pease air force base health consultation€¦ · providing health education for health care...
TRANSCRIPT

Health Consultation
Per- and Polyfluoroalkyl Substances (PFAS) in the Pease Tradeport
Public Water System
EPA PWS ID: 1951020
PEASE AIR FORCE BASE
PORTSMOUTH, NEWINGTON, AND GREENLAND,
NEW HAMPSHIRE
EPA FACILITY ID: NH7570024847
MARCH 20, 2020
U.S. DEPARTMENT OF HEALTH AND HUMAN SERVICES
Agency for Toxic Substances and Disease Registry
Division of Community Health Investigations
Atlanta, Georgia 30333
Health Consultation: A Note of Explanation
An ATSDR health consultation is a verbal or written response from ATSDR to a specific
request for information about health risks related to a specific site, a chemical release, or
the presence of hazardous material. In order to prevent or mitigate exposures, a
consultation may lead to specific actions, such as restricting use of or replacing water
supplies; intensifying environmental sampling; restricting site access; or removing the
contaminated material.
In addition, consultations may recommend additional public health actions, such as
conducting health surveillance activities to evaluate exposure or trends in adverse health
outcomes; conducting biological indicators of exposure studies to assess exposure; and
providing health education for health care providers and community members. This
concludes the health consultation process for this site, unless additional information is
obtained by ATSDR which, in the Agency’s opinion, indicates a need to revise or append
the conclusions previously issued.
You may contact ATSDR toll free at
1-800-CDC-INFO
or
visit our home page at: https://www.atsdr.cdc.gov

Pease Air Force Base Final Release
HEALTH CONSULTATION
Per- and Polyfluoroalkyl Substances (PFAS) in the Pease Tradeport
Public Water System
EPA PWS ID: 1951020
PEASE AIR FORCE BASE
Portsmouth, Newington, and Greenland, New Hampshire
EPA FACILITY ID: NH7570024847
Prepared by:
U.S. Department of Health and Human Services
Agency for Toxic Substances and Disease Registry
Division of Community Health Investigation
Atlanta, GA 30333

Summary
Introduction
In April 2015, the U.S. Air Force asked the Agency for Toxic Substances and Disease Registry
(ATSDR) to evaluate past and current exposures to per- and polyfluoroalkyl substances (PFAS) in
the Pease Tradeport public water system (PWS). The Pease Tradeport PWS serves the Pease
International Tradeport and the New Hampshire Air National Guard base at the former Pease
Air Force Base (AFB). The source of PFAS in the Pease Tradeport PWS is assumed to be from
aqueous film-forming foam (AFFF) used on the former Pease AFB, now known as the Pease
International Tradeport. This evaluation focuses on exposures to persons who worked at the
Pease International Tradeport and children who attended the two childcare centers at the
Pease International Tradeport from 1993 to the present. However, ATSDR acknowledges that
exposures to military and base personnel could have occurred before 1993 through drinking
water and other sources.
Scientific information suggests an association between perfluorooctanoic acid (PFOA) and
perfluorooctane sulfonic acid (PFOS) exposure and various health endpoints, including effects
on serum lipids, immune responses, fetal growth and development, and the liver. Several other
PFAS were detected in the water, some of which have similar health endpoints as PFOA and
PFOS (see Appendix A, Table A-1).
The Harrison, Haven, and Smith wells provided water to the Pease Tradeport PWS. The wells
were sampled and analyzed for several PFAS in April and May 2014 [CB&I 2015]. PFAS were
found in each of the wells. At that time, only the Haven well, where the maximum
concentration of PFOS was 2.5 µg/L, exceeded the U.S. Environmental Protection Agency’s
(EPA) provisional health advisory level of 0.2 micrograms per liter (µg/L) for PFOS. The Haven
well, located near the middle of the Pease AFB airstrip, was shut down on May 12, 2014,
immediately after the results were known. Since the Haven well was shut down, the Harrison
and Smith wells have continued to provide water for the Pease Tradeport PWS, supplemented
by water from the City of Portsmouth PWS (ID 1951010).
ATSDR develops health-based comparison values (HBCVs) using available scientific findings
about exposure levels and health effects. The HBCVs reflect an estimated contaminant
concentration for a given chemical that is expected to cause no adverse health effects,
assuming a standard daily water intake rate and body weight. To be conservative and
protective of public health, HBCVs are generally based on contaminant concentrations many
times lower than levels at which animal or human studies found no observable effects. ATSDR
uses HBCVs in this health consultation to screen PFAS contaminant concentrations to
ii

determine if a further in-depth evaluation is needed which includes calculating an exposure
dose and comparing these doses to ATSDR provisional minimal risk levels or MRLs.
Drinking water sampling from June 2014 through May 2017 indicated that the maximum
detected PFOS concentration was equal to ATSDR’s HBCV at the New Hampshire Department of
Environmental Services (NHDES) office and above the HBCV at the water treatment plant. The
treatment consists of corrosion control and then it is mixed to provide drinking water. A
demonstration water treatment system (granular activated carbon filters) has been operational
since September 2016. There were no exceedances of any other PFAS at any other sampling
locations, which included two childcare centers and a fire station [City of Portsmouth 2017a]. A
water treatment system to remove PFAS from the Smith and Harrison wells began operating on
September 23, 2016. Tests of the treated water collected in October and November 2016 did
not detect either PFOS or PFOA. Detection limits for PFAS typically range from 0.0026 µg/L for
PFOS to 0.0046 µg/L for PFOA or 2.6 to 4.6 parts per trillion [Walton R. (Air Force Civil Engineer
Center-BRAC Program Management Division) email to Gary Perlman (ATSDR), February 22,
2018, with datasheets, including Maxxam Analytics PFAS detection limits]. A few other PFAS
occasionally were detected at very low concentrations. Both PFOA and PFOS were below EPA’s
lifetime health advisory in all samples analyzed since June 2014.
ATSDR evaluated PFAS exposures in the Pease Tradeport PWS for two timeframes. The first
timeframe included the time when the Haven well was operational (1993 to May 2014). The
second included the time when the Haven well was shut down (June 2014 to the present).
On April 1, 2019, ATSDR released this health consultation report for public comment. The
comment period ended on June 3, 2019. ATSDR received 76 comments from individuals,
agencies, and a consultant during the public comment period. Appendix C provides responses
to the comments received.
iii
Conclusions
ATSDR evaluated the public health implications of past and current PFAS exposure to the
users of public water near the Pease International Tradeport and reached three conclusions.
These conclusions are limited by several uncertainties. The specific PFAS formulation in the
AFFF used at the former Pease AFB is not known. ATSDR used a conservative approach to
evaluate concentrations of 23 PFAS in drinking water wells. However, there may be PFAS in
the water that were not measured. ATSDR’s conclusions are based on evaluation of the PFAS
that were measured in the water.
Conclusion 1
Drinking water exposures from the Pease Tradeport PWS from 1993 to May 2014, before the
Haven Well was shut down, could have increased the risk for harmful non-cancer health
effects to Pease International Tradeport workers and children attending the childcare
centers. Other sources of PFAS exposure (e.g., from food and consumer products) to users of
the Pease Tradeport PWS could increase the risk of harmful effects beyond the risk from the
drinking water exposures alone. The cancer risk from past exposure to all PFAS in the Pease
Tradeport PWS is uncertain.
Basis for Conclusion
The estimated exposures for PFOA, PFOS, and perfluorohexane sulfonic acid (PFHxS) from
consuming the water were mostly below effect levels found in animal studies but were well
above their respective ATSDR provisional MRL, indicating a potential for concern, especially for
developmental and immune effects for exposure to PFOS. Scientific information suggests an
association between PFOA, PFOS, and PFHxS exposure and various health endpoints, including
effects on serum lipids (not for PFHxS), immune responses, development, endocrine (thyroid),
and the liver. The combined exposures to a mixture of PFOS, PFOA, PFHxS, and
perfluorononanoic acid (PFNA) could have increased the risk for developmental and immune
effects above what might be expected from exposure to any of these PFAS alone. For other
PFAS associations and health endpoints, however, the scientific information is far less certain.
Food, consumer products, and mixtures of PFAS in the drinking water are all possible
contributors to a person’s overall PFAS exposure and body burden. Testing of exposed persons
from the Pease Tradeport PWS by the New Hampshire Department of Health and Human
Services (NH DHHS) indicate that PFOA, PFOS, and PFHxS blood levels are elevated as compared
to national averages. Some pre-existing risk factors could increase the risk of harmful effects
(see the Public Health Implications Section for details).
iv

Epidemiologic data suggest a link between PFOA exposure and elevated rates of kidney,
prostate, and testicular cancer. However, additional studies are needed to confirm the link
between PFOA and other PFAS exposures and cancer to say they are the cause. Animals given
PFOA have shown higher rates of liver, testicular, and pancreatic tumors. A causal link based on
human studies between cancer and PFOS exposures remains uncertain. Animal studies have
found limited, but suggestive evidence of PFOS exposure and increased incidence of liver,
thyroid, and mammary tumors. Although current data are very limited, other PFAS may be
carcinogenic while some may not.
The EPA has developed an oral cancer slope factor (CSF) for PFOA based on testicular cancer
from a rat study to evaluate the cancer risk. Based on these assumptions and assuming that the
EPA CSF on testicular cancer from a rat study approximates the actual cancer risk for PFOA,
then the estimated adult cancer risk from exposure to the maximum detected PFOA
concentration in the public water supply system is 1.3 x 10⁻⁷. This means that if 10 million
people were similarly exposed, we might see an additional two cases of cancer. Please note this
this is a theoretical estimate of cancer risk that is used by ATSDR as a tool for deciding whether
public health actions are needed to protect health—it is not an actual estimate of cancer cases
in a community. If the CSF approximates the actual cancer risk for PFOA, then the estimated
cancer risk level is considered a very low risk. This estimated cancer risk must be viewed with
caution because the EPA CSF has not been fully adopted and other cancers that were elevated
in epidemiological studies of PFOA exposure were not evaluated. EPA does not have a CSF for
PFOS or other PFAS. Therefore, ATSDR cannot calculate the estimated cancer risk from PFOS or
other PFAS exposures and the actual cancer risk from exposure to all PFAS that may be cancer-
causing from the Pease PWS is uncertain.
Next Steps
ATSDR and the Centers for Disease Control and Prevention (CDC) are conducting a health study
of children and adults exposed to PFAS-contaminated drinking water at the Pease International
Tradeport and from nearby private wells. The study will evaluate associations between PFAS
blood levels and signs of changes in the body (e.g., cholesterol levels, kidney and thyroid
function, and the development of specific diseases), and will serve as the first site in
CDC/ATSDR’s Multi-site Health Study looking at the relationship between PFAS drinking water
exposures and health outcomes. Sites in seven additional states will also participate in the
Multi-site Health Study.
ATSDR and CDC are working to address the concerns of community members regarding
potential associations between PFAS exposure and cancer. We are conducting an analysis that
uses previously collected data to look at rates of certain health outcomes, including many adult
v
and pediatric cancers, in communities that have been exposed to PFAS through drinking water
and those that have not.
ATSDR and CDC are conducting exposure assessments in communities near current and former military bases and that are known to have had PFAS in their drinking water. The exposures assessments will provide information to communities about the levels of PFAS in their bodies. Using this information, public health professionals provide guidance to help people reduce or stop exposure.
ATSDR is also providing technical assistance to tribal, state, and territorial health departments nationwide so they can effectively evaluate PFAS exposure in contaminated communities.
Conclusion 2
Consuming water containing low levels of PFAS from the Pease Tradeport PWS since June
2014 is not expected to cause harm to the public.
Basis for Conclusion
Except for two samples where PFOS was detected slightly above the ATSDR HBCV, data indicate
that exposures were less than or equal to the ATSDR HBCVs, thereby indicating that no harmful
effects are expected. In addition, exposures to children at the two childcare facilities were all
below ATSDR HBCVs. Exposures to PFOS in the Pease Tradeport PWS since June 2014 are not
above ATSDR provisional MRLs, thereby indicating that harmful non-cancer effects are unlikely.
Further evaluation of the exposure to the mixture of PFOS, PFOA, PFHxS, and PFNA indicates
that the risk for harmful developmental or immune effects is not likely to be more than what
might be expected from exposure to any of these PFAS alone. Other PFAS were either below
their HBCVs, maximally detected at low levels (single parts per trillion) and below ATSDR’s most
conservative HBCV, or not detected.
Next Steps
The treatment system being added to the Pease Tradeport PWS will help protect consumers of
the drinking water. Operation of this treatment system will reduce exposure to PFAS
contaminants. Treated water should continue to be sampled. The treatment system should be
adjusted, as necessary, to prevent exposure above EPA or other applicable health-based
drinking water guidelines and reduce exposures to PFAS compounds that have no HBCVs. As a
prudent public health measure, ATSDR recommends that persons who have had long-term
exposures to PFAS should be aware of ways to reduce exposures (see information available
from https://www.atsdr.cdc.gov/pfas/pfas-exposure.html on ways to reduce exposures to all
sources of PFAS).
vi

Conclusion 3
Based on available scientific information, ATSDR concludes that the health and nutritional
benefits of breastfeeding outweigh the risks associated with PFAS in breast milk.
Basis for Conclusion
Community members, particularly mothers who have historically been exposed to PFAS from
the Pease Tradeport PWS, have expressed concern over the health implications of PFAS
exposures to infants who breastfeed. Developmental effects are the most sensitive adverse
health effects resulting from early life exposure to some PFAS. Studies have shown infants are
exposed during pregnancy, through the mother to the fetus (maternal transfer) and occur to
the nursing infant during breastfeeding. However, breastfeeding provides clear health and
nutritional benefits, including protection from some illnesses and infections and reductions in
the risks of developing asthma and sudden infant death syndrome. In general, the Centers for
Disease Control and Prevention and the American Academy of Pediatrics recommend
breastfeeding, despite the presence of chemicals in breast milk. Given what we know about
PFAS exposure, the benefits of breastfeeding outweigh any risks. However, the science on the
health effects of PFAS exposure on mothers and children continues to expand. A woman’s
decision to breastfeed is an individual choice, made after consideration of many different
factors (many unrelated to PFAS exposure) and in consultation with her healthcare providers.
Information developed by ATSDR to guide doctors (see
https://www.atsdr.cdc.gov/pfas/docs/ATSDR_PFAS_ClinicalGuidance_12202019.pdf) can aid in
this decision-making process.
Next Steps
Considering the many health benefits of breastfeeding for mother and child, ATSDR
recommends that nursing mothers continue to breastfeed. ATSDR recommends that a nursing
mother who has specific concerns should consult her healthcare provider. Moreover, women
who plan on breastfeeding should attempt to reduce potential exposures to toxic substances as
much as possible. ATSDR is available to consult with any healthcare provider, if needed.
vii

Abbreviations and Acronyms used in this report
µg/L micrograms per liter
6:2 FTS 6:2 fluorotelomer sulfonate
AFB Air Force base
AFFF aqueous film-forming foam
ATSDR Agency for Toxic Substances and Disease Registry
CDC Centers for Disease Control and Prevention
CERCLA Comprehensive Environmental Response, Compensation, and Liability Act
CSF oral cancer slope factor
CTE central tendency exposure
EPA United States Environmental Protection Agency
EtFOSE N-ethyl perfluorooctanesulfonomidoethanol
HBCVs health-based comparison values
HED human equivalent dose
HI hazard index
kg kilogram
L liter
LOAEL lowest observed adverse effect level
MOE margin of exposure
MEFOSE N-methyl perfluorooctanesulfonomidoethanol
mg milligram
MDH Minnesota Department of Health
NA not available
nc not calculated
ND not detected
NH DHHS New Hampshire Department of Health and Human Services
NHANES National Health and Nutrition Examination Survey
NHDES NH Department of Environmental Services
NOAEL no observed adverse effect level
PFAS per- and polyfluoroalkyl substances
PFBA perfluorobutanoic acid
PFBS perfluorobutanesulfonic acid
PFCs perfluorinated compounds
PFDeA perfluorodecanoic acid
PFDoA perfluorododecanoic acid
PFHpA perfluoroheptanoic acid
PFHpS perfluoroheptane sulfonate
PFHxA perfluorohexanoic acid
PFHxS perfluorohexane sulfonic acid
PFNA perfluorononanoic acid
PFOA perfluorooctanoic acid
PFOS perfluorooctanesulfonic acid
PFOSA perfluorooctane sulfonamide
PFPeA perfluoropentanoic acid
PFTeDA perfluorotetradecanoic acid
PFTrDA perfluorotridecanoic acid
PFUnA perfluoroundecanoic acid
ppb parts per billion
ppt parts per trillion
PWS public water supply
RME reasonable maximum exposure
USAF United States Air Force
viii
Contents
Summary ..................................................................................................................................................................................................... ii
Estimated Concentrations of PFAS in the Drinking Water before May 2014.......................................................................................... 7
Sampling from the Pease PWS after June 2014........................................................................................................................... 16
Abbreviations and Acronyms used in this report....................................................................................................................................viii Background and Statement of Issues ........................................................................................................................................................ 1 Pease Tradeport Public Water Supply ....................................................................................................................................................... 4
Water Supply Before Haven Well Shut Down, May 12, 2014............................................................................................................. 4 Water Supply After 2014 Haven Well Shut Down ............................................................................................................................... 5
Groundwater PFAS Contaminant History .................................................................................................................................................. 7 1970-1991 AFFF in use at Pease AFB ................................................................................................................................................... 7 2013 Sampling ....................................................................................................................................................................................... 7 Monitoring Outcome ............................................................................................................................................................................ 7
Drinking water testing results, June 2014 to the present ........................................................................................................................ 8 Sentry Wells........................................................................................................................................................................................... 9
ATSDR’s Evaluation Process ..................................................................................................................................................................... 10 Identifying Exposure ........................................................................................................................................................................... 10 Exposure and Health Effects............................................................................................................................................................... 10 Identifying Chemicals of Concern....................................................................................................................................................... 11
Exposure Pathway Analysis ...................................................................................................................................................................... 12 Screening Analysis............................................................................................................................................................................... 13
Sampling from the Pease Tradeport Public Water Supply before June 2014 ............................................................................ 13
Summary of Screening Analysis .................................................................................................................................................... 18 Public Health Implications of Exposure to PFAS in Drinking Water ....................................................................................................... 19 Exposure from 1993 to May 2014 ........................................................................................................................................................... 21
Exposures to PFOA and PFOS ............................................................................................................................................................. 22 Exposure to PFHxS............................................................................................................................................................................... 25 Exposure to Other Individual PFAS..................................................................................................................................................... 25 Exposure to PFHxA .............................................................................................................................................................................. 26 Exposure to PFHpA and PFPeA (individually)..................................................................................................................................... 26
Exposure from June 2014 to Present (individual PFAS).......................................................................................................................... 27 Exposure to a Mixture of PFAS ........................................................................................................................................................... 27 Exposures from 1993 to May 2014 .................................................................................................................................................... 28 Exposures from June 2014 to Present ............................................................................................................................................... 28
Biomonitoring results for Pease International Tradeport — NH Department of Health & Human Services Blood Sampling Program.......... 29 Contributions from Other Sources .......................................................................................................................................................... 31 Susceptible Populations: Persons with Pre-existing Health Conditions and Early Development......................................................... 31 Cancer Evaluation ..................................................................................................................................................................................... 32 Summary of Public Health Implications Evaluation ................................................................................................................................ 34 Community Concern: Breastfeeding Exposures and Health Implications ............................................................................................. 36 Limitations and Uncertainties of Human Health Risks from PFAS Exposures ....................................................................................... 37
Multiple Exposure Sources ................................................................................................................................................................. 37 Lack of Historical Exposure Data ........................................................................................................................................................ 37 Inadequate Methods to Assess Human Health Implications ............................................................................................................ 38 Limited Animal and Human Data........................................................................................................................................................ 38
Conclusions ............................................................................................................................................................................................... 40 Recommendations.................................................................................................................................................................................... 42 Public Health Action Plan ......................................................................................................................................................................... 44
Completed Actions.............................................................................................................................................................................. 44 Ongoing Actions .................................................................................................................................................................................. 45
Preparers of the Report............................................................................................................................................................................ 47 References................................................................................................................................................................................................. 48 Appendix A – Figures, Tables, and Equations.........................................................................................................................................A-1 Appendix B. Estimating Concentrations of Per- and Polyfluoroalkyl Substances in the Pease Tradeport Public Drinking Water ....B-1 Appendix C. Responses to Public Comments .........................................................................................................................................C-1
ix
Background and Statement of Issues
The Pease International Tradeport encompasses almost 4,300 acres in Greenland, Portsmouth,
and Newington, New Hampshire (see Appendix A, Figure A-1). The Tradeport is on land
formerly occupied by the Pease Air Force Base (AFB). Pease AFB began operations in 1956 and
closed in 1991 [ATSDR 1999]. The U.S. Air Force (USAF) transferred the Pease AFB property to
the Pease Development Authority in October 1991. In February 1992, the site was named the
Pease International Tradeport. The Pease Development Authority welcomed its first tenant in
1993 [Pease Development Authority 2017]. The EPA added the former Pease AFB to the
National Priorities List1 on February 21, 1990, because of groundwater and soil contamination
by chlorinated volatile organic c ompounds, including trichloroethylene; petroleum-related
volatile organic c ompounds2; and metals [ATSDR 1999]. There were no exposures to site-
related contaminants in base drinking water above levels of concern [ATSDR 1999].
Under the National Priorities List, the USAF signed a federal facility agreement with the U.S.
Environmental Protection Agency (EPA) and State of New Hampshire in 1991. The federal
facility agreement identified t he Installation Restoration Program sites at the former Pease AFB.
It also identified the Comprehensive Environmental Response, Compensation, and Liability Act
(CERCLA) (commonly k nown as Superfund) process. Sites included the former fire department
Area 2 and the Installation Restoration Program sites within the Haven well vicinity. The past
contamination issues were evaluated in a 1999 Public H ealth Assessment [ATSDR 1999].
As part of the EPA’s evaluation of emerging contaminants, additional sampling3 was conducted
at Pease International Tradeport. In 2013, twenty-two monitoring wells located at Fire
Department Area 2 (Site 8), known as AT008 on the Pease International Tradeport, were
sampled f or per- and polyfluoroalkyl su bstances (PFAS) (Appendix A, Figure A-2). Results were
compared to EPA’s health advisory level for perfluorooctane sulfonic acid (PFOS) and
1 The National Priorities List is the list of contaminated sites with known or threatened releases of hazardous substances, pollutants, or contaminants throughout the United States and its territories. These sites are eligible for long-term clean up. Sites are listed on the National Priorities List upon completion of Hazard Ranking System screening, public solicitation of comments about the proposed site, and after all comments have been addressed. More details are available from https://www.epa.gov/superfund/superfund-national-priorities-list-npl. 2 Volatile organic compounds are carbon-based compounds associated with photochemical reactions in the atmosphere. These compounds easily evaporate under normal atmospheric conditions. Some of these compounds can be harmful. More details are available from https://www.epa.gov/indoor-air-quality-iaq/technical-overview-volatile-organic-compounds. 3 Sample collection parameters: 1-liter polycarbonate bottles and stored at 4 degrees Celsius (±2°C). Samples extracted within 14 days of sample collection. Equipment rinsate blanks collected at a frequency of 10% using PFAS-free water supplied from the laboratory [CB&I 2014].
1

perfluorooctanoic acid (PFOA), which offers a margin of protection for all Americans including
children and nursing infants throughout their lives from adverse health effects resulting from
exposure to PFOA and PFOS in drinking water [EPA 2018a].
PFAS are a class of manufactured chemicals that are not regulated in public drinking water
supplies. PFAS were used since the 1950s to make products resistant to heat, oil, stains, grease,
and water [EPA 2017]. They are found in some fire-fighting foams and consumer products,
including nonstick cookware, stain-resistant carpets, fabric coatings, food packaging, cosmetics,
and personal care products [EPA 2017]. People can be exposed to PFAS in the air, indoor dust,
food, water, and consumer products. Because of their extensive use, PFAS exposure is common
for the general U.S. population [NIEHS 2016; ATSDR 2015; EPA 2016a; CDC 2018].
PFAS persist in the environment. They are water-soluble and are found in soil, sediment, water,
plants, and animals. Studies indicate that some PFAS move through the soil and easily enter
groundwater, in which they can travel long distances [MDH 2017b, 2017c].
AFFF containing PFOS and PFOA was used at the former Pease AFB to respond to petroleum
fires and during fire training exercises [CB&I 2014]. AFFF was first used at Pease around 1970
[NH DHHS 2015; Prevedouros et al. 2006; ATSDR 2015; NRL 2015]. Components of the AFFF,
such as PFOA and PFOS, seeped into the soil and groundwater and migrated into the water
supply wells that serve Pease Tradeport PWS.
At the time of sampling (2013), 19 monitoring wells at site 8 exceeded EPA’s former provisional
health advisory level of 0.2 microgram per liter (µg/L) for PFOS. Seventeen monitoring wells
exceeded EPA's former provisional health advisory level of 0.4 µg/L for PFOA [CB&I 2014].
When those wells were compared to the current EPA lifetime health advisory of 0.070 µg/L
[EPA 2016a, 2016b], 21 monitoring wells contained PFOS above 0.07 µg/L, and 18 contained
PFOA above 0.07 µg/L [CB&I 2014].
The City of Portsmouth operates and maintains the Pease Tradeport PWS through an inter-
municipal agreement with the Pease Development Authority (PDA). Three wells (identified as
Harrison, Haven, and Smith) supplied or supply water to the Pease Tradeport PWS. Water from
these wells are blended together and then three chemicals were added to the water: sodium
hypochlorite (disinfection), hydrofluorosilicic acid (dental cavity prevention), and
ortho/polyphosphate (iron and manganese sequestration and corrosion control). This water is
then blended with supplemental water boosted from the Portsmouth PWS and sent to the
distribution system. These wells were sampled and analyzed for several PFAS compounds in
April and May 2014. Although PFAS were detected in each well, only the Haven well had
2
elevated levels above the EPA provisional health advisory. PFOS in the Haven well was detected
at a maximum concentration of 2.5 µg/L. This exceeded EPA’s former provisional health
advisory level of 0.2 µg/L. Advisory levels in place at that time reflected the current knowledge
about amounts of a chemical a person might safely consume over a lifetime. When higher levels
are detected, action should be taken to reduce exposure to those contaminants in drinking
water. The EPA developed a Health Advisory for PFOS and PFOA (singly or combined at 0.07
ppb) on May 25, 2016.
The Haven well was shut down on May 12, 2014, immediately after the water testing results
were known. The Harrison and Smith wells continue to provide public water for the Pease
Tradeport PWS, supplemented by water from the City of Portsmouth PWS [CB&I 2014]. The
Portsmouth and Pease Tradeport PWS are interconnected, which allows water to be
transferred from Portsmouth to the Pease Tradeport as needed [Portsmouth Water Division
2014].
In April 2015, the USAF asked the Agency for Toxic Substances and Disease Registry (ATSDR) to
evaluate exposures to PFAS in the Pease Tradeport PWS. ATSDR evaluated past and current
exposures to on-site workers and children attending the two on-site childcare centers. ATSDR
also examined two timeframes for these exposures.
• Water supply before the Haven well shut down; 1993 to May 2014
• Water supply after the Haven well was shut down; June 2014 to the present
ATSDR acknowledges that exposures to military and base personnel could have occurred
through drinking water and other sources before 1993. However, this evaluation focuses on
exposures to persons who worked at the Pease International Tradeport and children who
attended the two childcare centers at the Pease International Tradeport from 1993 to present.
3
Pease Tradeport Public Water Supply
Water Supply Before Haven Well Shut Down, May 12, 2014
The Pease Tradeport PWS was built in the mid- to late 1950s as part of the construction of the
former Pease AFB. The AFB operated the PWS while the base was open [CH2M Hill 1984]. The
water system included three water supply wells (Harrison, Haven and Smith) and two water
storage tanks (Hobbs Hill Landing and National Guard) (Appendix A, Figure A-3). Water from the
three supply wells was chemically treated for corrosion control and introduced into the water
distribution system. Water was routinely tested by the water system operators according to the
monitoring plan set forth by the NHDES. Since 1985, water from these supply wells is mixed
together and treated before being delivered to customers (before the date when the Pease
International Tradeport welcomed its first tenants in 1993). The Harrison, Haven, and Smith
wells provided the primary drinking water for the Pease International Tradeport. Table 1
presents the past and current water source contributions.
The Pease and Portsmouth water systems have always been interconnected. In fact, prior to
the construction of the Pease Air Base, the Haven Well was one of the primary sources of
supply for the City of Portsmouth, with a history of use dating back to the late 1700s. When the
Newington Booster Station was built by the Army Corps of Engineers in the late 1950s to boost
water that came from Madbury into the Portsmouth system they also installed pumps that
could be used to pump water into the Pease Tradeport public water supply from the Newington
Booster. The existing booster system at the Grafton Road facility was installed in the early
1990s to enable Portsmouth water to be blended with Pease Tradeport water to reduce
nitrates that were in the Pease Tradeport wells because of the use of urea for a period at the
airport. An online nitrate analyzer at the Grafton Road facility coordinated how much
Portsmouth water was necessary to reduce the nitrate levels [B. Goetz, City of Portsmouth,
New Hampshire, Public Works, email to Gary Perlman, ATSDR, March 8, 2018].
4

Table 1. Average pumping percentages for each water source, based on monthly re ports, Pease Tradeport public water supply (PWS), 1994–2015
Years*
† Water source
Harrison Haven Smith Portsmouth
PWS‡
1994–1999 0% 56% 44% NA 2000–2001 0% 88% 12% NA 2003–2005 0% 53% 47% NA
2006 26%§ 48% 26% NA 2007 51% 47% 2% NA
2008–2013 29% 46% 25% NA Jan–May 2014¶ 24% 47% 29% NA
Jun 2014–Aug 2015 25% 0% 31% 44% Note: See Appendix B for more details. Abbreviation: NA = not available.
*Periods are discrete intervals and were determined by significant changes in amount of water provided. †Normal operations involved all three wells turning on and off together based on demand and storage tank levels. ‡The Portsmouth PWS was only used occasionally to boost the water storage capacity until May 12, 2014, when this
contribution was used to replace the contribution of the Haven well. §A vote was held by the Portsmouth Planning Board to reactivate the Harrison well [2003] subsequently, the well was tested,
designed and approved by the NH DES for reactivation in 2006. ¶Haven well taken out of service May 12, 2014.
When the Pease Tradeport PWS required supplemental water, it was pumped from the
Portsmouth water system. In emergency situations, water from the Pease Tradeport water
treatment facility was pumped to the Portsmouth system.
In 2014, based on the PFAS detections in monitoring wells located at AT008 (Site 8), the USAF
sampled the three Pease Tradeport water supply wells. PFOS levels in the Haven well exceeded
the former EPA provisional health advisory level of 0.2 µg/L. On May 12, 2014, the Haven well
was shut down. The other two wells fell below the current EPA lifetime health advisory level.
Water Supply After 2014 Haven Well Shut Down
Since the Haven well was shut down on May 12, 2014, the Portsmouth PWS, Harrison, and
Smith wells have provided water to the Pease Tradeport PWS.
In November 2015, the USAF, City of Portsmouth, and the Pease Development Authority
reached an agreement to design and build a treatment system to remove PFAS from the
Harrison, Haven, and Smith wells [City of Portsmouth 2015a, 2015b]. The City of Portsmouth
led the design and construction. The USAF provided funding. Activities to reduce PFAS
contamination in the aquifer beneath the Pease International Tradeport remain a priority of the
5

USAF, EPA, and New Hampshire Department of Environmental Services (NHDES) [City of
Portsmouth 2015a, 2015b]. In April 2016, the USAF, City of Portsmouth, and the Pease
Development Authority signed an agreement to install carbon filters to treat water from the
Harrison and Smith wells. The activated carbon demonstration filters continue to filter the
Harrison and Smith wells while the final treatment system for all three wells is constructed. The
pilot testing of the Haven Well confirmed that resin filters in combination with activated carbon
would provide the most efficient treatment of PFAS compounds. The construction project was
bid in late 2018 and construction began in April 2019 with completion of the system scheduled
for late 2021. Designs for the Haven well treatment continue [City of Portsmouth 2016a]. The
treatment system for the two Pease Tradeport wells (Harrison, Smith) began operating
September 23, 2016 [City of Portsmouth 2016b]. The treatment system will allow engineers to
evaluate options for the Haven well. Pilot testing for the Haven well treatment system started
in 2017 [City of Portsmouth 2016b, 2017c]. Water passing through the pilot filtration systems -
from the period of October 2016 through October 2018 - has been mostly non-detect for 22 of
23 PFAS. PFBA was detected on several occasions at an estimated maximum value 0.01 ppb.
Four other PFAS were estimated a low parts per trillion levels (detected only one time each),
with one detection of PFOS at an estimated value of 0.017 ppb or 17 ppt). The detection limits
for these 23 compounds ranged from 0.0026 ppb to 0.0066 ppb [see also
http://files.cityofportsmouth.com/files/misc/PeaseWaterSupply20181024.pdf].
The USAF is developing two other PFAS treatment systems (systems A and B) to comply with
the EPA’s Administrative Order for addressing PFAS at the Pease International Tradeport [P.
Sandin, New Hampshire Department of Environmental Services, email to Gary Perlman, ATSDR
Branch, November 21, 2017].
Treatment system A: Site 8 is also known as the former fire training area at the north end of
the airfield. The Administrative Order initially required the USAF to operate and optimize an
existing groundwater treatment system at Site 8 until a more comprehensive system could be
designed and installed. The existing system was designed and operated for more than 19 years
to remove volatile organic compounds and other contaminants of concern identified at Site 8.
After PFAS were found at Site 8 and EPA issued the Administrative Order, that system was
operated in compliance with the Administrative Order from August 2015 to spring 2017. The
system was then shut off so the new system could be built. The new system is expected to
begin operation near the end of 2021.
Treatment System B: The Airfield Interim Mitigation System is expected to be built in 2019. It
will pump and treat groundwater from several extraction wells in the middle of the airfield
6

(roughly 2,500 feet upslope from the Haven well) and return the treated water to the aquifer.
The system is also operating at a reduced flow rate as of the writing of this report.
Groundwater PFAS Contaminant History
1970-1991 AFFF in use at Pease AFB
Sampling for PFAS within Fire Department Area 2 (Site 8) began because some applied fire-
suppression foams are known to have contained PFAS. AFFF is a fire-suppressant that was used
on the base. Some AFFF contained PFAS. The fire suppressing foam was used at Pease AFB
when responding to airplane fuel leaks, fires, and during training exercises conducted at Site 8
[CB&I 2015]. Pease AFB may have started using AFFF in 1970 [NH DHHS 2015; Prevedouros et
al. 2006; ATSDR 2015; NRL 2015]. Site 8 is a known AFFF release area. Twenty additional AFFF
areas were evaluated for potential releases (Appendix A, Figure A-4). Only 11 AFFF areas are
subject to further evaluation [AMECFW 2016, 2017].
2013 Sampling
In 2013, monitoring wells located within the Pease Air Force Base Fire Department Area 2 (Site
8) were sampled for PFAS. Table A-2 (Appendix A) lists the PFAS that were monitored.
Monitoring Outcome
Based on the PFAS monitoring well results from Site 8, EPA and NHDES asked the USAF to
sample the three Pease Tradeport PWS wells. USAF collected initial samples on April 16, 2014;
USAF consultants and NHDES collected confirmatory samples on May 14, 2014. The Haven well
was shut down two days before the confirmatory sampling. The samples were analyzed for 11
PFAS and the results are presented in Table A-3 (Appendix A).
Estimated Concentrations of PFAS in the Drinking Water before May 2014
Past exposures to PFAS in the public drinking water were from water supplied from the
combination of the Harrison, Haven, and Smith wells. Because data for water at the distribution
point were not available, ATSDR used a simple flow-weighted mixing model to estimate
drinking water concentrations before June 2014 (see Appendix A Figure A-5, and Appendix B for
more details). The simple mixing model assumed that the PFAS concentrations at Pease
Tradeport PWS distribution points would be equal to those in any location where people drank
7

the water. To calculate the estimated PFOS, PFOA, and other PFAS concentrations in the water,
ATSDR used the monthly well pumping rates for several years and the highest PFOS and PFOA
concentrations from the April and May 2014 supply well samples.
ATSDR used a simple mixing model to estimate average monthly concentrations of PFAS in the
drinking water for the 11 compounds detected in the three water supply wells. The model used
monthly pumping rates from January 2003–April 2014 (see Figure B-1) for each water supply
well, along with PFAS concentrations measured at each well in April 2014 (Table B-3). To
estimate average monthly concentrations of PFAS in drinking water, the model used pumping
rates from May 2014–August 2015 for each water supply well and the highest PFAS
concentrations measured at each well during the month. Figure B-3 shows the monthly
estimated drinking water concentrations from January 2003–August 2015 for the 11 PFAS
detected in the three water supply wells. The highest estimated concentration of PFOS in
drinking water was 1.71 µg/L in December 2012 and January 2013. The highest estimated PFOA
and perfluorohexane sulfonate (PFHxS) concentrations during the same months were 0.24 µg/L
and 0.57 µg/L, respectively. Drinking water concentrations for the remaining eight PFAS
detected were at or below 0.2 µg/L. In November 2007, December 2007, and January 2008, the
estimated drinking water concentrations for all 11 PFAS were below 0.05 µg/L because the
Haven well was shut down for service during these months. Because the Haven well was taken
out of service on May 12, 2014, estimated concentrations of PFAS in drinking water during June
2014–August 2015 were less than 0.02 µg/L.
The following four PFAS were estimated at maximum concentrations from May 2012 to May
2014:
● perfluoroheptanoic acid (PFHpA) — 0.08 µg/L
● perfluorohexanoic acid (PFHxA) — 0.23 µg/L
● perfluorohexane sulfonic acid (PFHxS) — 0.57 µg/L
● perfluoropentanoic acid (PFPeA) — 0.19 µg/L
Drinking water testing results, June 2014 to the present
Since May 12, 2014, the Harrison and Smith wells have provided approximately 52% of the
public water to the Pease Tradeport PWS; the City of Portsmouth provides the other 48%.4
4 The City of Portsmouth, NH conducted tap water sampling for PFAS in June 2016. The samples were collected at two NHDES sites: Sagamore Road and the Portsmouth Library. PFOA and PFOS were non-detect. Five other compounds were detected at low levels: perfluorobutanesulfonic acid (PFBS), perfluoroheptane sulfonate (PFHpS), perfluoropentanoic acid (PFPeA), perfluorotetradecanoic acid (PFTeDA), and perfluorotridecanoic acid (PFTrDA). The
8

Since June 2014, USAF consultants have sampled the Smith well once a week and the Harrison
well twice a month, analyzing for 23 PFAS. Among Pease Tradeport PWS locations, the water
treatment plant and the NHDES Office have been sampled quarterly, and Fire Station No. 3,
Great Bay Kids’ Company, and Discovery Child Enrichment Center have been sampled
occasionally. The weekly sampling of the wells was changed to monthly sampling after the
demonstration filters were installed on the Smith and Harrison wells in September 2018--that
sampling frequency continues.
Table A-4 (Appendix A) presents results of water samples from the Harrison and Smith wells
from June 2014 through May 2017 (only the minimum and maximum for that period are
included). Table A-5 (Appendix A) presents results of samples from the Pease Tradeport
distribution points for that period. Table A-6 (Appendix A) presents results from the childcare
centers. Seventeen PFAS were detected in either the Harrison or Smith wells and nine PFAS
were detected in the Pease Tradeport distribution point water samples. Water samples were
collected from March 2015 through December 2015 at Great Bay Kids’ Company and the
Discovery Child Enrichment Center. Table A-6 (Appendix A) presents data for those samples.
Seven PFAS were detected in the water supplying the two childcare centers.
Sentry Wells
In addition to periodic Pease Tradeport PWS sampling, 12 monitoring wells, called sentry wells,
are sampled regularly. The sentry wells are used to check whether PFAS contamination
affecting the Haven well might migrate to the southern well field [AMECFW 2016]. The
southern well field includes two operating Pease Tradeport wells; the Harrison and Smith wells;
and the Collins and Portsmouth wells, two wells closest to the Pease International Tradeport
that are part of the Portsmouth PWS. The Portsmouth well, located about 2,800 feet south of
the Pease International Tradeport boundary, is the closest Portsmouth PWS well. The Haven
well is located about 5,300 feet north (upgradient) from the Harrison well, the closest of the
four wells in the southern well field.
The results from the sentry wells, through May 2017, are being closely evaluated for potential
PFAS migration in groundwater south toward the southern well field [AMECFW 2016; City of
Portsmouth 2017a]. The highest PFOS and PFOA concentrations detected in the sentry wells are
0.05 µg/L (November 2015) and 0.022 µg/L (May 2017), respectively [City of Portsmouth
2017a]. The USAF has proposed installing additional sentry wells to increase monitoring
levels of these compounds were equivalent to the sources that served the sample location, except for PFHpS, which was not detected at any of the sources, thus likely associated with facility plumbing or a laboratory analysis issue [City of Portsmouth 2017b, 2018].
9

capability and identify potential PFAS migration toward the public wells. These sentry wells
have never supplied public water. No one has nor will be drinking water from the sentry wells.
ATSDR’s Evaluation Process
Identifying Exposure
People near an environmental release are exposed to a contaminant only if they contact the
contaminant. Exposure might occur by eating food, breathing air, skin contact with a substance,
or drinking a substance containing the contaminant. A release does not always result in
exposure.
ATSDR evaluates site conditions to determine if people could have been (a past scenario), are (a
current scenario), or could be (a future scenario) exposed to site-related contaminants. ATSDR
also considers the route a substance takes from its source (where it began) to its end point
(where it ends), and how people can come into contact (or get exposed) to it. This is an
exposure pathway. An exposure pathway has five elements:
1) a source of contamination (for example spill or release)
2) an environmental media and transport mechanism (groundwater)
3) a point of exposure (tap water)
4) a route of exposure (drinking)
5) a receptor population (people potentially or actually exposed)
When evaluating exposure pathways, ATSDR identifies whether exposure to contaminated
media (such as drinking water) has occurred, is occurring, or might occur. ATSDR also identifies
an exposure pathway as completed or potential or eliminates the pathway from further
evaluation. Exposure pathways are complete if all five elements of a human exposure pathway
are present. A potential pathway occurs when one or more pathway elements cannot be
proved or disproved. A pathway is eliminated if at least one element is missing.
Exposure and Health Effects
At sufficient exposure levels, chemicals in the environment can cause harmful health effects.
The type and severity of effects are influenced by complex factors such as
● concentration (how much)
● the frequency or duration of exposure (how often and how long)
10
● the way the chemical enters the body
● combined exposure to other chemicals
Age, gender, nutritional status, genetics, health status, and other characteristics can affect how
a person’s body responds to an exposure and whether the exposure harms their health. When
a completed exposure pathway is identified, ATSDR evaluates chemicals in that pathway by
comparing exposure levels to screening values. Screening values are developed from available
scientific findings about exposure levels and health effects. They reflect an estimated
contaminant concentration that is not expected to cause adverse health effects for a given
chemical, assuming a standard daily contact rate (such as amount of water consumed) and
body weight. To be conservative and protective of public health, screening values are generally
based on contaminant concentrations many times lower than levels at which no effects were
observed in experimental animals or human studies. ATSDR does not use screening values to
predict the occurrence of adverse health effects, but rather to serve as a health protective first
step in the evaluation process.
Identifying Chemicals of Concern
Screening values are ATSDR’s health-based comparison values5 (HBCVs). ATSDR develops HBCVs
to screen environmental contamination for further evaluation. If contaminant concentrations
are above these HBCVs, ATSDR reviews exposure variables (such as duration and frequency),
the toxicology of the contaminant, and epidemiology studies to determine likelihood of
possible health effects. During this part of the evaluation process, ATSDR estimates site-specific
exposure doses and compares those to health guideline values. This comparison allows ATSDR
to assess the possible public health effects of site-specific conditions. Health-based comparison
values are developed based on data drawn from the epidemiologic and toxicological literature.
Many uncertainty factors, sometimes known as safety factors, are applied to ensure that the
health-based comparison values amply protect human health.
ATSDR’s MRLs [ATSDR 2018b] and EPA’s reference doses and oral cancer slope factors (CSFs)
are the health guidelines used in the screening process. An MRL is an estimate of the daily
human exposure to a hazardous substance that is likely to be without appreciable risk of
adverse non-cancer health effects over a specified duration of exposure. A CSF (also known as
an oral slope factor) is an EPA derived estimate of the increased cancer risk from oral exposure
5 Not all comparison values used to screen data were from ATSDR or other federal agency sources, because there were no federal comparison values available. As the state of science on these compounds progresses, more values may become available. Some values might be revised from their current values.
11
to a dose of 1 milligram per kilogram per day (mg/kg-day) for a lifetime. Estimated doses that
are below health guidelines are not expected to cause adverse health effects. When no federal
HBCVs are available, ATSDR used applicable state values for further comparison in the
screening process. Data on contaminants for which there were no federal or state HBCVs were
retained for further evaluation.
The following sections describe the evaluation process in more detail, focusing first on who was
potentially exposed (the exposure pathway analysis). ATSDR then consider the chemicals
identified for further evaluation (the screening analysis). Then we discuss the public health
implications of exposure.
Exposure Pathway Analysis
The Pease Development Authority welcomed its first tenant in 1993. Therefore, people who
worked at the Pease International Tradeport from 1993 to the present consumed in the past or
are now consuming drinking water from the Pease Tradeport PWS. Two childcare centers
operate at the Pease Tradeport. The Discovery Child Enrichment Care opened in 1994, and the
Great Bay Kids’ Company opened in 2010. Both childcare centers are open every day. Children
who attend the childcare centers range in age from 6 weeks to 5 years. Both childcare centers
received drinking water from the Pease Tradeport PWS.
Exposure to contaminants in water, in general, occurs by drinking (ingesting) and showering
(skin contact and breathing in vapors or mists). Skin exposure studies report very limited PFAS
absorption through the skin [Prevedouros 2006]. Moreover, exposure through water use, such
as bathing or showering, is not a pathway of concern for either inhalation or skin absorption of
PFAS at typical drinking water concentrations [NH DHHS 2016a; Emmett et al. 2006]. Because
people who use water at the Pease International Tradeport are typically workers and other
non-residents, bathing and showering would likely occur only where people exercise or swim.
Children at the childcare centers might use the water for play: infants might sit in tubs of water
and older children might run through sprays of water outside. However, the dermal exposure
pathway is minor, because skin absorption is slow. Skin exposures to PFAS do not result in
significant absorption.
Persons exposed include adults working on-site and children attending on-site childcare centers
who consume drinking water with PFAS from the Pease Tradeport PWS. Pregnant women who
consume or have consumed drinking water with PFAS from the Pease Tradeport PWS would
pass PFAS to the developing fetus through the placenta and to infants by breast feeding.
Exposure pathways are presented in Table A-7 (Appendix A).
12

Specific HBCV
Haven well Harrison well Smith well
PFAS April 16 May 14 April 16 May 14 April 16 May 14
PFHpA None* 0.12 0.12 0.0046† 0.0042† 0.0025† 0.002†
PFBS 2§ 0.051 0.051 0.00094† 0.00087† 0.002† 0.0019†
PFHxA None* 0.33 0.35 0.0087 0.01 0.0039† 0.004†
PFHxS 0.14‡ 0.83 0.96 0.036 0.032 0.013 0.013
PFNA 0.021‡ 0.017 0.017 ND ND ND ND
PFOA 0.021‡ 0.35 0.32 0.009 0.0086 0.0035† 0.0036†
PFOS 0.014‡ 2.5¶ 2.4¶ 0.048 0.041 0.018 0.015
PFPeA None* 0.27 0.26 0.0079 0.0084 0.0035† 0.0034†
Screening Analysis
ATSDR screened all drinking water data against available HBCVs to select PFAS for further
evaluation. Table A-8 in Appendix A summarizes the HBCVs selected f or screening. Data on
PFAS lacking HBCVs were retained for further in-depth evaluation. For some of the PFAS
compounds without HBCVs, concentrations in the water were very low and adequate
toxicological data were unavailable. ATSDR will consider the possible contributing effects of
these PFAS compounds as part o f mixtures.
Sampling from the P ease Tradeport Public Water Supply before June 20 14
Table 2 describes the PFAS levels in the supply wells screened against HBCVs. Table 2 also
includes concentrations from the Haven well when it was operational.
Table 2. Water quality data from supply w ells for 2014, screened b y available health-based comparison values, concentrations in micrograms per liter (µg/L) for eight compounds: PFOS, PFOA, PFHxS, PFHpA, PFHxA, PFNA, and PFPeA
Source: City of Portsmouth [2014]. Abbreviations: ND = not detected; PFAS = per- and polyfluoroalkyl substances; PFOS = perfluorooctanesulfonic acid; PFOA = perfluorooctanoic acid; PFHxS = perfluorohexane sulfonic acid; PFHpA = perfluoroheptanoic acid; PFHxA = perfluorohexanoic acid; PFPeA = perfluoropentanoic acid; HBCV = health-based comparison value. Note: Shaded = Concentrations are above a health-based comparison value. * Although lacking health-based comparison values, these were selected for further in-depth analysis because they were detected at higher concentrations. Other PFAS with no HBCV and detected at low concentrations will be included as part of the overall evaluation of mixtures. † Indicates an estimated value. This flag is used when the mass spectral data indicate the presence of an analyte meeting all the identification criteria, but the result is less than the Contract Required Quantitation Limit but greater than zero. ‡ ATSDR derived value for children's exposures. This value is called an Environmental Media Evaluation Guide (EMEG) and is an estimated contaminant concentration that is not expected to result in adverse noncarcinogenic health effects based on ATSDRevaluation. EMEGs are based on ATSDR provisional MRLs and conservative assumptions about exposure, such as intake rate, exposure frequency and duration, and body weight. Child drinking water EMEGs are based on an infant (age birth to one yearold) weighing 7.8 kg and an intake rate of 1.113 liters per day. §MDH developed a guidance value of 2 ppb for PFBS in drinking water to protect people who are most vulnerable to the potentially harmful effects of a contaminant [MDH 2017d]. ¶ These represent the maximum PFOS concentration in samples collected during April and May 2014 from the Haven well.Sampling from the same well during November 16 and 28, 2016, indicated that the PFOS concentrations were 1.0 µg/L and 1.4µg/L, respectively. Data from 2014 remain valid and were selected for further analysis and modeling by ATSDR (see Appendix B for modeling report).
13

During April 2014, PFAS were detected in each of the three wells (Harrison, Haven, and Smith)
that originally comprised t he Pease Tradeport PWS. Because the water from these three wells
was blended b efore being supplied as drinking water, ATSDR needed t o use a mathematical
model to estimate drinking water exposure levels from January 2003 through March 2015
(before and after the Haven well shut down in May 2014). The PFAS which were analyzed prior
to June 2014 include the eight PFAS listed in Table 2. After June 2014, additional laboratory
methods were available, and the list of PFAS expanded to include 23. The additional fourteen
PFAS are listed b elow:
6:2 Fluorotelomer sulfonate (6:2 FTS)
8:2 Fluorotelomer sulfonate (8:2 FTS)
N-Ethyl perfluorooctane sulfonamide (EtFOSA)
N-Ethyl perfluorooctane sulfonamidoethanol (EtFOSE)
N-Methyl Perfluorooctane Sulfonamide (MEFOSA)
N-Methyl Perfluorooctane Sulfonamidoethanol (MEFOSE)
Perfluorodecane sulfonate (PFDS)
Perfluorodecanoic acid (PFDA)
Perfluorododecanoic acid (PFDoA)
Perfluorononanoic acid (PFNA)
Perfluorotetradecanoic acid (PFTeDA)
Perfluorotridecanoic acid (PFTrDA)
Perfluoroundecanoic acid (PFUnA)
Perfluoroheptanoic acid (PFHpA)
The values in Table 3 show maximum estimated d rinking water PFAS concentrations.
14

Table 3. Maximum modeled per- and polyfluoroalkyl su bstances (PFAS) concentrations in blended Pe ase Tradeport PWS drinking water for the indicated period. All units displayed in micrograms per liter (µg/L)
Modeled time frames
Jan Nov Feb Sep May Jun Specific
HBCV 2003– 2007– 2008– 2010– 2012– 2014–
PFAS Oct Jan Aug Apr May Mar 2007 2008 2010 2012 2014 2015
PFHpA None* 0.08 <0.01 0.07 0.06 0.08 <0.01
PFHxA None* 0.22 0.01 0.18 0.17 0.23 0.01
PFHxS 0.14† 0.57 0.04 0.46 0.44 0.57 0.02
PFOA 0.021† 0.24 0.01 0.19 0.18 0.24 <0.01
PFOS 0.014† 1.7 0.05 1.37 1.29 1.71 0.02
PFPeA None* 0.18 0.01 0.15 0.14 0.19 0.01
Abbreviations: HBCV = health-based comparison value; PFHpA = perfluoroheptanoic acid; PFHxA = perfluorohexanoic acid; PFHxS = perfluorohexane sulfonic acid; PFOA = perfluorooctanoic acid; PFOS = perfluorooctanesulfonic acid; PFPeA = perfluoropentanoic acid. *Although lacking health-based comparison values, these were selected for further in-depth analysis because they were modeled at higher concentrations. Other PFAS with no HBCV and detected at low concentrations will be included as part of the overall evaluation of mixtures. †ATSDR derived value for children's exposures. This value is called an Environmental Media Evaluation Guide (EMEG) and is an estimated contaminant concentration that is not expected to result in adverse noncarcinogenic health effects based on ATSDRevaluation. EMEGs are based on ATSDR provisional MRLs and conservative assumptions about exposure, such as intake rate, exposure frequency and duration, and body weight. Child drinking water EMEGs are based on an infant (age birth to one yearold) weighing 7.8 kg and an intake rate of 1.113 liters per day. Note: ATSDR used the maximum PFOS concentration from the Haven well collected in April and May 2014. Subsequentsampling from the same well during November 16 and 28 of 2016 indicated that the PFOS concentration was 1.0 µg/L and 1.4µg/L, respectively. The data from 2014 remain valid and were selected for modeling by ATSDR (see Appendix B for modeling report). Shaded = Concentrations are above a health-based comparison value.
15
Table A-9 (Appendix A) shows more of the data summarized in Table 3. Table A-9 includes the
maximums and geometric mea ns (a form of averaging) for the estimated d rinking water PFAS
concentrations. To be conservative, ATSDR used the maximum estimated concentrations from
the water modeling to further evaluate the public health implications of PFAS exposures (see
Appendix B for modeling report).

Sampling from the Pease PWS after June 2014
Since May 2014, a mixture of water from the Harrison well, Smith well, and the Portsmouth
PWS comprised the drinking water supply. People were exposed to low levels of PFAS until the
water treatment system to treat the Harrison and Smith wells began operating on September
22, 2016 [City of Portsmouth 2016c]. The permanent water treatment system design is
expected to remove PFAS contaminants. The City of Portsmouth will follow all federal and state
guidelines and requirements to ensure the treated water meets current water quality
standards.
Drinking water sampling for PFAS was conducted at several distribution points from June 2014
through December 2015. Table 4 highlights the concentrations of PFAS after the Haven well
was shut down, using three locations: DES office, water treatment plant, and Fire Station No. 3.
The maximum detected PFOS and PFOA concentrations in the distribution points were 0.016
µg/L and 0.0073 µg/L respectively. The sampling indicated that the maximum detected PFOS
concentration was equal to the HBCV at the NHDES office and slightly above the HBCV at the
water treatment plant. There were no exceedances of any other PFAS at any other sampling
locations, which included two childcare centers and a fire station [City of Portsmouth 2017a].
For more details on those samples, see Table A-5 (Appendix A).
16

Table 4. Summary of per- and polyfluoroalkyl substances in the Pease Tradeport water supply (New Hampshire Department of Environmental Services (NHDES) office, water treatment plant distribution point, and Fire Station No. 3) from June 2014 through May 2017, Pease International Tradeport, Portsmouth, New Hampshire, concentrations in micrograms per liter (µg/L)
NHDES office
(13 sa mples)
plant
distributio n point
(9 sam ples)
Fire Stati on No. 3
(2 samples)
Specific PFAS
HBCV Min Max Min Max Min Max
PFHpA None* ND ND ND ND ND ND
PFHxA None* 0.003 0.0081 0.003 0.006 ND 0.007
PFHxS 0.14† 0.006 0.019 0.006 0.019 0.012 0.019
PFOA 0.021† ND 0.0073 ND ND 0.0055 0.0061
PFOS 0.014† 0.006 0.014 0.006 0.016 0.012 0.013
PFPeA None* 0.003 0.0083 0.004 0.007 0.0037 0.009 Abbreviations: HBCV = health-based comparison value; Max = maximum value detected; Min = minimum value detected; ND = not detected; PFAS = per- and polyfluoroalkyl substances; PFHpA = perfluoroheptanoic acid; PFHxA = perfluorohexanoic acid; PFHxS = perfluorohexane sulfonic acid; PFOA = perfluorooctanoic acid; PFOS = perfluorooctanesulfonic acid; PFPeA = perfluoropentanoic acid.
*Although lacking health-based comparison values, these were selected for further in-depth analysis because they were detected at higher concentrations. Other PFAS with no HBCV and detected at low concentrations will be included as part of the overall evaluation of mixtures. †ATSDR derived value for children's exposures. This value is called an Environmental Media Evaluation Guide (EMEG) and is an estimated contaminant concentration that is not expected to result in adverse noncarcinogenic health effects based on ATSDR evaluation. EMEGs are based on ATSDR provisional MRLs and conservative assumptions about exposure, such as intake rate, exposure frequency and duration, and body weight. Child drinking water EMEGs are based on an infant (age birth to one year old) weighing 7.8 kg and an intake rate of 1.113 liters per day.
Note: Shaded = Concentrations are above a health-based comparison value.
Water treatment
Table 5 highlights the PFAS concentrations in the on-site childcare center (Great Bay Kids’
Company and Discovery Child Enrichment Center) sample locations after the Haven well was
taken off-line. Table A-6 in Appendix A shows additional, low level PFAS detections. The
maximum detected PFOS and PFOA concentrations in the childcare distribution points were
0.012 µg/L and 0.005 µg/L, respectively. Those concentrations, both individually and combined,
are below the current EPA lifetime health advisory (0.070 µg/L) and below ATSDR health-based
comparison values. Other PFAS were detected at low levels below ATSDR’s lowest HBCV or did
not exceed available ATSDR HBCVs. For more details on those samples, see Table A-6 (Appendix
A).
17

Table 5. Summary of per- and polyfluoroalkyl substances (PFAS) detected in the Pease Tradeport public water supply at two childcare centers, March 2015, September 2015, and October 2015, Pease International Tradeport, Portsmouth, New Hampshire; concentrations in micrograms per liter (µg/L)
Great Bay Kids’ Discovery Child Enrichment Company* Center†
Specific PFAS HBCV Min Max Min Max
PFHpA None‡ ND ND ND ND
PFHxA None‡ 0.004 0.005 ND ND
PFHxS 0.14§ 0.01 0.014 0.01 0.014
PFOA 0.021§ ND 0.005 ND ND
PFOS 0.014§ 0.011 0.012 0.007 0.012
PFPeA None‡ 0.005 0.006 0.006 0.006
Abbreviations: HBCV = health-based comparison value; Max = maximum value detected; Min = minimum value detected; ND = not detected; PFHpA = perfluoroheptanoic acid; PFHxA = perfluorohexanoic acid; PFHxS = perfluorohexane sulfonic acid; PFOA = perfluorooctanoic acid; PFOS = perfluorooctanesulfonic acid; PFPeA = perfluoropentanoic acid.
*Results from two untreated samples from the Pease Tradeport Water Supply at Great Bay Kids’ Companylocation.†Results from two untreated samples from the Pease Tradeport Water Supply at Discovery Child EnrichmentCenter location.‡Although lacking health-based comparison values, these were selected for further in-depth analysis because theywere detected at higher concentrations. Other PFAS with no HBCV and detected at low concentrations will beincluded as part of the overall evaluation of mixtures.§ATSDR derived value for children's exposures. This value is called an Environmental Media Evaluation Guide(EMEG) and is an estimated contaminant concentration that is not expected to result in adverse noncarcinogenichealth effects based on ATSDR evaluation. EMEGs are based on ATSDR provisional MRLs and conservativeassumptions about exposure, such as intake rate, exposure frequency and duration, and body weight. Childdrinking water EMEGs are based on an infant (age birth to one year old) weighing 7.8 kg and an intake rate of1.113 liters per day.
Summary of Screening Analysis
For data obtained before June 2014, PFOS, PFOA, and PFHxS were selected for further in-depth
evaluation because their estimated maximum modeled concentrations were above their
respective HBCVs. Neither the modeled nor measured levels of PFNA were above an HBCV
indicating that no further evaluation is needed. However, PFNA was included as part of the
mixture evaluation. Three PFAS that lacked HBCVs (PFHpA, PFHxA, and PFPeA) were selected
for further in-depth evaluation because they occurred in significant concentrations in the water
and some scientific information on health effects were available to evaluate exposure. Other
PFAS with no HBCVs, detected at low concentrations and with limited toxicological data, will be
18

included as part of the overall public health evaluation of the PFAS mixture. These are
summarized in Table A-1 in Appendix A.
For data collected after June 2014, the maximum detected PFOS concentration was equal to
the HBCV at the NHDES office and above the HBCV at the water treatment plant (see Table A-
5). There were no exceedances of any other PFAS at any other sampling locations, which
included two childcare centers and a fire station (see Table A-6) [City of Portsmouth 2017a].
Public Health Implications of Exposure to PFAS in Drinking Water
A MRL is an estimate of the amount of a chemical a person can eat, drink, or breathe each day
without a detectable non-cancer risk to health. MRLs serve as a tool to help public health
professionals determine areas and populations potentially at risk for health effects from
exposure to a particular chemical.
MRLs are a screening tool that help identify exposures that could be potentially hazardous to
human health. Exposure above the MRLs does not mean that health problems will occur.
Instead, it serves as a signal to health assessors to look more closely at a particular site where
exposures may be identified. MRLs do not define regulatory or action levels for ATSDR.
The way the MRL is calculated can change depending on type and quality of data available.
MRLs can be set for 3 different time periods (the length of time people are exposed to the
substance): acute (about 1 to 14 days), intermediate (from 15-364 days), and chronic (exposure
for more than 365 days). MRLS are also calculated for different exposure routes (for example:
inhalation and ingestion). ATSDR has developed over 400 human health MRLs. MRLs are
developed for health effects other than cancer. For PFAS, ATSDR has developed provisional
MRLs for ingestion for PFOS, PFOA, PFHxS, and PFNA based on intermediate duration oral
animal studies. ATSDR is using these intermediate provisional oral MRLs to also screen and
evaluate chronic exposures [ATSDR 2018a]. As the fetus/neonate is the most sensitive group,
the provisional MRLs developed for the four PFAS are protective for the entire population and
for health endpoints that may occur at higher concentrations. In addition, ATSDR considered
immune effects in the development of our provisional MRLs as these effects may be a more
sensitive effect than developmental effects. Because of this, ATSDR added in a modifying factor
of 10 for concern that immunotoxicity may be a more sensitive endpoint than developmental
toxicity for some of the provisional oral MRLs [ATSDR 2018a].
Proposed MRLs undergo a rigorous review process. Following internal review by ATSDR’s expert
toxicologists, the MRLs go to an expert panel of external peer reviewers, an interagency MRL
19
workgroup, with participation from federal agencies, such as CDC’s National Center for
Environmental Health and National Institute of Occupational Safety and Health, the National
Institutes of Health’s National Toxicology Program, and EPA, before being submitted for public
comment [ATSDR 2018a].
Many studies have examined possible relationships between levels of per- and polyfluoroalkyl
substances (PFAS) in blood and harmful health effects in people. However, not all studies
involved the same groups of people, the same type of exposure, or the same PFAS, resulting in
a variety of observed health outcomes. Research in humans suggests that high levels of certain
PFAS may lead to
• increased cholesterol levels;
• changes in liver enzymes;
• decreased vaccine response in children;
• increased risk of high blood pressure or pre-eclampsia in pregnant women;
• small decreases in infant birth weights (<20 grams (0.7 ounces) decrease in birth
weight per 1 ng/mL increase in PFOA or PFOS in blood);
• increased risk of kidney or testicular cancer (ATSDR, 2018a)
Currently, scientists are still learning about the health effects of exposures to mixtures of PFAS.
One way to learn about whether PFAS will harm people is to do studies on lab animals.
• Most of these studies have tested doses of PFOA and PFOS that are higher than levels
found in the environment.
• These animal studies have found that PFOA and PFOS can cause damage to the liver
and the immune system.
• PFOA and PFOS have also caused birth defects, delayed development, and newborn
deaths in lab animals.
Humans and animals react differently to PFAS, and not all effects observed in animals may
occur in humans. Scientists have ways to estimate how the exposure and effects in animals
compare to what they would be in humans.
Some PFAS build up in the human body. The levels of some PFAS go down slowly over time
when exposure is reduced or stopped. Scientists in multiple federal agencies are studying how
different amounts of PFAS in the body might affect human health over time. In addition,
investigators are actively studying whether being exposed to multiple PFAS chemicals at the
same time increases the risk of health effects. Most existing research has focused on long-chain
20
PFAS. These persist in the environment; bioaccumulate in wildlife and humans; and are toxic to
laboratory animals, producing reproductive, developmental, and systemic effects in laboratory
tests.
Long-chain PFAS comprise two sub-categories:
● perfluoroalkyl carboxylic acids (PFCAs) with eight or more carbons, including PFOA, and
● perfluoroalkane sulfonic acids (PFSAs) with six or more carbons, including
o perfluorohexane sulfonic acid (PFHxS) and
o perfluorooctane sulfonic acid (PFOS).
While persistent in the environment, PFCAs with fewer than eight carbons, such as
perfluorohexanoic acid (PFHxA), and PFSAs with fewer than six carbons, such as
perfluorobutane sulfonic acid (PFBS), are generally less bioaccumulative in wildlife and humans
[EPA 2018b]. However, health effects of many short-chained PFAS and new PFAS alternatives
have not been fully researched. See Table A-2 for a listing of PFAS chemical formulas and
designated chain length.
It is important to remember that the likelihood of adverse health effects depends on several
factors, such as the concentrations of different PFAS, as well as the frequency and duration of
exposure. More frequent exposure can increase risk. Higher concentration and length of time
exposed can lead to increased risk.
Exposure from 1993 to May 2014
Because the data collected in 2014 were from water supply wells, ATSDR must rely on
computer-modeled concentrations for the distribution points to estimate past exposures. Using
these data, ATSDR considered the following lines of evidence to evaluate the likelihood of
health effects from past exposures:
• Potential effects of individual exposures to PFOA, PFOS, and PFHxS (PFAS with ATSDR
provisional MRLs)
• Potential effects of individual exposures to PFHxA, PFHpA, and PFPeA (PFAS with no
ATSDR provisional MRLs)
• Potential effects of exposures to a mixture of PFAS
• Biological measurements from past exposure
• Potential contributions from other sources
21

• Potential effects on susceptible populations: persons with pre-existing conditions and
early development
Given all the uncertainties related to evaluating PFAS compounds in general, ATSDR used the
maximum modeled concentration as a conservative approach. The selection of the maximum
values not only enabled the evaluation of long-term exposures but also exposures of less than 1
year (including young children at childcare centers). To estimate the exposure doses from past
consumption of the water, ATSDR used default exposure scenario assumptions [ATSDR 2016a,
2016b]. ATSDR’s default exposure assumptions are defined by specific age ranges, resulting in
estimated exposures for each age group. ATSDR used the maximum estimated modeled
concentrations from the distribution points to estimate the central tendency exposure (CTE)
and the reasonable maximum exposure (RME) that might be expected for each age group (see
Equations 2 and 3 in Appendix A). The central tendency exposure is the average water intake.
The reasonable maximum exposure is the maximum estimated exposure dose that might occur
at this site, based on the available data and assuming maximum water intake in each age group.
To account for less than residential exposures, ATSDR applied an exposure frequency factor of
71% (5 days divided by 7 days) to the exposure dose calculations to match a typical employee
workplace and a year-round childcare attendance frequency [ATSDR 2016a].
Exposures to PFOA and PFOS
Exposure doses were compared with the ATSDR provisional MRLs for PFOA and PFOS. The MRL
is 100% of a total daily exposure below which no adverse health effects are expected. ATSDR
derived an intermediate duration (15-364 days) oral provisional MRL of 3 × 10⁻⁶ mg/kg/day for
PFOA. This MRL is based on neurodevelopmental effects (i.e., altered activity at 5–8 weeks of
age and skeletal alterations at 13 and 17 months of age) in the offspring of mice fed a diet
containing PFOA [Koskela et al. 2016]. The PFOA provisional MRL is calculated using a human
equivalent dose (HED), lowest observed effect level (LOAEL) of 0.000821 mg/kg/day and a total
uncertainty factor of 300 (10 for use of a LOAEL, 3 for extrapolation from animals to humans,
and 10 for human variability). For PFOS, ATSDR derived an intermediate duration oral
provisional MRL of 2 × 10⁻⁶ mg/kg/day. This MRL is based on developmental effects (i.e.,
delayed eye opening and transient decrease in body weight during lactation) in the offspring of
rats administered PFOS [Luebker et al. 2005]. The provisional MRL is calculated with an HED no
observed adverse effect level (NOAEL) of 0.000515 mg/kg/day and a total uncertainty factor of
30 (3 for extrapolation from animals to humans with dosimetric adjustments and 10 for human
variability) and a modifying factor of 10 to account for concern that immunotoxicity may be a
more sensitive endpoint than developmental toxicity [ATSDR 2018a]. The HED LOAEL for
22
developmental effects from the Luebker et al. (2005) study was estimated to be 0.0021 or
2.1 × 10⁻³ mg/kg/day.
Adverse health effects from PFOS and PFOA exposure in animals that are the same in humans
include changes in total cholesterol and decreased birth weight. In animal studies, there are
common effects to the liver, neonatal development, and immune system. PFOS and PFOA
provisional MRLs are based on developmental endpoints. The maximum estimated modeled
PFOS and PFOA concentrations for any one month in the Pease Tradeport PWS was 1.71 µg/L
and 0.24 µg/L, respectively. These values were used to calculate exposure doses. In Appendix A,
Tables A-10 and A-11 present the exposure assumptions and exposure doses of PFOS and PFOA
for each age group, along with hazard quotients (HQ). An HQ is the ratio of the exposure doses
for PFOA and PFOS divided by their provisional MRLs.
An RME scenario assumes a higher than average water intake and, thus, that people have more
exposure to a contaminant. In this scenario, PFOA and PFOS HQs for all age groups, for a
pregnant woman, and for a lactating woman using the Pease Tradeport PWS estimated water
concentrations before May 12, 2014, exceeded 1.0. Assuming an average water intake rate
(referred to as a central tendency exposure or CTE scenario), all HQs for PFOS were above 1.0;
however, for PFOA, all were above 1.0 except for older children (6-21 years), adults and
pregnant women. The highest HQs were for young children (birth to less than 1 year).
If the HQ is greater than 1.0, concern for the potential hazard of the mixture increases as the
HQ increases. As can be seen from Tables A-10 and A-11, the HQs for PFOS were particularly
high and much greater than for PFOA. To put these HQs into perspective, ATSDR calculated a
margin-of-exposure (MOE). The MOE is the effect level, developed from animal studies, used to
derive the ATSDR provisional MRL divided by the dose from exposure to Pease public water. In
contrast to the HQ, the lower the MOE, the closer the exposure was to effect levels which
indicates more concern. Assuming 100% of the PFAS exposure is from drinking water, the PFOS
exposure dose for the most exposed Pease Tradeport PWS user, a child younger than 1 year, is
1.7 × 10⁻⁴ mg/kg/day. The MOE between the exposure dose and the lowest observed adverse
effect level human equivalent dose (LOAEL)HED (2.1 × 10⁻³ mg/kg/day) for developmental effects
was about 25 and 12 for the CTE and RME scenarios, respectively. To provide additional
perspective to exposure doses and immune effect levels found in the scientific literature, MOEs
were also calculated based on the Dong et al. (2011) and the Guruge et al. (2009) studies for a
RME scenario. The MOEs ranged from <1 to 2.4 for the Guruge et al. and Dong et al. studies,
respectively. Based on the current scientific literature, ATSDR understands that the immune
effect levels from PFOS exposures lies somewhere between the HED LOAELs for these two
studies (i.e., 4.1 × 10⁻⁴ for the Dong study and 3.1 × 10⁻⁵ for the Guruge et al. study). These
23
exposure doses are near or exceed the lower HED LOAEL from the Guruge et al. (2009) study
and would be considered potentially harmful. Therefore, PFOS exposures before May 2014 may
result in harmful immune effects.
The MOE between the exposure dose and the estimated PFOA lowest observed adverse effect
level human equivalent dose (LOAEL)HED (8.2 × 10⁻⁴ mg/kg/day) for neurodevelopmental effects
shown in the Koskela et al. 2016 animal studies was 74 and 33 for the CTE and RME scenarios,
respectively. Based on the above, past exposures to PFOS and PFOA from the Pease Tradeport
PWS are of concern and the estimated exposures do not include PFOA and PFOS exposures
from non-drinking water sources.
24

Exposure to PFHxS
An intermediate-duration oral provisional MRL of 2 × 10⁻⁵ mg/kg/day was derived for PFHxS
based on thyroid follicular cell damage (considered the most sensitive health outcome) in adult
male rats administered PFHxS for a minimum of 42 days [Butenhoff et al. 2009; Hoberman and
York 2003]. The provisional MRL is based on a HED NOAEL of 0.0047 mg/kg/day and a total
uncertainty factor of 30 (3 for extrapolation from animals to humans and 10 for human
variability) and a modifying factor of 10 for database limitations. The modifying factor for
database limitations was added to account for the small number of studies examining the
toxicity of PFHxS following intermediate-duration exposure and the limited scope of these
studies in particular studies examining immune effects, a sensitive endpoint for other PFAS, and
general toxicity [ATSDR 2018a]. The HED LOAEL from these studies is estimated to be 0.0073 or
7.3 × 10⁻³ mg/kg/day.
As seen in Table A-12, for the CTE scenario, only a child (birth to less than 1 year) had a dose
above the ATSDR provisional MRL. No other age groups for the to the CTE scenario were at or
above an HQ of 1.0. However, for the upper water intake scenario (RME), children 1 to 6 years
old and lactating women were at or above an HQ of 1.0. As for PFOA and PFOS above, to put
these HQs into perspective, ATSDR calculated MOEs for PFHxS. Assuming 100% of the PFAS
exposure is from drinking water, the PFHxS exposure dose for the most exposed Pease
Tradeport PWS user, a child younger than 1 year, is 5.85 × 10⁻⁵ mg/kg/day. The MOE between
the exposure dose and the lowest observed adverse effect level human equivalent dose
(LOAEL)HED for thyroid effects was about 125 and 278 for the CTE and RME scenarios,
respectively. Any conclusions for PFHxS human health effects are limited as the number and
scope of intermediate study duration studies are limited, especially for studies examining
immune effects, a sensitive endpoint for other PFAS, and general toxicity [ATSDR, 2018a]. For a
child younger than 1 year, the HQ was about 3 indicating that the dose received by this age
group could have been 3 times higher than ATSDR’s MRL. Based on exposures to PFHxS alone,
ATSDR would expect only a slight increased risk of harmful effects only for young children less
than 1 year that consumed more than average amounts of water on a daily basis (see the
Exposure to a Mixture of PFAS section below for more health perspective on this exposure).
Exposure to Other Individual PFAS
Before June 2014, people also were exposed to other PFAS. PFHxA (0.23 µg/L), PFPeA (0.19
µg/L), and PFHpA (0.08 µg/L) were detected at the highest estimated concentrations. The likely
health effects for each of these compounds, based on the best available scientific information,
are discussed below.
25
Exposure to PFHxA
Very limited information is available about the health effects of PFHxA exposure. One study
evaluated the chronic oral (ingestion) toxicity of PFHxA in laboratory animals [Klaunig et al.
2015]. Female rats exposed to 200 mg/kg/day had changes to their blood, such as decreased
red blood cells and hemoglobin levels and increased reticulocyte counts. Exposure also caused
renal effects (tubular degeneration, necrosis, increased urine volume, and reduced specific
gravity) and liver effects (necrosis). No adverse alterations (NOAELs) were seen in female rats at
30 mg/kg/day or in male rats at 100 mg/kg/day. One major uncertainty related to this study is
that serum PFHxA levels were not measured. Based on the maximum estimated concentration
of PFHxA in the Pease Tradeport PWS, the estimated reasonable maximum exposure dose for a
young child is 2.3 × 10⁻⁵ mg/kg/day (Table A-13). This dose is about a million times lower than
the lowest NOAEL from the Klaunig et al. [2015] study. Based on this study alone, harmful
effects are unlikely. However, although this PFAS has not been studied as extensively as the
PFAS with ATSDR MRLs (especially for the most sensitive health endpoints such as
developmental and immune effects) and the only identified chronic study has limitations, as
previously stated, PFCA chemicals with fewer than eight carbons, such as perfluorohexanoic
acid (PFHxA) are generally less toxic and less bioaccumulative in wildlife and humans [EPA,
2018a].
Exposure to PFHpA and PFPeA (individually)
Very little scientific information is available from either human or animal studies about the
health effects of exposure to PFHpA and PFPeA. However, for PFHpA, ATSDR identified several
human studies for cardiovascular disease, serum lipids, immune response, and other effects
that found either limited or no association. No studies for PFHpA and PFPeA were identified to
allow ATSDR to compare the exposure dose from the Pease Tradeport PWS and effect levels
(i.e., NOAELs or LOAELs) [ATSDR 2018a]. Therefore, ATSDR can make no health conclusions for
PFHpA and PFPeA. However, although PFHpA and PFPeA have not been studied as extensively
as the PFAS with ATSDR provisional MRLs, these PFAS are short-chained and not sulfonated
indicating they may bioaccumulate relatively less than longer-chained and sulfonated PFAS.
However, health effects of many short-chained PFAS and new PFAS alternatives have not been
fully researched.
26
Exposure from June 2014 to the Present (individual PFAS)
Because PFOS was the only PFAS above an ATSDR HBCV in distribution samples taken after May
2014, it was further evaluated. As seen in Table A-14, none of the estimated PFOS exposure
doses after June 2014 was above an HQ of 1.0 indicating that exposures to PFOS alone are not
expected to be harmful. In addition, because PFOA, PFHxS, and PFNA were below ATSDR’s
HBCVs, we do not expect harmful effects from individual exposures to these PFAS. Other PFAS
detected in the distribution system since June 2014 could not be evaluated individually because
of the lack of scientific data. However, further evaluation of the mixture of all PFAS exposures
after June 2014 was conducted and is explained below.
Exposure to a Mixture of PFAS
To evaluate the potential risk for cumulative exposures to PFOA, PFOS, PFHxS, and PFNA (those
PFAS with ATSDR-derived provisional MRLs), ATSDR calculated a hazard index. The hazard index
approach assumes dose additivity to assess the non-cancer health effects of a mixture. The
hazard index is the sum of the HQs for each of the four PFAS with ATSDR provisional MRLs. If
the hazard index is less than 1.0, it is unlikely that significant additive or toxic interactions
would occur; so no further evaluation is necessary. If the hazard index is greater than 1.0,
concern for the potential hazard of the mixture increases. Only two studies [Carr et al. 2013;
Wolf et al. 2014] have shown binary pairs of PFAS (i.e., comparing only two PFAS together)
demonstrate concentration and response additivity at lower concentrations, but deviate from
additivity at higher concentrations [Wolf et al. 2014]. These possible interactions (or dose
additivity) complicate the interpretation of the epidemiology data.
In the absence of data, chemical component-based approaches are used in risk assessment of
chemical mixtures. Component chemicals, that are judged to be toxicologically similar, are
evaluated by dose additive risk assessment methods that include the hazard index, relative
potency factors, and toxicity equivalency factors. These methods are based on potency
weighted dose addition and assume that there are no greater than or less than additive
interactions among the chemicals in the dose region of interest. Because of these limited data,
ATSDR cannot assume any mixture effect except additivity.
With the exception of the hazard index approach for PFOA, PFOS, PFHxS, and PFNA, there is not
a broadly accepted scientific method to quantitatively evaluate the possible health effects of
combined exposures to PFAS. In addition, as stated previously, not all PFAS share the same
health outcomes. Therefore, ATSDR evaluated the scientific literature to determine what health
27

effects from the chemicals in the PFAS mixture found in the Pease Tradeport PWS might have
similar health endpoints.
Exposures from 1993 to May 2014
For PFOA, PFOS, and PFNA (see Table A-15 for individual PFNA doses used in the mixture
evaluation), ATSDR derived its provisional MRLs based on developmental effects, and for PFHxS
based on thyroid effects. However, other studies show that developmental effects may occur
from exposure to PFHxS (see Table A-1). Therefore, ATSDR will evaluate if additional risk of
developmental effects is possible from the combined exposure to these four PFAS in the Pease
Tradeport PWS. Table A-16 shows the hazard indices for the combined exposures to these four
PFAS. The hazard indices for the CTE and RME scenarios for infants are 44 and 98 which are well
above 1.0. These numbers show a potential for additional risk for developmental effects
beyond what might be expected from exposure to any one of these PFAS alone. Three of the
PFAS for which ATSDR has derived provisional MRLs (PFOS, PFOA, and PFHxS) have also been
shown to have possible immune system effects (see Table A-1). Although ATSDR could not
derive a provisional MRL based on immune effects, the agency added a modifying factor of 10
to the derivation of the provisional MRLs for PFOS and PFHxS to account for immune effects.
Therefore, in addition to developmental effects, increased immune effects are also possible.
Each of the effects to target organ systems in Table A-1, has at least two PFAS compounds
found to be associated with them in animal or human epidemiological studies. Moreover, at
least four PFAS compounds are associated with developmental, liver, immune, and serum lipid
effects. Therefore, although we lack refined evaluation methods, the combined exposures to
PFAS compounds from the Pease Tradeport PWS might have increased the risk for some of
these non-cancer health outcomes.
Exposures from June 2014 to Present
ATSDR used a similar approach as above to evaluate the cumulative exposure to PFAS with
derived ATSDR provisional MRLs for exposures since June 2014. As seen in Table A-17, only the
HI for children6 less than one year (for the RME scenario) was above 1.0 (1.17). Given that the
HI is only slightly above 1.0, that it represents conservative assumptions (i.e., using the
maximum concentration represent longer-term intermediate and chronic exposures), and that
none of the PFOA, PFOS, PFHxS, and PFNA levels were above HBCVs for the childcare centers,
6 please note that the individual HQs summed in this table are shown in Tables A-14, A-19, A-20 and that PFNA was not included since it was not detected in water samples analyzed since June 2014
28

it is unlikely that the combined exposures to these four PFAS would increase the risk of
harmful effects higher than what was predicted by exposures to each alone. As with the
mixtures evaluation above, we lack refined methods to evaluate the combined exposures to
other PFAS without HBCVs detected in the Pease Tradeport PWS since June 2014. However, as
stated above, all the maximum levels were either not detected or, if present, were only
detected in low ppt levels and below ATSDR’s most conservative HBCV. Moreover, at least half
of the PFAS detected with no ATSDR MRLs were short-chain and non-sulfonated. Generally,
these PFAS bioaccumulate less in wildlife and humans. However, health effects of many short-
chained PFAS and new PFAS alternatives have not been fully researched.
Biomonitoring r esults for Pease International Tradeport — New Hampshire
Department of Health & Human Services Blood Sampling Pro gram
Biomonitoring has been increasingly used to assess people’s exposure to environmental
chemicals. Serum levels of PFAS tend to reflect cumulative exposure over several years from all
sources. Although there is no current guideline that tell us what levels of PFAS in blood are
“safe” or “unsafe” and body burden levels reflect overall exposure from all sources and routes,
monitoring PFAS in blood can help physicians and public health officials determine whether or
not people have been exposed to higher levels of PFAS than are found in the general population
and also help scientists plan and conduct research on exposure and health effects. Background
levels of 16 PFAS in the blood serum of the United States population are monitored at regular
intervals through the National Health and Nutrition Examination Survey (NHANES) [CDC 2018].
The trend for PFOA and PFOS levels in serum has been declining for several years, most likely
because of reductions in their use [CDC 2013].
Responding to requests from the affected public, the New Hampshire Department of Health
and Human Services (NH DHHS) began a biomonitoring program to determine blood serum
PFAS levels for those exposed at Pease International Tradeport. [NH DHHS 2015, 2016a, 2016b,
2016c, 2017a]. Between April and October 2015, 1,578 members of the Pease Tradeport
community had their blood tested for PFAS exposure. An additional 258 persons from the Pease
Tradeport community had their blood tested in 2016-2017 [NH DHHS 2017b]. The results of the
first round of biomonitoring were analyzed and presented in a NH DHHS report [NH DHHS
2015]. The results from that report were presented to the public at a community meeting held
June 16, 2016. About 23% of the samples were from children ages 11 years or younger. Three
PFAS (PFOS, PFOA, and PFHxS) were detected in more than 94% of all samples. The geometric
means of these three PFAS were also significantly higher than for the population tested in the
2011 to 2012 NHANES. PFNA was detected in 85% of the blood samples, but its geometric mean
29

was significantly lower in the Pease International Tradeport population than those in the
NHANES data.
The other PFAS tested for in blood were detected in less than half of the Pease International
Tradeport population and at much lower concentrations than PFOS, PFOA, PFHxS, and PFNA.
NH DHHS therefore concluded that a meaningful analysis and comparison of the other PFAS
was not possible. PFOS, PFOA, and PFHxS geometric means in the Pease International Tradeport
children’s group were also significantly elevated compared with the 2011–2012 NHANES data,
but the PFNA geometric mean did not differ significantly between the two. Only PFOA had a
significantly different geometric mean level between the Pease International Tradeport
children’s group and the Pease International Tradeport adolescent/adult population. (see NH
DHHS 2017a for additional resources).
Before the release of the 2013–2014 NHANES data, children ages less than 12 years were not
included in the NHANES data. Initially, because there was no ideal comparison for the Pease
International Tradeport children’s group (ages less than 12 years), the NH DHHS compared
children’s serum levels to 2011–2012 NHANES results for Pease International Tradeport
adolescents and adults to put the Pease International Tradeport children (ages less than 12
years) serum levels into context, as noted above. However, since the release of the 2013–2014
NHANES data, which does include data for children less than 12 years, the NH DHHS revised
their age-specific comparisons, which are available from https://wisdom.dhhs.nh.gov/wisdom.
NH DHHS also evaluated the data for the 258 persons who participants in the blood sampling in
2016-2017. For PFOA, only blood levels for persons 12 years and older were statistically
significantly higher (by 0.5 µg/L) than for the general U.S. population. For PFOS, levels for all
age groups were higher than for the general U.S. population and were statistically significant
(3.6 and 5.2 µg/L higher for the 3-11 and 12 and older age groups, respectively). Finally, for
PFHxS, levels for all age groups were higher than for the general U.S. population (2.6 and 3.1
µg/L higher for the 3-11 and 12 and older age groups, respectively) and the results were
statistically significant [NH DHHS 2017c]. The 2016-2017 results are consistent with the 2015
sampling [NH DHHS 2017b].
Health outcomes cannot be determined from the testing results. A person’s risk for developing
health effects from PFAS exposure is unknown. Currently, no PFAS serum levels in humans have
been identified at which adverse health effects are expected. The Pease Biomonitoring program
implemented by NH DHHS was based on convenience sampling, while NHANES uses a
statistically based approach. Convenience sampling collects information from population
members who are readily available to participate and volunteer and is inherently biased
30
towards participants with the greatest interest in the study. Statistically based sampling uses
the power of statistics to generate unbiased findings that represent an entire community, even
people that did not get their blood tested. Therefore, direct comparison of the Pease
Biomonitoring Program results to NHANES data has limitations.
Contributions from Other Sources
We do not have enough information to identify individual exposure sources nor to estimate
the background exposure level in the PWS water users. Those sources might include PFAS-
contaminated food (certain types of fish and shellfish if nearby streams, rivers, lakes, or other
water bodies are affected), hand-to-mouth transfer from surfaces previously treated with PFAS-
containing stain protectants (carpet being most significant for infants and toddlers), or eating
food packaged in material containing PFAS, such as popcorn bags, fast food containers, or pizza
boxes.
Susceptible Populations: Persons with Pre-existing Health Conditions and Early
Development
The available epidemiology data identify several potential targets of toxicity of PFAS, and
people with pre-existing conditions may be unusually susceptible. For example, it appears that
exposure to PFOA or PFOS can increase serum lipid levels, particularly cholesterol levels. Thus,
an increase in serum cholesterol may result in a greater health impact in persons with high
levels of cholesterol or with other existing cardiovascular risk factors. Similarly, increases in uric
acid levels have been observed in persons with higher PFAS levels; increased uric acid may be
associated with an increased risk of high blood pressure. Thus, people with hypertension may
be at greater risk. The liver is a sensitive target in many animal species and might be a target in
humans. Therefore, people with compromised liver function could be a susceptible population
[ATSDR 2015, 2018a]. Finally, human studies have indicated that some PFAS may affect immune
function [ATSDR 2018a]. Therefore, persons who are immunocompromised may also be a
susceptible population to PFAS exposures. The relationship between PFOA and PFOS exposure
and increased risk for cardiovascular disease is currently inconclusive. Additional research is
needed to understand how exposure to these chemicals might affect people with pre-existing
risk factors (such as elevated cholesterol) for cardiovascular disease.
ATSDR recognizes that the unique vulnerabilities of the unborn, infants, and children demand
special emphasis in communities affected by environmental contamination. A child’s
31

developing body systems can sustain damage if toxic exposures occur during critical growth
stages. Children ingest a larger amount of water relative to body weight than adults, resulting in
a higher intake of pollutants in proportion to body size. In addition, children exhibit hand-to-
mouth behavior and could be exposed to PFAS from previously treated carpet materials.
Reducing exposures to sources of PFAS, in infants and young children, are extremely important
because of their unique vulnerabilities. As evidence for this concern:
• Formula-fed infants consuming formula mixed with contaminated water would have a
higher exposure compared to adults as a result of formula being their sole or primary
food source and their smaller body weight.
• Evidence suggests that high serum (human blood) PFOA or PFOS levels are associated
with lower birth weights. Studies of populations with lower serum PFOA or PFOS levels
have not found significant associations with birth weight. However, although significant
associations were found for the high serum group, decreases in birth weight were small
and may not be biologically relevant [ATSDR 2018a].
Cancer Evaluation
Epidemiologic data suggest a link between PFOA exposure and elevated rates of kidney,
prostate, and testicular cancer. However, additional studies are needed to confirm the link
between PFOA and other PFAS exposures and cancer to say they are the cause. Currently, EPA
considers the evidence suggestive that PFOA has the potential to be carcinogenic in humans
and the Agency for Research on Cancer has determined that PFOA is possibly carcinogenic to
humans [EPA 2016b]. Animals given PFOA have shown higher rates of liver, testicular, and
pancreatic tumors. We do not know if cancer at these three sites in animals results from a
mode of action that is relevant to humans. Epidemiology studies of PFOS exposed workers
observed an increased risk for some cancers; however, because of the small sample size, they
were not statistically significant [Alexander et al. 2003; Alexander and Olsen 2007; Grice et al.
2006; Olsen et al. 2004]. A causal link based on human studies between cancer and PFOS
exposures remains uncertain. Animal studies have found limited, but suggestive evidence of
PFOS exposure and increased incidence of liver, thyroid, and mammary tumors. Although
current data are very limited, other PFAS may be carcinogenic while some may not.
32

EPA calculated a PFOA oral cancer slope factor (CSF)7 as a comparison to the safety of their
reference dose against carcinogenic effects, not as an official CSF for inclusion on their
Integrated Risk Information System [EPA 2016b]8. Using the testicular cancer data from a 2012
rat study [Butenhoff et al. 2012], EPA calculated a CSF of 0.07 mg/kg/day–1 [EPA 2016b].
To estimate the potential cancer risk from exposure to PFOA, ATSDR used the maximum
modeled levels of PFOA in public water wells (0.2 µg/L). Table A-18 shows the estimated cancer
risk calculations, by age, for PFOA exposure. The estimated lifetime excess cancer risk
calculations were based on Equation 1 in Appendix A. We do not know when PFAS
contaminated the groundwater and reached the public and private water supply wells. As an
estimate, ATSDR used an exposure time of 26 years (from the opening of the Pease
International Tradeport to 2017). ATSDR assumed that persons were exposed to the maximum
estimated PFOA concentration for these 26 years which is likely to overestimate the estimated
cancer risk. Based on these assumptions and assuming that the EPA CSF on testicular cancer
from a rat study approximates the actual cancer risk for PFOA, then the estimated adult cancer
risk from exposure to the maximum detected PFOA concentration in the public water supply
system is 1.3 × 10⁻⁷. This means that if 10 million people were similarly exposed, we might see
an additional two cases of cancer. Please note that this is a theoretical estimate of cancer risk
that is used by ATSDR as a tool for deciding whether public health actions are needed to protect
health—it is not an actual estimate of cancer cases in a community. This estimated cancer risk
level is considered a very low cancer risk. However, this theoretical cancer risk must be viewed
with caution because the EPA CSF is not an official one for inclusion in IRIS and other cancers
that were elevated in epidemiological studies of PFOA exposure were not evaluated (i.e., kidney
and prostate cancer).
Currently, EPA does not have an oral cancer slope factor for PFOS or other PFAS because the
animal data do not show a measurable or dose-response relationship. Therefore, ATSDR cannot
calculate the estimated cancer risk from PFOS or other potentially carcinogenic PFAS exposures
and the actual cancer risk from all PFAS exposures from private wells is uncertain.
7 EPA defines oral cancer slope factor (CSF) as “An upper bound, approximating a 95% confidence limit, on the increased cancer risk from a lifetime oral exposure to an agent. This estimate, usually expressed in units of proportion (of a population) affected per mg/kg-day, is generally reserved for use in the low-dose region of the dose-response relationship, that is, for exposures corresponding to risks less than 1 in 100.” See also https://www.epa.gov/fera/risk-assessment-carcinogenic-effects. 8 The EPA IRIS assessment process is a rigorous seven-step process that includes development of a draft assessment, agency and interagency review, public and peer-review, and then agency and interagency review before finalization.
33

Summary of Public Health Implications Evaluation
We must deal with several limitations and uncertainties when evaluating human health
implications from PFAS exposures in drinking water (see below). Because of these limitations
and until better methods are developed, ATSDR used a conservative approach to evaluate the
possibility for harmful health effects for noncancerous exposures. ATSDR’s approach
considering multiple exposures and factors. These included consideration of past body burdens,
length of exposure, multiple PFAS in the water, contributions from other non-water sources,
and similarity of health effects for various PFAS, all sources or factors that could contribute to
overall health effects of PFAS exposures. Even assuming a 100% contribution from drinking
water, PFOA, PFOS, and PFHxS exposures were mostly below health effect levels reported in
the scientific literature. Nonetheless, many of the estimated doses were well above ATSDR’s
provisional MRLs, indicating a potential for concern, especially for PFOS.
ATSDR evaluated the risk from drinking water with levels of PFOS, PFOA, and PFHxS above
ATSDR’s provisional MRLs before the Haven well was shut down on May 12, 2014, in
combination with other PFAS found in the Pease Tradeport PWS and other nondrinking water
sources. ATSDR concluded that drinking that water could have increased the possibility of
harmful non-cancer health effects in adults and particularly for young children (especially for
developmental and immune effects). Harmful non-cancer effects were likely greater for young
children who attended the childcare or were born to mothers who worked at the Pease
International Tradeport. Except for PFOA, PFOS, PFHxS, and PFNA, well-accepted scientific
methods to calculate the possible health effects of the combined exposures to PFAS
compounds (the mixture) have not been developed. The combined exposures to the mixture of
PFOS, PFOA, PFHxS and PFNA9, before the Haven well was closed, may have increased the risk
of developmental and immune effects beyond what might be expected from exposure to any
one of these PFAS alone. However, several other PFAS adversely affect the same general organ
systems. Therefore, the combined exposures to PFAS compounds from the Pease Tradeport
PWS might have increased the risk for some non-cancer health outcomes.
Since June 2014, no PFAS were detected above available HBCVs in water samples from the two
childcare centers served by the Pease Tradeport PWS. Sampling data from other points in the
water distribution system showed that only PFOS was detected slightly above ATSDR’s HBCV at
a maximum value of 0.016 µg/L. None of the estimated exposures doses for PFOS exposures
since June 2014 were above an HQ of 1.0 indicating that harmful exposures to PFOS alone are
not expected. ATSDR used a similar approach as above to evaluate the cumulative exposure to
9 PFNA was below ATSDR’s HBCV so further evaluation of individual exposures to this PFAS are not indicated. However, PFNA was included as part of the mixture evaluation from exposure to all four PFAS with ATSDR MRLs.
34
PFAS for exposures since June 2014. Only the HI for children infants (for the RME scenario) was
above 1.0 (1.17). Given that the HI is only slightly above 1.0, that it represents conservative
assumptions (i.e., using the maximum concentration from one sample to represent longer-term
intermediate and chronic exposures), and that none of the PFOA, PFOS, PFHxS, and PFNA levels
were above HBCVs for the childcare exposures, it is unlikely that the combined exposures to
these four PFAS would result in a higher risk of harmful effects than what was predicted by
exposures to each alone. We lack refined methods to evaluate the combined exposures to
other PFAS without HBCVs detected in the Pease Tradeport PWS since June 2014. However, all
the maximum levels were either not detected or, if present, were only detected in low ppt
levels and below ATSDR’s most conservative HBCV. Moreover, most of the PFAS detected with
no ATSDR MRLs were short-chain and non-sulfonated indicating that they may bioaccumulate
less than the longer-chain and sulfonated PFAS. However, health effects of many short-chained
PFAS and new PFAS alternatives have not been fully researched.
Additional supporting information leading to this conclusion includes the following:
• Scientific information suggests an association between PFOA, PFOS, and PFHxS exposure
and various health effects on serum lipids (not PFHxS), immune responses,
development, endocrine (thyroid), and the liver.
• A review of the scientific literature indicated that newborns and children are more
sensitive to PFAS exposures. In addition, people with certain pre-existing health
conditions (risk factors), such as elevated cholesterol or elevated blood pressure, and
those with compromised livers or who are immunocompromised might be unusually
susceptible to PFAS exposures.
• Other sources of exposure (background contributions and body burden) to users of the
Pease Tradeport PWS could increase the risk of harmful effects beyond the risk from the
drinking water exposures alone. Because of this, ATSDR considered possible
contributions from other sources, such as food and PFAS-treated furnishings.
• Effects from exposure to PFHxA, PFHpA, and PFPeA could not be determined with
certainty because the information on health effects of exposure to these PFAS
compounds is very limited. Moreover, most of the PFAS detected with no ATSDR MRLs
were short-chain and non-sulfonated indicating that they may bioaccumulate less than
the longer-chain and sulfonated PFAS. However, health effects of many short-chained
PFAS and new PFAS alternatives have not been fully evaluated.
• Results from New Hampshire’s Biomonitoring Program show that the levels of PFOA,
PFOS, and PFHxS in persons who drank water from the Pease Tradeport PWS were
35
significantly higher than national levels reported in the 2011–2012 and 2013–2014 CDC
NHANES reports.
• Epidemiologic data suggest a link between PFOA exposure and elevated rates of kidney,
prostate, and testicular cancer. Animals given PFOA have shown higher rates of liver,
testicular, and pancreatic tumors. A causal link based on human studies between cancer
and PFOS exposures remains uncertain. Animal studies have found limited, but
suggestive evidence of PFOS exposure and increased incidence of liver, thyroid, and
mammary tumors. The EPA has developed an oral cancer slope factor (CSF) for PFOA
based on testicular cancer from a rat study to evaluate the cancer risk. If the CSF
approximates the actual cancer risk for PFOA, then the estimated cancer risk level is
considered a very low risk. This estimated cancer risk must be viewed with caution
because the EPA CSF has not been fully adopted and other cancers that were elevated in
epidemiological studies of PFOA exposure were not evaluated. EPA does not have a CSF
for PFOS or other PFAS. Therefore, ATSDR cannot calculate the estimated cancer risk
from PFOS or other potentially carcinogenic PFAS exposures and the actual cancer risk
from all cancer-causing PFAS exposures from the Pease PWS is uncertain.
Community Concern: Breastfeeding Exposures and Health Implications
Community members, especially mothers who were exposed to PFAS from the Pease
International Tradeport site, have expressed concerns about the health implications of PFAS
exposure to infants who breastfeed. Developmental effects are the most sensitive adverse
health effect resulting from any early life exposure. Studies have shown PFAS to transfer to
nursing infants. Such exposures might occur through the mother to the fetus (maternal
transfer) during pregnancy, or to the infant during breastfeeding. Studies that measured PFAS
in maternal blood and breast milk in matched mother-infant pairs found highly variable
correlations [ATSDR 2018a]. Over time, PFAS levels in women decrease through breastfeeding.
Comparisons of serum concentrations of women who breastfed their infants with those who
did not showed that breastfeeding significantly decreases maternal serum concentrations of
PFAS [Mogensen et al. 2015]. The decrease was estimated to be 2% to 3% per month of
breastfeeding. Concentrations of PFAS in breast milk also decrease with breastfeeding duration
[ATSDR 2018a].
Breastfeeding provides many health and nutritional benefits to a child; such as, a reduced risk
of ear and respiratory infections, asthma, obesity, and sudden infant death syndrome (SIDS). In
addition, breastfeeding can also help lower a mother’s risk of high blood pressure, type 2
diabetes, and ovarian and breast cancer [CDC, 2019].
36

In general, CDC and the American Academy of Pediatrics recommend breastfeeding, despite the
presence of chemical toxicants [CDC 2015a; AAP, 2012]. A woman’s decision to breastfeed is a
personal choice, made in consultation with her healthcare provider. It is a choice made after
consideration of many different factors, many unrelated to PFAS exposure, specific to the
mother and child. ATSDR has developed information to guide doctors and aid in this decision-
making process (See
https://www.atsdr.cdc.gov/pfas/docs/ATSDR_PFAS_ClinicalGuidance_12202019.pdf).
Moreover, women who plan on breastfeeding should attempt to reduce potential exposures to
toxic substances as much as possible.
Limitations and Uncertainties of Human Health Risks from PFAS Exposures
Several limitations and uncertainties affect efforts to evaluate human health risks from PFAS
exposures in drinking water. These are discussed in detail below.
Multiple Exposure Sources
In addition to drinking water exposures, community members likely have exposures to PFAS
from other sources. These could include food, dust, air, and consumer products. Exposures
might also occur when people touch surfaces treated with a stain protector then touch their
mouths or food. All sources add to the amount of chemicals in the body and potential health
effects.
Lack of Historical Exposure Data
We do not know exactly how long people drank the water, how much they drank, or the precise
PFAS concentrations workers and children were exposed to in Pease Tradeport PWS drinking
water. Historical sampling data are unavailable. Exposures might have occurred for years
because of PFAS movement in groundwater. PFAS compounds accumulate and remain in the
body for years before elimination. Past and current exposures contribute to the overall health
risks from PFAS. It is uncertain whether reducing the frequency of exposure by about 30%
might underestimate the exposures. ATSDR used this approach because workers and childcare
attendees did not spend as much time at Pease International Tradeport as at their homes.
ATSDR typically uses this type of the adjustment factor used for such a scenario. These
assumptions match typical workplace and childcare attendance frequencies. Additional
uncertainties relate to the usage of 2014 data to estimate exposure before 2014, including
1993 when the Tradeport opened.
37

Inadequate Methods to Fully Assess Human Health Implications
Methods are available to evaluate the public health implications of exposure to PFOA, PFOS,
PFHxS, and PFNA (all PFAS with ATSDR-derived provisional MRLs. People who use the municipal
water are potentially exposed to a mixture of PFAS compounds. Methods used to assess
exposure to other environmental mixtures have not been developed for PFAS or might be
appropriate only for PFOA, PFOS, PFHxS, and PFNA. ATSDR added hazard quotients to get a
hazard index which is often used to assess risk to multiple chemicals. However, this approach
may not provide an appropriate solution for all PFAS. Only compounds with similar toxicological
endpoints should be combined (i.e., PFOS, PFOA, PFHxS, and PFNA). Moreover, standard risk
assessment methods have limitations. Only six of the 17 different PFAS detected in the Pease
Tradeport PWS have HBCVs to support a public health evaluation. ATSDR has HBCVs only for
PFOS, PFOA, PFHxS, and PFNA. ATSDR has not formally reviewed the Minnesota values for PFBS
and PFBA that are used in this document. ATSDR has included those values for perspective (to
show that the levels are much below an HBCV). Since ATSDR did not verify those values, they
will therefore not be included in the mixture analyses.
Other General Limitations
Humans and experimental animals differ in how their bodies absorb and react to PFAS. This
leaves questions about how relevant effects in animals are to humans. ATSDR also has limited
toxicity data for many PFAS compounds from human and animal studies [Butenhoff and
Rodricks 2015]. The health consequences of PFAS in the body are uncertain. Significant
uncertainty remains about the lowest concentration at which toxic effects might occur in
people exposed to PFAS for many years. Therefore, people exposed for many years could be at
increased health risk.
ATSDR calculated the HBCVs for PFOS, PFOA, PFHxS, and PFNA in drinking water using the best
available scientific information. The HBCVs allow us to assess the potential risk from drinking
water exposures. ATSDR bases the HBCVs and provisional MRLs on the most current PFAS
science; however, overall scientific knowledge on PFAS is still evolving. Toxicity information for
other PFAS compounds is limited.
Incomplete information on the type of AFFF used at the former Pease AFB and specific PFAS
formulations
One of the challenges to evaluating exposures from an AFFF source is that we do not know all
of the PFAS constituents and that these constituents have changed over time. Data on AFFF-
38
impacted groundwater indicate that about 25 percent of the PFAS species remain unidentified
[Houtz et al. 2013]. A study by Barzen-Hanson et al (2017) resulted in the discovery of 40 novel
classes of PFAS and the detection of 17 classes of previously reported PFAS, adding over 240
individual PFAS to the previous list that can now be associated with AFFF. Little is known about
the newly discovered PFAS regarding the subsurface remediation strategies, transport, and
toxicity [Brazen-Hanson et al. 2017].
Because of these limitations, ATSDR used a conservative approach to evaluate health risks for
noncancerous exposures until better methods are developed. ATSDR evidence on exposures
and other factors for the evaluations. For noncancerous health effects, we calculated hazard
quotients for PFOS, PFOA, PFHxS, and PFNA, the most thoroughly investigated PFAS
compounds. If the hazard quotient exceeded one, we considered a potential exposure to be of
concern. In evaluating health risks, we also considered other source contributions, other PFAS
compounds in the mixture, and past exposures. We reviewed the available literature for likely
health consequences from these exposures.
39

Conclusions
ATSDR evaluated the public health implications of past and current PFAS exposure to the
users of public water near the Pease Tradeport and reached three conclusions. These
conclusions are limited by several uncertainties. The specific PFAS formulation in the AFFF
used at the former Pease AFB is not known. ATSDR used a conservative approach to evaluate
concentrations of 23 PFAS in drinking water wells. However, there may be PFAS in the water
that were not measured. ATSDR’s conclusions are based on evaluation of the PFAS that were
measured in the water.
ATSDR develops health-based comparison values (HBCVs) using available scientific findings
about exposure levels and health effects. The HBCVs reflect an estimated contaminant
concentration for a given chemical that is expected to cause no adverse health effects,
assuming a standard daily water intake rate and body weight. To be conservative and
protective of public health, HBCVs are generally based on contaminant concentrations many
times lower than levels at which animal or human studies found no observable effects. ATSDR
uses HBCVs in this health consultation to screen PFAS contaminant concentrations to
determine if a further in-depth evaluation is needed which includes calculating an exposure
dose and comparing these doses to ATSDR provisional minimal risk levels or MRLs.
1. Drinking water exposures from the Pease Tradeport PWS from 1993 to May 2014, before
the Haven Well was shut down, could have increased the risk for non-cancer harmful health
effects to Pease International Tradeport workers and children attending the childcare
centers. Other sources of PFAS exposure (e.g., from food and consumer products) to users of
the Pease Tradeport PWS could increase the risk of harmful effects beyond the risk from the
drinking water exposures alone. The cancer risk from past exposure to all PFAS in the Pease
Tradeport PWS is uncertain.
The estimated exposures for PFOA, PFOS, and perfluorohexane sulfonic acid (PFHxS) from
consuming the water were mostly below effect levels found in animal studies but were well
above their respective ATSDR provisional minimal risk levels (MRL), indicating a potential for
concern, especially for developmental and immune effects for exposure to PFOS. Scientific
information suggests an association between PFOA, PFOS, and PFHxS exposure and various
health endpoints, including effects on serum lipids (not for PFHxS), immune responses,
development, endocrine (thyroid), and the liver. The combined exposures to a mixture of PFOS,
PFOA, PFHxS, and perfluorononanoic acid (PFNA) could have increased the risk for
developmental and immune effects above what might be expected from exposure to any of
these PFAS alone. For other PFAS associations and health endpoints, however, the scientific
information is far less certain. Food, consumer products, and mixtures of PFAS in the drinking
40
water are all possible contributors to a person’s overall PFAS exposure and body burden.
Testing of exposed persons from the Pease Tradeport PWS by the NH DHHS indicate that PFOA,
PFOS, and PFHxS blood levels are elevated as compared to national averages. Some pre-existing
risk factors could increase the risk of harmful effects (see the Public Health Implications Section
for details).
Epidemiologic data suggest a link between PFOA exposure and elevated rates of kidney,
prostate, and testicular cancer. However, additional studies are needed to confirm the link
between PFOA and other PFAS exposures and cancer to say they are the cause. Animals given
PFOA have shown higher rates of liver, testicular, and pancreatic tumors. A causal link based on
human studies between cancer and PFOS exposures remains uncertain. Animal studies have
found limited, but suggestive evidence of PFOS exposure and increased incidence of liver,
thyroid, and mammary tumors. Although current data are very limited, other PFAS may be
carcinogenic while some may not.
The EPA has developed an oral cancer slope factor (CSF) for PFOA based on testicular cancer
from a rat study to evaluate the cancer risk. Based on these assumptions and assuming that the
EPA CSF on testicular cancer from a rat study approximates the actual cancer risk for PFOA,
then the estimated adult cancer risk from exposure to the maximum detected PFOA
concentration in the public water supply system is 1.3 x 10⁻⁷. This means that if 10 million
people were similarly exposed, we might see an additional two cases of cancer. Please note this
this is a theoretical risk that is used by ATSDR as a tool for deciding whether public health
actions are needed to protect health—it is not an actual estimate of cancer cases in a
community. If the CSF approximates the actual cancer risk for PFOA, then the estimated cancer
risk level is considered a very low risk. This estimated cancer risk must be viewed with caution
because the EPA CSF has not been fully adopted and other cancers that were elevated in
epidemiological studies of PFOA exposure were not evaluated. EPA does not have a CSF for
PFOS or other PFAS. Therefore, ATSDR cannot calculate the estimated cancer risk from PFOS or
other potentially carcinogenic PFAS exposures and the actual cancer risk from all exposures to
cancer-causing PFAS that may be cancer-causing from the Pease PWS is uncertain.
2. Consuming water containing low levels of PFAS from the Pe ase Tradeport PWS since June 2014 is not expected to cause harm to the public.
Except for two samples where PFOS was detected slightly above the ATSDR HBCV, data indicate
that exposures were less than or equal to the ATSDR HBCVs, thereby indicating that no harmful
effects are expected. In addition, exposures to children at the two childcare facilities were all
below ATSDR HBCVs. Exposures to PFOS in the Pease Tradeport PWS since June 2014 are not
41

above ATSDR provisional MRLs, thereby indicating that harmful non-cancer effects are unlikely.
Further evaluation of the exposure to the mixture of PFOS, PFOA, PFHxS, and PFNA indicates
that the risk for harmful developmental or immune effects is not likely to be more than what
might be expected from exposure to any of these PFAS alone. Other PFAS were either below
their HBCVs, maximally detected at low levels (single ppt) and below ATSDR’s most
conservative HBCV, or not detected.
3. Based on available scientific information, ATSDR concludes that the health and nutritional
benefits of breastfeeding outweigh the risks associated with PFAS in breast milk.
Community members, particularly mothers who have historically been exposed to PFAS from
the Pease PWS, have expressed concern over the health implications of PFAS exposures to
infants who breastfed. Developmental effects are the most sensitive adverse health effects
resulting from early life exposure to some PFAS. Studies have shown infants are exposed during
pregnancy, through the mother to the fetus (maternal transfer) and occur to the nursing infant
during breastfeeding. However, breastfeeding provides clear health and nutritional benefits,
including protection from some illnesses and infections and reductions in the risks of
developing asthma and sudden infant death syndrome. In general, the Centers for Disease
Control and Prevention recommends breastfeeding, despite the presence of chemicals in breast
milk. Given what we know about PFAS exposure, the benefits of breastfeeding outweigh any
risks. However, the science on the health effects of PFAS exposure on mothers and children
continues to expand. A woman’s decision to breastfeed is an individual choice, made after
consideration of many different factors (many unrelated to PFAS exposure) and in consultation
with her healthcare providers. Information developed by ATSDR to guide doctors (see
https://www.atsdr.cdc.gov/pfas/docs/ATSDR_PFAS_ClinicalGuidance_12202019.pdf) can aid
in this decision-making process.
Recommendations
ATSDR recommends that EPA, NHDES, and the USAF continue their investigations to
characterize PFAS groundwater contamination at the site and continue their periodic
monitoring of the Pease Tradeport PWS for PFAS concentration trends. In addition, the USAF
should consider prioritizing their efforts and research into better understanding the types and
the formulations of AFFF used at Pease and other facilities to better inform future monitoring
efforts and health evaluations.
While the Pease Tradeport PWS treatment system is operating and being adjusted to provide
the maximum temporary removal of PFAS. The EPA issued Administrative Order SDWA-01-
42
2015-016 to the Air Force in August 2018 which required the Air Force to treat the Haven Well
and the effected aquifer at the former Pease Air Base. Subsequently, actions have been taken
by the Air Force to implement the order.
The treatment system being added to the Pease Tradeport PWS will help protect consumers of
the drinking water. Operation of this treatment system will reduce exposure to PFAS
contaminants. Treated water should continue to be sampled. The treatment system should be
adjusted, as necessary, to prevent exposure above EPA or other applicable health-based
drinking water guidelines and reduce exposures to PFAS compounds that have no HBCVs. As a
prudent public health measure, ATSDR recommends that persons who have had long-term
exposures to PFAS should be aware of ways to reduce exposures (see information available
from https://www.atsdr.cdc.gov/pfas/pfas-exposure.html on ways to reduce exposures to all
sources of PFAS).
Breastfeeding provides clear health and nutritional benefits to infants. These include protection
from some illnesses and infections, and reductions in the risks for developing asthma and
sudden infant death syndrome. In general, CDC recommends breastfeeding despite the
presence of chemical toxins in breast milk. From what we know, the benefits of breastfeeding
outweigh risk. However, the science on the health effects of PFAS exposure to mothers and
children continues to grow. A woman’s decision to breastfeed must be an individual choice —
one that is made after consideration of many different factors, many unrelated to PFAS
exposure, specific to the mother and the child. Information developed by ATSDR to guide
doctors (see
https://www.atsdr.cdc.gov/pfas/docs/ATSDR_PFAS_ClinicalGuidance_12202019.pdf) can aid
in this decision-making process. Moreover, women who plan on breastfeeding should attempt
to reduce potential exposures to toxic substances as much as possible.
We recommend that health education information related to PFAS in drinking water continue
to be developed and provided to affected residents, community members, and health
professionals in the site area.
43

Public Health Action Plan
Completed Actions
The Haven well, the one well with PFAS detected above HBCVs, was shut down. Water from the
City of Portsmouth PWS has replaced some of the water volume lost by the Haven well
shutdown.
The USAF, City of Portsmouth, and Pease Development Authority signed an Environmental
Services Cooperative Agreement for the design and construction of a water treatment system
as a short-term remedy to reduce exposure to PFAS in the Pease Tradeport PWS. The treatment
system for the Harrison and Smith wells began operation on September 23, 2016. New well
locations to replace the Haven well have been investigated and tested.
The NH DHHS developed a document that provides health information about PFAS, titled
Frequently Asked Questions: Perfluorochemicals (PFCs) in the Pease International Tradeport
Water System. This document can be found on the NH DHHS “Investigation into Contaminant
Found in Pease Tradeport Water System” webpage at
http://www.dhhs.nh.gov/dphs/investigation-pease.htm.
NH DHHS offered blood testing (biomonitoring) for people who were exposed to PFAS in the
drinking water at the Pease International Tradeport. NH DHHS sent results to people as it
received those from the laboratories. NH DHHS summarized the biomonitoring results in its
report and presented that information to the public in a June 16, 2016 meeting.
In November 2017, ATSDR released a feasibility assessment for conducting a study to evaluate
potential health effects of the population exposed to PFAS at the Pease International
Tradeport. The report is available on the ATSDR website,
https://www.atsdr.cdc.gov/sites/pease/documents/ Pease_Feasibility_Assessment_November-
2017_508.pdf.
In June 2018, ATSDR released a draft for public comment Toxicological Profile for
Perfluoroalkyls. This report contains information on the derivation of provisional MRLs used in
this health consultation to evaluate exposures to PFOA, PFOS, PFHxS, and PFNA.
In April 2019 after the release of this health consultation for public comment, ATSDR
representatives met with officials from the city of Portsmouth and town of Newington to
discuss the findings of this Health Consultation. Additionally, ATSDR conducted a 12-hour
44
availability session (at the Great Bay community College) for residents, workers, and others to
drop by and ask questions about our report.
Ongoing Actions
PFAS levels in the Pease Tradeport PWS are being monitored periodically by sampling the
Harrison well, Smith well, and selected distribution points of the Pease Tradeport PWS.
PFAS levels in the treated water are being sampled regularly, and the treatment system will be
adjusted as necessary to provide the most effective removal of PFAS contaminants.
PFAS levels in area groundwater and potential migration of PFAS toward operating Pease
Tradeport and Portsmouth PWS wells are being periodically monitored by sampling sentry
monitoring wells.
The USAF is investigating potential PFAS contaminant source area and PFAS migration pathways
at the former Pease Air Force Base to determine the most effective groundwater contaminant
containment and mitigation strategies.
ATSDR and the Centers for Disease Control and Prevention (CDC) are conducting a health study
of children and adults exposed to PFAS-contaminated drinking water at the Pease International
Tradeport and from nearby private wells. The study will evaluate associations between PFAS
blood levels and signs of changes in the body (e.g., cholesterol levels, kidney and thyroid
function, and the development of specific diseases), and will serve as the first site in
CDC/ATSDR’s Multi-site Health Study looking at the relationship between PFAS drinking water
exposures and health outcomes. Sites in seven additional states will also participate in the
Multi-site Health Study.
ATSDR and CDC are working to address the concerns of community members regarding
potential associations between PFAS exposure and cancer. We are conducting an analysis that
uses previously collected data to look at rates of certain health outcomes, including many adult
and pediatric cancers, in communities that have been exposed to PFAS through drinking water
and those that have not.
ATSDR and CDC are conducting exposure assessments in communities near current and former
military bases and that are known to have had PFAS in their drinking water. The exposures
assessments will provide information to communities about the levels of PFAS in their bodies.
45

Using this information, public health professionals provide guidance to help people reduce or
stop exposure.
ATSDR is also providing technical assistance to tribal, state, and territorial health departments
nationwide so they can effectively evaluate PFAS exposure in contaminated communities.
ATSDR recognizes that additional information is needed about the types of PFAS in AFFF and
the type of AFFF used at Pease. Standard laboratory methods capable of detecting a broader
range of PFAS in environmental samples are also needed. As more information becomes
available, ATSDR will incorporate it into future assessments of exposure to PFAS from sites
associated with the use of AFFF.
46

Preparers of the Report
Gregory V. Ulirsch, MS, PhD Branch Associate Director for Science Eastern Branch, DCHI
CAPT Gary D. Perlman, MPH, REHS/RS, DAAS Environmental Health Scientist Eastern Branch, DCHI
47

References
[AAP] American Academy of Pediatrics. 2012. Policy Statement: Breastfeeding and the Use of Human Milk. Pediatrics 129 (3); e827-e841.
Alexander BH, Olsen GW, Burris JM, Mandel JH, Mandel JS. 2003. Mortality of employees of a perfluorooctanesulphonyl fluoride manufacturing facility. Occup Environ Med 60:722–729.
Alexander BH, Olsen GW. 2007. Bladder cancer in perfluorooctanesulfonyl fluoride
manufacturing workers. Ann Epidemiol 17:471-478.
[AMEC] AMEC Environment & Infrastructure, Inc. 2014. Draft Private Well Inventory and
Perfluorinated Compound Sampling Report. Former Pease Air Force Base, Portsmouth, New
Hampshire Project No. SZDT20147242. Portland, ME: AMEC Environment & Infrastructure, Inc.
[AMECFW] Amec Foster Wheeler Environment & Infrastructure, Inc. 2015. Final perfluorinated
compounds preliminary assessment, former Pease Air Force Base, Portsmouth, New
Hampshire. Task Order 0177. Portland, ME: Amec Foster Wheeler Environment &
Infrastructure, Inc.
[AMECFW] Amec Foster Wheeler Environment & Infrastructure, Inc. 2016. Perfluorinated
compounds (PFCs) release response Pease Aquifer Southern Well Field Sentry Monitoring
Plan. Portland, ME: Amec Foster Wheeler Environment & Infrastructure, Inc.
[AMECFW] Amec Foster Wheeler Environment & Infrastructure, Inc. 2017. Perfluorinated
compounds release response base-wide site investigation report, Former Pease Air Force Base,
June. Portland, ME: Amec Foster Wheeler Environment & Infrastructure, Inc.
[ATSDR] Agency for Toxic Substances and Disease Registry. 1999. Public health assessment for
Pease Air Force Base Portsmouth, Rockingham, New Hampshire CERCLIS No. NH7570024847.
Atlanta, GA: Agency for Toxic Substances and Disease Registry.
[ATSDR] Agency for Toxic Substances and Disease Registry. 2015. ToxFAQs for perfluoroalkyls.
Atlanta, GA [updated: 2017 March 31; Accessed 2015 August]. Available from:
http://www.atsdr.cdc.gov/toxfaqs/tf.asp?id=1116&tid=237.
[ATSDR] Agency for Toxic Substances and Disease Registry. 2016a. Exposure dose guidance for
determining life expectancy and exposure factor. Atlanta, GA: U.S. Department of Health and
Human Services, Public Health Service. 48
All website links in this Health Consultation were tested and accessed on the date indicated. Websites may undergo changes that cause one or more links to no longer work. The web address are provided for archival purposes (especially for those links that may no longer work).
[ATSDR] Agency for Toxic Substances and Disease Registry. 2016b. Exposure dose guidance for
water ingestion, Version 2. Atlanta, GA: U.S. Department of Health and Human Services, Public
Health Service.
[ATSDR] Agency for Toxic Substances and Disease Registry. 2018a. Toxicological profile for
Perfluoroalkyls. (Draft for Public Comment). Atlanta, GA: U.S. Department of Health and Human
Services, Public Health Service. [updated 2018 June; accessed 2018 July 9] Available from:
http://www.atsdr.cdc.gov/toxprofiles/tp.asp?id=1117&tid=237.
[ATSDR] Agency for Toxic Substances and Disease Registry. 2018b. Minimal Risk Levels (MRLs) – For Professionals. Atlanta, GA: U.S. Department of Health and Human Services, Public Health
Service. [updated 2018 June 21; accessed 2018 November 15] Available from:
https://www.atsdr.cdc.gov/mrls/index.asp.
[ATSDR] Agency for Toxic Substances and Disease Registry. 2018c. Per- and Polyfluoroalkyl
Substances (PFAS) and Your Health. Atlanta, GA: U.S. Department of Health and Human
Services, Public Health Service. [updated 2018 June 21; accessed 2018 November 19] Available
from: https://www.atsdr.cdc.gov/pfas/index.html.
[ATSDR] Agency for Toxic Substances and Disease Registry. 2019. An Overview of the Science
and Guidance for Clinicians on Per- and Polyfluoroalkyl Substances (PFAS) [updated 2019
December 6; accessed 2020, January 3]. Available from:
https://www.atsdr.cdc.gov/pfas/docs/ATSDR_PFAS_ClinicalGuidance_12202019.pdf.
Barzen-Hanson, K.A; Roberts, S.C.; Choyke, S.; Oetjen, K.; McAlees, A; Riddell, N; McCrindle, R;
Ferguson, P.L.; Higgins, C.P.; and, Field, J.A. Discovery of 40 Classes of Per- and Polyfluoroalkyl
Substances in Historical Aqueous Film-Forming Foams (AFFFs) and AFFF-Impacted
Groundwater. Environ. Sci. Technol. 2017, 51(4), 2047−2057.
Butenhoff JL, Chang S, Ehresman DJ, York RG. 2009. Evaluation of potential reproductive and
developmental toxicity of potassium perfluorohexanesulfonate in Sprague Dawley rats. Reprod
Toxicol 27(3–4):331–41.
Butenhoff JL, Chang SC, Olsen GW, Thomford PJ. 2012. Chronic dietary toxicity and
carcinogenicity study with potassium perfluorooctanesulfonate in Sprague Dawley rats.
Toxicology 293(1–3):1–15.
49

Butenhoff JL, Rodricks JV. 2015. “Human Health Risk Assessment of Perfluoroalkyl Acids,” in
Toxicological Effects of Perfluoroalkyl and Polyfluoroalkyl Substances (Jamie C. DeWitt, editor)
Cham, Switzerland: Humana Press (Springer International Publishing), Chapter 15, pp 363-418.
Carr CK, Watkins AM, Wolf CJ, et al. 2013. Testing for departures from additivity in mixtures of
perfluoroalkyl acids (PFAAs). Toxicology 306:169-175. 10.1016/j.tox.2013.02.016.
[CB&I] CB&I Federal Services LLC. 2014. Draft perfluorinated compound investigation work
plan. Site 8, AT008, Fire Department Training Area 2, Former Pease Air Force Base, Portsmouth,
New Hampshire. Schenectady, NY [updated 2014 October; accessed 2015 August]. Available
from: http://www2.des.state.nh.us/DESOnestop/BasicList.aspx.
[CB&I] CB&I Federal Services LLC. 2015. Final perfluorinated compound investigation work plan
Site 8, AT008, Fire Department Training Area 2, Former Pease Air Force Base, Portsmouth, New
Hampshire. Contract No. FA8903-09-D-8580, Task Order No. 0010, Project No. 143279, Revision
0. April. Schenectady, NY: CB&I Federal Services LLC.
[CDC] Centers for Disease Control and Prevention. 2013. Fourth national report on human exposure to environmental chemicals. Updated tables, September 2013. Atlanta, GA: U.S. Department of Health and Human Services, Centers for Disease Control and Prevention and Prevention.
[CDC] Centers for Disease Control and Prevention. 2010. Exposure to environmental toxins.
[updated 2010 April 21; accessed 2017 May 16]. Available from:
http://www.cdc.gov/breastfeeding/disease/environmental_toxins.htm.
[CDC] Centers for Disease Control and Prevention. 2018. U.S. Centers for Disease Control and Prevention and Prevention, National Health and Nutrition Examination Survey. [updated 2018 July 31; accessed 2018 August 16]. Available from: http://www.cdc.gov/nchs/nhanes.htm.
CH2M Hill. 1984. Installation restoration program records search for Pease Air Force Base, New
Hampshire, January.
City of Portsmouth. 2014 Pease well monitoring and sampling results, Pease Well, April, May
2014 PFC results. [accessed 2018 March 14]. Available from:http://files.cityofportsmouth.com/publicworks/PeaseWellPFCSamplingAprilandMay%202014.pdf.
50
City of Portsmouth. 2015a. Pease International Tradeport water system overview and history. [2015
July 27; accessed 2017 May 16]. Available from: http://www.cityofportsmouth.com
/publicworks/PeaseTradePortWaterSystemOverviewandHistory.pdf.
City of Portsmouth. 2015b. Portsmouth, Pease Development Authority, and the United States Air Force
reach agreement regarding Pease International Tradeport well treatments. [2015 November 17;
accessed 2017 May 16]. Available from: http://files.cityofportsmouth.com/ Press%
20release_2015AirForceAgreement.pdf.
City of Portsmouth. 2016a. Portsmouth signs agreement with Air Force to proceed with Pease
International Tradeport well treatment system project. [2016 April 8; accessed 2017 May 16]. Available
from: http://cityofportsmouth.com/press/PressRelease
_PortsmouthPeaseWellTreatmentAgreement.pdf.
City of Portsmouth. 2016b. Pease announces upgraded water filtration at Pease International
Tradeport. [2016 September 23; accessed 2017 May 16]. Available from:
http://cityofportsmouth.com/press/PressRelease_PeaseWaterFiltration.pdf.
City of Portsmouth. 2016c. Pease International Tradeport water supply update. [2016 December 6;
accessed 2017 May 16]. Available from:
http://www.cityofportsmouth.com/publicworks
/Pease%20Water%20Supply%20and%20PFC%20Demonstration%20Project%20Update%2012.0
6.16.pdf.
City of Portsmouth. 2017a. Pease International Tradeport water information — comprehensive PFC
sampling data. [2017 May; accessed 2017 July 19]. Available from: http://cityofportsmouth .com/
publicworks/Pease%20Comprehensive%20PFC%20Sampling%20Data%20May%202017. pdf.
City of Portsmouth. 2017b. Portsmouth Water System PFC sampling update. [updated 2017 November
7; accessed 2017 November 20]. Available from:
http://files.cityofportsmouth.com/files/ww/PortsmouthSupplySourcesPFASUpdateNovember7_2017.pdf.
City of Portsmouth. 2017c. Haven Well piloting of activated carbon and resin treatment systems
begins. [updated 2017 October; accessed 2018 August 6]. Available from:
https://www.cityofportsmouth.com/publicworks/water/pease-tradeport-water-systemf.
51

City of Portsmouth. 2018. Portsmouth Water System PFC sampling update. [updated 2018
January, accessed 2018 March 12]. Available from:
https://www.cityofportsmouth.com/publicworks/water/pease-tradeport-water-
system#wellmonitoring.
Das KP, Grey BE, Rosen MB, et al. 2015. Developmental toxicity of perfluorononanoic acid in
mice. Reprod Toxicol 51:133–44.
Dong GH, Liu MM, Wang D, et al. 2011. Sub-chronic effect of perfluorooctanesulfonate (PFOS)
on the balance of type 1 and type 2 cytokine in adult C57BL6 mice. Arch Toxicol 85(10):1235-
1244.
Emmett EA, Shofer FS, Zhang H, Freeman D, Desai C, Shaw LM. 2006. Community exposure to
perfluorooctanoate: relationships between serum concentrations and exposure sources. J
Occup Environ Med 48(8):759–70.
[EPA] U.S. Environmental Protection Agency. 2016a. Drinking water health advisory for
perfluorooctane sulfonate (PFOS). EPA Office of Water. EPA 822-R-16-004. May 2016. [updated
2017 April 14; accessed 2017 May 16]. Available from: https://www.epa.gov/ground-water-
and-drinking-water/drinking-water-health-advisories-pfoa-and-pfos.
[EPA] U.S. Environmental Protection Agency. 2016b. Drinking water health advisory for
perfluorooctanoic acid (PFOA). EPA Office of Water. EPA 822-R-16-005. May 2016. [updated
2017 April 14; accessed 2017 May 16]. Available from: https://www.epa.gov/ground-water-
and-drinking-water/drinking-water-health-advisories-pfoa-and-pfos.
[EPA] U.S. Environmental Protection Agency. 2017. Research on per- and polyfluoroalkyl
substances (PFAS). [updated 2017 June 28; accessed 2017 November 27]. Available from:
https://www.epa.gov/chemical-research/research-and-polyfluoroalkyl-substances-pfas.
[EPA] U.S. Environmental Protection Agency. 2018a. Drinking Water Health Advisories for PFOA
and PFOS. [updated 2018 July 9; accessed 2018 August 6]. Available from:
https://www.epa.gov/ground-water-and-drinking-water/drinking-water-health-advisories-pfoa-
and-pfos.
52

[EPA] U.S. Environmental Protection Agency. 2018b. Risk Management for Per- and
Polyfluoroalkyl Substances under TSCA. [updated 2018 July 20; accessed 2018 November 7].
Available from: https://www.epa.gov/assessing-and-managing-chemicals-under-tsca/risk-
management-and-polyfluoroalkyl-substances-pfass.
Fu Y, Wang T, Fu Q, Wang P, Lu Y. 2014. Associations between serum concentrations of
perfluoroalkyl acids and serum lipid levels in a Chinese population. Ecotoxicol Environ Saf
106:246–52.
Gleason JA, Post GB, and Fagliano JA. 2015. Associations of perfluorinated chemical serum
concentrations and biomarkers of liver function and uric acid in the US population (NHANES),
2007–2010. Environ Res 136:8–14.
Grandjean P, Andersen EW, Budtz-Jørgensen E, et al. 2012. Serum vaccine antibody
concentrations in children exposed to perfluorinated compounds. JAMA 307(4):391–7.
Grice MM, Alexander BH, Hoffbeck R, Kampa DM. Self-reported medical conditions in
perfluorooctanesulfonyl fluoride manufacturing workers. J Occup Environ Med 2007;49:722-
729.
Guruge KS, Hikono H, Shimada N, et al. 2009. Effect of perfluorooctane sulfonate (PFOS) on
influenza A virus-induced mortality in female B6C3F1 mice. J Toxicol Sci 34(6):687-691.
Harris MW, Birnbaum LS. 1989. Developmental toxicity of perfluorodecanoic acid in C57BL/6N
mice. Fundam Appl Toxicol 12:442–8.
[HHS] U.S. Department of Health and Human Services. 2011. The Surgeon General’s call to
action to support breastfeeding. Washington, DC: U.S. Department of Health and Human
Services, Office of the Surgeon General. [accessed 2017 May 16]. Available from: https://www
.surgeongeneral.gov/library/calls/breastfeeding/calltoactiontosupportbreastfeeding.pdf.
[HHS] U.S Department of Health and Human Services. National Toxicology Program (NTP). 2016.
National Toxicology Program Monograph on Immunotoxicity Associated with Exposure to PFOA
and PFOS. [accessed 2019 August 5]. Available from:
https://ntp.niehs.nih.gov/pubhealth/hat/noms/pfoa/index.html.
Hoberman AM, York RG. 2003. Oral (gavage) combined repeated dose toxicity study of T-7706
with the reproduction/developmental toxicity screening test. Argus Research.
53

Houtz, E. F.; Higgins, C. P.; Field, J. A.; Sedlak, D. L. Persistence of Perfluoroalkyl Acid Precursors
in AFFF-Impacted Groundwater and Soil. Environ. Sci. Technol. 2013, 47 (15), 8187−
8195.
Iwai H, Hoberman AM. 2014. Oral (gavage) combined developmental and perinatal/postnatal
reproduction toxicity study of ammonium salt of perfluorinated hexanoic acid in mice. Int J
Toxicol 33(3):219–37.
Klaunig JE, Shinohara M, Iwai H, et al. 2015. Evaluation of the chronic toxicity and
carcinogenicity of perfluorohexanoic acid (PFHxA) in Sprague-Dawley rats. Toxicol Pathol
43(2):209–20.
Koskela et al. 2016. Effects of developmental exposure to perfluorooctanoic acid (PFOA) on long bone morphology and bone cell differentiation. Toxicol Appl Pharmacol 301:14-21.
Luebker DJ, Case MT, York RG, Moore JA, Hansen KJ, Butenhoff JL. 2005. Two-generation
reproduction and cross-foster studies of perfluorooctanesulfonate (PFOS) in rats. Toxicology
215(1–2):129–48.
[MDH] Minnesota Department of Health. 2017a. Human health-based water guidance table.
[updated 2017 August 9; accessed 2017 October 27]. Available from:
http://www.health.state.mn.us/divs/eh/risk/guidance/gw/table.html#ns.
[MDH] Minnesota Department of Health. 2017b. Perfluorochemicals (PFCs). [updated 2017
June 29, accessed 2018 August 16]. Available from:
http://www.health.state.mn.us/divs/eh/hazardous/topics/pfcs/index.html#pfasandhealth.
[MDH] Minnesota Department of Health. 2017c. Perfluorochemicals (PFCs) and health.
[updated 2017 June 29, accessed 2017 November 20]. Available from:
http://www.health.state.mn.us/divs/eh/hazardous/topics /pfcshealth.html.
[MDH] Minnesota Department of Health. 2017d. PFBS and drinking water. [updated 2017
December, accessed 2018 March 13]. Available from:
http://www.health.state.mn.us/divs/eh/risk/guidance/gw/pfbsinfo.pdf.
[MDH] Minnesota Department of Health. 2017e. PFBA and drinking water. [updated 2017
August, accessed 2018 July 18]. Available from:
http://www.health.state.mn.us/divs/eh/risk/guidance/gw/pfbainfo.pdf.
54
Mogensen UB, Grandjean P, Flemming N, Weihe P, Budtz-Jørgensen E. 2015. Breastfeeding as
an exposure pathway for perfluorinated alkylates. Environ Sci Technol 49(17):10466–73.
[NASF] National Association of Surface Finishing. 2019. 6:2 Fluorotelomer Sulfonate (6:2 FTS),
Toxicology at a Glance. [accessed 2019 July 31]. Available from: https://nasf.org/wp-
content/uploads/2019/04/Summary-of-Toxicology-Studies-on-6-2-FTS-and-Detailed-Technical-
Support-Documents.pdf.
[NH DHHS] New Hampshire Department of Health and Human Services. 2015. New Hampshire
perfluorochemicals (PFCs) testing program. Concord, NH [updated 2016 June 1; accessed 2017
May 16]. Available from: http://www.dhhs.nh.gov/dphs/documents/expanded-pease-
protocol.pdf.
[NH DHHS] New Hampshire Department of Health and Human Services. 2016a. Frequently
asked questions (FAQs) regarding perfluorooctane sulfonic acid (PFOS) detected in Pease
International Tradeport water system. New Hampshire Department of Health and Human
Services. [updated 2016 February 3; accessed 2017 May 16]. Available from:
http://www.dhhs.nh.gov/dphs/documents/pease-water-faqs.pdf.
[NH DHHS] New Hampshire Department of Health and Human Services. 2016b. NH DHHS to
offer PFC blood testing to residents impacted by PFC contamination in drinking water. Concord,
NH [accessed 2018 April 11]. Available from: https://www.dhhs.nh.gov/media/pr/2016/pfc-
blood-tests-06152016.htm.
[NH DHHS] New Hampshire Department of Health and Human Services. 2016c. Pease PFC Blood
Testing Program: April 2015–October 2015. [updated 2016 June 16; accessed 2017 July 24].
Available from: https://www.dhhs.nh.gov/dphs/documents/pease-pfc-blood-testing.pdf.
[NH DHHS] New Hampshire Department of Health and Human Services. 2017a.
Perfluorochemicals (PFCs) Blood Testing Program — New Hampshire PFC Testing Program data:
July 15, 2016–June 13, 2017. [updated 2017 June 15; accessed 2017 July 24]. Available from:
https://www.dhhs.nh.gov/dphs/pfcs/blood-testing.htm.
[NH DHHS] New Hampshire Department of Health and Human Services. 2017b. Summary of
New Hampshire Department of Health and Human Services’ Perfluorochemical (PFC) Blood Testing Program, 2016-2017 [October 2017; accessed 2018 November 18]. Available from:
https://www.dhhs.nh.gov/dphs/pfcs/documents/results-summary.pdf.
55
NH DHHS] New Hampshire Department of Health and Human Services. 2017c. NH Health
WISDOM--Pease PFC Blood Testing Program (2016-2017) [Accessed 2018 November 19].
Available from:
https://wisdom.dhhs.nh.gov/wisdom/#Topic_0B0C477040084FF89D133B9854FD85BE_Anon.
[NIEHS] National Institute of Environmental Health Sciences. 2016. Perfluorinated chemicals
(PFCs). [updated 2016 July; accessed 2017 May 16]. Available from:
https://www.niehs.nih.gov/health/materials/perflourinated_chemicals_508.pdf.
[NRL] Naval Research Laboratory. 2015. Aqueous film-forming foam. [updated 2010 February 1;
accessed 2017 May 16]. Available from:
http://www.nrl.navy.mil/accomplishments/materials/aqueous-film-foam.
Olsen GW, Burlew MM, Marshall JC, Burris JM, Mandel JH. 2004. Analysis of episodes of care in
a perfluorooctanesulfonyl fluoride production facility. J Occup Environ Med 46:837-846.
Onishchenko et al. 2011. Prenatal exposure to PFOS or PFOA alters motor function in mice in a sex-related manner. Neurotox Res 19:452-461.
Pease Development Authority. 2017. Press kit. [updated 2017 October; accessed 2017
November 29]. Available from: http://www.peasedev.org/documents/PDAPressKit.pdf.
Portsmouth Planning Board, New Hampshire. 2003. "Proposed purchase of 497 Sherburne Road
to reactivate the Harrison well." [updated 2003 April 24; accessed 2018 March 12]. Available
from: http://files.cityofportsmouth.com/agendas/2003/planningboard/pb042403as.pdf.
Portsmouth [New Hampshire] Water Division. 2014. Annual water quality report, reporting year
2013. PWS ID#: 1951010, 1951020, 1661010. [accessed 9 March 2018]. Available from:
http://files.cityofportsmouth.com/publicworks/reports/2013WaterQualityReport.pdf.
Prevedouros K, Cousins IT, Buck RC, Korzeniowski SH. 2006. Sources, fate and transport of
perfluorocarboxylates. Environ Sci Technol 40(1):32–44.
Starling AP, Engel SM, Whitworth KW, et al. 2014. Perfluoroalkyl substances and lipid
concentrations in plasma during pregnancy among women in the Norwegian Mother and Child
Cohort Study. Environ Int 62:104–12.
56
Takahashi M, Ishida S, Hirata-Koizumi M, et al. 2014. Repeated dose and reproductive/
developmental toxicity of perfluoroundecanoic acid in rats. J Toxicol Sci 39(1):97–108.
Viberg H, Lee I, Eriksson P. 2013. Adult dose-dependent behavioral and cognitive disturbances
after a single neonatal PFHxS dose. Toxicology 304:185–91.
Wolf CJ, Rider CV, Lau C, et al. 2014. Evaluating the additivity of perfluoroalkyl acids in binary
combinations on peroxisome proliferator-activated receptor-alpha activation. Toxicology
316:43-54. 10.1016/j.tox.2013.12.002.
Zeng XW, Qian Z, Emo B, et al. 2015. The association between perfluoroalkyl chemicals and
serum lipid levels in children. Sci Total Environ 512–513:364–70.
57

Appendix A – Figures, Tables, and Equations
A-1
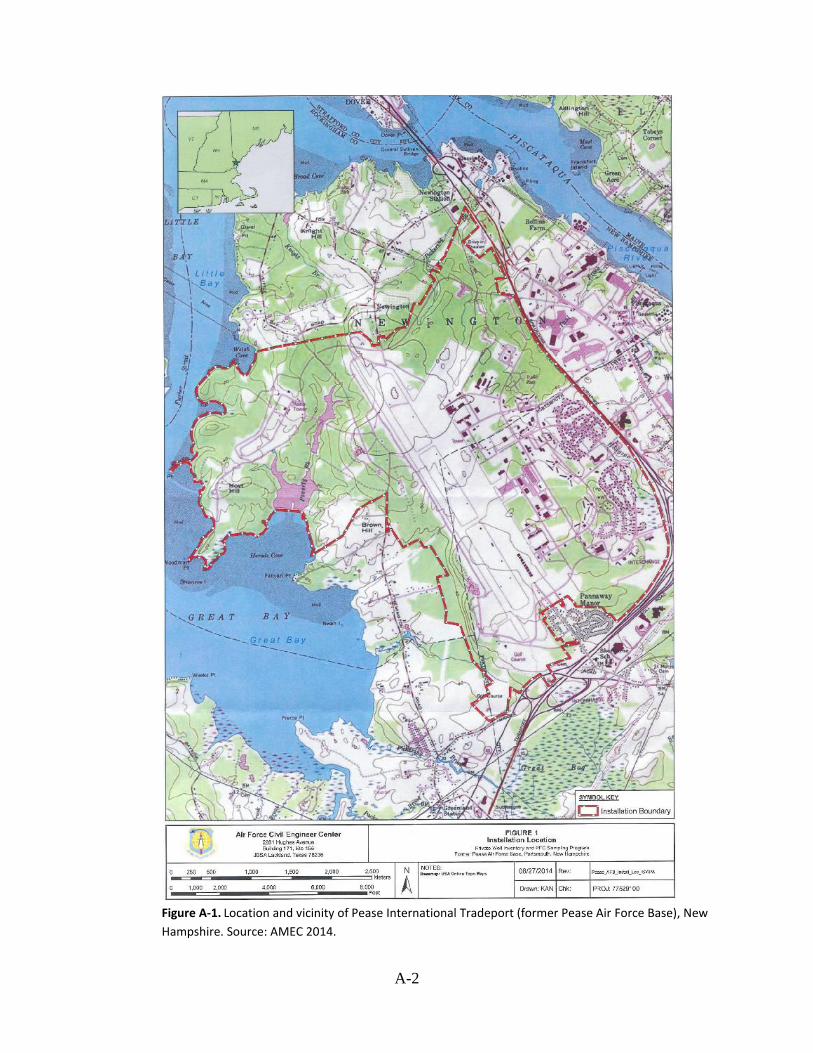
Figure A-1. Location and vicinity of Pease International Tradeport (former Pease Air Force Base), New
Hampshire. Source: AMEC 2014.
A-2
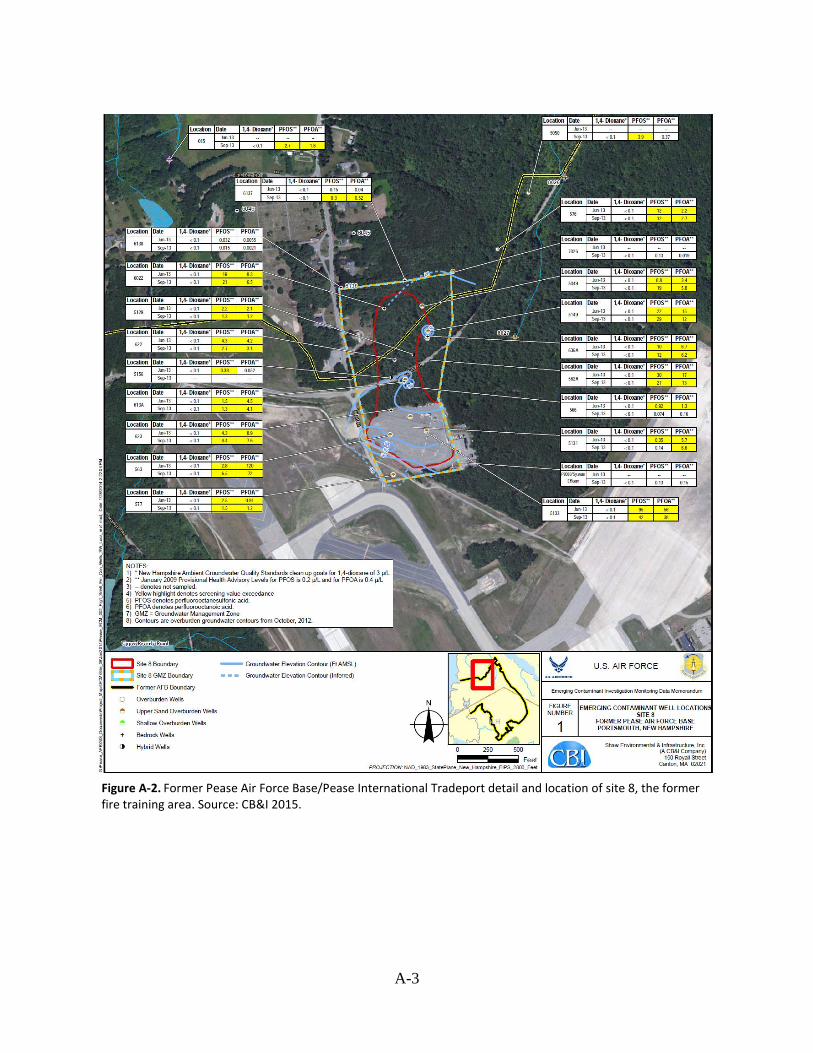
Figure A-2. Former Pease Air Force Base/Pease International Tradeport detail and location of site 8, the former fire training area. Source: CB&I 2015.
A-3

Figure A-3. Location of the Pease International Tradeport public water supply wells
A-4
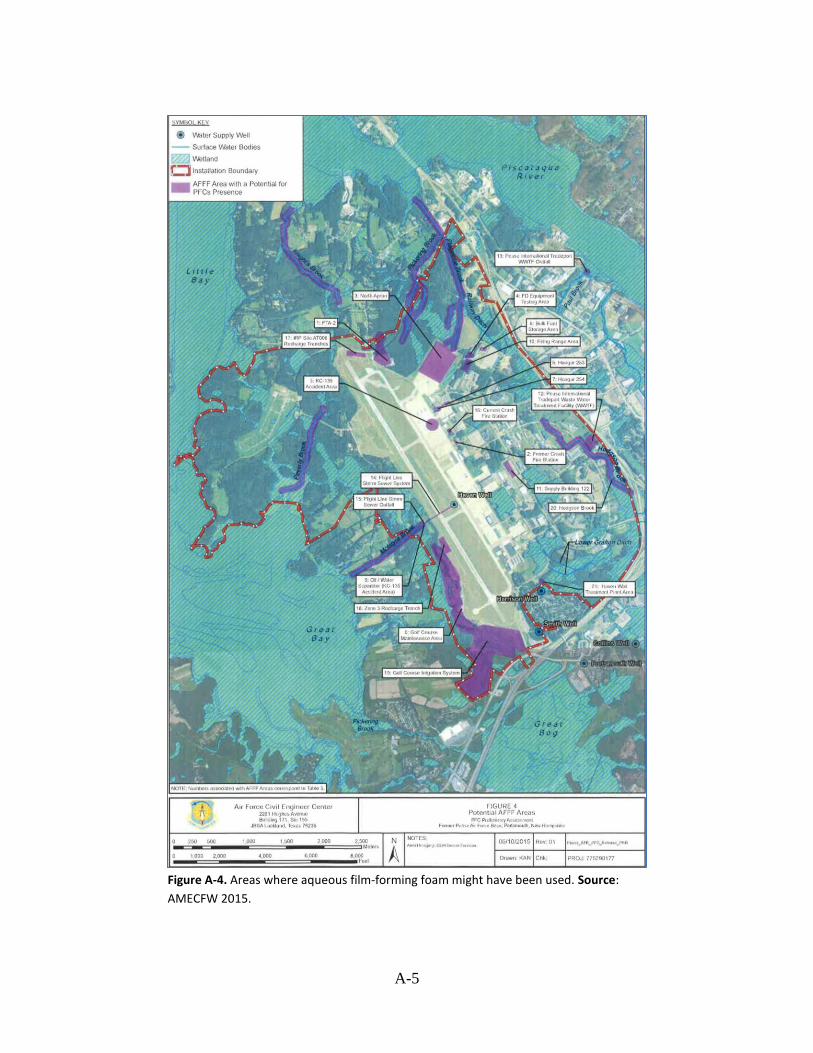
Figure A-4. Areas where aqueous film-forming foam might have been used. Source:
AMECFW 2015.
A-5

Figure A-5. Monthly estimated drinking water concentrations between January 2003 and August 2015 for 11 per-and polyfluoroalkyl substances (PFAS) detected in the water supply wells. Estimated values derived by using flow-weighted mixing model approach and measured PFAS concentrations in April 2014. Note: see Appendix B for more details. Abbreviations: µg/L = micrograms per liter; PFBS = perfluorobutane sulfonic acid; PFDA = perfluorodecanoic acid; PFDoA = perfluorododecanoic acid; PFHpA = perfluoroheptanoic acid; PFHxA = perfluorohexanoic acid; PFHxS = perfluorohexane sulfonic acid; PFNA = perfluorononanoic acid; PFOA = perfluorooctanoic acid; PFOS = perfluorooctane sulfonic acid; PFPeA = perfluoropentanoic acid; PFUnA = perfluoroundecanoic acid.
A-6

A-7
Table A-1. Per- and polyfluoroalkyl su bstances (PFAS) and possible effects on organ systems
Specific PFAS
Cardiovascular Developmental Endocrine Liver Immune Reproductive Serum lipid
PFBS ⚫ ⚫ ⚫
PFDeA ⚫ ⚫ ⚫
PFDoA
PFHpA
PFHxA ⚫ ⚫
PFHxS ⚫ ⚫ ⚫ ⚫
PFNA ⚫ ⚫
PFOA ⚫ ⚫ ⚫ ⚫ ⚫ ⚫ ⚫
PFOS ⚫ ⚫ ⚫ ⚫ ⚫ ⚫ ⚫
PFPeA
PFUnA ⚫
NOTES: ⚫ = Indicates possible impacts on this target organ system = Indicates no impacts or insufficient information
Abbreviation Citation(s) for effects (if applicable) PFBS perfluorobutane sulfonic acid Minnesota Department of Health [MDH 2017a]
PFDeA perfluorodecanoic acid Fu et.al. 2014; Grandjean et al. 2012; Harris and Birnbaum 1989; Starling, et al. 2014 PFDoA perfluorododecanoic acid No effects or insufficient information on target organ systems PFHpA perfluoroheptanoic acid No effects or insufficient information on target organ systems
PFHxA perfluorohexanoic acid Iwai and Hoberman 2014; Klaunig et al. 2015 PFHxS Perfluorohexane sulfonic acid Butenhoff et al. 2009; Gleason et al. 2015; Grandjean et al. 2012; Morgensen et al. 2015; Viberg et al. 2013
PFNA perfluorononanoic acid Das et al. 2015; Starling et al. 2014; Zeng, et al. 2015 PFOA perfluorooctanoic acid ATSDR 2018a PFOS perfluorooctane sulfonic acid ATSDR 2018a
PFPeA perfluoropentanoic acid No effects or insufficient information on target organ systems PFUnA perfluoroundecanoic acid Takahashi et al. 2014
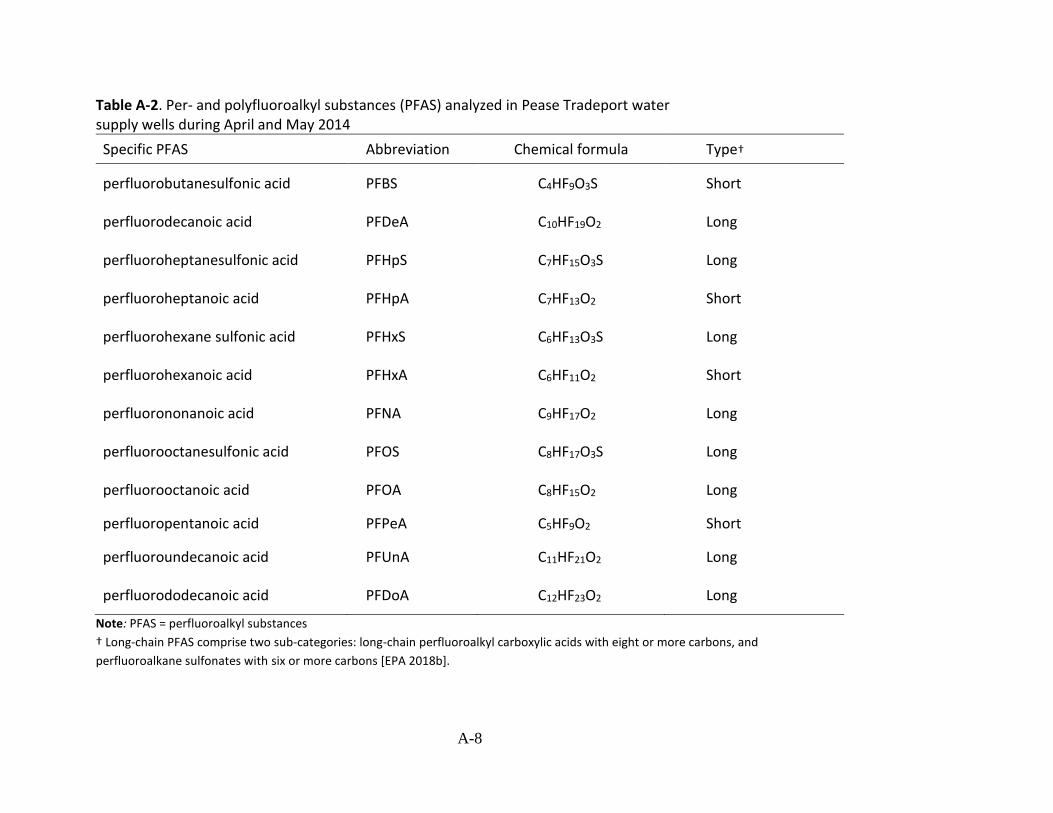
Specific PFAS Abbreviation Chemical formula Type†
perfluorobutanesulfonic acid PFBS C4HF9O3S Short
perfluorodecanoic acid PFDeA C10HF19O2 Long
perfluoroheptanesulfonic acid PFHpS C7HF15O3S Long
perfluoroheptanoic acid PFHpA C7HF13O2 Short
perfluorohexane sulfonic acid PFHxS C6HF13O3S Long
perfluorohexanoic acid PFHxA C6HF11O2 Short
perfluorononanoic acid PFNA C9HF17O2 Long
perfluorooctanesulfonic acid PFOS C8HF17O3S Long
perfluorooctanoic acid PFOA C8HF15O2 Long
perfluoropentanoic acid PFPeA C5HF9O2 Short
perfluoroundecanoic acid PFUnA C11HF21O2 Long
perfluorododecanoic acid PFDoA C12HF23O2 Long
Note: PFAS = perfluoroalkyl substances
† Long-chain PFAS comprise two sub-categories: long-chain perfluoroalkyl carboxylic acids with eight or more carbons, and
perfluoroalkane sulfonates with six or more carbons [EPA 2018b].
Table A -2. Per- and polyfluoroalkyl su bstances (PFAS) analyzed in Pease Tradeport water supply wells during April and May 2014
A-8

Table A-3. Water quality data from Pease Tradeport supply w ells (collected in 2014) screened b y health-based comparison values; concentrations in micrograms per liter (µg/L)
Specific
PFAS HBCV
HBCV
Source
Haven well Harrison well Smith well
April 16 May 14 April 16 May 14 April 16 May 14
PFBS 2 MDH§ 0.051 0.051 0.002* 0.0019* 0.00094* 0.00087*
PFDeA None None 0.0049* 0.0043* ND ND 0.0044 ND
PFDoA None None ND ND ND ND 0.012 ND
PFHpA None None 0.12 0.12 0.0046* 0.0042* 0.0025* 0.002*
PFHxA None None 0.33 0.35 0.0087 0.01 0.0039* 0.004*
PFHxS 0.14 ATSDR‡ 0.83 0.96 0.036 0.032 0.013 0.013
PFNA 0.021 ATSDR 0.017 0.017 ND ND ND ND
PFOA 0.021 ATSDR 0.35 0.32 0.009 0.0086 0.0035* 0.0036*
PFOS 0.014 ATSDR 2.5† 2.4† 0.048 0.041 0.018 0.015
PFPeA None None 0.27 0.26 0.0079 0.0084 0.0035* 0.0034*
PFUnA None None ND ND ND ND 0.017 ND
Abbreviations: µg/L = micrograms per liter; ATSDR = Agency for Toxic Substances and Disease Registry's derived children's health-based comparison value; HBCV = Health-based comparison value; ND = not detected; PFAS = per- and polyfluoroalkyl substances; PFBS = perfluorobutane sulfonic acid; PFDeA = perfluorodecanoic acid; PFDoA = perfluorododecanoic acid; PFHpA = perfluoroheptanoic acid; PFHxA = perfluorohexanoic acid; PFHxS = perfluorohexane sulfonic acid; PFNA = perfluorononanoic acid; PFOA = perfluorooctanoic acid; PFOS = perfluorooctane sulfonic acid; PFPeA = perfluoropentanoic acid; PFUnA = perfluoroundecanoic acid. *Estimated value. †These represent the maximum PFOS concentration from the Haven well collected in April and May 2014. Subsequent sampling from the same well
during November 16 and 28, 2016, indicated that the PFOS concentration was 1.0 µg/L and 1.4 µg/L, respectively. The data from 2014 remain valid.
ATSDR used these for further analysis and modeling (see Appendix B for modeling report). §MDH developed a guidance value of 2 ppb for PFBS in drinking water to protect people who are most vulnerable to the potentially harmful effects of a
contaminant [MDH 2017d]. ‡ ATSDR derived value for children's exposures. This value is called an Environmental Media Evaluation Guide (EMEG) and is an estimated contaminant
concentration that is not expected to result in adverse noncarcinogenic health effects based on ATSDR evaluation. EMEGs are based on ATSDR
provisional MRLs and conservative assumptions about exposure, such as intake rate, exposure frequency and duration, and body weight. Child drinking
water EMEGs are based on an infant (age birth to one year old) weighing 7.8 kg and an intake rate of 1.113 liters per day.
Note: Shaded = concentrations are above a health-based comparison value.
A-9
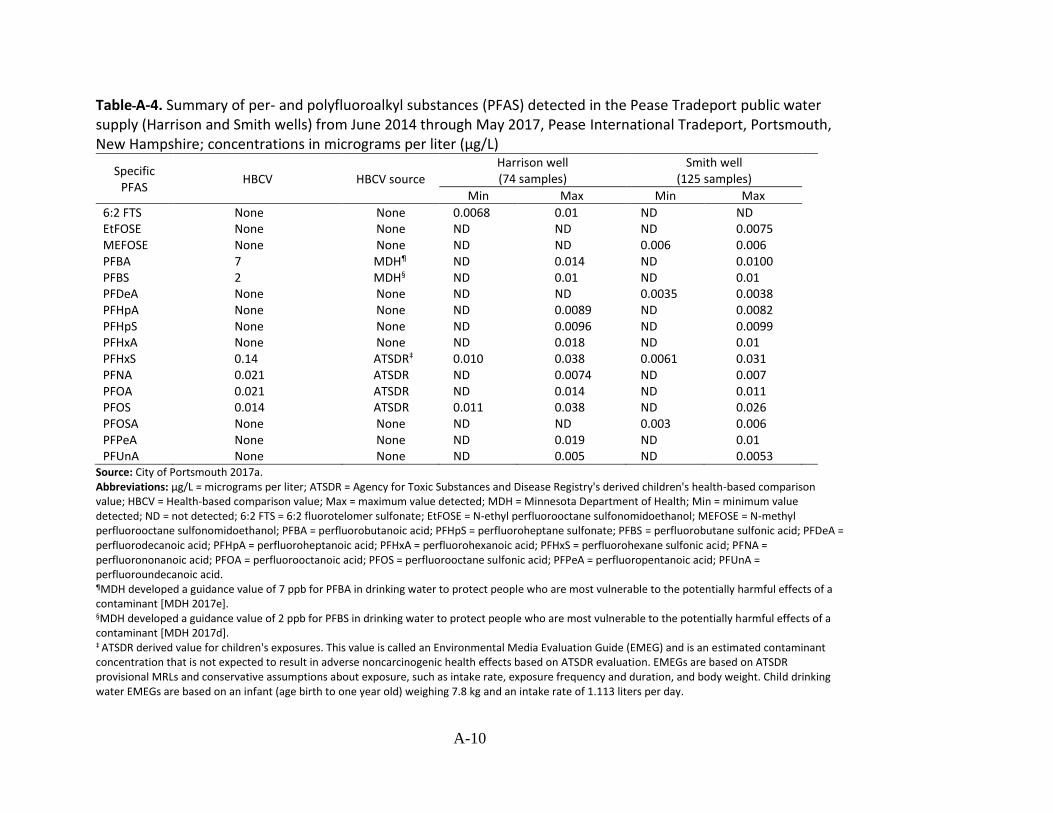
Table A-4. Summary of per- and polyfluoroalkyl su bstances (PFAS) detected in the Pease Tradeport public water supply (H arrison and Smith wells) from June 2014 through May 2017, Pease International Tradeport, Portsmouth, New Hampshire; concentrations in micrograms per liter (µg/L)
Specific PFAS
HBCV HBCV source
Harrison well (74 samples)
Smith well (125 samples)
Min Max Min Max
6:2 FTS None None 0.0068 0.01 ND ND EtFOSE None None ND ND ND 0.0075
MEFOSE None None ND ND 0.006 0.006 PFBA 7 MDH¶ ND 0.014 ND 0.0100 PFBS 2 MDH§ ND 0.01 ND 0.01 PFDeA None None ND ND 0.0035 0.0038
PFHpA None None ND 0.0089 ND 0.0082 PFHpS None None ND 0.0096 ND 0.0099
PFHxA None None ND 0.018 ND 0.01 PFHxS 0.14 ATSDR‡ 0.010 0.038 0.0061 0.031
PFNA 0.021 ATSDR ND 0.0074 ND 0.007 PFOA 0.021 ATSDR ND 0.014 ND 0.011 PFOS 0.014 ATSDR 0.011 0.038 ND 0.026 PFOSA None None ND ND 0.003 0.006 PFPeA None None ND 0.019 ND 0.01 PFUnA None None ND 0.005 ND 0.0053
Source: City of Portsmouth 2017a. Abbreviations: µg/L = micrograms per liter; ATSDR = Agency for Toxic Substances and Disease Registry's derived children's health-based comparison value; HBCV = Health-based comparison value; Max = maximum value detected; MDH = Minnesota Department of Health; Min = minimum value detected; ND = not detected; 6:2 FTS = 6:2 fluorotelomer sulfonate; EtFOSE = N-ethyl perfluorooctane sulfonomidoethanol; MEFOSE = N-methyl perfluorooctane sulfonomidoethanol; PFBA = perfluorobutanoic acid; PFHpS = perfluoroheptane sulfonate; PFBS = perfluorobutane sulfonic acid; PFDeA = perfluorodecanoic acid; PFHpA = perfluoroheptanoic acid; PFHxA = perfluorohexanoic acid; PFHxS = perfluorohexane sulfonic acid; PFNA = perfluorononanoic acid; PFOA = perfluorooctanoic acid; PFOS = perfluorooctane sulfonic acid; PFPeA = perfluoropentanoic acid; PFUnA = perfluoroundecanoic acid. ¶MDH developed a guidance value of 7 ppb for PFBA in drinking water to protect people who are most vulnerable to the potentially harmful effects of a contaminant [MDH 2017e]. §MDH developed a guidance value of 2 ppb for PFBS in drinking water to protect people who are most vulnerable to the potentially harmful effects of a contaminant [MDH 2017d]. ‡ ATSDR derived value for children's exposures. This value is called an Environmental Media Evaluation Guide (EMEG) and is an estimated contaminant concentration that is not expected to result in adverse noncarcinogenic health effects based on ATSDR evaluation. EMEGs are based on ATSDR provisional MRLs and conservative assumptions about exposure, such as intake rate, exposure frequency and duration, and body weight. Child drinking water EMEGs are based on an infant (age birth to one year old) weighing 7.8 kg and an intake rate of 1.113 liters per day.
A-10

Table A -5. Summary of per- and polyfluoroalkyl su bstances (PFAS) detected in the Pease Tradeport water supply ( New Hampshire Department of Environmental Services (NHDES) office, distribution point, and Fire Station No. 3) from June 2014 through May 2017, Pease International Tradeport, Portsmouth, New Hampshire; concentrations in micrograms per liter (µg/L)
Specific PFAS
HBCV
HBCV Source
Pease Tradeport Water Supply at NHDES office (13 samples)
Pease Tradeport water supply at water treatment plant (9
samples)
Pease Tradeport Water Supply at Fire Station No. 3 (2 samples )
Min Max Min Max Min Max
PFBA 7 MDH¶ ND 0.013* ND 0.0059* 0.0075* 0.013*
PFBS 2 MDH§ ND 0.0066* ND ND 0.0051* 0.0065*
PFHpA None None ND ND ND ND ND ND
PFHxA None None ND 0.0081* ND 0.0062* ND 0.007*
PFHxS 0.14 ATSDR‡ 0.006* 0.019* ND 0.012* 0.013* 0.019*
PFNA 0.021 ATSDR ND ND ND ND ND ND
PFOA 0.021 ATSDR ND 0.0073* ND ND ND 0.0055*
PFOS 0.014 ATSDR 0.006* 0.014* ND 0.016* 0.0095* 0.013*
PFPeA None None ND 0.0083* ND 0.0066* 0.0037* 0.0091*
Source: City of Portsmouth 2017a. Abbreviations: µg/L = micrograms per liter; ATSDR = Agency for Toxic Substances and Disease Registry's derived children's health-based comparison value; HBCV =
Health-based comparison value; Max = maximum value detected; MDH = Minnesota Department of Health; Min = minimum value detected; ND = not detected; PFBA =
perfluorobutanoic acid; PFBS = perfluorobutane sulfonic acid; PFHpA = perfluoroheptanoic acid; PFHxA = perfluorohexanoic acid; PFHxS = perfluorohexane sulfonic
acid; PFOA = perfluorooctanoic acid; PFOS = perfluorooctane sulfonic acid; PFPeA = perfluoropentanoic acid.
Note: Shaded = concentrations are at or above a health-based comparison value. The following PFAS were analyzed and not detected: 6:2 Fluorotelomer sulfonate (6:2
FTS); 8:2 Fluorotelomer sulfonate; N-Ethyl perfluorooctane sulfonamide; N-Ethyl perfluorooctane sulfonamidoethanol ; N-Methyl Perfluorooctane Sulfonamide; N-
Methyl Perfluorooctane Sulfonamidoethanol; Perfluorodecane sulfonate ; Perfluorodecanoic acid; Perfluorododecanoic acid); Perfluorononanoic acid;
Perfluorotetradecanoic acid; Perfluorotridecanoic acid; Perfluoroundecanoic acid; Perfluoroheptanoic acid*Estimated values. ¶MDH developed a guidance value of 7 ppb for PFBA in drinking water to protect people who are most vulnerable to the potentially harmful effects of a contaminant [MDH 2017e]. §MDH developed a guidance value of 2 ppb for PFBS in drinking water to protect people who are most vulnerable to the potentially harmful effects of a contaminant
[MDH 2017d]. ‡ ATSDR derived value for children's exposures. This value is called an Environmental Media Evaluation Guide (EMEG) and is an estimated contaminant concentration that is not expected to result in adverse noncarcinogenic health effects based on ATSDR evaluation. EMEGs are based on ATSDR provisional MRLs and conservative assumptions about exposure, such as intake rate, exposure frequency and duration, and body weight. Child drinking water EMEGs are based on an infant (age birth to one year old) weighing 7.8 kg and an intake rate of 1.113 liters per day.
A-11

Table A-6. Summary of per- and polyfluoroalkyl substances (PFAS) detected in the Pease Tradeport public water supply (at two childcare centers), March–October 2015, Pease International Tradeport, Portsmouth, New Hampshire; concentrations in micrograms per liter (µg/L)
Specific HBCV
HBCV Great Bay Kids’ Company* Discovery Child Enrichment Center†
PFAS source Min Max Min Max
PFHpA None None ND ND ND ND
PFHpS None None ND 0.0044‡ ND ND
PFHxA None None ND 0.0052‡ ND ND
PFHxS 0.14 ATSDR§ ND 0.014‡ ND 0.014‡
PFNA 0.021 ATSDR ND ND ND ND
PFOA 0.021 ATSDR ND 0.005‡ ND ND
PFOS 0.014 ATSDR ND 0.012‡ ND 0.012‡
PFOSA None None ND 0.0026‡ ND ND
PFPeA None None ND 0.006‡ ND 0.0064‡
Sources: City of Portsmouth 2017a, 2018. Abbreviations: µg/L = micrograms per liter; ATSDR = Agency for Toxic Substances and Disease Registry's derived children's health-based comparison
value; HBCV = Health-based comparison value; Max = maximum value detected; Min = minimum value detected; ND = not detected; PFHpA =
perfluoroheptanesulfonic acid; PFHpS = perfluoroheptane sulfonate; PFHxA = perfluorohexanoic acid; PFHxS = perfluorohexane sulfonic acid; PFOA =
perfluorooctanoic acid; PFOS = perfluorooctane sulfonic acid; PFOSA = perfluorooctane sulfonamide; PFPeA = perfluoropentanoic acid.
*Two untreated samples from the Pease Tradeport Water Supply at Great Bay Kids’ Company location. †Two untreated samples from the Pease Tradeport Water Supply at Discovery Child Enrichment Center location. ‡Estimated values. § ATSDR derived value for children's exposures. This value is called an Environmental Media Evaluation Guide (EMEG) and is an estimated contaminant concentration that is not expected to result in adverse noncarcinogenic health effects based on ATSDR evaluation. EMEGs are based on ATSDR provisional MRLs and conservative assumptions about exposure, such as intake rate, exposure frequency and duration, and body weight. Child drinking water EMEGs are based on an infant (age birth to one year old) weighing 7.8 kg and an intake rate of 1.113 liters per day. Note: The following PFAS were analyzed and not detected: 6:2 Fluorotelomer sulfonate (6:2 FTS); 8:2 Fluorotelomer sulfonate; N-Ethyl perfluorooctane sulfonamide;
N-Ethyl perfluorooctane sulfonamidoethanol ; N-Methyl Perfluorooctane Sulfonamide; N-Methyl Perfluorooctane Sulfonamidoethanol; Perfluorodecane sulfonate ;
Perfluorodecanoic acid; Perfluorododecanoic acid); Perfluorononanoic acid; Perfluorotetradecanoic acid; Perfluorotridecanoic acid; Perfluoroundecanoic acid;
Perfluoroheptanoic acid*Estimated values.
A-12

Table A-7. Exposure pathways, Pease International Tradeport, Portsmouth, New Hampshire
Pathway Source Media Exposure point Exposed
population Exposure route Time
Completed pathway status (see notes
below)
Pease Tradeport
Public Water Supply
Pease Air Force Base Fire Dept.
Training Area 2 (Site 8)
Drinking water
Pease Tradeport water supply
distribution points (businesses,
childcare centers)
Workers (since 1993) and children
attending childcare (since 1994 and 2010)
Ingestion
Skin absorption and inhalation of PFAS as vapors
Past,
present, and future
Past, present,
and future
Completed
Completed*
Completed†
Completed‡
Pease Tradeport
Public Water Supply
Pease Air Force Base Fire Dept.
Training Area 2 (Site 8)
Drinking water
Pease Tradeport water supply
distribution points (businesses,
childcare centers)
Pregnant women and women of
child-bearing age who breastfeed
Breast feeding infants
Ingestion
Ingestion
Past, present,
and future
Past, present,
and future
Completed
Completed
*Treatment system to remove per- and polyfluoroalkyl substances from Harrison and Smith wells began operating on September 22, 2016. Perfluorooctane sulfonic acid and perfluorooctanoic acid were not detected in six samples of treated water collected through mid-November 2016. Other per- and polyfluoroalkyl substances occasionally detected at very low levels. Treatment system will be adjusted to maximize removal of per- and polyfluoroalkyl substances. †Dermal and inhalation exposure routes contributed negligible additional intake based on past concentrations in drinking water. ‡Water treatment system is removing PFAS to either non-detect levels or very low concentrations. The two drinking water exposure routes contribute negligible additional intake based on current concentrations in the treated drinking water.
A-13

Table A-8. Health-based comparison values used to screen water quality for per- and polyfluoroalkyl substances (PFAS); concentrations in micrograms per liter (µg/L)
Health-based comparison Specific PFAS
value source Value (µg/L)
PFBA MDH¶ 7
PFBS MDH§ 2
PFDeA NA NA
PFDoA NA NA
PFHxA NA NA
PFHxS ATSDR* 0.14
PFNA ATSDR 0.021
PFOA ATSDR 0.021
PFOS ATSDR 0.014
PFPeA NA NA
PFUnA NA NA
Abbreviations: µg/L = micrograms per liter; ATSDR = Agency for Toxic Substances and Disease Registry's derived children's health-based comparison value; HBCV = Health-based comparison value; NA = not available (no health-based comparison value is available for this compound); PFBA = perfluorobutanoic acid; PFBS = perfluorobutane sulfonic acid; PFDeA = perfluorodecanoic acid; PFDoA = perfluorododecanoic acid; PFHxA = perfluorohexanoic acid; PFHxS = perfluorohexane sulfonic acid; PFNA = perfluorononanoic acid; PFOA = perfluorooctanoic acid; PFOS = perfluorooctane sulfonic acid; PFPeA = perfluoropentanoic acid; PFUnA = perfluoroundecanoic acid.
*ATSDR derived value for children's exposures. This value is called an Environmental Media Evaluation Guide (EMEG) and is an estimated contaminant concentration that is not expected to result in adverse noncarcinogenic health effects based on ATSDR evaluation. EMEGs are based on ATSDR provisional MRLs and conservative assumptions about exposure, such as intake rate, exposure frequency and duration, and body weight. Child drinking water EMEGs are based on an infant (age birth to one year old) weighing 7.8 kg and an intake rate of 1.113 liters per day. ¶MDH developed a guidance value of 7 ppb for PFBA in drinking water to protect people who are most vulnerable to the potentially harmful effects of a contaminant [MDH 2017e]. §MDH developed a guidance value of 2 ppb for PFBS in drinking water to protect people who are most vulnerable to the potentially harmful effects of a contaminant [MDH 2017d].
A-14

Table A-9. Per- and polyfluoroalkyl su bstances (PFAS) modeled maximu ms and geometric means values compared with health-based comparison values; all units in micrograms per liter (µg/L)
Jan 2003– Nov 2007– Feb 2008– Sep 2010– May 2012– Jun 2014–
Specific PFAS
HBCV
Oct 2007 Jan 2008 Aug 2010 Apr 2012 May 2014 Mar 2015
MAX GM MAX GM MAX GM MAX GM MAX GM MAX GM
PFBS§ 2 0.03 0.03 <0.01 <0.01 0.03 0.02 0.03 0.02 0.04 0.03 <0.01 <0.01
PFDeA none <0.01 <0.01 <0.01 <0.01 <0.01 <0.01 <0.01 <0.01 <0.01 <0.01 <0.01 <0.01
PFDoA none 0.01 <0.01 0.01 <0.01 <0.01 <0.01 0.01 <0.01 <0.01 <0.01 0 0
PFHpA* none 0.08 0.06 <0.01 <0.01 0.07 0.06 0.06 0.05 0.08 0.06 <0.01 <0.01
PFHxA* none 0.22 0.17 0.01 0.01 0.18 0.16 0.17 0.13 0.23 0.17 0.01 <0.01
PFHxS* 0.14† 0.57 0.43 0.04 0.03 0.46 0.41 0.44 0.32 0.57 0.44 0.02 0.01
PFNA 0.021† 0.01 0.01 0 0 0.01 0.01 0.01 0.01 0.01 0.01 0.01 <0.01
PFOA* 0.021† 0.24 0.18 0.01 0.01 0.19 0.17 0.18 0.13 0.24 0.18 <0.01 <0.01
PFOS* 0.014† 1.7 1.29 0.05 0.04 1.37 1.2 1.29 0.94 1.71 1.29 0.02 0.01
PFPeA* none 0.18 0.14 0.01 0.01 0.15 0.13 0.14 0.1 0.19 0.14 0.01 <0.01
PFUnA none 0.01 <0.01 0.01 <0.01 0.01 <0.01 0.01 0.01 0.01 <0.01 <0.01 <0.01
Abbreviations: µg/L = micrograms per liter; H BCV = health-based comparison values. GM = geometric mean; MAX = maximum value; PFBS = perfluorobutane sulfonic acid; PFDeA
= perfluorodecanoic acid; PFDoA = perfluorododecanoic acid; PFHpA = perfluoroheptanoic acid; PFHxA = perfluorohexanoic acid; PFHxS = perfluorohexane sulfonic acid; PFNA =
perfluorononanoic acid; PFOA = perfluorooctanoic acid; PFOS = perfluorooctane sulfonic acid; PFPeA = perfluoropentanoic acid; PFUnA = perfluoroundecanoic acid.
*These compounds were selected for further review. †ATSDR derived children's health-based comparison value; §MDH developed a guidance value of 2 ppb for PFBS in drinking water to protect people who are most vulnerable to
the potentially harmful effects of a contaminant [MDH 2017d].
Notes Shaded = above HBCV. ATSDR used the maximum PFOS concentration from the Haven well collected in April and May 2014. Subsequent sampling from the same well
during November 16 and 28 of 2016 indicated that the PFOS concentration was 1.0 µg/L and 1.4 µg/L respectively. The data from 2014 remain valid. ATSDR used the data for
modeling (see Appendix B for modeling report).
A-15
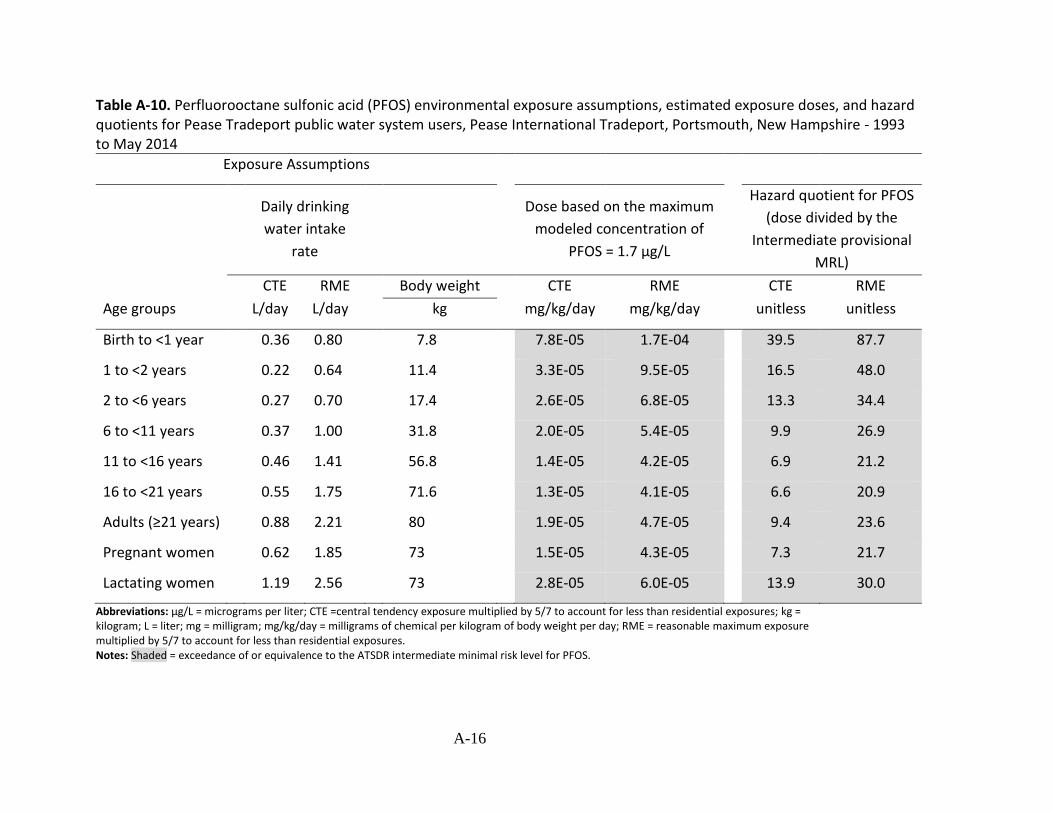
Table A-10. Perfluorooctane sulfonic acid (PFOS) environmental exposure assumptions, estimated exposure doses, and hazard quotients for Pease Tradeport public water system users, Pease International Tradeport, Portsmouth, New Hampshire - 1993 to May 2014
Exposure Assumptions
Age groups
Daily drinking
water intake
rate
Dose based on the maximum
modeled concentration of
PFOS = 1.7 µg/L
Hazard quotient for PFOS
(dose divided by the
Intermediate provisional
MRL)
CTE RME
L/day L/day
Body weight CTE RME
mg/kg/day mg/kg/day
CTE RME
unitless unitless kg
Birth to <1 year 0.36 0.80 7.8 7.8E-05 1.7E-04 39.5 87.7
1 to <2 years 0.22 0.64 11.4 3.3E-05 9.5E-05 16.5 48.0
2 to <6 years 0.27 0.70 17.4 2.6E-05 6.8E-05 13.3 34.4
6 to <11 years 0.37 1.00 31.8 2.0E-05 5.4E-05 9.9 26.9
11 to <16 years 0.46 1.41 56.8 1.4E-05 4.2E-05 6.9 21.2
16 to <21 years 0.55 1.75 71.6 1.3E-05 4.1E-05 6.6 20.9
Adults (≥21 years) 0.88 2.21 80 1.9E-05 4.7E-05 9.4 23.6
Pregnant women 0.62 1.85 73 1.5E-05 4.3E-05 7.3 21.7
Lactating women 1.19 2.56 73 2.8E-05 6.0E-05 13.9 30.0
Abbreviations: µg/L = micrograms per liter; CTE =central tendency exposure multiplied by 5/7 to account for less than residential exposures; kg = kilogram; L = liter; mg = milligram; mg/kg/day = milligrams of chemical per kilogram of body weight per day; RME = reasonable maximum exposure multiplied by 5/7 to account for less than residential exposures. Notes: Shaded = exceedance of or equivalence to the ATSDR intermediate minimal risk level for PFOS.
A-16

Table A-11. Perfluorooctanoic acid (PFOA) environmental exposure assumptions, estimated exp osure doses, and hazard quotients for Pease Tradeport public water system users, Pease International Tradeport, Portsmouth, New Hampshire - 1993 to May 2014
Exposure Assumptions
Body
weight
Dose based on the maximum
modeled concentration of PFOA = 0.2 µg/L
Hazard quotient for
PFOA (dose divided by
the Intermediate
provisional MRL)
Daily drinking water
intake rate
CTE RME CTE RME CTE RME
Age groups L/day L/day kg mg/kg/day mg/kg/day unitless unitless
Birth to <1 year 0.36 0.80 7.8 9.2E-06 2.0E-05 3.08 6.84
1 to <2 years 0.22 0.64 11.4 3.9E-06 1.1E-05 1.29 3.74
2 to <6 years 0.27 0.70 17.4 3.1E-06 8.0E-06 1.03 2.68
6 to <11 years 0.37 1.00 31.8 2.3E-06 6.3E-06 0.78 2.10
11 to <16 years 0.46 1.41 56.8 1.6E-06 5.0E-06 0.54 1.65
16 to <21 years 0.55 1.75 71.6 1.5E-06 4.9E-06 0.51 1.63
Adults (≥21 years) 0.88 2.21 80 2.2E-06 5.5E-06 0.73 1.84
Pregnant women 0.62 1.85 73 1.7E-06 5.1E-06 0.57 1.69
Lactating women 1.19 2.56 73 3.3E-06 7.0E-06 1.09 2.34
Abbreviations: µg/L = micrograms per liter; CTE =central tendency exposure multiplied by 5/7 to account for less than residential exposures; kg = kilogram; L = liter; mg = milligram; mg/kg/day = milligrams of chemical per kilogram of body weight per day; RME = reasonable maximum exposure multiplied by 5/7 to account for less than residential exposures. Notes: Shaded = exceedance of or equivalence to the ATSDR intermediate minimal risk level for PFOA.
A-17

Table A-12. Perfluorohexane sulfonic acid (PFHxS) environmental exposure assumptions, estimated exposure doses, and hazard quotients for Pease Tradeport public water system users, Pease International Tradeport, Portsmouth, New Hampshire - 1993 to May 2014
Exposure Assumptions Dose based on the maximum Hazard quotient for
Daily drinking water
intake rate
Body
weight
modeled concentration of
PFHxS= 0.57 µg/L
PFHxS (dose divided by
the Intermediate
provisional MRL)
CTE RME CTE RME CTE RME
Age groups L/day L/day kg mg/kg/day mg/kg/day unitless unitless
Birth to <1 year 0.36 0.80 7.8 2.63E-05 5.85E-05 1.32 2.92
1 to <2 years 0.22 0.64 11.4 1.10E-05 3.20E-05 0.55 1.60
2 to <6 years 0.27 0.70 17.4 8.84E-06 2.29E-05 0.44 1.15
6 to <11 years 0.37 1.00 31.8 6.63E-06 1.79E-05 0.33 0.90
11 to <16 years 0.46 1.41 56.8 4.62E-06 1.41E-05 0.23 0.71
16 to <21 years 0.55 1.75 71.6 4.38E-06 1.39E-05 0.22 0.70
Adults (≥21 years) 0.88 2.21 80 6.27E-06 1.57E-05 0.31 0.79
Pregnant women 0.62 1.85 73 4.84E-06 1.44E-05 0.24 0.72
Lactating women 1.19 2.56 73 9.29E-06 2.00E-05 0.46 1.00
Abbreviations: µg/L = micrograms per liter; CTE =central tendency exposure multiplied by 5/7 to account for less than residential exposures; kg = kilogram; L = liter; mg = milligram; mg/kg/day = milligrams of chemical per kilogram of body weight per day; RME = reasonable maximum exposure multiplied by 5/7 to account for less than residential exposures. Notes: Shaded = exceedance of or equivalence to the ATSDR intermediate minimal risk level for PFHxS.
A-18

Table A-13. Perfluorohexanoic acid (PFHxA) environmental exposure assumptions and estimated exposure doses for Pease Tradeport public water system users, Pease International Tradeport, Portsmouth, New Hampshire -1993 to May 2014
Exposure assumptions Dose based on the maximum
Daily drinking water Body modeled concentration of PFHxA =
intake rate weight 0.23 µg/L
CTE RME CTE RME
Age groups L/day L/day kg mg/kg/day mg/kg/day
Birth to <1 year 0.36 0.80 7.8 1.1E-05 2.3E-05
1 to <2 years 0.22 0.64 11.4 4.4E-06 1.3E-05
2 to <6 years 0.27 0.70 17.4 3.6E-06 9.2E-06
6 to <11 years 0.37 1.00 31.8 2.6E-06 7.3E-06
11 to <16 years 0.46 1.41 56.8 1.8E-06 5.7E-06
16 to <21 years 0.55 1.75 71.6 1.8E-06 5.6E-06
Adults (≥21 years) 0.88 2.21 80 2.5E-06 6.3E-06
Pregnant women 0.62 1.85 73 2.0E-06 5.8E-06
Lactating women 1.19 2.56 73 3.7E-06 8.1E-06
Abbreviations: µg/L = micrograms per liter; CTE =central tendency exposure multiplied by 5/7 to account for less than residential exposures; kg = kilogram; L = liter; mg = milligram; mg/kg/day = milligrams of chemical per kilogram of body weight per day; RME = reasonable maximum exposure multiplied by 5/7 to account for less than residential exposures.
A-19
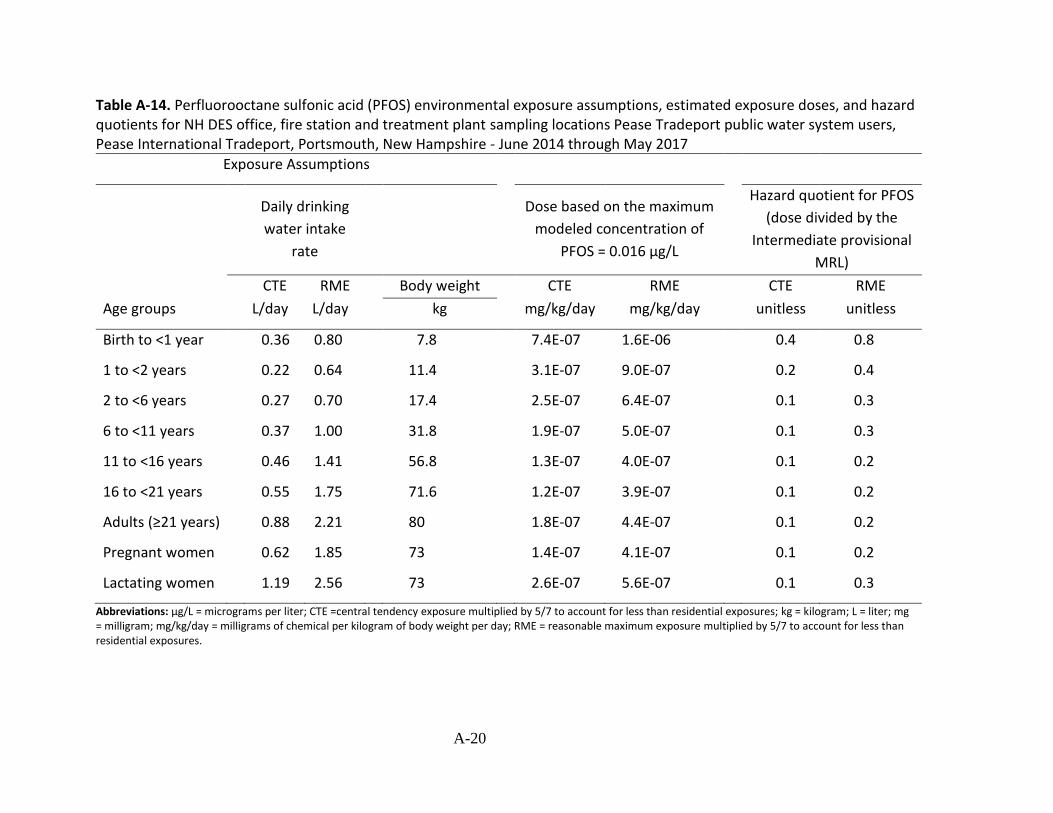
Table A-14. Perfluorooctane sulfonic acid (PFOS) environmental exposure assumptions, estimated exposure doses, and hazard quotients for NH DES office, fire station and treatment plant sampling locations Pease Tradeport public water system users, Pease International Tradeport, Portsmouth, New Hampshire - June 2014 through May 2017
Exposure Assumptions
Age groups
Daily drinking
water intake
rate
Dose based on the maximum
modeled concentration of
PFOS = 0.016 µg/L
Hazard quotient for PFOS
(dose divided by the
Intermediate provisional
MRL)
CTE RME
L/day L/day
Body weight CTE RME
mg/kg/day mg/kg/day
CTE RME
unitless unitless kg
Birth to <1 year 0.36 0.80 7.8 7.4E-07 1.6E-06 0.4 0.8
1 to <2 years 0.22 0.64 11.4 3.1E-07 9.0E-07 0.2 0.4
2 to <6 years 0.27 0.70 17.4 2.5E-07 6.4E-07 0.1 0.3
6 to <11 years 0.37 1.00 31.8 1.9E-07 5.0E-07 0.1 0.3
11 to <16 years 0.46 1.41 56.8 1.3E-07 4.0E-07 0.1 0.2
16 to <21 years 0.55 1.75 71.6 1.2E-07 3.9E-07 0.1 0.2
Adults (≥21 years) 0.88 2.21 80 1.8E-07 4.4E-07 0.1 0.2
Pregnant women 0.62 1.85 73 1.4E-07 4.1E-07 0.1 0.2
Lactating women 1.19 2.56 73 2.6E-07 5.6E-07 0.1 0.3
Abbreviations: µg/L = micrograms per liter; CTE =central tendency exposure multiplied by 5/7 to account for less than residential exposures; kg = kilogram; L = liter; mg = milligram; mg/kg/day = milligrams of chemical per kilogram of body weight per day; RME = reasonable maximum exposure multiplied by 5/7 to account for less than residential exposures.
A-20
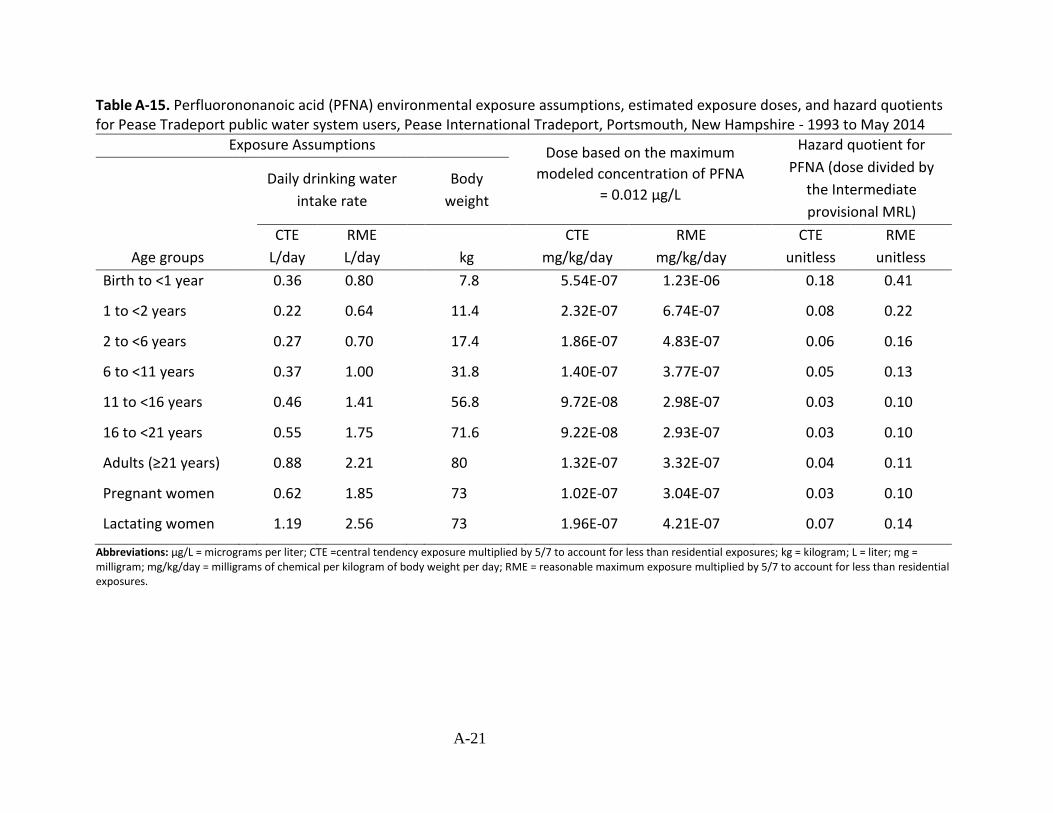
Table A-15. Perfluorononanoic acid (PFNA) environmental exposure assumptions, estimated exposure doses, and hazard quotients for Pease Tradeport public water system users, Pease International Tradeport, Portsmouth, New Hampshire - 1993 to May 2014
Exposure Assumptions Dose based on the maximum Hazard quotient for
Daily drinking water
intake rate
Body
weight
modeled concentration of PFNA
= 0.012 µg/L
PFNA (dose divided by
the Intermediate
provisional MRL)
CTE RME CTE RME CTE RME
Age groups L/day L/day kg mg/kg/day mg/kg/day unitless unitless
Birth to <1 year 0.36 0.80 7.8 5.54E-07 1.23E-06 0.18 0.41
1 to <2 years 0.22 0.64 11.4 2.32E-07 6.74E-07 0.08 0.22
2 to <6 years 0.27 0.70 17.4 1.86E-07 4.83E-07 0.06 0.16
6 to <11 years 0.37 1.00 31.8 1.40E-07 3.77E-07 0.05 0.13
11 to <16 years 0.46 1.41 56.8 9.72E-08 2.98E-07 0.03 0.10
16 to <21 years 0.55 1.75 71.6 9.22E-08 2.93E-07 0.03 0.10
Adults (≥21 years) 0.88 2.21 80 1.32E-07 3.32E-07 0.04 0.11
Pregnant women 0.62 1.85 73 1.02E-07 3.04E-07 0.03 0.10
Lactating women 1.19 2.56 73 1.96E-07 4.21E-07 0.07 0.14
Abbreviations: µg/L = micrograms per liter; CTE =central tendency exposure multiplied by 5/7 to account for less than residential exposures; kg = kilogram; L = liter; mg = milligram; mg/kg/day = milligrams of chemical per kilogram of body weight per day; RME = reasonable maximum exposure multiplied by 5/7 to account for less than residential exposures.
A-21
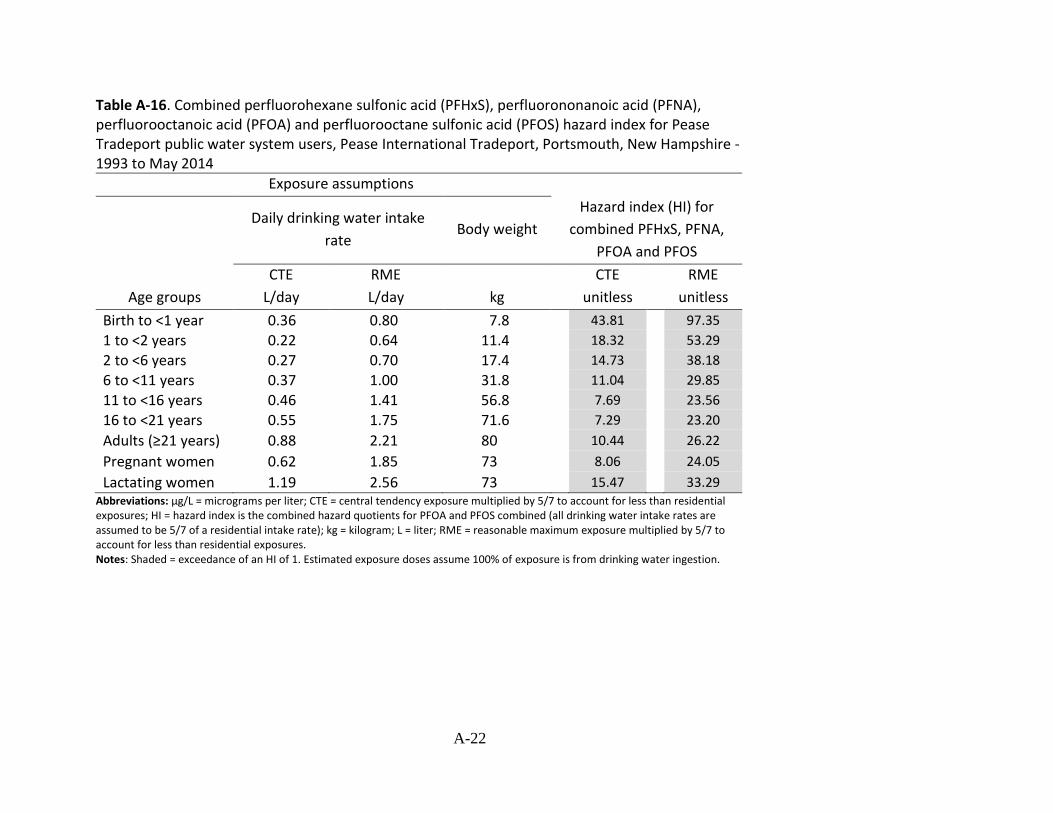
Table A-16. Combined perfluorohexane sulfonic acid (PFHxS), perfluorononanoic acid (PFNA), perfluorooctanoic acid (PFOA) and perfluorooctane sulfonic acid (PFOS) hazard index for Pease Tradeport public water system users, Pease International Tradeport, Portsmouth, New Hampshire -1993 to May 2014
Exposure assumptions
Daily drinking water intake
rate Body weight
Hazard index (HI) for
combined PFHxS, PFNA,
PFOA and PFOS
CTE RME CTE RME
Age groups L/day L/day kg unitless unitless
Birth to <1 year 1 to <2 years 2 to <6 years 6 to <11 years 11 to <16 years 16 to <21 years
Adults (≥21 years) Pregnant women
Lactating women
0.36 0.22 0.27 0.37 0.46 0.55
0.88
0.62
1.19
0.80 0.64 0.70 1.00 1.41 1.75
2.21
1.85
2.56
7.8 11.4 17.4 31.8 56.8 71.6
80
73
73
43.81
18.32
14.73
11.04
7.69
7.29
10.44
8.06
15.47
97.35
53.29
38.18
29.85
23.56
23.20
26.22
24.05
33.29 Abbreviations: µg/L = micrograms per liter; CTE = central tendency exposure multiplied by 5/7 to account for less than residential exposures; HI = hazard index is the combined hazard quotients for PFOA and PFOS combined (all drinking water intake rates are assumed to be 5/7 of a residential intake rate); kg = kilogram; L = liter; RME = reasonable maximum exposure multiplied by 5/7 to account for less than residential exposures. Notes: Shaded = exceedance of an HI of 1. Estimated exposure doses assume 100% of exposure is from drinking water ingestion.
A-22
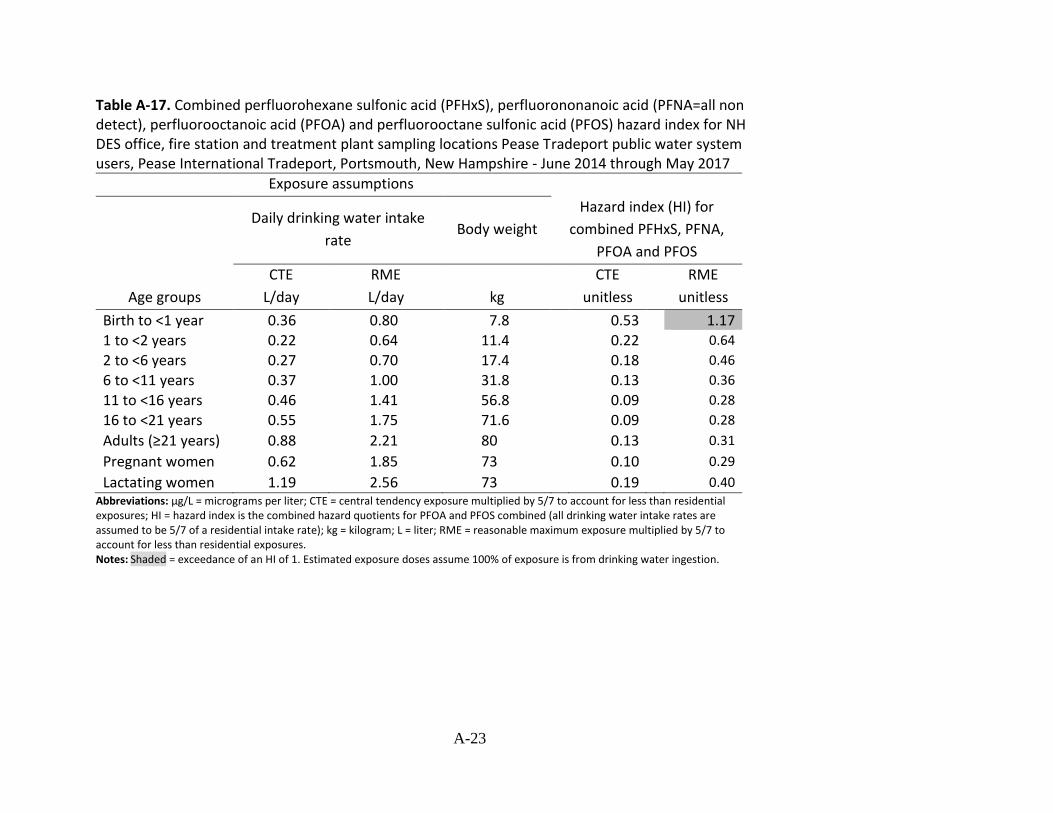
Table A-17. Combined perfluorohexane sulfonic acid (PFHxS), perfluorononanoic acid (PFNA=all non detect), perfluorooctanoic acid (PFOA) and perfluorooctane sulfonic acid (PFOS) hazard index for NH DES office, fire station and treatment plant sampling locations Pease Tradeport public water system users, Pease International Tradeport, Portsmouth, New Hampshire - June 2014 through May 2017
Exposure assumptions
Daily drinking water intake
rate Body weight
Hazard index (HI) for
combined PFHxS, PFNA,
PFOA and PFOS
CTE RME CTE RME
Age groups L/day L/day kg unitless unitless
Birth to <1 year 1 to <2 years 2 to <6 years 6 to <11 years
11 to <16 years 16 to <21 years
Adults (≥21 years) Pregnant women
Lactating women
0.36 0.22 0.27 0.37 0.46 0.55
0.88
0.62
1.19
0.80 0.64 0.70 1.00 1.41 1.75
2.21
1.85
2.56
7.8 11.4 17.4 31.8 56.8 71.6
80
73
73
0.53 0.22 0.18 0.13 0.09 0.09
0.13
0.10
0.19
1.17 0.64
0.46
0.36
0.28
0.28
0.31
0.29
0.40 Abbreviations: µg/L = micrograms per liter; CTE = central tendency exposure multiplied by 5/7 to account for less than residential exposures; HI = hazard index is the combined hazard quotients for PFOA and PFOS combined (all drinking water intake rates are assumed to be 5/7 of a residential intake rate); kg = kilogram; L = liter; RME = reasonable maximum exposure multiplied by 5/7 to account for less than residential exposures. Notes: Shaded = exceedance of an HI of 1. Estimated exposure doses assume 100% of exposure is from drinking water ingestion.
A-23
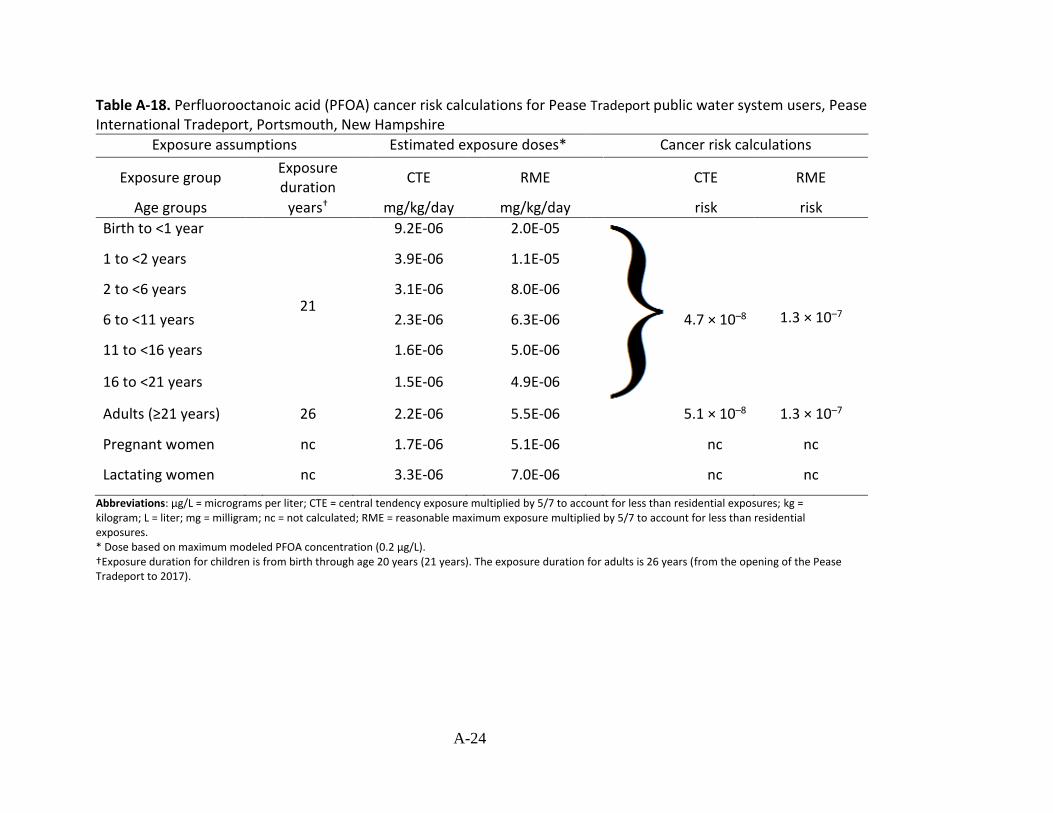
Table A-18. Perfluorooctanoic acid (PFOA) cancer risk calculations for Pease Tradeport public water system users, Pease International Tradeport, Portsmouth, New Hampshire
Exposure assumptions Estimated exposure doses* Cancer risk calculations
Exposure Exposure group CTE RME CTE RME
duration
Age groups † years mg/kg/day mg/kg/day risk risk
Birth to <1 year 9.2E-06 2.0E-05
1 to <2 years 3.9E-06 1.1E-05
2 to <6 years 3.1E-06 8.0E-06
6 to <11 years 21
2.3E-06 6.3E-06 4.7 × 10⁻⁸ 1.3 × 10⁻⁷
11 to <16 years 1.6E-06 5.0E-06
16 to <21 years 1.5E-06 4.9E-06
Adults (≥21 years) 26 2.2E-06 5.5E-06 5.1 × 10⁻⁸ 1.3 × 10⁻⁷
Pregnant women nc 1.7E-06 5.1E-06 nc nc
Lactating women nc 3.3E-06 7.0E-06 nc nc
Abbreviations: µg/L = micrograms per liter; CTE = central tendency exposure multiplied by 5/7 to account for less than residential exposures; kg = kilogram; L = liter; mg = milligram; nc = not calculated; RME = reasonable maximum exposure multiplied by 5/7 to account for less than residential exposures. * Dose based on maximum modeled PFOA concentration (0.2 µg/L). †Exposure duration for children is from birth through age 20 years (21 years). The exposure duration for adults is 26 years (from the opening of the Pease Tradeport to 2017).
A-24

Table A-19. Perfluorooctanoic acid (PFOA) environmental exposure assumptions, estimated exposure doses, and hazard quotients for NH DES office, fire station and treatment plant sampling locations Pease Tradeport public water system users, Pease International Tradeport, Portsmouth, New Hampshire - June 2014 through May 2017
Exposure Assumptions
Age groups
Daily drinking
water intake
rate
CTE RME
L/day L/day
Body weight
kg
Dose based on the maximum
modeled concentration of
PFOA = 0.0073 µg/L
CTE RME
mg/kg/day mg/kg/day
Hazard quotient for
PFOA (dose divided by
the Intermediate
provisional MRL)
CTE RME
unitless unitless
Birth to <1 year 0.36 0.80 7.8 3.37E-07 7.49E-07 0.11 0.25
1 to <2 years 0.22 0.64 11.4 1.41E-07 4.10E-07 0.05 0.14
2 to <6 years 0.27 0.70 17.4 1.13E-07 2.94E-07 0.04 0.10
6 to <11 years 0.37 1.00 31.8 8.49E-08 2.30E-07 0.03 0.08
11 to <16 years 0.46 1.41 56.8 5.91E-08 1.81E-07 0.02 0.06
16 to <21 years 0.55 1.75 71.6 5.61E-08 1.78E-07 0.02 0.06
Adults (≥21 years) 0.88 2.21 80 8.03E-08 2.02E-07 0.03 0.07
Pregnant women 0.62 1.85 73 6.20E-08 1.85E-07 0.02 0.06
Lactating women 1.19 2.56 73 1.19E-07 2.56E-07 0.04 0.09
Abbreviations: µg/L = micrograms per liter; CTE =central tendency exposure multiplied by 5/7 to account for less than residential exposures; kg = kilogram; L = liter; mg = milligram; mg/kg/day = milligrams of chemical per kilogram of body weight per day; RME = reasonable maximum exposure multiplied by 5/7 to account for less than residential exposures.
A-25

Table A-20. Perfluorohexane sulfonic acid (PFHxS) environmental exposure assumptions, estimated exposure doses, and hazard quotients for NH DES office, fire station and treatment plant sampling locations Pease Tradeport public water system users, Pease International Tradeport, Portsmouth, New Hampshire - June 2014 through May 2017
Exposure Assumptions Dose based on the maximum Hazard quotient for
Daily drinking water
intake rate
Body
weight
modeled concentration of
PFHxS= 0.019 µg/L
PFHxS (dose divided by
the Intermediate
provisional MRL)
CTE RME CTE RME CTE RME
Age groups L/day L/day kg mg/kg/day mg/kg/day unitless unitless
Birth to <1 year 0.36 0.80 7.8 8.77E-07 1.95E-06 0.04 0.10
1 to <2 years 0.22 0.64 11.4 3.67E-07 1.07E-06 0.02 0.05
2 to <6 years 0.27 0.70 17.4 2.95E-07 7.64E-07 0.01 0.04
6 to <11 years 0.37 1.00 31.8 2.21E-07 5.97E-07 0.01 0.03
11 to <16 years 0.46 1.41 56.8 1.54E-07 4.72E-07 0.01 0.02
16 to <21 years 0.55 1.75 71.6 1.46E-07 4.64E-07 0.01 0.02
Adults (≥21 years) 0.88 2.21 80 2.09E-07 5.25E-07 0.01 0.03
Pregnant women 0.62 1.85 73 1.61E-07 4.82E-07 0.01 0.02
Lactating women 1.19 2.56 73 3.10E-07 6.66E-07 0.02 0.03
Abbreviations: µg/L = micrograms per liter; CTE =central tendency exposure multiplied by 5/7 to account for less than residential exposures; kg = kilogram; L = liter; mg = milligram; mg/kg/day = milligrams of chemical per kilogram of body weight per day; RME = reasonable maximum exposure multiplied by 5/7 to account for less than residential exposures.
A-26

Equations
Equation 1. Estimating the lifetime excess cancer risk for perfluorooctanoic acid (PFOA) in drinking water.
Lifetime excess cancer risk mg mg −1
kg kg Exposure dose ( ) × Exposure time (years) × Oral cancer slope factor ( )
day day
= 78 years
Equation 2. Reasonable maximum exposure concentration calculation approach.
Reasonable maximum exposure 5 L µg
× Upper percentile drinking water intake ( ) × Exposure point concentration ( ) 7 day L =
Body weight (kg) × 1,000
Equation 3. Central tendency exposure concentration calculation approach.
5 L µg × Mean drinking water intake ( ) × Exposure point concentration ( ) 7 day L
Central tendency exposure = Body weight (kg) × 1,000
A-27
Appendix B. Estimating Concentrations of Per- and Polyfluoroalkyl Substances (PFAS) in the
Pease Tradeport Public Drinking Water
Prepared by:
Agency for Toxic Substances and Disease Registry
U.S. Department of Health and Human Services
Atlanta, Georgia
B-1
List of Abbreviations and Acronyms
ATSDR Agency for Toxic Substances and Disease Registry EPA (United States) Environmental Protection Agency gpm gallons per minute µg/L micrograms per liter NHDES New Hampshire Department of Environmental Services PFAS per- and polyfluoroalkyl substances PFBS perfluorobutane sulfonate PFDeA perfluorodecanoic acid PFDoA perfluorododecanoic acid PFHpA perfluoroheptanoic acid PFHxA perfluorohexanoic acid PFHxS perfluorohexane sulfonic acid PFNA perfluorononanoic acid PFOA perfluorooctanoic acid PFOS perfluorooctane sulfonate PFPeA perfluoropentanoic acid PFUnA perfluoroundecanoic acid PWTF Pease Water Treatment Facility
B-2

Abstract
The New Hampshire Department of Environmental Services (NHDES) Bureau of
Hazardous Waste Remediation asked the Agency for Toxic Substances and Disease Registry
(ATSDR) to evaluate past and current exposures to per- and polyfluoroalkyl substances (PFAS) in
the Pease Tradeport public water supply. ATSDR used the estimated concentrations of PFAS
from Appendix B to conduct the health consultation presented in the main section of this
report.
Three water supply wells have been the primary sources of drinking water for the Pease
International Tradeport at Portsmouth, New Hampshire. Before 1985, when the Pease Water
Treatment Facility (PWTF) was built, water from each well was chemically treated and
introduced directly into the Pease water distribution system. After the PWTF was built, water
from all three water supply wells was mixed at the water treatment facility. PWTF added
chlorine and fluoride to the water before delivery to customers. This appendix summarizes
ATSDR’s analyses of estimated concentrations of PFAS in public drinking water delivered by the
PWTF to the public between January 2003 and August 2015. The approach used to estimate
average monthly concentrations of PFAS in drinking water at Pease International Tradeport
during the past 13 to 14 years included computing flow-weighted average concentrations of
PFAS using a materials mass balance (simple mixing) model.
Background
(see main report)
Historical Operation
The Pease Tradeport water system takes water from three wells (Haven, Smith, and
Harrison), chemically treats it, and pumps it directly into the distribution system. The PWTF,
built in 1985, combines water from supply wells, adds chlorine and fluoride, and pipes the
treated water to customers. The water system was transferred from the U.S. Air Force to the
Pease Development Authority in the early 1990s. The City of Portsmouth, New Hampshire,
assumed operation responsibilities through an agreement with the authority in 1993. The
system type is non-transient non-community water system with a commercial population of
customers. A non-transient non-community water system is a public water system that
regularly supplies water to at least 25 of the same people at least six months per year. The
system did not serve residential customers until early May 2014, when service was extended to
a portion of the Town of Newington, just before shutdown of the Haven well.
On May 12, 2014, the NHDES shut down the Haven well because levels of
perfluorooctane sulfonate (PFOS) were above the 2009 EPA provisional health advisory level of
B-3

0.2 µg/L for PFOS. The science has evolved since 2009, and EPA replaced the provisional
advisories with new, lifetime health advisories in 2016. The Haven, Smith, and Harrison water
supply wells were the primary sources of drinking water for the Pease Tradeport water system.
The Harrison well was offline for several years until it was redeveloped and new equipment was
installed in 2006 to reactivate the well. During water supply well maintenance and when the
Pease system needed more water, water was pumped from the Portsmouth water system. On
occasion, when emergency backup water was needed, valves were opened to provide water
from the PWTF to the Portsmouth system. After the Haven well was taken out of service in May
2014, water from the Smith and Harrison wells has been supplemented with water from the
Portsmouth system via booster pumps at the PWTF where the water is mixed.
In 1953, the Army Corps of Engineers rebuilt the Haven well, which was initially
developed in 1870. The Haven well has a rated capacity of about 450 gallons per minute (gpm),
but is no longer being used. Pump testing in the 1990s set the well’s sustained capacity at 534
gpm. The Smith well was installed in 1958 as part of the water system for Pease Air Force Base.
The Smith well capacity is approximately 250 gpm. It supplies nearly 31% of the drinking water
to the PWTF. The Harrison well, originally built in 1957, was redeveloped in June 2006. The
Harrison well has a capacity of around 225 gpm. It provides about 25% of the drinking water to
the PWTF. The remaining 44% of Pease public drinking water comes from two 450 gpm booster
pumps that supply the Pease PWTF with drinking water from the Portsmouth water system (B.
Goetz, City of Portsmouth Department of Public Works, email to Jason Sautner, ATSDR Division
of Community Health Investigations, Science Support Branch, May 11, 2015). Table B-1 lists the
average percent of drinking water provided to the PWTF from each source for distinct intervals
between 1994 and 2014.
B-4
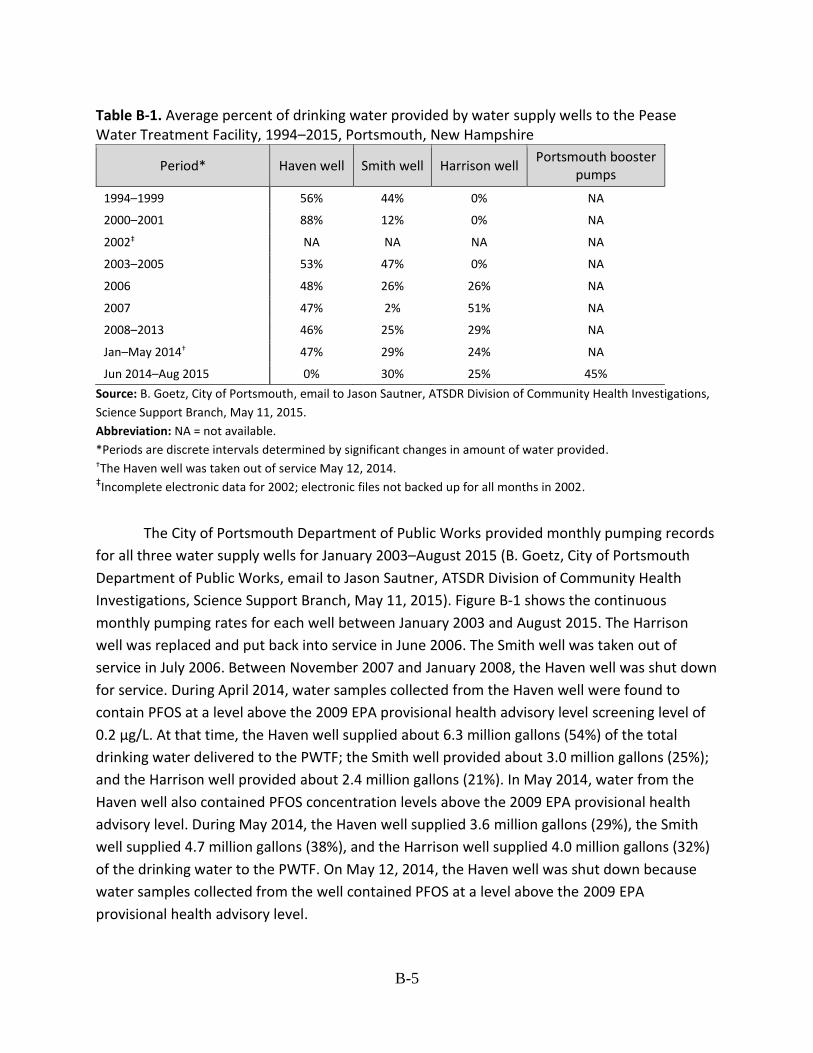
Table B-1. Average percent of drinking water provided by water supply wells to the Pease Water Treatment Facility, 1994–2015, Portsmouth, New Hampshire
Period* Haven well Smith well Harrison well Portsmouth booster
pumps
1994–1999
2000–2001
2002‡
2003–2005
2006
2007
2008–2013
Jan–May 2014†
Jun 2014–Aug 2015
56%
88%
NA
53%
48%
47%
46%
47%
0%
44%
12%
NA
47%
26%
2%
25%
29%
30%
0%
0%
NA
0%
26%
51%
29%
24%
25%
NA
NA
NA
NA
NA
NA
NA
NA
45%
Source: B. Goetz, City of Portsmouth, email to Jason Sautner, ATSDR Division of Community Health Investigations,
Science Support Branch, May 11, 2015.
Abbreviation: NA = not available.
*Periods are discrete intervals determined by significant changes in amount of water provided. †The Haven well was taken out of service May 12, 2014. ‡Incomplete electronic data for 2002; electronic files not backed up for all months in 2002.
The City of Portsmouth Department of Public Works provided monthly pumping records
for all three water supply wells for January 2003–August 2015 (B. Goetz, City of Portsmouth
Department of Public Works, email to Jason Sautner, ATSDR Division of Community Health
Investigations, Science Support Branch, May 11, 2015). Figure B-1 shows the continuous
monthly pumping rates for each well between January 2003 and August 2015. The Harrison
well was replaced and put back into service in June 2006. The Smith well was taken out of
service in July 2006. Between November 2007 and January 2008, the Haven well was shut down
for service. During April 2014, water samples collected from the Haven well were found to
contain PFOS at a level above the 2009 EPA provisional health advisory level screening level of
0.2 µg/L. At that time, the Haven well supplied about 6.3 million gallons (54%) of the total
drinking water delivered to the PWTF; the Smith well provided about 3.0 million gallons (25%);
and the Harrison well provided about 2.4 million gallons (21%). In May 2014, water from the
Haven well also contained PFOS concentration levels above the 2009 EPA provisional health
advisory level. During May 2014, the Haven well supplied 3.6 million gallons (29%), the Smith
well supplied 4.7 million gallons (38%), and the Harrison well supplied 4.0 million gallons (32%)
of the drinking water to the PWTF. On May 12, 2014, the Haven well was shut down because
water samples collected from the well contained PFOS at a level above the 2009 EPA
provisional health advisory level.
B-5

0
2
4
6
8
10
12
14
16 M
illio
n G
allo
ns
Haven well shut down for service November 2007 to January 2008
Date
Haven Well Smith Well Harrison Well
Figure B-1. Monthly pumping rates for Pease International Tradeport water supply wells, January 2003–August 2015, Portsmouth, New Hampshire.
Modeling Approach to Estimate PFAS Concentrations
From 1985 until May 12, 2014, when the Haven well was shut down, groundwater from
the Haven, Smith, and Harrison water supply wells was mixed at the PWTF before distribution
to customers. Therefore, ATSDR used a materials mass balance (simple mixing) model to
compute levels of PFAS in drinking water delivered to Pease International Tradeport customers
during April and May 2014. The model is based on the principles of continuity and conservation
of mass [Masters 1998]. Application of the simple mixing model presumes that the computed
PFAS concentrations of water at the PWTF are nearly equal to those at any location throughout
the water distribution system. Figure B-2 shows a schematic diagram of the mixing model
approach. The model is a sufficiently accurate and useful method to compute drinking water
concentrations at the PWTF and at locations serviced by the PWTF for any given month. Maslia
et al. [2009] provide further details and comparison of mixing models and complex, numerical
water distribution system models.
B-6

Figure B-2. Schematic representation of the mixing model approach used for the Pease International Tradeport water system analysis (modified from Maslia et al. 2013)
To compute weighted-average PFAS concentrations, ATSDR weighted PFAS
concentrations measured in April and May 2014 at each water supply well by the respective
well discharge during the month. These weighted-average concentrations are the likely average
concentrations of PFAS distributed through the Pease water system for any day during April and
May 2014.
B-7

Using the concentrations of PFAS at the three water supply wells and well pumping
rates, ATSDR calculated levels of PFAS at the PWTF and locations serviced by the PWTF with the
following mixing model:
𝑛 ∑ 𝑗=1 𝑞𝑖𝑗𝑐𝑖𝑗 𝐶𝑖 = ,
𝑄𝑇𝑖
where Ci = the concentration of PFAS at the PWTF for month i (ML-3); n = the total number of active water supply wells for month i; qij = the pumping rate of well j for month i (L3T-1); cij = the concentration of PFAS at water supply well j for month i (ML-3); and QTi = is the total water demand for month i (L3T-1).
Within those factors, M = mass (e.g., μg), L = length (e.g., meter or foot), and T = time (e.g., day).
Table B-2 lists estimated average monthly concentrations of PFAS calculated for April
and May 2014 at the PWTF and locations serviced by the PWTF. The calculated combined
perfluorooctanoic acid (PFOA) and PFOS average monthly concentration of 1.55 µg/L in drinking
water at any location throughout the Pease water distribution system during April 2014
exceeded the EPA lifetime health advisory level of 0.07 µg/L. The computed combined PFOA
and PFOS average monthly concentration of 0.82 µg/L during May 2014 also exceeded the EPA
lifetime health advisory.
B-8
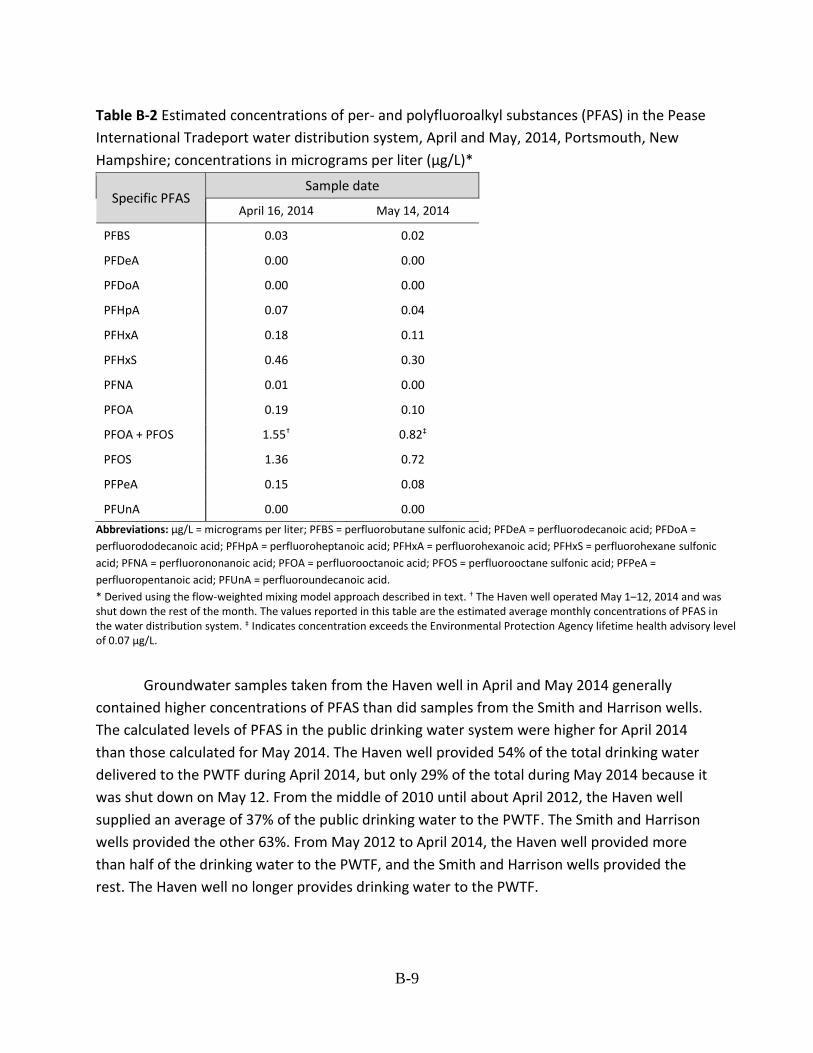
Table B-2 Estimated concentrations of per- and polyfluoroalkyl substances (PFAS) in the Pease
International Tradeport water distribution system, April and May, 2014, Portsmouth, New
Hampshire; concentrations in micrograms per liter (µg/L)*
Specific PFAS Sample date
April 16, 2014 May 14, 2014
PFBS 0.03 0.02
PFDeA 0.00 0.00
PFDoA 0.00 0.00
PFHpA 0.07 0.04
PFHxA 0.18 0.11
PFHxS 0.46 0.30
PFNA 0.01 0.00
PFOA 0.19 0.10
PFOA + PFOS 1.55† 0.82‡
PFOS 1.36 0.72
PFPeA 0.15 0.08
PFUnA 0.00 0.00
Abbreviations: µg/L = micrograms per liter; PFBS = perfluorobutane sulfonic acid; PFDeA = perfluorodecanoic acid; PFDoA =
perfluorododecanoic acid; PFHpA = perfluoroheptanoic acid; PFHxA = perfluorohexanoic acid; PFHxS = perfluorohexane sulfonic
acid; PFNA = perfluorononanoic acid; PFOA = perfluorooctanoic acid; PFOS = perfluorooctane sulfonic acid; PFPeA =
perfluoropentanoic acid; PFUnA = perfluoroundecanoic acid.
* Derived using the flow-weighted mixing model approach described in text. † The Haven well operated May 1–12, 2014 and was shut down the rest of the month. The values reported in this table are the estimated average monthly concentrations of PFAS in the water distribution system. ‡ Indicates concentration exceeds the Environmental Protection Agency lifetime health advisory level of 0.07 µg/L.
Groundwater samples taken from the Haven well in April and May 2014 generally
contained higher concentrations of PFAS than did samples from the Smith and Harrison wells.
The calculated levels of PFAS in the public drinking water system were higher for April 2014
than those calculated for May 2014. The Haven well provided 54% of the total drinking water
delivered to the PWTF during April 2014, but only 29% of the total during May 2014 because it
was shut down on May 12. From the middle of 2010 until about April 2012, the Haven well
supplied an average of 37% of the public drinking water to the PWTF. The Smith and Harrison
wells provided the other 63%. From May 2012 to April 2014, the Haven well provided more
than half of the drinking water to the PWTF, and the Smith and Harrison wells provided the
rest. The Haven well no longer provides drinking water to the PWTF.
B-9

Estimated Past Concentrations of PFAS in Drinking Water
ATSDR used a simple mixing model to estimate average monthly concentrations of PFAS
in the drinking water for the 11 compounds detected in the three water supply wells. The
model used monthly pumping rates from January 2003–April 2014 (see Figure B-1) for each
water supply well, along with PFAS concentrations measured at each well in April 2014 (Table
B-3). To estimate average monthly concentrations of PFAS in drinking water, the model used
pumping rates from May 2014–August 2015 for each water supply well and the highest PFAS
concentrations measured at each well during the month. Figure B-3 shows the monthly
estimated drinking water concentrations from January 2003–August 2015 for the 11 PFAS
detected in the three water supply wells. The highest estimated concentration of PFOS in
drinking water was 1.71 µg/L in December 2012 and January 2013. The highest estimated PFOA
and perfluorohexane sulfonate (PFHxS) concentrations during the same months were 0.24 µg/L
and 0.57 µg/L, respectively. Drinking water concentrations for the remaining eight PFAS
detected were at or below 0.2 µg/L. In November 2007, December 2007, and January 2008, the
estimated drinking water concentrations for all 11 PFAS were below 0.05 µg/L because the
Haven well was shut down for service during these months. Because the Haven well was taken
out of service on May 12, 2014, estimated concentrations of PFAS in drinking water during June
2014–August 2015 were less than 0.02 µg/L.
B-10
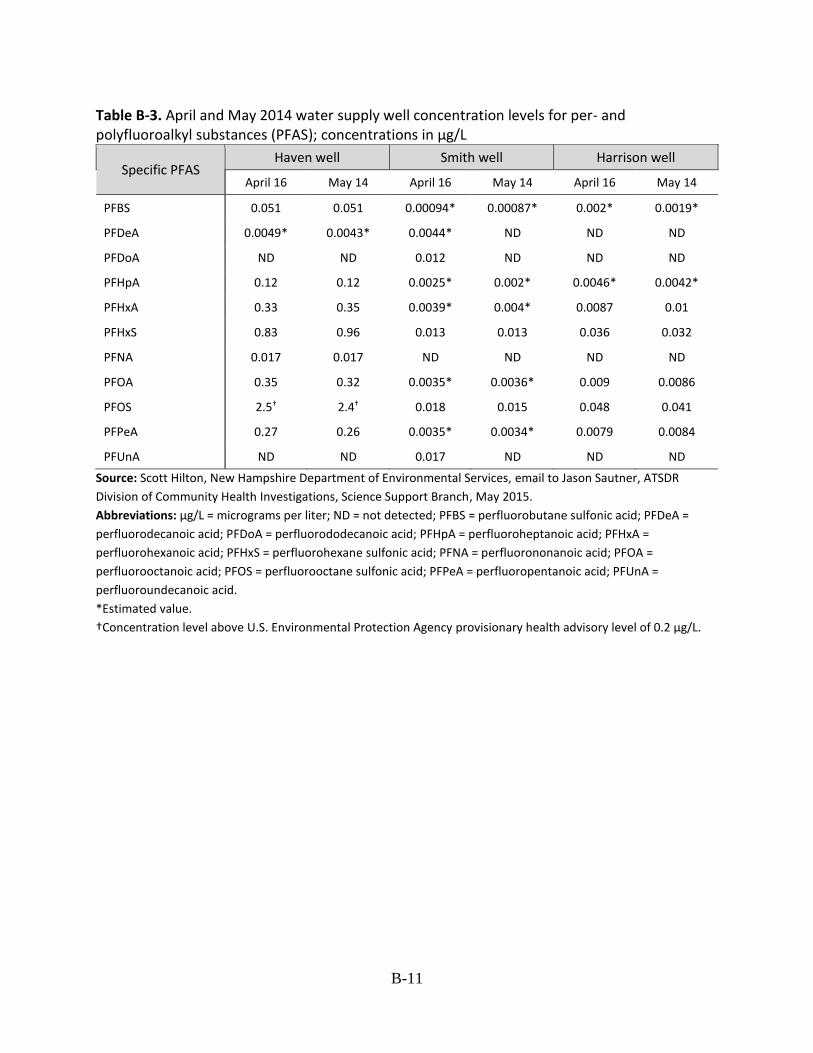
Table B-3. April and May 2014 water supply well concentration levels for per- and polyfluoroalkyl substances (PFAS); concentrations in µg/L
Specific PFAS Haven well Smith well Harrison well
April 16 May 14 April 16 May 14 April 16 May 14
PFBS 0.051 0.051 0.00094* 0.00087* 0.002* 0.0019*
PFDeA 0.0049* 0.0043* 0.0044* ND ND ND
PFDoA ND ND 0.012 ND ND ND
PFHpA 0.12 0.12 0.0025* 0.002* 0.0046* 0.0042*
PFHxA 0.33 0.35 0.0039* 0.004* 0.0087 0.01
PFHxS 0.83 0.96 0.013 0.013 0.036 0.032
PFNA 0.017 0.017 ND ND ND ND
PFOA 0.35 0.32 0.0035* 0.0036* 0.009 0.0086
PFOS 2.5† 2.4† 0.018 0.015 0.048 0.041
PFPeA 0.27 0.26 0.0035* 0.0034* 0.0079 0.0084
PFUnA ND ND 0.017 ND ND ND
Source: Scott Hilton, New Hampshire Department of Environmental Services, email to Jason Sautner, ATSDR
Division of Community Health Investigations, Science Support Branch, May 2015.
Abbreviations: µg/L = micrograms per liter; ND = not detected; PFBS = perfluorobutane sulfonic acid; PFDeA =
perfluorodecanoic acid; PFDoA = perfluorododecanoic acid; PFHpA = perfluoroheptanoic acid; PFHxA =
perfluorohexanoic acid; PFHxS = perfluorohexane sulfonic acid; PFNA = perfluorononanoic acid; PFOA =
perfluorooctanoic acid; PFOS = perfluorooctane sulfonic acid; PFPeA = perfluoropentanoic acid; PFUnA =
perfluoroundecanoic acid.
*Estimated value.
†Concentration level above U.S. Environmental Protection Agency provisionary health advisory level of 0.2 µg/L.
B-11

Figure B-3. Monthly estimated drinking water concentrations in the Pease water distribution system between January 2003 and August 2015 for the 11 per- and polyfluoroalkyl substances (PFAS) detected in water supply wells. Estimated values derived by using flow-weighted mixing model approach and measured concentrations of PFAS in Pease water supply wells during April 2014.
Abbreviations: µg/L = micrograms per liter; PFBS = perfluorobutane sulfonic acid; PFDA = perfluorodecanoic acid; PFDoA = perfluorododecanoic acid; PFHpA = perfluoroheptanoic acid; PFHxA = perfluorohexanoic acid; PFHxS = perfluorohexane sulfonic acid; PFNA = perfluorononanoic acid; PFOA = perfluorooctanoic acid; PFOS = perfluorooctane sulfonic acid; PFPeA = perfluoropentanoic acid; PFUnA = perfluoroundecanoic acid.
Based on estimated values derived by using the flow-weighted mixing model approach
and measured concentrations of PFAS from April 2014, ATSDR estimated the combined PFOA
and PFOS concentrations at the PWTF and in public drinking water for 2003 through 2015
(Figure B-3). Estimates for the last 3 to 4 years are the most reliable. The average monthly flow
concentration peaked at about 2.0 µg/L in December 2012 and January 2013.
The flow-weighted mixing model approach is effective and efficient in estimating recent
concentrations of PFOA and PFOS because water from all three supply wells was mixed at the
PWTF during April 2014 before being delivered to Pease customers. The flow-weighted mixing
B-12

model is also effective in estimating concentrations of PFOA and PFOS in the public drinking
water from 2003 through 2011 because PFOA and PFOS are extremely resistant to breakdown.
The concentrations of PFOA and PFOS measured in the water supply wells in April 2014
are thought to represent concentrations between 2003 and 2011 because PFOA and PFOS
persist in the environment [MDH 2005]. These estimations are based on measured
concentrations of PFAS in April 2014. Having detailed historical water system operational data
and measured PFAS concentrations closer to the year 2003 could help verify the reliability of
the model and might help improve the model results. ATSDR currently lacks all the information
needed to improve the model results, thus has not committed to additional modeling.
Figure B-4 shows the monthly estimated combined drinking water concentrations of
PFOA and PFOS during January 2003–August 2015. The highest estimated combined
concentration was 2.0 µg/L in December 2012 and January 2013. The only times the combined
concentrations of PFOA and PFOS were below the EPA lifetime health advisory of 0.7 µg/L were
when the Haven well was shut down during November 2007–January 2008, and when the
Haven well was taken out of service in May 2014.
B-13

Figure B-4. Monthly estimated combined drinking water concentrations in the Pease water distribution system for perfluorooctanoic acid (PFOA) and perfluorooctane sulfonate (PFOS) detected in water supply wells, January 2003–August 2015, Portsmouth, New Hampshire. Estimated values derived by using flow-weighted mixing model approach and measured concentrations of per- and polyfluoroalkyl substances (PFAS) in Pease International Tradeport water supply wells during April 2014. USEPA LTHA = U.S. Environmental Protection Agency lifetime health advisory level of 0.07 µg/L.
Abbreviations: µg/L = micrograms per liter; PFOA = perfluorooctanoic acid; PFOS = perfluorooctane sulfonic acid;
USEPA LTHA = U.S. Environmental Protection Agency Lifetime Health Advisory.
Table B-4 lists the average percent of drinking water provided to the PWTF from each of
the wells for discrete intervals during 2003–2015. The discrete periods shown in the tables
reflect significant changes in the percent of drinking water the Haven well supplies to the Pease
water system. New periods were selected when a significant change occurred in the amount of
water the Haven well supplied to the PWTF. The Haven well was shut down on May 12, 2014,
immediately after NHDES notified the City of Portsmouth that water samples collected from the
well contained PFOS at a level above the 2009 EPA provisional health advisory level.
B-14

Table B-5 lists estimated maximum concentrations and estimated geometric mean
concentrations for the 11 compounds detected in drinking water at Pease International
Tradeport. The highest estimated PFAS concentrations were when the Haven well supplied
around 50% of the drinking water to the PWTF. The highest estimated combined concentration
of PFOA and PFOS in drinking water was 2.0 µg/L in December 2012 and January 2013. Between
June 2014 and August 2015, estimated concentrations of PFAS in drinking water were less than
0.02 µg/L because the Haven well was taken out of service on May 12, 2014. ATSDR estimated
the values by using the flow-weighted mixing model approach and measured concentrations of
PFAS in Pease water supply wells during April 2014.
Table B-4. Average percent of drinking water provided by water sources to the Pease Water
Treatment Facility, January 2003–August 2015, Portsmouth, New Hampshire
Water Source
Haven
Smith
Harrison
Portsmouth Booster
Period*
Jan 2003 – Nov 2007 – Feb 2008 – Sep 2010 – May 2012 – Jun 2014 – Oct 2007 Jan 2008 Aug 2010 Apr 2012 May 2014† Aug 2015‡
51% 0% 48% 37% 52% 0%
35% 30% 23% 30% 23% 30%
14% 70% 29% 33% 25% 25%
NA NA NA NA NA 45%
Source: B. Goetz, City of Portsmouth Department of Public Works, email to Jason Sautner, ATSDR Division of
Community Health Investigations, Science Support Branch, May 11, 2015.
Abbreviation: NA = not available.
* Periods are discrete intervals determined by significant changes in amount of water provided. † Haven well taken out of service May 12, 2014. ‡ Pease water system supplemented with water from Portsmouth water system.
B-15

Table B-5. Estimated maximum and geometric mean concentrations of per- and polyfluoroalkyl
substances (PFAS) in the Pease water distribution system, January 2003–August 2015,
Portsmouth, New Hampshire; concentrations in micrograms per liter (µg/L)*
Specifi c PFAS
Period†
Jan 2 003 – Oct 2007
MAX¶ GM¶
Nov 2007 – Jan 2008
MAX GM
Feb 2 008 – Aug 2010
MAX GM
Sep 2 010 – Apr 2012
MAX GM
May 2012 – May 2014‡
MAX GM
Jun 2 014 – 2015§ Aug
MAX GM
PFBS
PFDeA
PFDoA
PFHpA
PFHxA
PFHxS
PFNA
PFOA
PFOA + PFOS
PFOS
PFPeA
0.03
<0.01
0.01
0.08
0.22
0.57
0.01
0.24
1.94††
1.70
0.18
0.01
0.03
<0.01
<0.01**
0.06
0.17
0.43
0.01
0.18
1.47††
1.29
0.14
<0.01**
<0.01
<0.01
0.01
<0.01
0.01
0.04
0.00
0.01
0.06
0.05
0.01
0.01
<0.01
<0.01**
<0.01**
<0.01
0.01
0.03
0.00
0.01
0.05
0.04
0.01
<0.01**
0.03
<0.01
<0.01
0.07
0.18
0.46
0.01
0.19
1.56††
1.37
0.15
0.01
0.02
<0.01
<0.01
0.06
0.16
0.41
0.01
0.17
1.37††
1.20
0.13
<0.01
0.03
<0.01
0.01
0.06
0.17
0.44
0.01
0.18
1.47††
1.29
0.14
0.01
0.02
<0.01
<0.01
0.05
0.13
0.32
0.01
0.13
1.07††
0.94
0.10
0.01
0.04
<0.01
<0.01
0.08
0.23
0.57
0.01
0.24
1.95††
1.71
0.19
0.01
0.03
<0.01
<0.01**
0.06
0.17
0.44
0.01
0.18
1.47††
1.29
0.14
<0.01**
<0.01
<0.01
0.00
<0.01
0.01
0.02
0.01
<0.01
0.02
0.02
0.01
<0.01
<0.01**
<0.01**
0.00
<0.01**
<0.01
0.01
<0.01**
<0.01
0.01
0.01
<0.01
<0.01** PFUnA
Abbreviations: MAX = maximum concentration; GM = geometric mean concentration; PFBS = perfluorobutane
sulfonic acid; PFDeA = perfluorodecanoic acid; PFDoA = perfluorododecanoic acid; PFHpA = perfluoroheptanoic
acid; PFHxA = perfluorohexanoic acid; PFHxS = perfluorohexane sulfonic acid; PFNA = perfluorononanoic acid;
PFOA = perfluorooctanoic acid; PFOS = perfluorooctane sulfonic acid; PFPeA = perfluoropentanoic acid; PFUnA =
perfluoroundecanoic acid.
* Derived using the flow-weighted mixing model approach described in text. † Periods are discrete intervals determined by significant changes in amount of water provided. ‡ Haven well taken out of service May 12, 2014. § Pease water system supplemented with water from Portsmouth water system. ¶ Estimated.
** The geometric mean was assumed to be <0.01 µg/L if the compound was detected in at least one sample but at
a level lower than 0.01 µg/L. †† Indicates concentration exceeds the U.S. Environmental Protection Agency lifetime health advisory level of 0.07
µg/L.
B-16

Discussion
ATSDR used measured concentrations of PFAS in the Pease water supply wells to
estimate concentrations of PFAS in drinking water for April and May 2014. ATSDR used a flow-
weighted mixing model to estimate average monthly concentrations in the drinking water for
2003 through 2014. The model used April 2014 measured concentrations of PFAS in the water
supply wells and monthly water supply well pumping rates from 2003–2014. Use of the simple
mixing model presumes that the computed concentrations at the PWTF are nearly equal to the
concentrations at any location throughout the water distribution system. The mixing model is
appropriate because the PWTF mixes water from the supply wells before distribution to
customers.
The mass balance (simple mixing) approach ATSDR used to compute PFAS
concentrations in drinking water delivered to Pease customers is based on the principles of
continuity and conservation of mass [Masters 1998]. Although the approach is efficient and
simple to use, it does include some simplifying assumptions. These assumptions include the
following:
1) Groundwater containing PFAS is uniformly and instantly mixed in a storage tank
(storage tank flow dynamics are not considered)
2) Measures of PFAS or any constituent are conservative and do not include
changes such as decay or biodegradation
3) Estimated concentrations of PFAS delivered to the distribution system represent
likely values or an average occurring on any day of the month
Having concentrations of PFAS measured closer to 2003 and detailed historical water
system operational data could help verify the reliability of the model and perhaps improve the
model results. Because all of the information needed to verify and improve the model results is
not available, no additional modeling is scheduled.
Conclusions
In April and May 2014, water from the Pease water system was tested and found to
contain several PFAS. Water from the Haven well contained 0.35 µg/L of PFOA and 2.5 µg/L of
PFOS during April 2014. Water from the Smith and Harrison wells contained PFOA and PFOS
concentration levels below the EPA lifetime health advisory of 0.07 µg/L. PFOA and PFOS were
also detected in water from the three water supply wells during both sampling dates, but at
levels below the EPA lifetime health advisory.
ATSDR used a flow-weighted mixing model to estimate average monthly concentrations
of PFAS in public drinking water. In December 2012 and January 2013, the highest estimated
B-17
PFOA and PFOS concentration in the drinking water were 0.24 µg/L and 1.71 µg/L, respectively.
The highest estimated combined PFOA and PFOS concentration of 2.0 µg/L exceeds the EPA
lifetime health advisory level of 0.07 µg/L. The highest estimated PFHxS concentration in
drinking water was 0.57 µg/L in December 2012 and January 2013, and the highest estimated
PFNA concentration was 0.012 µg/L in February 2003, December 2012, and January 2013. The
estimated drinking-water concentrations of PFAS in this modeling report will be used in the
ATSDR Pease Tradeport PWS health consultation.
B-18
References
Maslia ML, Suárez-Soto RJ, Wang J, Aral MM, Faye RE, Sautner JB, et al. 2009. Analyses of groundwater flow, contaminant fate and transport, and distribution of drinking water at Tarawa Terrace and vicinity, U.S. Marine Corps Base Camp Lejeune, North Carolina: Historical reconstruction and present-day conditions—Chapter I: Parameter sensitivity, uncertainty, and variability associated with model simulations of groundwater flow, contaminant fate and transport, and distribution of drinking water. Atlanta, GA: Agency for Toxic Substances and Disease Registry.
Maslia ML, Suárez-Soto RJ, Sautner JB, Anderson BA, Jones LE, Faye RE, et al. 2013. Analyses and historical reconstruction of groundwater flow, contaminant fate and transport, and distribution of drinking water within the service areas of the Hadnot Point and Holcomb Boulevard water treatment plants and vicinities, U.S. Marine Corps Base Camp Lejeune, North Carolina—Chapter A: Summary and findings. Atlanta, GA: Agency for Toxic Substances and Disease Registry.
Masters GM. 1998. Introduction to environmental engineering and science. 2nd ed. Upper Saddle River, NJ: Prentice-Hall.
[MDH] Minnesota Department of Health. 2005. Health consultation for 3M Chemolite perfluorochemical releases at the 3M – Cottage Grove Facility, City of Cottage Grove, Washington County, Minnesota. EPA Facility ID: MND006172969. February 18, 2005. Available from: https://www.atsdr.cdc.gov/hac/pha/3M-CGF021805-MN/3M-CGF021805-MN_pt1.pdf.
B-19
Appendix C - Responses to public comments
Comment 1: After reading the article in today’s Seacoast Online I find it interesting as I
worked on Pease at 2 International Drive and on New Hampshire Dr. from 1993 to 2008.
Ironically, one of my colleagues that had worked in the same office along with myself have
both been diagnosed with hyperthyroidism with Graves’ disease. I have no family history of
thyroid disease so this was a shocking diagnose. I’m currently being treated by an
Endocrinologist. I also am a very healthy, active 52 yr old that has a slightly high liver function
but no know (sic) cause of it per my Drs. further testing was also done to seek answers. It is
very ironic that in a very small office of maybe 10 of us that 2 of us have the same exact
thyroid disease. Knowing this can be triggered by environmental PFAS is concerning and
could be linked to that exposure for the many years we worked there.
Response:
Scientific studies indicate that exposures to the three primary PFAS (PFOA, PFOS, and PFHxS)
found in the Pease PWS have been associated with endocrine disorders, such as thyroid disease
and effects on the liver (see Table A-1). ATSDR is conducting a study of persons exposed to PFAS
from the Pease PWS and this study, along with our other nationwide multi-site study, should
provide exposed persons and the scientific community a better understanding of the
association between drinking water exposures to these PFAS and the health effects described
by the commenter as well as other effects.
Comment 2: The following comments have been placed together as they all related to our
lack of understanding of the full spectrum of PFAS contained in the AFFF used at Pease:
a. The greatest weakness of the ATSDR analysis is the relatively few PFAS compounds
that are addressed, and why.
b. Site 8 is said to be the major source of pollutants in the Portsmouth drinking water
supply, but there is no discussion of which PFASs (or other chemicals and surfactants,
etc.) were in the fire-fighting foams or other solvents used at site 8. It is a black box.
c. There is no discussion of why the 19 or so PFAS compounds listed in the abbreviations
list were selected for study, nor of which ones were excluded. It is a black box. Just
because a PFAS does not have a known “test” for measuring it does not mean that the
contaminant can be ignored as if it does not exist in our water.
C-1
d. Conclusion #2 says that treated water is safe to drink based on the testing of only a
dozen PFAS compounds, when it is clear that thousands of PFASs exist and any
particular fire-fighting foam may have contained hundreds of different PFASs, even
though the primary component was PFOA or PFOS. ATSDR should not make such a
broad, open-ended conclusion without limiting its scope to the actual chemicals
tested, disclosing what else was in the fire-fighting foams, and addressing those
chemicals that were not tested. For example, which PFASs are not removed by
treatment with activated charcoal and resin columns?
e. This report by ATSDR says it will “conclude the health consultation process for this
site.” But it provides the public with no information about the “black boxes” just
mentioned and addresses only a dozen or so compounds selected by an unknown
entity (USAF?) with no disclosure/discussion of the selection process. It requires a leap
of faith to believe Conclusion #2. Newington deserves better – especially because we
have believed the experts about the drinkability of the Haven well water and have
been twice burned by our blind faith.
Response:
ATSDR has collected all available information to evaluate exposures to PFAS from the Pease
Tradeport PWS. However, incomplete information exists on the type of AFFF used at the former
Pease AFB and specific PFAS formulations. ATSDR reviewed the PFAS water results provided
and acknowledges that there are potentially other PFAS which were not analyzed and that
exposures to other PFAS could have occurred. Previous PFAS water analyses were based on
available laboratory methods and data availability at the time of sampling. ATSDR has added a
statement to the final health consultation about this uncertainty in our conclusions and a new
section under the Limitations and Uncertainties of Risk Assessment of PFAS Exposures. Any
additional PFAS exposures prior to June 2014 would have increased the risk of harmful effects
and ATSDR acknowledges this in the public comment version of this health consultation several
times. After June 2014, because of the availability of additional laboratory methods, the
number of PFAS analyzed increased from 9 to 23. These additional analysis helps ATSDR to
better understand the past exposures between the time the Haven Well was shutdown (May
2014) and when the new water treatment system for the Smith and Harrison Wells was
installed (September 2016). The Haven well was operated until it was shut down in May 2014. A
granular activated carbon system was installed in September 2016. The Harrison and Smith
Wells have been treated by that system ever since that time. Additional protection is expected
when the dual granular activated carbon and resin treatment system is installed.
C-2

Comment 3: The following comments relate to whether the treated water from the City of
Portsmouth supplied to the Pease Tradeport and residents is safe to drink.
Newington has been twice burned with experts telling us the water treated at Pease was OK
to drink, first due to TCE/VOC contamination and then due to PFAS contamination. For sure,
the USAF and Portsmouth Water Dept. will point to this report and its recommendations as a
rubber stamp of approval, full steam ahead…. But continuing to rely on a drinking water well
in the middle of a superfund site and an operating airfield seems a recipe for another
disaster.
Conclusion #2 is especially worrisome. Especially because the analysis at Pease will be used
across the country for other contaminated drinking water supplies next to military bases.
Why should the public believe the treated water is now safe to drink when this was not true
for TCE, nor for decades with PFASs?
Already we are hearing:
“We can only test for what we can test for.” – Portsmouth Water Department
“We only know what we know.” – NH DES
“There is nothing special about Pease, this is the state-of-the-art for how contaminated water
systems are cleaned up.” – EPA
The ATSDR should exercise its authority and compel the USAF to compile information on the
components of fire-fighting foams and share it with all of us, so we will know a lot more
about what needs to be cleaned up and if the suggested processes are sufficient to produce
water that is safe to drink. Until we know the full extent of what we are dealing with, how
can the ATSDR conclude that the treated water is safe to drink and will do no harm.
Newington does not want to drink treated Haven Well water for the next 20 years only to
learn that the experts got it all wrong, FOR A THIRD TIME.
For more on the Pease RAB see: https://www.afcec.af.mil/Home/BRAC/Pease.aspx
Response:
As stated in the response to Comment 1 above, ATSDR agrees that there is some uncertainty
regarding all of the PFAS that may be present in the wells that have and will be providing the
primary source of water to the Pease Tradeport community. However, ATSDR reviewed at least
8 monthly rounds the post-filter samples from the currently installed filter system and it
appears to be effectively removing 23 PFAS from the Harrison and Smith wells. This system
appears to be removing both long-chain and short-chained PFAS. Only a few samples after
treatment have detected any PFAS, with only one sample that detected PFOS at levels slightly
above ATSDR’s HBCV and similar to the level detected in the distribution system samples at the
C-3
water treatment system distribution point (see Table 4). ATSDR has added a recommendation
to the USAF to prioritize their research and efforts to determine the AFFF usage and
formulation at Pease and other facilities to help inform future monitoring efforts around sites
where AFFF has been used. This additional monitoring will help to also inform future health
evaluations of exposures to communities who live around bases that have used AFFF.
Comment 4: The following comments relate to ATSDR recommendations:
a. The back of the front page of this report states: “An ATSDR health consultation … may
lead to specific actions, such as restricting use of or replacing water supplies;
intensifying environmental sampling; restricting site access; or removing the
contaminated material.” But the Recommendations in this study are especially weak.
They are a gift to the USAF, a pat on the back for a job well done. There is no attempt
to hold their feet to the fire so the experts and public can understand the full extent of
what is really in the water supply, what is being removed, and what is not being
removed by the GAC/resin treatment process.
b. As a minimum, the recommendations should compel the USAF to disclosure all the
surfactants and chemicals, including different PFASs, their components and
degradation products, and relative concentrations that were in the fire-fighting foams
used at Pease, especially at Site 8. The USAF is waving its hands in the air and arguing
about trade secrets, patents, and confidentiality of foam components. OK, so disclose
the chemical components in the foams and their relative proportions but do not
disclose the brand names or their manufacturers. The USAF is arguing that it cannot
find a record of all the fire-fighting foams used at Pease over the last 50 years. OK, so
identify all the foams that were on the market during those years, whether or not the
USAF purchased them, and disclose what is in them and go from there.
c. During discussion of the water treatment proposals for cleaning the Haven Well
water, the Pease Restoration Advisory Board first heard that charcoal filters were all
that were needed to remove PFASs from the contaminated water. That was not true.
Soon it became apparent that an ion exchange resin was also needed for removing
certain PFASs, such as those that are short chains. The Portsmouth Water Department
has been doing a great job in monitoring 23 PFAS compounds (that have available
tests) in the current water treatment process. But there is no information about the
hundreds of PFASs and other chemicals presumably present in the fire-fighting foams
used at Pease and whether those 23 PFASs/chemicals will be effectively removed by
the GAC/resin treatment process. Ignoring these other PFASs/chemicals and declaring
C-4

the water safe to drink based on testing only a select few PFASs is frightening. The
recommendations in this report should compel the USAF to undertake studies of
broad classes and types of different PFAS compounds to determine which ones will, or
will not, be removed by the proposed treatment process.
Response: See responses to Comments 2 and 3 above.
Comment 5:
Water in Newington is contaminated with many different PFASs. USAF data for testing the
water in Watering Springs is shown in the figure below. These springs are located off the old
base in the Newington residential area, which is down gradient from the old Site 8 fire
training area at Pease. I am using this data as a proxy for the Pease public drinking water
data. Though these springs have higher PFAS concentrations than contaminated drinking
water wells in Newington, the relative concentrations of the contaminants are likely similar in
the springs, the wells, and the Pease public drinking water because the water all comes from
the same contaminated underground aquifer close to Site 8.
My husband kept a plastic pitcher of Watering Springs water in our refrigerator so all of us
could enjoy the cold fresh water. All our ducks, geese, turkeys for the local 4-H group, pigs,
and beef that we grew when our children were young drank this water at full strength (not
120X diluted). We ate the duck and goose eggs and the meat from the ducks, geese, turkeys,
pigs, and beef. Our exposure was not to any particular PFAS in the water but to all of the
PFASs in the water, eggs, and meat. The impact on human health is the combined impact
from exposure to PFAS cocktails, not just to individual PFAS chemicals.
Response: ATSDR agrees that persons exposed to PFAS from the Pease PWS are also likely to
have exposures to PFAS from other sources like food. These exposures will likely vary
depending on the source of a family’s food. ATSDR does not have data on the foodstuffs
mentioned by the commenter to evaluate the public health implications beyond past PFAS
exposures from the Pease PWS. ATSDR will evaluate the potential exposures and health effects
related to the shellfish data from the Great Bay. ATSDR acknowledges in this health
consultation that total PFAS body burden for persons exposed to the Pease Tradeport PWS in
the past is a result of these exposures and other non-drinking water sources.
Comment 6: Watering springs is also contaminated with 6:2FTS, which had the third highest
concentration of the 13 PFASs tested. Although this PFAS was listed in the Abbreviations
Table on page vii of your health consultation, no other analysis is presented in the report. It is
not possible to understand the impact of 6:2 FTS to human health in the untreated and
C-5

treated Portsmouth Drinking water supply because no data is included in this health
consultation. Since all these chemicals likely came from the Site 8 fire training area, 6:2 FTS is
likely also in the Haven Well. Newington needs to understand the importance of 6:2FTS on
human health because it is present at high levels in our water. Deeming water treated at
Pease to be safe (Conclusion #2) without including information on 6:2 FTS is not reassuring.
The Watering Springs figure includes data on 13 PFAS contaminants that were tested. We
have no idea how many other PFAS chemicals are in this water. I divided the PFAS levels in
the water by 120 to obtain values that would be below the new drinking water standards
proposed by NH DES. Thus, the water (120x dilution) would be considered safe to drink if
similar levels were found in someone’s well:
— 13.3 ppt PFOA < 38 ppt proposed PFOA standard
— 50 ppt PFOS < 70 ppt proposed PFOS standard
— 63.3 ppt PFOA+PFOS < 70 ppt proposed PFOA+PFOS standard
— 0.2 ppt PFNA < 23 ppt proposed PFNA standard
— 29.2 ppt PFHxS < 85 ppt proposed PFHxS standard
BUT look at the combined total of 139.5 ppt for the 13 PFASs that were tested and found to
be present in the 120X diluted water. Certainly, drinking water that has such high levels of
PFASs cannot be good for you. In addition, there could be many other PFAS chemicals in this
water (some worse than others) that were not tested, so the combined PFAS exposure is
actually higher than 139.5 ppt.
Response: ATSDR cannot determine the exposure levels to 6:2 FTS before June 2014 because it
was not analyzed. After May 2014, when the list of PFAS analyzed was expanded, 6:2 FTS was
analyzed in the distribution system water samples and in samples of the treated water after the
treatment system was installed in September 2016. This PFAS was not detected in the
distribution water samples nor in drinking water supplied after the treatment system was
installed in September 2016. ATSDR has updated this health consultation to include this
information. In addition, ATSDR did some additional research and determined the following
regarding possible health effects of 6:2 FTS:
No human studies were identified for exposures to 6:2 FTS. 6:2 FTS has been detected at
low levels in some consumer products, drinking water, air, and fish; human exposure
may occur those any of these pathways. Some animal studies have shown that 6:2 FTS
can cause kidney and liver toxicity, but does not 1) cause damage to DNA; 2) act as a
skin sensitizer; and, 3) cause toxicity to reproductive organs or to the developing fetus
C-6

[NASF 2019]. However, overall, these studies are very limited and no definitive
conclusions can be drawn relating to potential effects in humans.
Comment 7: Mixtures of PFASs are more important to study/regulate than any one PFAS
alone. Fire-fighting foams are not homogenous and are likely comprised of hundreds of
chemicals, including many different PFASs, foaming agents, solvents, foam stabilizers,
unreacted ingredients, and degradation products. Most contaminated water supplies from
military bases and old fire training areas will have many (dozens? hundreds?) of different
contaminants from the release of these foams. This report should include a fourth conclusion
that specifically addresses PFAS mixtures. Assessing the impacts of PFAS exposure on human
health requires understanding the exposure of people to “cocktails” of multiple PFASs (and
the other chemicals present in the foams). Impacts from any one PFAS will inform such a
study, but the total impact to human health will arise from exposure to the total PFAS
cocktail.
Response: To the extent possible, ATSDR has evaluated the mixture of the PFAS exposures
related to the Pease PWS. ATSDR has already make conclusions about the possible health
effects of the mixture of PFAS exposures at Pease, both before and after May 2014. As stated in
other responses to public comments, ATSDR agrees that a major uncertainty of this evaluation
is the lack of information on the type of AFFFs used, formulations, and exposures to other
related chemicals. ATSDR has added in this additional uncertainty statement to the final health
consultation.
Comment 8: "I agree with the following statement in Conclusion #1 about past PFAS
exposures:
“The combined exposures to a mixture of PFOS, PFOA, PFHxS, and perfluorononanoic acid
(PFNA) could have increased the risk for developmental and immune effects above what
might be expected from exposure to any of these PFAS alone.” I do not agree with the
statement in Conclusion #2 about the safety of treated water: “Further evaluation of the
exposure to the mixture of PFOS, PFOA, PFHxS, and PFNA indicates that the risk for harmful
developmental or immune effects is not likely to be more than what might be expected from
exposure to any of these PFAS alone.” This statement may be true on the face of it for these
four compounds. But these 4 PFASs occurred in a cocktail of many other PFASs, some
identified and most not. It is misleading to imply that PFASs mixtures in treated water are
safe when only one subset of four PFASs was assessed.
Response: See responses to comments 2, 3, and 6 above.
C-7
Comment 9: Tables 2, 3, 4, and 5 indicate that PFHpA, PFHxA, and PFPeA lack health-based
comparison values and will be included as part of the overall evaluation of mixtures. Is this
analysis in the report? I couldn’t find information on the mixture of these three PFASs.
Response: ATSDR could not do a complete mixtures health evaluation for these PFAS as was
conducted for the four PFAS with provisional MRLs. However, we did research the scientific
literature to determine what health information might be available. ATSDR discussed the
common health outcomes associated with exposure to these PFAS and presented the results on
Table A-1. In addition, as stated in this health consultation, ATSDR can make no definitive
health conclusions for exposures to PFHxA, PFHpA and PFPeA. However, although PFHxA,
PFHpA and PFPeA have not been studied as extensively as the PFAS with ATSDR provisional
MRLs. Moreover, most of the PFAS detected with no ATSDR MRLs were short-chain and non-
sulfonated indicating that they may bioaccumulate less than the longer-chain and sulfonated
PFAS. However, health effects of many short-chained PFAS and new PFAS alternatives have not
been fully researched.
Comment 10: Many states are wrestling with setting water standards for PFASs, with
Massachusetts and Connecticut proposing a standard of 70 ppt for the sum of PFOS, PFOA,
PFNA, PFHxS, PFHpA, and PFBS. It would be helpful if the ATSDR could give further discussion
on the impacts of combined totals of PFASs. It is highly unlikely that drinking water will have
only one or two of these compounds. Newington is already contaminated with a broad
mixture of PFASs so addressing exposure to PFAS cocktails in our water is likely more
important than addressing any one PFAS alone.
Response: At this time, ATSDR can only conduct a full mixtures evaluation of the four PFAS with
provisional MRLs. To the extent possible, ATSDR discussed the available literature for other
PFAS found in the Pease PWS and also discussed the relative toxicity of the most predominate
PFAS detected in the Pease PWS as discussed in the response above.
Comment 11: Conclusion #3 on Breastfeeding. This conclusion is based on a general
knowledge that breast feeding is beneficial and ignores any real analysis of PFAS
bioaccumulation in breast milk. At best, the conclusion is preliminary and needs further
analysis. Please take into consideration the following two milk-related PFAS reports:
• Careful attention needs to be given to the Minnesota Department of Health’s (MDH)
study (Goeden et al., Journal of Exposure Science & Environmental Epidemiology 29:183–195,
2019) that shows that nursing babies and fetuses are exposed to the PFASs that are present in
the mother and then pass on to the fetus during pregnancy and to the baby while nursing.
C-8
Because mothers are bioaccumulating PFASs, the amount measured in drinking water alone is
not indicative of deleterious health effects.
Response: ATSDR recognizes and discusses in this health consultation the well-known fact that
PFAS are transferred from a nursing mother to her infant. Breastfeeding provides clear health
and nutritional benefits to infants. These include protection from some illnesses and infections,
and reductions in the risks for developing asthma and sudden infant death syndrome. In
general, CDC recommends breastfeeding despite the presence of chemical toxins in breast milk.
From what we know, the benefits of breastfeeding outweigh risk. However, the science on the
health effects of PFAS exposure to mothers and children continues to grow. A woman’s decision
to breastfeed must be an individual choice — one that is made after consideration of many
different factors, many unrelated to PFAS exposure, specific to the mother and the child.
Information developed by ATSDR to guide doctors (see
https://www.atsdr.cdc.gov/pfas/index.html) can aid in this decision-making process. Moreover,
women who plan on breastfeeding should attempt to reduce potential exposures to toxic
substances as much as possible. The American Academy of Pediatrics has made similar
recommendations [AAP 2012]. The article cited in this comment provides similar conclusions
and recommendations, as follows:
Although PFOA, PFHxS, and PFOS can be excreted through breastmilk, MDH recognizes
the important short- and long-term health benefits of breastfeeding for both mother
and infant. MDH recommends that women currently breastfeeding, and pregnant
women who plan to breastfeed, continue to do so. Exclusive breastfeeding is
recommended by doctors and other health professionals for the first 6 months. It is
unlikely that potential health concerns from infant PFOA exposure exceed the known
benefits of breastfeeding.
ATSDR recognizes that a woman’s decision to breastfeed is a personal choice, made in
consultation with her healthcare provider. It is a choice made after consideration of many
different factors, many unrelated to PFAS exposure, specific to the mother and child. ATSDR has
developed information to guide doctors and aid in this decision-making process
(See https://www.atsdr.cdc.gov/pfas/docs/ATSDR_PFAS_ClinicalGuidance_12202019.pdf)
ATSDR has revised the health consultation to recommend that women who plan on
breastfeeding should attempt to reduce potential exposures to toxic substances as much as
possible and we have added a reference to the American Academy of Pediatrics policy on
breastfeeding.
C-9
Comment 12:
In 2017, PFAS testing at Stoneridge Farm in Arundel, Maine found PFAS contamination of 50
ppt in the farm well, 7.93 ppt in the stream, 41.07 ppt in the pond, and 690 ppt in the milk
produced by cows on the farm. I do not know the breakdown of specific PFAS chemicals
(PFOA, PFOS,….) in this analysis but certainly the analysis demonstrates that cows that drink
water with levels of PFASs less than 70 ppt can concentrate PFAS in their milk at
concentrations at least 10 times higher than that found in the drinking water. Of course, part
of the milk contamination on this farm may have come from cows eating contaminated grass,
hay, or dirt in the fields. These other sources of contaminants must also be studied when
assessing the impacts on human health from drinking milk (or eating beef).
Response: ATSDR acknowledges that PFAS contamination in milk and other food is an additional
potential source of PFAS exposures. Persons who drank water from the Pease PWS in the past
could have additional PFAS exposure if they drink milk from this farm or consumed other food
containing PFAS. However, these exposures will likely vary depending on the source of a
family’s food. In general, ATSDR agrees that other sources of PFAS exposures in food is a
growing concern and needs further investigation and we do not have data to evaluate these
exposures in the community.
Comment 13: Other potential exposure pathways to human health. I appreciate the work the
ATSDR has put into the PFAS issue in this health consultation on the Pease public drinking
water system. Some other equally important health consultations include the following:
• Drinking from contaminated well water – Health Consultation expected by end of 2019.
• Eating contaminated wildlife (turkeys, deer, fowl) – Health Consultation needed (see
attached Appendix).
• Eating agricultural products, such as eggs, meat, and milk that were produced on fields
close to the contaminated water table – Health Consultation needed.
• The potential of inhalation exposure from the operation of the vapor extraction system at
the two fire training sites at Pease. These systems ran for over ten years, and pumped water
having extremely high levels of PFAS from multiple ground wells before discharging the
treated water back into recharge trenches. Though the system was mostly closed, no analysis
has been done to assess when, if, or how 8 PFASs may have been released into the air. Site 8
is very close to the Air National Guard facility – Health Consultation needed.
Response: ATSDR will release a health consultation of PFAS exposures to users of private wells
in Newington and Greenland. ATSDR does not have any exposure data on the various food
products discussed in this comment to evaluate the public health implications. PFAS do not
C-10

readily evaporate into the air. ATSDR does not expect any significant inhalation exposures to
PFAS from the operating extraction system on the base as compared to other pathways.
However, ATSDR does not have any exposure data to confirm this conclusion.
Comment 25:
It should be noted that this study is extremely conservative in its approach and does not
accurately reflect the conditions encountered at Pease. For example, the study looks at 100%
of PFAS exposure originating from drinking water. As PFAS have historically been used in
numerous consumer products that an average population would come into frequent contact
with, a 100% relative source contribution from drinking water is a false representation of the
environment we live in. While the conclusions in the report include the language of
uncertainty, such as “…could have increased the risk for harmful health effect…”, these
conclusions, based on highly conservative calculations, may have unintended ramifications
for public water suppliers. The conclusions should be bracketed with the assumptions and
short fallings of the study to further elaborate on the uncertainty associated with this work.
These uncertainties, if presented clearly and concisely, help to prevent the study’s
conclusions from being interpreted carte blanche.
Response: The assumption of a 100% relative source contribution is the standard approach
taken by ATSDR when evaluating site-related exposures in our health assessment documents.
The goal of this health consultation is to better understand site exposures and to determine if
harmful effects are possible. To do that, ATSDR must compare estimated PFAS exposures from
the Pease PWS to various health-based comparison values and health effect levels. ATSDR
acknowledges that persons exposed through the Pease PWS could have PFAS exposures from
other sources in their homes or through their food. These other exposures are evaluated in a
qualitative way in this health consultation.
ATSDR has included an extensive list of uncertainties related to this health consultation in the
public comment version and has added in additional uncertainty statements to address public
comments. These uncertainties may under- or over-estimate actual exposures, so no additional
caveats on our conclusions are needed.
Comment 26:
It is recommended that a cover letter be added to accompany the report. The cover letter
should clearly explain the findings of the study and explain the significance of the various
findings. The assumptions associated with the study should also be highlighted. This cover
letter should be written in such a manner to allow the general public, with a vast array of
scientific and non-scientific backgrounds, to understand.
C-11
Response:
The accompanying factsheet was developed to assist the reader understand the key findings of
the health consultation.
Comment 27:
While the study does show some potentially concerning findings associated with PFAS
exposure at Pease, the commenter would like to highlight a few relevant statements
regarding the Pease water system moving forward:
a. Since the shutdown of the Haven Well, water from the Harrison and Smith Wells,
either blended to lower PFAS concentrations or filtered through temporary granular
activated carbon filters, is not expected to have harmful effects on human health.
Response: Comment noted.
b. Not all PFAS appear to have the same health outcomes. Short chain compounds and
those with non-sulfonated head groups may be less toxic based on current research and the focus of treatment should be on the longer chain compounds with known negative health outcomes. To quote the EPA: “While persistent in the environment, PFCA chemicals with fewer than eight carbons, such as perfluorohexanoic acid
(PFHxA), and PFSA chemicals with fewer than six carbons, such as perfluorobutane sulfonic acid (PFBS), are generally less toxic and less bioaccumulative in wildlife and humans. Additional health studies may be required to confirm this understanding. Additionally, short chain PFAS do not appear to have significant bioaccumulation properties, with a human half-life of less than a week. This is highlighted in MDH’s Toxicological Summary for: Perfluorobutanoate
(https://www.health.state.mn.us/communities/environment/risk/docs/guidance/
gw /pfba2summ.pdf).
Response: ATSDR generally agrees with the statements in the comment and these
findings are already in the public comment version of the Pease PWS Health
Consultation. ATSDR agrees that PFCAs with fewer than eight carbons, such as
perfluorohexanoic acid (PFHxA), and PFSAs with fewer than six carbons, such as
perfluorobutane sulfonic acid (PFBS), are more persistent in the environment and
generally less bioaccumulative in wildlife and humans. However, health effects of many
short-chained PFAS and new PFAS alternatives have not been fully researched. The
health consultation was updated to make this clear.
C-12
c. The permanent water treatment system design is expected to remove all PFAS
contaminants. Portsmouth water operators will follow all federal and state guidelines
and requirements to ensure the treated water meets current water quality standards.
Response: This is also ATSDR’s understanding.
Comment 30:
While the commenter acknowledges that additional testing and research is required to
understand the health effects of the vast majority of PFAS in the environment, the limitations
associated with this lack of knowledge and the calculations conducted in this study should be
presented and explained so that all reading the report may better understand the
conclusions.
Response: The public comment version of the Pease PWS Health Consultation contains a
section that describes all of the limitations and uncertainties of evaluating the human health
risk from PFAS exposures. In addition, based on other public comments received, ATSDR has
also added in the uncertainty regarding the AFFF formulation and what other PFAS chemicals
might have been present in the drinking water.
Comment 31:
Page ii states: "Since the Haven well was shut down, the Harrison and Smith wells have
continued to provide water for the Pease Tradeport PWS, supplemented by water from the
City of Portsmouth PWS (ID 1951020)." The PWS ID number for the Pease Tradeport is
1951020 and the PWS ID number for the City of Portsmouth is 1951010. This should be
clarified in the report.
Response: Updated as suggested.
Comment 32:
Page ii states: "Drinking water sampling from June 2014 through May 2017 indicated that the
maximum detected PFOS concentration was equal to ATSDR's health-based comparison value
(HBCV) at the New Hampshire Department of Environmental Services (NHDES) office and
above the HBCV at the water treatment plant." The demonstration GAC filters were
operational in September 2016. The dates in the report should reflect this.
Response: Updated as suggested.
C-13
Comment 33:
On page iii, the laboratory used to analyze PFAS samples is spelled incorrectly. The laboratory
is Maxxam Analytics and not Maxxim Laboratory.
Response: Updated as suggested.
Comment 34:
Page 2 provides an overview of PF AS compounds. Background information regarding the
preliminary and updated health advisories for PFOA and PFOS would be helpful for the
drinking water system regulatory perspective. An explanation of health advisory versus
Maximum Contaminant Level (MCL) regulations would be useful as well (see
https://www.epa.gov/dwstandardsregulations/drinking-water-contaminant-human-health-effects-
information for more information).
Response:
Added: The EPA developed a Lifetime Health Advisory for PFOS and PFOA (singly or combined
at 0.07 ppb) on May 25, 2016.
Comment 35:
Page 2 states: "The City of Portsmouth operates ... " This sentence should be updated to say,
"The City of Portsmouth operates and maintains the Pease Tradeport PWS through an
intermunicipal agreement with the Pease Development Authority (PDA)."
Response: Updated as suggested.
Comment 36:
Page 2 states: "Three wells (identified as Harrison, Haven, and Smith) supplied or supply
water to the Pease Tradeport PWS. Water from these wells is disinfected and iron is
removed. The water is then treated for corrosion control and mixed to provide drinking
water." The _ proposes this section read as follows: "Three wells (identified as Harrison,
Haven, and Smith) supplied or supply water to the Pease Tradeport PWS. Water from these
wells are blended together and then three chemicals were added to the water: sodium
hypochlorite (disinfection), hydrofluorosilicic acid (dental cavity prevention), and
ortho/polyphosphate (iron and manganese sequestration and corrosion control). This water
is then blended with supplemental water boosted from the Portsmouth PWS and sent to the
distribution system."
Response: Updated as suggested.
C-14
Comment 37:
Page 2 states: "Although PFAS were detected in each well, only the Haven well had elevated
levels." The reference to elevated levels should be clarified as "levels above the EPA
provisional health advisory."
Response: Updated as suggested.
Comment 38:
Page 3 footnote should be updated to say that, "The Pease and Portsmouth water systems
have always been interconnected. In fact, prior to the construction [of the Pease Air Base, the
Haven Well was one of the primary sources of supply for the City of Portsmouth, with a
history of use dating back to the late 1700's."
Response: Updated as suggested.
Comment 39:
Page 4 should add the statement that, "Water was routinely tested by the water system
operators according to the monitoring plan set for by the NHDES."
Response: Updated as suggested.
Comment 40:
Page 4 footnote that says, "A vote was held by the Portsmouth Planning Board to reactivate
the Harrison well." Additional information should be added to say, subsequently, the well
was tested, designed and approved by the NHDES for reactivation in 2006."
Response: Updated as suggested.
Comment 41:
Page 5 states: "Pilot testing for the Haven well treatment system started in 2017..." The pilot
testing at the Haven Well concluded in 2019 and should be included in the report. It is also
recommended that the report mention in this section that construction of the permanent
treatment system is currently underway with an anticipated completion date in 2021.
Response: Updated as suggested.
C-15
Comment 42:
Page 5 should be updated to state that "the activated carbon demonstration filters continue
to filter the Harrison and Smith wells while the final treatment system for all three wells is
constructed. The pilot testing of the Haven Well confirmed that resin filters in combination
with activated carbon would provide the most efficient treatment of PFAS compounds. The
construction project was bid in late 2018 and construction began in April 2019 with
completion of the system scheduled for late 2021."
Response: Updated as suggested.
Comment 43:
Page 5 states: "The Airfield Interim Mitigation System is expected to be built in 2019." The
system is also operating at a reduced flow rate as of the writing of this report.
Response: Updated as suggested.
Comment 44:
Page 8 should add the comment that, "the weekly sampling of the wells was changed to
monthly sampling after the demonstration filters were installed on the Smith and Harrison
wells in September 2018. That sampling continues."
Response: Updated as suggested.
Comment 45:
Page 8 refers to Table A-4 for sampling results of the Haven Well. Additional information on
subsequent sampling was provided by the City of Portsmouth to Gary Perlman via email on
March 17, 2019.
Response: It is unclear what the first part of this comment is referring to as page 8 of the public
comment version of this health consultation refers to sampling results from the Harrison and
Smith wells which was summarized in Table A-4. ATSDR did receive and review subsequent
sampling results provided by the City of Portsmouth on March 17, 2019.
C-16

Comment 46: The following comments relate to differences in PFOS levels found in the Haven
well in 2014 and in subsequent sampling:
a. PFOS Levels at the Haven Well. The Haven Well, while off-line from the drinking water
system, has periodically been sampled for PFOS as part of the treatment system
design and piloting effort since 2014. This data has previously been submitted to the
ATSDR, showing results that are almost half of what they were as sampled in 2014
prior to the shut-down of this well. This may be due to the dilution factor and
methods of the testing analysis in 2014. As pointed out in the information the City has
provided the other compounds all have similar levels. Only PFOS is significantly
different. We believe that this is not due to a reduction in PFOS levels but more
accurate laboratory methods.
b. The original round of sampling by the Air Force's consultant in April and May 2014 had
an average PFOS concentration of 2,450 ppb. A follow-up sample in May 2014 taken
by the New Hampshire Department of Environmental Services resulted in a
concentration of 1,900 ppb for PFOS. Subsequently, the City's consultant pump-tested
the well to do some comprehensive water quality analysis in 2016 and the PFOS
results averaged 1,200 ppb. Finally, 13 rounds of testing from November 2017 to June
2018 during their treatment system piloting (Granular Activated Carbon and Resin
comparison testing) and had an average result for PFOS of 1,377 ppb. As shown in the
data, except for PFOS, all the other compounds were fairly consistent from the 2014
sampling event.
c. It is our understanding that the Air Force's sampling as part of their AIMS water
treatment system design and construction project has seen PFOS levels closer to the
1,200 to 1,400 ppb results that we have seen since the original samples were taken in
2014. We recommend that ATSDR check with the Air Force to confirm.
C-17

Response: ATSDR confirmed with the USAF that the PFOS levels were in the range of 1,200 to
1,400 parts per trillion (not ppb as indicated in the comment). Although there is some
uncertainty about the validity of the 2014 PFOS sampling as indicated by the commenter, it is
ATSDR’s understanding that the laboratory still considers these results valid. In addition, one
reason why the PFOS levels were reduced in later sampling could be because of the effects on
groundwater hydrology after the shutdown of the Haven Well.
Comment 47:
Page 16, Table 5, provides a footnote describing how ATSDR derived value for children's
exposures. Did this value take into account that those drinking this water were only doing so
when at Pease and not 24/7?
Response:
Yes, ATSDR adjusted the exposure scenario to account for non-residential exposures. ATSDR
uses an exposure factor of 5/7 to adjust for exposures in a school or occupational setting as was
the case for PFAS exposures from the Pease PWS drinking water.
Comment 48:
Page 17, Public Health Implication of Exposure to PFAS in Drinking Water. Please explain
what "lifetime exposures" mean in the realm of drinking water health advisories and
regulations.
Response: ATSDR cannot locate the phrase “lifetime exposures” in the section referenced in the
comment. In other sections, the document refers to EPA’s health advisory or HA which may be
what the comment is relating to. If so, a Health Advisory refers to a concentration that is not
expected to cause adverse health effects over a lifetime of consistent daily exposure at that
level.
Comment 49:
Page 38. The statement that "the USAF continue working with EPA and NHDES to implement
a long-term remedy," should be updated. The EPA issued Administrative Order SDWA-01-
2015-016 to the Air Force in August 2018 which required the Air Force to treat the Haven Well
and the effected aquifer at the former Pease Air Base. Subsequently, actions have been taken
by the Air Force to implement the order.
Response: Updated as suggested.
C-18
Comment 50: One commenter provided some additional comments regarding the overall
study regarding the history of fire-fighting foam use at Pease, as follows:
a. The commenter has been actively involved with the hydrogeological and scientific
review of the PFAS contamination at the Pease Tradeport since the sampling event in
2014 that resulted in shutting down the Haven Well. The technical team of
Hydrogeologist, scientists and regulators have performed an extensive amount of field
sampling and analysis throughout the former Pease Air Base. One of the assessments
of this group is that contamination of the Pease wells from the former fire training
center and other sites away from the Haven well likely did not have much contribution
to the PFAS levels. Other than the 90,000 gallons of fire-fighting foam used to put out
the KC-135E Fire at Pease AFB in January 1990 there are if any unknowns regarding the
past use, makeup and volumes of fire-fighting foam that may have been discharged on
the ground and eventually absorbed into the aquifer.
b. It would be most helpful from an historical perspective if this study were to further
investigate the history, types and volumes of PFAS contaminant events at the former
Pease Air Base to be able to reconstruct what the levels may have been years ago. It is
possible that prior to the fire in 1990 the Haven Well may have had lower PF AS levels
than found in 2014 and that people living and drinking the water when on the base
were not exposed to significant levels of PF AS in the drinking water.
c. Questions have also arisen as part of the Pease Restoration Advisory Board (RAB)
about what compounds and volumes of fire-fighting foam, and other potential
contaminants, were used at the base and the airport. This information would also be
most helpful in gaining more insight to the response to contamination as part of the
RAB's work.
Response: ATSDR agrees that there are many uncertainties relating to the amount, type, and
formulation of the AFFF used at the former Pease AFB. For this health consultation, we must
rely on the results of our modeling to provide a reasonable estimate of what past exposures
between 1993 and May 2014 might have been. Additional work to better understand these
past exposures is being conducted in relation to the ATSDR Pease Health Study. In addition,
ATSDR has revised the health consultation to recommend to the USAF that they should
consider doing additional work and research to better understand the type and formulations of
AFFF used at Pease and other facilities to inform future monitoring efforts and health
assessments.
C-19

Comment 51: The commenter would like to thank the ATSDR for consideration of these
comments. The commenter would also like to thank the ATSDR for their work on this
important and rapidly developing issue.
Response: Comment noted.
Comment 52:
Summary of Key Findings/Bullet point #2. Stating the phrase: “…can depress the immune
system….”, implies definitive evidence for a causal relationship between PFAS exposure and
health effects. Update the bullet point to: “…may or have the potential to depress the
immune system…”.
Response: The National Toxicology Program (NTP) concludes that PFOA and PFOS are presumed
to be an immune hazard to humans based on a high level of evidence that PFOA suppressed the
antibody response from animal studies and a moderate level of evidence from studies in
humans (NTP, 2016). Based on these determinations, “can” is an appropriate word to use in this
context. No change made.
Comment 53:
The document is difficult to understand in a general sense and requires revision that would
improve its readability - especially for the public. For example, on page iii the Basis for
Conclusion section contains language that is redundant and can be streamlined. More
specifically for example, “the estimated exposure doses” should be revised to “the estimated
exposure. Revise the overall report language for understanding and readability, such as the
example provided in the comment.
Response: ATSDR will make the changes as suggested in the comment. The health consultation
summary and fact sheet that accompanied the release of this document is intended for a lay
audience.
Comment 54:
There are several technical points that are incorrect or make broad assumptions that should
be corrected. For example, it is incorrect to state on page iii that “the cancer risk from past
exposure to all PFAS ...is uncertain” while not necessarily incorrect, implies that all PFAS are
carcinogens. Which is not the case. So the statement is highly misleading. In fact the
document goes on to acknowledge that there is only a slope factor for PFOA. Revise the
report language with regard to technical points to ensure there are no unclear, incorrect, or
misleading statements such as the example provided.
C-20

Response: ATSDR will add in a statement that clarifies that not all PFAS are carcinogenic.
Comment 55:
The document is burdened with jargon such as references to screening values such as MRLs
and HBCVs. The document should be rewritten to exchange these acronyms with a
description of the sensitive population they are developed to protect. For example, regarding
HBCVs the document should describe that be values are protective of children of less than
one year old. Revise the report language with regard to screening values in order to provide
clarity in the applicability of the screening values to the populations (public) reading this
document.
Response: ATSDR’s public health assessment documents are intended for both a technical and
lay audience. The ATSDR fact sheet that accompanied the release of this health consultation is
written for the general public. ATSDR defined all terms and explained how they were used in
the evaluation process. No change is indicated.
Comment 56:
On page iii and iv there are contradicting statements regarding discussion of the risk
associated with exposure to mixtures. Pg. iii. “The combined exposures to a mixture of PFOS,
PFOA, PFHxS, and perfluorononanoic acid (PFNA) could have increased the risk for
developmental and immune effects above what might be expected from exposure to any of
these PFAS alone.” Pg. iv. “Further evaluation of the exposure to the mixture of PFOS, PFOA,
PFHxS, and PFNA indicates that the risk for harmful developmental or immune effects is not
likely to be more than what might be expected from exposure to any of these PFAS alone.
Revise the language in these sections, and any corresponding sections in the report, to clarify
which of these statements is correct. Make the needed corrections.
Response: ATSDR was able to locate the language on page iii that the commenter refers to, but
not the language on page iv. The language referred to in this comment is on page v under
Conclusion 2. These statements are correct as the first refers to the evaluation of exposure
from 1993 to May 2014, which is part of the basis for Conclusion 1. The second statement
refers to exposures after May 2014 and is part of the basis for that conclusion. No changed
indicated.
Comment 57:
The last sentence in this paragraph states the new system is expected to begin operation near
the end of 2018. This period has past. Update with the appropriate data of operation.
C-21
Response: Updated to 2021.
Comment 58:
Monitoring Outcome... Add a period at the end of the sentence, following May 14, 2014.
Response: Updated as stated
Comment 59:
The section does not provide enough information on the sources for and the development of
the HBCVs. Revise this section to more clearly state the process for selecting and/or
developing the HBCVs.
Response: Beyond ATSDR’s HBCVs which are based on the provisional MRLs and well-
documented in the ATSDR draft PFAS Toxicological Profile, ATSDR generally will use the most
conservative HBCV from other reliable sources if they are peer-reviewed. As more states and
federally derived health-based and peer-reviewed values become available, ATSDR will consider
adding more HBCV to use in our health assessment work.
Comment 60:
Firstly, the commenter would like to commend the ATSDR for the thorough and well-written
health consultation it has provided for public comment, as well as thank the agency for the
time permitted to review the document.
Response: Thank you for the comment.
C-22

Comment 61:
"Conclusion 1: As a part of the basis for this conclusion, ATSDR described some of the
epidemiological and animal data used to consider carcinogenic potential of PFAS exposure. _
understands that the existing toxicological database is limited in regards to definitively
classifying PFOA (or other PFAS) as carcinogens. However, the text on page iv appears to lack
precision in describing the uncertainty around findings from animal studies. The commenter
appreciates the difficulty in communicating the technical interpretation of these findings in
animal studies as they relate to unknown cancer risk. Nevertheless, as presently written this
could lead to the perception that ATSDR is drawing a link between two animal studies and a
definitive risk for cancer in humans. As a part of its public comment, the commenter
recommends a review of this paragraph and consideration of more appropriate risk
communication that conveys: 1) the limits (essentially 2 studies) that inform this statement,
2) the evolving nature of the science around the scientific community’s understanding of
PFAS and cancer, and 3) an understanding of the region’s specific concerns to cancer(s). With
regards to this last point, the Seacoast region and its communities have concerns about
potential cancer clusters due to previous reports (NHDHHS 2016, 2017) and statistics offered
to the CDC (https://www.cdc.gov/cancer/dcpc/data/index.htm). Thus, it is recommended
that this point is clarified to avoid unintentional conflation with any cancer concerns in this
community. While there is clear uncertainty surrounding the cancer risks of PFAS, it would be
beneficial for the major conclusions of the ATSDR to be more clear given their authority and
trust from the public"
Response: The basis for the first conclusion on the cancer risk related to PFAS exposures is a summary of the full description of the state of scientific knowledge relating to animal and human studies which is contained in the body of the health consultation report. ATSDR believes that the full description of the cancer evaluation in the text lays out the primary points and uncertainty in relation to how animal and human studies inform our knowledge on PFOA and PFOS exposures and cancer in humans. ATSDR does not believe any further explanation is needed for this report. ATSDR is aware of the concerns in the Seacoast Region regarding childhood central nervous system and other cancers. This report does not evaluate any health statistics in relation to cancer risk for the exposed Pease population. However, it does estimate what a cancer risk may be in relation to PFOA exposures and describes all the uncertainty related to estimating a cancer risk for PFOA, PFOS, and other PFAS that may be carcinogenic. ATSDR and CDC are working to address the concerns of community members regarding potential associations between PFAS exposure and cancer. We are conducting an analysis that uses previously collected data to look at rates of certain health outcomes, including many adult and pediatric cancers, in communities that have been exposed to PFAS through drinking water
and those that have not. Since the health consultation explains what cancer evaluation may be undertaken, ATSDR does not see the need for any further explanation of what was reported in
C-23

the health consultation and what is being attempted in the Pease Health Study or other studies being conducted to look at childhood cancers in the Seacoast Region.
Comment 62:
"Conclusion #3: The commenter agrees with this statement and does not dispute the benefits
of breastfeeding relative to the existing body of knowledge regarding early-life risk associated
with PFAS exposure. _ believes that the later discussion on this issue (page 32 - Community
Concern: Breastfeeding Exposures and Health Implications) should provide further details on
this as recent risk assessment tools (i.e., Goeden et al. 2019) suggest that breastfeeding not
only results in elevated infant serum levels of PFAS, but may result in chronically elevated
serum levels through adolescence. Again, the benefits of breastfeeding on an infant’s health
and well-being are clear. Yet, relative to the ATSDR MRLs, the discussion at this point should
reflect the knowledge that PFAS have extraordinary half-lives (i.e., protracted serum levels
into adolescence) and that the ATSDR considered not only infant but the subsequent benefits
of breastfeeding on childhood."
Response: Please see response to Comment 11.
C-24