pearson the future of learning
TRANSCRIPT

Pearson Annual report and accounts 2017
The future of learning
Pearson Annual report and accounts 2017

Strategy and performance reporting The strategic report up to and including p60 is formed of three sections: ‘Overview’, ‘Our strategy in action’ and ‘Our performance’, and
was approved for issue by the Board on 14 March 2018 and signed on its behalf by:
Coram Williams Chief Financial Officer
Strategic report
Governance Financial statements
01 Overview02 Our KPIs04 About Pearson 06 Chairman’s introduction08 CEO’s strategic overview
12 Our strategy in action12 Market trends13 Our strategy
22 Efficacy24 Sustainability
34 Our performance34 Financial review42 Operating performance48 Risk management50 Principal risks and uncertainties
62 Governance overview 64 Leadership and effectiveness76 Accountability86 Engagement90 Remuneration106 Additional disclosures110 Statement of Directors’ responsibilities
112 Independent auditor’s report to the members of Pearson plc
118 Group accounts178 Parent company accounts190 Five-year summary192 Financial key performance indicators196 Shareholder informationBC Principal offices worldwide
In this report
Helping create the future of learning
Cedrick Collomb Senior Vice President for Global Product Technology
19
Kate Edwards Senior Vice President Efficacy & Research
23
Indika Senadhira Senior Manager, Software Engineering, Pearson Technology Delivery Centre
33
Alvaro Castro Product Management Analyst, Pearson Test of English
41
In this report we have included employee interviews from around our business to showcase how Pearson’s people are helping create the future of learning.
CC IS
ACKE

“I can’t imagine a better way to learn. “The digital experience that students get can really shape their understanding of the subject – it gives them a real world feel, with first class pedagogy and assessment built in.”
Pearson author Glenn Hubbard on why he and partner Anthony P O’Brien are transforming their classic textbook from print format into a digital education experience.
SIGN IN
Anywhere, anytime technology
See case study on p15
Better learning
See case study on p43
Real-time feedback See case study on p15
At Pearson we have a clear mission: to help people make progress in their lives through learning. We are focusing on the changing needs of the world’s education markets, and our strategy is to combine content and assessment, powered by services and technology, leading to more effective teaching and personalised learning at scale.
That is at the heart of what we do and is reflected through our three strategic priorities: We are growing market share through our digital transformation, focusing on structural growth markets and becoming a simpler and more efficient business. See Our strategy, p13
This will enable us to drive innovation by providing more authentic learning and assessment experiences, helping more learners around the globe build their skills and be better prepared for the future world of work.
Pearson products provide:
1
2
3
0101Section 1 Overview

Financial measuresOur KPIs
We measure our progress against three broad categories of KPIs: financial, business and non-financial measures.
These two pages summarise performance against all of these KPIs. More details on the performance, trends and factors influencing select KPIs are described within the relevant sections throughout this report.R See how we link strategy to how management is
rewarded on p90.
Maintain long-term growthIndicator 2017 Underlying change Reference
Sales R £4,513m -2% p35
Adjusted operating profit R
£576m1 -9% p35
Operating profit £451m2 n/a
Deliver sustainable returnsIndicator 2017 Headline change Reference
Adjusted earnings per share R
54.1p1 -8% p36
Basic earnings per share
49.9p2 n/a
Return on invested capital (gross basis) R
4.3% -0.7percentage points
p36
One year total shareholder return R
-4.5%3 Dividend per share 17p -67% p7
Manage our cash and balance sheetIndicator 2017 Headline change Reference
Operating cash flow R £669m1 +1% p37
Net cash generated from operations £462m2 -11%
Net debt £432m +60% p37
1 See p36–38 for an explanation of these alternative performance measures and p192–195 for full reconciliation of the numbers to the equivalent statutory measure and definitions of headline and underlying variances.
2 Equivalent statutory measure.3 Source: Datastream.
02 Pearson plc Annual report and accounts 2017

Our KPIs
Business measures Non-financial measures
1 Grow market share through digital transformation of our courseware & assessment businesses R
Indicator Performance Reference
2017 Digital revenues4
Digital: 32%
Digitally enabled: 27%
Non-digital: 41%
p14
US higher education courseware
Market position: #1 p14
US assessmentMarket position: #1 p14
UK assessment5Market position: #1 p14
4 Excluding GEDU, WSE and US K-12 courseware.5 Includes both vocational and general qualifications.
2 Invest in structural growth markets
Indicator Performance Reference
Virtual schools (Connections)
Market position: #2 p16
Global online program management
Market position: #1 p16
Global professional testing (Pearson VUE)
Market position: #1 p16
EnglishMarket position (courseware): #2
Market position (testing): #3p16
3 Become simpler & more efficient R
Indicator Performance Reference
Expected cost savings 2017-2020 programme6
c.£300m p18
Restructuring costs in 2017
£79mPlanned headcount reduction 2017-2020 programme
c.3,000 p18
6 Phased plan first presented on August 4 2017, based on December 2016 FX rates. Note: A significant part of these costs and savings are in US Dollar and other non-Sterling currencies and so subject to FX movements over the implementation timeframe.
Talent & employee engagementIndicator Performance Reference
Executive team’s achievement of quarterly employee engagement milestones
100% p27
% of Senior Leadership Group with development goals
89% p27
Employees taking at least one course on Pearson’s internal training programme, PearsonU
83% p27
Strengthen brand & reputationIndicator Performance Change Reference
Awareness of Pearson among teachers, learners and parents
59% +2percentage points
Favourability of those aware of Pearson
89% +1percentage points
Deliver gender diversityIndicator Performance Change Reference
Female Board members
30% no change p29
Female senior managers7
30% -2% p29
Female employees 61% +1% p29
7 Two reporting lines from the Chief Executive.
Reduce our carbon footprintIndicator Performance Change Reference
Global greenhouse gas emissions (Metric Tonnes of CO2e)
104,384 -17% p29
Maintain investment in communities & social innovationIndicator Performance Change Reference
Target 1% or more of adjusted pre-tax profits
£7.2m +1.4% p31
0303Section 1 Overview

About PearsonPearson is the world’s learning company, providing a range of products and services to help people across different learning stages make measurable progress in their lives.
Where we operate
Sales by geography
We operate in 70 markets worldwide, with a focus on those below. We report by geography because this is how we deliver learning: through providing a range of educational products and services to institutions, governments, professional bodies and individual learners in our key markets around the world, helping people everywhere aim higher and fulfil their true potential.
Our largest market including all 50 US states and Canada.
Our international business in established and mature education markets including the UK, Australia, Italy, France, Germany, Spain, Poland, Singapore, Malaysia and Vietnam.
Our growth markets in emerging and developing economies, with investment priorities in Brazil, India, South Africa, Mexico, Hong Kong & China, and the Middle East.
North AmericaSales
£2,929m
Core marketsSales
£815m
Growth marketsSales
£769m
04 Pearson plc Annual report and accounts 2017

Sales by products and services
What we offer We provide content, assessment and digital services to schools, colleges and universities, as well as professional and vocational education to learners to help increase their skills and employability prospects. Increasingly, we do this through partnership models where we bring investment, expertise and scale to help deliver better learning outcomes.
We provide world-leading educational content for use in both traditional and digital learning.
We provide assessment services to measure and validate learner progress, and to certify competency.
We provide integrated services that help educational institutions improve learner outcomes.
CoursewareSales
49%
AssessmentSales
30%
ServicesSales
21%
Assessment Services
Schools
We partner with US educators and districts to develop new, personalised ways of learning through effective, scalable assessments that measure 21st century skills and inform instruction for all learners. In the UK, Pearson is a market-leading, award winning organisation offering academic and vocational qualifications. We’re leading the adoption of AI (Artificial Intelligence) in assessment to support better learning.
See case study, p45
Professional certification
We help organisations measure and make improvements to ensure the success of employees and learners. Test owners and test takers across the world choose us to help develop, manage, deliver and grow their computer-based testing programmes. With the industry’s most secure testing environments, we’re the leader in computer-based testing.
See case study, p42
Clinical assessment
We provide assessment solutions to help professionals through the identification and management of barriers to learning and functioning in daily life. Our wide range of assessment and intervention products are used by psychologists, speech language pathologists, occupational therapists, counselors, human resources and talent management professionals.
English
Our fast-growing test, Pearson Test of English Academic, is the world’s leading computer-based test of English for study abroad and immigration.
Online Program Management
Pearson helps higher education institutions launch or expand online degree programs enabling them to increase enrolments, support online learning, boost graduation rates and deliver on employability.
Virtual schools
Connections Education is an accredited provider of high-quality, highly accountable virtual education solutions for students in grade K–12, including online schools, online courses, instructional tools and more.
See case study, p17
Fully integrated programmes
Our sistemas businesses offers a complete package of products and services for private and public K-12 schools in Brazil. We provide courseware, educational assistance, professional development, management consulting and marketing support, as well as digital content. In India we offer similar whole-school academic partnerships called MyPedia.
See interview on p47
English
Leading the English learning market in Brazil, we offer a diverse methodology in a franchising based model to help learners improve their lives by learning a second language.
Higher Education
Our personalised course content and digital resources help educators build knowledge and unlock learners’ potential. We increasingly sell direct to consumers and to educational institutions so students can come to class completely prepared from day one. This helps drive better learning experiences and outcomes.
See case study, p15
Schools
Our content business for schools in the US, UK and globally provides educational instructional resources, curriculum materials, digital learning tools and assessments to help to educate children across the world. Going forward, we are focusing our school content business on markets outside the US.
English
Pearson English language teaching develops courses, qualifications and learning tools to make teaching English easier.
Link to strategic priorities 1 Grow share through digital transformation 2 Invest in structural growth markets See Our strategy, p13–21
Courseware
0505Section 1 Overview

Chairman’s introduction
Sidney Taurel Chairman
Dear shareholders,
This has been an important year in the company’s transformation and significant progress has been made in 2017. On an operational level, the company has stabilised and, for the first time in several years, Pearson has met both internal and external expectations. We are still in the midst of a transformation and the environment in our largest business, US higher education courseware, remains challenging. However, we continue to take action and have a good handle on these challenges, as well as on the growth opportunities in other parts of our business, leaving us well placed to meet our long-term aspiration to be the leader in digital learning.
From a Board perspective, management is faithfully executing on our strategy, as seen through the actions taken to simplify the company, focus our portfolio, invest in our digital capabilities and invest in growth opportunities that will drive the future of Pearson. 2017 performance provides a solid foundation from which to build, with Pearson aiming to return to underlying profit growth in 2018.
Overseeing our strategic progress
The Pearson strategy must meet the evolving demands of learners while delivering sustainable returns to shareholders. Pearson meets those demands by combining world-class content and assessment, powered by services and technology, to support more effective teaching and personalised learning at scale. To deliver on the strategy, Pearson is focused on three priorities:
1. Grow share through the digital transformation of our courseware and assessment businesses
2. Invest in the biggest structural growth markets
3. Simplify the company, becoming more efficient and delivering better customer experiences.
A key tenet of the strategy is investment in content and technology to ensure Pearson has the skills and platforms to keep its products relevant, to become more agile in its digital capabilities, and to provide a robust infrastructure to deliver efficiencies. In turn, these will help Pearson win market share with products that deliver better outcomes, provide better customer experiences and deliver sustainable long-term growth, driving greater value for shareholders. You can read more about these priorities on p13–21.
Our simplification journey
Pearson enters 2018 in a strong financial position because of tight management of costs, actions to simplify the portfolio and a sharper focus on the biggest opportunities – areas that are consistent with our previously announced simplification strategy. In July 2017, the Board sanctioned the sale of a 22% stake in the Penguin Random House venture to Pearson’s joint venture partner Bertelsmann, and the recapitalisation of its remaining 25% stake in the business.
In the latter part of the year, Pearson also agreed the sale of two of its direct delivery businesses – GEDU and Wall Street English. Pearson has raised £2.4bn from strategic disposals since 2015, which has helped Pearson greatly strengthen its balance sheet, reinvest back into the business and return excess capital to shareholders. In October 2017, Pearson commenced a share buyback programme, completed on 16 February 2018, repurchasing a total of 42.8m shares at an average price of 700p.
Shareholder returns
It is my job to ensure that capital is allocated appropriately on behalf of our shareholders. I know that shareholders are disappointed about the reduction of the dividend in 2017. This was not a decision the Board took lightly and it reflects a continued focus on maintaining a strong balance sheet, investing in Pearson’s digital transformation and sustaining a solid investment-grade credit rating.
“2018 is a pivotal year for Pearson – it is the first in several when Pearson is expected to return to underlying profit growth.”
Governance at Pearson
Leadership and effectiveness
Board members challenge and debate strategy, performance, responsibility and accountability to ensure that the decisions we make are robust. Board activity and performance are assessed annually.
Engagement
Building strong relationships with our diverse stakeholders is crucial to our sustainable success. We aim to engage through many forums, and channels, to build trust. See our Governance report on p61–110
Accountability
Detailed risk assessment and management information shapes all strategic and operational decisions, with clearly defined Board and management responsibilities and processes.
Remuneration
Our remuneration policy aligns with strategy and adapts to market conditions and performance.See our Remuneration report on p90–105
06 Pearson plc Annual report and accounts 2017

Our stated objective in the long term is to rebuild our payment to shareholders, reflecting the Board’s long-standing confidence in the strong future cash generation of Pearson. At this stage, we are focused on striking the right balance between short-term shareholder reward and investing in the long-term success of the business. As a result, the proposed final dividend payment for 2017 is 12p per share, taking the full year dividend to 17p per share.
Board engagement with our investors and company stakeholders
The 2017 financial year has been one of significant engagement with our shareholders. I have enjoyed spending time throughout the year with many of you to ensure that we maintain an open, transparent dialogue, keep you updated on our strategy and receive your inputs.
Since May 2017, Elizabeth Corley, who chairs the Pearson Remuneration Committee, has led our work to engage with investors in connection with Pearson’s remuneration policy and to listen to your concerns. It is clear that shareholders and other stakeholders would like our approach to remuneration to be simple and transparent, closely linked to our strategy and the company’s performance.
We have worked hard to develop an approach that the majority of our shareholders can support. Elizabeth explains our approach in more detail in
the remuneration section of this report on p90–105, and I would like to thank those who helped us refine our proposals.
More broadly, our Board members have been engaging with educators, learners, community and thought leaders, and other stakeholders in a variety of ways. This remains an ongoing area of focus for us – you can read more about our engagement in the governance section on p61–110.
Investing in world-class talent
A company that is moving to a digital-first model needs to have the best and brightest talent to help guide it through the transition. I am pleased that in 2017 we made a number of significant hires – at Board and Executive level, as well as across the entire company.
Over the last few years we have further strengthened the composition of our Board through the addition of more technology knowledge, more international experience and greater depth regarding transformation. For example, Michael Lynton joined us as an Independent Non-Executive Director on 1 February 2018. Michael was formerly Chairman and CEO of Sony Entertainment, and CEO of Sony Pictures Entertainment before that. He is currently Chairman of Snap Inc., the owner of messaging start-up Snapchat, and brings a wealth of experience and expertise.
I believe we have a strong and experienced Board, fully engaged with the business and focused on helping guide Pearson back to growth. All across Pearson, there is a focus on developing necessary skills and capabilities to ensure Pearson has the right talent, building a market-leading, digital-first business.
Looking ahead
Pearson has an important role to play in supporting customers across the globe to make progress in their lives through learning. This encapsulates our work to build a more digital and sustainable business.
2018 is a pivotal year for Pearson – it is the first in several when Pearson is expected to return to underlying profit growth. The Board is confident management has a good plan to deliver on this guidance and that the strategy is working. Longer term, we are excited about the significant growth opportunities globally and about delivering sustainable long-term growth to drive shareholder value.
Thank you for your ongoing support of Pearson.
Sidney Taurel Chairman
Five-year TSR in 2017 was -20.9% which compares with a 57.2% return on the FTSE 100 Index of large UK listed companies. Our recent share price performance has been disappointing but we are confident that the plans and strategy laid out in this report will continue to make Pearson a simpler, stronger company, and that they set the company up for a sustained period of growth and value creation.
We cut our dividend in 2017 to reflect portfolio changes, increased product investment and challenging market conditions in our largest business. Our intention is to pay a sustainable and progressive dividend that is comfortably covered by the earnings of our ongoing business, excluding any contribution from our stake in Penguin Random House.
PearsonFTSE 100FTSEAll-Share
FTSE All-Share Media
STOXX600 Media
-20.9%
-20.9
57.263.0
82.670.0
Total shareholder return (Five years % change)
20172016201520142013
17p17p
52p52p51p48p
Dividend per share in fiscal year (pence)
Key performance indicators Deliver sustainable returns
0707Section 1 Overview
Chairman’s introduction

CEO’s strategic overview
Dear shareholders,
In 2017, in a challenging trading environment, we made an adjusted operating profit of £576m – at the top end of our guidance range – and we reported adjusted earnings per share of 54.1p. We continued to invest in the digital transformation and simplification of the company. We have further strengthened our balance sheet, ending the financial year with net debt of £432m. We expect to make further progress in 2018, and over the next three years, we will start growing again, in a sustainable way.
Returns to shareholders
As a result of our strong cash flow generation and proceeds from the further simplification of our portfolio, we launched a £300m share buyback during 2017, which was completed on 16 February 2018, repurchasing a total of 42.8m shares at an average price of 700p. This was accompanied by a significant cut in the dividend. While difficult, this ensures that we can continue to invest in the business to drive long-term growth and a sustainable and progressive dividend going forward. This will enable us to deliver value for our shareholders.
The global opportunity
Globally, there continues to be a tremendous opportunity in education. The estimated global spend is £3.6tn* per year. Currently only 2%* of that spend is on digital but we expect that to grow. But what does digital, look like in effective practice? It means moving to a world of better learning – anywhere, anytime, with real time feedback – driving better outcomes and more meaningful learning experiences.
It means better understanding not just what works, but how it works and in what context. That is what our commitment to efficacy – and reporting on the impact of the use our products on learning outcomes – is about. We made that commitment in 2013 and, as promised, this year we release audited efficacy reports. We are listening to the challenges and opportunities faced by teachers and students, and designing and developing products based on learning and data science – all with a focus on helping them achieve the outcomes that matter most. Technology has changed how, when and where learning takes place. With our scale and resources, brand and commitment to digital, we are in a unique position to make a significant mark on the future of learning.
Put simply, we need to give flexibility to students, arming them with the opportunities to learn in modern, innovative ways, so they have the foundational knowledge and the 21st century skills to not only adapt but succeed.
Our diverse global customer base shares common values of wanting to have more control of their futures in an increasingly uncertain world. We can enable them to do that by helping drive better engagement and by helping learners realise the true economic value of education – and how it helps them make progress. Our focus is on giving the next generation of learners the confidence to be successful no matter what they do. Read more on our approach to creating value for all our stakeholders on p20–21.
It is with this in mind that Pearson is accelerating its move to digital. We are creating products and services to help people teach, learn and grow in new and powerful ways, while fostering a culture of continuous innovation that will ensure we stay relevant over time. Through this transformation, our products will deliver:
Better learning. Our technology inspires more personalised, flexible and engaging learning that delivers better outcomes
Anywhere, anytime technology. Our technology gives people the freedom and flexibility they crave, giving them the control over when, where and how they learn
Real-time feedback. Our innovative online products and services provide real-time personalised feedback so that teachers and faculty can see where they might need to adjust their lessons, and learners can focus where they need to.
This focus on understanding the evolving needs of learners and on innovating to anticipate and meet those needs drives everything we do.
“We are optimistic about what the future holds and expect to make further progress in 2018.“ John Fallon
Chief Executive
08 Pearson plc Annual report and accounts 2017
* Source: Citi GPS: Global Perspectives & Solutions, July 2017.

Our strategy and priorities
Our mission at Pearson is to help people make progress in their lives through learning. To deliver our purpose, we have a vision to be the trusted gateway to lifelong learning.
In order to deliver on this vision, there are three areas of focus:
1. We will grow share through the digital transformation of our courseware and assessment businesses
2. We will invest to build our businesses in structurally growing markets more quickly
3. We will simplify our company to be more efficient and to deliver a much better experience to our customers.
We need to leverage our core strengths in content and assessment powered by services and technology to bring more effective teaching and personalised learning at scale.
Gain share through our digital transformation
This will help us satisfy changing learner consumption preferences and transition our assessment businesses to deliver fewer, smarter tests.
The single biggest opportunity to gain share through our digital transformation is in US higher education courseware, which makes up 28% of product contribution. These profits have declined over the last few years due to the challenges we face in this business, which will continue for the next couple of years.
However, we are making good progress in shifting the business from ownership to ‘pay for use’, which is a much more viable and sustainable model. We are doing this by ensuring the business is significantly more digital, prioritising access to content over ownership and transacting more product directly to consumers and institutions. Last January, we lowered the price on thousands of eBook rentals, and we also launched a new print rental programme. Our ‘Inclusive Access’ model gives convenience and better value to students and is a direct-to-institution model that allows students to have materials for their course on day one.
We are building a Global Learning Platform, which is a single, cloud-based platform that’s highly scalable and more reliable, and allows us to innovate faster and support a lifelong learning ecosystem for hundreds of millions of learners.
We also know that getting to market more quickly and improving our agility will help us win. To that end, we are making a record level of investment in our business each year – over £700m annually – to drive and scale innovation at Pearson. Some recent examples include:
Fostering complex skills: using machine learning to improve and accelerate essay grading and student feedback in US higher education courseware
Personalised pathways: providing adaptive practice and learning in maths and the sciences in US higher education courseware
Intelligent tutoring: partnering with IBM Watson to embed tutoring dialogue into our courseware products to help students when they need it most
Natural Language Processing: partnering with Microsoft Research Asia to integrate AI capabilities into English language learning curriculum in China.
Our strategy
See Our strategy, p13
Our business
Our strategic priorities
CONTENT ASSESSMENT
More effective
teaching and personalised
learning at scale
Powered by services and technology
Become simpler and more efficient
Invest in structural growth markets
Grow market share through digital transformation1
2
3
0909Section 1 Overview
CEO’s strategic overview

Invest in structural growth markets
Our second strategic priority is to invest in structural market opportunities. That means investing and growing share in our fastest-growing businesses across Pearson, such as:
Professional Certifications (Pearson VUE), which helps more than 450 credential owners across the globe develop, manage, deliver and grow their assessment programmes.
Virtual Schools (Connections Academy), which provides high-quality online education for c.78,000 K-12 students in the US.
English language learning curriculum, instruction and assessment, including our fast-growing Pearson Test of English Academic, the only fully digital test which offers a convenient way for people to demonstrate their English language proficiency as a gateway for other opportunities.
Online Program Management, which helps colleges and universities take their programmes online and improves access for learners who cannot attend a brick-and-mortar school.
Become a simpler and more efficient company
Our third strategic priority is to become a simpler and more efficient company, phasing out dated technologies and systems, eliminating duplication and streamlining operations.
As many of you know, we removed more than £650m in cost between 2013 to 2016. In 2017, we announced our plans to deliver another £300m in cost savings over a three-year period by further simplifying our technology, increasing the use of shared service centres and standardising our processes. This will reduce Pearson’s employee base by roughly 3,000 roles but, more importantly, it will improve the way we operate as a company and respond to the needs of a changing educational landscape.
Looking ahead
We are optimistic about what the future holds and expect to make further progress in 2018. At the same time, we know that we will continue to see challenging headwinds in US higher education courseware for the next few years, and we’ve planned for that. We will offset these headwinds by the broader 70% of Pearson that is stabilising or growing, by creating further cost efficiencies, and by the strength of our cash flow generation and our balance sheet.
It won’t be easy, and it will take time. However, I am confident that we will deliver because no other learning company can match our scale, investment and expertise, which includes the incredible, mission-driven talent at Pearson that each day helps people make progress in their lives through learning.
Thank you for your ongoing support of Pearson.
John Fallon Chief Executive
Preparing people for the jobs of the future is core to Pearson’s mission of helping people make progress in their lives through learning.
A student entering formal education today will be making decisions about his or her career by the year 2030.
That is why in 2017 Pearson partnered with Nesta and the Oxford Martin School, on a research project designed to advance the conversation about the future of work past fears of automation. Offering the most comprehensive research on this topic to date, it better predicts how major societal and economic trends – and the interactions between them – will affect the future of work, and the skills needed to succeed in the future.
Along with technology, factors such as globalisation and climate change are changing our economy and our labour market. This presents challenges, but also creates an opportunity for real change.
Clearly we need to re-evaluate the skills employers and individuals will need – but we also need to update education systems, better support teachers and create effective new tools to support future teaching and learning. The future will be marked by lifelong learning, and we cannot afford to leave anyone behind.
This research provides an optimistic blueprint for reforming education for the needs of this rapidly changing future.
For Pearson, this is a significant opportunity. Our hope is that employers, education systems and policymakers will collaborate to redesign jobs, retrain individuals and encourage greater skills development in order to make a future economy and world where more people can flourish and make meaningful progress throughout their lives.
Read more: www.futureskills.pearson.com
Future of skills
Employment in 2030
10 Pearson plc Annual report and accounts 2017
CEO’s strategic overview

Executive team
Bjarne Tellmann General Counsel & Chief Legal Officer
Giovanni Giovannelli President Growth Markets
Coram Williams Chief Financial Officer
Anna Vikström Persson Chief Human Resources Officer
John Fallon Chief Executive
Kate James Chief Corporate Affairs & Global Marketing Officer
Bob Whelan President Pearson Assessments
Jonathan Chocqueel-Mangan Chief Strategy Officer
Kevin Capitani President North America
Albert Hitchcock Chief Technology & Operations Officer
Rod Bristow President UK & Core Markets Tim Bozik President Global Product
1111Section 1 Overview
CEO’s strategic overview

Technology is changing expectations and increasing possibilities in education.
Market trends
The future of work is about skills not jobsMuch of the conversation about the future of work revolves around fears of technology making workers obsolete. However, when we solely talk about how automation will change the nature of work, we are missing the bigger picture. Rather than jobs disappearing, what is more likely is that the jobs that exist in the future will be broadly
recognisable but the skills required to do them will have shifted. To succeed in the future, individuals, employers and education systems need to respond to the notion that while we are not able to control the jobs that will be available, we can prepare people with the skills that will be most valuable for their ongoing success.
Decline of the traditional textbook?While many students across the world still use traditional textbooks, the rapid pace of technology means that learners increasingly expect to consume educational content in digital format. This is driving rapid advances in accessibility, affordability and a user experience that is immersive, utilising sophisticated technologies designed to help educators increase engagement and produce measurable outcomes for learners.
Rise of personalised learning, virtual and augmented realityThrough the move to digital education, these rapid advances in technology are also enabling individual, adaptive learning to take place at scale. The rise of Artificial Intelligence and virtual reality in the classroom, training
centres and workplace brings exciting new opportunities for learners, schools, colleges and educators, which will help increase lifelong learning, student engagement and, ultimately, improve learning outcomes.
+1.
101
101
10101
10101010101
12 Pearson plc Annual report and accounts 2017

Our strategyOur business
We are transforming our business to meet the evolving needs of our customers. We will do that by combining content and assessment powered by services and technology, leading to more effective teaching and personalised learning at scale.
CONTENT ASSESSMENT
More effective
teaching and personalised
learning at scale
Powered by services and technology
Our strategic priorities
Our strategy is focused on the major growth opportunities – sectors and channels. Our products and services are becoming more personalised, accessible and affordable. And we are becoming leaner and more efficient.
Stakeholder value
Become simpler and more efficient
Invest in structural growth markets
Grow market share through digital transformation1
2
3
Efficacy programme see p22 Sustainability plan see p24
1313Section 2 Our strategy in action

US higher education courseware
Core student assessment and qualifications
US student assessment
Underlying market pressures relating to lower enrolment and print attrition to the secondary market persist for the next couple of years, but as we move to an access model and shift to digital we expect pressures to ease and that we will become a more predictable business with greater visibility* Total student spend: (Pearson estimates) ** Source: MPI
Demographics and demand for qualifications will drive overall growth. After a period of significant curriculum change, we expect greater stability from 2018
Stability returning after a period of policy change in recent years, we have continued to invest and are well positioned to grow again:
Stable market outlook Better contract win momentum Increased partnering opportunities Better margins in digital.
Our business model and strategy
Grow market share through digital transformation1
Better learning. More personalised, flexible and engaging with better outcomes. With anytime, anywhere technology. Giving people the freedom and flexibility they crave, and control over when they learn.
We serve three interrelated customers – students, faculty and administrators. We are meeting the needs of each group by:
Moving from an ownership to access model Selling directly to institutions and B2C channels Accelerating digital formats Investing in better learning experiences and outcomes.
We serve students, teachers, schools and government through our qualifications business where we are the awarding body and own the IP (intellectual property). Our strengths include:
Pioneering digital assessment platforms Strong brands built around quality at scale Investment in IP and new products.
We remain the largest vendor and we have led the shift towards digital testing with our best-in-class platform TestNav.
2017 sales
2017 sales
2017 sales
Size of market* Size of new materials market** Market position**
Size of market
Size of market
Percentage of Pearson’s total sales
Percentage of Pearson’s total sales
Percentage of Pearson’s total sales
Market position
Market position
Market position in General Qualifications
Market share
£1,146m
£256m
£355m
c.$7bn $3.5bn #1
#1
#1
#2
+35%
c.£700m
$1.2bn
Our performance Our market Our approach and strengths
14 Pearson plc Annual report and accounts 2017
25%
6%
8%

US higher education coursewareOffering learners more affordable choices and better outcomes will help us take share through expanding our addressable market. We will do this by:
The exciting pipeline of new products The deployment of our new Global Learning Platform to enable faster innovation and scalability Investing in services, such as analytics.
Core student assessment and qualifications Pioneering a shift to a more digital future, building on innovative online data analytics tool Results Plus, making access to marked exam scripts available online, free to all students, teachers and schools Investing in new products and services to drive growth and market share gain.
US student assessment Digitally administered tests now account for well over 50% of the total Digital lead is allowing us to develop strong partnerships and reduce regulatory risk Leading the adoption of artificial intelligence in assessment providing real-time, personalised feedback, supporting teachers to help learners focus on what they need to achieve.
Our world is changing. As the nature of work evolves, our solutions must foster the knowledge and skills students need to succeed both in school and in their careers.
Pearson is meeting this challenge head on. We are leveraging the latest technology to provide real-time feedback as students engage in open-ended challenges that foster critical thinking and effective communication.
Today, Revel supports engaging learning experiences and activities, including automated essay feedback and scoring. The essay assignments ask students to answer open-ended questions to assess their understanding and communication skills. For selected essay prompts, Revel provides immediate feedback and generates a score for the instructor and students to review in the gradebook.
In the future, the product will offer enhanced automated essay grading and
feedback services that leverage the latest developments in Artificial Intelligence, machine learning, and data science. In this way, an AI-based student essay scoring system will learn instructors’ grading and feedback patterns and automatically apply them to subsequent essays at scale.
The scoring system will measure both what students say and how they say it, assessing both comprehension and ability to communicate a wider variety of knowledge and skills. Each student will receive personalised feedback on their essay and scores for their instructor’s review. Students can then choose to revise their work based on the feedback and resubmit it to their instructor.
The Global Learning Platform will support faster innovation, the continued evolution of Revel, and new learning experiences across our digital products. That will allow us to respond more quickly to students and educators’ needs, and deliver a more personalised approach to learning, on an unprecedented worldwide scale.
Our strategic priorities
The future of learning
What the future of learning looks like in US higher education courseware – Revel and the Global Learning Platform
15Section 2 Our strategy in action
“The Global Learning Platform will support faster innovation, the continued evolution of Revel, and new learning experiences across our digital products.”
Our business model and strategy

Virtual schools
Online Program Management and other HE services
Professional certification
English
Total virtual school enrolment in the US is about 330k Virtual schools are permitted in 34 states, covering about 80% of K-12 population, including the ‘big three’ – CA, TX, FL.
Market growing at 10% Pearson has 40 global partners and runs over 250 programs 45 new programs signed and 14 new programs launched in 2017 Course registration growth of 8%.
Growing market driven by increasing demand for professional credentials and regulatory change.
1.7bn English speakers globally, expected to be 2bn by 2020 A growing opportunity – ELT courseware, assessment, PTE-Academic and adult school franchises.
Invest in structural growth markets2
A digital business where we offer complete services for charter school partners, support for district programmes and blended offerings. Our strengths include:
Strong brand, good learning outcomes, high parental satisfaction Domain knowledge; end-to-end solution Proven partner school model.
The digital promise of “anywhere, anytime learning” opens up one of our biggest structural growth markets:
Strong brand and track record Domain knowledge; end-to-end solution; and can leverage further strengths in content and assessment Proven enterprise/undergraduate model Multi-programme and multi-discipline approach.
We are the largest vendor in this market and have built our brand through:
Security and reliability Leading digital platforms Global network of 20,000 testing centres.
Better customer experience/outcomes Embedded in-course assessment and analytics Alignment to Global Scale of English consistency and scale.
Our business model and strategy
16 Pearson plc Annual report and accounts 2017
2017 sales
2017 sales
2017 sales
2017 sales
Percentage of Pearson’s total sales
Percentage of Pearson’s total sales
Percentage of Pearson’s total sales
Percentage of Pearson’s total sales
* excluding WSE
£274m
£253m
£474m
£305m*
6%
5%
11%
7%
Size of market
Size of market
Size of market
Size of market
Market position
Market position
Market position
Market position in English courseware
Market position in English assessment
$1.5bn+ #2
#1
#1
#2 #3
$1.2bn
$1.2bn
$5bn+
Our performance Our market Our approach and strengths

Our business model and strategy
Virtual schools Expand the addressable market with new partner schools Scale up in existing states while continuing to take market share.
Online Program Management and other HE services Strong pipeline of investment for longer-term growth Expansion of enterprise/ undergraduate models, global growth and employer education.
Professional certification Near-term growth from US MCAT Long-term growth through leveraging operational excellence and expertise.
English Grow English courseware with new product pipeline that leverages strength in content and assessment Grow PTE-Academic, our leading digital test that gives faster, more accurate results
Use insights from our direct delivery businesses in China to power a wide range of partners, deploying our brands, content, assessment and ability to scale online.
In a letter to The Columbus Dispatch, Alex wrote:
“I enrolled in the online charter school before my junior year because I had a very difficult experience in my previous school. I had grown to hate everything about school (especially my math courses) and I didn’t care if I finished high school. College wasn’t even a consideration. Once I started at OCA, I discovered I could learn at my own pace and my teachers motivated me to dive deeper into subjects that interested me. Along the way, I started to love studying and learning and I even found that I actually liked science… I really don’t think
that I would be anywhere close to where I am today if I hadn’t had the opportunity to attend Ohio Connections Academy… I wish to thank all my teachers and counselors at OCA who worked with me and inspired me. They really changed my life at a time when I thought education was pointless.”
Alex recently graduated from the University of Alabama and plans to travel to Germany to conduct research as part of her Fulbright Scholarship to the Max Planck Institute for Plasma Physics, and then to begin her Ph.D. programme in physics at Princeton University.
Alex LeViness
Learner story
Ohio Connections Academy (OCA) virtual school graduate
We are currently the number two player in virtual schooling in the US, but are growing more rapidly and have a strong reputation in the market.
We are aiming to build share by deepening existing relationships, accelerating the opening of new schools and investing to drive greater efficacy through our product offering.
Our model is proven, our results are strong academically and we have a powerful brand which is highly regarded by parents and educators alike.
17Section 2 Our strategy in action
The future of learning
Virtual schools
Connections Academy
Our strategic priorities
“I started to love studying and learning and I even found that I actually liked science… I really don’t think that I would be anywhere close to where I am today if I hadn’t had the opportunity to attend Ohio Connections Academy…”

2013 20172016 2020
Become simpler and more efficient3
Our competitive advantage Record level of investment
Pearson’s strong balance sheet underpins the continuing investment in our digital transformation and structural growth markets. We are investing over £700m a year to become the winners in digital education.
Global player
We have a truly global scale and focus. We operate in over 70 markets worldwide. Our products and services benefit from
being centrally developed, globally deployed with local expertise and capabilities ensuring success.
Move to digital
Pearson’s products and services are becoming more digital and personalised, offering more affordable choices for students with better learning outcomes. This is building a more sustainable and profitable business with a more visible and predictable revenue profile, based around access not ownership models.
Common platforms
Our products and services are increasingly being delivered across common platforms, enabling a leaner Pearson, driving significant revenue and cost synergies.
Market leader
Our competitive position is strong and we occupy either number one or number two positions in all our major markets. We are focused on gaining share through our digital transformation and building sustainable, leading positions in our structural growth markets.
Focus areas
Centralising functions for a simpler and leaner organisation Commence roll-out of single global Enterprise Resource Planning software
Focus areas
Further simplification through shared services centres Leaner organisations through reduction in headcount Reduction in number of legacy applications, data centres and office locations Complete roll-out of global Enterprise Resource Planning
Recent activity
US K-12 courseware Held-For-Sale in 2018 Exited WSE, GEDU, Utel, smaller businesses in 2017
of cost savings1 of cost savings2c. £650m c. £300m
2020E+2014 2020E+2014 2020E+2014
Applications Data centres Offices
3,024 93 >200
<100
c.3006
Infrastructure simplification
Current headcount
Disposals3 Net exits 2020 headcount
32,500
c.24,500
c.5,000
3,000
Headcount reduction
18 Pearson plc Annual report and accounts 2017
Our business model and strategy
1 Calculated at year end 2016 exchange rates.2 Phased plan first presented on August 4 2017, based on December 2016 FX rates. Note: A significant part of these costs and savings are in US Dollar and other
non-Sterling currencies and so subject to FX movements over the implementation timeframe.3 Not including US K-12 courseware.

Our business model and strategy
19Section 2 Our strategy in action
What excites you most about the work you do at Pearson?CC
What excites me the most about working for Pearson is how we are using technology to revolutionise and drastically transform education. Our customers and learners are at the heart of everything that we do, and we are bringing them the best – and most advanced – technologies so that they have engaging, highly interactive experiences with our products. Leveraging the latest technologies such as artificial intelligence, machine learning, augmented reality, virtual reality, advanced real-time rendering, simulation, to name a few, will enable this experience, and ultimately improve their learning outcomes.
What is your main goal for 2018? CC
This year, we are shaping the future of education by bringing our Global Learning Platform technology to life through next-generation software. The platform will enable us to deliver unparalleled learning experiences to our customers and learners around the world.
How are you helping Pearson in its transition to digital?CC
Pearson’s digital transformation isn’t just taking our legacy products and making them digital, it is much more than that.
Every aspect of the company is undergoing transformation; how we operate, our processes, how our teams work, how we build and deliver, it’s everything. In building the Global Learning Platform, our teams have been laser focused on using the best data to learn as much as we can about our customers’ behaviour and what we as a company need to do in order to give them world-class learning experiences.
What is your biggest win at Pearson to date?CC
Personally, I have enjoyed sharing the developments of the Global Learning Platform with our employees, especially the first-look demo which brought the idea of the Global Learning Platform to life and showed the promise of profound educational changes. Transforming education as we know it today is no easy feat, and I am humbled to be the leader of an exceptionally high-performing team, who collectively have delivered – and continue to deliver – so that we deliver on Pearson’s mission. The team are not only building next-generation products and software, but are also serving our current customer base by ensuring all of the products across our portfolio are stable, reliable and deliver a quality experience for our customers.
“Pearson’s digital transformation isn’t just taking our legacy products and making them digital... every aspect of the company is undergoing transformation.”
CC Cedrick Collomb Senior Vice President for Global Product Technology
Helping create the future of learning
An interview with Cedrick Collomb, Senior Vice President for Global Product Technology
be highly scalable and more reliable, speeding up innovation
support customer and third party integration
be a foundation for a lifelong learning ecosystem
Global Learning Platform in one minute
Over time, all of Pearson’s products will be
brought onto a single platform which will allow us to deliver:
GLP products will:
Personalised learning experiences across our portfolio ...
Using machine learning and Artificial Intelligence innovation
At a global scale ...

Value created for our stakeholders Our strategy is driven by the belief that education is evolving to meet the demands of today’s learners, and we are a driving force behind that change. This will enable us to create long-term, sustainable value for our shareholders, customers, partners and learners across the world.
Educatorswant more engaging ways to connect with their students and better and more timely feedback on student progress to help set them up for success.
Administrators in a cost-conscious environment, aim to deliver innovative and high-quality experiences that set students on a course to become prosperous lifelong learners.
Industry is looking for the educational system to help drive growth and innovation by graduating students from high school prepared for college or a career, and for higher education to become more accessible and affordable. A strong education system is crucial to preparing people for prosperous employment and successful lifelong learning.
Government on a local, state, federal and national level are trying to address inequities in the growing skills gap, by providing education systems attuned to the needs of the workforce and designed to deliver the education and training individuals need to prosper in today’s labour market. Governments and regulators also set policy to ensure that both businesses and consumers are provided with the most effective legislative frameworks that help drive sustainable growth.
No one can predict with certainty what the future of learning will look like, but we know that technology has enabled autonomy and customisation for the individual. Education, without a doubt, has to follow suit. Not all students, educators and institutions are the same; they each have to choose what is most likely to make them successful.
Building skills around lifelong learning, agility and innovation will give the next generation of learners the confidence to be successful, no matter what they do. We offer traditional tools and methods and continually innovate so that learners are given the power to choose what, how, when and where they learn.
Learners Want control over their education and are increasingly questioning the value of an education, and the traditional trappings of institutions – whether it is courseware, outdated teaching methods or brick-and-mortar institutions.
20 Pearson plc Annual report and accounts 2017
Value for our customers
Addressing theneeds of today
Our business model and strategy
learnersGovermants & other education agenda setters
Shareholders and investors
Teachers & educators
Govermants & other education agenda setters
Customers
Suppliers
Govermants & other education agenda setters

Our business model and strategy
For our learners:Developing an innovative technology platform to support and enable lifelong learning, focusing on achieving better learning outcomes.
For our authors:Share their passion for teaching and research to bring new skills and concepts to life for learners.
For our employees: Creating a healthier company, with clear expectations, sufficient resources, supportive relationships and clear accountability to deliver a very ambitious programme of change and transformation.
For our partners and suppliers:Building successful business partnerships across the education ecosystem to build joint success and growth.
For governments: Building strong political and institutional relationships to support our stakeholders. We are committed to aligning our agendas – we provide counsel and share our knowledge on the future trends in global education; we create opportunities for private-public partnerships.
We are developing new organisational capabilities to create value for all our stakeholders while keeping our learners at the heart of everything we do. Our culture will enable sustained success, capturing external ideas, fostering top-down innovation and driving business partnerships and collaboration.
learners
Employees
Govermants & other education agenda setters
Teachers & educators
International, non-govermental & non-pro�t organisations
21Section 2 Our strategy in action
Our approach to value creation
Shareholders and investors Govermants & other education agenda setters
Value for our shareholders:
This will ultimately help us achieve long-term sustainable growth for all our company shareholders.
For our customers:Building a truly customer-centric operating model based on effective use of data to drive strategic insights.
Channel partners:Help ensure learners have the course materials they need to succeed in their studies.
Deliveringvalue
Govermants & other education agenda setters
Teachers & educators
Govermants & other education agenda settersTeachers & educators
Media
Customers
Suppliers
Please see the stakeholder engagement section of the Governance report for more on how we build strong relationships with our diverse range of stakeholders on p88–89

What we did and what we have learned
When we launched our commitment to report on the efficacy of our products, we aspired to have impact in three areas:
evidencing that our in-market products improve the outcomes that matter most to customers and learners; supporting evidence-based product innovation; and galvanising the education sector and all learning companies to measure their impact by the outcomes they deliver for learners.
Over the past four years, working across all of Pearson’s major digital product portfolios, we embedded efficacy and research across product development in both early-stage product strategy, design and development, and later stage product improvement. For the majority of our in-market digital supplemental products, we have evidence that there are statistically significant relationships between the use of our products and student achievement.
Learning
In order to understand where, when, how, why and for whom our products are effective, we focus on defining and collecting evidence of impact on the outcomes that matter most to our customers and learners, including access and engagement, competency and skill, achievement and progression.
We have evidence that there are statistically significant relationships between the use of many of our digital products and course achievement outcomes. However, the efficacy of a digital product cannot be separated from the way that product is implemented, or the context in which it is used. Who is using the product – what their prior knowledge and experience is, implementation – the way a product is integrated into teaching and learning – and product alignment – the way that the features of a product are designed, aligned and used to support the achievement of learning goals – all have a significant impact on the outcomes that can be achieved.
The more we can engage with our customers to better understand the outcomes that matter most to them; select products that have features that can support the delivery of those outcomes; and share best practices about how learning technologies can be integrated into their teaching, the more likely they will be to achieve their desired outcomes.
Product innovation
Our efficacy research to date has focused on measuring the impact of the use of digital supplemental products on course achievement goals. We have used what we have learned about our in-market products to make incremental improvements to
existing products as well as to support new product innovation.
In parallel, we are further driving more evidence based approaches to product development by applying evidence about what works from the learning and data sciences to the design, development and ongoing improvement of products. We are focusing on helping learners develop the knowledge and the skills they need to be successful in the future.
As we progress with the development of fully digital learning experiences, we expect that the combination of these elements – paired with implementation support for our customers – will enable an even greater impact on learning.
Education sector
In 2013, Pearson was the first learning company to make a public commitment to reporting on the impact of use of our products on outcomes. Since then, both our traditional and non-traditional competitors have announced similar efforts. Today, we remain the only learning company in the world that is subjecting its efficacy statements to external audit and peer review. Put simply, we are the only company that has made a public, evidence-based commitment to helping more learners learn more.
https://www.pearson.com/corporate/efficacy-and-research.html
We made a commitment in 2013 to report annually on the impact of use of our products on outcomes, and to externally audit the reports by 2018. From 2014–2016, we shared preliminary efficacy findings; this year we are proud to publish our first set of audited efficacy reports, certified by PricewaterhouseCoopers. Collectively these reports are representative of products impacting the lives of 18m learners. We are proud to be the only learning company committed to efficacy with such rigour and at such scale.
Connections
In 2017 we took a critical lens to better understand the efficacy of Connections Academy. This work was intended to help us evaluate how we are educating young people through our virtual schools. Through three different methodological approaches, we sought to better understand the students we serve, as well as their performance at
Connections Academy relative to peers in brick and mortar schools with similar populations.
Our research confirms that our virtual schools serve a diverse and unique student body with some of the highest mobility rates in the United States. When we adjust for this student mobility and control for prior student achievement, our studies found that the
academic performance of Connections students is comparable to that of students in brick and mortar schools.
We look forward to sharing this research with the virtual schools sector to help inform the discourse around virtual schools, so that students and families who may benefit from such learning environments have the opportunity to do so.
Efficacy
22 Pearson plc Annual report and accounts 2017

Efficacy
SUSTAINABILITY OVERMATTER
EMPLOYEE INTERVIEW (SENIOR MEMBER OF THE GLP TEAM)
What excites you most about the work you do at Pearson?KE
Working for a business that seeks to combine commercial growth with impact on learning. For me this is all about understanding the greatest learning-related challenges and needs our customers and learners have now, and will have in the future, and then applying outcomes-focused, evidence-based design to our solutions. This is what keeps me up at night (in a good way!) and what gets me up in the morning.
What are your main goals for 2018? KE
At the company level, our efficacy & research goal is to continue to improve our impact on learning outcomes. In 2018, we will be doing this by:
1. Developing evidence-based products, applying efficacy improvement activities and undertaking efficacy reporting
2. Using efficacy & research more frequently to help our colleagues have learner-led conversations with our customers
3. Developing the efficacy & research skills and expertise of our people
4. Actively participating in external conversations on efficacy & research
In particular, we want to apply this work to informing the design of products that develop the skills needed for both work and life in the future.
How are you helping Pearson in its transition to digital?KE
I’m passionate about the role we need to play in exploring and explaining three things in digital teaching and learning: the role of the educator, the role of the student and the role of the technology.
What is the most important milestone Pearson has reached from an efficacy & research perspective to date?KE
The most important milestone, to date, is yet to come. We will reach it at the end of March 2018 when we release our 2018 Efficacy Reports. We will be the first learning company in the world to undertake, and release, non-financial reporting on the impact of use of our products on outcomes for learners. External reporting and auditing for the first time is an important milestone for Pearson and efficacy. However, the ongoing commitment to external reporting is a means to an end: the primary goal being for Pearson to use evidence about how to improve learning to develop and sell best-in-class products and services.
“In 2018, we will be the first learning company in the world to undertake, and release, non-financial reporting on the impact of use of our products on outcomes for learners.”
Helping create the future of learning
An interview with Kate Edwards, Senior Vice President Efficacy & Research
KE Kate Edwards Senior Vice President Efficacy & Research
2323Section 2 Our strategy in action

Sustainability is integral to our company strategy. This is no accident as commercial success cannot be separated from ethical and sustainable business practice. It is fundamental to achieving our mission to help people progress in their lives through learning.
Sustainability
Two years ago, Pearson adopted its 2020 sustainability plan. It provides a framework for the business to focus on the most important ways we can contribute to solving some of the world’s greatest social and environmental challenges, while helping to grow and strengthen our business at the same time. By setting a vision to integrate sustainability into every aspect of the company, the plan continues to guide us as we deliver on our business strategy.
The plan was designed to reflect the United Nations Sustainable Development Goals (SDGs), which together point towards a more equitable, ethical and environmentally sustainable world. Of the 17 SDGs, we have prioritised Goal 4 on quality education, Goal 8 on decent work and economic growth and Goal 10 on reducing inequalities. Quality education is both one of the goals but also a factor underpinning success across all the goals. As such, a stronger and more sustainable Pearson in turn will allow us to help more people progress.
Sustainability Plan
Our 2020 Sustainability Plan is designed to create value for our learners, shareholders and society. It is built around three pillars:
1. Be a trusted partner
2. Reach more learners
3. Shape the future of learning.
More information on our performance will be available later this year when we publish our 2017 Sustainability Report. In this section, we:
Set out the key material issues for the company and how these relate to our risk management process
Outline how sustainability is governed at Pearson
Report on highlights from each of the three pillars.
Our material issues
Our 2020 Sustainability Plan is informed by our material issues – those most relevant to the sustainability of the business. They were identified following consultation with senior leaders and employees, external experts and stakeholders, and a review and benchmark of current policies and priorities. We then further prioritised nine key issues.
These issues represent both opportunities for growth as well as risks to revenue. We continue to map these sustainability issues against our enterprise risk management process. As part of our risk management process, company-wide risks are tracked across geographies and functions. See Our material issues matrix p26
Sustainability governance
The Reputation & Responsibility Committee, a formal committee of the Board, provides ongoing oversight, scrutiny and challenge on both matters relating to our sustainability strategy and our corporate reputation. Learn more on p86.
The Pearson Executive drives implementation of business strategy, including responding to our sustainability issues. The Responsible Business Leadership Council oversees the development of the strategy on behalf of the Board. It is chaired by our Chief Corporate Affairs & Global Marketing Officer and comprises senior leaders from across the business.
Skills for jobs
24 Pearson plc Annual report and accounts 2017

Be a trusted partner1
Pearson has a set of commitments that together define responsible business for us. These are to:
Ensure that our products and services are inclusive, appropriate in content to the age, location and ability of the learner and are easy and safe to use and access
Respect and progress our employees and provide opportunities for them to get involved in their local communities
Respect human rights, including protecting data entrusted to us by learners and our customers. More information on our approach to data privacy and security can be found in the Principal Risks section (p58)
Extend our commitments on human rights and environmental responsibility to include our suppliers, franchisees and other business partners
Deliver against our targets to make more efficient use of resources and on our response to climate change.
Deliver high-quality products and services
Learners trust and depend on Pearson to provide course materials that are relevant, appropriate, inclusive, safe and work well. Our primary responsibility to learners is through the products and services we sell and how we extend our reach. Our section on Efficacy (p22) describes the progress we have made in ensuring our products have their intended learning outcomes.
A focus area last year was the development and release of a new global editorial policy designed to ensure we consistently publish high-quality content and prevent errors or offensive content. The policy is global in scope and builds upon both existing editorial principles in operation today across our business as well as a review of external guidelines.
This work was happening at the same time as the discovery of inappropriate material in our Concepts in Nursing series of textbooks. We took immediate action – issuing a public apology, removing the offensive material and offering a free replacement copy to students who requested a reprinted copy.
We now have more work to do, and work will begin on training on the new policy early in 2018. This is a first step ahead of policy due diligence. We are also starting work in partnership with Stonewall on developing guidelines for our UK Schools business on how we can make our products more LGBT inclusive.
Respect and progress our employees
Our commitments to our people as a responsible employer are to:
Inform, support and equip colleagues to work collaboratively
Encourage and reward high performance, nurturing talent and creating a culture where all are able to realise their individual potential
Provide a safe and healthy work environment for our employees and the learners we serve. See the Principal Risks section on p54 for more detail on how we manage this issue
Help our employees understand how we are doing as a company, including how world and sector trends might affect them.
Sustainability planBuilding a sustainable business is critical to achieving our mission and ensuring our long-term competitiveness. Our customers, employees, partners and learners expect us to uphold the highest business standards, to continuously enhance the quality of our products and to contribute to their communities.
To help achieve this, we have three sustainability pillars:
Our plan aligns with the United Nations SDGs creating better outcomes for customers and society, and stronger financial returns for shareholders.
Reach more learners
Shape the future of education
Be a trusted partner 2 31
4 – Quality education
8 – Decent work and economic growth
10 – Reduced inequalities
Deliver high-quality products and services
Respect human rights
Develop our people and communities
Protect our natural environment
Build a sustainable supply chain
Ensure strong governance
Leverage technology for equitable learning outcomes
Build skills that foster employability and inclusive economic growth
Promote education for sustainable development
Contribute to global research, dialogue and collective action on quality education
Improve access to and affordability of products and services
Collaborate to reach underserved learners
Sustainability
2525Section 2 Our strategy in action

Sustainability
Our material issues
Alignment of material issues to principal and other Pearson risks
Sustainability report 2016 Material issues
Annual report 2017 Principal risk
Company-wide risk Business area risk monitoring
Disruptive distribution models 2 YES Global Product
Core
Growth
North America
Environmental, Social & Governance
Competitiveness of digital products 2
Affordability 2
Learner expectations 2
Academic quality 2
Summative testing 5 YES Assessment Core
Lobbying and public policy 4 YES Core
Growth
North America
Assessment
Data privacy and security 12 YES Global Product
Core
Growth
North America
Assessment
Legal
Tech & Ops
Digital infrastructure 8 YES Global Product North America Tech & Ops
Security, health and safety 6 7 YES Core
Growth
HR
Assessment
Environmental, Social & Governance
Tech & Ops
Accessibility* – – Assessment Legal Environmental, Social & Governance
GHG emissions and climate change – – Environmental, Social & Governance
LOW
Stak
ehol
der c
once
rnH
IGH
LOW Business impact HIGH
Data privacy and security
Corporate governance
Security, health and safety
21st century skills
Girls’ and women’s empowerment and equality
Lobbying and public policy
Summative testing
Learner expectationsEconomic
empowermentCompetitiveness
of digital products
Accessibility
Literacy
Digital infrastructure
Academic quality
Affordability
Progression
GHG emissions and climate change
Education for sustainable development
Disruptive distribution models
Materiality matrix
The following matrix shows how we mapped our 19 issues, and highlights the nine that we have deemed to be the most material for the purpose of our sustainability strategy.
We will evaluate, refine and talk with stakeholders about our material issues on an ongoing basis, in the spirit of continuous iteration and improvement.
Key to material issues
Nine material issues in our sustainability plan and reporting
Corporate functions
Societal issues
Education industry
Environmental issues
Degree of control
High Medium Low
* Emerging risk See Principal risks and uncertainties, p50
26 Pearson plc Annual report and accounts 2017

Employee engagement survey
Employee engagement remains a consistent priority as we navigate changes to our business. Last year, each member of the Pearson Executive Management team committed to respond to the key themes highlighted in our 2016 Employee Engagement Survey. Each Executive developed a plan with progress monitored quarterly. Highlights from those plans:
Aspect Issue Response
Career Development and Mentoring
More information for employees on how to progress their careers at Pearson
Over 1,500 employees participated in Career Development Workshops across 111 sessions in 27 locations in 23 countries. Over 100 mentoring relationships have been established.
Company Strategy To do more to communicate on our products and reporting on progress
We introduced Discovery Days – forums to engage employees on our strategy, products and brand and provide workshops to gain new skills. 24 Discovery Days were held in 2017 in 14 countries. Since 2016, 24% of Pearson employees have attended a Discovery Day.
Learning and Development
More opportunity to develop functional and management skills
Academies were launched on Technology, Product, Sales and Finance to strengthen expertise and career development.
We introduced Workforce 2020 capabilities defining who we are, how we act and what we do. These provide guidance on the capabilities Pearson expects.
We launched our Leadership Academy, delivering what leadership looks like at all levels in the organisation. The Academy offers a range of programmes, resources and support. It includes a pilot of a new Manager Fundamentals training programme to help prepare new managers for success.
All of the above are available through Pearson U and open to all employees. In 2017, 25,725 employees took at least one course in Pearson U.
During 2017, we followed up by asking 1,700 Pearson leaders to take an organisational health survey to help us understand areas where we could further boost performance. Key findings include the following:
Aspect: Action taken:
Being clear on our strategy Set our three strategic priorities, published a company-wide performance dashboard, appointed a new Chief Strategy Officer and been clear on our priorities as part of our brand focus
Accountability and ownership Have been more explicit on expectations of individuals to collaborate and deliver against the strategy
Innovation and partnership Invested in new platforms and partnerships
Insight Created a global research and insight function
Operational excellence Accelerated the investment in centres of excellence, driving efficiency through investment in technology
Diversity and inclusion Established a new committee and global team to help us better reflect the communities we serve
Pearson continues to manage considerable amounts of change both within the business and outside it. We have introduced new business models as well as continued our investment programme in new platforms and products to help us simplify and standardise how we work.
During 2017, we announced additional plans to achieve annualised cost savings of £300m by 2020, including a target to reduce the total Pearson team by 3,000. We continue to provide comprehensive information on the trends behind these plans, regular communication with extra detail on the process for affected teams and consultation as well as support for colleagues leaving the company.
Culture, mission and values
Our values – to be brave, imaginative, decent and accountable – continue to guide us in implementing our strategy. They are embedded into our performance assessment, which means all employees are evaluated on and rewarded for acting consistently with them.
The Pearson Code of Conduct underpins our values by setting out the ethical, social and environmental standards of behaviour we expect from employees, and we have a companion code for business partners.
The Code was refreshed and last circulated in September 2017. We make sure everyone in Pearson is aware of the Code and confirms they understand and will comply with it. Agreeing to the Code is a mandatory part of the on-boarding process for all new Pearson employees. We have achieved our target of 100% of employees having signed up to the Code.
Many of the areas covered by the Code are supported by detailed policies and procedures. For example, anti-bribery & corruption, health & safety & safeguarding. Learn more about these issues in our section on Principal Risks (p54–55).
£
Sustainability
2727Section 2 Our strategy in action

Sustainability
We operate a free, independent, confidential telephone helpline and website available to anyone who wants to raise a concern. We have a clear non-retaliation policy in place to encourage people to share the issues they have and we ask about how comfortable people are in raising concerns in our employee engagement survey. In 2017, we had 87 concerns (107 in 2016), which were investigated and, where possible, the outcome shared with the whistleblower. As in previous years, the majority of the concerns related to HR practices. Material concerns are reported to the Pearson Audit Committee.
Diversity, equality and inclusion
At Pearson, we value the power of our differences. Our global Diversity & Inclusion (D&I) programme aims to build a better, stronger company for our employees, our learners and the communities we serve.
Our commitment is to aspire to maintain a work environment that’s inclusive as well as diverse, in which our people can be themselves. And we are building a culture of innovation and learning where every idea and perspective is valued, so that our products reflect the people we serve – our teachers and learners.
Highlights of our activity include:
Expansion of the new global D&I team and appointment of a senior leadership role to drive the agenda. Establishment of a new Executive level committee led by the General Counsel and Chief Legal Officer to provide strategic oversight. Around 2,400 employees get involved in our eight global employee resource networks. The networks are for women, parents, veterans, Latinos, the LGBT community, generational differences, people with disabilities and employees of black and/or African ancestry. Reached more than 6m people through initiatives such as our #DiscussDiversity Twitter chats Over 2,400 people completed D&I related training courses For a fifth year, achieved a perfect score of 100% in the 2017 Corporate Equality Index run by LGBT advocacy group the Human Rights Campaign.
Respect human rights
In 2017, Pearson undertook a review of its approach to human rights. Drawing on the expertise of BSR (Business for Social Responsibility), we considered how our operations, products and services, as well as the activities of our business partners, may have a positive or negative impact. The work considered the rights of learners, parents, employees and contractors, teachers and educators, customers, supply chain workers and the broader community.
Pearson also looked at how its policies seek to respect human rights standards defined by internationally agreed principles: the International Bill of Human Rights; the International Labour Organization Declaration on Fundamental Principles and Rights at Work; and the United Nations Guiding Principles on Business and Human Rights.
As a result of the human rights review, we have identified priority human rights risks and opportunities and have developed a roadmap to address them. For more, see the section on compliance in Principal Risks on p59.
Our Business Partner Code of Conduct sets out our requirements of third parties and, as part of our global approach to procurement, we include specific obligations relating to human rights compliance in new and renewed supplier agreements. We audit suppliers in high-risk categories in our book printing supply chain.
A concern across the value chain is for ensuring our activities are free from slavery, servitude, forced or compulsory labour and human trafficking. A statement on the steps taken by Pearson to combat modern slavery was approved by the Board and can be viewed on the Pearson website (www.pearson.com).
As a result of our review on human rights, we have identified relevant areas of risk and opportunity for Pearson. These include providing a safe and inclusive environment for learners, employees and contractors as well as analysing how technology and partnerships impact on rights. We do not currently have an overarching human rights policy, although we intend to introduce one in 2018. We do have policies in place for key elements of human rights including editorial content, health & safety, safeguarding and data privacy.
Working with the 30% Club on women’s mentorship and empowerment
To support Pearson’s commitment to progressing women within our organisation and supporting women in leadership, we joined forces with the 30% Club on a mentorship programme in the UK.
The 30% Club is dedicated to bringing the percentage of women on Boards and in executive management up to 30%. Expanding mentorship for women is a key part of reaching that goal.
Our Women in Learning and Leadership (WILL) group in the UK worked with the 30% Club to facilitate a cross-company mentorship for talented mid-career Pearson women via a scheme that began four years ago.
At a 2017 award ceremony, the 30% Club named Pearson ‘Dynamic Mentoring Organisation of the Year’ for our work around expanding diversity and inclusion; for developing events and services to harness
the power of mentoring; and for supporting mentors and mentees to make time for meetings and fully embrace the value of mentoring. In the same award ceremony, Pearson employee Carol Hill was awarded Committed Mentee of the Year Runner Up.
“Being a mentee in the 30% Club scheme has been an amazing experience for me. I was paired with a mentor from the banking industry who acted as an unbiased sounding board for me as I tried to work my way through my career goals.”
Carol Hill, Director of Global Product Lifecycle Implementation at Pearson
28 Pearson plc Annual report and accounts 2017

Key performance indicatorsGlobal Greenhouse Gas emissions dataMetric tonnes of CO2e
Emissions from 2015 2016 2017
Combustion of fuel and operation of facilities (GHG Protocol Scope 1) 22,343 19,093 15,691
Electricity (GHG Protocol Scope 2) 88,831 77,579 61,047
Emissions relating to air and rail travel, electricity transmission, waste and water (GHG Protocol scope 3) 35,644 29,714 27,646
Total 146,368 126,386 104,384
Intensity ratios 2015 2016 2017
Scope 1 and 2/sales revenue 24.8 21.2 17
Scope 1 and 2/FTE 2.7 2.95 2.53
Methodology: We have reported on all of the emission sources required under the Companies Act 2006 (Strategic Report and Directors’ Reports) Regulations 2013. These sources fall within our consolidated financial statement. We do not have responsibility for any emission sources that are not included in our consolidated statement. The method we have used to calculate GHG emissions is the GHG Protocol Corporate Accounting and Reporting Standard (revised edition), using the location-based scope 2 calculation method, together with the latest emission factors from recognised public sources, including, but not limited to, the UK Department for Business Energy & Industrial Strategy, the International Energy Agency, the US Energy Information Administration, the US Environmental Protection Agency and the Intergovernmental Panel on Climate Change. The data in the table above has been independently verified by Corporate Citizenship.
Key performance indicatorsGender diversityWomen in Pearson %
Pearson works hard to create an environment where women have the opportunity to build careers in all functions and at all management levels of the organisation.
At Board level, 30% of our members were female as at the end of 2017. As a founder member of the 30% Club, we remain committed to the target of a minimum of 30% representation of women on the Board.
2015 2016 2017
Board of Directors 33% 30% 30%
Senior leadership* 34% 32% 30%
All employees 59% 60% 61%
* Two reporting lines from the Chief Executive.
Over the last two years, we have seen a fall in the proportion of women at senior leadership level. To help reverse this, we will increase our focus and investment in diversity for 2018. Our CEO has recently become a signatory to the latest 30% Club challenge to reach and maintain a minimum of 30% representation of women in senior leadership.
In the UK, the government has introduced new regulations designed to help address the gender pay gap. Pearson has provided information on its gender pay gap in the UK and has made a commitment to extend our reporting globally by 2020.
Protect our natural environment
Climate change remains a focus for us as one of the most serious issues facing the planet and GHG emissions is one of our material sustainability issues.
Minimising our environmental impact is not just the right thing to do; it helps deliver cost savings.
The environmental impact of our directly controlled operations – our buildings and business travel – is low. Our single most significant impact area is energy use and this accounts for less than 1% of our supply chain cost. As such, environmental risk has been considered and does not feature as a Principal Risk for the company.
Nevertheless, good environmental stewardship by companies is expected by stakeholders. This is why GHG emissions was identified as a material sustainability issue for the company.
We maintained our climate neutral status for our directly controlled operations – a commitment first introduced in 2009. Our strategy is for:
Reduction: A 50% reduction in operational emissions as at the end of 2017 compared with a 2009 base year.
Renewables: We maintained our record of purchasing 100% of the electricity we use from renewable sources and generate our own renewable electricity at five of our sites. Offset: Since 2009, we have now protected over 1,600 hectares of forest. One of our offset providers – the Woodland Trust – has also again provided offsets equivalent to those generated by the printing of this report.
Pearson has had an environment policy in place since 1992. We remain certified against the Carbon Trust Standard for our global operations and were the second ever organisation to secure the standard which recognises leadership in measuring, managing and reducing year-on-year carbon emissions. We also continue to be certified against ISO 14001, the environmental management standard in the UK and Australia. This standard incorporates both internal and external audit.
The Task Force on Climate-related Financial Disclosures has published recommendations for voluntary, consistent climate-related financial risk disclosures for use by companies. The biggest impact on the environment for Pearson is in its supply
chain through the purchase of paper and the associated carbon emissions. During 2018, we will consider the extent to which Pearson should amend its disclosures in light of the taskforce recommendations.
On paper, our focus is on sustainability of supply, being efficient in how we use paper and on promoting responsible forest management. We:
Have a policy on environmental sourcing of paper Discuss our approach with suppliers, customers, environmental groups and investors Are active members of industry bodies dedicated to responsible forest management Hold Forest Stewardship Council (FSC) chain of custody in the UK as does LSC Communication, our outsource partner in North America, allowing books in those markets to carry the FSC label.
We will publish full details of our environmental performance including other materially important emissions such as water use and embedded carbon dioxide in purchased raw materials in our 2017 Environment Report.
2929Section 2 Our strategy in action
Sustainability

Sustainability
Innovating to address youth unemployment in South Africa
Through Tomorrow’s Markets Incubator, Pearson employee Carolynne Lengfeld, Head of Learning Innovation in South Africa, is leading a team that has worked to develop Project Boost, a recruitment, job preparation and integration service in South Africa.
Boost aims to address the unemployment challenge for low-income youth, while making recruitment of high-quality candidates more efficient for potential employers. Unemployed young people who participate will receive support and training at no cost and will have access to jobs that offer the chance to build a CV, establish a network of contacts, gain work experience and increase their earnings.
The project is in its early R&D phase and will be piloted with a small group of unemployed young people alongside a number of employers who have shown interest in the service.
The initiative is targeted at young people between the ages of 18 and 34 who are below or close to the poverty line. This group remains vulnerable in the labour market with an unemployment rate of 37.1%, which is 10.6% higher than the national average. Pearson aims to replicate the model in other countries in Africa in due course.
The DFID Business Partnership Fund is supporting this project by providing a combination of technical assistance and a financial grant to the value of £225,210 over 20 months.
Reach more learners2
Reaching more learners is integral to both our business goals and our sustainability strategy. Through growing our business, we can both achieve our financial targets and help more people to progress through learning. The commitments we make are designed to contribute to a quality education for all, decent jobs and equality:
Expand access to education and make learning more affordable for people everywhere, including the most disadvantaged groups
Harness the power of new technologies to bring education and opportunities to more people in more places
Work together with charities, teachers, education experts, governments and others to tackle some of the biggest education challenges related to gender inequality, conflicts and emergencies, and illiteracy.
We are taking steps to tackle some of the barriers underserved learners face, such as geographic, cultural or socioeconomic obstacles, or personal constraints, such as the need to balance education with work and family responsibilities.
For example, products like Revel (our next-generation US higher education courseware product) help students learn in smaller, bite-sized chunks and shorter time periods, so they are able to carve out a few minutes from their busy days or make use of transition times like commuting when they would not otherwise be able to study. Personalised, adaptive solutions in products like MyLab can identify students who are behind and help them stay on track. Our inclusive access subscription model helps students to access their materials at a lower price.
Ability and access
Accessibility is one of our nine material sustainability issues as tailoring the learning experience to the ability level of the learner is a key factor in reaching more learners.
Standards on accessibility for people with disabilities are evolving. Focusing on higher education, Pearson has adopted a road map to invest in integrating accessibility standards into existing products while committing to apply those standards into new product development. In 2017, we announced that we will make 100% of our digital portfolio accessible for people with disabilities by 2020.
As an employer, disability is part of our wider commitment to inclusion. We work to ensure that appropriate procedures, training and support are in place for people with disabilities to ensure fair access to career and progression opportunities. One of our eight employee resource groups is Pearson Able – its remit is to improve company practice for learners and employees.
30 Pearson plc Annual report and accounts 2017

Our performance sustainability rankings
One way we assess how we are doing as a sustainable business is to maintain our position in key indices and benchmarks of social responsibility.
This year, we were delighted to be recognised in the Dow Jones Sustainability Indices as best in class for the global media sector.
Community contribution
Pearson focuses on a small number of campaigns and issues where, working together with others, we can both improve access to education for underserved groups as well as be relevant to our commercial objectives. We invest in a small number of partnerships, making sure we provide opportunities for our employees to bring their energy and enthusiasm in getting involved in social impact work.
Our 2017 investment in social innovation and impact was £7.2m or 1.4% of adjusted pre-tax profits and included a number of programmes:
Our Every Child Learning partnership with Save the Children and Tomorrow’s Markets Incubator, which supports Pearson employees to develop new products and services, as well as overall business models, to bring high-quality education to learners in low-income and underserved communities. Our investment in the Incubator seeks to identify commercially viable market opportunities as well as social return
Our award-winning flagship campaign is Project Literacy. Founded and convened by Pearson, the global campaign brings together not-for-profits and companies with a shared aim of bringing the power of words to the world, by building partnerships and driving action
Our people are our best ambassadors and advocates. We support them to give time and money to invest in communities around where they work as well as in good causes around the world.
Additionally, the Pearson Affordable Learning Fund invests ‘patient capital’ in independently run, for-profit, education start-ups using innovative approaches to improving learning outcomes and increasing access, at scale.
Community Investment
Social Innovation
Project Literacy £3.6m –
Every Child Learning £0.9m –
Tomorrow’s Markets Incubator – £1.2m
Employee engagement/other partnerships/ local gifts £1.5m –
Total £6.0m £1.2m
2017 Yes
2016 Yes
2015 Yes
2014 Yes
2017 Gold Class & Media Sector leader
2016 Silver Class
2015 Bronze Class
2014 Bronze Class
2017 Yes
2016 Yes
2015 Yes
2014 Yes
Yes signifies inclusion in FTSE4Good
Inclusion in Global 100 most sustainable corporations (Corporate Knights)
3131Section 2 Our strategy in action
Sustainability

Pearson and Everglades University prepare learners for careers in green building
Shape the future of education3
The pace of change in education is faster than ever before.
We have a responsibility to play our part in shaping a future where learning does even more to foster inclusive and equitable societies and economies. This means ensuring our learners are equipped with the skills they need to build careers and communities, navigate uncertainty, address the world’s biggest sustainable development challenges and thrive in the 21st century and beyond.
Cutting-edge technology, insights and partnerships will help us deliver. We contribute to a growing body of research, working with others to together help global education systems better serve the next generation of students.
To equip learners for jobs, Pearson’s Career Success Programme aims to meet the needs of both colleges and employers by providing a digital suite of assessments, learning modules and tools that help students identify career goals and the gaps in their academic and career skills that they need to fill.
Delivering the knowledge, skills and understanding students need to prepare for their chosen career, BTECs can support progression to higher or further education or into employment. Pearson VUE helps individuals prepare for their next educational or career opportunity through credentials that verify the skills and learning required for a specific job or educational programme.
There is rising demand from educators for the integration of sustainable development topics into content, courses and curricula. By integrating sustainability-related content into our products, we can explore new market opportunities while making a direct contribution to the SDGs and inspiring the next generation to improve their world. We are collaborating with leading experts in the space to advance education for sustainability and respond to our customer needs.
Sustainability
Pearson has partnered with Everglades University in the United States and the US Green Building Council (USGBC) to develop an Introduction to Sustainability digital course designed to put students on the path to high-demand careers in green energy and building design.
Through a combination of online and hands-on learning, the course improves students’ preparation for Leadership in Energy and Environmental Design (LEED) certification in growing fields such as construction; alternative and renewable energy; environmental policy and management; land and energy; and crisis and disaster management.
Upon completion of the course, students earn certificates that can be featured in the form of digital badges and added to their résumés, demonstrating their education in and commitment to sustainability.
Ultimately, this partnership will benefit thousands of students, dozens of university staff and faculty members, and the community at large surrounding Everglades University’s four locations.
“Through our partnership with the USGBC and Pearson, we are improving the quality of our course offerings and student learning outcomes, thereby further educating, training, and certifying the future leaders in these growing fields.”
Kristi Mollis, President and Chief Executive Officer, Everglades University
32 Pearson plc Annual report and accounts 2017

What excites you most about the work you do at Pearson?
IS
I’m most excited by the continuous learning opportunities available at Pearson that help me to grow in my career. There is a friendly environment and great team culture too, and I often feel like Pearson is my second home.
What is your main goal for 2018?IS
My main goal for 2018 is to increase the technical and behavioural skills of myself and my teams. Primarily, this will help us to contribute more effectively to the development of highly scalable solutions for the business in line with Engineering Best Practices.
How are you helping Pearson in its transition to digital?
IS
I have three teams working on Next Generation technology projects that are used in Revel, eText and Learning Applications. Those applications are providing a more sophisticated digital experience for our learners and customers.
Another way I contribute to the digital transition is by encouraging a team culture of continuous learning and providing the opportunity for my team to grow. Growing the skills of my engineers ensures they can build the best possible solutions to achieve Pearson’s goals.
What is your biggest win at Pearson to date?
IS
I am one of Pearson’s ‘home grown’ managers. I joined eCollege (which was later acquired by Pearson) 13 years ago as an Associate Software Engineer. I then moved up in my career to become a Senior Manager. During that journey, the biggest win for me has been acquiring IEng accreditation with the UK’s prestigious Institute of Engineering & Technology. That has opened up the opportunity for me to learn both professionally and academically, as well as contribute my knowledge to Pearson and to wider society.
Helping create the future of learning
An interview with Indika Senadhira, Senior Manager, Software Engineering, Pearson Technology Delivery Centre, Colombo, Sri Lanka.
“Growing the skills of my engineers ensures they can build the best possible solutions to achieve Pearson’s goals.”
IS Indika Senadhira Senior Manager, Software Engineering
The Technology Delivery Centre in one minute
The Technology Delivery Centre is a team of
Operates out of Sri Lanka, India, the US and UK
used by program and product teams across Pearson.
MobileContentSalesforceIntegrationUser interfaceDigital MarketingPerformance
testingSecurity testingAccessibility testingAnalytics & Big DataOracle
WHAT
WHERE
WHEN
WHO
2,230 digital specialists
24/7, 365
Capabilities include:
3333Section 2 Our strategy in action
Sustainability

Profit and loss statement
In 2017, Pearson’s sales decreased by £39m in headline terms to £4,513m. Adjusted operating profit fell £59m to £576m (2016: £635m).
Currency movements, primarily from the depreciation of Sterling against the US Dollar and other currencies during the period, increased sales by £126m and operating profits by £23m.
The effect of disposals reduced sales by £54m and continuing adjusted operating profits by £24m.
Stripping out the impact of portfolio changes and currency movements, revenues were down 2% in underlying terms while adjusted operating profit fell £58m or 9%.
Trading contributed £58m to this decline in adjusted operating profit, other operating factors including increased amortisation expense and staff incentive contributed £95m to the decline and cost inflation, an estimated £55m. This was partly offset by a £150m year-on-year benefit from restructuring savings.
Net interest payable in 2017 was £79m, compared with £59m in 2016. The increase was primarily due to additional charges relating to the early redemption of various bonds during the year and higher US interest rates.
Our adjusted tax rate in 2017 was 11.1% (2016: 16.5%). The decrease in tax rate was primarily due to uncertain tax position provision releases following the expiry of the relevant statutes of limitation.
Adjusted earnings per share were 54.1p (2016: 58.8p).
Cash generation
Operating cash flow rose by 1% in headline terms, despite a decrease in adjusted operating profit, driven by a strong cash conversion of 116% driven by tight working capital control, strong collections and high Penguin Random House cash dividends.
Return on invested capital
On a gross basis ROIC decreased from 5.0% in 2016 to 4.3% in 2017 and from 7.2% in 2016 to 6.2% in 2017 on a net basis. The movement largely reflects lower profit in the year and increased tax payments.
Statutory results
Our statutory profit from continuing operations of £451m in 2017 compares with a loss of £2,497m in 2016. The loss in 2016 is mainly attributable to an impairment charge to North American goodwill and the higher level of restructuring spend.
“We expect ongoing headwinds in our US higher education courseware business to be offset by improving conditions in our other businesses.” Coram Williams
Chief Financial Officer
Financial summary
Business performance
£ millions 2017 2016Headline
growthCER
growth
Under-lying
growth
Sales 4,513 4,552 (1)% (4)% (2)%
Adjusted operating profit 576 635 (9)% (13)% (9)%
Operating cash flow 669 663 1%
Adjusted earnings per share 54.1p 58.8p (8)%
Dividend per share 17p 52p (67)%
Net debt (432) (1,092) 60%
Growth rates stated on a headline basis are calculated by comparing the reported results. Growth rates on a constant exchange rate (CER) basis are calculated after excluding the effect of exchange. Underlying growth rates exclude both the effect of exchange and portfolio changes arising from acquisitions and disposals.
Statutory results
£ millions 2017 2016Headline
growthCER
growth
Under-lying
growth
Sales 4,513 4,552 (1)% (4)% (2)%
Operating profit/(loss) 451 (2,497) n/a
Profit/(loss) for the year 408 (2,335) n/a
Cash generated from operations 462 552 (11)%
Basic earnings/(loss) per share 49.9p (286.8)p n/a
The business performance measures include our adjusted performance measures which are non-GAAP measures. An explanation of these measures is included in this financial review section and full reconciliations to the equivalent statutory heading under IFRS are included in the financial key performance indicators section on p192–195.
Financial review
34 Pearson plc Annual report and accounts 2017

Key performance indicators Maintain long-term growth
20172016201520142013
£4,513m-1%
4,5134,728 4,540 4,468 4,552
Sales (£m)
Sales decreased in headline terms by £39m or 1% and fell by 4% in CER terms and 2% in underlying terms. The underlying decline was due to a 4% decline in North America, partially offset by stabilisation in Core and Growth. Over the last five years, revenues have benefited from growth in digital and the relative strength of the dollar but this has been offset by pressure on print revenues, cyclical and policy factors and adverse currency movements in some of our markets.
20172016201520142013
£576m-9% 576
736 722 723635
Adjusted operating profit (£m)
Adjusted operating profit fell by 9% in headline terms with the impact of lower sales, other operating factors, including increased amortisation and staff incentives, and cost inflation offsetting the benefit from restructuring savings. Over the last five years, adjusted operating profit has declined due to the pressure on revenues in higher margin businesses, portfolio changes and increased investment in digital, partially offset by benefits from restructuring.
Capital allocation
Our capital allocation policy remains unchanged: to maintain a strong balance sheet and a solid investment grade rating, to continue to invest in the business, to have a sustainable and progressive dividend policy, and to return surplus cash to our shareholders.
Balance sheet
Net debt to EBITDA was 0.6x (or 2.1x on a simplified credit agency view adjusting for leases and other items). Net debt decreased to £432m (2016: £1,092m) reflecting disposal proceeds, operating cash flow and a benefit from the weakening of the US Dollar relative to Sterling, partially offset by restructuring costs, pension contributions, including amounts related to agreements regarding the disposals of the FT and Penguin, interest, tax, dividend payments and the share buyback.
During 2017, we took steps to reduce our level of gross debt and optimise our balance sheet, successfully executing market tenders repurchasing $383m of our $500m 3.75% US Dollar Notes due 2022 and $406m of our $500m 3.25% US Dollar Notes due 2023. In addition, we redeemed the $300m 4.625% Senior Notes due June 2018 and the $550m 6.25% Notes due May 2018.
During January 2018, we also successfully repurchased a total of $569m of debt at an average interest rate of around 2.5% by tendering for €250m of our Euro 1.875% Notes due May 2021 and €200m of our Euro 1.375% Notes due May 2025 and cancelling the associated currency swaps.
Pension plan
The overall surplus on the UK Group Pension Plan of £158m at the end of 2016 has increased to a surplus of £545m at the end of 2017. This has arisen due to increased contributions, including £227m as part of the agreements relating to the Penguin Random House merger in 2013 and FT Group sale in 2015, together with the impact of favourable movements in assumptions.
The UK Group Pension Plan used its strong funding position to purchase two insurance buy-in policies with Legal & General and Aviva, covering approximately £1.2bn (one-third) of its total liabilities. This put the Plan in an even stronger position and substantially reduced Pearson’s future pension funding risk, at no further cost to the company.
Dividend
In line with our policy, the Board is proposing a final dividend of 12p (2016: 34p) which results in an overall dividend of 17p (2016: 52p) subject to shareholder approval.
Share buyback
We launched a £300m share buyback, beginning on 18 October 2017 utilising part of the proceeds from the disposal of a 22% stake in Penguin Random House. We completed the programme on 16 February 2018.
Businesses held for sale
Following the decision to sell both WSE and the K-12 school courseware business in the US, the assets and liabilities of those businesses have been classified as held for sale on the balance sheet at 31 December 2017.
2018 outlook
2017 was a year of progress for Pearson, delivering adjusted operating profit at the top end of our guidance range and continuing to invest in the digital transformation and simplification of the company. We expect to make further progress in 2018, with underlying profit growth, reporting adjusted operating profit of between £520m and £560m and adjusted earnings per share of 49p to 53p. This reflects our portfolio and exchange rates as at 31 December 2017 and the factors outlined overleaf.
See a summary of all our KPIs on p2–3
3535Section 3 Our performance
Financial review

Trading
We expect ongoing headwinds in our US higher education courseware business to be offset by improving conditions in our other businesses.
Portfolio changes
We completed the sale of a 22% stake in Penguin Random House and our Chinese English test preparation business GEDU in 2017. The annualised impact of these disposals will reduce 2018 operating profit by £44m. We expect to complete the disposal of WSE and our stake in Mexican joint venture Utel in the first half of 2018 and have announced that we have concluded the strategic review of our US K-12 courseware business and have classified the business as held for sale. WSE contributed £195m to 2017 sales and WSE and Utel contributed £5m to 2017 adjusted operating profit and £5m to statutory profit. US K-12 courseware is expected to contribute £385m to 2018 sales and around £11m to 2018 adjusted and statutory profit.
Other operational factors, incentives and inflation
Our 2018 guidance incorporates cost inflation of around £50m together with other operational factors and incentives of £30m.
Restructuring benefits
We expect incremental in-year benefits from the 2017–2019 restructuring programme of £80m in 2018. Exceptional restructuring costs of £90m will be excluded from adjusted operating profit in line with our recent practice.
Interest and tax
We expect a 2018 net interest charge of around £45m and a tax rate of 20%.
Currency
In 2017, Pearson generated approximately 61% of its sales in the US, 7% in Greater China, 5% in the Eurozone, 3% in Brazil, 3% in Canada, 3% in Australia, 2% in South Africa and 1% in India and our guidance is based on exchange rates at 31 December 2017.
We calculate that a 5 cent move in the US Dollar exchange rate to Sterling would impact adjusted earnings per share by between 2p and 2.5p.
Adjusted performance measures
The Group’s adjusted performance measures are non-GAAP financial measures and are included as they are key financial measures used by management to evaluate performance and allocate resources to business segments. The measures also enable investors to more easily, and consistently, track the underlying operational performance of the Group and its business segments by separating out those items of income and expenditure relating to acquisition and disposal transactions, and major restructuring programmes.
The Group’s definition of adjusted performance measures may not be comparable to other similarly titled measures reported by other companies. A reconciliation of the adjusted measures to their corresponding statutory reported figures is shown in summary below and in more detail on p192–195.
Financial review
Key performance indicators Deliver sustainable returnsPerformance over the last five years reflects the market pressures we have faced. But we are building a strong future returns potential.
20172016201520142013
54.1p-8% 54.1
70.1 66.7 70.358.8
Adjusted earnings per share (£m headline)
Adjusted earnings per share (EPS) is down 8% in 2017, reflecting lower adjusted operating profit and increased interest charges partially offset by a decrease in the tax rate. Over the last five years EPS has declined in line with the decline in adjusted operating profit.
20172016201520142013
4.3%-0.7 percentage points
4.3
6.25.4 5.4 5.6 5.7 5.8
6.3
5.0
7.2
Return on invested capital (% headline)
Gross basisNet basis
Return on invested capital (ROIC) fell by 0.7 percentage points to 4.3% in 2017 mainly due to lower adjusted operating profit and higher cash tax paid. We have also presented ROIC on a net basis after removing impaired goodwill from the invested capital balance. The net approach assumes that goodwill which has been impaired is treated in a similar way to goodwill disposed as it is no longer being used to generate returns.
See a summary of all our KPIs on p2–3
36 Pearson plc Annual report and accounts 2017

Adjusted operating profit
Adjusted operating profit includes the operating profit from the total business, including the results of discontinued operations when relevant. There were no discontinued operations in either 2016 or 2017. A reconciliation of the statutory measure to the adjusted measure is shown below:
£ millions 2017 2016
Operating profit/(loss) 451 (2,497)
Add back: Cost of major restructuring 79 338
Add back: Other net (gains) and losses (128) 25
Add back: Intangible charges 166 2,769
Add back: Impact of US tax reform 8 –
Adjusted operating profit 576 635
In January 2016, the Group announced that it was embarking on a restructuring programme to simplify the business, reduce costs and position the company for growth in its major markets. The costs of this 2016 restructuring programme in 2016 were significant enough to exclude from the adjusted operating profit measure so as to better highlight underlying performance. A new restructuring programme, the 2017-2019 restructuring programme announced in May 2017, began
in the second half of 2017 and is expected to drive further significant cost savings. This new programme has also been excluded from the adjusted operating profit measure.
These major restructuring costs are analysed below:
£ millions 2016
2016 restructuring programme
Combining into one single product organisation 77
Integrating our assessment operations 33
Reducing exposure to large-scale direct delivery 67
Making efficiency improvements in enabling functions 110
Rationalising our property portfolio and consolidating major supplier agreements 51
Total major restructuring cost 338
£ millions 2017
2017-2019 restructuring programme
Adjusting the cost base in our US higher education courseware business 23
Further efficiency improvements in enabling functions through back office change programmes in Human Resources, Finance and Technology 23
Further rationalisation of property and supplier agreements 33
Total major restructuring cost 79
Other net gains and losses that represent profits and losses on the sale of subsidiaries, joint ventures, associates and other financial assets are excluded from adjusted operating profit as it is important to highlight their impact on operating profit, as reported, in the period in which the disposal transaction takes place in order to understand the underlying trend in the performance of the Group. Other gains of £128m in 2017 largely relate to the sale of the test preparation business in China which resulted in a profit on sale of £44m and the part sale of the Group’s share in Penguin Random House which resulted in a profit of £96m. In 2016, the losses mainly relate to the closure of the English language schools in Germany and the sale of the Pearson English Business Solutions business in North America.
Charges relating to acquired intangibles and acquisitions are also excluded from adjusted operating profit when relevant as these items reflect past acquisition activity and do not necessarily reflect the current year performance of the Group. In 2016, intangible charges included an impairment of goodwill in our North American business of £2,548m.
Key performance indicators Manage cash effectively
20172016201520142013
£669m+1%
669588
649
435
663
Operating cash flow (£m headline)
Operating cash flow increased by 1% in 2017, despite the reduction in adjusted operating profit, reflecting continued tight working capital control, strong cash collections and higher dividends from Penguin Random House.
20172016201520142013
£432m+60%
432
1,379
1,639
654
1,092
Net debt (£m headline)
The Group’s net debt decreased from £1,092m at the end of 2016 to £432m at the end of 2017 as the proceeds from disposals, operating cash flow and the positive effect of exchange rate movements more than offset restructuring spend, tax, interest, pension and dividend payments.
See a summary of all our KPIs on p2–3
3737Section 3 Our performance
Financial review

As a result of US tax reform, the reported tax charge on a statutory basis includes a benefit from revaluation of deferred tax balances to the reduced federal rate of £5m and a repatriation tax charge of £6m. In addition to the impact on the reported tax charge, the Group’s share of profit from associates was adversely impacted by £8m. These adjustments have been excluded from adjusted operating profit and the adjusted tax charge as they are considered to be transition adjustments that are not expected to recur in the near future.
Adjusted earnings per share
Adjusted earnings includes adjusted operating profit and adjusted finance and tax charges. A reconciliation to the statutory profit is shown below:
£ millions 2017 2016
Profit/(loss) for the year 408 (2,335)
Non-controlling interest (2) (2)
Add back: Cost of major restructuring 79 338
Add back: Other net (gains) and losses (128) 25
Add back: Intangible charges 166 2,769
Add back: Other net finance (income)/costs (49) 1
Add back: Impact of US tax reform on profit from associate 8 –
Tax benefit relating to items added back (42) (317)
Adjusted earnings 440 479
Weighted average number of shares (millions) 813.4 814.8
Adjusted earnings per share 54.1p 58.8p
Net finance costs classified as other net finance costs or income are excluded in the calculation of adjusted earnings.
Finance income relating to retirement benefits are excluded as management believes the presentation does not reflect the economic substance of the underlying assets and liabilities. Finance costs relating to acquisition transactions are also excluded as these relate to future earn-outs or acquisition expenses and are not part of the underlying financing.
Foreign exchange and other gains and losses are also excluded as they represent short-term fluctuations in market value and are subject to significant volatility. Other gains and losses may not be realised in due course as it is normally the intention to hold the related instruments to maturity.
In 2017, the total of these net finance cost items excluded from adjusted earnings was a gain of £49m compared with a loss of £1m in 2016. Finance income relating to retirement benefits decreased from £11m in 2016 to £3m in 2017, but this decrease was more than offset by foreign exchange gains on unhedged cash and cash equivalents and other financial instruments that generated losses in 2016.
The adjusted income tax charge excludes the tax benefit or charge on items that are excluded from the profit or loss before tax. In addition, the tax benefit from tax deductible goodwill and intangibles is added to the adjusted income tax charge as this benefit more accurately aligns the adjusted tax charge with the expected rate of cash tax payments.
Operating cash flow
Operating cash flow is presented in order to align the cash flows with corresponding adjusted operating profit measures. A reconciliation to operating cash flow from net cash generated from operations, the equivalent statutory measure, is shown below:
£ millions 2017 2016
Net cash generated from operations 462 522
Dividends from joint ventures and associates 146 131
Capital expenditure on property, plant, equipment and software (237) (247)
Add back: Cost of major restructuring paid 71 167
Add back: Special pension contribution paid 227 90
Operating cash flow 669 663
In addition to the dividends received from associates above, there were dividends from Penguin Random House in 2017 of £312m relating to the recapitalisation of Penguin Random House following the sale of part of the Group’s interest in the venture.
This cash flow is not related to the underlying trading of the business and has not been included in the adjusted operating cash measure.
Costs of major restructuring paid in 2017 include cash flow from both the 2016 restructuring programme (£44m) and the 2017–2019 programme (£27m).
Special pension contributions of £227m in 2017 were made as part of the agreements relating to the Penguin Random House merger in 2013 (£202m) and the sale of the FT Group in 2015 (£25m). In 2016, special pension contributions of £72m (net of tax) relate to the sale of the FT Group.
Return on invested capital (ROIC)
ROIC is a non-GAAP measure and has been disclosed as it is part of Pearson’s key business performance measures. ROIC is used to track investment returns and to help inform capital allocation decisions within the business. Average values for total invested capital are calculated as the average monthly balance for the year.
For the first time in 2017, we have presented ROIC on a net basis after removing impaired goodwill from the invested capital balance. The net approach assumes that goodwill that has been impaired is treated in a similar fashion to goodwill disposed as it is no longer being used to generate returns.
£ millions
2017 2016 2017 2016
Gross basis Net basis
Adjusted operating profit 576 635 576 635
Operating cash tax paid (75) (63) (75) (63)
Return 501 572 501 572
Average invested capital 11,568 11,464 8,126 7,906
ROIC 4.3% 5.0% 6.2% 7.2%
Financial review
38 Pearson plc Annual report and accounts 2017

Other financial information
Net finance costs
£ millions 2017 2016
Net interest payable (79) (59)
Finance income in respect of retirement benefits 3 11
Other net finance income/(costs) 46 (12)
Net finance costs (30) (60)
Net interest payable was £79m in 2017, compared with £59m in 2016. The increase was primarily due to higher US interest rates in 2017, additional charges relating to the early redemption of various bonds during the year and some additional interest on tax provisions. In March and November 2017 respectively, the Group redeemed the $550m 6.25% global Dollar bonds and the $300m 4.625% US Dollar notes, both originally due in 2018. In addition, in August 2017, the Group redeemed $383m out of the $500m 3.75% US Dollar notes due in 2022 and $406m out of the 3.25% US Dollar notes due in 2023. Although there is a charge in respect of the early redemptions, there are partial year interest savings as a result which have flowed through the income statement in the period since redemption, with the full annualised savings coming through in 2018.
In 2017, the total of other net finance income excluded from adjusted earnings was a gain of £49m compared with a loss of £1m in 2016. Finance income relating to retirement benefits decreased from £11m in 2016 to £3m in 2017 reflecting the comparative funding position of the plans at the beginning of each year. This decrease was more than offset by foreign exchange gains on unhedged cash and cash equivalents and other financial instruments that generated losses in 2016.
Capital risk
The Group’s objectives when managing capital are:
To safeguard the Group’s ability to continue as a going concern and retain financial flexibility by maintaining a strong balance sheet
To maintain a solid investment grade credit rating
To provide returns for shareholders.
The Group is currently rated BBB (negative outlook) by Standard and Poor’s and Baa2 (negative outlook) by Moody’s.
Net debt
The net debt position of the Group is set out below:
£ millions 2017 2016
Cash and cash equivalents 645 1,459
Marketable securities 8 10
Derivative financial instruments – (93)
Bank loans and overdrafts (15) (39)
Bonds (1,062) (2,420)
Finance lease liabilities (8) (9)
Net debt (432) (1,092)
Net debt was reduced during the year following the partial disposal and recapitalisation of the Group’s stake in Penguin Random House.
Bond debt was reduced to £1.1bn from £2.4bn through debt repayments of £1.3bn which reduced cash balances. The Group holds Dollar debt as a natural hedge of the Group’s largest earnings generating region, North America.
Despite the low balance sheet gearing, the Group has significant operating lease liabilities of around £1.2bn which are not currently included as balance sheet liabilities but are included by the credit rating agencies within debt.
Liquidity and funding
The Group had a strong liquidity position at 31 December 2017, with over £600m of cash and an undrawn US Dollar denominated Revolving Credit Facility due in 2021 of $1.75bn (at 31 December 2016, the Group had cash of over £1.4bn and an undrawn Revolving Credit Facility due 2021 of $1.75bn). To ensure efficient use of the Group’s cash balances, the Group repaid €450m (around £400m) of bond debt in January 2018 at a premium broadly equivalent to interest due for 2018, which will result in a reduced interest charge from 2019.
Taxation
The effective tax rate on adjusted earnings in 2017 was 11.1% compared with an effective rate of 16.5% in 2016. The decrease in tax rate was primarily due to uncertain tax position provision releases due to the expiry of relevant statutes of limitation.
The reported tax charge on a statutory basis in 2017 was £13m (3.1%) compared with a benefit of £222m (8.7%) in 2016. The statutory tax benefit in 2016 was mainly due to the release of deferred tax liabilities relating to tax deductible goodwill that was impaired. Operating tax paid in 2017 was £75m compared with £63m in 2016.
As a result of US tax reform, the reported tax charge on a statutory basis includes a benefit from revaluation of deferred tax balances to the reduced federal rate of £5m and a repatriation tax charge of £6m. The Group continues to analyse the detail of the new legislation and this may result in revisions to these impacts. In addition to the impact on the reported tax charge, the Group’s share of profit from associates was adversely impacted by £8m.
Other comprehensive income
Included in other comprehensive income are the net exchange differences on translation of foreign operations. The loss on translation of £262m in 2017 compares with a gain in 2016 of £913m and has arisen due to the relative weakness of the US Dollar compared with Sterling. A significant proportion of the Group’s operations are based in the US and the US Dollar weakened in 2017 from an opening rate of £1:$1.23 to a closing rate at the end of 2017 of £1:$1.35. At the end of 2016 most of the currencies that Pearson is exposed to had strengthened relative to Sterling following the Brexit vote. In 2016, the US Dollar had strengthened in comparison with the opening rate moving from £1:$1.47 to £1:$1.23.
Also included in other comprehensive income in 2017 is an actuarial gain of £182m in relation to post-retirement plans of the Group and our share of the post-retirement plans of Penguin Random House. The gain arises from the impact of favourable movements in mortality assumptions, discount rates, member options on retirement and asset returns which offset the impact of the UK Group plan’s purchase of insurance buy-in policies. The gain in 2017 compares with an actuarial loss in 2016 of £276m.
3939Section 3 Our performance
Financial review

Post-retirement benefits
Pearson operates a variety of pension and post-retirement plans. Our UK Group Pension Plan has by far the largest defined benefit section. We have some smaller defined benefit sections in the US and Canada but, outside the UK, most of our companies operate defined contribution plans.
The charge to profit in respect of worldwide pensions and retirement benefits amounted to £72m in 2017 (2016: £70m) of which a charge of £75m (2016: £81m) was reported in adjusted operating profit and an income of £3m (2016: £11m) was reported against other net finance costs.
The overall surplus on the UK Group pension plan of £158m at the end of 2016 increased to a surplus of £545m at the end of 2017. The increase has arisen principally due to the impact of favourable movements in assumptions discussed above but also due to increased contributions, including £227m as part of the agreements relating to the Penguin Random House merger in 2013 and FT Group sale in 2015.
In total, our worldwide net position in respect of pensions and other post-retirement benefits increased from a net asset of £19m at the end of 2016 to a net asset of £441m at the end of 2017.
Dividends
The dividend accounted for in our 2017 financial statements totalling £318m represents the final dividend in respect of 2016 (34.0p) and the interim dividend for 2017 (5.0p). We are proposing a final dividend for 2017 of 12p, bringing the total paid and payable in respect of 2017 to 17p. This final 2017 dividend, which was approved by the Board in February 2018, is subject to approval at the forthcoming AGM and will be charged against 2018 profits. For 2017, the dividend is covered 3.2 times by adjusted earnings and, after excluding the contribution from Penguin Random House, the dividend is covered 2.5 times.
Share buyback
The £300m share buyback programme announced in October 2017 was completed on 16 February 2018. At 31 December 2017, 21m shares at a value of £153m had been purchased. Cash payments of £149m had been made in respect of the purchases with the outstanding £4m settlement made at the beginning of January 2018. This £4m together with the remaining value of the buyback programme (£147m) was recorded as a liability on the balance sheet at 31 December 2017. A further 22m shares were repurchased under the programme in 2018.
Businesses held for sale
Following the decision to sell both our Wall Street English language teaching business and the K-12 school courseware business in the US, the assets and liabilities of those businesses have been classified as held for sale on the balance sheet at 31 December 2017.
Goodwill and intangible assets
Amortisation and impairment charges in 2017 were £166m compared with a charge of £2,769m in 2016. The 2016 charge includes an impairment charge to North American goodwill of £2,548m. This charge arose following trading in the final quarter of 2016 and the consequent revision to strategic plans which reflected underlying issues in the US higher education courseware market that were more severe than had previously been anticipated. These issues related to declining student enrolments, changes in buying patterns of students and correction of inventory levels by distributors and bookshops.
Acquisitions and disposals
There were no significant acquisitions in 2017 or 2016. In 2017, disposals in total gave rise to a profit of £128m. These disposals included the sale of our test preparation business in China (GEDU) which resulted in a profit on sale of £44m and the sale of a portion of our stake in Penguin Random House to our venture partner, Bertelsmann, resulting in a reduction in our interest from 47% to 25% and a profit on sale of £96m. In 2016, we closed our English language schools in Germany and also sold the Pearson English Business Solutions business. These two disposals, together with other smaller disposal related items, gave rise to an aggregate loss of £25m.
Related party transactions
Transactions with related parties are shown in note 36 of the consolidated financial statements.
Post-balance sheet events
During January 2018, Pearson successfully executed market tenders to repurchase €250m of its €500m Euro 1.875% Notes due May 2021 and €200m of its €500m Euro 1.375% Notes due May 2025.
On 16 February 2018, Pearson completed its £300m share buyback programme. In aggregate between 18 October 2017 and 16 February 2018, Pearson repurchased 42,835,577 shares, including 21,839,676 repurchased since 31 December 2017, at a cost of £151m.
Coram Williams Chief Financial Officer
Financial review
40 Pearson plc Annual report and accounts 2017

What excites you most about the work you do at Pearson?AC
In Pearson I have the amazing opportunity to work with different geographies all over the world. PTE Academic is delivered in over 50 countries and part of my job is really to understand the singularities of each market. I particularly enjoy engaging with the geographies and providing them with data insights that can inform their business strategy.
What is your main goal for 2018?AC
To support the growth of the PTE Academic test, our main goal as a team is to improve the operational infrastructure around the test, and to redevelop the customer journey. My role is to help the team achieve this goal by analysing operational performance, identifying areas of improvement and working with stakeholders to make them.
How are you helping Pearson in its transition to digital?AC
PTE Academic is a computer-based test and I have been involved in the operational and technology improvements of the product. As with every digital product, we can generate valuable operational data that can turn into evidence based decision-making.
What is your biggest win at Pearson to date?AC
I am proud of my work producing genuine data reporting that has been used by teams, colleagues and management. In addition to providing valuable insight and informing decision-making at all levels, I have been able to introduce a data-driven culture within the team and with the geographies. These reporting capabilities have also served to provide accurate forecasting and a robust test centre capacity plan, which has been instrumental for supporting the growth of the test.
“I introduced a data-driven culture. More accurate forecasting has supported the growth of the test.”
Helping create the future of learning
An interview with Alvaro Castro, Product Management Analyst, Pearson Test of English
AC Alvaro Castro Product Management Analyst
+c.70%
250 centres
Pearson Test of English in one minute
The Pearson Test of English Academic is the computer-based
English test trusted by universities, colleges and
governments around the world.
around the world
Differentiated consumer experience drove c.70% volume growth
“The test is a true reflection of what’s required
in communicating ... Reading, Writing,
Speaking and Listening”Elizabeth Karanja,
Australia, October 2017
4141Section 3 Our performance
Financial review

Association of American Medical CollegesThe Association of American Medical Colleges (AAMC) has selected Pearson VUE to deliver the prestigious Medical College Admission Test® (MCAT®) beginning in 2018.
“We are proud to enter into an agreement with the AAMC to deliver this important exam to tomorrow’s doctors,” says Bob Whelan, President, Pearson Assessments. “We understand the AAMC’s commitment to excellence and we are proud to be part of their continued commitment to examinees and the testing community. As an extension of the AAMC to its test takers, we will deliver each exam with care, consistency and the highest levels of customer service.”
Pearson VUE will deliver the MCAT exam in its premium, patented, owned-and-operated network of Pearson Professional Centres and several Pearson VUE Authorized Test Centre Selects globally. In addition to the existing test centres, Pearson VUE is investing in an expansion of its test centre network to provide additional capacity for test takers.
The Pearson Professional Centres are the gold standard in exam delivery, offering test takers a professional, highly secure and consistent testing experience.
Market spotlight
North American Assessment
Revenues declined 4% in underlying terms, primarily due to anticipated declines in higher education and school courseware, school assessment and Learning Studio, a learning management system we are retiring.
North American higher education courseware fell 3%. School courseware fell high-single digits, impacted by a lower adoption participation rate and weak Open Territory sales in the second half of the year. School assessment declined high-single digits, due to previously announced contract losses. Learning Studio revenues continued to decline as we move towards the retirement of the product in 2019. Offsetting that, we saw modest growth in both virtual schools and Online Program Management (OPM) due to good underlying volume growth partially offset by some contract exits and in-sourcing. Revenues in North American Professional Certification were flat on phasing of new contracts and a slowdown in IT certification late in 2017.
Adjusted operating profits fell 10% in underlying terms, due primarily to the impact of lower sales and other operating factors partially offset by restructuring savings.
Courseware
School
In school, revenue declined high-single digits primarily due to sharp declines across Open Territory states in the second half
of the year. This was partially offset by growth in Adoption state revenues where strong performance in Texas Grades K-12 Spanish, Indiana Grades K-12 Science and South Carolina Grades 6-8 Science outweighed a lower adoption participation rate resulting from our decision not to compete for the California Grades K-8 English Language Arts (ELA) adoption with a core basal programme.
Our new adoption participation rate fell to 61% from 64% in 2016. We won an estimated 38% share of adoptions competed for (30% in 2016) and 29% of total new adoption expenditure of $365m (19% of $470m in 2016).
Higher education
In higher education, total US college enrolments, as reported by the National Student Clearinghouse, fell 1.1%, with combined two-year public and four-year for-profit enrolments declining 2.5%. Enrolment weakness was particularly focused on part-time students where enrolment declined 3.3%, a bigger decline than in any of the last five years. Full-time enrolment grew 0.3%, the first expansion since autumn 2010.
Net revenues in our higher education courseware business declined 3% during the year. We estimate around 2% of this decline was driven by lower enrolment; just over 1% from the adoption of Open
42 Pearson plc Annual report and accounts 2017
Efficacy finding
Working with Penn State University, we found that students in Introductory Physics courses who do better on their Mastering Physics homework tended to perform better in exams and external assessments.
North America
Market summaryOur largest market includes all 50 US states and Canada.
Contribution to Group revenues
65%Sales
£2,929mAdjusted operating profit
£394m
Operating performance

“This digital experience will completely change the way we teach.”
The digital experience that students get can really shape their understanding of the subject. Digital gives a much better experience for students – it gives them a real world feel, with first class pedagogy and assessment built in – I can’t imagine a better way to learn.
This digital experience will completely change the way we teach. It meets students at their point of need. Students are able to go as fast or slow through the content as they need, getting a great learning experience. From the professor’s perspective, they know their student is getting help to prepare for class.
We are in the early days of an incredibly exciting future of learning. Students come to economics as they care about the world and want to learn about it. A product that can bring the real world together with a user-friendly interface for students is a game changer. The technology we have makes that future possible.
We are going to see a future in less than ten years’ time where students are no longer lugging a big bag of textbooks around. Instead they will have a simple interface that gives them a great learning experience.
Helping create the future of learning
An interview with Glenn Hubbard, Pearson author, economist and academic
GH �Glenn�Hubbard Economist and academic
Link to strategic priorities 1 Grow share through digital transformation 2 Invest in structural growth markets See Our strategy, p13–21
4343Section 3 Our performance
Educational Resources (OER); around 5% from the secondary market, new initiatives and other factors, primarily the growth in print rental; offset by c.3% benefit from institutional selling and the shift to digital and a 2% benefit in 2017 from lower returns by the channel.
In 2017, Pearson’s US higher education courseware market share, as reported by MPI, was in the upper half of the c.40–41.5% range seen over the last five years.
During 2017, we performed strongly in Statistics and Business Statistics, Biology and Accounting. Statistics benefited from the popularity of “best in class” learning application StatCrunch, Biology from the success of Campbell Biology 11e and MasteringBiology, and Accounting from the success of Miller-Nobles Horngren Accounting 11e and MyAccountingLab. This was offset by weakness in Information Technology, particularly in the for-profit sector and continued softness in Developmental Mathematics.
Digital revenues grew 9% benefiting from continued growth in direct sales, favourable mix and selected price increases. Global digital registrations of MyLab and related products fell 1%. In North America, digital registrations fell 3% with good growth in Science, Business & Economics and Revel offset by lower overall enrolment and continued softness in Developmental
Mathematics. Revel registrations grew more than 50%. Including stand-alone eBook registrations, total North American digital registrations were flat.
The actions announced in early 2017 to promote access over ownership met with success. We reduced the rental price of 2,000 eBook titles and saw eBook revenues increase more than 20% in response. Our print rental programme has had a successful start, and we have added more than 90 further titles. In institutional courseware solutions we signed 210 institutions to our Inclusive Access (Direct Digital Access, DDA) solutions, taking the total to over 500. During the year, we delivered over 1m course enrolments with inclusive access rising to c.5% of our higher education revenue as more colleges and faculties see the benefit of this model.
Assessment
School assessment
In school assessment (State and National assessments), revenues declined high-single digits due to previously announced contract losses.
Pearson secured contract extensions in Virginia, Indiana, Arizona, Minnesota, Puerto Rico, Kentucky, New York City and North Carolina and for the National Assessment of Educational Progress.
We delivered 25.3m standardised online tests to K-12 students, up 7% from 2016. TestNav 8, Pearson’s next-generation online test platform, supported a peak load of 752,000 tests in a single day and provided 99.99% up time. Our AI scoring systems scored 35m responses to open-ended test items, around 30% of the total. Paper-based standardised test volumes fell 7% to 20.4m.
Professional Certification
In Professional Certification, VUE global test volume rose 1% to over 15m. Revenues in North America were flat, with continued growth in certification for professional bodies, offset by modest declines in US teacher certification and the GED High School Equivalency Test, after strong performance last year, and by weakness in higher level IT certifications in the second half.
We signed over 50 new contracts in 2017 including a multi year contract with the Association of American Medical Colleges (AAMC) to administer the MCAT, and multi-year contracts with ExxonMobil and the Project Management Institute. Our renewal rate on existing contracts continues to be over 95%.
Operating performance

A Pearson author’s view on the future
As a professor, staying relevant to my students is not just about what I teach, but the way I teach it. With the advent of iGen – the smartphone generation – academics and publishers need to be evolving. This means offering digital, interactive learning to stay successfully switched on by the students of today and of the future.
Author view
North American Services
Jean M Twenge, Professor of Psychology at San Diego University and Pearson author
JT �Jean�M�Twenge Professor of Psychology
44 Pearson plc Annual report and accounts 2017
Operating performance
North America
Clinical assessment
Clinical assessment sales declined slightly on an absence of new major product introductions. Q-Interactive, Pearson’s digital solution for Clinical Assessment administration, saw continued strong growth in licence sales with sub-test administrations up more than 33% over the same period last year.
Services
Connections Education
Connections Education, our virtual school business, served nearly 78,000 Full Time Equivalent students through full-time virtual and blended school programmes, up 6% on last year.
Two new full-time online, state-wide, partner schools opened for the 2017–2018 school year. Enrolment growth from new and existing schools was partially offset by the termination of a school partnership at the end of the 2016–2017 school year.
Revenues grew modestly as enrolment growth was partially offset by increased in-sourcing, as some partners took non-core services in-house.
Enrolment and revenue is expected to grow in 2018 as growth in existing school partnerships and the opening of new partner schools for the 2018–2019 school year offsets the termination of two further contracts and the in-sourcing of services by some customers.
The 2017 Connections Academy Parent Satisfaction Survey showed strong results with 92% of families with students enrolled in full-time online partner schools stating they would recommend the schools to others and 95% agreeing that the curriculum is of high quality. Results from the survey are available at pear.sn/HPTn30dCNHH.
Pearson Online Services
In Pearson Online Services, revenues declined high-single digits, primarily due to a decline in Learning Studio revenues as we retire the product and the restructuring of smaller non-OPM contracts. Learning Studio declined by just over 50% to a revenue contribution of £11m in 2017. In OPM, we grew revenues modestly as course enrolments grew strongly, up 8% to more than 341,000, boosted by good growth and programme extensions at key partners,
including Arizona State University Online, Maryville University, Rutgers University and University of Alabama at Birmingham and from new partners, partially offset by contract exits.
We signed 45 multi-year programmes in 2017, renewed 19 programmes and launched 14 new programmes at partners, including Maryville University, Duquesne University and Ohio University. During the year, we also agreed the termination of nine programmes that were not mutually viable and did not renew a further six programmes.
Brinker International, Inc. (NYSE: EAT), one of the world’s leading casual dining restaurant companies and owner of Chili’s® Grill & Bar and Maggiano’s Little Italy®, with over 1,600 owned, operated and franchised restaurant locations, partnered with Pearson to launch a comprehensive employer-education programme Best You EDU that provides free educational opportunities to Brinker employees, including foundational, GED and Associate Degree programmes.
2018 outlook
US higher education courseware
In US higher education courseware, we expect revenues to be flat to down mid-single digit percentages as similar pressures seen in the last two years continue with lower college enrolments, increased use of OER and attrition from growth in the secondary market driven
by print rental are partially offset by growth in digital revenues, benefits from our actions to promote access over ownership and a continued normalisation of channel returns behaviour.
Evidence of a marginally slower rate of decline in US student enrolment, together with slightly lower than expected attrition from OER in 2017, means that we are now planning for an underlying decline in demand of around 6% in US higher education courseware, slightly improved from our prior range of 6% to 7%.
North American student assessment
We expect stable testing revenues in North American student assessment as new contracts offset a continued contraction in revenue associated with our PARCC contract.
Connections Education
Connections Education is expected to grow modestly as new partner school openings and good growth in enrolment are partially offset by in-sourcing of non-core services by some partners and contract exits.
Professional Certification
North American Online Program Management is expected to see modest growth in revenue as investment in new programs begin to ramp up. Professional certification is expected to grow revenues in the mid-single digits benefiting from new contracts, including our nationwide contract with the AAMC.

They chose BTEC – will you?
This year, we’ve been proud to partner once again with some high profile leaders who’ve told us why they love their careers – and why they believe in BTEC.
The ‘I Choose BTEC’ campaign was all about our BTEC Ambassadors telling their stories to show how BTEC opens doors to university, an apprenticeship – and a thriving career.
Business entrepreneurs Peter Jones CBE, Jamal Edwards MBE and Sharmadean Reid MBE and double Olympic Gold medallist Max Whitlock MBE all featured on London buses, posters in schools and colleges, and in online campaigns.
Olympic hero Max Whitlock MBE said: “I’m the type of person that likes to get stuck in and really involved in what I do. That’s the way I learn best. It’s not about being the hardest worker in the room – it’s about being the smartest. I would definitely recommend BTEC to other people.”www.ichoosebtec.com
The�future�of learning
Further education Core
BTEC
Link to strategic priorities 1 Grow share through digital transformation 2 Invest in structural growth markets See Our strategy, p13–21
Operating performance
4545Section 3 Our performance
Revenues grew 1% in headline terms, were down 1% at CER and flat on underlying terms, primarily due to growth in OPM in the UK and Australia and growth in Pearson Test of English offset by declines in school, higher education, English courseware and student assessment and qualifications.
Adjusted operating profit declined 14%, or £8m, in underlying terms due to revenue mix, investment in new products and services and business exits, partially offset by restructuring savings.
Courseware
School
Higher education
English
Courseware revenues declined moderately. In school, revenues declined in Australia, due to market contraction in the primary sector partly offset by slight growth in secondary, and declines in smaller markets in Europe and Africa. In higher education, revenues were down slightly due to declines in smaller markets, while in Australia and the UK an increase in direct to institution sales and a further shift to digital offset declines in traditional textbook sales. In English, there were declines in smaller markets.
Assessment
Student assessment and qualifications
In student assessment and qualifications, revenues declined mid-single digits primarily due to lower AS level, iGCSE and apprenticeship volumes as a result of policy changes. BTEC revenues also declined modestly as revenues recognised in 2017 lagged the greater stability we have seen in registrations and billed revenue in the year. We successfully delivered the National Curriculum Test for 2017, marking 3.5m scripts, up slightly from 2016.
Clinical assessment
Clinical assessment grew strongly with revenues benefiting from strong growth in the new editions of the Wechsler Intelligence Scale for Children (WISC-V) and the Clinical Evaluation of Language Fundamentals (CELF-5).
Pearson Test of English (PTE)
Pearson Test of English (PTE) saw continued strong growth in test volumes, which rose 84% from 2016, driven primarily by its use to support visa applications to the Australian Department of Immigration and Border Protection and good growth in New Zealand.
Professional Certification
In Professional Certification, revenues were flat as the impact of last year’s renegotiated terms of the UK Driving Theory test for the DVSA was offset by growth from new and existing contracts.
Efficacy finding
Research to understand the impact of Bug Club on pupils’ literacy learning, their attitudes to reading and school, and their reading activity found children made 30 months of progress in 18 months.
Core
Market summaryOur international business in established and mature education markets including the UK, Australia and Italy.
Contribution to Group revenues
18%Sales
£815mAdjusted operating profit
£50m

Thank you MyPedia“For a new school like ours, MyPedia has been a great support in terms of curriculum planning, assessments and teacher support. It challenges both teachers and students to break away from the conventional teaching learning methodology and encourages them to explore and derive their own conclusions.”
Meenakshi�Mehta�Headteacher
“MyPedia is user friendly software for the teachers. I was hesitant using it earlier but now it has become an integral part of my teaching plan. It has everything that a teacher can wish for. Thank you MyPedia.”
Pooja�Bisht,�Teacher
Helping create the future of learning
An interview with teachers from Gyananda School, Dehradun
46 Pearson plc Annual report and accounts 2017
Services
Higher education services
In higher education services, revenues grew strongly. Our OPM revenues were up 33%. In Australia, we saw good growth due to our successful partnership with Monash University, and continued success of the Graduate Diploma in Psychology. We have a total of c.9,300 course registrations across the seven programs in Australia up from c.6,900 in 2016. In the UK, we launched five new programs in addition to the two launched in 2016. UK course registrations grew, reaching c.1,400 compared with c.370 in 2016.
English services
English services grew, with strong growth in WSE Italy, due to the opening of new centres in 2015 and 2016, partially offset by declines in Japan.
2018 outlook
In Core, we are expecting modest growth driven by our recent investments in student assessment and qualifications, where we are offering new products and services of considerably greater value, along with continued growth in PTE and OPM with ten new program launches in the UK, and growth in existing programs in Australia.
Efficacy finding
Speakout: Students report that Speakout with MyEnglishLab has increased their confidence, motivation and enjoyment.
Revenues were flat in both headline and underlying terms due to growth in China, school courseware in South Africa and Pearson Test of English, offset by declines in higher education services primarily due to lower enrolment at CTI and business disposals in India, and declines in Brazil. Revenues were down 4% at CER due to the disposal of GEDU.
Adjusted operating profit increased 3% in underlying terms, reflecting the higher revenues in China, South Africa school courseware and PTE in India, together with the benefits of restructuring, partially offset by lower revenues in Brazil.
Courseware
Courseware revenues grew moderately, due to strong growth in school textbook sales in South Africa and English language courseware in China, partially offset by weakness in Brazil.
Growth
Market summaryOur growth markets in emerging and developing economies with investment priorities in Brazil, China, India and South Africa.
Contribution to Group revenues
17%Sales
£769mAdjusted operating profit
£38m
Operating performance

MePro: A new English Learning solution in Hispano-America“MePro is a new and innovative English Learning programme launching spring 2018 in Hispano-America initially, with plans to roll it out further across markets such as China, Brazil and the Middle East. English Learning opens up a world of opportunities and future careers and continues to grow as an indispensable core competency in non-English speaking countries – Pearson has the opportunity to reach millions of learners and teachers across the Growth markets through MePro which can help meet this need by leveraging successful existing content, assessment and enhanced technology solutions and platforms to deliver personalised learning for students measured by Global Scale of English learning outcomes.”
Helping create the future of learning
An interview with Alan Palau, Innovation & Efficacy Delivery Director, Hispano-America, Pearson
Link to strategic priorities 1 Grow share through digital transformation 2 Invest in structural growth markets See Our strategy, p13–21
Operating performance
4747Section 3 Our performance
Penguin Random House
Following the disposal of a 22% stake on 5 October 2017 Pearson owns 25% of Penguin Random House, the first truly global consumer book publishing company.
Penguin Random House performed in line with our expectations with revenues up slightly on a headline and underlying basis year on year on rising audio sales, broadly stable print sales and modest ongoing declines in demand for eBooks, while the business benefited from bestsellers by Dan Brown, R.J. Palacio, John Grisham, Jamie Oliver and Dr. Seuss.
2018 outlook
In Penguin Random House, we anticipate a broadly level publishing performance and expect an annual after-tax contribution of around £60–65m to our adjusted operating profit.
Services
English services
In English services, growth in Wall Street English in China, due to new centre openings, was offset by declines in Brazil due to macroeconomic pressures.
School services
In school services, revenue fell, with student enrolment in our sistemas business in Brazil falling 14% primarily due to NAME, our public sistema, where we took the strategic decision to exit two-thirds of our contracts with municipalities due to unattractive economic prospects, together with a reduction in student enrolments in our Dom Bosco private sistema due to challenging economic conditions. In India, Pearson MyPedia, an inside service ‘sistema’ solution for schools, expanded to over 500 schools with approximately 157,000 learners.
Higher education services
In higher education services, revenues declined sharply due to a 14% fall in total student enrolment at CTI, our university in South Africa driven by the cumulative impact of economic factors in recent years, partially offset by improved new student enrolments in 2017, together with business exits in India.
Assessment
Pearson Test of English
Professional Certification grew strongly. Pearson Test of English saw over 30% growth in the volume of tests taken in India.
2018 outlook
In our growth markets we expect a modest increase in revenues, with growth in China in ELT products, PTE and in South Africa due to improving enrolments in CTI partially offset by declines in school courseware after a strong 2017. In Brazil, we expect revenue to increase modestly from growth in Wizard and school sistemas, partially offset by declines in government contracts. In India, we expect PTE and MyPedia to continue growing.
1 2 3 4
Efficacy consulting & placement
Learning progress plan
Measuring progress
Relevant achievement
Measuring learning progress

The goal of our approach to Enterprise Risk Management (ERM), summarised in the framework below, is to support Pearson in meeting its strategic and operational objectives, as set out by the Chairman and the Chief Executive on p6–10. Our framework aligns to international standards (e.g. COSO and ISO 31000) and aids our compliance with the Financial Reporting Council’s (FRC) UK Corporate Governance Code guidance on risk management.
Risk management
Managing riskFoundationsRisk foundations are all the elements (as set out in this framework) which underpin successful ERM, and risk management more broadly, across Pearson.
Governance and oversight
The Board, assisted by the Audit Committee, oversees the ERM framework, validates risk appetite targets, risk status and mitigation plans, plus verifies the viability statement process.
Roles and responsibilities
Day-to-day ERM is undertaken by a dedicated team. For a list of their responsibilities, as well as other key risk stakeholders, see p84 ‘Governance’.
Policy, framework, processes and tools
Our policy, framework and supporting guidance outline our commitment to managing risk and set what we consider to be the minimum standards. These can be tailored by a business area as long as they align with the policy. The process is assessed during the annual effectiveness review, covered in more detail on p84 in ‘Governance’.
Appetite and tolerance
Pearson leadership sets the target risk appetite for each risk they own, validated by the Audit Committee and Board. Understanding the degree of risk the Board will accept determines the most appropriate risk treatment.
For example, a legal or compliance risk has a low target appetite where we try to eliminate risk as much as we can. Whereas a business transformation risk is often also a strategic opportunity and likely to have a higher appetite, where we would take well-informed and well-managed risks to achieve our goals.
Working with third-parties
The use of third-parties (for example, suppliers or partnerships) can create risk, such as an interruption to operations or an impact on reputation. In 2017, we drafted a third-party risk management policy. We also created risk identification questions to help us flag areas requiring investigation. Questions cover principal risks as well as material issues, e.g. environmental matters and respect for human rights, as described in ‘Sustainability’ on p24–33. This process is being rolled out in phases as part the implementation of a new procurement system.
Our approach to managing risk has remained consistent with our approach in 2016.
Context
The risk context sets the criteria against which risks are identified and assessed. It defines the external and internal parameters to be taken into account, as well as the scope of the risk management process.
The risk management policy, framework and supporting guidance set out how to manage risks, such as determining probability and impact as well as instructions on how to translate these into an overall risk rating. Adaptations of these matrices, tailored for a specific business area, are in use and align with the policy.
Context
Monitoring and review
Treatment
ReportingAssessment
identify, analyse, evaluate
Pearson plc Annual report and accounts 201748

Managing risk CultureThe ERM framework is also used to drive the integration of risk management approaches into the culture of the organisation.
Communication, training, education and awareness
Our Code of Conduct remained in place throughout 2017 to drive ethical behaviours across the organisation. The ERM team is committed to raising awareness among employees on the importance of better managing their day-to-day risks. In 2017, the team regularly attended leadership and team meetings to highlight best practice and conducted specific training events.
Embedding risk in decision-making
A key focus area for the ERM team in 2017 was the further embedding of risk management across the wider organisation to support the business in making risk aware decisions.
All Pearson business functions continued to maintain their own risk map, with the spotlight in 2017 on the robustness of the mitigation plans. Business functions follow the same framework for identifying, assessing, treating and monitoring risk. Each identified risk is also assigned a risk appetite target. This work underpins the assessment of the company-wide risks. 2017 saw greater ownership and extension of risk processes by individual business areas.
Continuous improvement
At the end of 2014, we reviewed our current risk management maturity against this risk framework and set maturity targets for the following three years.
In 2018 we will be implementing a more integrated approach to assurance across Pearson (based on a model which outlines the different levels of assurance responsibilities from business management through to external audit and oversight), as well as updating our framework to ensure it continues to align with the 2017 update of the COSO ERM standard.
Assessment
At least twice a year, the ERM team facilitates a risk assessment process through discussions with leadership, senior management and key stakeholders from each business area. For each risk, the probability of it materialising and its potential impact is rated. The adequacy of action plans to address any remaining control gaps is then assessed.
We do this for both new risks identified as well as those already being monitored. Horizon scanning also takes place throughout the year to aid in the identification of new risks.
Treatment
Once assessed, the most appropriate course of action for each risk is decided, taking into account the size of the gap that needs to be closed between its current status versus its risk appetite target. This can include ‘avoid’ (e.g. not doing something); implementing mitigation or contingency plans to change the probability or reduce the impact of a risk; accepting increasing risk in order to pursue an opportunity; or sharing the risk with another party or parties.
Monitoring and review
Reports are submitted to the Board and Audit Committee bi-annually. This gives them the opportunity to review, challenge and validate the ERM process and key risks. The reports cover current risk status as well as an update on risk mitigation initiatives and their effectiveness. Discussions focus on where there is either a) the greatest change in rating or b) the biggest gap between current rating and the target appetite, with the emphasis on the strength of mitigation plans in place. The risk maps for each business area are also included in these reports.
Risk deep dives also take place at the Audit Committee throughout the year. In 2017, some of the risks covered included business transformation, data privacy and security (including GDPR), tax and treasury. You can read the details in the Chairman of the Audit Committee’s report on p76–78.
Risk management
49Section 3 Our performance 49

Principal risks and uncertainties
The Board of Directors confirms that throughout 2017 they undertook a robust assessment of the principal risks facing the company, in accordance with provision C.2.1 of the 2016 UK Corporate Governance Code.
Our principal risks (as of 31 December 2017)
Listed in the table below (and shown on the adjacent risk map) are the most significant risks that may affect Pearson’s future. A longer list of company-wide risks, plus emerging risks, was monitored and reviewed throughout the year. The most material of these are identified as principal risks. Principal risks are those which have a higher probability and significant impact on strategy, reputation or operations, or a financial impact greater than £50m.
The full impact of the UK’s pending departure from the EU (Brexit) is still unclear, but we remain vigilant to potentially material risks for Pearson. Work continued throughout 2017 (led by a Steering Committee chaired by the CFO) to identify and mitigate any potential impact on (a) our principal risks below, such as treasury, tax or data privacy, or (b) other areas such as UK-EU supply chain and workforce mobility, including in the event of a ‘no deal’ exit scenario. We continue to believe that Brexit, in whatever form it takes, will not have a material adverse impact on Pearson as a whole.
The following principal risks also relate to the material issues considered in the 2017 sustainability report: products and services, testing failure, political and regulatory risk, data privacy, information security, customer digital experience, and safety and corporate security. You can read more in the Sustainability section on p24–33.
Principal risks: status and 2017 change
0
Indicates change in 2017
Net risk Probability and impact are based on residual risk, i.e. after taking into account controls already in place and assumed to be operating effectively.
For more information see principal risks and uncertainties tables p51–60.
Key
Impa
ct
Rare Unlikely Possible Likely Almost certain
Insi
gnifi
cant
Min
orM
oder
ate
Maj
orSe
vere
2
1
10
13
11
14
4
12
8
5
7 3
Probability
Risks are categorised into four main areas: Executive responsibility
Strategy & change Relating to the goals that support our strategy. This category is the most likely to contain ‘opportunity’ risks which typically have a higher risk appetite
1 Business transformation and change
Chief Executive Officer
2 Products and services President, Global Product
3 Talent Chief Human Resources Officer
4 Political and regulatory risk
Chief Corporate Affairs and Global Marketing Officer
Operational Involving people, systems and processes
5 Testing failure President, Assessments President, UK & Core Markets
6 Health and safety Chief Human Resources Officer
7 Safeguarding President, Assessments
8 Customer digital experience
President, Global Product & Chief Technology and Operations Officer
9 Corporate security and business resilience
Chief Financial Officer
Financial Involving financial planning, investments, budgeting, potential losses of and exposures to Pearson’s assets
10 Tax Chief Financial Officer
11 Treasury Chief Financial Officer
Legal & compliance Relating to the adherence to applicable laws and regulations. Risks in this category typically have a very low risk appetite.
12 Data privacy and information security
Chief Technology and Operations Officer & General Counsel
13 Intellectual property and rights, permissions and royalties
General Counsel
14 Compliance General Counsel
15 Competition law General Counsel
9 156
50 Pearson plc Annual report and accounts 2017

Business transformation and changeThe pace and scope of our business transformation initiatives increase our execution risk that benefits may not be fully realised, costs may increase, or that our business as usual activities may be impacted and do not perform in line with expectations.
Incorporates ‘Data quality and integrity’ risk: Unavailability of timely complete and accurate data limits informed decision-making and increases risk of non-compliance with legal, regulatory and reporting requirements.
Increase in impact and probability
Existing controls
Transformation programme office
Global learning platform (GLP) and the enabling programme (TEP) are standing Audit Committee agenda items. See ‘Governance’ p76–77
Regular updates with Pearson Executive
Executive owned Steering Committees in place
Independent assurance on key programmes
Outcome of 2017 activities
In 2017, we continued to invest in the digital transformation and simplification of the company. The volume and accelerated pace of change combined with execution interdependencies as we go into 2018 are keeping this our highest rated (and slightly increased) risk. We also have capabilities we need to continue to develop internally to deliver transformation and change (See Talent risk on p52).
The £300m 2017-2019 cost efficiency programme remains on track to achieve its targets. Following the planning phase culminating in the August 2017 announcement, the programme transitioned to implementation.
HR Fusion, part of TEP, successfully went live in the US in June 2017. Significant progress was also made regarding data governance as our quality focus and scope expanded in 2017 to global data. We now have a much more top-down view of product data, moving on to sales, marketing, rights and royalties and fulfilment. We also started putting in place customer data governance.
2018 outlook and plans
Business transformation and change initiatives will continue to support our strategic goals to accelerate our digital transition in higher education, to manage the print decline, and to reshape our portfolio, as outlined by our Chief Executive on p8–10 and covered in more detail under our strategy in action on p14–21.
In 2018, we will continue with the development of the GLP, a single, cloud-based platform to support learners and our digital transformation, as well as the next phase of TEP to further progress the simplification of our business. Both programmes will continue to be closely monitored by the Audit Committee at each meeting (you can read more about their oversight of key programmes in the report from the Chair of the Audit Committee on p76–77).
Successful execution of all our change programmes in 2018 will depend on having the right change management skills (see also Talent risk on p52).
The focus on data quality in 2018 will be supporting the TEP North America implementation. In addition, the new EU data privacy law, the General Data Protection Regulation (GDPR) which will apply from May 2018 and spans all of our underlying systems, is a priority.
Strategy & change1
Principal risks and uncertainties
5151Section 3 Our performance

Strategy & changeProducts and servicesFailure to accelerate our shift to digital by developing and delivering (to time and quality) market leading global products and services that will have the biggest impact on learners and drive growth; ensuring Pearson offers products to market at the right price and with a deal structure that remains competitive as well as supports our strategy.
Decrease in probability
Existing controls
Global product lifecycle process
Portfolio management
Audit Committee oversight of GLP
Outcome of 2017 activities
Successfully managing this risk underpins two of our key strategic priorities – growing our market share through digital transformation plus investing in structural growth opportunities (see p14–17).
The likelihood of this risk occurring reduced in 2017 due to the progress we’ve made towards implementing portfolio management practices and strategic investment recommendations, as well as on pricing strategy and governance in US higher education courseware.
In 2017, we progressed our understanding of the competitive and structural threats, especially to our courseware business in terms of general and student buying behaviour and have taken steps to mitigate these. For example, we are making good progress in shifting the business from ownership to ‘pay for use’, we reduced the price of a number of eBook rentals and also launched a print rental
programme to give greater convenience and value to students.
2018 outlook and plans
Turning this risk into an opportunity – successfully accelerating our shift to digital as well as investing in and delivering the right products and services – is as key to successful business performance in 2018 as it was in 2017. A new Chief Strategy Officer joined at the start of 2018 see p63.
We will continue to improve the US higher education courseware integrated business strategy, product lifecycle and governance, as well as pricing strategy. In addition to the development of GLP, we are investing in other innovations, such as Artificial Intelligence, to ensure our products stay relevant and to become more agile in our delivery. We are also prioritising investment in our fastest growing businesses across Pearson. See p16–17 in Strategy in action.
Market research and analysis activity across Pearson was centralised into one Global Insights team in January 2018. Their remit is to develop customer insights to inform portfolio, product, channel and business strategy.
2
TalentFailure to attract, retain and develop staff, including adapting to new skill sets required to run the business.
Decrease in probability
Existing controls
Consistent performance, talent and succession management processes
Employee policies including the Code of Conduct (see p27 in Sustainability)
Employee engagement forums and action plans
Turnover data monitored on a monthly basis
Exit interviews conducted and monitored globally to identify any trends and concerns
Learning programmes now offered on a single platform for all staff (Pearson U)
Revamped external careers website and talent acquisition approach to improve attraction of digital skills
Wide range of employee benefits
Outcome of 2017 activities
The likelihood of this risk occurring has reduced due to the mitigation activities successfully implemented in 2017. However, talent remains an ongoing priority for the company, with a focus on building the talent needed to deliver the business strategy for 2020 especially in key areas such as digital and change management skills.
Work was undertaken to ensure we have clarity on the key capabilities required to achieve our 2020 goals, using this to support learning and development, assessment, development and talent attraction.
Throughout 2017, there was a strong focus on leadership communication of the Pearson strategy, as well as increased visibility of the Pearson Executive and leadership teams.
Employee engagement action plans communicated across Pearson and the Executive are reporting progress to the Board on a quarterly basis. Highlights from these plans are listed on p27 in the Sustainability section.
An organisational health survey was conducted, and results and action plan shared in Q4.
Our platform for learning and development was upgraded in 2017, increasing accessibility to learning and development solutions and greater flexibility in goal-setting. Academies were also launched for leadership teams as well as Technology, Product, Marketing and Finance. These aim to increase both our capabilities and retention.
2018 outlook and plans
Pearson will implement further programmes to improve connection with the Pearson strategy, and to increase engagement and organisational health.
In order to build the talent we need to deliver the 2020 business strategy, there will additional focus on direct sourcing and construction of targeted talent pools to target skills (digital), address succession gaps, and increase diversity in leadership roles. We will also continue to support change activities through Change Leadership training and handbooks.
In 2018, there will be a stronger focus on development planning linked to further roll-out of career workshops. We will expand and upgrade Pearson U learning, launching new Sales Academy and leadership programmes that support succession planning and increase retention. We will also further refine the careers website to increase employee attraction.
The Pearson Executive will maintain their focus in 2018 on talent actions for the senior leadership group and succession through quarterly reviews.
3
Principal risks and uncertainties
52 Pearson plc Annual report and accounts 2017

Strategy & changePolitical and regulatory riskChanges in policy and/or regulations have the potential to impact business models and/or decisions across all markets.
Existing controls
Board and Executive oversight
Government relationship teams
EU referendum Steering Committee
Outcome of 2017 activities
Although there has been no overall change in the risk rating, significant work has been done to ensure we can more proactively identify and mitigate political and regulatory risk.
Over the last two years, there has been a specific focus on leveraging resources across the US and UK to build global political/regulatory relationships, and an international political profile in order to understand future international risks and proactively mitigate them.
In the UK, 2017 was the year that GCSEs began their changeover from grades A*-G to 9-1 with English and Maths. Our focus was on working with government, regulator and other awarding organisations to demonstrate the professionalism and solidity of the system, which resulted in a stable set of results.
In the US, we continued to implement our ten priority state strategy engaging with new and existing office holders in key states and worked to shape the state and federal regulatory and legislative environment in favour of Pearson strengths. This work focused on Pearson solutions to affordability and access with stakeholders in Congress, the Administration and priority state capitals.
The full impact of the UK’s pending departure from the EU is still unclear, but we remain vigilant to potentially material risks for Pearson. Work continued throughout 2017 (led by a Steering Committee chaired by the CFO) to identify and mitigate any potential impacts on our principal risks below, such as treasury, tax or data privacy, or on other areas such as UK-EU supply chain and workforce mobility, including in the event of a ‘no deal’ exit scenario. We continue to believe that Brexit, in whatever form it takes, will not have a material adverse impact on Pearson as a whole.
2018 outlook and plans
Pearson will continue to position itself as a leader in the education space, an innovator in higher education and establish the company as a key engine in workforce development and economic growth. We are also driving opportunities to engage directly with other businesses.
In the UK, there is ongoing concern about the amount of testing (and the sheer difficulty of the new tests) in primary schools. As a test administrator, we are mitigating this through a stakeholder outreach programme on assessment. In addition:
The new 9-1 GCSEs will be awarded in almost all subjects
Technical education: as the government becomes more clear about the role of T Levels we will need ongoing government relations, media and thought leadership work.
Across our educational markets in 2018, we believe the trend for more intrusive and voluminous regulation in our sector will continue. We will continue our work from 2016 and 2017 to mitigate this.
We will continue to assess the potential impacts of the UK’s decision to leave the EU as the model that will replace our membership becomes clearer.
4
Principal risks and uncertainties
5353Section 3 Our performance

Testing failureFailure to deliver tests and assessments and other related contractual requirements because of operational or technology issues, resulting in negative publicity impacting our brand and reputation.
Health and safetyFailure to adequately protect the health, safety and wellbeing of our employees, learners and other stakeholders from harm could adversely impact our reputation.
This risk previously incorporated Corporate security which is now part of risk 9 ‘Corporate security and business resilience’.
Decrease in probability
Existing controls
We seek to minimise the risk of a breakdown in our student marking systems with the use of:
Robust quality assurance procedures and controls
Oversight of contract performance Investment in technology, project management and skills development of our people, including software security controls, system monitoring, pre-deployment testing, change controls and the use of root cause analysis procedures to learn from incidents and prevent recurrence
Use of Amazon Web Services (AWS) in Clinical and Schools
IBM counter-fraud tool.
Outcome of 2017 activities
Pearson is an education content, assessment and related services company and, as such, managing this risk remains a priority.
In the US, the majority of student testing is now conducted via AWS, resulting in improved availability and stability.
In the UK, we successfully delivered the UK summer exam series in 2017 to a high standard of quality.
2018 outlook and plans
The drive to continue improvements to availability and stability of testing systems continues. The migration and retirement of legacy systems in use will continue.
Given the high stakes nature of the UK testing business, there remains a risk of breaches of security either as a result of error or of a malicious nature. We are reviewing what additional measures we can put in place for 2018 to further mitigate against potential question paper security breaches.
The plan to upgrade Pearson’s bespoke online marking system – ePEN – in the UK will continue throughout 2018 with full implementation due by the end of 2019, taking into account the complexity of our systems as well as external marking contract obligations.
Clinical’s Q-global will be moving to AWS in Q1 of 2018. Additional technology stack updates will be implemented during 2018 to address 2017 issues.
Existing controls
Global health and safety (H&S) team
Global policy and standards
Global assurance and incident reporting system
Audit programme
Regional training
Outcome of 2017 activities
The likelihood of this risk occurring has decreased as a result of the outcomes of the following:
Overall implementation status of Pearson’s H&S minimum standards continues to improve globally
The 2017 global H&S audit programme was completed across a wide range of our locations
Our global H&S coordinator role has been formalised with a new terms of reference
The global H&S team became a registered centre to teach the globally recognised Institution of Occupational Safety and Health (IOSH), Managing Safely course
A completely revised global H&S Policy (with improved governance and responsibilities) and standards have been developed, which now include good practice goals, recognising the H&S maturity in many of our key markets
Good progress was made across our 15–17 H&S Strategy.
2018 outlook and plans
Implement the new global H&S Policy and standards and continue to improve the application of our H&S standards
Refine and Implement a new 18–20 H&S Strategy
Deliver the IOSH Managing Safely course to our global H&S coordinators
Review our H&S systems to ensure they continually evolve to reflect our changing business
Enhance our global assurance programme to not only provide risk-based auditing of key locations, but to also include advisory reviews and focused risk-based H&S Projects
Continue to evolve our key risk reduction programmes covering:
– Ergonomics
– Occupational Road Risk
– Occupational health risk management and wellbeing
Operational5
6
Principal risks and uncertainties
54 Pearson plc Annual report and accounts 2017

Existing controls
Safeguarding policy
Internal procedures and controls
Staff Code of Conduct
Third-party risk management policy
Safeguarding Steering Committee
Local safeguarding coordinators
Outcome of 2017 activities
We continue to view safeguarding as a fundamental obligation to our learners and a high priority. Although the risk has been reduced due to our disposal of the majority of our direct delivery businesses, we are exposed to greater online risk as we move to more digital services. There is never a zero risk of a safeguarding incident and organisations should always challenge themselves and look to improve their practice. Hence the overall risk remains the same.
An exercise was conducted to test the response of selected businesses to an online safeguarding issue regarding a member of staff, the results of which were used to further refine training and awareness, ready for implementation in 2018.
A sexual harassment policy for our further education business has been developed and currently training is being produced to support its implementation in Q2 2018.
2018 outlook and plans
We will continue to develop and question our practices around safeguarding in 2018, with a focus on ongoing training and awareness across the business, especially with regard to online safeguarding.
We will also further refine our safeguarding metrics and the system used for reporting, as well as developing and implementing a system for external validation of our safeguarding practice.
Customer digital experienceChallenges with reliability and availability of customer facing systems could result in incidents of poor customer digital experience and impact our customer service responsiveness.
Existing controls
Real-time monitoring of systems (for service disruptions) and reporting of operational performance used to identify issues
Project management disciplines in place to ensure enhancements and new products meet required standards
Outcome of 2017 activities
Managing this risk is critical to achieving our strategic goal of accelerating our shift to digital products and services, and, crucially, becoming a trusted partner. Therefore this risk remains high, despite the significant improvements in 2017 to our product stability and execution.
Mitigations were put in place to prevent a recurrence of the 2016 back-to-school (BTS) issues experienced by customers. BTS stability in the second half of 2017 was significantly improved, resulting in only a few minor incidents and the highest availability levels seen in the last three years.
Further investment was made in 2017 in our global learning platform (GLP). You can read more on this and how it underpins our strategy and the learning experience in ‘Our strategy in action’ section on p14–15.
Customer support also improved response times for incoming calls and improved outgoing customer communications during the recent outages.
2018 outlook and plans
In 2018, there will be a continued focus on the performance, stability and usability of all product platforms as well as customer service quality and responsiveness.
Our GLP development, critical to our digital transformation strategy, will continue in 2018, with the first pilots due to go live. This platform will allow us to innovate faster as well as better support our learners.
Operational
8
SafeguardingFailure to adequately protect children and learners, particularly in our direct delivery businesses.
7
Principal risks and uncertainties
5555Section 3 Our performance

Corporate security and business resilienceCorporate security: Failure to ensure security for our staff, learners, assets and reputation, due to increasing numbers of and variety of local and global threats.
Business resilience: Failure to plan for or prevent incidents at any of our locations. Incident management and technology disaster recovery (DR) plans may not be comprehensive across the whole Group.
Risk definition has changed from ‘business continuity’ in 2016 and now incorporates corporate security, previously reported as part of risk 6 ‘Health and safety’.
Existing controls
Security and resilience policies
Security minimum protection standards
Incident management process
Resilience governance Steering Committee
Incident management and DR teams
Global notification and incident reporting tools
ISO audit programme
PQS & VUE – ISO 22301 accredited
Outcome of 2017 activities
There were an increased number of incidents in 2017, which fortunately did not impact Pearson directly.
Continued work across the ‘Top 40’ locations for planning, testing and response
Increased collaboration across the organisation, improving understanding of current and future risks, particularly regarding incident response and DR planning
Training of global incident management teams for different response levels
A mass notification system was deployed in the UK and will be further deployed globally during 2018 in order to better communicate with our staff and confirm their safety during an incident
We strengthened our travel security programme, including greater support provision for higher risk trips
In physical security, the security policy and global property guidelines were released in early 2017, and contain advice and direction for all projects involving the build, refurbishment and disposal of properties. Security reviews in specific locations resulted in a reduction of risks and therefore improvements for staff and learners.
2018 outlook and plans
In 2018, we will:
Continue to drive security as a proactive rather than reactive activity, with ongoing physical and travel security reviews
Refine the incident response model towards a broader regional/geographic response
Continue work on the sustainable and data specific roll-out of the Everbridge mass notification system
Mandate travel security training for travel to high risk countries (due for deployment in February)
Work to refine DR planning for any legacy systems and applications, as well as our support of the GLP, TEP and the £300m 2017-2019 cost efficiency programmes
Grow our knowledge around cloud-based technologies and implement future digital resilience.
9
Principal risks and uncertainties
Operational
56 Pearson plc Annual report and accounts 2017
TaxLegislative change caused by the OECD Base Erosion and Profit Shifting initiative, the UK exit from the EU, other tax reform or domestic government initiatives, potentially in response to the ongoing EU anti-tax abuse activities, results in a higher effective tax rate, double taxation and/or negative reputational impact.
Increase in impact
TreasuryFailure to manage treasury financial risks e.g. debt repayments, key corporate ratios, counterparty risk, rising interest rates and transactional FX exposure.
Decrease in impact and probability
Existing controls
Our tax strategy reflects our business strategy and the locations and financing needs of our operations. In common with many companies, we seek to manage our tax affairs to protect value for our shareholders, in line with our broader fiduciary duties. We do not seek to avoid tax by the use of ‘tax havens’ or by transactions that we would not fully disclose to a tax authority. We are guided by our taxation principles, which include complying with all relevant laws, including claiming available tax incentives and exemptions that are available to all market participants.
Oversight of the tax strategy is within the remit of the Audit Committee, which receives a report and risk deep dive on this topic at least once a year (see p78 for details). The CFO is responsible for tax strategy; the conduct of our tax affairs and the management of tax risk are delegated to a global team of tax professionals.
Outcome of 2017 activities
This risk increased in 2017 due to the US tax reform changes legislated in December and the announcement in November of the European Commission opening decision on the United Kingdom Controlled Foreign Companies exemption [see note 34, contingent liabilities on p175).
In August the Audit Committee received an update on our tax strategy and approved our first tax report which was published in September. A further update was given to the Audit Committee and Board in December mainly focusing on the impact of US tax reform.
US tax reform is not expected to have a material impact on our effective tax rate, however we continue to work through the detail and assess whether any changes to our strategy are appropriate.
The outcome of Brexit remains insufficiently clear to assess any impact on tax but we continue to monitor.
2018 outlook and plans
We will continue to assess (and implement mitigation plans if required) US legislation changes as well as monitoring potential tax law changes globally, along with Brexit implications and the State Aid situation.
2018 will see the publication of our second tax report.
Media and public scrutiny on tax issues will continue to be actively monitored by group tax and corporate affairs.
Controls
Treasury policy (see note 19 starting on p156)
The treasury strategy and policy is also subject to an Audit Committee risk ‘deep dive’. See p78
Outcome of 2017 activities
Overall treasury risk has reduced over 2017 due to a proactive exercise to reduce gross debt and strengthen our balance sheet which has had a direct impact on refinancing, counterparty and interest rate risk.
Pearson has no debt maturities in 2018. We anticipate that cash from operations, our existing cash balances and cash equivalents, together with availability under our existing credit facility, and cash from operations, will be sufficient to fund our operations for at least the next 12 months.
Pearson maintains investment grade credit ratings with Moody’s and Standard and Poor’s which facilitate good access to capital markets. These credit ratings in February 2018 were Baa2 (negative outlook) with Moody’s and BBB (negative outlook) with Standard and Poor’s. The negative outlooks reflect perceived business risk as the business transforms, particularly in US Higher Education.
See note 19 starting on p156 for more information on credit, counterparty, interest rate and transactional FX activities in 2017.
2018 outlook and plans
In 2018, we will continue to operate in line with our treasury policy. More on this can be found in note 19, starting on p156.
Financial10
11
Principal risks and uncertainties
5757Section 3 Our performance

Data privacy and information securityRisk of a data privacy incident or other failure to comply with data privacy regulations and standards, and/or a weakness in information security, including a failure to prevent or detect a malicious attack on our systems, could result in a major data privacy or confidentiality breach causing reputational damage, damage to the student experience, lack of compliance and financial loss.
Existing controls
Information Security and Data Privacy Offices
Privacy impact assessment process
Regular audits
Automated tools
Annual data privacy training and awareness week
Risk management framework
Vendor oversight
Audit Committee risk ‘deep dive’. See p78
Outcome of 2017 activities
Risks concerning cyber-security and data privacy remain high due to complex external factors.
We now have clarity on the increased regulatory obligations and their impact on Pearson, such as the new EU data privacy law, the General Data Protection Regulation (GDPR) which will apply from May 2018 and introduce more onerous privacy obligations and more stringent penalties for non-compliance. The UK’s departure from the EU is also adding another layer of uncertainty with regard to the regulator, and customers are also demanding more from us in terms of data privacy (e.g. GDPR and data sovereignty).
We continued to roll out our GDPR programme in 2017; our work to improve the security of our critical products; as well as our privacy impact assessment process for new vendors and programmes.
Many information security risks previously identified have been addressed, plus there was increased vendor oversight in 2017. However, ongoing assessments uncover new vulnerabilities and risk areas arising from increasingly sophisticated attack strategies, as well as Pearson’s ongoing transition to digital products, services and cloud adoption.
In 2017, the information security team focused on an improvement programme for critical applications, core platforms and infrastructure to enable Pearson’s digitisation and simplification strategy. In addition, we also instituted a programme to review our top vendor contracts to ensure they have the most up-to-date data privacy and information security wording and that they align with GDPR where relevant.
2018 outlook and plans
The Data Privacy Office continues to monitor developments relating to the UK’s departure from the EU and, where necessary, adapt to any new UK specific privacy developments. As Pearson operates across several EU Member States, we will still need to comply with GDPR when the UK leaves the EU.
The information security team will continue to drive security maturity (and also thus security compliance to GDPR, PCI, HIPAA, FERPA and other regulatory requirements). A new risk management tool has been deployed so that security risk accountability can be cascaded effectively.
We are conducting an inventory of what personal and other sensitive data we hold and where in the organisation to better focus our resources and attention.
Joint data privacy and information security activities to build security and privacy controls into the design critical products (including the new global learning platform) will continue.
Increased vendor oversight is a critical initiative for security and broad compliance.
Legal & compliance12
Principal risks and uncertainties
58 Pearson plc Annual report and accounts 2017

Intellectual property and rights, permissions and royaltiesFailure to adequately manage, procure, register or protect intellectual property (IP) rights (including patents and general copyright) in our brands, content and technology or to prevent unauthorised printing and distribution of books and digital piracy may prevent us from enforcing our rights which will reduce our sales and/or erode our revenues.
Failure to obtain permissions, or to comply with the terms of permissions, for copyrighted or otherwise protected materials such as photos resulting in potential litigation; risk of authors alleging improper calculations or payments of royalties.
Decrease in probability
ComplianceFailure to effectively manage risks associated with compliance (global and local legislation), including failure to vet third-parties, resulting in reputational harm, anti-bribery and corruption (ABC) liability, or sanctions violations.
Expanded from the previously reported anti-bribery and corruption risk.
Existing controls
Policies in place to manage and protect our IP
Global trademark monitoring platform
Cooperation with trade associations
Monitoring of technology and legal advances
Patent programme in place
Establishment of Anti-piracy Committee
Legal department provides ongoing monitoring and enforcement of print and digital copyright piracy
Outcome of 2017 activities
Overall risk has reduced due to careful litigation management, the continued negotiation of preferred vendor agreements, as well as the ongoing work to implement a new rights and royalties system which will further mitigate this risk. We started our phased implementation of this system in the UK in 2017.
We established an Anti-piracy Committee to manage piracy related risk in a coordinated manner. We conduct internet monitoring, takedown and internet ‘search result’ scrubbing to reduce digital piracy. We have also worked with our larger North America channel partners to adopt best-practice anti-counterfeit measures.
In 2017, we launched patent management technology to further improve our asset tracking, as well as implementing a global trademark monitoring platform to improve visibility of potential infringement threats.
2018 outlook and plans
We will continue to streamline our portfolios; procure and register expanded rights in our high value IP globally, including aggressively expanding our patent portfolio; monitor activities and regulations; and proactively enforce our rights, taking necessary legal action.
We will continue to implement the newly developed royalty and business practices, along with the new rights management system across the US and Canada during 2018.
A new author agreement is being rolled out in the first half of 2018.
Existing controls
Audit Committee oversight
ABC policy certification
Internal procedures and controls
Risk-based third-party due diligence
Employee and business partner codes of conduct (see also ‘Respect for human rights’ under Sustainability on p28)
Local Compliance Officers (LCOs)
Outcome of 2017 activities
Internal procedures, controls and training continue to mature, which are designed to prevent corruption. Pearson’s Code of Conduct was refreshed and rolled out for all employee certification in September 2017, including references to ABC policy and requirements (also discussed under ‘Sustainability on p28). Pearson’s ABC policy reflects our zero tolerance towards bribery and corruption of any kind by establishing a consistent set of expectations and requirements regarding ABC for all our personnel and business partners to adhere to.
Pearson’s 2016 ABC programme self-assessment served as a roadmap for work for 2017-2018. Progress was made on ABC risk assessments of the various regional and local business units.
We conducted due diligence on our highest risk third-parties and developed roll-out plans for further phases.
Pearson’s ABC infrastructure includes a network of LCOs based in country, mainly members of the legal team. This programme continues to be successful with greater knowledge and competencies of the LCOs and better leadership, guidance and helpful tools and resources provided by the global compliance office.
2018 outlook and plans
In 2018, we will:
Implement a comprehensive plan for risk-based roll-out of further ABC third-party due diligence, including new tools and resources
Roll out a comprehensive refresh of the training programme on ABC and Code of Conduct globally
Continue risk assessments in 2018 to ensure that the ABC programme reflects local market and business model risks, as well as plan actions to remediate issues revealed during those assessments
Employ a more robust analytic framework to our investigative data to spot trends and root causes.
Legal & compliance13
14
Principal risks and uncertainties
5959Section 3 Our performance

Risk assessment of prospects and viability
This section should be read together with the full viability statement on p106.
Pearson’s principal risks and our ability to manage them as outlined above are linked to our viability as a company. These risks have therefore been taken into account when preparing the viability statement.
The Board assessed the prospects of the company over a three-year period, longer than the minimum 12 months of the annual going concern review. The three-year period corresponds with Pearson’s strategic planning process and represents the time over which the company can reasonably predict market dynamics and the likely impact of additions to the product portfolio.
The Board discusses the company’s strategic plan on an annual basis taking account of a range of factors, including market conditions, the principal risks to the Group above, product and capital investment levels as well as available funding. Pearson’s strategy and business model are discussed in more detail on p14–21.
The key assumptions which underpin our three-year strategic plan to December 2020 are as follows:
Implementation of our 2017-2019 cost efficiency programme reducing our annualised cost base exiting 2019 by c.£300m
Increased investment in the product technology platform to accelerate the shift to digital and enhance courseware service capabilities
Further declines in enrolments and other downwards pressures in the US higher education courseware market
US higher education courseware returns rates continue to improve as the previous inventory correction continues to unwind and sales become more direct to consumers
Online Program Management grows, driven by global enrolment in undergraduate and post-graduate online courses
US assessment revenues stabilise
Other strategic priorities, including Online Blended Learning and Professional Certification, show modest growth.
In assessing the company’s viability for the three years to December 2020, the Board analysed a variety of downside scenarios, including a scenario where the company is impacted by all principal risks. The primary modelling overlaid a ‘severe but plausible’ downside scenario onto the base case strategic plan for Pearson, focusing on the impact of the following assumptions and key risks:
Failure to materialise anticipated benefits of our 2017-2019 cost efficiency programme
Increased declines in enrolments and further channel disruption in US higher education courseware
Failure to accelerate our shift to digital while successfully investing and delivering market leading global products and services
Online Program Management fails to generate expected revenue growth
US assessment revenues fail to stabilise
Other strategic priorities, including Online Blended Learning and Professional Certification, do not achieve modest growth amid global economic uncertainty and local market pressures.
The Board also stress-tested the impact on our liquidity of all the principal risks occurring together. Although this is not regarded as a plausible scenario, the test showed that the company would still have liquid resources subject to a limited number of management actions.
The Board’s confirmation of Pearson’s viability for the three years to 2020, based on this assessment, is included alongside the going concern statement on p106.
Competition lawFailure to comply with anti-trust and competition legislation could result in costly legal proceedings and/or adversely impact our reputation.
Increase in probability
Existing controls
Global policy published
Training and guidance
Regular internal communications
Lawyer network
Outcome of 2017 activities
This risk increased during 2017, reflecting our participation in industry associations, including Board membership, as well as the recent activity of associations being challenged by anti-trust authorities such as in Spain.
A global policy, general training and guidance were launched in 2017 and contain all the measures, indicators and actions required to ensure anti-trust and competition compliance.
A lawyer network was launched in 2017 and training has taken place to improve their expertise around competition/anti-trust laws. An increasing number of employees have also been trained. All employees will need to be certified.
2018 outlook and plans
Training, including e-learning modules, is being further expanded in 2018 with metrics being developed to track engagement. The lawyer network is contributing more data to feed into training and risk assessment indicators.
Legal & compliance15
Principal risks and uncertainties
Pearson plc Annual report and accounts 201760

6161Section 4 Governance 61Section 4 Governance
Governance report
Governance overview62 Chairman’s letter
Leadership & effectiveness
64 Board of Directors66 Board governance and activities74 Nomination & Governance
Committee report
Accountability76 Audit Committee report84 Risk governance and control
Engagement86 Reputation & Responsibility
Committee report88 Stakeholder engagement
Remuneration90 Remuneration overview94 Our Executive remuneration framework96 2017 remuneration report
Additional disclosures106 Report of the Directors110 Statement of Directors’ responsibilities
In this section

62 Pearson plc Annual report and accounts 2017
Governance overview
Dear shareholders,
As I said last year, during times of change, good governance is paramount. As a Board we continue to organise our work around five major themes where we believe we can add value: governance and risk, strategy, performance, leadership and people, and shareholder engagement. A summary of the key items covered by the Board throughout the year appears on p68, and I have set out below further detail on our particular areas of focus during 2017.
Looking back on 2017, the Board is satisfied that external and internal expectations regarding performance have been met and that the company has achieved operational stability. We have been very focused throughout the year on the simplification of our portfolio and investment in our transformation programmes, including The Enabling Programme (TEP) and the Global Learning Platform (GLP). We are now in a position where, in addition to regularly monitoring performance and simplification, the Board can begin to pivot its attentions towards longer-term strategic opportunities through structural growth, digital transformation and in the lifelong learning sector.
Leadership & effectiveness See full section on p64–75
In my letter to shareholders at this time last year, I set out a number of priorities for the Board during 2017. I am pleased to report that good progress has been made on all fronts, summarised below, and with further detail given throughout this report:
monitor the company’s strategic and tactical actions related to the refocusing of the business – the Board monitors financial and operational performance through a streamlined and effective dashboard, which is provided to the Directors on a monthly basis, enabling us to spend more time on strategic discussions during Board meetings
implement previously signposted portfolio decisions – in 2016 we indicated that we intended to reduce our exposure to large-scale direct delivery businesses to focus on more scalable online, virtual, and blended services. In line with this strategy, we completed the sale of our English test preparation business in China, Global Education (GEDU), in August 2017. We also announced the sale of our English language learning business, Wall Street English (WSE), which is expected to complete in the first half of 2018. In addition, we indicated in early 2017 our intention to exit from our stake in Penguin Random House. Following negotiations with our partner in Penguin Random House, Bertelsmann, we agreed to divest a 22% stake in Penguin Random House, retaining an interest of 25%, and to recapitalise that business
significantly drive down our cost structure – we announced in 2017 our plans to reduce Pearson’s cost base by a further £300m exiting 2019. We are on track to deliver the planned savings, many of which will come through simplification of our technology architecture allowing the increased use of shared service centres enabling us to standardise processes and reduce headcount. This will facilitate further opportunities such as the greater centralisation of procurement and the reduction in the number of our office locations
reduce the dividend – in 2017, we took the decision to rebase our dividend policy to reflect portfolio changes, the challenging market environment, the pace of investment required to transform the
Sidney Taurel Chairman
UK Corporate Governance Code
This year, we are reporting against the 2016 edition of the UK Corporate Governance Code (the Code). The Board believes that during 2017 the company was in full compliance with all relevant provisions of the Code. A detailed account of the provisions of the Code can be found on the FRC’s website at www.frc.org.uk and we encourage readers to view our compliance schedule on the company website at www.pearson.com/governance
In this Governance section
Leadership & effectiveness p64–75
Accountability p76–85
Engagement p86–89
Remuneration p90–105
Additional disclosures p106–110

6363Section 4 Governance
Overview
Our strategy in action
Our perform
anceG
overnanceFinancial statem
ents
Governance overview
business and the need to sustain a healthy balance sheet to ensure we have the financial flexibility to maintain a solid investment grade credit rating. Our policy reflects a sustainable and progressive dividend, comfortably covered by the earnings of our business and which can grow as our business expands into the opportunities in global education. For the 2017 financial year, we therefore propose to pay a total dividend of 17p per share – 5p per share at the interim, paid in September 2017, and 12p per share final dividend, subject to shareholder approval at the Annual General Meeting (AGM) in May 2018
effect an optimal capital allocation, particularly following the outcome of negotiations regarding our investment in Penguin Random House, to ensure long-term sustainability and to reward our shareholders. The proceeds from the sale of the Penguin Random House stake have been used as follows: we undertook a buyback programme to repurchase £300m of ordinary shares which completed on 16 February 2018; $306m was utilised to pay down debt in the form of an early redemption of a US dollar denominated bond; and the remainder reinvested to build a strong balance sheet.
In the coming year, our main focus is to pivot towards our longer-term growth opportunities by delivering on the three strategic priorities described in this report and to continue to monitor progress against our dashboard and key milestones for 2018.
The Board continued to work closely with the Executive team to ensure ongoing leadership development throughout the year. At an Executive level, we recruited a Chief Strategy Officer, Jonathan Chocqueel-Mangan, and a new Chief Human Resources Officer, Anna Vikström Persson, both of whom joined the team in early 2018. The Board looks forward to working closely with Jonathan and Anna, who each have a key role to play in shaping Pearson as we continue to transform the business, hone our strategy and ensure we are able to attract and develop the talent that will lead the business forward.
The Board evaluation for 2017 was facilitated externally – the first external evaluation during my tenure as Chairman. I am pleased to report that there was unanimous agreement by all Directors that the Board is operating effectively. In times of transformation and disruption within Pearson itself and the wider sector in which we operate, it is imperative to ensure that our long-term strategy is appropriate, with shorter-term tactical actions that support delivery of that strategy. One particular theme arising from our evaluation was that the Board will spend even more time considering long-term strategy and ensure we are aligned on process and deliverables. Our Chief Strategy Officer will play an important role in this work during 2018.
Building on our 2016 evaluation, the Board and management gave consideration to the areas where we could particularly leverage external expertise and advice, and as a result Pearson established a Digital Advisory Network of external experts who are partnering with us to help maximise the opportunity from digital disruption. Lincoln Wallen was instrumental in the creation of this network, which held its inaugural meeting late in 2017. We are also pleased that Michael Lynton has been appointed as a Non-Executive Director with effect from 1 February 2018. Michael’s experience leading businesses through times of digital disruption will further strengthen our capabilities in this area.
We recently announced that Harish Manwani, a Non-Executive Director of Pearson since 2013, is retiring from the Board at the forthcoming AGM, and will not be seeking re-election, in anticipation of his future commitments. The Board joins me in thanking Harish for his commitment and invaluable contribution to Pearson, and we wish him all the best in his future endeavours.
Accountability See full section on p76–85
As a Board, we are accountable for Pearson’s successes and addressing its challenges. We aim to communicate to you in a transparent manner the steps we have taken to ensure that we have a clear oversight of the business and the work we have undertaken in respect of Pearson’s strategy throughout the year. Our Audit Committee, led by Tim Score, plays a key role in monitoring and evaluating our risk management processes, providing independent oversight of our external audit and internal control programmes, accounting policies, business transformation projects, such as TEP and GLP, and in assisting the Board in reporting in a fair, balanced and understandable manner to our shareholders.
Engagement See full section on p86–89
The 2017 financial year has been one of significant engagement with our shareholders. I have enjoyed spending time throughout the year with many of you to ensure that we maintain an open, transparent dialogue, keep you updated on our strategy and receive your inputs. In common with most large, public companies, we have a wider range of stakeholders than just traditional investors, and our Reputation & Responsibility Committee has oversight of our sustainability and social impact initiatives, government and public affairs matters, and engagement with the education community. Board members also engage with the wider stakeholder population, including employees, customers and partners, both through formal Board events and by way of individual contributions to internal and external initiatives.
Remuneration See full section on p90–105
Since our last AGM in May 2017, Elizabeth Corley, who chairs our Remuneration Committee, has led our work to engage with investors in connection with Pearson’s remuneration policy and to listen to their concerns. It is clear that shareholders and other stakeholders would like our approach to remuneration to be simple, transparent, closely linked to our strategy and the company’s performance. We have worked hard to develop an approach that the majority of our shareholders can support. Our approach is explained in more detail in the remuneration section of this report on p90–105.
Conclusion
I hope this report clearly sets out how your company is run, and how we align governance and our Board agenda with the strategic direction of Pearson. We always welcome questions or comments from shareholders, either via our website (www.pearson.com) or in person at our AGM.
Sidney Taurel Chairman

64 Pearson plc Annual report and accounts 2017
Board of Directors
Chairman
Pearson Board members bring a wide range of experience, skills and backgrounds which complement our strategy.
Linda Lorimer Non-Executive Director aged 65, appointed 1 July 2013
Linda spent almost 40 years serving higher education. She retired from Yale in spring 2016 after 34 years at the university where she served in an array of senior positions including vice president for Global & Strategic Initiatives. She oversaw the development of Yale’s burgeoning online education division and the expansion of Yale international programmes and centres. During her tenure, she was responsible for many administrative services, ranging from Yale’s public communications and alumni relations to sustainability, human resources and the university press. Previously, Linda was president of Randolph-Macon Woman’s College and chair of the board of the Association of American Colleges and Universities. She also served on the boards of several public companies, including as presiding director of the McGraw-Hill companies. She is a member of the Trilateral Commission and the Council on Foreign Relations.
John Fallon Chief Executive aged 55, appointed 3 October 2012
John became Pearson’s Chief Executive on 1 January 2013. Since 2008, he had been responsible for the company’s education businesses outside North America and a member of the Pearson management committee. He joined Pearson in 1997 as Director of Communications and was appointed President of Pearson Inc. in 2000. In 2003 he was appointed CEO of Pearson’s educational publishing businesses for Europe, Middle East & Africa. Prior to joining Pearson, John was director of corporate affairs at Powergen plc and was also a member of the company’s executive committee. Earlier in his career, John held senior public policy and communications roles in UK local government. He is an advisory board member of the Global Business Coalition for Education, a member of the Council of the University of Hull, and trustee and director of the Oracle Cancer Trust.
Sidney Taurel Chairman aged 69, appointed 1 January 2016
Sidney has over 45 years of experience in business and finance, and is currently a board director and chairman of the compensation committee at IBM Corporation. Sidney is an advisory board member at pharmaceutical firm Almirall. He was chief executive officer of global pharmaceutical firm Eli Lilly and Company from 1998 until 2008, chairman from 1999 until 2008, and has been chairman emeritus since 2009. He was also a director at McGraw Hill Financial, Inc., a role which he held from 1996 until April 2016, and at ITT Industries from 1996 to 2001. Sidney has received three US presidential appointments to: the Homeland Security Advisory Council, the President’s Export Council and the Advisory Committee for Trade Policy and Negotiations, and is an officer of the French Legion of Honour.
Non-Executive Directors
Harish Manwani Non-Executive Director aged 64, appointed 1 October 2013
Harish has an extensive background in emerging markets and senior experience in a successful global organisation. He was previously chief operating officer of consumer products company Unilever, having joined the company in 1976 as a marketing management trainee in India, and held senior management roles around the world, including North America, Latin America, Europe, Africa and Asia. He is non-executive chairman of Hindustan Unilever Limited in India, and serves on the boards of Whirlpool Corporation, Qualcomm Inc. and Nielsen Holdings. He is also on the board of the Indian School of Business and the Economic Development Board (EDB) of Singapore, and is global executive advisor at Blackstone Private Equity.
Executive Directors
Coram Williams Chief Financial Officer aged 44, appointed 1 August 2015
Coram joined Pearson in 2003 and has held a number of senior positions including Finance and Operations Director for Pearson’s English Language Teaching business in Europe, Middle East & Africa, Interim President of Pearson Education Italia and Head of Financial Planning and Analysis for Pearson. In 2008, Coram became CFO of The Penguin Group and was latterly appointed CFO of Penguin Random House in 2013, where he oversaw the integration of the two businesses. Coram trained at Arthur Andersen, and subsequently worked in both the auditing and consulting practices of the firm. He is a non-executive director and chairman of the audit committee for the Guardian Media Group.
Digital/technology experience
56%
International markets experience
89%
Education/learning experience
33%
Sustainable business practice experience
67%
Executive experience of Chairman and Non-Executive Directors
Key to Committees A Audit N Nomination & Governance RR Reputation & Responsibility R Remuneration Committee chair
A N
N
RRRR
R

6565Section 4 Governance/Leadership & effectiveness
Elizabeth Corley, CBE Non-Executive Director aged 61, appointed 1 May 2014
Elizabeth was CEO of Allianz Global Investors, initially for Europe then globally, from 2005 to 2016, and continues to act as a senior adviser to the firm as vice-chair. She was previously at Merrill Lynch Investment Managers and Coopers & Lybrand. In addition to Pearson, Elizabeth serves on two other company boards as a non-executive director – BAE Systems plc and Morgan Stanley. She has various financial services industry roles including as a member of the FICC Markets Standards Board, the ESMA stakeholder group and the TheCityUK Advisory Council. Additionally she is a member of the Committee of 200 and a trustee of the British Museum. Elizabeth currently chairs a group advising the UK government on social impact investing. She is also a crime fiction author.
Vivienne Cox, CBE Senior Independent Director aged 58, appointed 1 January 2012
Vivienne has wide experience in energy, natural resources and business innovation. She worked for BP plc for 28 years in global roles including executive vice president and chief executive of BP’s gas, power and renewables business and its alternative energy unit. She is non-executive director of Stena International and chairman of the supervisory board of Vallourec, a leader in the seamless steel pipe markets. She is also non-executive director at pharmaceutical company GlaxoSmithKline plc and an advisory board member of the African Leadership Institute.
Tim Score Non-Executive Director aged 57, appointed 1 January 2015
Tim has extensive experience of the technology sector in both developed and emerging markets, having served as chief financial officer of ARM Holdings plc, the world’s leading semiconductor IP company, for 13 years. He is an experienced non-executive director and currently sits on the boards of The British Land Company plc and HM Treasury, in addition to being on the board of trustees of the Royal National Theatre and chairman of the group audit committee of the Football Association. He served on the board of National Express Group plc from 2005 to 2014, including time as interim chairman and six years as the senior independent director. Earlier in his career Tim held senior finance roles with Rebus Group, William Baird, LucasVarity plc and BTR plc.
Josh Lewis Non-Executive Director aged 55, appointed 1 March 2011
Josh’s experience spans finance, education and the development of digital enterprises. He is the founder of Salmon River Capital LLC, a New York-based private equity/venture capital firm focused on technology-enabled businesses in education, financial services and other sectors. Over a 25-year career in active, principal investing, he has been involved in a broad range of successful companies, including several pioneering enterprises in the education sector. In addition, he has long been active in the non-profit education sector, with associations including New Leaders, New Classrooms and the Bill & Melinda Gates Foundation. He is also a non-executive director of several enterprises in the fin-tech/data, education and other sectors.
Lincoln Wallen Non-Executive Director aged 57, appointed 1 January 2016
Lincoln has extensive experience in the technology and media industries, having been CEO of DWA Nova, a software-as-a-service company spun out of DreamWorks Animation Studios in Los Angeles, a position he held until 2017. He worked at DreamWorks Animation for nine years in a variety of leadership roles including chief technology officer and head of animation technology. He was formerly CTO at Electronic Arts Mobile, leading EA’s entry into the mobile gaming business internationally. He is currently a visiting associate in Computing and Mathematical Sciences at the California Institute of Technology (Caltech). Lincoln is also a non-executive director of the Smith Institute for Industrial Mathematics and Systems Engineering. Lincoln’s early career involved 20 years of professional IT and mathematics research, including as a reader in Computer Science at Oxford.
Michael Lynton Non-Executive Director aged 58, appointed 1 February 2018
Michael served as CEO of Sony Entertainment from 2012 until 2017, overseeing Sony’s global entertainment businesses. He also served as chairman and CEO of Sony Pictures Entertainment from 2004. Prior to this, he held senior roles within Time Warner and AOL, and earlier served as chairman and CEO of Penguin Group where he extended the Penguin brand to music and the internet. Michael is chairman of Snap, Inc., and currently serves on the boards of Pandora Media Inc., IEX and Ares Management, L.P. He is also a member on the Council on Foreign Relations, the Harvard Board of Overseers and serves on the boards of the Los Angeles County Museum of Art, the Tate and the Rand Corporation. Michael holds a B.A. in History and Literature from Harvard College, where he also received his M.B.A.
Non-Executive Directors
AA
N RR
R
AA N
NN
RR
R
R
Board of Directors

66 Pearson plc Annual report and accounts 2017
Board governance and activities
Board of Directors
Composition of the Board As at the date of this report, the Board consists of the Chairman, Sidney Taurel, two Executive Directors: the Chief Executive, John Fallon, and Chief Financial Officer, Coram Williams, and eight independent Non-Executive Directors. As previously disclosed, Harish Manwani will step down from the Board at the forthcoming AGM.
Chairman and Chief Executive There is a defined split of responsibilities between the Chairman and the Chief Executive. The roles and responsibilities of the Chairman and Chief Executive are clearly defined, set out in writing and reviewed and agreed by the Board on an annual basis.
Chairman’s significant commitments On 1 January 2017, Mr Taurel stepped down from his role as a senior adviser at the global investment bank, Moelis & Co, and on 30 November 2017 he stepped down from his role on the advisory Board of Takeda Pharmaceutical.
Roles and composition of the Board
Role Name Responsibility
Chairman Sidney Taurel The Chairman is primarily responsible for the leadership of the Board and ensuring its effectiveness. He ensures the Board upholds and promotes the highest standards of corporate governance, setting the Board’s agenda and encouraging open, constructive debate of all agenda items for effective decision-making. He regularly meets the Chief Executive to stay informed. He also ensures that shareholders’ views are communicated to the Board.
Chief Executive
John Fallon The Chief Executive is responsible for the operational management of the business and for the development and implementation of the company’s strategy as agreed by the Board and management. He is responsible for developing operational proposals and policies for approval by the Board, and promotes Pearson’s culture and standards.
Chief Financial Officer
Coram Williams The Chief Financial Officer is responsible for the preparation and integrity of Pearson’s financial reporting and statements and also oversees other functional areas including tax, treasury, internal audit and corporate finance. He supports the Chief Executive in developing and implementing the strategy of the company as agreed by the Board and management.
Senior Independent Director
Vivienne Cox The Senior Independent Director’s role includes meeting regularly with the Chairman and Chief Executive to discuss specific issues, as well as being available to shareholders generally should they have concerns that have not been addressed through the normal channels. She also leads the evaluation of the Chairman on behalf of the other Directors.
Committee Chairmen
Elizabeth Corley Vivienne Cox Linda Lorimer Tim Score
The Committee Chairmen are responsible for leading the Board committees and ensuring their effectiveness. They set the Committees’ agendas, in consultation with the company’s management, and report to the Board on Committee proceedings. They lead on engagement with shareholders regarding matters within the remit of the Committees, alongside senior management.
Non-Executive Directors
Elizabeth Corley Vivienne Cox Josh Lewis Linda Lorimer Michael Lynton Harish Manwani Tim Score Lincoln Wallen
The Non-Executive Directors contribute to the development of our strategy and scrutinise and constructively challenge the performance of management in the execution of strategy and risk planning. They also engage with various stakeholders of the company and provide guidance and independent perspective to management.
Company Secretary
Stephen Jones The Company Secretary acts as secretary to the Board and its committees, ensuring compliance with Board procedures and advising on governance matters. He is responsible, under the direction of the Chairman, for ensuring the Board receives accurate, timely and clear information. The Company Secretary supports the Chairman in delivery of the corporate governance agenda and organises Director inductions and ongoing training.
Nationality of Directors
Gender split of Board
Length of tenure of Non-Executive Directors
Ethnicity
British 6USA 4Singapore 1
Men 8Women 3
Under 3 years 23 to 6 years 4Over 6 years 2
Asian 1Mixed 1White 9
Asian – Indian (1)Mixed – White & Black Caribbean (1)White – English/Welsh/Scottish/Northern Irish/British (6)White – Any other White Background (3)

6767
Governance at Pearson
Board of Directors
Board Committees
Pearson Executive management (PEM)
Audit Committee
Nomination & Governance Committee
Remuneration Committee
Reputation & Responsibility Committee
Chief Executive
Chief Financial Officer
Chief Technology and Operations Officer
Chief Corporate Affairs and Global Marketing Officer
Chief Human Resources Officer
Chief Strategy Officer
General Counsel and Chief Legal Officer
President, Core markets
President, Growth markets
President, North America
President, Assessments
President, Global Product
FLO
W O
F IN
FOR
MA
TIO
N
Section 4 Governance/Leadership & effectiveness
Appraises our financial management and reporting and assesses the integrity
of our accounting procedures and financial control.
Reviews corporate governance matters, including Code compliance and Board
evaluation, considers the appointment of new Directors, Board experience and diversity,
and reviews Board induction and succession plans.
Determines the remuneration and benefits of the Executive
Directors and oversees remuneration arrangements
for the Pearson Executive.
Considers the company’s impact on society and the communities
in which Pearson operates, including to ensure strategies
are in place to manage and improve Pearson’s reputation.
PEM consists of John Fallon (Chief Executive) and his direct reports. They are the leadership group for Pearson, responsible for delivering Pearson’s strategy under clearly defined accountabilities
and in line with agreed governance and processes.
There were no other changes to the Chairman’s significant commitments during 2017.
Independence of Chairman In accordance with the Code, Sidney Taurel was considered to be independent upon his appointment as Chairman on 1 January 2016.
Independence of Directors All of the Non-Executive Directors who served during 2017 were considered by the Board to be independent for the purposes of the Code. The Board reviews the independence of each of the Non-Executive Directors annually. This includes reviewing their external appointments and any potential conflicts of interest as well as assessing their individual circumstances in order to ensure that there are no relationships or matters likely to affect their judgement. In addition to this review, each of the Non-Executive Directors is asked annually to complete an independence questionnaire to satisfy requirements arising from Pearson’s US listing.
Josh Lewis and Vivienne Cox have served on the Board for more than six years. Accordingly, their performance has been subject
to a rigorous review, including with regard to their independence. The Board has determined that Josh Lewis and Vivienne Cox continue to be independent, nothwithstanding their length of service, taking into account their valuable contribution to Board discussions and constructive challenge of management.
Conflicts of interest Under the Companies Act 2006 (the Act), Directors have a statutory duty to avoid conflicts of interest with the company. The company’s Articles of Association (Articles) allow the Directors to authorise conflicts of interest. The company has established a procedure to identify actual and potential conflicts of interest, including all directorships or other appointments to, or relationships with, companies which are not part of the Pearson Group and which could give rise to actual or potential conflicts of interest. Once notified to the Chairman or Company Secretary, such potential conflicts are considered for authorisation by the Board at its next scheduled meeting. The relevant Director cannot vote on an authorisation resolution, or be counted in the quorum, in relation to the resolution relating to his/her conflict or potential conflict. The Board reviews any authorisations granted on an annual basis.
Board governance and activities

68 Pearson plc Annual report and accounts 2017
Board governance and activities
Board meetings
The Board had seven formal meetings in 2017, with discussions and debates focused on the key strategic issues facing the company. This included two meetings each of three days’ duration in São Paulo, Brazil and Boston, USA at which the Board considered growth markets and strategy. Major items covered by the Board in 2017 are shown in the table below.
In addition to the formal meetings, the Board meets as necessary to consider matters of a time-sensitive nature.
São Paulo, Brazil
At a three-day meeting at São Paulo in June, the Board and Pearson Executive focused primarily on the Pearson business in Brazil, while also taking a wider look at our Growth geographic markets, including time focusing on India and South Africa. They engaged with the Brazilian leadership team and wider employee population throughout the visit, and spent time gaining an insight into the macro-economic environment in Brazil.
The Board participated in demonstrations for three products in the learning and assessment sectors. In two groups, the Board and Executive then visited schools where they met students and teachers, considered the school culture and classroom innovations, and discussed the students’ perspectives on the value of learning.
Boston, USA
The Board and the Pearson Executive visited Boston in October for a three-day meeting where they were joined by members of the North American senior management team to consider leadership, culture and the change agenda in Pearson North America. The Board also spent time considering Pearson’s vision and strategy, including a financial overview and consideration of synergies and our product investment portfolio, US higher education courseware and key strategic initiatives and opportunities, before taking some time to review organisational health.
The Board and Executive participated in a range of engagement opportunities with a variety of Pearson stakeholders, including an event on Employment in 2030 – The Future of Skills, and customer panel sessions. On the final day of the three-day meeting, the Board attended a facilitated breakfast meeting with top talent and new employees and gained insight into employees’ views on Pearson’s current challenges and opportunities. Read more about the Board’s engagement with these stakeholders on p89.
Board meeting focus during 2017
Area of responsibility Activity
Governance & risk
Training on Market Abuse Regulation
Compliance with UK Corporate Governance Code
Income statement and Going concern and viability
Shareholder activism and defence plan
Enterprise risk management review
Approval of division of responsibilities between Chairman and Chief Executive
Annual review of conflicts of interest
Pension scheme derisking
Approval of Committee terms of reference
Strategy Penguin Random House, WSE, GEDU and K-12 courseware – updates
Strategy meeting in São Paulo focusing on local Brazilian businesses and wider Growth strategy
Efficiency and simplification initiatives
US higher education courseware
Interactive product demonstrations
Communications strategy and positioning
Capital structure
Product, technology and operations strategies
Digital advisory network update
Operating and strategic plan updates
Tax update
Performance 2016 preliminary results and annual report and accounts
Interim results and trading updates
Monthly dashboard and milestone reports
2017 operating plan
Final and interim dividend proposals
Draft 2018 operating plan and 2017 and 2018 goals
Leadership & people
Chief Executive’s goals
Talent and succession planning
Organisational health including review of Pearson’s culture
Dinner with senior local management and facilitated breakfasts with key talent at overseas strategy meetings. Read more on employee engagement on p27.
Shareholders & engagement
Share buyback programme
Investor relations strategy and share price performance
Major shareholders and share register analysis
Shareholder issues and voting
Focus on forthcoming AGM

6969Section 4 Governance/Leadership & effectiveness
Board in action
US higher education courseware
Robin Baliszewski, Managing Director, Higher Education Sales, leads a panel of student ambassadors at the Board’s meeting in Boston
At the Board’s request, US higher education courseware was an area of focus at each Board meeting during 2017 as Pearson looked to respond to and proactively mitigate against challenges in that market sector. At each meeting, the Board was joined by the Presidents of North America and Global Product and by the Chief Technology and Operations Officer to review the market and associated financial model, changes in the trading environment, possible short- and longer-term implications of
those changes, and to consider and assess Pearson’s strategic response, including the impact of the new digital and print rental models on both customer and competitor activity and on the traditional sales channel.
At its October meeting in Boston, the Board viewed an early stage product demonstration of the Global Learning Platform which would initially be focused on the higher education portfolio. The Board also engaged with panels of students and faculty members in order to gain a greater insight into how Pearson’s higher education products and services are viewed by those that use them. Throughout the year, including between scheduled meetings, the Board also monitored progress through a monthly dashboard which enabled them to track Pearson’s delivery of agreed strategic, performance and customer-focused metrics in the higher education courseware market.
Link to strategic priorities, See p14
Grow market share through digital transformation1
Structural growth opportunities
Pearson considers Online Program Management (OPM) and virtual schools to be among its biggest growth opportunities. During the year, the Board considered Pearson’s prospects in these areas, how to measure success, and what differentiates Pearson and provides real competitive advantage. The Board also considered what Pearson might look like in the medium term as these and other opportunities come to fruition, and the characteristics for these businesses in terms of revenues and profits. At its strategy meeting in October, the Board held a deep dive into each of these areas with the responsible Executives. In respect of OPM, the Board reviewed the global market opportunity, and considered how Pearson’s expertise in courseware and assessment could continue to support partners in the development and delivery of online programmes that deliver demonstrable learner outcomes and superior student learning experience. The Board discussed how to deliver that strategy, and considered management’s recommendations for next steps. Regular reporting to the Board of progress in this market has been introduced and OPM will be a particular item for the Board’s ongoing consideration in 2018.
Link to strategic priorities, See p16
Invest in structural growth markets2
Portfolio changes
Following the announcement of Pearson’s strategy of reducing exposure to large-scale direct delivery businesses, the Board had considered its portfolio for strategic alignment, and had determined that its English test preparation business in China, Global Education (GEDU), and English language learning business, Wall Street English (WSE), were no longer aligned with Pearson’s core strategy and accordingly that exits from these business would be explored. At a number of meetings during 2017, the Board considered input from the President, Growth markets, with responsibility for Pearson’s business in China, and from the SVP Corporate Finance & Strategic Development, both of whom provided updates as the negotiations proceeded and the transactions took shape. The Board considered the potential terms of the transactions, the status of interested parties, and in light of all relevant factors – including the impact of the potential divestments on Pearson, its shareholders and wider stakeholders – gave approval for the sales of GEDU and WSE businesses in line with agreed terms.
Link to strategic priorities, See p18
Become simpler and more efficient3
Board governance and activities

70 Pearson plc Annual report and accounts 2017
Board governance and activities
The role and business of the Board
The Board is deeply engaged in developing and measuring the company’s long-term strategy, performance and values. We believe that it adds a valuable and diverse set of external perspectives and that robust, open debate about significant business issues brings an additional discipline to major decisions.
A schedule of formal matters reserved for the Board’s decision and approval is available on our website, at www.pearson.com/governance.
The key responsibilities of the Board include:
Overall leadership of the company and setting the company’s values and standards
Determining the company’s strategy in consultation with management, reviewing performance against it and overseeing management execution thereof
Major changes to the company’s corporate, capital, management and control structures
Approval of all transactions or financial commitments in excess of the authority limits delegated to the Chief Executive and other Executive management.
The Board receives timely, regular and necessary financial, management and other information to fulfil its duties. Comprehensive meeting papers are circulated to the Board and committee members at least one week in advance of each meeting and the Board receives a monthly dashboard and key milestones report and regular updates from the Chief Executive and CFO. In addition to meeting papers, a library of current and historic corporate information is made available to Directors electronically to support the Board’s decision-making process. Directors can obtain independent professional advice, at the company’s expense, in the performance of their duties as Directors. All Directors have access to the advice and services of the Company Secretary.
Standing Committee
A Standing Committee of the Board is established to approve certain operational and ordinary course of business items such as banking matters, guarantees, intra-group transactions and to make routine approvals relating to employee share plans.
The Committee has written terms of reference, reviewed and approved each year, which clearly set out its authority and duties. These can be found on the company website at www.pearson.com/governance.
Culture and values
Pearson’s core values – to be brave, imaginative, decent and accountable – go to the heart of our mission to improve learning outcomes, and the Board and employees are committed to demonstrating these characteristics throughout their work and deliberations. The Board monitors the culture of the company and levels of employee engagement and advocacy with the assistance of its Reputation & Responsibility Committee and through regular updates from the Chief Human Resources Officer. It aims to foster a culture of collaboration, diversity and inclusion at all levels, including by engaging with employees from across Pearson at various events throughout the year. Pearson’s Code of Conduct outlines how we work to our mission and values in an ethical and responsible manner.
Board attendance
Directors are expected to attend all Board and committee meetings but in certain exceptional circumstances, such as due to pre-existing business or personal commitments, Directors may be unable to attend. In these circumstances, Directors receive relevant papers and, where possible, will communicate any comments and observations in advance of the meeting for raising as appropriate during the meeting. They are updated on any developments after the meeting by the Chairman of the Board or committee, as appropriate. Individuals’ attendance at Board and committee meetings is considered, as necessary, as part of the formal annual review of their performance. There was a high level of attendance by Directors at Board and committee meetings in 2017.
The following table sets out the attendance of the company’s Directors at scheduled Board meetings during 2017:
Board meetings attended
Chairman
Sidney Taurel 7/7
Executive Directors
John Fallon 7/7
Coram Williams 7/7
Non-Executive Directors
Elizabeth Corley 7/7
Vivienne Cox 7/7
Josh Lewis 7/7
Linda Lorimer 7/7
Harish Manwani 7/7
Tim Score1 6/7
Lincoln Wallen 7/7
1 Unable to attend one meeting due to pre-existing commitment. Ahead of the meeting, Mr Score communicated his comments on the business of the Board to the Chairman.

7171Section 4 Governance/Leadership & effectiveness
Succession planning
The Board considers oversight of succession planning as one of its prime responsibilities, assisted by the Nomination & Governance Committee. As well as Board and Executive management succession, the Board oversees the process for all key positions throughout the business with a particular focus on high potential talent.
The company has formal contingency plans in place for the temporary absence of the Chief Executive for health or other reasons. The matter of Chief Executive succession is a standing item for discussion and review by the Chairman and the Board annually. Succession planning for the Board and Chairman is also considered annually by the full Board and on an ongoing basis by the Nomination & Governance Committee. There is also discussion and oversight of key positions at Executive management level, including the recent appointments of Jonathan Chocqueel-Mangan as Chief Strategy Officer and Anna Vikström Persson as Chief Human Resources Officer.
Directors’ training and induction
All Directors receive training in the form of presentations about the company’s operations, through Board meetings held at operational locations and by encouraging the Directors to visit local facilities and management as and when their schedule allows, including if they are travelling to a country or region on non-Pearson business. The Company Secretary and General Counsel, in conjunction with Pearson’s advisers, monitor legal and governance developments and update the Board on such matters as agreed with the Chairman. In 2017, the Directors and other senior managers were briefed on:
The EU Market Abuse Regulation, including the impact of regulatory guidance introduced during the year
The latest regulatory framework, corporate governance reporting and Directors’ remuneration report as part of a training session led by PwC
Regular market updates for the Remuneration Committee on industry practice and regulation received from external advisers.
Our Directors can also make use of external courses.
Directors receive a significant bespoke induction programme and a range of information about Pearson when they join the Board. This includes background information on Pearson and details of Board procedures, Directors’ responsibilities and various governance-related issues, including procedures for dealing in Pearson shares and their legal obligations as Directors. The induction also typically includes a series of meetings with members of the Board, external legal advisers and brokers, the Pearson Executive and senior management, presentations regarding the business from Senior Executives and a briefing on Pearson’s investor relations programme.
The induction programme for Michael Lynton, our most recently appointed Non-Executive Director, will take place in 2018. The initial phase will include meetings with other Board members, business area familiarisation with members of the Pearson Executive, a briefing on Directors’ duties and sessions with the SVP Internal Audit, Compliance and Risk and SVP Investor Relations, with the remainder of the induction tailored to Michael’s particular areas of interest and aligned with the Board’s focus areas.
Directors’ indemnities
A qualifying third-party indemnity (QTPI), as permitted by the Articles and sections 232 and 234 of the Act, has been granted by the company to each of its Directors. Under the provisions of the QTPI, the company undertakes to indemnify each Director against liability to third-parties (excluding criminal and regulatory penalties) and to pay Directors’ costs as incurred, provided that they are reimbursed to the company if the Director is found guilty, the court refuses to grant the relief sought or, in an action brought by the company, judgment is given against the Director. The indemnity has been in force for the financial year ended 31 December 2017 and is currently in force.
The company has purchased and maintains Directors’ and Officers’ insurance cover against certain legal liabilities and costs for claims in connection with any act or omission by such Directors and Officers in the execution of their duties.
Board Committees
The Board has established four formal Committees: Audit, Nomination & Governance, Remuneration, and Reputation & Responsibility. The chairmen and members of these committees are appointed by the Board on the recommendation (where appropriate) of the Nomination & Governance Committee and in consultation with each relevant committee chairman. In addition to these formal Board Committees, the Standing Committee also operates with Board-level input.
Learn more about Pearson’s governance structure on p67
More Committee information:
Audit Committee p76
Nomination & Governance Committee p74
Remuneration Committee p90
Reputation & Responsibility Committee p86
Standing Committee p70
The Committees focus on their own areas of expertise, enabling the Board meetings to focus on governance and risk, strategy, performance, and leadership and people, thereby making the best use of the Board’s time together as a whole. The Committee chairmen report to the full Board at each Board meeting immediately following their sessions, ensuring a good communication flow while retaining the ability to escalate items to the full Board’s agenda if appropriate.
Board governance and activities

72 Pearson plc Annual report and accounts 2017
Progress on findings of 2016 evaluation
Finding Response/Action taken
Continue to focus on US higher education courseware at every meeting, and build additional measures into the monthly dashboard to monitor this business.
US higher education courseware is a standing item at each Board meeting, with the responsible Executives providing updates on progress and initiatives. The regular monthly dashboard has been refined and provides more detail on US higher education courseware. The dashboard is kept under review and evolves as necessary with business and Board requirements.
Drive to increase use of external expertise in digital technologies.
Building on a scoping session involving Directors and members of the Pearson Executive, we launched a digital advisory network in 2017 to bring together a diverse cross-section of people with experience and knowledge of digital disruption. Learn more about the digital advisory network on p88.
Experience identified as valuable in new Board members, including digital transformation and disruption.
An agreed candidate specification was drawn up for any potential new Non-Executive Director appointments, resulting in the appointment of Michael Lynton.
Agree most appropriate format and scheduling for Non-Executive and Chairman only sessions
These sessions are a standing item at each Board, Audit Committee and Remuneration Committee meeting, to enable open discussion of issues and ensure the Board or committee continues to work effectively as a group. The Chairman also held a number of Non-Executive Director dinners in 2017.
Desire to build a compelling narrative about the role for Pearson in the future of learning.
Building on research with teachers and learners, a set of insights-driven communications principles and practices has been developed about who we are, what we do, and what that means for our customers.
Creation of a strategic framework to guide disposals.
This was discussed and agreed by the Board at a strategy session in late 2016 and the framework implemented in 2017.
Increase visibility of ROIC-style metrics in each part of portfolio.
Additional ROIC-style measures were introduced into the Board’s reporting during 2017, and both gross and net ROIC were reported publicly in our 2017 full year results.
Continued focus on retention of key talent, both at senior levels and throughout organisation.
Key talent and ‘regretted leavers’ report considered regularly by Remuneration Committee. A ‘managers’ toolkit’ has also been developed to encourage and enable retention of key employees.
Board evaluation
The Board evaluation for 2017 was an externally facilitated process led by Heidrick & Struggles JCA Group, which was selected following a review by the Nomination & Governance Committee of various providers and consideration of the potential scope of the evaluation. In addition to facilitating the Board evaluation, Heidrick & Struggles JCA Group was also engaged by Pearson in relation to Non-Executive Director and Senior Executive search activity during the year.
In reporting back to the Board, the evaluator reported that conversations with Board members were positive, with unanimous agreement that the Board operates effectively. The evaluator noted that the Board had acknowledged the management team’s commitment which has put the business in a much more positive position at the end of the year than it was at the beginning of the year. This was the first external evaluation since the appointment of Sidney Taurel as Chairman, and it was noted by the other Board members that he had created a different and positive dynamic, with his leadership style and experience. The evaluator reported that the relationship between the Executive and Non-Executive Directors remains positive, with the additions of Coram Williams and Lincoln Wallen to the Board further complementing that dynamic. The evaluator noted that the Board was particularly appreciative of Elizabeth Corley’s commitment throughout 2017 in her engagement with investors in respect of remuneration matters.
More detail on the evaluation process and the priorities arising from it is given opposite, and the Nomination & Governance Committee will consider Heidrick & Struggles JCA Group’s findings and recommendations in greater detail throughout 2018.
A number of actions were taken during 2017 in response to findings arising from the 2016 Board evaluation process. You can read more about progress on these in the table below.
Individual evaluation
In addition to the evaluation of the Board as a whole, Executives are evaluated each year on their performance against personal objectives under the company’s annual incentive plan. These objectives are linked to certain strategic metrics, including efficiency and cost savings initiatives, driving the digital agenda, and growing market share in US higher education courseware. Progress against each of these metrics is reviewed by the Board on a monthly basis, as part of the dashboard of KPIs which we believe to be central to Pearson’s turnaround.
The Chairman meets with each Non-Executive Director individually on a regular basis and, in assessing the contribution of each, has confirmed that each Director continues to make a significant contribution to the business and deliberations of the Board. The Non-Executive Directors, led by the Senior Independent Director, also conduct an annual review of the Chairman’s performance.
Committee evaluation
All committees undertake an annual evaluation process to review their performance and effectiveness. For 2017, the process was facilitated externally by Heidrick & Struggles JCA Group as part of the Board evaluation. The Committees were considered to be working effectively, led well by their respective chairmen with appropriate agendas and a strong work ethic from each committee member. Read more on this in the pages that follow.
Board governance and activities

7373
External Board evaluation process 2017
Following discussions with the Chairman, Senior Independent Director and Chief Executive, Heidrick & Struggles JCA Group (the evaluator) prepared a framework for discussion, as set out below, which formed the basis for all one-on-one meetings.
The evaluator met individually with each of the Directors and the Company Secretary for an open, confidential, unattributed conversation using the framework for discussion as a prompt on proposed topics. The discussion was not limited to these topics if participants wanted to raise additional subjects.
The evaluator submitted a draft report to the Chairman and Senior Independent Director. This was followed by a discussion of the findings and a number of recommendations arising therefrom.
The evaluator facilitated an open discussion with the Board in December 2017 on the findings of the evaluation process.
For the purposes of good governance, the evaluator spoke with another Independent Non-Executive Director following the Board meeting to confirm all information provided was a fair reflection of the feedback from each of the Directors, and was not influenced inappropriately by any Director.
Discussion framework
A framework for an open discussion with Directors
Key themes arising from the evaluation
The Board and Committees work effectively, led well by their respective chairs, with a clear and significant personal commitment to Pearson demonstrated by all Board members
The Non-Executive Directors recognised the inclusive and thoughtful approach of the Executive Directors in ensuring transparent communication between the Board and the Executive
Effective processes and monthly reporting have helped the Board ensure the company achieves and maintains operational control and stability
The Board members appreciate the sequencing of meetings, including overseas meetings, which afford them the opportunity to engage with the wider senior management team and to meet employees, customers and other stakeholders
Board succession planning should consider future committee chairs, and other desirable expertise in new Board members
Ensure ongoing strategic development aligned with business transformation activity. New Chief Strategy Officer to facilitate, enabling all Board members’ strategic perspectives to be captured and considered
Ongoing Board education to continue to focus on competitive landscape and digital technologies
A desire for additional informal joint Board and Executive sessions to permit open dialogue and discussion in a less structured format
Ensure continued understanding by the Board of significant shareholders’ views to encourage constructive dialogue and clear communication of strategy
New Chief Human Resources Officer to continue executive succession planning and complete a talent review aligned to the strategic needs of the business.
Preparation
Chairman and roles
Risk management
Organisation
Communications
Dynamics
Succession management and
planning
Strategy
Committees
Performance
Composition
One-on-one meetings Feedback to the Chairman and Senior Independent Director
Feedback to the Board Final review with another Independent Director
Section 4 Governance/Leadership & effectiveness
Board governance and activities

74 Pearson plc Annual report and accounts 2017
Nomination & Governance Committee report
Role and business of the Committee
The Committee monitors the composition and balance of the Board and of its Committees, identifying and recommending to the Board the appointment of new Directors and/or Committee members. The Committee also oversees talent and succession plans for senior roles.
As the remit of the Committee expanded in 2017, the Committee now also oversees the company’s compliance with, and approach to, all applicable regulation and guidance related to corporate governance matters, including Board diversity, oversight of the annual Board evaluation processes, the company’s corporate governance policies and practices, compliance with the Code, and oversight of Director induction and training. In respect of its governance remit, the Committee primarily has the role of reviewing current practices on behalf of the Board, and recommending actions or changes for the Board’s formal approval.
The Committee is comprised of five independent Non-Executive Directors and the Chairman of the Board. The Chief Executive and other senior management attend Committee meetings by invitation.
Appointment of Michael Lynton
During the 2016 Board evaluation process, the Board considered the experience it would require in its next Non-Executive Director. Accordingly, the Committee met in early 2017 and agreed the specific skills and experience required in potential candidates, which included: a current or former CEO of a mid-to-large sized company; experience in an industry which has undergone digital disruption; and global experience, including of the US market. Other desired experience included marketing or branding and experience in the service sector. Pearson also expects all Non-Executives to demonstrate the highest level of integrity and credibility, independence of judgement, maturity, collegiality, a high interest in education and the commitment to devote the necessary time. Based on these criteria, candidates were then shortlisted for the proposed role at the Committee’s next meeting and were interviewed by Heidrick & Struggles JCA Group and then the Committee. As a result of this process, the Committee was satisfied that Michael Lynton met the required skills and experience and also possessed the personal attributes that we would expect to see in any Pearson Non-Executive Director.
Diversity
The Board embraces the Code’s underlying principles with regard to Board balance and diversity, including in respect of ethnicity, gender and age. In May 2017, the Committee adopted the Board diversity and inclusion policy. The objectives set out in the policy and our progress towards these objectives are shown in the table opposite. The Committee ensures that the Directors of Pearson demonstrate a broad balance of skills, background and experience, and nationalities, to support Pearson’s strategic development and reflect the global nature of our business. The Committee also ensures that appointments are made on merit and relevant experience, while taking into account the broadest definition of diversity.
As at 31 December 2017, the gender diversity of the Board, exceeded Lord Davies’ 2015 target with 30% female representation on the Board. However, as noted in the Board diversity and inclusion policy, we are committed to work towards the recommendations
Committee Chairman Vivienne Cox
Members Elizabeth Corley, Vivienne Cox, Josh Lewis, Harish Manwani, Tim Score and Sidney Taurel
Board search
Pearson uses a number of leading firms in its Board search activities and ensures that we retain good relationships with them. During 2017, the services of Heidrick & Struggles JCA Group were availed for the appointment of Michael Lynton, Non-Executive Director, who joined the Board on 1 February 2018. During 2017, Heidrick & Struggles JCA Group also led the externally facilitated evaluation of the Board and its Committees, and was engaged in Senior Executive search activity. Heidrick & Struggles JCA Group is a signatory to the voluntary code of conduct for executive search firms.
Committee responsibilities include:
AppointmentsIdentifying and nominating candidates for Board vacancies.
Balance Ensuring that the Board and its Committees have the appropriate balance of skills, experience, independence, diversity and knowledge to operate effectively.
Succession Reviewing the company’s leadership needs with a view to ensuring the continued ability of the organisation to compete in the marketplace.
Governance Review and oversight of Pearson’s corporate governance framework, Board evaluation and training plans, and Board diversity policy.
Terms of reference
The Committee has written terms of reference which clearly set out its authority and duties. These are reviewed annually and can be found on the company website www.pearson.com/governance
Attendance
Attendance by Directors at Nomination & Governance Committee meetings throughout 2017:
Meetings attended
Elizabeth Corley 3/3
Vivienne Cox 3/3
Josh Lewis 3/3
Harish Manwani 3/3
Tim Score 3/3
Sidney Taurel 3/3

7575
suggested by the Hampton-Alexander Review aimed at having at least 33% female representation on the Board by 2020.
Our Code of Conduct sets out our global standards and responsibilities with regard to diversity & inclusion (D&I) at all employee levels, including the Pearson Executive, and covers many aspects, including gender, age, disability and sexual orientation. This is underpinned by a global statement on D&I along with country and business specific policies. We are a founder member of the 30% Club and the Chief Executive has also signed a personal commitment to set an aspirational target of 30% women in Pearson’s senior management team by 2020. The Chief Executive and the Chief Financial Officer are both members of the Board. Among the other ten members of the Executive team there are currently two women (20%) although for most of 2017 the percentage was 22% (two members out of nine). The senior leadership team, comprising the members of the Pearson Executive and their direct reports, has 30% female representation. We believe that we have a strong pipeline of women in leadership and senior management positions, and the Committee will monitor their development, and the development of all key talent, with care. The sustainability section provides more detail on how we implement our standards on D&I on p28.
Further, in the UK, the government has introduced new regulations designed to help address the gender pay gap. Pearson has published its gender pay gap report in Great Britain and has made a commitment to extend our reporting globally by 2020.
View details of the Board’s diversity and breadth of professional experience on p64 & 66
Committee evaluation
The Committee undertook an annual evaluation to review its own performance and effectiveness. This evaluation was facilitated by Heidrick & Struggles JCA Group as part of the wider Board evaluation process. The Committee was considered to have operated effectively throughout 2017 with a clear agenda and effective leadership. In response to the findings of the 2017 evaluation, the Committee will consider succession planning as a priority in 2018, particularly for Committee chair roles.
Board diversity & inclusion objectives
The Committee has agreed the following objectives to support the Board diversity & inclusion policy:
Objectives Progress
We will strive to maintain a Board composition of:
At least 25% female Directors, with a target of at least 33% female Directors by 2020
At least one Director of colour
25% female Directors achieved
Achieved
All Board appointments will be made on merit, in the context of the skills and relevant experience that are needed for the Board to oversee Pearson’s strategic development and that reflect the global nature of our business.
Achieved. Rigorous process used during recent search for Michael Lynton who has relevant experience and skills.
The Board will prioritise use of search firms which adhere to the Voluntary Code of Conduct for Executive Search Firms when seeking to make Board-level appointments.
Achieved. Availed services of Heidrick & Struggles JCA Group, which has signed the Voluntary Code.
The Board will continue to adopt best practice, as appropriate, in response to the Davies Review, the Hampton-Alexander Review and the Parker Review.
Suggestions noted by the Board.
Where appropriate, we will assist with the development and support of initiatives that promote all forms of diversity and inclusion in the Board, Pearson Executive and our senior management.
Adopted the Board diversity & inclusion policy. Board members personally sponsor Women in Learning & Leadership network.
Section 4 Governance/Leadership & effectiveness
Nomination & Governance Committee meeting focus during 2017
Area of responsibility Activity
Appointments Appointment of Michael Lynton as Non-Executive Director
Balance Agreement of desired skills and experience of new Non-Executive Director
Board diversity and inclusion policy
Succession Contingency succession planning for temporary absence of CEO
Succession planning for senior executives including CEO
Succession planning and updates on search for Non-Executive Director
Governance Approval of committee terms of reference
Consideration of Board evaluation feedback
Compliance with UK Corporate Governance Code
Committee aims for 2018
We will have a full agenda for 2018, with a particular focus on Non-Executive Directors’ succession planning activity, Board and senior management diversity and inclusion plan, findings of the Board evaluation and review of the corporate governance framework in light of changes to the Code expected to come into effect during 2018.
Vivienne Cox Chairman of Nomination & Governance Committee
Nomination & Governance Committee report

76 Pearson plc Annual report and accounts 2017
Audit Committee report
Audit Committee role
The Committee has been established by the Board primarily for the purpose of overseeing the accounting, financial reporting, internal control and risk management processes of the company and the audit of the financial statements of the company. As a Committee, we are responsible for assisting the Board’s oversight of the quality and integrity of the company’s external financial reporting and statements and the company’s accounting policies and practices.
Pearson’s SVP Internal Audit, Compliance and Risk has a dual reporting line to the Chief Financial Officer and to me, and external auditors have direct access to the Committee to raise any matters of concern and to report on the results of work directed by the Committee. As Audit Committee Chairman, I report to the full Board at every Board meeting immediately following a Committee meeting. I also work closely with the Chief Financial Officer and senior financial management outside the formal meeting schedule to ensure robust oversight and challenge in relation to financial control and risk management.
Audit Committee composition
The Committee comprises five independent Non-Executive Directors. As a committee, we have a good balance of skills and knowledge with competence and experience covering all aspects of the sector in which Pearson operates – education, digital and services – and our key geographic markets.
Fair, balanced and understandable reporting
We are mindful of the Code’s provision C.1.1 relating to fair, balanced and understandable reporting and we build sufficient time into our annual report timetable to ensure that the full Board receives sufficient opportunity to review, consider and comment on the report as it progresses. Learn more about fair, balanced and understandable reporting on p109
Risk assessment, assurance and integrity
A key role of the Committee is to provide oversight and reassurance to the Board with regard to the integrity of the company’s financial reporting, internal control policies and procedures for the identification, assessment and reporting of risk. During 2017, we conducted a number of deep dives into selected principal risks, and the key risks on which the Committee focused throughout the year are set out below. Learn more about principal risks and uncertainties on p50–60
Business transformation
Ongoing business transformation is one of Pearson’s key risks and opportunities. The Enabling Programme (TEP) is an important operational simplification project covering Pearson’s key enterprise resource planning technology and processes, including financial and HR systems and processes, and the Committee received an update at each meeting as TEP progressed during the year.
Committee Chairman Tim Score
Members Elizabeth Corley, Vivienne Cox, Linda Lorimer, Tim Score and Lincoln Wallen
Committee responsibilities include oversight of:
Reporting The quality and integrity of financial reporting and statements and related disclosure.
Policy Group policies, including accounting policies and practices.
External audit
External audit, including the appointment, qualification, independence and the performance of the external auditor.
Risk & internal control
Risk management systems and internal control environment, including the performance of the internal audit function.
Compliance & governance
Compliance with legal and regulatory requirements in relation to financial reporting and accounting matters.
Terms of reference
The Committee has written terms of reference which clearly set out its authority and duties. These are reviewed annually and can be found on the company website www.pearson.com/governance
Attendance
Attendance by Directors at Audit Committee meetings throughout 2017:
Meetings attended
Elizabeth Corley1 3/4
Vivienne Cox 4/4
Linda Lorimer 4/4
Tim Score 4/4
Lincoln Wallen 4/4
1. Unable to attend one meeting due to existing commitment pre-dating her appointment to the Committee. Ahead of the meeting, Ms Corley communicated her comments on the business of the Committee to the Chairman.

7777
Audit Committee meeting focus during 2017
Area of responsibility Activity
Reporting Accounting and technical updates
Impact of legal claims and regulatory issues on financial reporting
Fair, balanced and understandable, Going concern and viability statements
2016 annual report and accounts: preliminary announcement, financial statements and income statement
Review of interim results and trading updates
Form 20-F and related disclosures, including annual Sarbanes-Oxley Act section 404 attestation of financial reporting internal controls
Significant issues reporting
Policy Accounting matters and Group accounting policies
Analysis supporting viability statement
Annual review and approval of external auditor policy
Treasury policy and strategy
Tax strategy
External audit
Provision of non-audit services by PwC
Receipt of external auditors’ report on Form 20-F and year-end audit
Half year review
Reappointment of external auditors
Confirmation of auditor independence
2017 external audit plan
Remuneration and engagement letter of external auditors
Review opinion on interim results
Review of the effectiveness of external auditors
Risk & internal control
Internal audit activity reports and review of key findings
Enterprise risk management
2018 internal audit plan
Legacy product review
Assessment of the effectiveness of internal control environment and risk management systems
Impact of transformation on contract royalties
Health and safety
Global Learning Platform
Risk deep dives: data security; data privacy including GDPR; anti-bribery and corruption; tax; treasury; business resilience
Oversight of The Enabling Programme
Controls transformation initiative and subsequent Committee updates
Compliance & governance
Fraud, whistleblowing reports and Code of Conduct matters
Schedule of authorities
Compliance with accounting and audit-related aspects of the UK Corporate Governance Code
Internal audit terms of reference
Committee terms of reference
Review of the effectiveness of the internal audit function
The primary areas of focus for the Committee throughout 2017 were monitoring the stabilisation of finance and operations systems in the UK which were implemented in the second half of 2016, and oversight of the planned implementation of finance and operations systems throughout our North American business. In particular, the Committee considered the phasing of the North America implementation which has been aligned to the business cycle to minimise associated risk. The Committee also considered lessons learned from the previous year’s UK implementation, including employee training and design adaptations, and how these lessons would be applied to the next phase.
The Committee heard from the project team leading the North American design and implementation, as well as the senior management team in charge of the transformation programme. Customer experience, data quality and readiness were key areas under regular consideration by the Committee, and updates were considered at every meeting on adherence to key project milestones and budget. In addition to the continued finance and operations system implementation, new global procurement, supply chain and contingent worker systems were also rolled out across Pearson.
The Global Learning Platform (GLP) is a key customer- and learner-facing element of the transformation programme, and is a mitigating factor in a number of risks facing the business, including data security and accessibility. Accordingly, the Committee has introduced GLP as a standing item for consideration at each meeting as the project progresses. The Committee will continue to monitor progress on TEP and GLP throughout 2018 with the assistance of senior management.
Leveraging the progress made through TEP, a review of general controls operating in the business commenced in 2017 with the aim of moving the control environment to best-in-class standard, alongside processes and systems. To this end, a formal control Steering Committee was established with representation from finance, HR, and technology, chaired by the Deputy CFO. The Steering Committee has oversight for controls globally, and centres of excellence have been created for both financial and IT general controls. The controls transformation is expected to be a progressive programme, over a multi-year period, building on TEP, with automated controls. The “first line of defence” will also be strengthened to reduce reliance on mitigating and audit controls. The Committee approved the proposed framework at its meeting in May 2017, and progress reports are now a standing item for the Committee’s consideration. Learn more about GLP on p15 and TEP on p51
Section 4 Governance/Accountability
Audit Committee report

78 Pearson plc Annual report and accounts 2017
Audit Committee report
Data security and data privacy
In a deep dive led by the Chief Information Security Officer, the Committee considered the progress being made in security across Pearson’s technology estate, where multiple workstreams arising from the business transformation programme have contributed to an improved remediation position in relation to risk. The risk level remains high overall, however, due primarily to the nature and volume of data held within our systems, particularly legacy systems, although decommissioning of these has accelerated under the simplification programme. The maturity of the security programme has improved through 2017, and business continuity and disaster recovery capabilities are expected to also improve as data centres are closed.
The Committee considered the balance to be struck between ongoing improvements to security maturity and the actions required by the Group-wide simplification initiatives, as well as the appropriate mix of talent required to both protect and remediate legacy systems and continue development of leading edge solutions.
The Chief Privacy Officer led a separate deep dive into Pearson’s data privacy framework. The Committee considered a report on Pearson’s readiness for the implementation of the General Data Protection Regulation (GDPR) in May 2018, and the plan in place to remediate the gaps identified. Also noted were the actions that were being taken to replace or retire legacy systems, and it was agreed that good progress had been made during the year in terms of Group-wide data privacy governance.
Tax and treasury
The Committee held two deep dives into Pearson’s tax strategy, led by the SVP Tax, to keep abreast of developments at a time of uncertainty in the tax environment. External factors under consideration by the Committee included possible impacts of the proposed US tax reforms and activity at an EU level, including potential effects on Pearson and the sectors in which we operate. From an internal perspective, the Committee considered with management and PwC the appropriate level of provisioning in respect of historical tax issues, and how such provisioning might be applied going forward, taking into account the evolution of Pearson’s size and structure in recent years.
Tax transparency is a particular topic of focus in the corporate sector as a whole, being a matter of public trust for companies and the taxation system. In September 2017, Pearson published a report on its tax strategy and financial information on a country-by-country basis for our 12 largest markets, the report being a matter of consideration for the Committee prior to publication.
The Committee also considered the direction of Pearson’s treasury strategy, with input from the new SVP Treasury who joined the business in early 2017. Key findings were that the fundamentals of the Group’s funding structure were sound and controls around dealing and cash payments were in good shape. Priorities moving forward were also considered, including the continued evolution of the treasury strategy aligned with the commercial direction of the business and the finance transformation programme, and ongoing integration of the insurance function within treasury to give a more holistic view of financial risk.
Audit Committee meetings and activities
At every meeting, the Committee considered reports on the activities of the internal audit and compliance functions, including the results of internal audits, risk reviews, project assurance reviews and fraud and whistleblowing reports. The Committee also monitored the company’s financial reporting and risk management procedures, reviewed the services provided by PwC and considered any significant legal claims and regulatory issues in the context of their impact on financial reporting, each on a regular basis.
At our August meeting, the Committee considered the findings of our review of the performance and effectiveness of Pearson’s internal audit function, a process which is undertaken annually. This review was conducted by distributing a questionnaire to the key stakeholders of the internal function – including Committee members, the lead external audit partner, members of the Pearson Executive, and senior financial, legal and operational management – and the findings indicated an effective internal audit function.
The Committee also considered Pearson’s anti-bribery and corruption programme, and the planned governance framework in respect of new anti-facilitation of tax evasion legislation, which came into effect in September 2017. In February 2018, the Committee considered the 2017 annual report and accounts, including the preliminary results announcement, financial statements, strategic report and Directors’ report.
Learn more about the key activities of the Audit Committee on p77
Members
All of the Audit Committee members are independent Non-Executive Directors and have financial and/or related business experience due to the senior positions they hold or have held in other listed or publicly traded companies and/or similar large organisations. Tim Score, Chairman of the Committee since April 2015, is the company’s designated financial expert, having recent
and relevant financial experience, and is an Associate Chartered Accountant. He also serves as Audit Committee Chairman for The British Land Company plc. The qualifications and relevant experience of the other Committee members are detailed on p64–65

7979
Additional meeting attendees
In addition to the Committee members, advisers and executives from across the business also attended meetings during the year, as outlined in the table below. This gives the Committee direct contact with key leadership. The Chairman and Chief Executive each attend at least one meeting per year, and the Chief Executive also attends for discussion of matters with an operational focus. The Committee also met regularly in private with the external auditors, SVP Internal Audit, Compliance and Risk, and VP Internal Audit.
Attendees Meetings attended
Chief Financial Officer 4/4
Deputy CFO 4/4
Legal Counsel 4/4
SVP Internal Audit, Compliance and Risk 4/4
SVP Finance, Group Reporting 4/4
VP Internal Audit* 3/3
Committee Secretary 4/4
* VP Internal Audit role created partway through 2017
Audit Committee training
The Committee receives regular technical updates as well as specific or personal training as appropriate. In August 2017, PwC led a training session for the Committee and other Board members on the current regulatory framework and corporate reporting.
Committee members also meet with local management on a periodic basis, such as when travelling for overseas Board meetings, in order to gain a better understanding of how Pearson’s policies are embedded in operations.
Committee evaluation
In 2017, the Committee evaluation was undertaken by Heidrick & Struggles JCA Group as part of the wider Board evaluation process. The responses illustrated an effective Committee, which uses its time well and has an appropriate focus on the key issues. The key findings were:
The combination of the Committee Chairman and CFO, who attends Committee meetings by invitation, is very effective and creates a well-functioning Audit Committee
All Committee members contribute fully and the balance of challenge and support is felt to be appropriate
The meetings are well run to a disciplined timetable ensuring appropriate allocation of time for discussion and agreement
Risk management is given the right attention and review in the Committee’s meetings, and there is appropriate escalation of matters to the full Board when necessary
Directors who do not serve on the Committee feel well informed of its proceedings
Succession for the role of Audit Committee Chairman should be borne in mind with future Non-Executive Director appointments, although this is not immediately pressing.
External audit
Oversight of external auditors
The Committee reviews and makes recommendations to the Board in respect of the appointment and compensation of the external auditors. This recommendation is made by the Committee after considering the external auditors’ performance during the year, reviewing external auditor fees, conducting an effectiveness review and confirming the independence, objectivity, qualifications and experience of the external auditors.
The Committee reviewed the effectiveness and independence of the external auditors during 2017, as it does every year, and remains satisfied that the auditors provide effective independent challenge to management.
The external auditor review was conducted by distributing a questionnaire to key audit stakeholders, including members of the Audit Committee, the Chief Executive, Chief Financial Officer, Deputy CFO, Company Secretary, SVP Internal Audit, Compliance and Risk, SVP Finance for each business area and other heads of corporate functions. Overall, responses to the questionnaire were very positive, indicating an effective external audit process.
The Committee will continue to review the performance of the external auditors on an annual basis and will consider their independence and objectivity, taking account of all appropriate guidelines. There are no contractual obligations restricting the Committee’s choice of external auditors. The external auditors are required to rotate the audit partner responsible for the Pearson audit every five years. A new lead audit partner, Giles Hannam, rotates onto the Pearson audit from 2018, with the outgoing partner, Stuart Newman, having led the audit for five years concluding at the end of the 2017 audit.
Audit tendering and rotation
Pearson’s last audit tender was in respect of the 1996 year end, and resulted in the appointment of Price Waterhouse as auditors. Developments at an EU level regarding mandatory audit rotation for listed companies have changed the UK landscape on audit tendering and rotation. The Committee has reviewed the timetable for tendering and has taken into account relevant regulation and guidance. EU regulations and the ruling by the Competition and Markets Authority (CMA) impose mandatory tendering and rotation requirements, with EU rules requiring a new auditor to be appointed no later than for the 2024 financial year end.
In considering the appropriate audit tender timetable for Pearson in light of these requirements, the Committee has also taken account of the significant business change being experienced by the Group and is monitoring the extent to which the Group is drawing upon the services of other accounting firms. As noted elsewhere within this report, a series of programmes is well underway throughout Pearson to implement major simplification and efficiency improvements across all our enabling functions – particularly technology, finance, HR – to continue to bring the general and administrative costs of running Pearson more in line with global best practice. These include a major transformation programme – The Enabling Programme (TEP) – which includes the
Section 4 Governance/Accountability
Audit Committee report

80 Pearson plc Annual report and accounts 2017
Audit Committee report
implementation of new financial systems and changes to our transaction processing and control activities, which launched in the UK during 2016, and is expected to be rolled out throughout our businesses by 2020. Pearson is supported in these changes, such as in project assurance matters and, more broadly, by external advisers, including accounting firms.
Due to the status of TEP and the involvement of accounting firms advising on TEP and other change projects, the Committee is of the opinion that the level of disruption likely with a change of auditor, as well as the focus required by finance and management teams to conduct the tender process thoroughly and effectively, may unduly impact the Group and would not be in the best interests of shareholders. The rotation of lead audit partner at the start of 2018 gives us further confidence in the ongoing effectiveness, independence and challenge brought by the external auditor.
As noted last year, it is the current expectation of the Committee that an audit tender process would commence in 2022 in order for the auditor selected as a result of the tender to be appointed for the financial year ending 31 December 2023. It would be our intention to look to accelerate this timing if feasible and appropriate following the completion of TEP, and we would communicate any change in our plans to shareholders in advance of any decision. For the reasons outlined above, the Committee considers this timing to be in the best interests of Pearson’s shareholders and will continue to monitor this annually in light of the effectiveness and independence of the current auditors, as well as considering whether the timing remains appropriate in light of business developments.
Once the next audit tender occurs, Pearson will adopt a policy of putting the audit contract out to tender at least every ten years, as required.
Compliance with the CMA Order
Pearson confirms that it was in compliance with the provisions of The Statutory Audit Services for Large Companies Market Investigation (Mandatory Use of Competitive Tender Processes and Audit Committee Responsibilities) Order 2014 during the financial year ended 31 December 2017.
Review of the external audit
During the year, the Committee discussed the planning, conduct and conclusions of the external audit as it proceeded.
At the August 2017 Audit Committee meeting, the Committee discussed and approved the external audit plan and reviewed the key risks of misstatement of Pearson’s financial statements, which were updated at the December 2017 Committee meeting.
The table on p81–82 sets out the significant issues considered by the Audit Committee together with details of how these items have been addressed. The Committee discussed these issues with the auditors at the time of their review of the half-year interim financial statements in August 2017 and again at the conclusion of their audit of the financial statements for the full year in February 2018.
All the significant issues were also areas of focus for the auditors. Learn more in the Independent auditors’ report on p112–117
In December 2017, the Committee discussed with the auditors the status of their work, focusing in particular on internal controls and Sarbanes-Oxley testing, and covering the significant issues outlined on the following pages.
As the auditors concluded their audit, they explained to the Committee:
The work they had conducted over revenue, including over more complex revenue contracts and judgements in relation to provisions for returns
Their work in evaluating management’s goodwill impairment exercise, on a fair value less costs to sell basis, including assessing assumptions around sales and operating cash flow forecasts, longer-term growth rates and discount rates
The work performed over the nature and presentation of non-trading items focusing on subjective judgements and the transparency with which related adjusted measures are presented
The work they had done to determine the provisioning levels in respect of potential tax exposures and uncertain tax provisions and related disclosures
Their evaluation of the recoverability of investments in digital platforms and pre-publication assets
Their work over completed disposals and the assessment of certain businesses meeting the definition of held for sale
The results of their controls testing for Sarbanes-Oxley Act section 404 reporting purposes and in support of their financial statements audit
The results of their work over the company’s going concern and viability statement reports
Their work in relation to other matters which aren’t classified as key audit matters, but may give rise to additional disclosure requirements e.g. the impact of new accounting standards.
The auditors also reported to the Committee the misstatements that they had found in the course of their work, which were insignificant, and the Committee confirmed that there were no material items remaining unadjusted in these financial statements.

8181
Significant issues considered by the Audit Committee
Area of focus Issue Action taken by Audit Committee Outcome
Impairment reviews
Pearson carries significant goodwill intangible asset balances. There is judgement exercised in the identification of CGUs and the process of allocating goodwill to CGUs and aggregate CGUs and in the assumptions underlying the impairment review. In 2016, Pearson made significant impairments to goodwill in its North American business. There were no impairments recorded in 2017.
The Committee considered the results of the Group’s annual goodwill impairment review and the key assumptions which are considered to be the cash flows derived from strategic and operating plans, long-term growth rates and the weighted average cost of capital. The Committee considered the sensitivities to changes in assumptions and the related disclosures required by IAS 36 ‘Impairment of Assets’. The Committee considered sensitivity to assumptions in relation to the Group’s CGUs noting that after a number of impairments in recent years even a relatively small change in assumptions could crystallise impairments particularly in the Group’s Core CGU.
Annual impairment review finalised with confirmation of sufficient headroom in each of the CGUs.
Revenue recognition and IFRS 15
Pearson has a number of revenue streams where revenue recognition practices are complex and management assumptions and estimates are necessary. The Group also finalised its work on the disclosure required in connection with the transition to IFRS 15 ‘Revenue from Contracts with Customers’ which will be applicable in 2018.
The Committee regularly reviews revenue recognition practice and the underlying assumptions and estimates. In addition, the Committee has visibility of internal audit findings relating to revenue recognition controls and processes and routinely monitors the views of external auditors on revenue recognition issues. During the year, the Committee continued to monitor the project to transition to the new revenue recognition standard, IFRS 15 ‘Revenue from Contracts with Customers’. The Committee noted the changes to revenue streams and the quantification of the impact on the opening balance sheet.
Assumptions underlying revenue recognition were reviewed and challenged and considered to be appropriate. Progress on the project to convert to IFRS 15 and final quantification and disclosures were reviewed and also agreed as appropriate.
Financial instruments
Pearson will adopt IFRS 9 ‘Financial Instruments’ in 2018.
The Committee reviewed the work on the transition to IFRS 9 and noted the Group’s new approach to hedge accounting, investment valuation and impairment. The Committee reviewed the impact on the opening balance sheet and in particular the impact on bad debt provisions.
Adjustments relating to IFRS 9 were reviewed and disclosure of impact in 2018 was considered appropriate.
Disposal transactions
The Group sold a significant portion of its stake in Penguin Random House and the China test preparation business, ‘GEDU’. The Group also announced its intention to sell its English Language teaching business in China, ‘WSE’, and its K-12 school courseware business in the US.
The Committee reviewed the accounting for the disposal transactions, including the rationale for held for sale treatments in respect of proposed disposals. The Committee also considered the status of the remaining 25% investment in Penguin Random House and in particular considered whether Pearson continued to exert significant influence over the venture.
The Committee determined that disposal accounting had been correctly recorded and that the criteria for held for sale treatment in respect of potential disposals was appropriate. The Committee also agreed that the remaining investment in Penguin Random House should continue to be accounted for as an associate.
Section 4 Governance/Accountability
Audit Committee report

82 Pearson plc Annual report and accounts 2017
Audit Committee report
Significant issues considered by the Audit Committee (continued)
Area of focus Issue Action taken by Audit Committee Outcome
Pension valuations
Pearson’s UK pension plan includes a large defined benefit section. The valuation of this plan under IAS 19 ‘Employee Benefits’ requires significant judgement.
The Committee looked at changes in the assumptions used to value the UK pension plan and in particular noted updated assumptions for mortality, discount rates and member options on retirement. The Committee also reviewed the accounting for the Plan’s purchase of insurance buy-in policies during the year and for significant additional pension contributions made in respect of prior year business disposals.
Pension assumptions were considered appropriate and the pension surplus under IAS 19 was agreed to be fairly stated.
Comment letters received from regulators
During the year Pearson received comment letters from the Financial Reporting Council (FRC) in the UK and the Securities Exchange Commission (SEC) in the US.
Letters from the FRC and SEC were circulated to the Committee and responses by the company were reviewed. Where relevant additional disclosure was requested by the regulators this was also reviewed prior to publication in this report. In particular, the Committee reviewed proposed changes to disclosures relating to our alternative performance measures included in the Our KPIs section, the Financial Review section and the Financial key performance indicators section of this report.
The Committee agreed that the company’s responses to comment letters were appropriate and ensured that disclosures were reviewed and updated. Both comment letter processes have been closed.
RestructuringPearson announced a new restructuring programme in May 2017. There are a number of accounting judgements to be made regarding categorisation and timing of recognition of cost.
The Committee reviewed progress on the restructuring programme and considered the judgements required in accounting for the costs of redundancy, asset impairment and property rationalisation mainly in respect of the Group’s North America operations and enabling functions. The Committee also considered the disclosure of restructuring in Pearson’s adjusted measures.
The Committee confirmed that the accounting and disclosure for the restructuring programme were appropriate.
Returns In light of significant product returns in 2016 in the US higher education courseware business, we continued to review returns data and our policy on reserving for returns.
The Committee considered return provisioning for the US higher education courseware business following a high level of returns from retailers in 2016 and a subsequent change in methodology for establishing provisions. This methodology was subsequently refined in 2017.
Assumptions underlying the returns reserve methodology were reviewed and agreed as still being appropriate in the light of actual returns in 2017.
Tax The impact of US tax reform and the trend for increased tax transparency, and provision levels.
The Committee reviewed tax provision levels and was updated on expanded annual report disclosures concerning tax provisions. The Committee addressed this matter through the presentation of two management reports on Pearson’s tax affairs by the SVP Tax and through a presentation of the external auditors’ assessment of the company’s tax provisioning. In addition, the Committee considered the report on tax strategy issued in September 2017 prior to publication. The Committee was briefed by management on the anticipated impact of US tax reform in December 2017. As more information on the detailed application becomes available, these estimates may change, and the Committee will be updated as necessary.
The Committee was satisfied with Pearson’s approach to tax provisioning, taking account of the views of management and the assessment of the external auditors. The Committee agreed that expanded disclosure in this report would be beneficial to users.

8383
Auditors’ independence
In line with best practice, our relationship with PwC is governed by our policy on external auditors, which is reviewed and approved annually by the Audit Committee. The policy establishes procedures to ensure the auditors’ independence is not compromised, as well as defining those non-audit services that PwC may or may not provide to Pearson. These allowable services are in accordance with relevant UK and US legislation.
The Audit Committee approves all audit and non-audit services provided by PwC. Our policy on the use of the external auditors for non-audit services reflects the restriction on the use of pre-approval in the 2016 FRC Guidance on Audit Committees and, accordingly all non-audit services, irrespective of value, are required to be approved by the Audit Committee. In particular, we expressly prohibit the provision of certain tax, HR and other services by our external auditor. We review non-audit services on a case-by-case basis, including reviewing the ongoing effectiveness and appropriateness of our policy.
The Audit Committee receives regular reports summarising the amount of fees paid to the auditors. During 2017, Pearson spent £0.8m less on non-audit fees with PwC compared with 2016, due to a reduction in billing on tax services and on the efficacy programme. For 2017, non-audit fees represented 23% of external audit fees (35% in 2016). The policy on provision of non-audit services by external auditors in use in 2016 was in line with previous FRC requirements.
For all non-audit work in 2017, PwC was selected only after consideration that it was best able to provide the services we required at a reasonable fee and within the terms of our policy on external auditors. Where PwC is selected to provide audit-related services, we take into account its existing knowledge and experience of Pearson. Where appropriate, services were tendered prior to a decision being made as to whether to award work to the auditors.
Significant non-audit work performed by PwC during 2017 included:
Audit-related work in relation to potential and actual corporate finance transactions
Audit of IT general controls mandated by contractual commitments.
A full statement of the fees for audit and non-audit services is provided in note 4 to the consolidated financial statements on p137.
Tim Score Chairman of Audit Committee
Section 4 Governance/Accountability
Audit Committee report

84 Pearson plc Annual report and accounts 2017
Control environment
The Board has overall responsibility for Pearson’s systems of internal control and risk management, which are designed to manage, and where possible mitigate, the risks facing Pearson, safeguard assets and provide reasonable, but not absolute, assurance against material financial misstatement or loss. The Board confirms that it has conducted a review of the effectiveness of Pearson’s systems of risk management and internal control in accordance with provision C.2.3 of the Code and the FRC Guidance on Risk Management, Internal Control and Related Financial and Business Reporting (FRC Guidance). The Board confirms these systems operated satisfactorily throughout the year and to the date of this report, and no significant failings or weaknesses were identified in the review process.
The Board has delegated responsibility for monitoring the effectiveness of the company’s risk management and internal control systems to the Audit Committee. The Audit Committee oversees a risk-based internal audit programme, including periodic audits of the risk processes across the organisation. It provides assurance on the management of risk, and receives reports on the efficiency and effectiveness of internal controls. Each business area, including the corporate centre, maintains internal controls and procedures appropriate to its structure, business environment and risk assessment, while complying with company-wide policies, standards and guidelines.
Internal control and risk management
Our internal controls and risk oversight are monitored and continually improved to ensure their compliance with FRC Guidance. Our risk journey is described more thoroughly in the risk management section on p50–60.
The Board is ultimately accountable for effective risk management in Pearson and determines our strategic approach to risk. It confirms risk appetite targets and receives and reviews semi-annual reports on the enterprise risk management (ERM) process and the status of top enterprise-wide risks.
It is supported in the following ways:
The Audit Committee is responsible for overseeing internal controls within Pearson which includes determining the risk appetite (recommended by Pearson Executive management), reviewing and commenting upon key risks and ensuring that risk management is effective
Pearson’s Executive and leadership teams are responsible for identifying and mitigating risks, supported by the ERM team
Leaders and managers at all levels in Pearson are responsible for managing risk in their area of responsibility, including the identification, assessment and treatment of risk
The ERM team owns the overall risk management framework for the company and facilitates consolidated reporting on risk
The internal audit team provides independent assurance on the adequacy of the risk management arrangements in place. The internal audit plan is aligned to identified enterprise-wide risks reported by the ERM team and it presents issues and risks arising from internal audits at each Audit Committee meeting.
The involvement of the Board and Audit Committee in the design, implementation, identification, monitoring and review of risks (including setting risk appetite, determining which are principal to the company and how risk is being embedded in our culture) is outlined in more detail in the risk management section on p50–60.
Financial management and reporting
There is a comprehensive strategic planning, budgeting and forecasting system with an annual operating plan approved by the Board. Monthly financial information, including trading results, balance sheets, cash flow statements, capital expenditures and indebtedness, is reported against the corresponding figures for the plan and prior years, with corrective action outlined by the appropriate Senior Executive. Pearson’s senior management meets regularly with business area management to review their business and financial performance against plan and forecast. Major risks relevant to each business area as well as performance against the stated financial and strategic objectives are reviewed in these meetings.
We have an ongoing process to monitor the risks and effectiveness of controls in relation to the financial reporting and consolidation process, including the related information systems. This includes up-to-date Pearson financial policies, formal requirements for finance to certify that they have been in compliance with policies and that the control environment has been maintained throughout the year, consolidation reviews and analysis of material variances, finance technical reviews, and review and sign-off by senior finance managers. The Group finance function also monitors and assesses these processes and controls through finance and technology compliance functions and a Controls Steering Committee comprising cross-functional experts.
These controls include those over external financial reporting which are documented and tested in accordance with the requirements of section 404 of the Sarbanes-Oxley Act, which is relevant to our US listing. One key control in this area is the Verification Committee, which submits reports to the Audit Committee. This Committee is chaired by the SVP Internal Audit, Compliance and Risk, and members include the Chief Financial Officer and/or their deputy, General Counsel, SVP Investor Relations and the Company Secretary as well as senior members of financial management. The primary responsibility of this Committee is to review Pearson’s public reporting and disclosures to ensure that information provided to shareholders is complete, accurate and compliant with all applicable legislation and listing regulations. The effectiveness of key financial controls is subject to management review and self-certification and independent evaluation by the external auditors.
Risk governance and control

8585
Internal audit
Pearson has an in-house internal audit function, supported by co-source agreements to augment our in-house resources, in areas such as providing specific subject matter expertise or language skills. The internal audit function is responsible for providing independent assurance to management and the Audit Committee on the design and effectiveness of internal controls to mitigate strategic, financial, operational and compliance risks. The SVP Internal Audit, Compliance and Risk reports formally to the Chairman of the Audit Committee and the Chief Financial Officer, with a reporting line to the General Counsel on compliance matters.
The internal audit mandate and plan are approved annually by the Audit Committee. Completion and changes to the plan are also reviewed and approved by the Audit Committee throughout the year. The internal audit plan is aligned to our greatest areas of risk as identified by the ERM process, and the Audit Committee considers issues and risks arising from internal audits. Management action plans to improve internal controls and to mitigate risks, or both, are agreed with the business area after each audit. Formal management self-assessments allow internal audit to monitor business areas’ progress in implementing management action plans agreed as part of internal audits to resolve any control deficiencies. Progress of management action plans is reported to the Audit Committee at each meeting. Internal audit has a formal collaboration process in place with the external auditors to ensure efficient coverage of internal controls. Regular reports on the findings and emerging themes identified through internal audits are provided to Executive management and, via the Audit Committee, to the Board.
The SVP Internal Audit, Compliance and Risk oversees compliance with our Code of Conduct and works with senior legal and HR personnel to investigate any reported incidents, including ethical, corruption and fraud allegations. The Audit Committee is provided with an update of all significant matters received through our whistleblowing reporting system, together with an annual review of the effectiveness of this system. The Pearson anti-bribery and corruption programme provides the framework to support our compliance with various anti-bribery and corruption regulations such as the UK Bribery Act 2010 and the US Foreign Corrupt Practices Act.
Treasury management
The treasury department operates within policies approved by the Audit Committee on behalf of the Board, and treasury transactions and procedures are subject to regular internal audit. Major transactions are authorised outside the department at the requisite level, and there is an appropriate segregation of duties. Frequent reports are made to the Chief Financial Officer and regular reports are prepared for the Audit Committee and the Board. The treasury policy is described in more detail in note 19 to the consolidated financial statements.
Insurance
Pearson reviews its risk financing options regularly to determine how the company’s insurable risk exposures are managed and protected. Pearson purchases comprehensive insurance cover and annually reviews coverage, insurers and premium spend, ensuring the programme is fit for purpose and cost-effective.
Pearson’s insurance subsidiary, Spear Insurance Company Limited, is used to leverage Pearson’s risk retention capability and to achieve a balance between retaining insurance risk and transferring it to external insurers.
Section 4 Governance/Accountability
Risk governance and control

86 Pearson plc Annual report and accounts 2017
Reputation & Responsibility Committee report
Committee Chairman Linda Lorimer
Members Vivienne Cox, Linda Lorimer, Harish Manwani and Lincoln Wallen
Reputation & Responsibility Committee role
The Committee forms an important part of the Board’s oversight of the broader governance environment, working to advance Pearson’s reputation across a range of stakeholders and to maximise the company’s positive impact on society and the communities in which we work.
The Committee’s agenda includes discussion of reputation, critical issues and initiatives, including those identified as material to Pearson’s stakeholders and long-term sustainability, and consideration of immediate risks or opportunities. We are committed to promoting Pearson’s 2020 sustainability plan, and the Committee works in alignment with the company’s Responsible Business Leadership Council which comprises senior leaders from across the business.
Read more about our 2020 sustainability plan on p24–33.
Changes to the Committee
Lincoln Wallen joined the Committee with effect from 1 January 2017, in place of Josh Lewis who stepped down from the Committee at the end of 2016. I was pleased to take over the chairmanship of the Committee at the start of the year from Vivienne Cox, who remains a valuable member of the Committee.
Areas of focus during 2017
As part of Pearson’s 2020 sustainability plan, the company has identified a shortlist of issues that are most relevant to the sustainability of our business. The Committee has an integral role in the oversight and governance of these issues, and during 2017 held a number of deep dives to consider specific issues, in particular considering the public goals and targets the company is setting to address these issues, and examining their associated reputational impacts.
At our August meeting, we reviewed proposals for Pearson’s new global editorial policy, designed to ensure we consistently publish high-quality content and prevent errors. The Committee considered appropriate positioning and communication of the policy and discussed plans for training to be rolled out to content creators and editorial staff. We also discussed ways in which Pearson could adapt and modify its content to reflect local and cultural norms, while still being true to our values and purpose. During the year we also considered access enabled by affordability, particularly in the US higher education courseware market, and discussed plans to ensure our products meet the needs of learners, educators and administrators in accessing learning and teaching materials from anywhere, at any time. In addition, the Committee considered reports on other material sustainability issues, namely greenhouse gas emissions and climate change, 21st century skills and lobbying and public policy.
Read more about our material sustainability issues and our global editorial policy on p25–26.
During the year we reviewed the progress made by Pearson’s ongoing social impact initiatives and partnerships. We focused on developing the next phases of Project Literacy and for the Pearson Affordable Learning Fund as well as studied the plans for Tomorrow’s Markets Incubator.
Committee responsibilities include oversight of:
Reputation Pearson’s reputation among major stakeholders, including governments, investors, employees, customers, learners and the education community.
Risk Oversight of Pearson’s approach to reputational risk, including ensuring that clear roles have been assigned for management.
Sustainability Oversight of 2020 sustainability plan and performance against sustainability goals and commitments.
Brand & culture
Management of the Pearson brand to ensure that its value and reputation are maintained and enhanced. Pearson’s approach to monitoring and supporting the values and desired behaviours that form our corporate culture.
Ethics Ethical business standards, including Pearson’s approach to issues relevant to its reputation as a responsible corporate citizen.
Strategy Strategies, policies and plans related to reputation and responsibility issues and the people, processes and policies that are in place to manage them.
Terms of reference
The Committee has written terms of reference which clearly set out its authority and duties. These are reviewed annually and can be found on the company website www.pearson.com/governance
Attendance
Attendance by Directors at Reputation & Responsibility Committee meetings throughout 2017:
Meetings attended
Vivienne Cox 4/4
Linda Lorimer 4/4
Harish Manwani 4/4
Lincoln Wallen 4/4

8787
Overview
Our strategy in action
Our perform
anceG
overnanceFinancial statem
ents
Section 4 Governance/Engagement
Reputation & Responsibility Committee meeting focus during 2017
Area of responsibility Activity
Reputation Issue management – customer and media engagement in UK and US
Global editorial policy: meeting learner expectations
North American markets – new US administration and approach to government affairs and public policy
Sustainability Sustainability report
Tomorrow’s Markets Incubator initiative
Efficacy reporting plans
Greenhouse gas emissions and climate change
Brand & culture
Brand strategy
Marketing campaigns
Review of any incidents
Strategy Access and affordability of US higher education courseware
Community investment plan, including Project Literacy updates
One story and digital narrative
Brand strategy is an important part of the Committee’s mandate, and we assessed the progress in rolling out the new Pearson brand and the recent market campaigns in North America. We have been attentive to how the communications are migrating more to digital dissemination to align with our customers’ practices and preferences.
The US is our largest market, so it is important for the Committee to follow Pearson’s reputation and brand in the US particularly. The likely impact of the US 2016 elections was outlined for us early in 2017, and we have received updates on issues and initiatives in our higher education business as they related to reputation. Pearson will be reporting publicly, starting in 2018, on the efficacy of our products and services to demonstrate their measurable impact. Throughout 2017, the Committee monitored the progress of our external reporting plans; we looked at how we are aligning our efficacy goals with our wider business strategy, and considered examples of product efficacy reports. We were joined for our efficacy sessions by PwC, which is providing external assurance for the efficacy reporting process.
In our report to shareholders last year, we noted that, as a Committee, we would continue to monitor the Pearson culture and employee engagement, particularly in light of the changes and rationalisations throughout the business in 2016. However, due to the importance of this topic, it was instead considered by the full Board in 2017. Culture and engagement continues to fall within the remit of the Committee, and we will consider the matter as appropriate during 2018.
Committee evaluation
In 2017, the Committee evaluation was undertaken by Heidrick & Struggles JCA Group as part of the wider Board evaluation process. Overall, the responses illustrated a collaborative and engaged Committee, and that the work of the Committee is increasingly aligned with the strategic agenda. The assessment indicated that there may be opportunity to evolve the Committee further by clarifying its focus. In particular, some overlap with the Audit Committee was identified. As a result, oversight on efficacy, health and safety and safeguarding will be lodged with this Committee rather than shared with the Audit Committee.
Committee aims for 2018
Over the next year we will continue to explore Pearson’s material sustainability issues, including employability and 21st century skills as well as affordability, health and safety and safeguarding. We will hold a deep dive into sustainability considerations relating to our supply chain and review our 2018 efficacy reporting activity and plans for 2019. We will also review our Group-wide approach to reputational risk management and will consider culture and employee engagement, bearing in mind challenges and opportunities presented by the ongoing transformation and simplification across the business.
Linda Lorimer Chairman of Reputation & Responsibility Committee
Reputation & Responsibility Committee report

Pearson plc Annual report and accounts 201788
Stakeholder engagement
Engaging with shareholders
Access to capital is key to the long-term performance of our business. We work to ensure that our investors, analysts and other investment professionals have a good understanding of our strategy, performance and purpose.
Pearson has an extensive programme of communication with all of its shareholders – large and small, institutional and private.
Shareholder outreach In 2017, we continued with our shareholder outreach programme, conducting over 300 meetings in the UK, US, Canada and Continental Europe with over 260 investment institutions.
Trading updates There are five trading updates each year and the Chief Executive and Chief Financial Officer present our preliminary and interim results. They also attend regular meetings throughout the year with investors in the UK and around the world, tailored to investor requirements, to discuss the performance of the company, the company’s strategy, our change programme, structural and cyclical changes in our markets, and risks and opportunities for the future.
The investor relations team Led by Joanne Russell, SVP Investor Relations, who joined in June 2017 after six years as Head of Investor Relations at Whitbread plc. The IR team met with investors throughout the year, including attending several investor conferences, and addressed regular investor and analyst enquiries.
Chairman and Non-Executive Directors The Chairman meets regularly with shareholders to understand any issues and concerns they may have. This is in accordance with the Code and consistent with the duties of investors under the UK Stewardship Code. The Non-Executive Directors meet informally with shareholders both before and after the AGM and respond to shareholder queries and requests as necessary. The Chairman ensures that the Board is kept informed of investors’ and advisers’ views on strategy and corporate governance. At each Board meeting, the Directors consider commentary from advisers on major shareholders’ positions and Pearson’s share price. In addition, the Nomination & Governance and Remuneration Committees consider shareholder views on corporate governance and remuneration matters, respectively, as required.
The 2017 financial year has been one of significant engagement with our shareholders. Sidney Taurel, Elizabeth Corley and our senior management team also consulted with our major shareholders and with shareholder representative bodies on our approach to Directors’ remuneration following the vote against our Directors’ remuneration report at our 2017 AGM.
Further details regarding Directors’ remuneration can be found on p90–105
Private investors Institutional investors’ holdings in Pearson account for around 90% of total shares outstanding, but private investors represent over 80% of the shareholders on our register and we make a concerted effort to engage with them regularly. Shareholders who cannot attend the AGM are
Non-Executive Director engagement
Save the Children, Jordan – Vivienne Cox
Last September, Vivienne Cox accompanied Kate James (Chief Corporate Affairs and Global Marketing Officer) and other Pearson colleagues to Amman, Jordan, on behalf of Pearson, to launch the next phase of Pearson’s ‘Every Child Learning’ partnership with Save the Children. The team launched a new pilot education project in Jordan, in partnership with the Jordanian Ministry of Education, to help Syrian refugees, and local children living in host communities, to improve their learning outcomes, to build resilience and to help make their schools safer.
As part of the trip, the Pearson team:
Visited a community centre in East Amman which over the previous 12 months had given us access to learners with whom to develop the maths learning app. The team met some of the refugee children and ran a focus testing group on the latest version of the app
Took part in an official launch of our pilot education project at the Al Emama Al Shafe’e School with officials from the Jordanian Ministry of Education, British Ambassador and Save the Children. The team met children, parents, teachers and Save the Children Jordan Field Staff who were taking part in our pilot education project
Visited Za’atari refugee camp to see various aid programmes run by Save the Children.
Digital Advisory Network – Lincoln Wallen
For Pearson, tackling a major social need – making education more accessible and effective – is why we exist and how we create value for our shareholders. In a world where work is increasingly disrupted by machine intelligence, the need to be always learning is greater now than ever. It is also a great challenge, as the legacy analogue businesses that still generate a lot of Pearson’s profits are themselves being disrupted by technology.
At this pivotal time in the digital transformation of education, Pearson launched the Digital Advisory Network to bring together a diverse cross-section of people with experience and knowledge of disruption in other industries and to help us apply lessons learned and insights to shape Pearson’s business strategy for the Board.
Lincoln Wallen has been an instrumental leader since the Network’s inception and participated in the first Network Summit in October 2017. Lincoln continues to serve as a leader and adviser to both the Network and the Pearson Executive.

8989
Engagement in action
Industry & marketplace
Employees Franchisees Customers
Non-Executive Directors Josh Lewis and Linda Lorimer were engaged and instrumental in redefining the go-to-market strategy for Pearson’s Online Program Management business, working alongside senior management
The Board attended a discussion event on Future of Skills: Employment in 2030, at which they considered the future of work and implications for education. The Board was joined at the event by external business, policy and thought leaders from the Boston area
Read more about the Future of Skills: Employment in 2030 on p10
The Board met with local staff and senior management during 2017 visits to São Paulo and Boston. Dinners with senior local management and breakfasts with key talent allowed the Non-Executive Directors to share their experience and expertise with employees as well as allowing the Directors to better understand employees’ abilities and motivations, helping them to assess the company’s prospects and plans for succession
Non-Executive Directors Elizabeth Corley and Vivienne Cox participated in Women in Leadership and Learning network (WILL) meetings, giving virtual talks to employees on professional development
The Board had an opportunity to interact with an audience of 800 people from the Pearson franchisee sales team at the Wizard sales convention in São Paulo, Brazil
During this event, the Board learned about the Wizard strategy, marketing campaigns and training provided to the franchisee sales team. The event also included recognition for high-performing employees
The Board heard from faculty and students about the challenges and opportunities they face with digital teaching and learning at the Digital Teaching & Learning Customer Panels in Boston
This session enabled the Board to understand the customer context to our higher education strategy
invited to e-mail questions to the Chairman in advance at [email protected]
We encourage our private shareholders to become more informed investors and have provided a wealth of information on our website about managing Pearson shareholdings. We also encourage all shareholders, who have not already done so, to register their e-mail addresses through our website and with our registrar. This enables them to receive e-mail alerts when trading updates and other important announcements are added to our website. See Shareholder information on p196 or visit our website https://www.pearson.com/corporate/investors/managing-your-shares.html
Annual General Meeting
Our AGM, on 4 May 2018, is an opportunity for all shareholders to meet the Board and to hear presentations about Pearson’s businesses and results.
Share dealing service
Due to its continued popularity, we intend to provide shareholders with smaller holdings the opportunity to use our registrar’s low-cost share dealing service, giving them the chance to add to or reduce their stake in Pearson at significantly reduced dealing rates, or to donate shares to charity with ease. We believe it is important that our employees have a shared interest in the direction and achievements of Pearson and are pleased to say that a large number of our employees are shareholders in the company.
Engaging with all stakeholders
We post all company announcements on our website, www.pearson.com, as soon as they are released, and key shareholder presentations are made accessible via webcast or conference call. Our website contains a dedicated investor relations section with an extensive archive of past announcements and presentations, historical financial performance, share price data and a calendar of events. It also includes information about all of our businesses, links to their websites and details of our sustainability policies and activities. Learn more about our approach to Sustainability on p24–33
Vivienne Cox engaging with refugee children at a community centre in East Amman, Jordan during ‘Every Child Learning’ visit.
Section 4 Governance/Engagement
Stakeholder engagement

Pearson plc Annual report and accounts 201790
Remuneration overview
Committee Chairman Elizabeth Corley
Members Elizabeth Corley, Josh Lewis, Tim Score and Sidney Taurel
Key changes to how we implement our remuneration policy for 2018
Maintaining lower award size for 2018 LTIP awards
Reduction in pension contributions for new hires
Shareholding guidelines to extend post-retirement
�Simplified�and�balanced�performance�measures
In this remuneration section
Part 1: Remuneration overview p90
Part 2: Executive remuneration framework and implementation in 2018 p94
Part 3: 2017 remuneration report p96
Terms of reference
The Committee’s full charter and terms of reference are available on the Governance page of the company’s website. A summary of the Committee’s responsibilities is shown on p105.
Board Committee attendance
The following table shows attendance by Directors at Committee meetings throughout 2017:
Remuneration
Elizabeth Corley 5/5
Josh Lewis 5/5
Tim Score 5/5
Sidney Taurel 5/5
www.pearson.com/governance
Dear shareholders,
The vote on remuneration at last year’s AGM gave us a clear message about how we managed executive pay for 2016. We made a commitment to respond in a constructive way and have taken a comprehensive look at the remuneration of our Executive Directors for 2017.
We have engaged with our shareholders
We have held extensive dialogue with major shareholders and shareholder representative bodies. We began this process in May 2017 and will continue it through this year’s AGM. I would like to thank all those who contributed to the process. We have listened and sought to respond to the concerns we have heard. It is clear that shareholders and other stakeholders would like our approach to remuneration to be simpler, more transparent and with lower maximum levels of reward as the business goes through this challenging phase. Our investors continue to hold a diverse range of views regarding appropriate performance measures. We have endeavoured to develop an approach that the majority of shareholders can support.
Our approach to remuneration supports our strategy
Pearson is the world’s learning company. We create educational tools, content, products and services that people need to help them make progress in their lives through learning. Our ambition is to be the leader in digital learning on a global basis. To deliver on this ambition we have a strong global management team, and we compete for talent in a demanding international business environment. The company’s ability to attract and retain the high calibre executives needed to lead this complex and changing business is critical for our shareholders. As such, we have tried to take a balanced approach to these commercial pressures when determining executive pay.
We have reduced the LTIP awards for 2017 and 2018
The Remuneration Committee has reduced the 2017 grant of long-term incentives to the Executive Directors in the year by approximately 30%. This substantial reduction demonstrates a responsible approach to the operation of remuneration arrangements for our Executive Directors as we go through the current business transformation. The Committee has decided that we will maintain the same reduced award size for the LTIP grant to be made in 2018. Therefore, the 2018 awards will be made with the same face value as a % of salary as those in 2017. We have also reduced the proportion of these awards that will vest for threshold performance to 18% of the award.
These share awards will only vest to the extent that performance is delivered against stretching performance tests over the next three years. Any awards vesting will be subject to a further two-year holding period. The eventual value of the awards will depend on our share price performance and dividends paid to shareholders over�a�five-year�period.
“After a thorough review and extensive shareholder engagement, we believe that our approach to remuneration is simpler, transparent, and a balanced reflection of the performance of the business.”

91Section 4 Governance/Remuneration
How we reflected our progress and performance in the annual bonus for 2017
Pearson�delivered�adjusted�operating�profit�of�£576m�in�2017,� which was at the top end of our guidance range, and underlying earnings per share of 54.1p, helped by an exceptional change to the tax rate during the year. The company continued to invest in digital transformation�and�simplification.�In�2017,�Pearson�announced�plans�to�deliver�another�c.£300m�in�cost�savings�over�a�three-year�period,�in�addition�to�the�c.£650m�of�cost�savings�delivered�in�the�years immediately prior.
Pearson�had�strong�cash�flow�generation�in�the�year.�The�portfolio�was�further�simplified�with�the�partial�disposal�of�Penguin�Random�House.�A�£300m�share�buyback�programme�was�announced�and�the�overall�Net�Debt�of�the�business�was�reduced�to�£432m�at�the�end�of�2017�from�£1.1bn�in�2016.�The�proposed�overall�dividend�for�the year will be 17p. Further details of these results can be found elsewhere in this Annual Report.
The Committee took this progress and performance into account when determining the outcome of the annual incentive plan for 2017.
During 2017, the board set a demanding plan for the business. The thresholds of the performance ranges for the Annual Incentive Plan for our Executive Directors were set above market consensus expectations at the time. As such, bonus was only payable to the Executive Directors for 2017 for performance delivered ahead of market expectations.
The company delivered results in line with the demanding plan set�for�the�year�on�operating�profit�and�earnings�per�share.� Good progress was made in delivering on a number of aspects of�the�strategic�plan.�Cash�flow�generation�exceeded�plan�in�the�year driven by strong cash conversion of 116%.
��We�announced�a�£300m�share�buyback�beginning�18�October� 2017 utilising part of the proceeds from the disposal of a 22% stake in Penguin Random House. We completed the programme on 16�February�2018.�The�share�buy�back�programme�did�not�benefit�the outcome of incentives for the Executive Directors.
Sales revenues in the year did not reach the stretch targets in the annual incentive plan.
��There�is�no�benefit�from�foreign�exchange�movements�in�the�year�in determining the outcome of the annual bonus.
A year of progress and performance
Remuneration simplified and balanced
LTIP awards reduced for 2017 & 2018 by approximately 30%
Discretionary reductions in annual bonus for 2017
Based on performance against targets, in 2017 the CEO achieved a bonus outcome of 61% of maximum and the CFO achieved a bonus outcome of 58% of maximum. The Remuneration Committee exercised its discretion and reduced these outcomes by 5% to account for the exceptional change in the tax rate during the year so that�the�Executive�Directors�did�not�benefit�from�this.�This�resulted�in a bonus outcome of 56% of maximum for the CEO and 53% of maximum for the CFO.
The Remuneration Committee then moved to consider the bonus outcomes in the context of the shareholder experience in the year. Mindful of this experience, and the work still to be done, the Executive Directors, along with the Committee, have agreed it would not be appropriate to take the full bonus and that a further reduction in outcomes was appropriate. The Committee commends the Executive Directors for their approach in these matters and confirmed�that�we�should�further�reduce�the�bonus�outcome�based�on the following considerations:
The degree of stretch in the targets set relative to plan was considered�and�the�Committee�were�satisfied�that�the�targets� were appropriately calibrated;
��Outcomes�against�the�targets�were�a�reflection�of�the� performance of the company in the year and were a fair and reasonable outcome;
Management is making tangible progress in executing the strategy but, at the time of the Committee’s deliberations, this was not fully reflected�in�the�share�price;
A change in dividend policy resulted in a reduced payout of a proposed 17p;
2017 performance provides a solid foundation from which to build and positions the company well for a return to growth in 2018.
As a result, the annual bonus payable to the CEO for 2017 is 44% of maximum and for the CFO is 47% of maximum.
Remuneration overview

92 Pearson plc Annual report and accounts 2017
Understanding total remuneration for the CEO for 2017
Given the level of performance achieved and the progress made towards executing our longer term strategic plan, the overall reported�‘single�figure’�for�the�total�remuneration�of�John�Fallon� for�2017�is�£1.758m.�This�is�a�16%�increase�compared�with�2016.� The�‘single�figure’�has�increased�because�we�have�paid�an�annual�bonus of 44% of the maximum opportunity for 2017. This is higher than the annual bonus for 2016, which was 24% of the maximum opportunity.
John Fallon did not receive a salary increase in 2017 and none of the 2015 LTIP award for the performance cycle from 2015 to 2017 vested. This was the sixth year in which none of the long-term incentive awards have vested, demonstrating the Remuneration Committee’s consistent application of a rigorous approach to setting performance targets.
Having completed 20 years of service with Pearson, from October 2017�John�Fallon�had�no�further�service�accrual�under�his�defined�benefit�pension�arrangements.
Looking forward to 2018 – simpler, balanced performance measures
The base salary for the CEO and CFO will be increased by 2.5% in 2018 in line with the average increases for UK employees. This is the�first�increase�in�three�years.
Working within our existing policy, to simplify the annual incentive plan�(AIP)�structure�for�2018,�and�reflecting�shareholder�feedback,�we�have�reduced�the�number�of�performance�measures�from�five� to�four.�We�have�replaced�the�two�profit�based�measures�previously�included�(Operating�Profit�and�EPS)�with�a�single�Operating�Profit�measure, which will determine 40% of the outcome of the plan. This provides a greater focus on the metric used by management on a day-to-day basis to manage the business, whilst reducing the prominence of EPS in the overall remuneration framework. We have also made minor adjustments to the weightings of the other�performance�measures�(Cashflow�20%,�Revenue�20%�and�Strategic Measures 20%). We believe this creates an AIP that is appropriately balanced between key metrics and objectives for 2018. Each performance measure will operate independently. There will be no changes to the maximum annual incentive opportunities for 2018.
As noted above, the Remuneration Committee has decided to maintain the lower level of long-term incentive awards in 2018. In 2017, we reduced LTIP awards by approximately 30% from prior levels, whilst retaining stretching performance targets. We have also reduced the proportion of these awards that will vest for threshold performance from 25% to 18% of the award. We will adopt the same approach for the 2018 awards by maintaining the 2017 award levels. Therefore, the 2018 awards will be made with the same face value as a % of salary as those in 2017.
Responding to shareholder feedback we are rebalancing the performance measures for 2018 awards. One third of any award will vest based on each of Earnings Per Share (EPS), Gross Return On Invested Capital (ROIC) and Relative Total Shareholder Return (TSR) measured over three years. Awards will also be subject to a further two year holding period. The eventual value of the awards will depend on our share price performance and dividends paid to�shareholders�over�a�five�year�period.�
Other important changes for the future
We will limit the pension allowance for future new external Executive Director appointments. This will reduce the maximum cash allowance in lieu of participation in a pension scheme from 26% to 16% of salary.
We are extending our minimum shareholding guidelines post-retirement. Executive directors will be expected to maintain a shareholding of at least half their normal guideline for two years following retirement.
Remuneration overview

93Section 4 Governance/Remuneration
Our remuneration policy is aligned with our strategy
Our shareholders approved our remuneration policy in 2017. Nevertheless, the Remuneration Committee considered carefully whether we should seek shareholder approval for a new policy at the AGM in 2018. The primary principle of our remuneration policy remains to support the company’s strategy, which is focused on delivering sustainable performance and the creation of value over the long term for our stakeholders. The remuneration of our Executive Directors is closely tied to the achievement of annual and longer-term objectives, while remaining sensitive to the shareholder experience.
We concluded that we are able to operate within our current policy, which we believe underpins the company’s strategic objectives and maintains an appropriate relationship between pay and performance. The policy has worked well in 2017 to provide the right framework�to�reflect�strategy�and�execution�priorities,�while�also�allowing us to address the concerns raised by our shareholders as expressed at last year’s AGM and also on subsequent engagement.
Conclusion
Pearson is undergoing substantial change as the business delivers on digital transformation and continuous improvements in efficiency,�while�addressing�the�needs�of�all�our�stakeholders.� This demands a strong leadership, whom we need to reward appropriately in the context of the performance of the business, while remaining mindful of the investor context.
My conversations with shareholders have been invaluable in understanding a range of perspectives and I thank those shareholders who engaged with us. Your feedback has helped us to simplify and balance our remuneration approach and to increase the transparency you need. I look forward to receiving your support at our AGM in May 2018 and to continuing the dialogue.
Elizabeth Corley Chairman of Remuneration Committee
14 March 2018
Summary of key Committee actions and decisions
2017 actions Comprehensive and multi-phased investor engagement
30% reduction in LTIP award levels
Reduction in LTIP threshold vesting level from 25% to 18% of maximum
LTIP subject to stretching targets set above market consensus expectations at the time
AIP based on challenging targets with no benefit�from�buyback�or�currency�movement
Maximum payout would require maximum performance on each individual component and outperformance on any one element cannot compensate for others
Discretionary downward adjustment to remove�benefit�of�tax�rate�reduction
Further reduction in outcomes
2018 decisions LTIP awards maintained at same reduced level as 2017
AIP�and�LTIP�measures�simplified�and� adjusted in the light of investor feedback
Stretching LTIP targets, disclosed prospectively�for�first�time�at�Pearson
Salary increases of 2.5%, in line with employees. First increases for three years
Shareholding guidelines now extended to post-retirement
Reduced pension policy for new hires
Remuneration overview

94 Pearson plc Annual report and accounts 2017
Our remuneration policy was approved by shareholders at the AGM held on 5 May 2017 (and can be found in the Governance section of our website Pearson.com/governance). The table below summarises the key elements of
the remuneration framework for Directors as set out in our Policy, including how we intend to implement it in 2018 and the changes being introduced as a result of our recent review (see remuneration overview for further context).
Our Executive remuneration framework and how we will implement it in 2018
Key features of each Policy element
Motivate the achievement of annual business goals aligned to financial�and�strategic�imperatives
Performance measures, weightings and targets are set annually by the Committee to ensure continued alignment with strategy
Each AIP component is independent. For the CEO to achieve the maximum overall payout (180%) would require maximum performance on each individual component and outperformance on any one element cannot compensate for others
Performance metrics linked to strategic imperatives are selected to support Pearson’s transformation strategy. A payout will only be made if a minimum level of performance has been achieved under the financial�metrics
Stretching performance targets are fully disclosed in the annual remuneration report for the relevant�financial�year
Malus and clawback provisions apply
2018 implementation/changes
Maximum opportunity unchanged for 2018:
180% of base salary for the CEO
170% of base salary for the CFO
Performance metrics and associated weightings:
For 2018, the following balanced mix�of�financial�and�strategic�measures will be usedOperating�Profit�(40%) The�two�profit�based�measures�previously�included�(Operating�Profit�
and EPS) will be replaced with a single�Operating�Profit�measure�which will determine 40% of the outcome of the plan
We have also made minor adjustments to the weightings of the other performance measures:
Sales (20%) Operating Cash Flow (20%) Strategic Measures (20%)
Targets will be disclosed in the 2018 directors’ remuneration report
Annual incentive plan
Key features of each Policy element
Fixed pay�which�reflects�the�level, role, skills, experience, the competitive market and individual contribution
Under the Policy, base salary increases will not ordinarily exceed 10% per annum
Salary review takes into account a range of factors, including: the level of increases made across the company as a whole; particular circumstances such as changes in role, responsibilities or organisation; the remuneration and level of increases for Executives in similar positions in comparable companies; general economic and market conditions; and individual performance
2018 implementation/changes
Salaries effective 1 April 2018:
John Fallon: £799,800 (+2.5%)
Coram Williams: £527,900 (+2.5%)
When reviewing salaries, the committee took into account the level of increases made across the company (which were 2.5% across the UK) as a whole, business and individual performance, and general economic and market conditions.
Key features of each Policy element
Allowances and benefits which reflect�the�local�competitive�market and can include travel and�health-related�benefits�
The total value of allowances and benefits for Executive Directors will not ordinarily exceed 15% of base salary in any year
2018 implementation/changes
Unchanged for 2018.
Base salary
Allowances and benefits
Key features of each Policy element
Current Executive Directors are members of the Final Pay section of The Pearson Pension Plan, which is closed to new members. Additional cash allowances may apply�in�specific�circumstances�
New appointments are eligible to join the Money Purchase section of The Pearson Pension Plan and receive contributions of up to 16% of pensionable salary (up to the�earnings�limit�of�£154,200�for�2017/18) or may receive a cash allowance of up to 26% of salary
2018 implementation/changes
There will be no changes to the pension provision of the existing Executive Directors.
With effect from 2018, the maximum cash allowance for any future Executive Director external appointments will be reduced from 26% to 16% of salary.
Retirement benefits

95Section 4 Governance/Remuneration
Key features of each Policy element
Drive long-term earnings, share price growth and value creation
Align the interests of Executives and shareholders
Awards are made annually, and vest based on performance against stretching targets measured over a three-year performance period
An additional two-year holding period applies following vesting
The Committee will determine the performance measures, weightings and targets governing an award prior to grant to ensure continuing alignment with strategy and to ensure that targets�are�sufficiently�stretching
Malus and clawback provisions apply
2018 implementation/changes
Awards will be made at the same reduced level as in 2017:
275% of base salary for the CEO 245% of base salary for the CFO
Performance metrics, weightings and targets: EPS (one-third)
Vesting schedule (% max) EPS for FY20
15% 65p
65% 68p
100% 80p
ROIC (one-third)
Vesting schedule (% max) ROIC for FY20
15% 5%
65% 6%
100% 8%
Relative TSR (one-third)
Vesting schedule (% max)
Ranked position versus FTSE 100
25% Median
100% Upper quartile
Note: Straight line vesting in between points shown, with no vesting for performance below threshold
Long-term incentive plan
Key features of each Policy element
Align the interests of Executives and shareholders and encourage long-term shareholding and commitment to the company
Executive Directors are expected to build up a substantial shareholding in the company. The target holding is 300% of salary for the Chief Executive
and 200% of salary for other Executive Directors
Executive Directors have five�years�from�the�date� of appointment to reach the guideline
2018 implementation/changes
With�effect�from�2018,�shareholding guidelines for Executive Directors will be extended post-retirement
Executive Directors will be required to retain half of the current guideline for a period of two years post-retirement in respect of shares vested from company incentive plans.
Key features of each Policy element
The Chairman is paid a single fee for all of his responsibilities
The Non-Executive Directors are paid a basic fee. The Chairmen and members of the main Board Committees and the Senior Independent Director are paid an�additional�fee�to�reflect�their�extra responsibilities
The Chairman and Non-Executive Directors receive no�other�pay�or�benefits,� except for reimbursement of expenses, and do not participate in incentive plans
A minimum of 25% of the Chairman’s and Non-Executive Directors’ basic fee is paid in shares
2018 implementation/changes
There will be no changes to fees for 2018:
Role Fees for 2018
Chairman of the Board £500,000
Base fee for Non-Executive Directors £70,000
Additional SID fee £22,000
Role Chair Member
Audit Committee £27,500 £15,000
Remuneration Committee £22,000 £10,000
Nomination & Governance Committee £15,000 £8,000
Reputation & Responsibility Committee £13,000 £6,000
Non-Executive fees
Shareholding guidelines
Our Executive framework and how we will implement it in 2018

96 Pearson plc Annual report and accounts 2017
2017 remuneration report
Certain parts of this report have been audited as required by the Large and Medium-sized Companies and Groups (Accounts and Reports) Regulations 2008 as amended. Those tables which have been subject to audit are marked with an asterisk.
Single total figure of remuneration and prior year comparison*
Total�aggregate�emoluments�for�executive�and�non-executive�directors�were�£4,067m�in�2017.�These�emoluments�are�included�within�the�total�employee�benefit�expense�in�note�5�to�the�financial�statements�(p138).�
Executive Directors
The�remuneration�received�by�Executive�Directors�in�respect�of�the�financial�years�ended�31�December�2017�and�31�December�2016�is�set�out below.
Executive Director remuneration
Element of remuneration £000s
John Fallon Coram Williams
2017 2016 2017 2016
Base salary 780 780 515 515
Allowances and benefits 45 85 39 53
Annual incentives 624 343 412 193
Long-term incentives 0 0 0 –
Retirement benefits 309 310 52 47
Total remuneration 1,758 1,518 1,018 808
Notes to single figure table
Base salary
The�base�salary�shown�in�the�single�figure�table�reflects�salary� paid�in�the�financial�year.
Allowances and benefits
Travel�benefits�comprise�company�car,�car�allowance,�private�use� of a driver and reimbursements of a taxable nature resulting from business�travel�and�engagements.�Health�benefits�comprise�healthcare, health assessment and gym subsidy. In addition to the above�benefits�and�allowances,�Executive�Directors�may�also�participate�in�company�benefit�or�policy�arrangements�that�have�no�taxable�value.�The�allowances�and�benefits�figure�for�2016�reflects�what�was�reported�in�the�single�figure�table�in�the�2016�report.�However,�the�figure�includes�an�amount�in�respect�of�certain�risk�benefits�which�do�not�form�part�of�John�Fallon’s�taxable�benefits� and�so�that�amount�(being�£35k�in�2016)�has�not�been�included�in�the�corresponding�figure�for�2017.
The breakdown is as follows for 2017:
John Fallon
Coram Williams
Travel 43 37
Healthcare 2 2
Annual incentives
Annual incentives for the directors are funded by Pearson global annual�financial�and�non-financial�KPIs,�and�pay-outs�take�into�account individual performance against personal objectives. For more detail, see below.
Long-term incentives
The�single�figure�of�remuneration�for�2017�includes�all�long-term�incentive awards that were subject to a performance condition where the performance period ended at 31 December 2017. In 2017, the performance conditions for the 2015 Long-Term Incentive Plan (LTIP) were not met and so this award will not vest in 2018.
Retirement benefits
Further�detail�on�retirement�benefits�is�presented�later�in� this report.

97Section 4 Governance/Remuneration
Executive Directors’ annual incentive payments for 2017
Based on performance against targets, in 2017 the CEO achieved a bonus outcome of 61% of maximum and the CFO achieved a bonus outcome of 58% of maximum. The Remuneration Committee exercised its discretion and reduced these outcomes by 5% to account for the exceptional change in the tax rate during the year so that�the�Executive�Directors�did�not�benefit�from�this.�This�resulted�in a bonus outcome of 56% of maximum for the CEO and 53% of maximum for the CFO.
The Remuneration Committee then moved to consider the bonus outcomes in the context of the shareholder experience in the year. Mindful of this experience, and the work still to be done, the Executive Directors, along with the Committee, have agreed it would not be appropriate to take the full bonus and that a further reduction in outcomes was appropriate. The Committee commends the Executive Directors for their approach in these matters and confirmed�that�we�should�further�reduce�the�bonus�outcome�based�on the following considerations:
The degree of stretch in the targets set relative to plan was considered�and�the�Committee�were�satisfied�that�the�targets� were appropriately calibrated;
��Outcomes�against�the�targets�were�a�reflection�of�the� performance of the company in the year and were a fair and reasonable outcome;
Management is making tangible progress in executing the strategy but, at the time of the Committee’s deliberations, this was not fully reflected�in�the�share�price;
A change in dividend policy resulted in a reduced payout of a proposed 17p;
2017 performance provides a solid foundation from which to build and positions the company well for a return to growth in 2018.
As a result, the annual bonus payable to the CEO for 2017 is 44% of maximum and for the CFO is 47% of maximum.
Overall outcome and discretionary adjustment
Performance measure % of total
Performance range
Actual results
CEO payout CFO payout
Threshold Target Max
% of max bonus
opportunity % of salary
% of max bonus
opportunity % of salary
Operating�profit 22.5% £535m £579m £661m £576m 11.5% 21% 11% 18%
Group EPS 22.5% 45.6p 48.0p 55.7p 54.1p 20.5% 37% 20% 34%
Sales 15% £4,572m £4,635m £4,728m £4,513m 0% 0% 0% 0%
Operating�cash�flow 15% £460m £506m £598m £669m 15% 27% 15% 26%
Strategic measures 25%See performance against strategic
measures table over page 14% 25% 12% 21%
100%Performance
outcome 61% 110% 58% 99%
Notes:– Targets have been re-stated on a constant currency basis using the average 2017 exchange rate.–�Any�share�buybacks�did�not�benefit�Group�EPS�bonus�outcomes�for�the�year.–��At�Threshold,�the�payout�is�15%�of�maximum.�At�Target,�the�payout�is�55%�of�maximum�for�the�CEO�(reflecting�his�on-target�bonus�of�100%�of�salary)�and� 50%�of�maximum�for�the�CFO�(reflecting�his�on-target�bonus�of�85%�of�salary).�
CEO payout CFO payout
% of max bonus
opportunity % of salary
% of max bonus
opportunity % of salary
Group EPS adjusted to remove benefit of tax rate reduction
Shareholders�benefited�from�a�significant�reduction�in�the�effective�corporate�tax�rate�in�2017�from� 21% budgeted to 11%. However, for the purposes of the bonus calculation, the Committee used the budgeted rate. This resulted in a reduction in the total bonus outcome as shown:
56%(-5%)
101%(-9%)
53%(-5%)
90%(-9%)
Further discretionary adjustment
Whilst�the�Committee�were�satisfied�that�the�targets�were�appropriately�calibrated�and�that�the�outcomes�were�reflective�of�the�performance�in�the�year,�in�light�of�the�work�still�to�be�done,�and�the�recent�shareholder experience, the Executive Directors along with the Committee agreed it would not be appropriate to take the full bonus and that a further reduction in outcomes was appropriate.
44%(-12%)
80%(-21%)
47%(-6%)
80%(-10%)
2017 remuneration report

98 Pearson plc Annual report and accounts 2017
2017 remuneration report
Performance against strategic measuresThe targets (and outcomes) for performance against each of the strategic measures are shown in the table and supporting narrative below, with the outcome for each Executive Director shown in the table on the previous page.
Strategic measure% of total funding Threshold Target Max Outcome
Delivery of efficiency and cost savings Measured by cost savings budgeted in 2018 Operating Plan through restructuring delivered in 2017 and underpinned by progress on The Enabling Programme (TEP)
10% 95% of Plan cost savings budgeted for 2018
Plan cost savings budgeted for 2018
110% of Plan cost savings budgeted for 2018
Management made encouraging progress, exceeding expected cost savings budgeted for 2018,�as�well�as�realising�£15m�of�cost�savings�earlier than expected in 2017.
Much of the savings will come from the simplification�of�the�technology�architecture�under TEP, which allows the increased use of shared service centres enabling us to standardise processes and reduce headcount.
Driving digital agenda Delivery of key strategic milestones in support of accelerating digital transformation through the Global Learning Platform (GLP) and progress in US higher education courseware total net digital sales (NDS) in 2017
10% Some key milestones on track and hold NDS
Key milestones on track and achieve Plan NDS
All milestones on track and improve on Plan NDS by 5%
Management are on track with digital transformation, delivering a strong performance on NDS, which grew by 9% in the year. There has been continued investment in the Global Learning Platform (GLP) and innovative product and future pipeline. A further 210 new institutions were signed to Inclusive Access (Direct Digital Access) in 2017, taking the total to over 500 institutions. During the year, over 1m course enrolments were delivered in this way.
Grow market share in our primary market US higher education courseware (25% of revenues) as measured by Management Practice Inc. (MPI)/American Association of Publishers (AAP) net sales for 2017
5% 40.0% 41.0% 41.5% Achieved US higher education courseware 2017 market share of 41% as reported by MPI and in the upper half of the c40-41.5% range seen�over�the�last�five�years.
Overall 25% With management outperforming against some of the strategic targets set for 2017, and achievement against plan for others, the Committee felt overall that an on-target outcome was a fair result under the strategic measures for 2017. This translates to a pay-out of 25% of salary for the CEO and 21% of salary for the CFO as shown on the previous page.
Note:��If�an�element�of�judgement�was�required�to�assess�achievements�that�were�not�completely�quantifiable,�Internal�Audit�provided�an�independent�assessment� to the Committee.
Long-term incentives awarded in 2017*
One�of�the�significant�changes�that�we�made�in�2017�was�to�reduce�the grant of long-term incentives made to the Executive Directors in the year by approximately 30%. This substantial reduction demonstrates a responsible approach to the operation of remuneration arrangements for our Executive Directors as the company goes through the current transformation of the business.
The Remuneration Committee has decided that we will maintain the same approach for LTIP awards to be made in 2018. Therefore, the 2018 awards will be made with the same face value as those in 2017. We have also reduced the proportion of these awards that will vest for threshold performance from 25% to 18% of the award.
Director Date of award Vesting date Number of shares Face value Face value
(% of base salary)
Value for threshold
performance (% of maximum) Perfomance Period
John Fallon 11 September 17 1 May 20 366,000 £2,144,760 275% 18% 1 Jan 17–31 Dec 19
Coram Williams 11 September 17 1 May 20 215,000 £1,259,900 245% 18% 1 Jan 17–31 Dec 19
Face value was determined using a share price of 586p (previous trading day closing price as at the date of grant).
The awards will vest on 1 May 2020 subject to the following performance conditions. Any shares which vest will be subject to an additional two-year holding period to 1 May 2022.

99Section 4 Governance/Remuneration
Details of the performance targets for the 2017 long-term incentive awards are set out in the tables below.
Earnings per share (EPS) (40%) Return on invested capital (ROIC) (30%) Relative total shareholder return (TSR) (30%)
Vesting schedule (% max) Adjusted EPS for FY19 Vesting schedule (% max) Adjusted ROIC for FY19 Vesting schedule (% max) Ranked position vs FTSE 100
15% 55p 15% 4.5% 25% Median
75% 62p 75% 5.5% 100% Upper quartile
100% 75p or above 100% 7.5% or above
Note 1: Straight-line vesting will occur in between the points shown, with no vesting for performance below threshold.
Note 2: Pearson’s total shareholder return performance is measured relative to the constituents of the FTSE 100 Index over the performance period.
Directors’ interests in shares and value of shareholdings
Shareholding guidelines
Executive Directors are expected to build up a substantial shareholding in the company in line with the policy of encouraging widespread employee share ownership and to align further the interests of Executive Directors and shareholders. The target holding is 300% of salary for the Chief Executive and 200% of salary for the other Executive Directors. Shares that count towards these guidelines include any shares held unencumbered by an Executive Director, their spouse and/or dependent children plus any shares vested but held pending release under a share plan. Executive Directors�have�five�years�from�the�date�of�appointment�to�reach� the guideline. Once the guideline has been met, it is not retested, other than when shares are sold.
With�effect�from�2018,�shareholding�guidelines�for�Executive�Directors have been extended post-retirement. Executive Directors are required to retain half of the current guideline for a period of two years post-retirement in respect of shares vested from company incentive plans.
The shareholding guidelines do not apply to the Chairman and Non-Executive Directors. However, a minimum of 25% of the basic Non-Executive Directors’ fee is paid in Pearson shares that the Non-Executive Directors have committed to retain for the period of their directorships.
Directors’ interests*
The share interests of the Directors and their connected persons are as follows:
Director
Current shareholding
(ordinary shares)at 31 Dec 17
Conditional shares at 31 Dec 17
Total number of ordinary and
conditional shares at 31 Dec 17
Guideline (% salary) Guideline met?
Chairman
Sidney Taurel 78,677 – – – –
Executive Directors
John Fallon 326,784 749,000 1,075,784 300% Yes
Coram Williams 15,010 437,000 452,010 200% n/a (see note 4)
Non-Executive Directors
Elizabeth Corley 8,066 – – – –
Vivienne Cox 5,263 – – – –
Josh Lewis 11,033 – – – –
Linda Lorimer 6,977 – – – –
Harish Manwani 14,151 – – – –
Tim Score 17,285 – – – –
Lincoln Wallen 4,423 – – – –
Note 1: The current value of the Executive Directors’ shareholdings is based on the closing market value of Pearson shares of 725p on 1 March 2018 against base salaries at 31 December 2017.
Note 2: Ordinary shares include both ordinary shares listed on the London Stock Exchange and American Depositary Receipts (ADRs) listed on the New York Stock Exchange.�The�figures�include�both�shares�and�ADRs�acquired�by�individuals�under the long-term incentive plan and any legacy share plans they might have participated in.
Note 3: Conditional shares means unvested shares which remain subject to performance�conditions�and�continuing�employment�for�a�pre-defined�period. Note 4: Coram�Williams�has�five�years�from�the�date�of�his�appointment�as�an�Executive Director to reach the shareholding guideline. Note 5: There have been no changes in the interests of any director between 31 December 2017 and 12 March 2018, being the latest practicable date prior to the publication of this report.
2017 remuneration report

100 Pearson plc Annual report and accounts 2017
2017 remuneration report
Movements in Directors’ interests in share awards during 2017*
PlanDate
of awardVesting
date
Number of shares
as at 1 Jan 2017 Awarded Released Lapsed
Number of shares as at 31 Dec 2017 Status
John Fallon
LTIP 11 September 2017 1 May 2020 0 366,000 366,000 Outstanding subject to performance
3 May 2016 3 May 2019 383,000 383,000 Outstanding subject to performance
1 May 2015 1 May 2018 230,000 230,000 Lapses in 2018
Total 613,000 366,000 0 230,000 749,000
Coram Williams
LTIP 11 September 2017 1 May 2020 0 215,000 215,000 Outstanding subject to performance
3 May 2016 3 May 2019 222,000 222,000 Outstanding subject to performance
1 Aug 2015 1 Aug 2018 129,000 129,000 Lapses in 2018
Total 351,000 215,000 0 129,000 437,000
Note 1: Released means where shares have been transferred to participants.
Note 2: TSR is measured relative to the constituents of the FTSE World Media Index for 2015 and 2016 LTIP awards. For the LTIP awards granted in 2017, TSR is measured relative to the constituents of the FTSE 100.
Note 3: The performance targets for the 2015 award were not met and therefore this award will lapse in 2018.
Note 4: Coram Williams’ 2015 award was made on his appointment to the Board on 1 August 2015 and will vest three years from this date on 1 August 2018, subject to the same performance conditions and holding periods as for other Executives.
Note 5: The share price did not reach the 2014 worldwide save for shares option price�of�£8.112�during�the�maturity�period�so�John�Fallon’s�award�exercisable�in�2017 lapsed.
Performance targets for outstanding awards under the Long-Term Incentive Plan (LTIP)
The status of outstanding awards under the Long-Term Incentive Plan (LTIP) as described in the table above is set out in the following table.
Date of award
Share price on date
of awardVesting
datePerformance
measures WeightingPerformance
periodPayout at threshold
Payout at maximum
11 September 2017 586.0p 1 May 2020 Relative TSR 30% 1 Jan 2017 to 31 Dec 2019 25% at median 100% at upper quartile
ROIC 30% 2019 15% for ROIC of 4.5% 100% for ROIC of 7.5%
EPS 40% 2019 15% for EPS 55p 100% for EPS 75p
3 May 2016 805.0p 3 May 2019 Relative TSR 1/6 1 Jan 2016 to 31 Dec 2018 25% at median 100% at upper quartile
ROIC 1/3 2018 25% for ROIC of 5.5% 100% for ROIC of 6.7%
EPS 1/2 2018 25% for EPS 61.4p 100% for EPS 78.3p
Executive Directors’ retirement benefits and entitlements
Details�of�the�Directors’�pension�entitlements�and�pension-related�benefits�during�the�year�are�as�follows:�
Director
Value of defined benefit over the period
£000s
Other allowances in lieu of pension
£000s
Total annual value in 2017
£000s
Accrued pension at 31 Dec 17
£000s
John Fallon 106 203 309 103
Coram Williams 52 52 32
Note 1: The accrued pension at 31 December 2017 is the deferred pension to which the member would be entitled on ceasing pensionable service on 31 December 2017. It relates to the pension payable from the UK plan. Normal retirement age is 62.
Note 2: The�value�of�defined�benefit�over�the�period�comprises�the�defined�benefit�input�value,�less�inflation,�less�individual�contribution.
Note 3: Other allowances in lieu of pension represent the cash allowances paid in lieu of the previous FURBS arrangements.
Note 4: Total annual value is the sum of the previous two columns and is disclosed�in�the�single�figure�of�remuneration�table.

101Section 4 Governance/Remuneration
Plans
John Fallon – The Pearson Group Pension Plan Accrual rate of 1/30th of pensionable salary per annum, restricted to the�plan�earnings�cap�(£154,200�per�annum�in�2017/18).�
John�attained�the�maximum�service�accrual�for�this�benefit�when�he�reached�20�years’�service�in�October�2017.�With�effect�from�this�date�he�had�accrued�a�benefit�of�two-thirds�of�his�final�pensionable�salary�and�no�further�service-related�benefits�can�accrue�under�the�Plan.�Based�on�the�2017/2018�earnings�cap�of�£154,200,�he�will�have�accrued�a�pension�of�£102,800�per�annum�at�this�time.�When�the�earnings cap under the Plan rules is increased in the future in line with�increases�in�the�UK�retail�price�index,�his�final�salary�pension�benefit�will�increase�accordingly.�
In addition, he received a taxable and non-pensionable cash supplement (of 26% of salary) in lieu of the previous FURBS arrangement.�There�are�no�enhanced�early�retirement�benefits.
Coram Williams – The Pearson Group Pension Plan Accrual rate of 1/60th of pensionable salary per annum, restricted to�the�plan�earnings�cap�(£154,200�per�annum�in�2017/18),�with�continuous service with a service gap. There are no enhanced early retirement�benefits.
Chairman and Non-Executive Director remuneration*
The�remuneration�paid�to�the�Chairman�and�Non-Executive�Directors�in�respect�of�the�financial�years�ended�31�December�2017�and� 31 December 2016 are as follows:
Director £000s
2017 2016
Salary/ basic fee
Committee chairmanship
Committee membership SID
Taxable benefits Total
Salary/ basic fee
Committee chairmanship
Committee membership SID
Taxable benefits Total
Sidney Taurel 500 – – – 12 512 500 – – – 16 516
Elizabeth Corley 70 22 20 – 0 112 70 22 – – 0 92
Vivienne Cox 70 10 21 22 3 126 70 10 25 22 3 130
Josh Lewis 70 – 15 – 59 144 70 – 15 – 10 95
Linda Lorimer 70 12 15 – 5 102 70 – 20 – 4 94
Harish Manwani 70 – 11 – 4 85 70 – 5 – 3 78
Tim Score 70 28 15 – 0 113 70 28 10 – 3 111
Lincoln Wallen 70 – 21 – 6 97 70 – 13 – 3 86
Total 990 72 118 22 89 1,291 990 60 88 22 42 1,202
Note 1: A�minimum�of�25%�of�the�Chairman’s�and�Non-Executive�Directors’�basic�fee�is�paid�in�shares,�effective�from�the�2017�AGM�policy�approval. Note 2: Taxable�benefits�refer�to�travel,�accommodation�and�subsistence�expenses�incurred�while�attending�Board�meetings�during�2017�that�were�paid�or�reimbursed�by the company which are deemed by HMRC to be taxable in the UK. The amounts in the table above include the grossed-up cost of UK tax to be paid by the company on�behalf�of�the�Directors.�Josh�Lewis’s�tax�position�has�changed�now�that�he�has�been�a�non-executive�director�of�Pearson�for�more�than�five�years�(as�of�March�2016)�with�a�consequential�increase�in�the�taxable�value�of�the�expenses�he�incurs�visiting�the�UK�for�board�meetings.�As�such,�the�taxable�benefits�figure�in�the�table�above� is�materially�higher�than�last�year’s�figure�and�the�figures�for�other�non-executive�directors.
Payments to former Directors
There were no payments made to former Directors in 2017.
Payments for loss of office
There�were�no�payments�for�loss�of�office�made�to�or�agreed�for�Directors in 2017.
Executive Directors’ Non-Executive directorships
Coram Williams is engaged as a NED of Guardian Media Group plc. He�received�fees�of�£37,750�during�2017�in�respect�of�this�role.�His�current�remuneration�is�at�the�rate�of�£39,000�p.a.�since�1�April�2017�when became chair of the audit committee. In accordance with our policy, Coram is permitted to retain these fees.
Historical performance and remuneration
Total shareholder return performance
We set out on the next page Pearson’s total shareholder return (TSR) performance relative to the FTSE All-Share index on an annual basis over the nine-year period 2008 to 2017. This comparison has been chosen because the FTSE All-Share represents the broad market index within which Pearson shares are traded. TSR is the measure of the returns that a company has provided for its shareholders, reflecting�share�price�movements�and�assuming�reinvestment�of�dividends (source: Datastream).
In accordance with the reporting regulations, this section also presents�Pearson’s�TSR�performance�alongside�the�single�figure� of total remuneration for the CEO over the last nine years and a summary of the variable pay outcomes relative to the prevailing maximum at the time.
2017 remuneration report

102 Pearson plc Annual report and accounts 2017
2017 remuneration report
Total shareholder return £ Pearson TSRFTSE All-share TSR
50
100
150
200
250
300
2017201620152014201320122011201020092008
CEO remuneration Marjorie Scardino John Fallon
Total remuneration (single�figure,�£000s)� 6,370 8,466 8,340 5,330 1,727 1,895 1,263 1,518 1,758
Annual incentive (% of maximum) 91.3% 92.1% 75.7% 24.2% 34.3% 50.5% Nil 24.4% 44.4%
Long-term incentive (% of maximum) 80.0% 97.5% 68.3% 36.7% Nil Nil Nil Nil Nil
Annual incentive is the actual annual incentive received by the incumbent as a percentage of maximum opportunity.
Long-term incentive�is�the�payout�of�performance-related�restricted�shares�under�the�LTIP�where�the�year�shown�is�the�final�year�of�the�performance�period�for� the�purposes�of�calculating�the�single�total�figure�of�remuneration.
Total remuneration�is�as�reflected�in�the�single�total�figure�of�remuneration�table.
John Fallon’s total remuneration opportunity is lower than that of the previous incumbent. Variable payouts under the annual and Long-Term Incentive Plans reflect�performance�for�the�relevant�periods.
Comparative information
The following information is intended to provide additional context regarding the total remuneration for Executive Directors.
Relative percentage change in remuneration for CEO
The following table sets out the change between 2016 and 2017 in three elements of remuneration for the CEO, in comparison with the average for all employees. While the Committee reviews base pay for the CEO relative to the broader employee population, benefits�are�driven�by�local�practices�and�eligibility�is�determined� by level and individual circumstances which do not lend themselves to comparison.
Change in CEO remuneration 2016/17
Base salary Allowances and benefits Annual incentives
no change �47% (see note 1) 82%
Change in employee remuneration 2016/17
Base salary Allowances and benefits Annual incentives
2% 5% �45% (see note 2)
Note 1: The�above�percentages�relating�to�the�CEO�reflect�the�figures�as�shown� in�the�single�figure�table�on�page�96.�If�the�risk�benefits�are�excluded�from�the�allowances�and�benefits�figure�for�2016�(see�the�notes�to�the�single�figure�table� on page 96), the relevant percentage would be -10%.
Note 2: The�figures�for�all�employees�reflect�average�salaries�and�average�employee numbers each year at constant exchange rates. The change in annual incentives�is�an�aggregate�figure�which�includes�all�incentive�arrangements�across the company, including sales incentives. The equivalent year-on-year figure�for�the�staff�annual�incentive�plan�for�those�eligible�in�2017�was�+127%.

103Section 4 Governance/Remuneration
Relative importance of pay spend
The Committee considers Directors’ remuneration in the context of the�company’s�allocation�and�disbursement�of�resources�to�different�stakeholders.�In�particular,�we�chose�operating�profit�because�this� is a measure of our ability to reinvest in the company. We include dividends because these constitute an important element of our return to shareholders.
All figures in £ millions 2017 2016
Change
£m %
Adjusted�operating�profit 576 635 -59 -9%
Dividends 318 424 -106 -25%
Total wages and salaries 1,567 1,661 -94 -6%
Note 1: Adjusted�operating�profit�is�as�set�out�in�the�financial�statements.�
Note 2: Wages and salaries include continuing operations only and include Directors. Average employee numbers for continuing operations for 2017 were 30,339 (2016: 32,719). Further details are set out in note 5 to the financial�statements�on�p138.
Dilution and use of equity
Pearson can use existing shares bought in the market, treasury shares or newly issued shares to satisfy awards under the company’s various share plans. For restricted stock awards under the LTIP, the company would normally expect to use existing shares.
There are limits on the amount of new-issue equity we can use. In any rolling ten-year period, no more than 10% of Pearson equity will be issued, or be capable of being issued, under all Pearson’s share plans, and no more than 5% of Pearson equity will be issued, or be capable of being issued, under Executive or discretionary plans. The headroom available for all Pearson plans, executive or discretionary, and shares held in trust is as follows:
Headroom 2017
All Pearson plans 8.4%
Executive or discretionary plans 5%
Shares held in trust 4.3%
The Remuneration Committee in 2017
Role Name Title
Chairman Elizabeth Corley Independent Non-Executive DirectorsJosh Lewis
Tim Score
Sidney Taurel Chairman of the Board
Internal attendeesJohn Fallon Chief Executive
Coram Williams Chief�Financial�Officer
Melinda Wolfe Chief Human Resources Officer�(to�May�2017)
Kate Bishop Interim Chief Human Resources�Officer� (from June 2017)
Stuart Nolan SVP, Reward
Stephen Jones Company Secretary
External advisers Willis Towers Watson (to June 2017)
Deloitte LLP (appointed in July 2017)
Sidney Taurel was a member of the Committee throughout 2017 as permitted under the UK Corporate Governance Code.
Advisers to the Remuneration Committee
During 2017, the Remuneration Committee undertook a formal tender process, the outcome of which resulted in Deloitte LLP being appointed as independent Remuneration Committee advisers in July 2017. Deloitte LLP supplied the Committee with advice on current market trends and developments, incentive plan design and target setting, investor engagement and other general executive remuneration matters. In respect of their services to the Committee, Deloitte LLP were paid fees, which were charged on�a�time�spent�basis,�of�£165,000.�Deloitte�LLP�were�founding�members of the Remuneration Consultants’ Group and adhere to its code of conduct.
During the year, Deloitte LLP also provided Pearson PLC with certain tax and other advisory and consultancy services.
The Committee also received advice from Willis Towers Watson, which supplied survey data and advice on market trends, long-term incentives and other general remuneration matters. During the year, Willis Towers Watson was paid fees for advice to the Committee, which�were�charged�on�a�time�spent�basis,�of�£87,000.Willis�Towers�Watson�also�advised�the�company�on�health�and�welfare�benefits�in�the US and provided consulting advice directly to certain Pearson operating companies.
The�Committee�remains�satisfied�that�advice�provided�by� both Deloitte LLP and Willis Towers Watson was objective and independent and that the provision of other services in no way compromised their independence.
2017 remuneration report

104 Pearson plc Annual report and accounts 2017
2017 remuneration report
Remuneration Committee meeting focus during 2017
Area of responsibility Activities
Market Noted Willis Towers Watson’s and subsequently Deloitte’s overview of the current remuneration and governance environment.
Received a number of updates on changes to the corporate governance environment for executive compensation.
Performance Received input from the Audit Committee, Internal Audit and from management on the financial�performance�of�the�business and progress against strategic measures. Received input from Investor Relations on market consensus expectations.
Noted and reviewed the status of outstanding long-term incentive awards based on the current view of likely Pearson financial�performance.
Reviewed the approach to the Annual Incentive Plan for Pearson executive management and the Management Incentive Plan for senior leaders.
Noted and reviewed the status of the 2016–2017 talent retention arrangements and impact on voluntary turnover.
Implementation Reviewed and approved a pay freeze for 2017 for the Executive Directors and annual salary increases for Pearson executive management and senior leaders.
Reviewed and approved 2016 annual incentive plan payouts for the Executive Directors, Pearson executive management and senior leaders.
Reviewed and approved 2017 individual annual incentive opportunities for the Executive Directors and Pearson Executive management.
Reviewed and approved 2017 Pearson annual incentive plan targets including a detailed review�of�financial�and� non-financial�targets.�
Approved nil payout under 2014 long-term incentive plan awards.
Reviewed and approved 2017 long-term incentive awards for the Executive Directors and Pearson executive management, including the quantum of awards.
Noted 2017 long-term incentive awards for senior leaders and managers below Pearson executive management
Considered shareholder feedback and market consensus for setting 2017 long-term incentive performance conditions. Further consideration of investor feedback and experience prior to granting of awards.
Noted remuneration packages for new appointments to the Pearson executive management team and termination arrangements for leavers
Noted the deployment of 2016-17 retention arrangements and�effectiveness�of�the�arrangements in the retention of critical talent.
Governance Noted the activity of the standing Committee of the Board in relation to the operation of the company’s equity-based reward programmes.
Noted company’s use of equity for employee share plans.
Conducted an evaluation of the Committee’s performance.
Conducted a formal process to review the provision of external independent advice to the Committee.
Policy Considered the Director’s Remuneration Policy for approval by shareholders at the 2017 AGM.
Reviewed�and�reconfirmed�the�operation of the Policy for 2018.
Disclosure and engagement
Considered feedback from Committee Chairman’s meetings with key shareholders and proxy bodies during 2017.
Reviewed and approved 2016 Directors’ remuneration report
Noted shareholder feedback on 2016 Directors’ remuneration report.
Reviewed 2017 Annual General Meeting season, shareholder voting and engagement strategy.
Noted template and outline of 2017 Directors’ remuneration report and shareholder engagement strategy.

105Section 4 Governance/Remuneration
Terms of reference
The Committee’s full charter and terms of reference are available on the Governance page of the company’s website. A summary of the Committee’s responsibilities is set out below.
Committee responsibilities:
Determine and review policy
Determine and regularly review the remuneration policies for the Executive Directors, the presidents and other members of the Pearson Executive management (who report directly to the CEO), and overview the approach for the senior leadership group. These policies include base salary, annual and long-term incentives, pension�arrangements,�any�other�benefits�and�termination� of employment.
Shareholder engagement
Ensure the company maintains an appropriate level of engagement with its shareholders and shareholder representative bodies in relation to the remuneration policy and its implementation.
Review and approve implementation
Regularly review the implementation and operation of the remuneration policy for Executive management and approve the�individual�remuneration�and�benefits�packages�of�the� Executive Directors.
Approve performance related plans
Approve the design of, and determine targets for, any performance- related pay plans operated by the Group for Pearson Executive management and approve the total payments to be made under such plans.
Review long-term plans
Review the design of the company’s long-term incentive and other share plans operated by the Group and where relevant recommend such plans for approval by the Board and shareholders.
Set termination arrangements
Advise�and�decide�on�general�and�specific�arrangements� in connection with the termination of employment of Executive Directors.
Review targets
Review and approve corporate goals and objectives relevant to Executive Directors’ remuneration and evaluate the Executive Directors’ performance in light of those goals and objectives.
Determine Chairman’s remuneration
Delegated responsibility for determining the remuneration and benefits�package�of�the�Chairman�of�the�Board.
Appoint remuneration consultants
Appoint and set the terms of engagement for any remuneration consultants who advise the Committee and monitor the cost of such advice.
Committee evaluation
In 2017, the Committee evaluation was undertaken by Heidrick & Struggles JCA Group as part of the wider board evaluation process. The�responses�illustrated�an�effective�Committee,�which�uses�its�time well and has an appropriate focus on the key issues. The key findings�were:
��The�Committee�is�seen�to�be�working�effectively�on�the�whole,� led well by its Chair with an appropriate agenda and a strong work ethic from each member of the Committee.
Meetings are run well and in a disciplined manner.
Succession for the role of Committee chair should be borne in mind with future Non-Executive Director appointments, although this is not immediately pressing.
Some consideration might be given to ensuring there is minimal duplication with other Committees (e.g. gender pay could fall under both Reputation & Responsibility Committee and the Remuneration Committee depending on the outcomes of the UK Corporate Governance Code review), or how duplication will be handled so as not to create any unnecessary work.
Voting at the 2017 AGM
The following table summarises the details of votes cast in respect of the remuneration resolutions at the 2017 AGM.
% of votes cast for% of votes cast
against Votes withheld
2017 Remuneration Policy vote
68.8% (404,615,934)
31.2% (183,100,737) 43,738,267
Annual remuneration votes
34.4% (202,512,759)
65.6% (385,996,157) 42,945,685
Following the 2017 AGM result, as part of our commitment to an ongoing dialogue, we have continued to engage actively with our investors to seek feedback on the reasons for the voting outcome. A number of our shareholders believed that there was a disconnect between�pay�and�performance�for�2016�and�this�was�reflected�in� the voting outcome on the resolutions on remuneration. Since last year’s AGM, Pearson has sought to address this in a number of ways that are explained in the remuneration overview section of this report. We appreciate and have acknowledged that feedback and are grateful to those shareholders who engaged with us.
The Directors’ remuneration report has been approved by the Board on 14 March 2018 and signed on its behalf by:
Elizabeth Corley Chairman of Remuneration Committee
2017 remuneration report

106 Pearson plc Annual report and accounts 2017
Additional disclosures
Pages 62–109 of this document comprise the Directors’ report for the year ended 31 December 2017.
Set out below is other statutory and regulatory information that Pearson is required to disclose in its Directors’ report.
Going concern
The Directors have made an assessment of the Group’s ability to continue as a going concern and consider it appropriate to adopt the going concern basis of accounting.
Viability statement
As set out on p60, the Board has also reviewed the prospects of Pearson over the three-year period to December 2020 taking account of the company’s strategic plans, a ‘severe but plausible’ downside case and further stress testing based on the principal risks set out on p50–60.
Based on the results of these procedures, and considering the company’s strong balance sheet, the Directors have a reasonable expectation that Pearson will be able to continue in operation and meet its liabilities as they fall due over the three-year period ending December 2020. Further details of the Group’s liquidity are shown in Financial review (see p34–40).
Share capital
Details of share issues and cancellations are given in note 27 to the consolidated financial statements on p170. The company has a single class of shares which is divided into ordinary shares of 25p each. The ordinary shares are in registered form. As at 31 December 2017, 802,053,752 ordinary shares were in issue. At the AGM held on 5 May 2017, the company was authorised, subject to certain conditions, to acquire up to 82,258,685 ordinary shares by market purchase. Shareholders will be asked to renew this authority at the AGM on 4 May 2018.
Share buyback
In July, we announced the sale of a 22% stake in Penguin Random House to Bertelsmann and recapitalisation of the business, generating total net proceeds of approximately $1bn.
The partial divestment of our stake in Penguin Random House was in line with our strategy for simplification and allowed us to crystallise some of the significant shareholder value created through our successful partnership with Bertelsmann over the prior four years.
We have set out clear capital allocation priorities as follows:
1. Maintaining a strong balance sheet and solid investment grade credit ratings through an appropriate capital structure. Accordingly, we intend to maintain a year end net debt/EBITDA of less than 1.5x
2. Simplifying our portfolio and investing in the business to drive sustainable organic growth
3. Delivering shareholder returns through a sustainable and progressive dividend policy, returning surplus cash to shareholders where appropriate through buybacks or special dividends.
In line with those priorities, the Board decided that we would use the proceeds from the transaction to maintain a strong balance sheet and invest in our business in addition to returning £300m of surplus capital to shareholders following the closing of the transaction.
The Board considered investor views on preferred methods of cash return, the amount being returned and other factors and concluded a share buyback was the most appropriate methodology to return that capital to our shareholders at that time.
We launched a £300m share buyback, beginning on 18 October 2017 and completed the programme on 16 February 2018 repurchasing a total of 42,835,577 shares at an average price of 700p. The reduction in average shares outstanding as a result of the buyback increased 2017 adjusted earnings per share (EPS) by less than 1%, but will have a larger impact on 2018 adjusted EPS.
Major shareholders
Information provided to the company pursuant to the Financial Conduct Authority’s Disclosure and Transparency Rules (DTR) is published on a Regulatory Information Service and on the company’s website.
As at 31 December 2017, the company had been notified under DTR 5 of the following holders of significant voting rights in its shares.
Number of voting
rights
Percentage as at date of notification
Schroders plc 108,691,682 13.63%
Silchester International Investors LLP 89,160,115 11.18%
Lindsell Train Limited 41,393,237 5.17%
Ameriprise Financial, Inc. and its group 41,236,375 5.02%
Libyan Investment Authority1 24,431,000 3.01%
1. Based on notification to the Company dated 7 June 2010. We have been notified of no change to this holding since that date. Assets belonging to, or owned, held or controlled on 16 September 2011 by the Libyan Investment Authority and located outside Libya on that date, are frozen in accordance with Article 5(4) of Regulation 2016/44 of the Council of the European Union.
Between 31 December 2017 and 14 March 2018, being the latest practicable date before the publication of this report, the company received further notifications under DTR 5, with the most recent positions being as follows:
Schroders plc disclosed a holding of 14.04%
Silchester International Investors LLP disclosed a holding of 11.14%.
Annual General Meeting
The notice convening the AGM, to be held at 12 noon on Friday 4 May 2018 at IET London, 2 Savoy Place, London WC2R 0BL, is contained in a circular to shareholders to be dated 28 March 2018.
Registered auditors
In accordance with section 489 of the Act, a resolution proposing the reappointment of PricewaterhouseCoopers LLP as auditors to the company will be proposed at the AGM, at a level of remuneration to be agreed by the Audit Committee.

107Section 4 Governance/Additional disclosures
Amendment to Articles of Association
Any amendments to the Articles of Association of the company (the Articles) may be made in accordance with the provisions of the Act by way of a special resolution.
Rights attaching to shares
The rights attaching to the ordinary shares are defined in the Articles. A shareholder whose name appears on the company’s register of members can choose whether his/her shares are evidenced by share certificates (i.e. in certificated form) or held electronically (i.e. uncertificated form) in CREST (the electronic settlement system in the UK).
Subject to any restrictions below, shareholders may attend any general meeting of the company and, on a show of hands, every shareholder (or his/her representative) who is present at a general meeting has one vote on each resolution and, on a poll, every shareholder (whether an individual or a corporation) present in person or by proxy shall have one vote for every 25p of nominal share capital held. A resolution put to the vote at a general meeting is decided on a show of hands unless before, or on the declaration of the result of, a vote on a show of hands, a poll is demanded. A poll can be demanded by the Chairman of the meeting, or by at least three shareholders (or their representatives) present in person and having the right to vote, or by any shareholders (or their representatives) present in person having at least 10% of the total voting rights of all shareholders, or by any shareholders (or their representatives) present in person holding ordinary shares on which an aggregate sum has been paid up of at least 10% of the total sum paid up on all ordinary shares. At this year’s AGM, voting will again be conducted on a poll, consistent with best practice.
Shareholders can declare a final dividend by passing an ordinary resolution but the amount of the dividend cannot exceed the amount recommended by the Board. The Board can pay interim dividends on any class of shares of the amounts and on the dates and for the periods they decide. In all cases the distributable profits of the company must be sufficient to justify the payment of the relevant dividend.
The Board may, if authorised by an ordinary resolution of the shareholders, offer any shareholder the right to elect to receive new ordinary shares, which will be credited as fully paid, instead of their cash dividend.
Any dividend which has not been claimed for 12 years after it became due for payment will be forfeited and will then belong to the company, unless the Directors decide otherwise.
If the company is wound up, the liquidator can, with the sanction of a special resolution passed by the shareholders, divide among the shareholders all or any part of the assets of the company and he/she can value assets and determine how the division shall be carried out as between the shareholders or different classes of shareholders. The liquidator can also, with the same sanction, transfer the whole or any part of the assets to trustees upon such trusts for the benefit of the shareholders.
Voting at general meetings
Any form of proxy sent by the shareholders to the company in relation to any general meeting must be delivered to the company (via its registrars), whether in written or electronic form, not less than 48 hours before the time appointed for holding the meeting or adjourned meeting at which the person named in the appointment proposes to vote.
The Board may decide that a shareholder is not entitled to attend or vote either personally or by proxy at a general meeting or to exercise any other right conferred by being a shareholder if he/she or any person with an interest in shares has been sent a notice under section 793 of the Act (which confers upon public companies the power to require information with respect to interests in their voting shares) and he/she or any interested person failed to supply the company with the information requested within 14 days after delivery of that notice. The Board may also decide, where the relevant shareholding comprises at least 0.25% of the nominal value of the issued shares of that class, that no dividend is payable in respect of those default shares and that no transfer of any default shares shall be registered.
Pearson operates an employee benefit trust to hold shares, pending employees becoming entitled to them under the company’s employee share plans. There were 5,993,536 shares held as at 31 December 2017. The trust has an independent trustee which has full discretion in relation to the voting of such shares. A dividend waiver operates on the shares held in the trust.
Pearson also operates two nominee shareholding arrangements which hold shares on behalf of employees. There were 2,561,000 shares held in the Sharestore account and 432,375 shares held in the Global Nominee account as at 31 December 2017. The beneficial owners of shares held in Sharestore are invited to submit voting instructions online at www.shareview.co.uk and Global Nominee participants are invited to submit voting instructions by e-mail to [email protected]. If no instructions are given by the beneficial owner by the date specified, the trustees holding these shares will not exercise the voting rights.
Transfer of shares
The Board may refuse to register a transfer of a certificated share which is not fully paid, provided that the refusal does not prevent dealings in shares in the company from taking place on an open and proper basis. The Board may also refuse to register a transfer of a certificated share unless: (i) the instrument of transfer is lodged, duly stamped (if stampable), at the registered office of the company or any other place decided by the Board, and is accompanied by the certificate for the share to which it relates and such other evidence as the Board may reasonably require to show the right of the transferor to make the transfer; (ii) it is in respect of only one class of shares; and (iii) it is in favour of not more than four transferees.
Transfers of uncertificated shares must be carried out using CREST and the Board can refuse to register a transfer of an uncertificated share in accordance with the regulations governing the operation of CREST.
Additional disclosures

Pearson plc Annual report and accounts 2017108
Variation of rights
If at any time the capital of the company is divided into different classes of shares, the special rights attaching to any class may be varied or revoked either:
(i) With the written consent of the holders of at least 75% in nominal value of the issued shares of the relevant class or
(ii) With the sanction of a special resolution passed at a separate general meeting of the holders of the shares of the relevant class.
Without prejudice to any special rights previously conferred on the holders of any existing shares or class of shares, any share may be issued with such preferred, deferred or other special rights, or such restrictions, whether in regard to dividend, voting, return of capital or otherwise as the company may from time to time by ordinary resolution determine.
Appointment and replacement of Directors
The Articles contain the following provisions in relation to Directors:
Directors shall be no less than two in number. Directors may be appointed by the company by ordinary resolution or by the Board. A Director appointed by the Board shall hold office only until the next AGM and shall then be eligible for reappointment, but shall not be taken into account in determining the Directors or the number of Directors who are to retire by rotation at that meeting. The Board may from time to time appoint one or more Directors to hold Executive office with the company for such period (subject to the provisions of the Act) and upon such terms as the Board may decide and may revoke or terminate any appointment so made.
The Articles provide that, at every AGM of the company, at least one-third of the Directors shall retire by rotation (or, if their number is not a multiple of three, the number nearest to one-third). The first Directors to retire by rotation shall be those who wish to retire and not offer themselves for re-election. Any further Directors so to retire shall be those of the other Directors subject to retirement by rotation who have been longest in office since they were last re-elected but, as between persons who became or were last re-elected on the same day, those to retire shall (unless they otherwise agree among themselves) be determined by lot. In addition, any Director who would not otherwise be required to retire shall retire by rotation at the third AGM after they were last re-elected.
Notwithstanding the provisions of the Articles, the Board has resolved that all Directors should offer themselves for re-election annually, in accordance with the Code.
The company may by ordinary resolution remove any Director before the expiration of his/her term of office. In addition, the Board may terminate an agreement or arrangement with any Director for the provision of his/her services to the company.
Powers of the Directors
Subject to the Articles, the Act and any directions given by special resolution, the business of the company will be managed by the Board who may exercise all the powers of the company, including powers relating to the issue and/or buying back of shares by the company (subject to any statutory restrictions or restrictions imposed by shareholders in general meeting).
Significant agreements
The following significant agreements contain provisions entitling the counterparties to exercise termination or other rights in the event of a change of control of the company:
Under the $1,750,000,000 revolving credit facility agreement dated August 2014 which matures in August 2021 between, among others, the company, Barclays Bank plc (Agent) and the banks and financial institutions named therein as lenders (the Facility), any such bank may, upon a change of control of the company, require its outstanding advances, together with accrued interest and any other amounts payable in respect of such Facility, and its commitments, to be cancelled, each within 60 days of notification to the banks by the Agent. For these purposes, a ‘change of control’ occurs if the company becomes a subsidiary of any other company, or one or more persons acting either individually or in concert obtains control (as defined in section 1124 of the Corporation Tax Act 2010) of the company.
Shares acquired through the company’s employee share plans rank pari passu with shares in issue and have no special rights. For legal and practical reasons, the rules of these plans set out the consequences of a change of control of the company.
Additional disclosures

Section 4 Governance/Additional disclosures 109
Other statutory information
Other information that is required by the Companies Act 2006 (the Act) to be included in the Directors’ report, and which is incorporated by reference, can be located as follows:
Summary disclosures index See more
Dividend recommendation p35
Financial instruments and financial risk management p156–158
Important events since year end p40
Future development of the business p8–32
Research and development activities p22–23
Employment of disabled persons p28
Employee involvement p25–28
Greenhouse gas emissions p29
With the exception of the dividend waiver described on p107, there is no information to be disclosed in accordance with Listing Rule 9.8.4.
No political donations or contributions were made or expenditure incurred by the company or its subsidiaries during the year.
Fair, balanced and understandable reporting and disclosure of information
As required by the Code, we have established arrangements to ensure that all information we report to investors and regulators is fair, balanced and understandable. A process and timetable for the production and approval of this year’s report was agreed by the Board at its meeting in December 2017. The full Board then had opportunity to review and comment on the report as it progressed.
Representatives from financial reporting, corporate affairs, company secretarial, legal and internal audit, compliance and risk are involved in the preparation and review of the annual report to ensure a cohesive and balanced approach and, as with all of our financial reporting, our Verification Committee conducts a thorough verification of narrative and financial statements. We also have procedures in place to ensure the timely release of inside information, through our Market Disclosure Committee.
The Audit Committee is also available to advise the Board on certain aspects of the report, to enable the Directors to fulfil their responsibility in this regard. The Directors consider that the annual report and accounts, taken as a whole, is fair, balanced and understandable and provides the information necessary for shareholders to assess the company’s position and performance, business model and strategy.
The Directors also confirm that, for each Director in office at the date of this report:
So far as the Director is aware, there is no relevant audit information of which the Group and company’s auditors are unaware
They have taken all the steps that they ought to have taken as Directors in order to make themselves aware of any relevant audit information and to establish that the Group and the company’s auditors are aware of that information.
Directors in office
The following Directors were in office during the year and up until signing of the financial statements:
E P L Corley H Manwani
V Cox T Score
J J Fallon S Taurel
S J Lewis L Wallen
L K Lorimer C Williams
M M Lynton (appointed 1 February 2018)
The Directors’ report has been approved by the Board on 14 March 2018 and signed on its behalf by:
Stephen Jones Company Secretary
Additional disclosures

Pearson plc Annual report and accounts 2017110
Statement of Directors’ responsibilities
Statement of Directors’ responsibilities
The Directors are responsible for preparing the annual report and the financial statements in accordance with applicable law and regulation.
Company law requires the Directors to prepare financial statements for each financial year. Under that law the Directors have prepared the Group and company financial statements in accordance with International Financial Reporting Standards (IFRSs) as adopted by the European Union. Under company law the Directors must not approve the financial statements unless they are satisfied that they give a true and fair view of the state of affairs of the Group and company and of the profit or loss of the Group and company for that period. In preparing the financial statements, the Directors are required to:
Select suitable accounting policies and then apply them consistently
State whether applicable IFRSs as adopted by the European Union have been followed for the Group and company financial statements, subject to any material departures disclosed and explained in the financial statements
Make judgements and accounting estimates that are reasonable and prudent
Prepare the financial statements on the going concern basis unless it is inappropriate to presume that the Group and company will continue in business.
The Directors are responsible for keeping adequate accounting records that are sufficient to show and explain the Group and company’s transactions and disclose with reasonable accuracy at any time the financial position of the Group and company and enable them to ensure that the financial statements and the Directors’ Remuneration Report comply with the Companies Act 2006 and, as regards the group financial statements, Article 4 of the IAS Regulation.
The Directors are also responsible for safeguarding the assets of the Group and company and hence for taking reasonable steps for the prevention and detection of fraud and other irregularities.
The Directors are responsible for the maintenance and integrity of the company’s website. Legislation in the United Kingdom governing the preparation and dissemination of financial statements may differ from legislation in other jurisdictions.
Each of the Directors, whose names and functions are listed on p64–65, confirms that, to the best of their knowledge:
The Group financial statements, which have been prepared in accordance with IFRSs as adopted by the European Union, give a true and fair view of the assets, liabilities, financial position and profit of the Group
The strategic report contained in the annual report includes a fair review of the development and performance of the business and the position of the Group and company, together with a description of the principal risks and uncertainties that it faces.
This responsibility statement has been approved by the Board on 14 March 2018 and signed on its behalf by:
Coram Williams Chief Financial Officer

111
Financial statements
Consolidated financial statements112 Independent auditor’s report to the
members of Pearson plc 118 Consolidated income statement 119 Consolidated statement of
comprehensive income 120 Consolidated balance sheet 122 Consolidated statement of changes
in equity 123 Consolidated cash flow statement
Notes to the consolidated financial statements124 1 Accounting policies132 2 Segment information136 3 Restructuring costs136 4 Operating expenses138 5 Employee information138 6 Net finance costs139 7 Income tax141 8 Earnings per share143 9 Dividends143 10 Property, plant and equipment144 11 Intangible assets148 12 Investments in joint ventures
and associates150 13 Deferred income tax151 14 Classification of financial instruments153 15 Other financial assets153 16 Derivative financial instruments154 17 Cash and cash equivalents
(excluding overdrafts)155 18 Financial liabilities – borrowings156 19 Financial risk management
159 20 Intangible assets – pre-publication159 21 Inventories160 22 Trade and other receivables161 23 Provisions for other liabilities
and charges161 24 Trade and other liabilities162 25 Retirement benefit and other
post-retirement obligations168 26 Share-based payments170 27 Share capital and share premium170 28 Treasury shares171 29 Other comprehensive income172 30 Business combinations172 31 Disposals including business closures173 32 Held for sale174 33 Cash generated from operations175 34 Contingencies176 35 Commitments176 36 Related party transactions177 37 Events after the balance sheet date177 38 Accounts and audit exemptions
Company financial statements178 Company balance sheet 179 Company statement of changes in equity 180 Company cash flow statement 181 Notes to the company financial statements
190 Five-year summary
192 Financial key performance indicators
196 Shareholder information
In this section
Financial statements
111Section 5 Financial statements

Pearson plc Annual report and accounts 2017112
Independent auditor’s report to the members of Pearson plcReport on the audit of the financial statements
Our opinion
In our opinion, Pearson Plc’s Group financial statements and parent company financial statements (the “financial statements”): give a true and fair view of the state of the Group’s and of the parent company’s affairs as at 31 December 2017 and of the Group’s profit and the Group’s and the parent company’s cash flows for the year then ended; have been properly prepared in accordance with IFRSs as adopted by the European Union and, as regards the parent company’s financial statements, as applied in accordance with the provisions of the Companies Act 2006; and have been prepared in accordance with the requirements of the Companies Act 2006 and, as regards the Group financial statements, Article 4 of the IAS Regulation.
We have audited the financial statements, included within the Annual Report and accounts (the “Annual Report”), which comprise: the Group and parent company balance sheets as at 31 December 2017; the Group’s income statement and statement of comprehensive income, the Group and parent company statements of cash flows, and the Group and parent company statements of changes in equity for the year then ended; and the notes to the financial statements, which include a description of the significant accounting policies.
Our opinion is consistent with our reporting to the Audit Committee.
Basis for opinion
We conducted our audit in accordance with International Standards on Auditing (UK) (“ISAs (UK)”) and applicable law. Our responsibilities under ISAs (UK) are further described in the Auditors’ responsibilities for the audit of the financial statements section of our report. We believe that the audit evidence we have obtained is sufficient and appropriate to provide a basis for our opinion.
Independence
We remained independent of the Group in accordance with the ethical requirements that are relevant to our audit of the financial statements in the UK, which includes the FRC’s Ethical Standard, as applicable to listed public interest entities, and we have fulfilled our other ethical responsibilities in accordance with these requirements.
To the best of our knowledge and belief, we declare that non-audit services prohibited by the FRC’s Ethical Standard were not provided to the Group or the parent company.
Other than those disclosed in note 4 to the financial statements, we have provided no non-audit services to the Group or the parent company in the period from 1 January 2017 to 31 December 2017.
The scope of our audit
As part of designing our audit, we determined materiality and assessed the risks of material misstatement in the financial statements. In particular, we looked at where the directors made subjective judgements, for example in respect of significant accounting estimates that involved making assumptions and considering future events that are inherently uncertain.
We gained an understanding of the legal and regulatory framework applicable to the Group and the industry in which it operates, and considered the risk of acts by the Group which were contrary to applicable laws and regulations, including fraud. We designed audit procedures to respond to the risk, recognising that the risk of not detecting a material misstatement due to fraud is higher than the risk of not detecting one resulting from error, as fraud may involve deliberate concealment by, for example, forgery or intentional misrepresentations, or through collusion. We designed audit procedures that focused on the risk of non-compliance related to the Companies Act 2006, the Listing Rules, and applicable tax legislation in the countries in which Pearson operates. Our tests included, but were not limited to, review of the financial statement
Our audit approach Overview
Overall Group materiality: £22m (2016: £23m), based on 4% of adjusted operating profit, adjusted for net finance costs. Overall parent company materiality: £20m (2016: £21m), 1% of net assets capped below Group materiality We conducted work in four key territories: US, UK, Brazil and China. In addition, we obtained an audit opinion on the financial information reported by the associate Penguin Random House. The territories where we conducted audit procedures, together with work performed at corporate functions and at the consolidated Group level, accounted for approximately: 67% of the Group’s revenue; 62% of the Group’s profit before tax; and 60% of the Group’s adjusted profit before tax. Revenue recognition including risk of fraud (Group). Carrying values of goodwill and intangible assets (Group). Returns provisions (Group). Nature and presentation of non-trading items (Group). Provisions for uncertain tax liabilities (Group). Recoverability of pre-publication assets (Group). Major transactions (Group and parent). Retirement benefits and other post-retirement obligations (Group).
Materiality
Audit scope
Areas offocus

Section 5 Financial statements 113
disclosures to underlying supporting documentation, review of correspondence with legal advisors and tax authorities, enquiries of management, review of significant component auditors’ work and review of internal audit reports in so far as they related to the financial statements. We did not identify any key audit matters relating to irregularities, including fraud. As in all of our audits we also addressed the risk of management override of internal controls, including testing journals and evaluating whether there was evidence of bias by the directors that represented a risk of material misstatement due to fraud.
Key audit matters
Key audit matters are those matters that, in the auditors’ professional judgement, were of most significance in the audit of the financial statements of the current period and include the most significant assessed risks of material misstatement (whether or not due to fraud) identified by the auditors, including those which had the greatest effect on: the overall audit strategy; the allocation of resources in the audit; and directing the efforts of the engagement team. These matters, and any comments we make on the results of our procedures thereon, were addressed in the context of our audit of the financial statements as a whole, and in forming our opinion thereon, and we do not provide a separate opinion on these matters. This is not a complete list of all risks identified by our audit.
Key audit matter How our audit addressed the key audit matter
Revenue recognition including risk of fraudThere are two types of complex contracts that require significant judgements and estimates, which could be subject to either accidental errors or deliberate fraud:
Multiple element arrangements, such as the sale of physical textbooks accompanied by digital content or supplementary workbooks, where revenue is recognised for each element as if it were an individual contractual arrangement requiring the estimation of its relative fair value; Certain long-term contracts that span year end, where revenue is recognised using estimated percentage of completion based on costs. These include contracts to design, develop and deliver testing and accreditation, and contracts to secure students and support the online delivery of their teaching.
These complex contracts generate material deferred revenue and accrued income balances and are areas where misstatements in the underlying assumptions or estimation calculations could have a material effect on the financial statements.
In addition, there are material shipments towards the period end from major distribution locations giving rise to the potential risk of a cut-off error.
Where books are sold together with workbooks delivered later or companion digital materials available online, we assessed the basis for allocation of the purchase price between each element based on individual contractual arrangements, and then tested the detailed calculations supporting the revenue deferral calculations. This included validating adjustments for the extent of user take up in relation to digital content to underlying support. We found the revenue deferrals to be based on reasonable estimates of the relative fair value of each element and to be properly and consistently calculated.
For a selection of the larger, more judgemental and more recent long-term contracts, covering both testing activities and online delivery of teaching, we read the contracts and assessed the accounting methodologies being applied to calculate the proportion of revenue being recognised. We also tested costs incurred to date and management’s estimates of forecast costs and revenues by reference to historical experience and current contract status.
Additionally, we have performed manual journals testing focusing on unusual or unexpected entries to revenue as well as unexpected users.
Our testing showed that revenue recognition practices are in accordance with Group policies and related accounting standards with appropriate methods for calculating the revenue recognised. Refer to the returns provision areas of focus for our work over the risk of cut-off.
Carrying values of goodwill and intangible assetsThe Group recorded goodwill of £2,030m and intangible assets of £934m at 31 December 2017, including software, acquired customer lists, contracts and relationships, acquired trademarks and brands and acquired publishing rights.
The Group recorded an impairment charge of £2,548m at 31 December 2016 against the North America CGU. The carrying values of goodwill and intangible assets are dependent on future cash flows of the underlying CGUs and there is a risk that if management does not achieve these cash flows it could give rise to further impairment. This risk increases in periods when the Group’s trading performance and projections do not meet prior expectations, such as in 2016.
The impairment reviews performed by management contain a number of significant judgements and estimates. Changes in these assumptions can result in materially different impairment charges or available headroom.
We obtained management’s fair value less costs of disposal impairment model and tested and evaluated the reasonableness of key assumptions, including CGU identification; operating cash flow forecasts and key inputs to these forecasts; the appropriateness of the inclusion of restructuring cost savings; perpetuity growth rates; and discount rates.
We tested the mathematical integrity of the forecasts and carrying values in management’s impairment model and confirmed that management’s estimate of each CGU’s recoverable amount is appropriately based on the higher of fair value less costs of disposal and value-in-use. Our procedures have been focused on the North America and Core CGUs.
We agreed the forecast cash flows to board-approved budgets, assessed how these budgets are compiled and understood key judgements and estimates within them, including short-term growth rates, cost allocations and restructuring costs and related savings.
We used valuations specialists to assess the perpetuity growth rate and discount rate for each CGU by comparison with third-party information, past performance and relevant risk factors. We also considered management’s estimate of disposal costs for reasonableness.
We performed our own sensitivity analyses to understand the impact of reasonable changes in the key assumptions. We agree with management’s decision to provide additional disclosures and sensitivities in note 11 of the financial statements, in relation to the North America and Core CGUs.
Independent auditor’s report to the members of Pearson plc

114 Pearson plc Annual report and accounts 2017
Independent auditor’s report to the members of Pearson plc
Key audit matter How our audit addressed the key audit matter
Returns provisionsThe Group has provided £170m for sales returns at 31 December 2017. The most significant exposure to potential returns within Pearson arises in the US higher education courseware business. Trends in this business, such as the growth of textbook rentals and the availability of free on-line content continue to affect this market and have the potential to impact returns levels if shipping practices and arrangements with retailers are not managed by Pearson in response to these trends: for example, returns in the first half of 2016 were higher and more volatile than had been anticipated.
Management provides for returns based on past experience by customer and channel, using a three year average method.
We assessed management’s evaluation of the trends in the market and their responses (including changed incentive arrangements and shipping practices) and considered whether management’s methodology and three year averaging remained appropriate. We were satisfied that this was the case. We tested the returns provision calculations at 31 December 2017 and agreed inputs such as historical sales and returns experience to underlying records
We performed detailed testing over shipment and returns levels around the year end in particular at major shipping locations in the US and UK and evaluated whether these gave rise to an increased risk of future returns. We concluded that management had adopted methods and reached estimates for future returns that were supportable and appropriate.
Nature and presentation of non-trading itemsIn May 2017, management announced a further three year restructuring plan to the one announced in 2016, to continue to simplify the business and focus further on their global education strategy. As a result, management recorded a restructuring charge of £79m during 2017.
Given the significance of this programme, management has excluded these costs from their adjusted profit measure in addition to certain other items which have been excluded on a consistent basis with prior years.
There is a risk that inappropriate costs might be excluded from the underlying operating cost base in such a restructuring programme, and that the disclosures around the items excluded from adjusted performance measures might not be clear and transparent.
We identified no material adjustments in relation to the recording of the restructuring costs. We noted that for the majority of these items there was clear evidence to support the fact that they have arisen as a direct consequence of the Group’s restructuring plans. There are certain costs where the classification as restructuring is subjective due to the circumstances in which they have arisen. Based on the audit evidence obtained, we have been able to conclude that, although subjective, there are valid arguments for associating these costs with the restructuring activities undertaken and therefore the classification is reasonable.
We also considered the extent and clarity of the Group’s reconciliations between the statutory and adjusted measures and the related explanations. We were satisfied that these were appropriate and consistent with the nature of the underlying items.
Provisions for uncertain tax liabilitiesThe Group is subject to several tax regimes due to the geographical diversity of its businesses. At 31 December 2017 the Group had provisions for uncertain tax positions of £280m (see note 7).
Management is required to exercise significant judgement in determining the appropriate amount to provide in respect of potential tax exposures and uncertain tax provisions. The most significant of these relate to US tax.
Changes in assumptions about the views that might be taken by tax authorities can materially impact the level of provisions recorded in the financial statements.
We engaged our tax experts in support of our audit of tax and obtained an understanding of the Group’s tax strategy and risks. We recalculated the Group’s tax provisions and determined whether the treatments adopted were in line with the Group’s tax policies and had been applied consistently.
We evaluated the key underlying assumptions, particularly in the US and UK. In doing this, we considered the status of tax authority audits and enquiries. We considered the basis and support, in particular for provisions not subject to tax audit, in comparison with our experience for similar situations.
We also evaluated the consistency of management’s approach to establishing or changing prior provision estimates and validated that changes in prior provisions reflected a change in facts and circumstances.
We are satisfied that management’s provision estimates for uncertain tax positions were prepared on a consistent basis with the prior year and were adequately supported.
We also evaluated the disclosures in note 7 in relation to uncertain tax provisions, and were satisfied that the disclosures were consistent with the underlying positions and with the requirements of IAS 1.
Recoverability of pre-publication assetsThe Group has £988m of pre-publication assets at 31 December 2017 including £247m recorded in businesses classified as held for sale (see below). Pre-publication assets represent direct costs incurred in the development of education platforms, programmes and titles prior to their public release.
Judgement is required to assess the recoverability of the carrying value of these assets; this is further complicated by the transition to digital as the Group invests in new, less proven, inter-linked digital content and platforms.
We assessed the appropriateness of capitalisation and amortisation policies and selected a sample of costs deferred to the balance sheet as pre-publication assets to test their magnitude and appropriateness for capitalisation and the appropriateness of amortisation profiles against sales forecasts, including considering the impact of the transition towards digital products.
We challenged the carrying value of certain pre-publication assets where products are yet to be launched, are less proven, or where sales are lower than originally anticipated.
We assessed forecast cash flows against historical experience and obtained supporting evidence for management’s explanations. Where the pre-publication assets formed part of a held for sale business we also considered the evidence supporting the expected disposal proceeds exceeding the carrying value of those assets.
We found the Group’s policies to be appropriate and consistently applied. Whilst the carrying value of some assets depends on future sales growth, overall we considered the year end carrying values to be supported and in line with the Group’s policy.

115Section 5 Financial statements
Key audit matter How our audit addressed the key audit matter
Major transactionsThe Group has disposed of both a 22% share in its investment in the Penguin Random House associate and Global Education during 2017. Pre-tax gains on disposal of £96m and £44m have been recorded respectively on these disposals. Pearson continues to hold a 25% share in Penguin Random House.
Additionally, at 31 December 2017 the K-12 and Wall Street English businesses have been classified as held for sale. Therefore assets of £760m and liabilities of £588m have been classified as held for sale on the face of the balance sheet. Management have recorded the held for sale assets at the lower of carrying value and fair value less costs to dispose. No impairments were recorded on classification of the businesses as held for sale.
We obtained and reviewed the sale agreements and evidence of proceeds received for both disposals. We also reviewed the contractual agreements to assess the accounting treatment and classification of proceeds and the gains on disposal of both Penguin Random House and Global Education. We consider the accounting treatment to be appropriate and the gains to have been appropriately calculated and disclosed.
We have obtained evidence to support the held for sale determination including (for WSE) a signed sale agreement and (for K-12) supporting Board approval and evidence in support of a well advanced sales process. From the evidence we have obtained we were satisfied that both K-12 and Wall Street English have been appropriately measured and classified as held for sale at 31 December 2017.
Retirement benefits and other post-retirement obligationsThe Group operates a number of defined benefit and defined contribution retirement plans throughout the world. The total fair value of plan assets is £3,492m and the total present value of defined benefit obligations is £2,973m. The largest plan is the Pearson Group Pension Plan in the UK (UK Group plan) which has a net surplus of £545m.
There have been a number of changes to the UK Group plan in the period including increased contributions; an update to certain actuarial assumptions; and the purchase of two insurance buy-in policies covering approximately £1.2bn of its total liabilities. Given the size of the UK Group plan, changes of this nature have a material impact on the net surplus.
We assessed the appropriateness of key assumptions supporting the Group’s valuation of retirement benefit obligations with the support of our own actuarial specialists and undertook work to validate the valuation of assets.
We considered the consistency of management’s methodology with prior periods. Where changes to the basis of assumptions were made we obtained evidence in support of the revised basis, and where relevant to the changes in circumstances. Our assessment included benchmarking assumptions against our independent expected range and with other FTSE 100 companies with plans of similar duration. We consider the changes to be supportable and appropriate.
We have circularised fund managers and custodians to confirm existence of pension assets and have performed independent valuation procedures. We have not identified any significant adjustments in relation to this work.
We have reviewed contractual information and advice received from external advisers in relation to the insurance buy-in policies. We have confirmed that the accounting for these transactions is consistent with agreements entered into.
We also evaluated the disclosures in note 25 and were satisfied that they appropriately addressed key changes in the period.
How we tailored our audit scope
We tailored the scope of our audit to ensure that we performed enough work to be able to give an opinion on the financial statements as a whole, taking into account the structure of the Group and the parent company, the accounting processes and controls, and the industry in which they operate.
Overall Group materiality: £22m, which represents 4% of adjusted operating profit, adjusted for net finance costs as disclosed in note 8 to the consolidated financial statements. Refer to p116 for further details.
We conducted work in four key territories: US, UK, Brazil and China. In addition, we obtained an audit opinion on the financial information reported by the associate Penguin Random House.
The territories where we conducted audit procedures, together with work performed at corporate functions and at the consolidated Group level, accounted for approximately: 67% of the Group’s revenue; 62% of the Group’s profit before tax; and 60%% of the Group’s adjusted profit before tax.
Materiality
The scope of our audit was influenced by our application of materiality. We set certain quantitative thresholds for materiality. These, together with qualitative considerations, helped us to determine the scope of our audit and the nature, timing and extent of our audit procedures on the individual financial statement line items and disclosures and in evaluating the effect of misstatements, both individually and in aggregate on the financial statements as a whole.
Independent auditor’s report to the members of Pearson plc

116 Pearson plc Annual report and accounts 2017
Independent auditor’s report to the members of Pearson plc
Based on our professional judgement, we determined materiality for the financial statements as a whole as follows:
Group financial statements
Parent company financial statements
Overall materiality
£22m (2016: £23m). £20m (2016: £21m).
How we determined it
4% of adjusted operating profit, adjusted for net finance costs
1% of net assets capped below Group materiality
Rationale for benchmark applied
Note 8 of the financial statements explains that the Group’s principal measure of performance is adjusted operating profit (£576m), which excludes the cost of major restructuring, other net gains and losses and acquired intangible asset amortisation, in order to present results from operating activities on a consistent basis. From adjusted operating profit we deducted net finance costs of £30m (see note 8) because these mainly reflect recurring finance charges. To the resulting number we then applied 4% (rather than the usual 5%) as our materiality calculation was based on an adjusted measure.
We consider net assets to be an appropriate benchmark for a Group holding company. However we have capped this below overall Group materiality.
For each component in the scope of our Group audit, we allocated a materiality that is less than our overall Group materiality. The range of materiality allocated across components was between £3m and £18m.
We agreed with the Audit Committee that we would report to them misstatements identified during our audit above £2m (Group audit) (2016: £2m) and £2m (Parent company audit) (2016: £2m) as well as misstatements below those amounts that, in our view, warranted reporting for qualitative reasons.
Going concern
In accordance with ISAs (UK) we report as follows:
Reporting obligation Outcome
We are required to report if we have anything material to add or draw attention to in respect of the directors’ statement in the financial statements about whether the directors considered it appropriate to adopt the going concern basis of accounting in preparing the financial statements and the directors’ identification of any material uncertainties to the Group’s and the parent company’s ability to continue as a going concern over a period of at least twelve months from the date of approval of the financial statements.
We have nothing material to add or to draw attention to. However, because not all future events or conditions can be predicted, this statement is not a guarantee as to the Group’s and parent company’s ability to continue as a going concern.
We are required to report if the directors’ statement relating to Going Concern in accordance with Listing Rule 9.8.6R (3) is materially inconsistent with our knowledge obtained in the audit.
We have nothing to report.
Reporting on other information
The other information comprises all of the information in the Annual Report other than the financial statements and our auditors’ report thereon. The directors are responsible for the other information. Our opinion on the financial statements does not cover the other information and, accordingly, we do not express an audit opinion or, except to the extent otherwise explicitly stated in this report, any form of assurance thereon.
In connection with our audit of the financial statements, our responsibility is to read the other information and, in doing so, consider whether the other information is materially inconsistent with the financial statements or our knowledge obtained in the audit, or otherwise appears to be materially misstated. If we identify an apparent material inconsistency or material misstatement, we are required to perform procedures to conclude whether there is a material misstatement of the financial statements or a material misstatement of the other information. If, based on the work we have performed, we conclude that there is a material misstatement of this other information, we are required to report that fact. We have nothing to report based on these responsibilities.
With respect to the Strategic Report and Governance report, we also considered whether the disclosures required by the UK Companies Act 2006 have been included.
Based on the responsibilities described above and our work undertaken in the course of the audit, the Companies Act 2006, (CA06), ISAs (UK) and the Listing Rules of the Financial Conduct Authority (FCA) require us also to report certain opinions and matters as described below (required by ISAs (UK) unless otherwise stated).
Strategic Report and Governance report
In our opinion, based on the work undertaken in the course of the audit, the information given in the Strategic Report and Governance report for the year ended 31 December 2017 is consistent with the financial statements and has been prepared in accordance with applicable legal requirements. (CA06)
In light of the knowledge and understanding of the Group and parent company and their environment obtained in the course of the audit, we did not identify any material misstatements in the Strategic Report and Governance report. (CA06)
The directors’ assessment of the prospects of the Group and of the principal risks that would threaten the solvency or liquidity of the Group
We have nothing material to add or draw attention to regarding:
The directors’ confirmation on pages 60 and 106 of the Annual Report that they have carried out a robust assessment of the principal risks facing the Group, including those that would threaten its business model, future performance, solvency or liquidity. The disclosures in the Annual Report that describe those risks and explain how they are being managed or mitigated. The directors’ explanation on pages 60 and 106 of the Annual Report as to how they have assessed the prospects of the Group, over what period they have done so and why they consider that period to be appropriate, and their statement as to whether they have a reasonable expectation that the Group will be able to

117Section 5 Financial statements
continue in operation and meet its liabilities as they fall due over the period of their assessment, including any related disclosures drawing attention to any necessary qualifications or assumptions.
We have nothing to report having performed a review of the directors’ statement that they have carried out a robust assessment of the principal risks facing the group and statement in relation to the longer-term viability of the Group. Our review was substantially less in scope than an audit and only consisted of making inquiries and considering the directors’ process supporting their statements; checking that the statements are in alignment with the relevant provisions of the UK Corporate Governance Code (the “Code”); and considering whether the statements are consistent with the knowledge and understanding of the group and parent company and their environment obtained in the course of the audit. (Listing Rules)
Other Code Provisions
We have nothing to report in respect of our responsibility to report when:
The statement given by the directors, on page 110, that they consider the Annual Report taken as a whole to be fair, balanced and understandable, and provides the information necessary for the members to assess the Group’s and parent company’s position and performance, business model and strategy is materially inconsistent with our knowledge of the Group and parent company obtained in the course of performing our audit. The section of the Annual Report on page 76 describing the work of the Audit Committee does not appropriately address matters communicated by us to the Audit Committee. The directors’ statement relating to the parent company’s compliance with the Code does not properly disclose a departure from a relevant provision of the Code specified, under the Listing Rules, for review by the auditors.
Directors’ Remuneration
In our opinion, the part of the Directors’ Remuneration Report to be audited has been properly prepared in accordance with the Companies Act 2006. (CA06)
Responsibilities for the financial statements and the audit
Responsibilities of the directors for the financial statements
As explained more fully in the Statement of directors’ responsibilities, the directors are responsible for the preparation of the financial statements in accordance with the applicable framework and for being satisfied that they give a true and fair view. The directors are also responsible for such internal control as they determine is necessary to enable the preparation of financial statements that are free from material misstatement, whether due to fraud or error.
In preparing the financial statements, the directors are responsible for assessing the Group’s and the parent company’s ability to continue as a going concern, disclosing as applicable, matters related to going concern and using the going concern basis of accounting unless the directors either intend to liquidate the Group or the parent company or to cease operations, or have no realistic alternative but to do so.
Auditors’ responsibilities for the audit of the financial statements
Our objectives are to obtain reasonable assurance about whether the financial statements as a whole are free from material misstatement, whether due to fraud or error, and to issue an auditors’ report that includes our opinion. Reasonable assurance is a high level of assurance, but is not a guarantee that an audit conducted in accordance with ISAs (UK) will always detect a material misstatement when it exists. Misstatements can arise from fraud or error and are considered material if, individually or in the aggregate, they could reasonably be expected to influence the economic decisions of users taken on the basis of these financial statements.
A further description of our responsibilities for the audit of the financial statements is located on the FRC’s website at: www.frc.org.uk/auditorsresponsibilities. This description forms part of our auditors’ report.
Use of this report
This report, including the opinions, has been prepared for and only for the parent company’s members as a body in accordance with Chapter 3 of Part 16 of the Companies Act 2006 and for no other purpose. We do not, in giving these opinions, accept or assume responsibility for any other purpose or to any other person to whom this report is shown or into whose hands it may come save where expressly agreed by our prior consent in writing.
Other required reporting
Companies Act 2006 exception reporting
Under the Companies Act 2006 we are required to report to you if, in our opinion:
we have not received all the information and explanations we require for our audit; or adequate accounting records have not been kept by the parent company, or returns adequate for our audit have not been received from branches not visited by us; or certain disclosures of directors’ remuneration specified by law are not made; or the parent company financial statements and the part of the Directors’ Remuneration Report to be audited are not in agreement with the accounting records and returns.
We have no exceptions to report arising from this responsibility.
Appointment
Following the recommendation of the Audit Committee, we were appointed by the members on 6 February 1996 to audit the financial statements for the year ended 31 December 1996 and subsequent financial periods. The period of total uninterrupted engagement is 22 years, covering the years ended 1 January 1996 to 31 December 2017.
Stuart Newman (Senior Statutory Auditor) for and on behalf of PricewaterhouseCoopers LLP Chartered Accountants and Statutory Auditors London
14 March 2018
Independent auditor’s report to the members of Pearson plc

Pearson plc Annual report and accounts 2017118
Consolidated income statementYear ended 31 December 2017
All figures in £ millions Notes 2017 2016
Continuing operations
Sales 2 4,513 4,552
Cost of goods sold 4 (2,066) (2,093)
Gross profit 2,447 2,459
Operating expenses 4 (2,202) (2,480)
Other net gains and losses 4 128 (25)
Impairment of intangible assets 11 – (2,548)
Share of results of joint ventures and associates 12 78 97
Operating profit/(loss) 2 451 (2,497)
Finance costs 6 (110) (97)
Finance income 6 80 37
Profit/(loss) before tax 421 (2,557)
Income tax 7 (13) 222
Profit/(loss) for the year 408 (2,335)
Attributable to:
Equity holders of the company 406 (2,337)
Non-controlling interest 2 2
Earnings per share/(loss) attributable to equity holders of the company during the year
(expressed in pence per share)
– basic 8 49.9p (286.8)p
– diluted 8 49.9p (286.8)p

Section 5 Financial statements 119
Consolidated statement of comprehensive incomeYear ended 31 December 2017
All figures in £ millions Notes 2017 2016
Profit/(loss) for the year 408 (2,335)
Items that may be reclassified to the income statement
Net exchange differences on translation of foreign operations – Group (158) 910
Net exchange differences on translation of foreign operations – associates (104) 3
Currency translation adjustment disposed (51) –
Attributable tax 7 9 (5)
Fair value gain on other financial assets 13 –
Attributable tax 7 (4) –
Items that are not reclassified to the income statement
Remeasurement of retirement benefit obligations – Group 25 175 (268)
Remeasurement of retirement benefit obligations – associates 7 (8)
Attributable tax 7 (42) 58
Other comprehensive (expense)/income for the year 29 (155) 690
Total comprehensive income/(expense) for the year 253 (1,645)
Attributable to:
Equity holders of the company 251 (1,648)
Non-controlling interest 2 3

120 Pearson plc Annual report and accounts 2017
Consolidated balance sheetAs at 31 December 2017
All figures in £ millions Notes 2017 2016
Assets
Non-current assets
Property, plant and equipment 10 281 343
Intangible assets 11 2,964 3,442
Investments in joint ventures and associates 12 398 1,247
Deferred income tax assets 13 95 451
Financial assets – derivative financial instruments 16 140 171
Retirement benefit assets 25 545 158
Other financial assets 15 77 65
Trade and other receivables 22 103 104
4,603 5,981
Current assets
Intangible assets – pre-publication 20 741 1,024
Inventories 21 148 235
Trade and other receivables 22 1,110 1,357
Financial assets – marketable securities 14 8 10
Cash and cash equivalents (excluding overdrafts) 17 518 1,459
2,525 4,085
Assets classified as held for sale 32 760 –
Total assets 7,888 10,066
Liabilities
Non-current liabilities
Financial liabilities – borrowings 18 (1,066) (2,424)
Financial liabilities – derivative financial instruments 16 (140) (264)
Deferred income tax liabilities 13 (164) (466)
Retirement benefit obligations 25 (104) (139)
Provisions for other liabilities and charges 23 (55) (79)
Other liabilities 24 (133) (422)
(1,662) (3,794)

121Section 5 Financial statements
Consolidated balance sheet continuedAs at 31 December 2017
All figures in £ millions Notes 2017 2016
Current liabilities
Trade and other liabilities 24 (1,342) (1,629)
Financial liabilities – borrowings 18 (19) (44)
Current income tax liabilities (231) (224)
Provisions for other liabilities and charges 23 (25) (27)
(1,617) (1,924)
Liabilities classified as held for sale 32 (588) –
Total liabilities (3,867) (5,718)
Net assets 4,021 4,348
Equity
Share capital 27 200 205
Share premium 27 2,602 2,597
Treasury shares 28 (61) (79)
Capital redemption reserve 5 –
Fair value reserve 13 –
Translation reserve 592 905
Retained earnings 662 716
Total equity attributable to equity holders of the company 4,013 4,344
Non-controlling interest 8 4
Total equity 4,021 4,348
These financial statements have been approved for issue by the Board of Directors on 14 March 2018 and signed on its behalf by
Coram Williams Chief Financial Officer

122 Pearson plc Annual report and accounts 2017
Consolidated statement of changes in equityYear ended 31 December 2017
All figures in £ millions
Equity attributable to equity holders of the company
Non-controlling
interestTotal
equityShare
capitalShare
premiumTreasury
shares
Capital redemption
reserveFair value
reserveTranslation
reserveRetained earnings Total
At 1 January 2017 205 2,597 (79) – – 905 716 4,344 4 4,348
Profit for the year – – – – – – 406 406 2 408
Other comprehensive income/(expense) – – – – 13 (313) 145 (155) – (155)
Total comprehensive income/(expense) – – – – 13 (313) 551 251 2 253
Equity-settled transactions – – – – – – 33 33 – 33
Issue of ordinary shares under share option schemes – 5 – – – – – 5 – 5
Buyback of equity (5) – – 5 – – (300) (300) – (300)
Purchase of treasury shares – – – – – – – – – –
Release of treasury shares – – 18 – – – (18) – – –
Changes in non-controlling interest – – – – – – (2) (2) 2 –
Dividends – – – – – – (318) (318) – (318)
At 31 December 2017 200 2,602 (61) 5 13 592 662 4,013 8 4,021
All figures in £ millions
Equity attributable to equity holders of the company
Non-controlling
interestTotal
equityShare
capitalShare
premiumTreasury
shares
Capital redemption
reserveFair value
reserveTranslation
reserveRetained earnings Total
At 1 January 2016 205 2,590 (72) – – (7) 3,698 6,414 4 6,418
Loss for the year – – – – – – (2,337) (2,337) 2 (2,335)
Other comprehensive income/(expense) – – – – – 912 (223) 689 1 690
Total comprehensive income/(expense) – – – – – 912 (2,560) (1,648) 3 (1,645)
Equity-settled transactions – – – – – – 22 22 – 22
Issue of ordinary shares under share option schemes – 7 – – – – – 7 – 7
Buyback of equity – – – – – – – – – –
Purchase of treasury shares – – (27) – – – – (27) – (27)
Release of treasury shares – – 20 – – – (20) – – –
Changes in non-controlling interest – – – – – – – – (3) (3)
Dividends – – – – – – (424) (424) – (424)
At 31 December 2016 205 2,597 (79) – – 905 716 4,344 4 4,348
The capital redemption reserve reflects the nominal value of shares cancelled in the Group’s share buyback programme. The fair value reserve arises on revaluation of other financial assets. The translation reserve includes exchange differences arising from the translation of the net investment in foreign operations and of borrowings and other currency instruments designated as hedges of such investments.

123Section 5 Financial statements
Consolidated cash flow statementYear ended 31 December 2017
All figures in £ millions Notes 2017 2016
Cash flows from operating activities
Net cash generated from operations 33 462 522
Interest paid (89) (67)
Tax paid (75) (45)
Net cash generated from operating activities 298 410
Cash flows from investing activities
Acquisition of subsidiaries, net of cash acquired 30 (11) (15)
Purchase of investments (3) (6)
Purchase of property, plant and equipment (82) (88)
Purchase of intangible assets (150) (157)
Disposal of subsidiaries, net of cash disposed 31 19 (54)
Proceeds from sale of associates 31 411 4
Proceeds from sale of investments – 92
Proceeds from sale of property, plant and equipment 33 – 4
Proceeds from sale of liquid resources 20 42
Loans (advanced)/repaid by related parties (13) 14
Investment in liquid resources (18) (24)
Interest received 20 16
Dividends received from joint ventures and associates 458 131
Net cash generated from/(used in) investing activities 651 (41)
Cash flows from financing activities
Proceeds from issue of ordinary shares 27 5 7
Buyback of equity 27 (149) –
Purchase of treasury shares 28 – (27)
Proceeds from borrowings 2 4
Repayment of borrowings (1,294) (249)
Finance lease principal payments (5) (6)
Transactions with non-controlling interest – (2)
Dividends paid to company’s shareholders 9 (318) (424)
Net cash used in financing activities (1,759) (697)
Effects of exchange rate changes on cash and cash equivalents 16 81
Net decrease in cash and cash equivalents (794) (247)
Cash and cash equivalents at beginning of year 1,424 1,671
Cash and cash equivalents at end of year 17 630 1,424

124 Pearson plc Annual report and accounts 2017
Notes to the consolidated financial statements
General information
Pearson plc (the company), its subsidiaries and associates (together the Group) are international businesses covering educational courseware, assessments and services, and consumer publishing through its associate interest in Penguin Random House.
The company is a public limited company incorporated and domiciled in England. The address of its registered office is 80 Strand, London WC2R 0RL.
The company has its primary listing on the London Stock Exchange and is also listed on the New York Stock Exchange.
These consolidated financial statements were approved for issue by the Board of Directors on 14 March 2018.
1. Accounting policies
The principal accounting policies applied in the preparation of these consolidated financial statements are set out below.
a. Basis of preparation
These consolidated financial statements have been prepared on the going concern basis and in accordance with International Financial Reporting Standards (IFRS) and IFRS Interpretations Committee (IFRS IC) interpretations as adopted by the European Union (EU) and with those parts of the Companies Act 2006 applicable to companies reporting under IFRS. In respect of the accounting standards applicable to the Group; there is no difference between EU-adopted and IASB-adopted IFRS.
These consolidated financial statements have been prepared under the historical cost convention as modified by the revaluation of financial assets and liabilities (including derivative financial instruments) at fair value through profit or loss.
1. Interpretations and amendments to published standards effective 2017 The following amendments and interpretations were adopted in 2017:
Amendments to IFRS 12 Disclosure of Interests in Other Entities – Annual Improvements 2014-2016 cycle
Amendments to IAS 7 Statement of Cash Flows – Disclosure Initiative
Amendments to IAS 12 Income Taxes – Recognition of Deferred Tax Assets for Unrealised Losses
The adoption of these new pronouncements from 1 January 2017 does not have a material impact on the consolidated financial statements. Additional disclosure has been given where relevant.
2. Standards, interpretations and amendments to published standards that are not yet effective New accounting standards and interpretations have been published that are not mandatory for the year ended 31 December 2017. The Group has elected not to early-adopt these new standards and interpretations. The Group’s assessment of the impact of these new standards is set out below.
IFRS 9 ‘Financial Instruments’, effective for annual reporting periods beginning on or after 1 January 2018. The standard, which replaces IAS 39 ‘Financial Instruments: Recognition and Measurement’, addresses the classification, measurement and derecognition of financial assets and financial liabilities, introduces new hedge
accounting rules and a new impairment model for financial assets. The Group will adopt IFRS 9 as at 1 January 2018 and apply the new rules retrospectively, with the practical expedients permitted in the standard. Comparatives for 2017 will not be restated. The Group has assessed the impact of adopting IFRS 9 and is expecting the following impact:
Classification and measurement The Group has reviewed its financial assets and liabilities and does not expect any changes in classification or measurement as a result of adopting IFRS 9. Trade receivables will continue to be measured at amortised cost as they are held to collect contractual cash flows which represent solely payments of principal and interest, in accordance with the business model. There will be no impact on classification and measurement of financial liabilities as the new requirements only affect the accounting for financial liabilities which are designated at fair value through the profit and loss account, and the Group does not have any such liabilities. Derivative assets and liabilities will continue to be recognised at fair value with movements recognised in finance income or costs, unless the hedging strategy determines otherwise. The Group’s equity financial investments will continue to be recognised at fair value and the Group has elected the option to recognise all movements in fair value in other comprehensive income (FVOCI). Gains or losses realised on the subsequent sale of these financial assets will no longer be recycled through the profit and loss account, but instead reclassified from the FVOCI reserve to retained earnings. During 2017, £nil of such gains/losses were recycled to the profit and loss account in relation to the disposal of available-for-sale assets.
Impairment IFRS 9 introduces a new impairment model which requires the recognition of impairment provisions based on expected credit losses rather than only incurred credit losses, as is the case under IAS 39. The Group expects this new impairment model will lead to a small increase in its provision for losses against trade debtors, representing anticipated losses (evidenced by both historical recovery rates and forward-looking indicators) where there has been no triggering event to suggest any impairment incurred to date. The Group expects its provision for losses against trade debtors as at 1 January 2018 to increase by an amount approximating 1% of gross trade debtors as a result of adopting the expected credit loss model for impairments. The Group does not anticipate the expected credit loss model having a material impact on profit before tax for 2018 unless market conditions or other factors change the outlook for credit losses.
Hedge accounting IFRS 9 introduces a new, simpler hedge accounting model with a principles-based approach designed to align the accounting result with the economic hedging strategy. The group currently uses fair value hedge relationships to hedge interest rate risk and currency risk on its bond borrowings and also uses net investment hedging relationships to hedge currency re-translation risk on its overseas assets. The Group has confirmed that its current hedge relationships will continue to qualify as hedges upon the adoption of IFRS 9. The Group does not currently undertake any cash flow hedging, but is reviewing its strategy with regard to currency risk. Should the Group decide to expand its hedging strategy in this area, changes in fair value relating to forward points or currency basis may, subject to hedge designation, be deferred in a cost of hedging reserve and recognised against the related hedge transaction when it occurs.

125Section 5 Financial statements
1. Accounting policies continued
a. Basis of preparation continued
IFRS 9 also requires additional disclosure which will be incorporated in the 2018 annual report.
IFRS 15 ’Revenue from Contracts with Customers’, effective for annual reporting periods beginning on or after 1 January 2018. The standard, which replaces IAS 18 covering contracts for goods and services, and IAS 11 covering construction contracts, addresses the recognition of revenue. The new standard is based on the principle that revenue is recognised to depict the transfer of promised goods or services to customers in an amount that reflects the consideration to which the Group expects to be entitled in exchange for those goods or services. The Group will adopt the new standard as at 1 January 2018 and apply the modified retrospective approach. Comparatives for 2017 will not be restated and the cumulative impact of adoption will be recognised in retained earnings as at 1 January 2018.
The Group has reviewed the impact of adopting IFRS 15 across its various geographies and lines of business, with reference to underlying contractual terms and business practices, and has identified four areas of impact, as follows:
Unexercised customer rights (or breakage) The Group sells rights to future performance to customers which may go unexercised. While the customer has paid for future performance, usage is at the customer’s discretion and those rights may expire prior to usage, or never be used. The Group maintains historical customer data to understand usage patterns over time (i.e. redemption rates). Where the Group expects to have no future obligation (based on these redemption rates), revenue has historically been recognised immediately for this portion of the sale. Under IFRS 15, where the Group currently recognises this breakage element on subscriptions, revenue instead will be recognised evenly over the period of use. Where breakage relates to sales of tests or vouchers, revenue will be recognised when the underlying tests are delivered. This revised treatment in respect of breakage primarily affects the school and higher education businesses in North America and will result in higher deferred revenue upon adoption on 1 January 2018.
Online Program Management (OPM) marketing Historically the OPM (Embanet) business recognised revenue for the pre-semester costs of marketing and recruitment as a separate performance obligation from course delivery during the semester (i.e. revenue was recognised in line with the marketing costs incurred). Under IFRS 15, revenue will be recognised on a straight-line basis over the semester with no revenue recognised up front for pre-semester recruitment and marketing costs based on management’s judgement under the new standard’s requirements assessing the start of the Group’s contract and determining the Group’s performance obligations. This revised treatment of pre-semester costs only affects the OPM business in North America and will result in a lower trade receivable balance upon adoption on 1 January 2018.
Administration fees This relates to non-refundable upfront administration fees charged to customers which do not relate to the transfer of a promised good or service to the customer. Rather these fees are charged to cover internal costs, such as registration fees for testing candidate exams. Historically administration fees have been recognised in revenue up front when charged. Under IFRS 15, such fees must be deferred and recognised over the period over which services are provided as they do not relate to a specific performance obligation. This revised treatment primarily affects the UK Assessments business and will result in higher deferred revenue upon adoption on 1 January 2018.
Commissions This relates to incremental costs of obtaining customer contracts, such as sales incentive plans or sales commissions specifically linked to obtaining new contracts. Historically such commissions have been charged to the profit and loss account as incurred. Under IFRS 15, sales commissions in respect of customer transactions with an accounting period of greater than one year will be capitalised and amortised over that accounting period, using practical expedients permissible under the new standard. This revised treatment affects the US Assessments business and will result in a higher contract asset upon adoption on 1 January 2018.
IFRS 15 also requires increased disclosure, in particular analysis of disaggregated revenues, contract balances and transaction price allocated to remaining performance obligations. This disclosure will be incorporated in the 2018 annual report.
Had the Group been applying IFRS 15 during 2017, both sales and profit before tax would have been around £2m higher, with the balance sheet impact at the beginning and end of the year being similar. The impact on sales and profit before tax for 2018 is not expected to be materially different to 2017, assuming a like-for-like business portfolio. The cumulative pre-tax impact of adopting IFRS 15 on 1 January 2018 is expected to reduce retained earnings by around £143m, with deferred revenue increasing by £106m, trade receivables reducing by £38m and contract assets increasing by £1m.
IFRS 16 ‘Leases’, effective for annual reporting periods beginning on or after 1 January 2019. Early adoption is permitted. The new standard replaces IAS 17 ‘Leases’ and related interpretations and details the requirements for the classification, measurement and recognition of lease arrangements. Adoption of the new standard is likely to have a material impact on the Group. Management continues to assess this impact but cannot reasonably estimate this impact due to judgements which are required to be made for each lease and the adoption methods available. The actual impact of applying IFRS 16 will depend on the composition of the Group’s lease portfolio at the adoption date and the extent to which the Group chooses to use practical expedients and recognition exemptions. The Group plans to apply IFRS 16 on 1 January 2019, and anticipates using the modified retrospective approach. Under this approach, the cumulative effect of adopting IFRS 16 will be recognised as an adjustment to the opening balance of retained earnings on 1 January 2019, with no restatement of comparative information.
Notes to the consolidated financial statements

126 Pearson plc Annual report and accounts 2017
Notes to the consolidated financial statements
1. Accounting policies continued
a. Basis of preparation continued
Although the Group has not completed its detailed assessment, the following changes to lessee accounting are likely to have a material impact:
Currently no lease assets are included on the Group’s consolidated balance sheet for operating leases. Under IFRS 16 right-of-use assets will be recorded on the balance sheet for assets that are leased by the Group
Currently no lease liabilities are included on the Group’s consolidated balance sheet for future operating lease payments; these are disclosed as commitments. Under IFRS 16 liabilities will be recorded for future lease payments. As at 31 December 2017, the Group’s future aggregate minimum lease payments under non-cancellable operating leases amounted to £1,201m, on an undiscounted basis (see note 35)
Currently operating lease rentals, net of any incentives received, are expensed to the income statement on a straight-line basis over the period of the lease. Under IFRS 16 the lease expense will represent the depreciation of the right-of-use asset together with interest charged on lease liabilities
Currently operating lease cash flows are included within operating cash flows in the Group’s consolidated cash flow statement. Under IFRS 16 these cash flows will be recorded as cash flows from financing activities being the repayment of lease liabilities and related interest
Lessor accounting under IFRS 16 is similar to IAS 17 accounting and is not expected to have a material impact on the Group.
In June 2015, the IASB issued an exposure draft ED/2015/5 ‘Remeasurement on a Plan Amendment, Curtailment or Settlement/Availability of a Refund from a Defined benefit Plan (Proposed Amendments to IAS 19 and IFRIC 14)’. The proposed amendments to IFRIC 14, which may have restricted the Group’s ability to recognise a pension asset in respect of pension surpluses in its UK defined benefit plan, have now been withdrawn.
A number of other new standards and amendments to standards and interpretations are effective for annual periods beginning after 1 January 2017, and have not been applied in preparing these financial statements. None of these is expected to have a material impact on the consolidated financial statements.
3. Critical accounting assumptions and judgements The preparation of financial statements in conformity with IFRS requires the use of certain critical accounting assumptions. It also requires management to exercise its judgement in the process of applying the Group’s accounting policies. The areas requiring a higher degree of judgement or complexity, or areas where assumptions and estimates are significant to the consolidated financial statements, are discussed in the relevant accounting policies under the following headings and in the notes to the accounts where appropriate:
Consolidation: Business combinations – classification of investments (see note 1b(1)) Intangible assets: Goodwill (see note 1e(1))
Intangible assets: Pre-publication assets (see note 1e(5)) Taxation (see note 1m) Revenue recognition including provisions for returns (see note 1p) Employee benefits: Pensions (see note 1n(1)) Consolidation: Business combinations – determination of fair values (where relevant) (see note 1b(1))
b. Consolidation
1. Business combinations The acquisition method of accounting is used to account for business combinations.
The consideration transferred for the acquisition of a subsidiary is the fair value of the assets transferred, the liabilities incurred and the equity interest issued by the Group. The consideration transferred includes the fair value of any asset or liability resulting from a contingent consideration arrangement. Acquisition-related costs are expensed as incurred in the operating expenses line of the income statement. Identifiable assets acquired and identifiable liabilities and contingent liabilities assumed in a business combination are measured initially at their fair values at the acquisition date. The determination of fair values often requires significant judgements and the use of estimates, and, for material acquisitions, the fair value of the acquired intangible assets is determined by an independent valuer. The excess of the consideration transferred, the amount of any non-controlling interest in the acquiree and the acquisition date fair value of any previous equity interest in the acquiree over the fair value of the identifiable net assets acquired is recorded as goodwill (see note 30).
See note 1e(1) for the accounting policy on goodwill. If this is less than the fair value of the net assets of the subsidiary acquired, in the case of a bargain purchase, the difference is recognised directly in the income statement.
On an acquisition-by-acquisition basis, the Group recognises any non-controlling interest in the acquiree either at fair value or at the non-controlling interest’s proportionate share of the acquiree’s net assets.
IFRS 3 ‘Business Combinations’ has not been applied retrospectively to business combinations before the date of transition to IFRS.
Management exercises judgement in determining the classification of its investments in its businesses, in line with the following:
2. Subsidiaries Subsidiaries are entities over which the Group has control. The Group controls an entity when the Group is exposed to, or has rights to, variable returns from its involvement with the entity and has the ability to affect those returns through its power over the entity. Subsidiaries are fully consolidated from the date on which control is transferred to the Group. They are deconsolidated from the date that control ceases.
3. Transactions with non-controlling interests Transactions with non-controlling interests that do not result in loss of control are accounted for as equity transactions, that is, as transactions with the owners in their capacity as owners. Any surplus or deficit arising from disposals to a non-controlling interest is recorded in equity. For purchases from a non-controlling interest, the difference between consideration paid and the relevant share acquired of the carrying value of the subsidiary is recorded in equity.

127Section 5 Financial statements
1. Accounting policies continued
b. Consolidation continued
4. Joint ventures and associates Joint ventures are entities in which the Group holds an interest on a long-term basis and has rights to the net assets through contractually agreed sharing of control. Associates are entities over which the Group has significant influence but not the power to control the financial and operating policies, generally accompanying a shareholding of between 20% and 50% of the voting rights. Ownership percentage is likely to be the key indicator of investment classification; however, other factors, such as Board representation, may also affect the accounting classification. Judgement is required to assess all of the qualitative and quantitative factors which may indicate that the Group does, or does not, have significant influence over an investment. Penguin Random House is the Group’s only material associate – see note 12 for further details on the judgements involved in its accounting classification. Investments in joint ventures and associates are accounted for by the equity method and are initially recognised at the fair value of consideration transferred.
The Group’s share of its joint ventures’ and associates’ post-acquisition profits or losses is recognised in the income statement and its share of post-acquisition movements in reserves is recognised in reserves.
The Group’s share of its joint ventures’ and associates’ results is recognised as a component of operating profit as these operations form part of the core publishing business of the Group and are an integral part of existing wholly-owned businesses. The cumulative post-acquisition movements are adjusted against the carrying amount of the investment. When the Group’s share of losses in a joint venture or associate equals or exceeds its interest in the joint venture or associate, the Group does not recognise further losses unless the Group has incurred obligations or made payments on behalf of the joint venture or associate.
5. Contribution of a subsidiary to an associate or joint venture The gain or loss resulting from the contribution or sale of a subsidiary to an associate or a joint venture is recognised in full. Where such transactions do not involve cash consideration, significant judgements and estimates are used in determining the fair values of the consideration received.
c. Foreign currency translation
1. Functional and presentation currency Items included in the financial statements of each of the Group’s entities are measured using the currency of the primary economic environment in which the entity operates (the functional currency). The consolidated financial statements are presented in sterling, which is the company’s functional and presentation currency.
2. Transactions and balances Foreign currency transactions are translated into the functional currency using the exchange rates prevailing at the dates of the transactions. Foreign exchange gains and losses resulting from the settlement of such transactions and from the translation at year-end exchange rates of monetary assets and liabilities denominated in foreign currencies are recognised in the income statement, except when deferred in equity as qualifying net investment hedges.
3. Group companies The results and financial position of all Group companies that have a functional currency different from the presentation currency are translated into the presentation currency as follows:
i) Assets and liabilities are translated at the closing rate at the date of the balance sheet
ii) Income and expenses are translated at average exchange rates
iii) All resulting exchange differences are recognised as a separate component of equity.
On consolidation, exchange differences arising from the translation of the net investment in foreign entities, and of borrowings and other currency instruments designated as hedges of such investments, are taken to shareholders’ equity. The Group treats specific inter-company loan balances, which are not intended to be repaid in the foreseeable future, as part of its net investment. When a foreign operation is sold, such exchange differences are recognised in the income statement as part of the gain or loss on sale.
The principal overseas currency for the Group is the US dollar. The average rate for the year against sterling was $1.30 (2016: $1.33) and the year-end rate was $1.35 (2016: $1.23).
d. Property, plant and equipment
Property, plant and equipment are stated at historical cost less depreciation. Cost includes the original purchase price of the asset and the costs attributable to bringing the asset to its working condition for intended use. Land is not depreciated. Depreciation on other assets is calculated using the straight-line method to allocate their cost less their residual values over their estimated useful lives as follows:
Buildings (freehold): 20–50 years
Buildings (leasehold): over the period of the lease
Plant and equipment: 3–10 years
The assets’ residual values and useful lives are reviewed, and adjusted if appropriate, at each balance sheet date.
The carrying value of an asset is written down to its recoverable amount if the carrying value of the asset is greater than its estimated recoverable amount.
e. Intangible assets
1. Goodwill For the acquisition of subsidiaries made on or after 1 January 2010, goodwill represents the excess of the consideration transferred, the amount of any non-controlling interest in the acquiree and the acquisition date fair value of any previous equity interest in the acquiree over the fair value of the identifiable net assets acquired. For the acquisition of subsidiaries made from the date of transition to IFRS to 31 December 2009, goodwill represents the excess of the cost of an acquisition over the fair value of the Group’s share of the net identifiable assets acquired. Goodwill on acquisitions of subsidiaries is included in intangible assets. Goodwill on acquisition of associates and joint ventures represents the excess of the cost of an acquisition over the fair value of the Group’s share of the net identifiable assets acquired. Goodwill on acquisitions of associates and joint ventures is included in investments in associates and joint ventures.
Notes to the consolidated financial statements

128 Pearson plc Annual report and accounts 2017
Notes to the consolidated financial statements
1. Accounting policies continued
e. Intangible assets continued
Goodwill is tested at least annually for impairment and carried at cost less accumulated impairment losses. An impairment loss is recognised to the extent that the carrying value of goodwill exceeds the recoverable amount. The recoverable amount is the higher of fair value less costs of disposal and value in use. These calculations require the use of estimates in respect of forecast cash flows and discount rates and significant management judgement in respect of CGU and cost allocation. A description of the key assumptions and sensitivities is included in note 11. Goodwill is allocated to aggregated cash-generating units for the purpose of impairment testing. The allocation is made to those aggregated cash-generating units that are expected to benefit from the business combination in which the goodwill arose.
Gains and losses on the disposal of an entity include the carrying amount of goodwill relating to the entity sold.
2. Acquired software Software separately acquired for internal use is capitalised at cost. Software acquired in material business combinations is capitalised at its fair value as determined by an independent valuer. Acquired software is amortised on a straight-line basis over its estimated useful life of between three and eight years.
3. Internally developed software Internal and external costs incurred during the preliminary stage of developing computer software for internal use are expensed as incurred. Internal and external costs incurred to develop computer software for internal use during the application development stage are capitalised if the Group expects economic benefits from the development. Capitalisation in the application development stage begins once the Group can reliably measure the expenditure attributable to the software development and has demonstrated its intention to complete and use the software. Internally developed software is amortised on a straight-line basis over its estimated useful life of between three and eight years.
4. Acquired intangible assets Acquired intangible assets include customer lists, contracts and relationships, trademarks and brands, publishing rights, content, technology and software rights. These assets are capitalised on acquisition at cost and included in intangible assets. Intangible assets acquired in material business combinations are capitalised at their fair value as determined by an independent valuer. Intangible assets are amortised over their estimated useful lives of between two and 20 years, using an amortisation method that reflects the pattern of their consumption.
5. Pre-publication assets Pre-publication assets represent direct costs incurred in the development of educational programmes and titles prior to their publication. These costs are recognised as current intangible assets where the title will generate probable future economic benefits and costs can be measured reliably. Pre-publication assets are amortised upon publication of the title over estimated economic lives of five years or less, being an estimate of the expected operating lifecycle of the title, with a higher proportion of the amortisation taken in the earlier years.
The investment in pre-publication assets has been disclosed as part of cash generated from operations in the cash flow statement (see note 33).
The assessment of the recoverability of pre-publication assets involve a significant degree of judgement based on historical trends and management estimation of future potential sales. An incorrect amortisation profile could result in excess amounts being carried forward as intangible assets that would otherwise have been written off to the income statement in an earlier period.
Reviews are performed regularly to estimate recoverability of pre-publication assets. The carrying amount of pre-publication assets is set out in note 20.
f. Other financial assets
Other financial assets, designated as available for sale investments, are non-derivative financial assets measured at estimated fair value. Changes in the fair value are recorded in equity in the fair value reserve. On the subsequent disposal of the asset, the net fair value gains or losses are taken to the income statement.
g. Inventories
Inventories are stated at the lower of cost and net realisable value. Cost is determined using the first in first out (FIFO) method. The cost of finished goods and work in progress comprises raw materials, direct labour, other direct costs and related production overheads. Net realisable value is the estimated selling price in the ordinary course of business, less estimated costs necessary to make the sale. Provisions are made for slow-moving and obsolete stock.
h. Royalty advances
Advances of royalties to authors are included within trade and other receivables when the advance is paid less any provision required to adjust the advance to its net realisable value. The realisable value of royalty advances relies on a degree of management judgement in determining the profitability of individual author contracts. If the estimated realisable value of author contracts is overstated, this will have an adverse effect on operating profits as these excess amounts will be written off.
The recoverability of royalty advances is based upon an annual detailed management review of the age of the advance, the future sales projections for new authors and prior sales history of repeat authors.
The royalty advance is expensed at the contracted or effective royalty rate as the related revenues are earned. Royalty advances which will be consumed within one year are held in current assets. Royalty advances which will be consumed after one year are held in non-current assets.

129Section 5 Financial statements
1. Accounting policies continued
i. Cash and cash equivalents
Cash and cash equivalents in the cash flow statement include cash in hand, deposits held on call with banks, other short-term highly liquid investments with original maturities of three months or less, and bank overdrafts. Bank overdrafts are included in borrowings in current liabilities in the balance sheet.
Short-term deposits and marketable securities with maturities of greater than three months do not qualify as cash and cash equivalents and are reported as financial assets. Movements on these financial assets are classified as cash flows from financing activities in the cash flow statement where these amounts are used to offset the borrowings of the Group or as cash flows from investing activities where these amounts are held to generate an investment return.
j. Share capital
Ordinary shares are classified as equity.
Incremental costs directly attributable to the issue of new shares or options are shown in equity as a deduction, net of tax, from the proceeds.
Where any Group company purchases the company’s equity share capital (treasury shares), the consideration paid, including any directly attributable incremental costs, net of income taxes, is deducted from equity attributable to the company’s equity holders until the shares are cancelled, reissued or disposed of. Where such shares are subsequently sold or reissued, any consideration received, net of any directly attributable transaction costs and the related income tax effects, is included in equity attributable to the company’s equity holders.
Ordinary shares purchased under a buyback programme are cancelled and the nominal value of the shares is transferred to a capital redemption reserve.
k. Borrowings
Borrowings are recognised initially at fair value, which is proceeds received net of transaction costs incurred. Borrowings are subsequently stated at amortised cost with any difference between the proceeds (net of transaction costs) and the redemption value being recognised in the income statement over the period of the borrowings using the effective interest method. Accrued interest is included as part of borrowings. Where a debt instrument is in a fair value hedging relationship, an adjustment is made to its carrying value in the income statement to reflect the hedged risk.
l. Derivative financial instruments
Derivatives are recognised at fair value and remeasured at each balance sheet date. The fair value of derivatives is determined by using market data and the use of established estimation techniques such as discounted cash flow and option valuation models.
Changes in the fair value of derivatives are recognised immediately in finance income or costs. However, derivatives relating to borrowings and certain foreign exchange contracts are designated as part of a hedging transaction. The accounting treatment is summarised as follows:
Typical reason for designation
Reporting of gains and losses on effective portion of the hedge
Reporting of gains and losses on disposal
Net investment hedge
The derivative creates a foreign currency liability which is used to hedge changes in the value of a subsidiary which transacts in that currency.
Recognised in other comprehensive income.
On disposal, the accumulated value of gains and losses reported in other comprehensive income is transferred to the income statement.
Fair value hedges
The derivative transforms the interest profile on debt from fixed rate to floating rate. Changes in the value of the debt as a result of changes in interest rates are offset by equal and opposite changes in the value of the derivative. When the Group’s debt is swapped to floating rates, the contracts used are designated as fair value hedges.
Gains and losses on the derivative are reported in finance income or finance costs. However, an equal and opposite change is made to the carrying value of the debt (a ‘fair value adjustment’) with the benefit/cost reported in finance income or finance costs. The net result should be a zero charge on a perfectly effective hedge.
If the debt and derivative are disposed of, the value of the derivative and the debt (including the fair value adjustment) are reset to zero. Any resultant gain or loss is recognised in finance income or finance costs.
Non-hedge accounted contracts
These are not designated as hedging instruments. Typically these are short-term contracts to convert debt back to fixed rates or foreign exchange contracts where a natural offset exists.
No hedge accounting applies.
m. Taxation
Current tax is recognised at the amounts expected to be paid or recovered under the tax rates and laws that have been enacted or substantively enacted at the balance sheet date.
Deferred income tax is provided, using the balance sheet liability method, on temporary differences arising between the tax bases of assets and liabilities and their carrying amounts. Deferred income tax is determined using tax rates and laws that have been enacted or substantively enacted by the balance sheet date and are expected to apply when the related deferred tax asset is realised or the deferred income tax liability is settled.
Deferred tax assets are recognised to the extent that it is probable that future taxable profit will be available against which the temporary differences can be utilised.
Deferred income tax is provided in respect of the undistributed earnings of subsidiaries, associates and joint ventures other than where it is intended that those undistributed earnings will not be remitted in the foreseeable future.
Notes to the consolidated financial statements

130 Pearson plc Annual report and accounts 2017
Notes to the consolidated financial statements
1. Accounting policies continued
m. Taxation continued
Current and deferred tax are recognised in the income statement, except when the tax relates to items charged or credited directly to equity or other comprehensive income, in which case the tax is also recognised in equity or other comprehensive income.
The Group is subject to income taxes in numerous jurisdictions. Significant judgement is required in determining the estimates in relation to the worldwide provision for income taxes. There are many transactions and calculations for which the ultimate tax determination is uncertain during the ordinary course of business. The Group recognises tax provisions when it is considered probable that there will be a future outflow of funds to a tax authority. The provisions are based on management’s best judgement of the application of tax legislation and best estimates of future settlement amounts (see note 7). Where the final tax outcome of these matters is different from the amounts that were initially recorded, such differences will impact the income tax and deferred tax provisions in the period in which such determination is made.
Deferred tax assets and liabilities require management judgement in determining the amounts to be recognised. In particular, significant judgement is used when assessing the extent to which deferred tax assets should be recognised with consideration given to the timing and level of future taxable income together with any future tax planning strategies (see note 13).
n. Employee benefits
1. Pensions The retirement benefit asset and obligation recognised in the balance sheet represents the net of the present value of the defined benefit obligation and the fair value of plan assets at the balance sheet date. The defined benefit obligation is calculated annually by independent actuaries using the projected unit credit method. The present value of the defined benefit obligation is determined by discounting estimated future cash flows using yields on high-quality corporate bonds which have terms to maturity approximating the terms of the related liability.
When the calculation results in a potential asset, the recognition of that asset is limited to the asset ceiling – that is the present value of any economic benefits available in the form of refunds from the plan or a reduction in future contributions. Management uses judgement to determine the level of refunds available from the plan in recognising an asset.
The determination of the pension cost and defined benefit obligation of the Group’s defined benefit pension schemes depends on the selection of certain assumptions, which include the discount rate, inflation rate, salary growth and longevity (see note 25).
Actuarial gains and losses arising from experience adjustments and changes in actuarial assumptions are charged or credited to equity in other comprehensive income in the period in which they arise.
The service cost, representing benefits accruing over the year, is included in the income statement as an operating cost. Net interest is calculated by applying the discount rate to the net defined benefit obligation and is presented as finance costs or finance income.
Obligations for contributions to defined contribution pension plans are recognised as an operating expense in the income statement as incurred.
2. Other post-retirement obligations The expected costs of post-retirement medical and life assurance benefits are accrued over the period of employment, using a similar accounting methodology as for defined benefit pension obligations. The liabilities and costs relating to significant other post-retirement obligations are assessed annually by independent qualified actuaries.
3. Share-based payments The fair value of options or shares granted under the Group’s share and option plans is recognised as an employee expense after taking into account the Group’s best estimate of the number of awards expected to vest. Fair value is measured at the date of grant and is spread over the vesting period of the option or share. The fair value of the options granted is measured using an option model that is most appropriate to the award. The fair value of shares awarded is measured using the share price at the date of grant unless another method is more appropriate. Any proceeds received are credited to share capital and share premium when the options are exercised.
o. Provisions Provisions are recognised if the Group has a present legal or constructive obligation as a result of past events, it is more likely than not that an outflow of resources will be required to settle the obligation and the amount can be reliably estimated. Provisions are discounted to present value where the effect is material.
The Group recognises a provision for deferred consideration. Where this is contingent on future performance or a future event, judgement is exercised in establishing the fair value.
The Group recognises a provision for onerous lease contracts when the expected benefits to be derived from a contract are less than the unavoidable costs of meeting the obligations under the contract.
The provision is based on the present value of future payments for surplus leased properties under non-cancellable operating leases, net of estimated sub-leasing income.
p. Revenue recognition
The Group’s revenue streams are courseware, assessments and services. Courseware includes curriculum materials provided in book form and/or via access to digital content. Assessments includes test development, processing and scoring services provided to governments, educational institutions, corporations and professional bodies. Services includes the operation of schools, colleges and universities, including sistemas in Brazil and English language teaching centres around the world as well as the provision of online learning services in partnership with universities and other academic institutions.
Revenue comprises the fair value of the consideration received or receivable for the sale of goods and services net of sales taxes, rebates and discounts, and after eliminating sales within the Group.

131Section 5 Financial statements
1. Accounting policies continued
p. Revenue recognition continued
Revenue from the sale of books is recognised when title passes. A provision for anticipated returns is made based primarily on historical return rates, customer buying patterns and retailer behaviours including stock levels (see note 22). If these estimates do not reflect actual returns in future periods then revenues could be understated or overstated for a particular period.
Revenue from the sale of off-the-shelf software is recognised on delivery or on installation of the software where that is a condition of the contract. In certain circumstances, where installation is complex, revenue is recognised when the customer has completed their acceptance procedures. Where software is provided under a term licence, revenue is recognised on a straight-line basis over the period of the licence.
Revenue from the provision of services to academic institutions, such as programme development, student acquisition, education technology and student support services, is recognised as performance occurs. Revenue from multi-year contractual arrangements, such as contracts to process qualifying tests for individual professions and government departments, is recognised as performance occurs. The assumptions, risks and uncertainties inherent to long-term contract accounting can affect the amounts and timing of revenue and related expenses reported. Certain of these arrangements, either as a result of a single service spanning more than one reporting period or where the contract requires the provision of a number of services that together constitute a single project, are treated as long-term contracts with revenue recognised on a percentage of completion basis. Percentage of completion is calculated on a cost basis using the proportion of the total estimated costs incurred to date. Losses on contracts are recognised in the period in which the loss first becomes foreseeable. Contract losses are determined to be the amount by which estimated total costs of the contract exceed the estimated total revenues that will be generated.
Where a contractual arrangement consists of two or more separate elements that can be provided to customers either on a stand-alone basis or as an optional extra, such as the provision of supplementary materials or online access with textbooks and multiple deliverables within testing or service contracts, revenue is recognised for each element as if it were an individual contractual arrangement. This requires judgement regarding the identification of the individual elements as well as the estimation of its relative fair value.
On certain contracts, where the Group acts as agent, only commissions and fees receivable for services rendered are recognised as revenue. Any third-party costs incurred on behalf of the principal that are rechargeable under the contractual arrangement are not included in revenue.
Income from recharges of freight and other activities which are incidental to the normal revenue-generating activities is included in other income.
q. Leases
Leases of property, plant and equipment where the Group has substantially all the risks and rewards of ownership are classified as finance leases. Finance leases are capitalised at the commencement of the lease at the lower of the fair value of the leased property and the present value of the minimum lease payments. Each lease payment is allocated between the liability and finance charges to achieve a constant rate on the finance balance outstanding. The corresponding rental obligations, net of finance charges, are included in financial liabilities – borrowings. The interest element of the finance cost is charged to the income statement over the lease period to produce a constant periodic rate of interest on the remaining balance of the liability for each period. The property, plant and equipment acquired under finance leases are depreciated over the shorter of the useful life of the asset or the lease term.
Leases where a significant portion of the risks and rewards of ownership are retained by the lessor are classified as operating leases by the lessee. Payments made under operating leases (net of any incentives received from the lessor) are charged to the income statement on a straight-line basis over the period of the lease.
r. Dividends
Final dividends are recorded in the Group’s financial statements in the period in which they are approved by the company’s shareholders. Interim dividends are recorded when paid.
s. Discontinued operations
A discontinued operation is a component of the Group’s business that represents a separate major line of business or geographical area of operations that has been disposed of or meets the criteria to be classified as held for sale.
Discontinued operations are presented in the income statement as a separate line and are shown net of tax.
t. Assets and liabilities held for sale
Assets and liabilities are classified as held for sale and stated at the lower of carrying amount and fair value less costs to sell if it is highly probable that the carrying amount will be recovered principally through a sale transaction rather than through continuing use. No depreciation is charged in respect of non-current assets classified as held for sale. Amounts relating to non-current assets and liabilities held for sale are classified as discontinued operations in the income statement where appropriate.
u. Trade receivables
Trade receivables are stated at fair value after provision for bad and doubtful debts and anticipated future sales returns (see also note 1p).
Notes to the consolidated financial statements

132 Pearson plc Annual report and accounts 2017
Notes to the consolidated financial statements
2. Segment information
The primary segments for management and reporting are geographies as outlined below. In addition, the Group separately discloses the results from the Penguin Random House associate.
The chief operating decision-maker is the Pearson executive.
North America Courseware, Assessments and Services businesses in the US and Canada.
Core Courseware, Assessments and Services businesses in more mature markets including UK, Australia and Italy.
Growth Courseware, Assessments and Services businesses in emerging markets including Brazil, China, India and South Africa.
For more detail on the services and products included in each business segment refer to the strategic report.
All figures in £ millions Notes
2017
North America Core Growth
Penguin Random
House Corporate Group
Sales 2,929 815 769 – – 4,513
Adjusted operating profit 394 50 38 94 – 576
Cost of major restructuring (60) (11) (8) – – (79)
Intangible charges (89) (12) (37) (28) – (166)
Other net gains and losses (3) – 35 96 – 128
Impact of US tax reform – – – (8) – (8)
Operating profit 242 27 28 154 – 451
Finance costs 6 (110)
Finance income 6 80
Profit before tax 421
Income tax 7 (13)
Profit for the year 408
Segment assets 4,116 1,914 667 – 793 7,490
Joint ventures 12 – – 3 – – 3
Associates 12 4 3 – 388 – 395
Total assets 4,120 1,917 670 388 793 7,888
Other segment items
Share of results of joint ventures and associates 12 5 1 1 71 – 78
Capital expenditure 10, 11 162 35 43 – – 240
Pre-publication investment 20 218 84 59 – – 361
Depreciation 10 56 13 21 – – 90
Amortisation 11, 20 348 103 110 – – 561
Impairment 11 – – – – – –

133Section 5 Financial statements
2. Segment information continued
All figures in £ millions Notes
2016
North America Core Growth
Penguin Random
House Corporate Group
Sales 2,981 803 768 – – 4,552
Adjusted operating profit 420 57 29 129 – 635
Cost of major restructuring (172) (62) (95) (9) – (338)
Intangible charges (2,684) (16) (33) (36) – (2,769)
Other net gains and losses (12) (12) (1) – – (25)
Operating (loss)/profit (2,448) (33) (100) 84 – (2,497)
Finance costs 6 (97)
Finance income 6 37
Loss before tax (2,557)
Income tax 7 222
Loss for the year (2,335)
Segment assets 4,859 1,461 859 – 1,640 8,819
Joint ventures 12 – – 2 – – 2
Associates 12 1 4 – 1,240 – 1,245
Total assets 4,860 1,465 861 1,240 1,640 10,066
Other segment items
Share of results of joint ventures and associates 12 (1) 1 (1) 98 – 97
Capital expenditure 10, 11 153 42 51 – – 246
Pre-publication investment 20 235 92 68 – – 395
Depreciation 10 56 12 27 – – 95
Amortisation 11, 20 394 109 116 – – 619
Impairment 11 2,548 – – – – 2,548
There were no material inter-segment sales in either 2017 or 2016.
For additional detailed information on the calculation of adjusted operating profit as shown in the above tables, see p192-195 (Financial key performance indicators).
Adjusted operating profit is shown in the above tables as it is the key financial measure used by management to evaluate the performance of the Group and allocate resources to business segments. The measure also enables investors to more easily, and consistently, track the underlying operational performance of the Group and its business segments by separating out those items of income and expenditure relating to acquisition and disposal transactions and major restructuring programmes.
Cost of major restructuring In January 2016, the Group announced that it was embarking on a restructuring programme to simplify the business, reduce costs and position the Group for growth in its major markets. The costs of this programme of £338m in 2016 were significant enough to exclude from the adjusted operating profit measure so as to better highlight the underlying performance. These costs included costs associated with headcount reductions, property rationalisation and closure or exit from certain systems, platforms, products and supplier and customer relationships. A new programme of restructuring, announced in May 2017, to run between 2017 and 2019, began in the second half of 2017 and is expected to drive further significant cost savings. Costs incurred to
date relating to this new programme were £79m at the end of 2017 and related to cost efficiencies in higher education and enabling functions together with further rationalisation of the property portfolio. The costs of this new programme have also been excluded from adjusted operating profit (see note 3).
Intangible charges These represent charges in respect of goodwill, including impairment, and intangible assets acquired through business combinations and the direct costs of acquiring those businesses. These charges are excluded as they reflect past acquisition activity and do not necessarily reflect the current year performance of the Group. In 2016, intangible charges included an impairment of goodwill in the Group’s North America business of £2,548m (see note 11). There was no impairment in 2017.
Other net gains and losses These represent profits and losses on the sale of subsidiaries, joint ventures, associates and other financial assets and are excluded from adjusted operating profit as they distort the performance of the Group as reported on a statutory basis. Other net gains of £128m in 2017 largely relate to the sale of the test preparation business in China which resulted in a profit on sale of £44m and the part sale of the Group’s share in Penguin Random House which resulted in a profit of £96m (see note 31). In 2016, the net losses in the Core segment mainly relate to the closure of the Group’s English language schools in Germany and in the North America segment relate to the sale of the Pearson English Business Solutions business.
Notes to the consolidated financial statements

134 Pearson plc Annual report and accounts 2017
Notes to the consolidated financial statements
2. Segment information continued
Impact of US tax reform In 2017, as a result of US tax reform, the Group’s share of profit from associates was adversely impacted by £8m. This amount has been excluded from adjusted operating profit as it is considered to be a transition adjustment that is not expected to recur in the near future.
Corporate costs are allocated to business segments on an appropriate basis depending on the nature of the cost and therefore the total segment result is equal to the Group operating profit.
Segment assets, excluding corporate assets, consist of property, plant and equipment, intangible assets, inventories, receivables, deferred taxation and other financial assets and exclude cash and cash equivalents and derivative assets. Corporate assets comprise cash and cash equivalents, marketable securities and derivative financial instruments. Capital expenditure comprises additions to property, plant and equipment and software (see notes 10 and 11).
Property, plant and equipment and intangible assets acquired through business combination were £nil (2016: £10m) (see note 30).
The following tables analyse the Group’s revenue streams. Courseware includes curriculum materials provided in book form and/or via access to digital content. Assessments includes test development, processing and scoring services provided to governments, educational institutions, corporations and professional bodies. Services includes the operation of schools, colleges and universities, including sistemas in Brazil and English language teaching centres around the world as well as the provision of online learning services in partnership with universities and other academic institutions.
All figures in £ millions
2017
North America Core Growth Group
Sales:
Courseware
School Courseware 394 171 139 704
Higher Education Courseware 1,146 93 63 1,302
English Courseware 20 60 102 182
1,560 324 304 2,188
Assessments
School and Higher Education Assessments 355 256 23 634
Clinical Assessments 146 46 – 192
Professional and English Certification 341 138 60 539
842 440 83 1,365
Services
School Services 274 5 54 333
Higher Education Services 253 34 32 319
English Services – 12 296 308
527 51 382 960
Total 2,929 815 769 4,513

Section 5 Financial statements 135
2. Segment information continued
All figures in £ millions
2016
North America Core Growth Group
Sales:
Courseware
School Courseware 418 173 127 718
Higher Education Courseware 1,147 92 60 1,299
English Courseware 21 65 97 183
1,586 330 284 2,200
Assessments
School and Higher Education Assessments 378 268 21 667
Clinical Assessments 143 40 – 183
Professional and English Certification 333 112 49 494
854 420 70 1,344
Services
School Services 259 6 54 319
Higher Education Services 269 29 46 344
English Services 13 18 314 345
541 53 414 1,008
Total 2,981 803 768 4,552
The Group operates in the following main geographic areas:
All figures in £ millions
Sales Non-current assets
2017 2016 2017 2016
UK 384 393 796 946
Other European countries 262 255 128 134
US 2,770 2,829 2,247 3,351
Canada 126 118 240 268
Asia Pacific 643 632 151 205
Other countries 328 325 184 232
Total 4,513 4,552 3,746 5,136
Sales are allocated based on the country in which the customer is located. This does not differ materially from the location where the order is received. The geographical split of non-current assets is based on the subsidiary’s country of domicile. This is not materially different to the location of the assets. Non-current assets comprise property, plant and equipment, intangible assets, investments in joint ventures and associates and trade and other receivables.
Notes to the consolidated financial statements

136 Pearson plc Annual report and accounts 2017
Notes to the consolidated financial statements
3. Restructuring costs
An analysis of restructuring costs is as follows:
All figures in £ millions 2017 2016
By nature:
Product costs 15 32
Employee costs 11 139
Depreciation and amortisation 13 29
Property and facilities 24 43
Technology and communications 2 7
Professional and outsourced services 12 31
General and administrative costs 2 48
Total restructuring – operating expenses 79 329
Share of associate restructuring – 9
Total 79 338
In January 2016, the Group announced that it was embarking on a restructuring programme to simplify the business, reduce costs and position the Group for growth in its major markets. The costs of this programme in 2016 were significant enough to exclude from the adjusted operating profit measure so as to better highlight the underlying performance (see note 8). A new programme of restructuring, the 2017-2019 restructuring programme announced in May 2017, began in the second half of 2017 and is expected to drive further significant cost savings. The costs of this new programme have also been excluded from adjusted operating profit.
4. Operating expenses
All figures in £ millions Notes 2017 2016
By function:
Cost of goods sold 2,066 2,093
Operating expenses
Distribution costs 84 88
Selling, marketing and product development costs 896 908
Administrative and other expenses 1,207 1,240
Restructuring costs 3 79 329
Other income (64) (85)
Total net operating expenses 2,202 2,480
Other net gains and losses (128) 25
Impairment of intangible assets 11 – 2,548
Total 4,140 7,146
Included in other income is service fee income from Penguin Random House of £3m (2016: £4m). Included in administrative and other expenses are research and efficacy costs of £14m (2016: £23m). In addition to the restructuring costs shown above, there were restructuring costs in Penguin Random House of £nil (2016: £9m).

Section 5 Financial statements 137
4. Operating expenses continued
All figures in £ millions Notes 2017 2016
By nature:
Royalties expensed 246 264
Other product costs 564 616
Employee benefit expense 5 1,805 1,888
Contract labour 152 206
Employee-related expense 127 122
Promotional costs 229 217
Depreciation of property, plant and equipment 10 90 95
Amortisation of intangible assets – pre-publication 20 338 350
Amortisation of intangible assets – software 11 85 84
Amortisation of intangible assets – other 11 138 185
Impairment of intangible assets 11 – 2,548
Property and facilities 202 243
Technology and communications 218 188
Professional and outsourced services 322 378
Other general and administrative costs 140 140
Costs capitalised to intangible assets (324) (318)
Other net gains and losses (128) 25
Other income (64) (85)
Total 4,140 7,146
During the year the Group obtained the following services from the Group’s auditors:
All figures in £ millions 2017 2016
The audit of parent company and consolidated financial statements 4 5
The audit of the company’s subsidiaries 2 2
Total audit fees 6 7
Other assurance services 1 1
Other non-audit services 1 1
Total other services 2 2
Total non-audit services 2 2
Total 8 9
Reconciliation between audit and non-audit service fees is shown below:
All figures in £ millions 2017 2016
Group audit fees including fees for attestation under section 404 of the Sarbanes-Oxley Act 6 7
Non-audit fees 2 2
Total 8 9
Fees for attestation under section 404 of the Sarbanes-Oxley Act are allocated between fees payable for the audits of consolidated and subsidiary accounts.
Included in non-audit fees are amounts related to carve-out audits for disposals of £1m (2016: £1m).
Notes to the consolidated financial statements

Pearson plc Annual report and accounts 2017138
Notes to the consolidated financial statements
5. Employee information
All figures in £ millions Notes 2017 2016
Employee benefit expense
Wages and salaries (including termination costs) 1,567 1,661
Social security costs 130 124
Share-based payment costs 26 33 22
Retirement benefits – defined contribution plans 25 57 67
Retirement benefits – defined benefit plans 25 19 16
Other post-retirement medical benefits 25 (1) (2)
Total 1,805 1,888
The details of the emoluments of the Directors of Pearson plc are shown in the report on Directors’ remuneration.
Average number employed 2017 2016
Employee numbers
North America 16,295 16,841
Core 5,291 5,664
Growth 8,268 9,868
Other 485 346
Total 30,339 32,719
6. Net finance costs
All figures in £ millions Notes 2017 2016
Interest payable (99) (74)
Net foreign exchange losses – (21)
Finance costs associated with transactions (6) –
Derivatives not in a hedge relationship (5) (2)
Finance costs (110) (97)
Interest receivable 20 15
Net finance income in respect of retirement benefits 25 3 11
Net foreign exchange gains 44 1
Derivatives not in a hedge relationship 12 10
Derivatives in a hedge relationship 1 –
Finance income 80 37
Net finance costs (30) (60)
Analysed as:
Net interest payable reflected in adjusted earnings (79) (59)
Other net finance income/(costs) 49 (1)
Total net finance costs (30) (60)
Included in interest receivable is £1m (2016: £1m) of interest receivable from related parties. There was a net movement of £1m on fair value hedges in 2017 (2016: £nil), comprising a gain of £37m (2016: loss of £4m) on the underlying bonds, offset by a loss of £36m (2016: gain of £4m) on the related derivative financial instruments.
For further information on adjusted measures above, see note 8.

Section 5 Financial statements 139
7. Income tax
All figures in £ millions Notes 2017 2016
Current tax
Charge in respect of current year (121) (66)
Adjustments in respect of prior years (2) 27
Total current tax charge (123) (39)
Deferred tax
In respect of temporary differences 96 277
Other adjustments in respect of prior years 14 (16)
Total deferred tax credit 13 110 261
Total tax (charge)/credit (13) 222
The adjustments in respect of prior years in both 2017 and 2016 primarily arise from revising the previous year’s reported tax provision to reflect the tax returns subsequently filed. This results in a change between deferred and current tax as well as an absolute benefit to the total tax charge.
The tax on the Group’s profit/(loss) before tax differs from the theoretical amount that would arise using the UK tax rate as follows. Information for 2016 has been re-presented to give additional disclosure.
All figures in £ millions 2017 2016
Profit/(loss) before tax 421 (2,557)
Tax calculated at UK rate (2017: 19.25%, 2016: 20%) (81) 511
Effect of overseas tax rates 15 424
Joint venture and associate income reported net of tax 15 19
Intangible impairment not subject to tax – (722)
Intra-group financing benefit 26 34
Movement in provisions for tax uncertainties 49 (37)
Impact of US tax reform (1) –
Net expense not subject to tax (39) (8)
Gains and losses on sale of businesses not subject to tax 8 15
Utilisation of previously unrecognised tax losses and credits (1) –
Unrecognised tax losses (16) (25)
Adjustments in respect of prior years 12 11
Total tax (charge)/credit (13) 222
UK (36) 46
Overseas 23 176
Total tax (charge)/credit (13) 222
Tax rate reflected in earnings 3.1% 8.7%
The impact of US tax reform includes a benefit from revaluation of deferred tax balances to the reduced federal rate of £5m and a repatriation tax charge of £6m. The Group continues to analyse the detail of new legislation and this may result in revisions to these impacts.
Factors which may affect future tax charges include changes in tax legislation, transfer pricing regulations, the level and mix of profitability in different countries, and settlements with tax authorities.
The movement in provisions for tax uncertainties primarily reflects releases due to the expiry of relevant statutes of limitation. The current tax liability of £231m (2016: £224m) includes £280m (2016: £322m) of provisions for tax uncertainties principally in respect of a number of issues in the US, the UK and China. The issues provided for include the allocation between territories of proceeds of historic business disposals, and the potential disallowance of intra-group recharges and interest expense. The Group is currently under audit in a number of countries, and the timing of any resolution of these audits is uncertain. Of the balance of £280m, £38m relates to 2013 and earlier and is mostly under audit. In most countries tax years up to and including 2013 are now statute barred from examination by tax authorities. Of the remaining balance, £70m relates to 2014, £86m to 2015, £57m to 2016 and £29m to 2017. If relevant enquiry windows pass with no audit, management believes it is reasonably possible that provision levels will reduce by an estimated £60m within the next 12 months.
Notes to the consolidated financial statements

140 Pearson plc Annual report and accounts 2017
Notes to the consolidated financial statements
7. Income tax continued
In 2016 the Group impaired US goodwill (see note 11). The majority of this impairment charge is not deductible for tax purposes.
The tax rate reflected in adjusted earnings is calculated as follows:
All figures in £ millions 2017 2016
Profit/(loss) before tax 421 (2,557)
Adjustments:
Cost of major restructuring 79 338
Other net gains and losses (128) 25
Intangible charges 166 2,769
Other net finance (income)/costs (49) 1
Impact of US tax reform 8 –
Adjusted profit before tax 497 576
Total tax (charge)/credit (13) 222
Adjustments:
Tax benefit on cost of major restructuring (26) (84)
Tax charge/(benefit) on other net gains and losses 20 (14)
Tax benefit on intangible charges (85) (255)
Tax charge on other net finance (income)/costs 9 –
Impact of US tax reform 1 –
Tax amortisation benefit on goodwill and intangibles 39 36
Adjusted income tax charge (55) (95)
Tax rate reflected in adjusted earnings 11.1% 16.5%
For further information on adjusted measures above, see note 8.
The tax (charge)/benefit recognised in other comprehensive income is as follows:
All figures in £ millions 2017 2016
Net exchange differences on translation of foreign operations 9 (5)
Fair value gain on other financial assets (4) –
Remeasurement of retirement benefit obligations (42) 58
(37) 53

141Section 5 Financial statements
8. Earnings per share
Basic
Basic earnings per share is calculated by dividing the profit attributable to equity shareholders of the company by the weighted average number of ordinary shares in issue during the year, excluding ordinary shares purchased by the company and held as treasury shares.
Diluted
Diluted earnings per share is calculated by adjusting the weighted average number of ordinary shares to take account of all dilutive potential ordinary shares and adjusting the profit attributable, if applicable, to account for any tax consequences that might arise from conversion of those shares.
All figures in £ millions 2017 2016
Earnings/(loss) for the year 408 (2,335)
Non-controlling interest (2) (2)
Earnings/(loss) attributable to equity holders of the company 406 (2,337)
Weighted average number of shares (millions) 813.4 814.8
Effect of dilutive share options (millions) 0.3 –
Weighted average number of shares (millions) for diluted earnings 813.7 814.8
Earnings/(loss) per share
Basic 49.9p (286.8)p
Diluted 49.9p (286.8)p
Adjusted
For additional detailed information on the calculation of adjusted measures, see p192-195 (Financial key performance indicators). See note 2 for details of specific items excluded from or included in adjusted operating profit in 2017 and 2016.
In order to show results from operating activities on a consistent basis, an adjusted earnings per share is presented. The Group’s definition of adjusted earnings per share may not be comparable with other similarly titled measures reported by other companies.
Adjusted earnings is a non-GAAP (non-statutory) financial measure and is included as it is a key financial measure used by management to evaluate the performance of the Group and allocate resources to business segments. The measure also enables investors to more easily, and consistently, track the underlying operational performance of the Group and its business segments by separating out those items of income and expenditure relating to acquisition and disposal transactions, and major restructuring programmes.
Adjusted earnings per share is calculated as adjusted earnings divided by the weighted average number of shares in issue on an undiluted basis. The following items are excluded from or included in adjusted earnings:
Cost of major restructuring In January 2016, the Group announced that it was embarking on a restructuring programme to simplify the business, reduce costs and position the Group for growth in its major markets. The costs of this programme in 2016 were significant enough to exclude from the adjusted operating profit measure so as to better highlight the underlying performance. A new programme of restructuring, announced in May 2017, began in the second half of 2017 and is expected to drive further significant cost savings. The costs of this new programme have also been excluded from adjusted operating profit. See note 3 for an analysis of these costs.
Other net gains and losses These represent profits and losses on the sale of subsidiaries, joint ventures, associates and other financial assets and are excluded from adjusted earnings as they distort the performance of the Group as reported on a statutory basis.
Intangible charges These represent charges in respect of goodwill, including impairment, and intangible assets acquired through business combinations and the direct costs of acquiring those businesses. These charges are excluded as they reflect past acquisition activity and do not necessarily reflect the current year performance of the Group.
Other net finance income/costs These include finance costs in respect of retirement benefits, finance costs of deferred consideration and foreign exchange and other gains and losses. Finance income relating to retirement benefits is excluded as management does not believe that the consolidated income statement presentation under IAS 19 reflects the economic substance of the underlying assets and liabilities. Finance costs associated with transactions are excluded as these relate to future earn-outs or acquisition expenses and are not part of the underlying financing. Foreign exchange and other gains and losses are excluded as they represent short-term fluctuations in market value and are subject to significant volatility. Other gains and losses may not be realised in due course as it is normally the intention to hold the related instruments to maturity. In 2017 and 2016, the foreign exchange gains and losses largely relate to foreign exchange differences on unhedged US dollar and euro loans, cash and cash equivalents.
Notes to the consolidated financial statements

142 Pearson plc Annual report and accounts 2017
Notes to the consolidated financial statements
8. Earnings per share continued
Adjusted continued
Impact of US tax reform In 2017, as a result of US tax reform, the Group’s share of profit from associates was adversely impacted by £8m. This amount has been excluded from adjusted earnings as it is considered to be a transition adjustment that is not expected to recur in the near future.
Tax Tax on the above items is excluded from adjusted earnings. Where relevant the Group also excludes the benefit from recognising previously unrecognised pre-acquisition and capital losses. As a result of US tax reform in 2017, the reported tax charge on a statutory basis includes a benefit from the revaluation of deferred tax balances to the reduced federal rate of £5m and a repatriation tax charge of £6m. This amount has been excluded from adjusted earnings as it is considered to be a transition adjustment that is not expected to recur in the near future. The tax benefit from tax deductible goodwill and intangibles is added to the adjusted income tax charge as this benefit more accurately aligns the adjusted tax charge with the expected rate of cash tax payments.
Non-controlling interest Non-controlling interest for the above items is excluded from adjusted earnings.
The following tables reconcile the statutory income statement to the adjusted income statement.
All figures in £ millions
2017
Statutory income
statement
Cost of major
restructuring
Other net gains and
lossesIntangible
charges
Other net finance
income/ costs
Impact of US tax reform
Tax amortisation
benefit
Adjusted income
statement
Operating profit/(loss) 451 79 (128) 166 – 8 – 576
Net finance costs (30) – – – (49) – – (79)
Profit/(loss) before tax 421 79 (128) 166 (49) 8 – 497
Income tax (13) (26) 20 (85) 9 1 39 (55)
Profit/(loss) for the year 408 53 (108) 81 (40) 9 39 442
Non-controlling interest (2) – – – – – – (2)
Earnings/(loss) 406 53 (108) 81 (40) 9 39 440
Weighted average number of shares (millions) 813.4 813.4
Weighted average number of shares (millions) for diluted earnings 813.7 813.7
Earnings per share (basic) 49.9p 54.1p
Earnings per share (diluted) 49.9p 54.1p
All figures in £ millions
2016
Statutory income
statement
Cost of major
restructuring
Other net gains and
lossesIntangible
charges
Other net finance
income/ costs
Impact of US tax reform
Tax amortisation
benefit
Adjusted income
statement
Operating (loss)/profit (2,497) 338 25 2,769 – – – 635
Net finance costs (60) – – – 1 – – (59)
(Loss)/profit before tax (2,557) 338 25 2,769 1 – – 576
Income tax 222 (84) (14) (255) – – 36 (95)
(Loss)/profit for the year (2,335) 254 11 2,514 1 – 36 481
Non-controlling interest (2) – – – – – – (2)
(Loss)/earnings (2,337) 254 11 2,514 1 – 36 479
Weighted average number of shares (millions) 814.8 814.8
Weighted average number of shares (millions) for diluted earnings 814.8 814.8
(Loss)/earnings per share (basic) (286.8)p 58.8p
(Loss)/earnings per share (diluted) (286.8)p 58.8p

143Section 5 Financial statements
9. Dividends
All figures in £ millions 2017 2016
Final paid in respect of prior year 34.0p (2016: 34.0p) 277 277
Interim paid in respect of current year 5.0p (2016: 18.0p) 41 147
318 424
The Directors are proposing a final dividend in respect of the financial year ended 31 December 2017 of 12.0p per share which will absorb an estimated £93m of shareholders’ funds. It will be paid on 11 May 2018 to shareholders who are on the register of members on 6 April 2018. These financial statements do not reflect this dividend.
10. Property, plant and equipment
All figures in £ millionsLand and buildings
Plant and equipment
Assets in course of
construction Total
Cost
At 1 January 2016 359 508 22 889
Exchange differences 44 83 2 129
Additions 26 59 4 89
Disposals (26) (100) – (126)
Disposal through business disposal (1) (2) – (3)
Reclassifications (4) 12 (8) –
At 31 December 2016 398 560 20 978
Exchange differences (20) (29) (2) (51)
Additions 26 40 24 90
Disposals (13) (34) – (47)
Disposal through business disposal (11) (5) – (16)
Reclassifications 5 8 (13) –
Transfer to intangible assets – (11) – (11)
Transfer to assets classified as held for sale (55) (2) – (57)
At 31 December 2017 330 527 29 886
All figures in £ millionsLand and buildings
Plant and equipment
Assets in course of
construction Total
Depreciation
At 1 January 2016 (192) (377) – (569)
Exchange differences (26) (62) – (88)
Charge for the year (34) (61) – (95)
Disposals 22 95 – 117
Reclassifications 1 (1) – –
At 31 December 2016 (229) (406) – (635)
Exchange differences 12 23 – 35
Charge for the year (35) (55) – (90)
Disposals 9 26 – 35
Disposal through business disposal 6 3 – 9
Transfer to assets classified as held for sale 40 1 – 41
At 31 December 2017 (197) (408) – (605)
Carrying amounts
At 1 January 2016 167 131 22 320
At 31 December 2016 169 154 20 343
At 31 December 2017 133 119 29 281
Notes to the consolidated financial statements

144 Pearson plc Annual report and accounts 2017
Notes to the consolidated financial statements
10. Property, plant and equipment continued
Depreciation expense of £23m (2016: £21m) has been included in the income statement in cost of goods sold and £67m (2016: £74m) in operating expenses.
The Group leases certain equipment under a number of finance lease agreements. The net carrying amount of leased plant and equipment included within property, plant and equipment was £9m (2016: £10m).
11. Intangible assets
All figures in £ millions Goodwill Software
Acquired customer
lists, contracts and relationships
Acquired trademarks and brands
Acquired publishing
rights
Other intangibles
acquired Total
Cost
At 1 January 2016 4,134 619 860 281 180 509 6,583
Exchange differences 752 85 157 65 31 135 1,225
Impairment (2,548) – – – – – (2,548)
Additions – internal development – 132 – – – – 132
Additions – purchased – 25 – – – – 25
Disposals – (49) (37) – – – (86)
Acquisition through business combination 3 – – 7 – 3 13
Disposal through business disposal – – (6) – – (47) (53)
Transfer to intangible assets – pre-publication – (14) – – – – (14)
At 31 December 2016 2,341 798 974 353 211 600 5,277
Exchange differences (148) (46) (74) (26) (6) (50) (350)
Impairment – – – – – – –
Additions – internal development – 133 – – – – 133
Additions – purchased – 17 – – – – 17
Disposals – (23) – – – – (23)
Disposal through business disposal – (4) (9) (19) – (27) (59)
Transfer from property, plant and equipment – 11 – – – – 11
Transfer to assets classified as held for sale (163) (4) (2) (27) (21) (34) (251)
At 31 December 2017 2,030 882 889 281 184 489 4,755

145Section 5 Financial statements
11. Intangible assets continued
All figures in £ millions Goodwill Software
Acquired customer
lists, contracts and relationships
Acquired trademarks and brands
Acquired publishing
rights
Other intangibles
acquired Total
Amortisation
At 1 January 2016 – (357) (430) (155) (163) (314) (1,419)
Exchange differences – (60) (83) (32) (27) (75) (277)
Charge for the year – (84) (85) (22) (8) (70) (269)
Disposals – 38 37 – – – 75
Disposal through business disposal – – 6 – – 47 53
Transfer to intangible assets – pre-publication – 2 – – – – 2
At 31 December 2016 – (461) (555) (209) (198) (412) (1,835)
Exchange differences – 30 43 13 4 36 126
Charge for the year – (85) (77) (18) (3) (40) (223)
Disposals – 21 – – – – 21
Disposal through business disposal – 2 8 18 – 22 50
Transfer to assets classified as held for sale – – 1 16 19 34 70
At 31 December 2017 – (493) (580) (180) (178) (360) (1,791)
Carrying amounts
At 1 January 2016 4,134 262 430 126 17 195 5,164
At 31 December 2016 2,341 337 419 144 13 188 3,442
At 31 December 2017 2,030 389 309 101 6 129 2,964
Goodwill
The goodwill carrying value of £2,030m relates to acquisitions completed after 1 January 1998. Prior to 1 January 1998 all goodwill was written off to reserves on the date of acquisition. For acquisitions completed between 1 January 1998 and 31 December 2002, no value was ascribed to intangibles other than goodwill which was amortised over a period of up to 20 years. On adoption of IFRS on 1 January 2003, the Group chose not to restate the goodwill balance and at that date the balance was frozen (i.e. amortisation ceased). If goodwill had been restated, then a significant value would have been ascribed to other intangible assets, which would be subject to amortisation, and the carrying value of goodwill would be significantly lower. For acquisitions completed after 1 January 2003, value has been ascribed to other intangible assets which are amortised.
Other intangible assets
Other intangibles acquired include content, technology and software rights.
Intangible assets are valued separately for each acquisition and the primary method of valuation used is the discounted cash flow method. The majority of acquired intangibles are amortised using an amortisation profile based on the projected cash flows underlying the acquisition date valuation of the intangible asset, which generally results in a larger proportion of amortisation being recognised in the early years of the asset’s life. The Group keeps the expected pattern of consumption under review.
Amortisation of £17m (2016: £17m) is included in the income statement in cost of goods sold and £206m (2016: £252m) in operating expenses.
Notes to the consolidated financial statements

146 Pearson plc Annual report and accounts 2017
11. Intangible assets continued
Other intangible assets continued
The range of useful economic lives for each major class of intangible asset (excluding goodwill and software) is shown below:
Class of intangible asset
2017
Useful economic life
Acquired customer lists, contracts and relationships 3-20 years
Acquired trademarks and brands 2-20 years
Acquired publishing rights 5-20 years
Other intangibles acquired 2-20 years
The expected amortisation profile of acquired intangible assets is shown below:
All figures in £ millions
2017
One to five years
Six to ten years
More than ten years Total
Class of intangible asset
Acquired customer lists, contracts and relationships 215 75 19 309
Acquired trademarks and brands 56 31 14 101
Acquired publishing rights 5 1 – 6
Other intangibles acquired 97 32 – 129
Impairment tests for cash-generating units (CGUs) containing goodwill
Impairment tests have been carried out where appropriate as described below. Goodwill was allocated to CGUs, or an aggregation of CGUs, where goodwill could not be reasonably allocated to individual business units. Impairment reviews were conducted on these CGUs. The recoverable amount for each unit exceeds its carrying value therefore there is no impairment in 2017. The carrying value of the goodwill in each of the CGUs is summarised below:
All figures in £ millions 2017 2016
North America 1,013 1,295
Core 641 633
Growth (includes Brazil, China, India and South Africa) – –
Pearson VUE 376 413
Total 2,030 2,341
The recoverable amount of each aggregated CGU is based on fair value less costs of disposal. Goodwill is tested at least annually for impairment. Other than goodwill there are no intangible assets with indefinite lives. The goodwill is generally denominated in the currency of the relevant cash flows and therefore the impairment review is not materially sensitive to exchange rate fluctuations.
Notes to the consolidated financial statements

147Section 5 Financial statements
11. Intangible assets continued
Key assumptions
For the purpose of estimating the fair value less costs of disposal of the CGUs, management has used an income approach based on present value techniques. The calculations use cash flow projections based on financial budgets approved by management covering a five-year period, management’s best estimate about future developments and market assumptions. The fair value less costs of disposal measurement is categorised as Level 3 on the fair value hierarchy. The key assumptions used by management in the fair value less costs of disposal calculations were:
Discount rates The discount rate is based on the risk-free rate for government bonds, adjusted for a risk premium to reflect the increased risk in investing in equities. The risk premium adjustment is assessed for each specific CGU. The average post-tax discount rates range from 8.4% to 14.3%. Discount rates are lower for those businesses which operate in more mature markets with low inflation and higher for those operating in emerging markets with higher inflation.
Perpetuity growth rates A perpetuity growth rate of 2.0% was used for cash flows subsequent to the approved budget period for CGUs operating in mature markets. This perpetuity growth rate is a conservative rate and is considered to be lower than the long-term historical growth rates of the underlying territories in which the CGU operates and the long-term growth rate prospects of the sectors in which the CGU operates. CGU growth rates between 3.0% and 6.9% were used for cash flows subsequent to the approved budget period for CGUs operating in emerging markets with high inflation. These growth rates are also below the long-term historical growth rates in these markets.
The key assumptions used by management in setting the financial budgets for the initial five-year period were as follows:
Forecast sales growth rates Forecast sales growth rates are based on past experience adjusted for the strategic direction and near-term investment priorities within each CGU. Key assumptions include growth in Online Program Management, Online Blended Learning and Professional Certification, stabilisation in UK Qualifications and US Assessments, and ongoing pressures in the US higher education courseware market. The five-year sales forecasts use average nominal growth rates between 3% and 6% for mature markets and between 5% and 14% for emerging markets with high inflation.
Operating profits Operating profits are forecast based on historical experience of operating margins, adjusted for the impact of changes to product costs and cost-saving initiatives, including the impact of the implementation of our cost efficiency programme.
Cash conversion Cash conversion is the ratio of operating cash flow to operating profit. Management forecasts cash conversion rates based on historical experience.
Sensitivities
The Group’s impairment review is sensitive to a change in assumptions used, most notably the discount rates and the perpetuity growth rates.
The carrying value of goodwill in the Growth market CGUs was written down to £nil in 2015.
A 0.1% increase in discount rates would cause the fair value less costs of disposal of the North America CGU to reduce by £50m, the Core GGU by £17m and the VUE CGU by £21m.
A 0.1% reduction in perpetuity growth rates would cause the fair value less costs of disposal of the North America CGU to reduce by £39m, the Core CGU by £14m and the VUE CGU by £17m.
The Core CGU is highly sensitive to any reductions in short-term cash flows, whether driven by lower sales growth, lower operating profits or lower cash conversion. A 5% reduction in total annual operating profits, spread evenly across all CGUs, would give rise to an impairment of £66m in the Core CGU. An increase in discount rates or a reduction in perpetuity growth rates would also give rise to an impairment in the Core CGU. The North America CGU is no longer considered to be highly sensitive to changes in impairment assumptions, with increased headroom when compared to 2016.
2016 impairment tests
At the end of 2016, following trading in the final quarter of the year, it became clear that the underlying issues in the US higher education courseware business market were more severe than anticipated. These issues related to declining student enrolments, changes in buying patterns of students and correction of inventory levels by distributors and bookshops. As a result, in January 2017, strategic plans and estimates for future cash flows were revised and we determined during the goodwill impairment review that the fair value less costs of disposal of the North America CGU no longer supported the carrying value of this goodwill and as a consequence impaired goodwill by £2,548m.
Notes to the consolidated financial statements

148 Pearson plc Annual report and accounts 2017
12. Investments in joint ventures and associates
The amounts recognised in the balance sheet are as follows:
All figures in £ millions 2017 2016
Associates 395 1,245
Joint ventures 3 2
Total 398 1,247
The amounts recognised in the income statement are as follows:
All figures in £ millions 2017 2016
Associates 77 98
Joint ventures 1 (1)
Total 78 97
Investment in associates
The Group has the following material associates:
Principal place of business
Ownership interest
Nature of relationship
Measurement method
Penguin Random House Ltd UK/Global 25% See below Equity
Penguin Random House LLC US 25% See below Equity
On 1 July 2013, Penguin Random House was formed, upon the completion of an agreement between Pearson and Bertelsmann to merge their respective trade publishing companies, Penguin and Random House, with the parent companies owning 47% and 53% of the combined business respectively. On 5 October 2017, Pearson sold a 22% stake in Penguin Random House to Bertelsmann, retaining a 25% share (see note 31 for more information on disposal of associates). Pearson owns its 25% interest in Penguin Random House via 25% interests in each of the two entities listed in the table above. Despite the separate legal structures of the two Penguin Random House entities, Pearson regards Penguin Random House as one combined global business. Consequently, Pearson discloses Penguin Random House as one single operating segment and presents disclosures related to its interests in Penguin Random House on a combined basis.
The shareholder agreement includes protective rights for Pearson as the minority shareholder, including rights to dividends. Management considers ownership percentage, Board composition and the additional protective rights, and exercises judgement to determine that Pearson has significant influence over Penguin Random House and Bertelsmann has the power to direct the relevant activities and therefore control. Following the transaction in 2017 the assessment of significant influence has not changed. Penguin Random House does not have a quoted market price.
Notes to the consolidated financial statements

149Section 5 Financial statements
12. Investments in joint ventures and associates continued
Investment in associates continued
The summarised financial information of the material associate is detailed below:
All figures in £ millions
2017 2016
Penguin Random
House
Penguin Random
House
Assets
Non-current assets 1,048 1,267
Current assets 1,758 1,587
Liabilities
Non-current liabilities (859) (394)
Current liabilities (1,579) (1,074)
Net assets 368 1,386
Sales 2,693 2,620
Profit for the year 171 209
Other comprehensive expense (60) (14)
Total comprehensive income 111 195
Dividends received from associate in relation to profits 146 131
Re-capitalisation dividends received from associate 312 –
The information above reflects the amounts presented in the financial statements of the associate, adjusted for fair value and similar adjustments. The tax on Penguin Random House LLC is settled by the partners. For the purposes of clear and consistent presentation, the tax has been shown in the associate line items in the consolidated income statement and consolidated balance sheet, recording the Group’s share of profit after tax consistently for the Penguin Random House associates.
A reconciliation of the summarised financial information to the carrying value of the material associate is shown below:
All figures in £ millions
2017 2016
Penguin Random
House
Penguin Random
House
Opening net assets 1,386 1,206
Exchange differences (18) 179
Profit for the year 171 209
Other comprehensive expense (60) (14)
Dividends, net of tax paid (1,167) (194)
Tax adjustments in relation to disposals 56 –
Closing net assets 368 1,386
Share of net assets 92 651
Goodwill 296 589
Carrying value of associate 388 1,240
Notes to the consolidated financial statements

150 Pearson plc Annual report and accounts 2017
12. Investments in joint ventures and associates continued
Investment in associates continued
Information on other individually immaterial associates is detailed below:
All figures in £ millions 2017 2016
Profit for the year 7 –
Total comprehensive income 7 –
Transactions with material associates
The Group has loans to Penguin Random House which are unsecured and interest is calculated based on market rates. The amount outstanding at 31 December 2017 was £46m (2016: £33m). The loans are provided under a working capital facility and fluctuate during the year. The loan outstanding at 31 December 2017 was repaid in its entirety in January 2018.
The Group also has a current asset receivable of £19m (2016: £21m) from Penguin Random House and a current liability payable of £3m (2016: £nil) arising from the provision of services. Included in other income (note 4) is £3m (2016: £4m) of service fees. In addition, the Group will receive a further re-capitalisation dividend of £49m in April 2018, which was triggered by the Group’s decision to sell a 22% stake in Penguin Random House in 2017.
Investment in joint ventures
Information on joint ventures, all of which are individually immaterial, is detailed below:
All figures in £ millions 2017 2016
Profit/(loss) for the year 1 (1)
Total comprehensive income/(expense) 1 (1)
13. Deferred income tax
All figures in £ millions 2017 2016
Deferred income tax assets 95 451
Deferred income tax liabilities (164) (466)
Net deferred income tax (69) (15)
Substantially all of the deferred income tax assets are expected to be recovered after more than one year.
Deferred income tax assets and liabilities shall be offset when there is a legally enforceable right to offset current income tax assets with current income tax liabilities and where the deferred income taxes relate to the same fiscal authority. At 31 December 2017, the Group has unrecognised deferred income tax assets of £32m (2016: £32m) in respect of UK losses, £18m (2016: £18m) in respect of US losses and approximately £86m (2016: £95m) in respect of losses in other territories. The UK losses are capital losses. The US losses relate to state taxes and therefore have expiry periods of between five and 20 years. Other deferred tax assets of £12m (2016: £9m) have not been recognised.
Deferred tax assets of £75m (2016: £95m) have been recognised in countries that reported a loss in either the current or preceding year. The majority arises in Brazil in respect of tax deductible goodwill. It is considered more likely than not that there will be sufficient future taxable profits to realise these assets.
The recognition of the deferred income tax assets is supported by management’s forecasts of the future profitability of the relevant countries.
Notes to the consolidated financial statements

151Section 5 Financial statements
13. Deferred income tax continued
The movement in deferred income tax assets and liabilities during the year is as follows:
All figures in £ millionsTrading
lossesReturns
provisions
Retirement benefit
obligationsDeferred revenue
Goodwill and intangibles Other Total
Deferred income tax assets/(liabilities)
At 1 January 2016 19 43 (9) 55 (348) (44) (284)
Exchange differences 3 7 10 15 (84) 27 (22)
Income statement (charge)/benefit – (15) (4) 50 144 86 261
Disposal through business disposal – – – (3) (7) – (10)
Tax benefit in other comprehensive income – – 40 – – – 40
At 31 December 2016 22 35 37 117 (295) 69 (15)
Exchange differences (2) (3) (4) (8) 19 (8) (6)
Income statement (charge)/benefit (11) 6 7 (9) 118 (1) 110
Disposal through business disposal – – – – – (3) (3)
Tax charge in other comprehensive income – – (84) – – (5) (89)
Transfer to assets/(liabilities) classified as held for sale – (4) – (73) 3 8 (66)
At 31 December 2017 9 34 (44) 27 (155) 60 (69)
Other deferred income tax items include temporary differences in respect of share-based payments, provisions, depreciation and royalty advances.
14. Classification of financial instruments
The accounting classification of each class of the Group’s financial assets and their carrying values, is as follows:
All figures in £ millions Notes
2017 2016
Fair valueAmortised
cost
Total carrying
value
Fair valueAmortised
cost
Total carrying
valueAvailable
for sale
Derivatives held for trading
Derivatives in hedge
relationshipLoans and
receivablesAvailable
for sale
Derivatives held for trading
Derivatives in hedge
relationshipLoans and
receivables
Investments in unlisted securities 15 77 – – – 77 65 – – – 65
Cash and cash equivalents 17 – – – 518 518 – – – 1,459 1,459
Cash and cash equivalents – within assets classified as held for sale 32 – – – 127 127 – – – – –
Marketable securities 8 – – – 8 10 – – – 10
Derivative financial instruments 16 – 3 137 – 140 – 3 168 – 171
Trade receivables 22 – – – 760 760 – – – 982 982
Trade receivables – within assets classified as held for sale – – – 22 22 – – – – –
Total financial assets 85 3 137 1,427 1,652 75 3 168 2,441 2,687
The carrying value of the Group’s financial assets is equal to, or approximately equal to, the market value.
Notes to the consolidated financial statements

152 Pearson plc Annual report and accounts 2017
14. Classification of financial instruments continued
The accounting classification of each class of the Group’s financial liabilities, together with their carrying values and market values, is as follows:
All figures in £ millions Notes
2017 2016
Fair valueAmortised
cost
Total carrying
value
Total market
value
Fair valueAmortised
cost
Total carrying
value
Total market
value
Derivatives held for trading
Derivatives in hedge
relationshipOther
liabilities
Derivatives held for trading
Derivatives in hedge
relationshipOther
liabilities
Derivative financial liabilities 16 – (140) – (140) (140) (7) (257) – (264) (264)
Trade payables 24 – – (265) (265) (265) – – (333) (333) (333)
Trade payables – within liabilities classified as held for sale – – (20) (20) (20) – – – – –
Liability to purchase own shares 24 – – (151) (151) (151) – – – – –
Bank loans and overdrafts 18 – – (15) (15) (15) – – (39) (39) (39)
Other borrowings due within one year 18 – – (4) (4) (4) – – (5) (5) (5)
Borrowings due after more than one year 18 – – (1,066) (1,066) (1,070) – – (2,424) (2,424) (2,385)
Total financial liabilities – (140) (1,521) (1,661) (1,665) (7) (257) (2,801) (3,065) (3,026)
Fair value measurement
As shown above, the Group’s derivative assets and liabilities, unlisted securities and marketable securities are held at fair value. Financial instruments that are measured subsequently to initial recognition at fair value are grouped into levels 1 to 3, based on the degree to which the fair value is observable, as follows:
Level 1 fair value measurements are those derived from unadjusted quoted prices in active markets for identical assets or liabilities.
Level 2 fair value measurements are those derived from inputs, other than quoted prices included within level 1, that are observable for the asset or liability, either directly (as prices) or indirectly (derived from prices).
Level 3 fair value measurements are those derived from valuation techniques that include inputs for the asset or liability that are not based on observable market data (unobservable inputs).
The Group’s derivative assets valued at £140m (2016: £171m) and derivative liabilities valued at £140m (2016: £264m) are classified as level 2. The Group’s marketable securities valued at £8m (2016: £10m) are classified as level 2. The Group’s investments in unlisted securities are valued at £77m (2016: £65m) and are classified as level 3.
The following table analyses the movements in level 3 fair value remeasurements:
All figures in £ millions
2017 2016
Investments in unlisted securities
Investments in unlisted securities
At beginning of year 65 143
Exchange differences (4) 8
Acquisition of investments 3 6
Fair value movements 13 –
Disposal of investments – (92)
At end of year 77 65
The fair value of the investments in unlisted securities is determined by reference to the financial performance of the underlying asset, recent funding rounds and amounts realised on the sale of similar assets.
Notes to the consolidated financial statements

153Section 5 Financial statements
15. Other financial assets
All figures in £ millions 2017 2016
At beginning of year 65 143
Exchange differences (4) 8
Acquisition of investments 3 6
Fair value movements 13 –
Disposal of investments – (92)
At end of year 77 65
Other financial assets comprise unlisted securities of £77m (2016: £65m).
16. Derivative financial instruments
The Group’s approach to the management of financial risks is set out in note 19. The Group’s outstanding derivative financial instruments are as follows:
All figures in £ millions
2017 2016
Gross notional amounts Assets Liabilities
Gross notional amounts Assets Liabilities
Interest rate derivatives – in a fair value hedge relationship 799 23 – 2,157 68 (4)
Interest rate derivatives – not in a hedge relationship 429 3 – 1,187 3 (7)
Cross-currency rate derivatives – in a hedge relationship 1,522 114 (140) 1,622 100 (253)
Total 2,750 140 (140) 4,966 171 (264)
Analysed as expiring:
In less than one year – – – 162 – –
Later than one year and not later than five years 1,638 65 (95) 2,776 86 (157)
Later than five years 1,112 75 (45) 2,028 85 (107)
Total 2,750 140 (140) 4,966 171 (264)
The Group has issued both euro and US dollar fixed rate debt. The fixed rate euro debt is converted to either a fixed or floating rate US dollar exposure using interest rate and cross-currency swaps. The Group’s remaining fixed rate US dollar debt is held as fixed rate instruments.
The Group receives interest under its euro debt related swap contracts to match the interest on the bonds (ranging from a receipt of 1.375% on its euro 2025 notes to 1.875% on its euro 2021 notes) and, in turn, pays US dollar interest at rates ranging between US Libor + 0.84% to US Libor + 1.35%.
Interest rate swaps are then used to fix an element of the interest charge, in line with the Group’s interest rate hedging policy, which requires a proportion of the Group’s gross debt to be fixed in line with the Group’s hedging policy. During 2017 Pearson executed a number of floating interest rate swaps to match the maturity of the 2021 and 2025 euro bonds mitigating the exposure to interest rate increases. The all-in rates (including the Libor spread) that the Group pays are between 2.78% and 3.58%. At 31 December 2017, the Group had contracts to fix $579m of debt over the next 12 months and $331m of outstanding fixed rate bonds bringing the total fixed rate debt to $910m.
At the end of 2017, the currency split of the mark-to-market values of rate derivatives, including the exchange of principal on cross currency rate derivatives, was US dollar £(869)m, sterling £12m and euro £857m (2016: US dollar £(1,051)m, sterling £19m and euro £939m).
The Group’s portfolio of rate derivatives is diversified by maturity, counterparty and type. Natural offsets between transactions within the portfolio and the designation of certain derivatives as hedges significantly reduce the risk of income statement volatility. The sensitivity of the portfolio to changes in market rates is set out in note 19.
Notes to the consolidated financial statements

154 Pearson plc Annual report and accounts 2017
16. Derivative financial instruments continued
Derivative financial assets and liabilities subject to offsetting arrangements are as follows:
All figures in £ millions
2017 2016
Gross derivative
assets
Gross derivative liabilities
Net derivative assets/
liabilities
Gross derivative
assets
Gross derivative liabilities
Net derivative assets/
liabilities
Counterparties in an asset position 103 (78) 25 30 (11) 19
Counterparties in a liability position 37 (62) (25) 141 (253) (112)
Total as presented in the balance sheet 140 (140) – 171 (264) (93)
All of the Group’s derivative financial instruments are subject to enforceable netting arrangements with individual counterparties, allowing net settlement in the event of default of either party. Offset arrangements in respect of cash balances are described in note 17.
Counterparty exposure from all derivatives is managed, together with that from deposits and bank account balances, within credit limits that reflect published credit ratings and by reference to other market measures (e.g. market prices for credit default swaps) to ensure that there is no significant risk to any one counterparty.
In accordance with IAS 39 ‘Financial Instruments: Recognition and Measurement’, the Group has reviewed all of its material contracts for embedded derivatives that are required to be separately accounted for if they do not meet certain requirements, and has concluded that there are no material embedded derivatives.
17. Cash and cash equivalents (excluding overdrafts)
All figures in £ millions 2017 2016
Cash at bank and in hand 361 570
Short-term bank deposits 157 889
518 1,459
Cash at bank and in hand – within assets classified as held for sale 127 –
645 1,459
Short-term bank deposits are invested with banks and earn interest at the prevailing short-term deposit rates.
At the end of 2017, the currency split of cash and cash equivalents was US dollar 36% (2016: 34%), sterling 8% (2016: 40%), euro 7% (2016: 3%), renminbi 20% (2016: 10%) and other 29% (2016: 13%). At the end of 2017, a significant proportion of the renminbi cash relates to assets held for sale.
Cash and cash equivalents have fair values that approximate to their carrying value due to their short-term nature. Cash and cash equivalents include the following for the purpose of the cash flow statement:
All figures in £ millions 2017 2016
Cash and cash equivalents 518 1,459
Cash and cash equivalents – within assets classified as held for sale 127 –
Bank overdrafts (15) (35)
630 1,424
The Group has certain cash pooling arrangements in US dollars, sterling, euro and Canadian dollars where both the company and the bank have a legal right of offset. At 31 December 2017, the offsetting amounts are presented gross in the balance sheet. Offset arrangements in respect of derivatives are shown in note 16.
Notes to the consolidated financial statements

155Section 5 Financial statements
18. Financial liabilities – borrowings
The Group’s current and non-current borrowings are as follows:
All figures in £ millions 2017 2016
Non-current
6.25% Global dollar bonds 2018 (nominal amount $550m) – 469
4.625% US dollar notes 2018 (nominal amount $300m) – 254
1.875% euro notes 2021 (nominal amount €500m) 463 453
3.75% US dollar notes 2022 (nominal amount $117m; 2016: nominal amount $500m) 85 407
3.25% US dollar notes 2023 (nominal amount $94m; 2016: nominal amount $500m) 69 402
1.375% euro notes 2025 (nominal amount €500m) 445 435
Finance lease liabilities 4 4
1,066 2,424
Current
Due within one year or on-demand:
Bank loans and overdrafts 15 39
Finance lease liabilities 4 5
19 44
Total borrowings 1,085 2,468
Included in the non-current borrowings above is £10m of accrued interest (2016: £18m). Included in the current borrowings above is £nil of accrued interest (2016: £nil).
The maturity of the Group’s non-current borrowing is as follows:
All figures in £ millions 2017 2016
Between one and two years 3 726
Between two and five years 549 454
Over five years 514 1,244
1,066 2,424
The carrying amounts and market values of borrowings are as follows:
All figures in £ millions
2017 2016
Effective interest rate
Carrying value
Market value
Effective interest rate
Carrying value
Market value
Bank loans and overdrafts n/a 15 15 n/a 39 39
6.25% Global dollar bonds 2018 n/a – – 6.46% 469 468
4.625% US dollar notes 2018 n/a – – 4.69% 254 250
1.875% euro notes 2021 2.04% 463 467 2.04% 453 454
3.75% US dollar notes 2022 3.94% 85 87 3.94% 407 396
3.25% US dollar notes 2023 3.36% 69 67 3.36% 402 381
1.375% euro notes 2025 1.44% 445 445 1.44% 435 432
Finance lease liabilities n/a 8 8 n/a 9 9
1,085 1,089 2,468 2,429
The market values stated above are based on clean market prices at the year end or, where these are not available, on the quoted market prices of comparable debt issued by other companies. The effective interest rates above relate to the underlying debt instruments.
Notes to the consolidated financial statements

156 Pearson plc Annual report and accounts 2017
18. Financial liabilities – borrowings continued
The carrying amounts of the Group’s borrowings before the effect of derivatives (see notes 16 and 19 for further information on the impact of derivatives) are denominated in the following currencies:
All figures in £ millions 2017 2016
US dollar 172 1,559
Sterling 1 13
Euro 911 892
Other 1 4
1,085 2,468
The Group has $1.75bn (£1.3bn) of undrawn capacity on its committed borrowing facilities as at 31 December 2017 (2016: $1.75bn (£1.4bn) undrawn). In addition, there are a number of short-term facilities that are utilised in the normal course of business.
All of the Group’s borrowings are unsecured. In respect of finance lease obligations, the rights to the leased asset revert to the lessor in the event of default.
The maturity of the Group’s finance lease obligations is as follows:
All figures in £ millions 2017 2016
Finance lease liabilities – minimum lease payments
Not later than one year 4 5
Later than one year and not later than two years 3 3
Later than two years and not later than three years 1 1
Later than three years and not later than four years – –
Later than four years and not later than five years – –
Later than five years – –
Future finance charges on finance leases – –
Present value of finance lease liabilities 8 9
The present value of the Group’s finance lease obligations is as follows:
All figures in £ millions 2017 2016
Not later than one year 4 5
Later than one year and not later than five years 4 4
Later than five years – –
8 9
The carrying amounts of the Group’s lease obligations approximate their fair value.
19. Financial risk management
The Group’s approach to the management of financial risks together with sensitivity analyses of its financial instruments is set out below.
Treasury policy
Pearson’s treasury function has primary responsibility for managing certain financial risks to which the Group is exposed. The Group’s treasury policies are approved by the Board of Directors annually and the Audit Committee receives regular reports on the Group’s treasury activities, policies and procedures. The Group’s treasury function is not run as a profit centre and does not enter into any transactions for speculative purposes.
The treasury function is permitted to use derivatives for risk management purposes which may include interest rate swaps, rate caps and collars, currency rate swaps and forward foreign exchange contracts, of which interest rate swaps and forward foreign exchange swaps are the most commonly used.
Notes to the consolidated financial statements

157Section 5 Financial statements
19. Financial risk management continued
Capital risk
The Group’s primary objective when managing capital is to safeguard its ability to continue as a going concern and retain financial flexibility by maintaining a strong balance sheet. The Group aims to maintain net debt at a level less than 1.5 times EBITDA, which is consistent with a solid investment grade rating (assuming no material deterioration in trading performance) and provides comfortable headroom against covenants. This should permit the business to invest in organic growth. Shareholder returns are made through a sustainable and progressive dividend policy. Any surplus cash is returned to shareholders via share buybacks or special dividends.
The Group is currently rated BBB (negative outlook) with Standard and Poor’s and Baa2 (negative outlook) with Moody’s.
Net debt
The Group’s net debt position is set out below:
All figures in £ millions 2017 2016
Cash and cash equivalents 645 1,459
Marketable securities 8 10
Derivative financial instruments – (93)
Bank loans and overdrafts (15) (39)
Bonds (1,062) (2,420)
Finance lease liabilities (8) (9)
Net debt (432) (1,092)
Interest and foreign exchange rate management
The Group’s principal currency exposure is to the US dollar which represents more than 60% of the Group’s sales.
The Group’s long-term debt is primarily held in US dollars to provide a natural hedge of this exposure, which is achieved through issued US dollar debt or by converting euro debt to US dollars using cross-currency swaps.
As at 31 December 2017, £674m of the Group’s debt is held at fixed rates (2016: £650m), with £411m held at floating rates (2016: £1,818m), partially offset by US dollar cash balances which attract floating rate interest. As at 31 December 2017, a 1% movement in US dollar interest rates for one year would result in a £2m movement in the interest charge (2016: £13m).
Overseas profits are converted to sterling to satisfy sterling cash outflows such as dividends at the prevailing spot rate at the time of the transaction. To the extent the Group has sufficient sterling, US dollars may be held as dollar cash to provide a natural offset to the Group’s debt or to satisfy future US dollar cash outflows.
The Group does not have significant cross border foreign exchange transactional exposures.
As at 31 December 2017, the sensitivity of the carrying value of the Group’s financial instruments to fluctuations in interest rates and exchange rates is as follows:
All figures in £ millionsCarrying
value
Impact of 1% increase in
interest rates
Impact of 1% decrease in
interest rates
Impact of 10% strengthening
in sterling
Impact of 10% weakening in
sterling
Investments in unlisted securities 77 – – (6) 7
Cash and cash equivalents 645 – – (54) 66
Marketable securities 8 – – – –
Derivative financial instruments – (26) 26 1 (1)
Bonds (1,062) 45 (48) 97 (118)
Other borrowings (23) – – 2 (2)
Liability to purchase own shares (151) – – – –
Other net financial assets 497 – – (41) 50
Total financial instruments (9) 19 (22) (1) 2
The table shows the sensitivities of the fair values of each class of financial instruments to an isolated change in either interest rates or foreign exchange rates. Other net financial assets comprises trade receivables less trade payables. A significant proportion of the movements shown above would impact equity rather than the income statement due to the location and functional currency of the entities in which they arise and the availability of net investment hedging.
Notes to the consolidated financial statements

Pearson plc Annual report and accounts 2017158
19. Financial risk management continued
Interest and foreign exchange rate management continued
The Group’s income statement is reported at average rates for the year while the balance sheet is translated at the year-end closing rate. Differences between these rates can distort ratio calculations such as debt to EBITDA and interest cover. Adjusted operating profit translated at year-end closing rates would be £22m lower than the reported figure of £576m at £554m (2016: £55m higher if translated at the year-end 2016 rate instead of the 2016 average rate at £690m compared with a reported figure of £635m). EBITDA translated at year-end closing rates would be £25m lower than the reported figure of £738m at £713m (2016: £63m higher if translated at the year-end 2016 rate instead of the 2016 average rate, at £848m, compared with a reported figure of £785m).
Liquidity and re-financing risk management
The Group regularly reviews the level of cash and debt facilities required to fund its activities. This involves preparing a prudent cash flow forecast for the next three to five years, determining the level of debt facilities required to fund the business, planning for shareholder returns and repayments of maturing debt, and identifying an appropriate amount of headroom to provide a reserve against unexpected outflows.
At 31 December 2017, the Group had cash of £0.6bn and an undrawn US dollar denominated revolving credit facility due 2021 of $1.75bn (£1.3bn). At 31 December 2016, the Group had cash of £1.5bn and an undrawn US dollar denominated revolving credit facility due 2021 of $1.75bn (£1.4bn).
The $1.75bn facility contains interest cover and leverage covenants which the Group has complied with for the year ended 31 December 2017.
At the end of 2017, the currency split of the Group’s trade payables was US dollar £137m, sterling £58m and other currencies £90m (2016: US dollar £164m, sterling £67m and other currencies £102m) . Trade payables are all due within one year (2016: all due within one year).
The following table analyses the Group’s bonds and derivative assets and liabilities into relevant maturity groupings based on the remaining period at the balance sheet date to the contractual maturity date. The amounts disclosed in the table are the contractual undiscounted cash flows (including interest) and as such may differ from the amounts disclosed on the balance sheet.
All figures in £ millions
Analysed by maturity
Total
Analysed by currency
TotalLess than one year
Later than one year but less than five
yearsFive years
or more USD GBP Other
At 31 December 2017
Bonds 20 601 533 1,154 184 – 970 1,154
Rate derivatives – inflows (38) (975) (684) (1,697) (53) (751) (893) (1,697)
Rate derivatives – outflows 48 1,060 667 1,775 1,003 751 21 1,775
Total 30 686 516 1,232 1,134 – 98 1,232
At 31 December 2016
Bonds 82 1,308 1,292 2,682 1,732 – 950 2,682
Rate derivatives – inflows (103) (1,086) (867) (2,056) (239) (838) (979) (2,056)
Rate derivatives – outflows 82 1,202 891 2,175 1,308 838 29 2,175
Total 61 1,424 1,316 2,801 2,801 – – 2,801
Financial counterparty risk management
Counterparty credit limits, which take published credit rating and other factors into account, are set to cover the Group’s total aggregate exposure to a single financial institution. The limits applicable to published credit rating bands are approved by the Chief Financial Officer within guidelines approved by the board. Exposures and limits applicable to each financial institution are reviewed on a regular basis.
Cash deposits and derivative transactions are made with approved counterparties up to pre-agreed limits. To manage counterparty risk associated with cash and cash equivalents, the Group uses a mixture of money market funds as well as bank deposits. As at 31 December 2017, 58% of cash and cash equivalents was held with investment grade bank counterparties, 38% with AAA money market funds and 4% held with non-investment grade bank counterparties. As at 31 December 2017, the Group had a net exposure of £24m with investment grade counterparties for derivative transactions.
Notes to the consolidated financial statements

Section 5 Financial statements 159
20. Intangible assets – pre-publication
All figures in £ millions 2017 2016
Cost
At beginning of year 2,417 2,201
Exchange differences (168) 380
Additions 362 395
Disposal through business disposal (1) (8)
Disposals (248) (565)
Transfer from intangible assets – 14
Transfer to assets classified as held for sale (508) –
At end of year 1,854 2,417
Amortisation
At beginning of year (1,393) (1,360)
Exchange differences 109 (250)
Charge for the year (338) (350)
Disposal through business disposal – 4
Disposals 248 565
Transfer from intangible assets – (2)
Transfer to assets classified as held for sale 261 –
At end of year (1,113) (1,393)
Carrying amounts
At end of year 741 1,024
Included in the above are pre-publication assets amounting to £504m (2016: £694m) which will be realised in more than one year.
Amortisation is included in the income statement in cost of goods sold.
21. Inventories
All figures in £ millions 2017 2016
Raw materials 4 5
Work in progress 2 6
Finished goods 142 224
148 235
The cost of inventories recognised as an expense and included in the income statement in cost of goods sold amounted to £324m (2016: £340m). In 2017, £38m (2016: £48m) of inventory provisions was charged in the income statement. None of the inventory is pledged as security.
Notes to the consolidated financial statements

160 Pearson plc Annual report and accounts 2017
Notes to the consolidated financial statements
22. Trade and other receivables
All figures in £ millions 2017 2016
Current
Trade receivables 739 961
Royalty advances 8 22
Prepayments 82 124
Accrued income 1 15
Other receivables 280 235
1,110 1,357
Non-current
Trade receivables 21 21
Royalty advances 20 10
Prepayments 15 13
Accrued income 10 31
Other receivables 37 29
103 104
The carrying value of the Group’s trade and other receivables approximates its fair value. Trade receivables are stated net of provisions for bad and doubtful debts and anticipated future sales returns. The movements in the provision for bad and doubtful debts are as follows:
All figures in £ millions 2017 2016
At beginning of year (112) (64)
Exchange differences 7 (17)
Income statement movements (38) (53)
Utilised 21 22
Disposal through business disposal 1 –
Transfer to assets classified as held for sale 5 –
At end of year (116) (112)
Concentrations of credit risk with respect to trade receivables are limited due to the Group’s large number of customers, who are internationally dispersed.
The ageing of the Group’s trade receivables is as follows:
All figures in £ millions 2017 2016
Within due date 661 812
Up to three months past due date 187 232
Three to six months past due date 48 55
Six to nine months past due date 18 21
Nine to 12 months past due date 13 14
More than 12 months past due date 3 7
Total trade receivables 930 1,141
Less: provision for sales returns (170) (159)
Net trade receivables 760 982
The Group reviews its bad debt provision at least twice a year following a detailed review of receivable balances and historical payment profiles. Management believes all the remaining receivable balances are fully recoverable.

161Section 5 Financial statements
23. Provisions for other liabilities and charges
All figures in £ millionsDeferred
consideration PropertyDisposals
and closuresLegal
and other Total
At 1 January 2017 56 4 10 36 106
Exchange differences (5) – – (2) (7)
Charged to income statement – – – 4 4
Released to income statement – – – (7) (7)
Utilised (6) – (2) (8) (16)
Disposal through business disposal – (1) 3 (2) –
At 31 December 2017 45 3 11 21 80
Analysis of provisions:
All figures in £ millions
2017
Deferred consideration Property
Disposals and closures
Legal and other Total
Current 5 1 11 8 25
Non-current 40 2 – 13 55
45 3 11 21 80
2016
Current 6 1 8 12 27
Non-current 50 3 2 24 79
56 4 10 36 106
Deferred consideration primarily relates to the formation of a venture in a North America business in 2011. The provision will be utilised over a number of years as payments are based on a royalty rate. Disposals and closures include liabilities related to the disposal of Penguin with the provisions utilised as the disposals and closures are completed. Legal and other includes legal claims, contract disputes and potential contract losses with the provisions utilised as the cases are settled. Restructuring provisions were not material in either 2017 or 2016.
24. Trade and other liabilities
All figures in £ millions 2017 2016
Trade payables 265 333
Social security and other taxes 21 25
Accruals 447 507
Deferred income 322 883
Interest payable 45 31
Liability to purchase own shares 151 –
Other liabilities 224 272
1,475 2,051
Less: non-current portion
Accruals 26 17
Deferred income 35 319
Other liabilities 72 86
133 422
Current portion 1,342 1,629
The carrying value of the Group’s trade and other liabilities approximates its fair value.
The deferred income balance comprises advance payments in assessment, testing and training businesses; subscription income in school and college businesses; and obligations to deliver digital content in future periods.
The liability to purchase own shares relates to a liability arising under a buyback agreement for the purchase of the company’s own shares (see note 27).
Notes to the consolidated financial statements

162 Pearson plc Annual report and accounts 2017
Notes to the consolidated financial statements
25. Retirement benefit and other post-retirement obligations
Background
The Group operates a number of defined benefit and defined contribution retirement plans throughout the world.
The largest plan is the Pearson Group Pension Plan (UK Group plan) in the UK, which is sectionalised to provide both defined benefit and defined contribution pension benefits. The defined benefit section was closed to new members from 1 November 2006. The defined contribution section, opened in 2003, is open to new and existing employees. Finally, there is a separate section within the UK Group plan set up for auto-enrolment. The defined benefit section of the UK Group plan is a final salary pension plan which provides benefits
to members in the form of a guaranteed level of pension payable for life. The level of benefits depends on the length of service and final pensionable pay. The UK Group plan is funded with benefit payments from trustee-administered funds. The UK Group plan is administered in accordance with the Trust Deed and Rules in the interests of its beneficiaries by Pearson Group Pension Trustee Limited.
At 31 December 2017, the UK Group plan had approximately 24,000 members, analysed in the following table:
All figures in % Active Deferred Pensioners Total
Defined benefit 1 26 35 62
Defined contribution 8 30 – 38
Total 9 56 35 100
The other major defined benefit plans are based in the US. These are also final salary pension plans which provide benefits to members in the form of a guaranteed pension payable for life, with the level of benefits dependent on length of service and final pensionable pay. The majority of the US plans are funded.
The Group also has several post-retirement medical benefit plans (PRMBs), principally in the US. PRMBs are unfunded but are accounted for and valued similarly to defined benefit pension plans.
The defined benefit schemes expose the Group to actuarial risks, such as life expectancy, inflation risks, and investment risk including asset volatility and changes in bond yields. The Group is not exposed to any unusual, entity-specific or plan-specific risks.
The defined contribution section of the UK Group plan operates a Reference Scheme Test (RST) pension underpin for its members. Where a member’s fund value is insufficient to purchase the RST pension upon retirement, the UK Group plan is liable for the shortfall to cover the member’s RST pension. During the year, the UK Group plan revised its approach to securing the RST underpin by converting a member’s fund value into a pension in the UK Group plan rather than purchasing an annuity with an insurer. A liability of £32m (2016: £181m) in respect of the underpin is included in the UK Group plan’s defined benefit obligation, calculated as the present value of projected payments less the fund value. The UK Group plan’s conversion factors are lower than the respective insurer annuity values and this has driven a reduction in the underpin liability, resulting in an actuarial gain through other comprehensive income and an increase in the surplus at 31 December 2017. From 1 January 2018, members who have sufficient funds to purchase an RST pension will be able to convert their fund value into a pension in the UK Group plan as an alternative to purchasing an annuity with an insurer. The Group does not recognise the assets and liabilities for members of the defined contribution section of the UK Group plan whose fund values are expected to be sufficient to purchase an RST pension without assistance from the UK Group plan. The defined contribution section of the UK Group plan had gross assets of £442m at 31 December 2017.

163Section 5 Financial statements
25. Retirement benefit and other post-retirement obligations continued
Assumptions
The principal assumptions used for the UK Group plan and the US PRMB are shown below. Weighted average assumptions have been shown for the other plans, which primarily relate to US pension plans.
All figures in %
2017 2016
UK Group plan
Other plans PRMB
UK Group plan
Other plans PRMB
Inflation 3.2 1.6 1.5 3.3 1.6 1.5
Rate used to discount plan liabilities 2.5 3.0 3.0 2.5 3.8 3.9
Expected rate of increase in salaries 3.7 3.0 3.0 3.8 3.0 3.0
Expected rate of increase for pensions in payment and deferred pensions 2.1 to 5.1 – – 2.2 to 5.1 – –
Initial rate of increase in healthcare rate – – 6.5 – – 6.8
Ultimate rate of increase in healthcare rate – – 5.0 – – 5.0
The UK discount rate is based on corporate bond yields adjusted to reflect the duration of liabilities. In 2017, the Group revised the portfolio of corporate bonds used to exclude bonds with an implicit government guarantee. Under the previous methodology, the 2017 UK discount rate would have been lower by around 0.1%.
The US discount rate is set by reference to a US bond portfolio matching model.
The inflation rate for the UK Group plan of 3.2% reflects the RPI rate. In line with changes to legislation in 2010, certain benefits have been calculated with reference to CPI as the inflationary measure and in these instances a rate of 2.2% has been used.
The expected rate of increase in salaries has been set at 3.7% for 2017 with a short-term assumption of 2.0% for three years.
For the UK plan, the mortality base table assumptions have been updated and are derived from the SAPS S2 for males and females, adjusted to reflect the observed experience of the plan, with CMI model improvement factors. A 1.5% long-term rate improvement on the CMI model is applied for both males and females.
For the US plans, the mortality table (RP – 2017) and 2017 improvement scale (MP – 2017) with generational projection for male and female annuitants has been adopted.
Using the above tables, the remaining average life expectancy in years of a pensioner retiring at age 65 on the balance sheet date for the UK Group plan and US plans is as follows:
All figures in years
UK US
2017 2016 2017 2016
Male 23.6 23.5 20.8 21.2
Female 25.7 25.6 22.8 23.2
The remaining average life expectancy in years of a pensioner retiring at age 65, 20 years after the balance sheet date, for the UK and US Group plans is as follows:
All figures in years
UK US
2017 2016 2017 2016
Male 25.7 25.5 22.5 22.9
Female 27.9 27.8 24.4 24.9
Although the Group anticipates that plan surpluses will be utilised during the life of the plan to address member benefits, the Group recognises its pension surplus in full in respect of the UK Group plan on the basis that it is management’s judgement that there are no substantive restrictions on the return of residual plan assets in the event of a winding up of the plan after all member obligations have been met.
Notes to the consolidated financial statements

164 Pearson plc Annual report and accounts 2017
Notes to the consolidated financial statements
25. Retirement benefit and other post-retirement obligations continued
Financial statement information
The amounts recognised in the income statement are as follows:
All figures in £ millions
2017
UK Group plan
Defined benefit
other Sub-totalDefined
contribution PRMB Total
Current service cost 8 1 9 57 (1) 65
Administration expenses 9 1 10 – – 10
Total operating expense 17 2 19 57 (1) 75
Interest on plan assets (84) (5) (89) – – (89)
Interest on plan liabilities 77 7 84 – 2 86
Net finance (income)/expense (7) 2 (5) – 2 (3)
Net income statement charge 10 4 14 57 1 72
All figures in £ millions
2016
UK Group plan
Defined benefit
other Sub-totalDefined
contribution PRMB Total
Current service cost 8 2 10 67 – 77
Curtailments – – – – (2) (2)
Administration expenses 6 – 6 – – 6
Total operating expense 14 2 16 67 (2) 81
Interest on plan assets (104) (6) (110) – – (110)
Interest on plan liabilities 89 7 96 – 3 99
Net finance (income)/expense (15) 1 (14) – 3 (11)
Net income statement charge (1) 3 2 67 1 70
The amounts recognised in the balance sheet are as follows:
All figures in £ millions
2017 2016
UK Group plan
Other funded plans
Other unfunded
plans TotalUK Group
planOther funded
plans
Other unfunded
plans Total
Fair value of plan assets 3,337 155 – 3,492 3,339 158 – 3,497
Present value of defined benefit obligation (2,792) (161) (20) (2,973) (3,181) (183) (22) (3,386)
Net pension asset/(liability) 545 (6) (20) 519 158 (25) (22) 111
Other post-retirement medical benefit obligation (67) (77)
Other pension accruals (11) (15)
Net retirement benefit asset 441 19
Analysed as:
Retirement benefit assets 545 158
Retirement benefit obligations (104) (139)

165Section 5 Financial statements
25. Retirement benefit and other post-retirement obligations continued
Financial statement information continued
The following gains/(losses) have been recognised in other comprehensive income:
All figures in £ millions 2017 2016
Amounts recognised for defined benefit plans 175 (277)
Amounts recognised for post-retirement medical benefit plans – 9
Total recognised in year 175 (268)
The fair value of plan assets comprises the following:
All figures in %
2017 2016
UK Group plan
Other funded plans Total
UK Group plan
Other funded plans Total
Insurance 29 – 29 – – –
Equities 1 1 2 2 1 3
Bonds – 3 3 9 1 10
Property 8 – 8 8 – 8
Pooled asset investment funds 44 – 44 67 – 67
Other 14 – 14 12 – 12
The plan assets do not include any of the Group’s own financial instruments, or any property occupied by the Group. The table below further disaggregates the UK Group plan assets into additional categories and those assets which have a quoted market price in an active market and those that do not:
All figures in %
2017 2016
Quoted market price
No quoted market price
Quoted market price
No quoted market price
Insurance 29 – – –
Non-UK equities – 2 – 3
Fixed-interest securities 3 – 10 –
Property – 8 – 8
Pooled asset investment funds 44 – 67 –
Other – 14 – 12
Total 76 24 77 23
The liquidity profile of the UK Group plan assets is as follows:
All figures in % 2017 2016
Liquid – call <1 month 50 75
Less liquid – call 1–3 months – –
Illiquid – call >3 months 50 25
Notes to the consolidated financial statements

166 Pearson plc Annual report and accounts 2017
Notes to the consolidated financial statements
25. Retirement benefit and other post-retirement obligations continued
Financial statement information continued
Changes in the values of plan assets and liabilities of the retirement benefit plans are as follows:
All figures in £ millions
2017 2016
UK Group plan
Other plans Total
UK Group plan
Other plans Total
Fair value of plan assets
Opening fair value of plan assets 3,339 158 3,497 2,803 135 2,938
Exchange differences – (8) (8) – 24 24
Interest on plan assets 84 5 89 104 6 110
Return on plan assets excluding interest (140) 10 (130) 445 8 453
Contributions by employer 234 8 242 99 2 101
Benefits paid (188) (18) (206) (112) (17) (129)
Other 8 – 8 – – –
Closing fair value of plan assets 3,337 155 3,492 3,339 158 3,497
Present value of defined benefit obligation
Opening defined benefit obligation (3,181) (205) (3,386) (2,466) (175) (2,641)
Exchange differences – 13 13 – (32) (32)
Current service cost (8) (1) (9) (8) (2) (10)
Administration expenses (9) (1) (10) (6) – (6)
Interest on plan liabilities (77) (7) (84) (89) (7) (96)
Actuarial gains/(losses) – experience 126 6 132 12 – 12
Actuarial gains/(losses) – demographic 133 1 134 (47) 2 (45)
Actuarial gains/(losses) – financial 44 (5) 39 (689) (8) (697)
Contributions by employee – – – – – –
Other (8) – (8) – – –
Benefits paid 188 18 206 112 17 129
Closing defined benefit obligation (2,792) (181) (2,973) (3,181) (205) (3,386)
The weighted average duration of the defined benefit obligation is 16.9 years for the UK and 8.1 years for the US.

167Section 5 Financial statements
25. Retirement benefit and other post-retirement obligations continued
Financial statement information continued
Changes in the value of the US PRMB are as follows:
All figures in £ millions 2017 2016
Opening defined benefit obligation (77) (76)
Exchange differences 5 (14)
Current service cost 1 –
Curtailments – 2
Interest on plan liabilities (2) (3)
Actuarial gains/(losses) – experience 1 8
Actuarial gains/(losses) – demographic 1 2
Actuarial gains/(losses) – financial (2) (1)
Benefits paid 6 5
Closing defined benefit obligation (67) (77)
Funding
The UK Group plan is self-administered with the plan’s assets being held independently of the Group in trust. The trustee of the plan is required to act in the best interest of the plan’s beneficiaries. The most recent triennial actuarial valuation for funding purposes was completed as at 1 January 2015 and this valuation revealed a technical provisions funding shortfall of £27m which was eliminated by contributions paid during 2015.
As a consequence of the disposal of the FT Group, an agreement has been made between Pearson and the plan trustee to accelerate the funding of the plan. As a result, the plan is expected to be fully funded on a ‘self-sufficiency’ basis by 2019, inclusive of £202m paid in 2017 in relation to the Penguin Random House merger in 2013. This is a much higher level of funding than technical provisions. As a result, the plan expects to be able to provide benefits (in accordance with the plan rules) with a very low level of reliance on future funding from Pearson. A commitment has also been made to maintain that level of funding in future years.
Assets of the plan are divided into two elements: matching assets, which are assets that produce cash flows that can be expected to match the cash flows for a proportion of the membership, and include a liability-driven investment mandate (UK bonds, interest rate/inflation swaps and other derivative instruments), inflation-linked property and infrastructure; and return seeking assets, which are assets invested with a longer-term horizon to generate the returns needed to provide the remaining expected cash flows for the beneficiaries, and include diversified growth funds, property and alternative asset classes. The plan’s long-term investment strategy allocates 85% to matching assets and 15% to return seeking assets.
In October 2017, the UK Group plan purchased pensioner buy-in policies with both Aviva and Legal & General totalling £1.2bn. The buy-ins cover around a third of its total liabilities and are split equally between the two insurers. The buy-ins transfer significant longevity risk to Aviva and Legal & General, reducing the pension risks being underwritten by the Group and providing additional security for members.
Regular contributions to the plan in respect of the defined benefit sections are estimated to be £6m for 2018.
Sensitivities
The effect of a one percentage point increase and decrease in the discount rate on the defined benefit obligation and the total pension expense is as follows:
All figures in £ millions
2017
1% increase 1% decrease
Effect:
(Decrease)/increase in defined benefit obligation – UK Group plan (423) 575
(Decrease)/increase in defined benefit obligation – US plan (14) 16
Notes to the consolidated financial statements

168 Pearson plc Annual report and accounts 2017
Notes to the consolidated financial statements
25. Retirement benefit and other post-retirement obligations continued
Sensitivities continued
The effect of members living one year more or one year less on the defined benefit obligation is as follows:
All figures in £ millions
2017
One year increase
One year decrease
Effect:
Increase/(decrease) in defined benefit obligation – UK Group plan 145 (152)
Increase/(decrease) in defined benefit obligation – US plan 8 (9)
The effect of a half percentage point increase and decrease in the inflation rate is as follows:
All figures in £ millions
2017
0.5% increase 0.5% decrease
Effect:
Increase/(decrease) in defined benefit obligation – UK Group plan 144 (132)
Increase/(decrease) in defined benefit obligation – US plan – –
The above sensitivity analyses are based on a change in an assumption while holding all other assumptions constant, although in practice this is unlikely to occur and changes in some assumptions may be correlated. When calculating these sensitivities, the same method has been applied to calculate the defined benefit obligation as has been applied when calculating the liability recognised in the balance sheet. This methodology is the same as prior periods.
26. Share-based payments
The Group recognised the following charges in the income statement in respect of its equity-settled share-based payment plans:
All figures in £ millions 2017 2016
Pearson plans 33 22
The Group operates the following equity-settled employee option and share plans:
Worldwide Save for Shares Plan Since 1994, the Group has operated a Save-As-You-Earn plan for UK employees. In 1998, the Group introduced a Worldwide Save for Shares Plan. Under these plans, employees can save a portion of their monthly salary over periods of three or five years. At the end of this period, the employee has the option to purchase ordinary shares with the accumulated funds at a purchase price equal to 80% of the market price prevailing at the time of the commencement of the employee’s participation in the plan. Options that are not exercised within six months of the end of the savings period lapse unconditionally.
Employee Stock Purchase Plan In 2000, the Group established an Employee Stock Purchase Plan which allows all employees in the US to save a portion of their monthly salary over six-month periods. At the end of the period, the employee has the option to purchase American Depository Receipts (ADRs) with their accumulated funds at a purchase price equal to 85% of the lower of the market prices prevailing at the beginning or end of the period.
Long-Term Incentive Plan The plan was first introduced in 2001 and consists of restricted shares. The vesting of restricted shares is normally dependent on continuing service over a three to five-year period, and in the case of Executive Directors and senior management upon the satisfaction of corporate performance targets over a three-year period. These targets may be based on market and/or non-market performance criteria. Restricted shares awarded to Executive Directors in September 2017, and to Executive Directors and senior management in May 2016, vest dependent on relative total shareholder return, return on invested capital and earnings per share growth. Restricted shares awarded to senior management in March 2016 and March 2017 vest dependent on earnings per share growth. Other restricted shares awarded in 2016 and 2017 vest depending on continuing service over a three-year period.
Management Incentive Plan The plan was introduced in 2017 combining the Group’s Annual Incentive Plan and Long-Term Incentive Plan for senior management. The number of shares to be granted to participants is dependent on Group performance in the calendar year preceding the date of grant (on the same basis as the Annual Incentive Plan). Subsequently, the shares vest dependent on continuing service over a three-year period, and additionally in the case of Pearson Executive Management upon satisfaction of non market-based performance criteria as determined by the Remuneration Committee. Restricted shares awarded as part of the 2017 Management Incentive Plan will be granted in April 2018.

169Section 5 Financial statements
26. Share-based payments continued
The number and weighted average exercise prices of share options granted under the Group’s plans are as follows:
2017 2016
Number of share options
000s
Weighted average exercise price
£
Number of share options
000s
Weighted average exercise price
£
Outstanding at beginning of year 2,978 8.14 3,250 9.24
Granted during the year 1,619 5.50 1,544 6.94
Exercised during the year (9) 7.00 (49) 7.07
Forfeited during the year (1,451) 8.04 (1,695) 9.14
Expired during the year (156) 9.09 (72) 8.95
Outstanding at end of year 2,981 6.84 2,978 8.14
Options exercisable at end of year 350 8.18 247 9.06
Options were exercised regularly throughout the year. The weighted average share price during the year was £6.71 (2016: £8.23). Early exercises arising from redundancy, retirement or death are treated as an acceleration of vesting and the Group therefore recognises in the income statement the amount that otherwise would have been recognised for services received over the remainder of the original vesting period.
The options outstanding at the end of the year have weighted average remaining contractual lives and exercise prices as follows:
Range of exercise prices£
2017 2016
Number of share options 000s
Weighted average contractual life
YearsNumber of
share options 000s
Weighted average contractual life
Years
0–5 – – – –
5–10 2,697 2.52 2,548 2.31
>10 284 1.24 430 2.25
2,981 2.40 2,978 2.31
In 2017 and 2016, options were granted under the Worldwide Save for Shares Plan. The weighted average estimated fair value for the options granted was calculated using a Black–Scholes option pricing model.
The weighted average estimated fair values and the inputs into the Black–Scholes model are as follows:
2017 Weighted average
2016 Weighted average
Fair value £1.24 £1.01
Weighted average share price £6.83 £7.85
Weighted average exercise price £5.50 £6.94
Expected volatility 34.75% 27.38%
Expected life 3.7 years 3.7 years
Risk-free rate 0.20% 0.58%
Expected dividend yield 7.61% 7.49%
Forfeiture rate 3.2% 3.2%
The expected volatility is based on the historical volatility of the company’s share price over the previous three to seven years depending on the vesting term of the options.
The following shares were granted under restricted share arrangements:
2017 2016
Number of shares
000s
Weighted average fair value
£
Number of shares
000s
Weighted average fair value
£
Long-Term Incentive Plan 6,453 6.61 6,833 8.24
Notes to the consolidated financial statements

170 Pearson plc Annual report and accounts 2017
Notes to the consolidated financial statements
26. Share-based payments continued
The fair value of shares granted under the Long-Term Incentive Plan that vest unconditionally is determined using the share price at the date of grant. The number of shares expected to vest is adjusted, based on historical experience, to account for potential forfeitures. Participants under the plan are entitled to dividends during the vesting period and therefore the share price is not discounted.
Restricted shares with a market performance condition were valued by an independent actuary using a Monte Carlo model. Restricted shares with a non-market performance condition were fair valued based on the share price at the date of grant. Non-market performance conditions are taken into consideration by adjusting the number of shares expected to vest based on the most likely outcome of the relevant performance criteria.
27. Share capital and share premium
Number of shares
000s
Share capital
£m
Share premium
£m
At 1 January 2016 821,068 205 2,590
Issue of ordinary shares – share option schemes 1,059 – 7
At 31 December 2016 822,127 205 2,597
Issue of ordinary shares – share option schemes 923 – 5
Purchase of own shares (20,996) (5) –
At 31 December 2017 802,054 200 2,602
The ordinary shares have a par value of 25p per share (2016: 25p per share). All issued shares are fully paid. All shares have the same rights.
The £300m share buyback programme announced in October 2017 was completed on 16 February 2018. In 2017, the Group’s brokers purchased 21m shares at a value of £153m of which £149m had been cancelled at 31 December 2017. Cash payments of £149m had been made in respect of the purchases with the outstanding £4m settlement made at the beginning of January 2018. This £4m together with the remaining value of the buyback programme of £147m was recorded as a liability at 31 December 2017 (see note 24). A further 22m shares were purchased under the programme in 2018 (see note 37). The shares bought back are being cancelled and the nominal value of these shares is transferred to a capital redemption reserve. The nominal value of shares cancelled at 31 December 2017 was £5m.
The Group manages its capital to ensure that entities in the Group will be able to continue as a going concern while maximising the return to shareholders through the optimisation of the debt and equity balance.
The capital structure of the Group consists of debt (see note 18), cash and cash equivalents (see note 17) and equity attributable to equity holders of the parent, comprising issued capital, reserves and retained earnings.
The Group reviews its capital structure on a regular basis and will balance its overall capital structure through payments of dividends, new share issues as well as the issue of new debt or the redemption of existing debt in line with the financial risk policies outlined in note 19.
28. Treasury shares
Pearson plc
Number of shares
000s £m
At 1 January 2016 6,705 72
Purchase of treasury shares 3,000 27
Release of treasury shares (1,986) (20)
At 31 December 2016 7,719 79
Purchase of treasury shares – –
Release of treasury shares (1,725) (18)
At 31 December 2017 5,994 61
The Group holds Pearson plc shares in trust to satisfy its obligations under its restricted share plans (see note 26). These shares, representing 0.8% (2016: 0.9%) of called-up share capital, are treated as treasury shares for accounting purposes and have a par value of 25p per share.
The nominal value of Pearson plc treasury shares amounts to £1.5m (2016: £1.9m). Dividends on treasury shares are waived.
At 31 December 2017, the market value of Pearson plc treasury shares was £44m (2016: £63m).

171Section 5 Financial statements
29. Other comprehensive income
All figures in £ millions
2017
Attributable to equity holders of the companyNon-
controlling interest Total
Fair value reserve
Translation reserve
Retained earnings Total
Items that may be reclassified to the income statement
Net exchange differences on translation of foreign operations – Group – (158) – (158) – (158)
Net exchange differences on translation of foreign operations – associates – (104) – (104) – (104)
Currency translation adjustment disposed – (51) – (51) – (51)
Attributable tax – – 9 9 – 9
Fair value gain on other financial assets 13 – – 13 – 13
Attributable tax – – (4) (4) – (4)
Items that are not reclassified to the income statement
Remeasurement of retirement benefit obligations – Group – – 175 175 – 175
Remeasurement of retirement benefit obligations – associates – – 7 7 – 7
Attributable tax – – (42) (42) – (42)
Other comprehensive income/(expense) for the year 13 (313) 145 (155) – (155)
All figures in £ millions
2016
Attributable to equity holders of the companyNon-
controlling interest Total
Fair value reserve
Translation reserve
Retained earnings Total
Items that may be reclassified to the income statement
Net exchange differences on translation of foreign operations – Group – 909 – 909 1 910
Net exchange differences on translation of foreign operations – associates – 3 – 3 – 3
Currency translation adjustment disposed – – – – – –
Attributable tax – – (5) (5) – (5)
Items that are not reclassified to the income statement
Remeasurement of retirement benefit obligations – Group – – (268) (268) – (268)
Remeasurement of retirement benefit obligations – associates – – (8) (8) – (8)
Attributable tax – – 58 58 – 58
Other comprehensive income/(expense) for the year – 912 (223) 689 1 690
Notes to the consolidated financial statements

172 Pearson plc Annual report and accounts 2017
Notes to the consolidated financial statements
30. Business combinations
There were no significant acquisitions in 2017 or 2016.
Fair values for the assets and liabilities arising from acquisitions completed in the year are as follows:
All figures in £ millions Notes
2017 2016
Total fair value
Total fair value
Intangible assets 11 – 10
Net assets acquired at fair value – 10
Goodwill 11 – 3
Total – 13
Satisfied by:
Cash – (7)
Other liabilities – (6)
Total consideration – (13)
Goodwill of £3m arising on 2016 acquisitions is expected to be deductible for tax purposes.
Intangible assets acquired in 2016 have the following useful economic lives: trademarks and brands 15 years, and other acquired intangibles six years.
All figures in £ millions 2017 2016
Cash flow on acquisitions
Cash – current year acquisitions – (7)
Deferred payments for prior year acquisitions and other items (11) (7)
Acquisition costs and other acquisition liabilities paid – (1)
Net cash outflow (11) (15)
31. Disposals including business closures
In August 2017, the Group completed the sale of the test preparation business in China (GEDU) and in October 2017 the sale of a 22% share in Penguin Random House, retaining a 25% share (see note 12).
All figures in £ millions Notes
2017 2016
GEDU
Penguin Random
House Other Total Total
Disposal of subsidiaries and associates
Property, plant and equipment 10 (7) – – (7) (3)
Intangible assets 11 (2) – (7) (9) –
Investments in joint ventures and associates – (352) – (352) –
Net deferred income tax assets 13 (1) (2) – (3) (10)
Intangible assets – pre-publication 20 – – (1) (1) (4)
Inventories (1) – (1) (2) –
Trade and other receivables (16) – – (16) (6)
Current income tax receivable – (5) – (5) –
Cash and cash equivalents (excluding overdrafts) (13) – – (13) (9)
Trade and other liabilities 33 – 1 34 21
Cumulative currency translation adjustment 29 3 48 – 51 –
Net assets disposed (4) (311) (8) (323) (11)
Cash received 54 413 1 468 7
Costs (6) (6) (5) (17) (16)
Gain/(loss) on disposal 44 96 (12) 128 (20)

173Section 5 Financial statements
31. Disposals including business closures continued
All figures in £ millions 2017 2016
Cash flow from disposals
Cash – current year disposals 468 11
Cash and cash equivalents disposed (13) (9)
Costs and other disposal liabilities paid (25) (52)
Net cash inflow/(outflow) 430 (50)
Analysed as:
Cash inflow/(outflow) from sale of subsidiaries 19 (54)
Cash inflow from sale of associates 411 4
32. Held for sale
The assets and liabilities related to Wall Street English language teaching businesses (WSE), part of the Core and Growth segments, and the K-12 school courseware business (K-12), part of the North America segment, have been presented as held for sale following the approval by the Group’s management to sell both businesses.
Notes
2017 2016
WSE K-12 Total Total
Non-current assets
Property, plant and equipment 10 16 – 16 –
Intangible assets 11 15 166 181 –
Deferred income tax assets – 68 68 –
Trade and other receivables 4 23 27 –
35 257 292 –
Current assets
Intangible assets – pre-publication 20 8 239 247 –
Inventories – 46 46 –
Trade and other receivables 12 36 48 –
Cash and cash equivalents (excluding overdrafts) 17 127 – 127 –
147 321 468 –
Assets classified as held for sale 182 578 760 –
Non-current liabilities
Deferred income tax liabilities (2) – (2) –
Other liabilities (10) (274) (284) –
(12) (274) (286) –
Current liabilities
Trade and other liabilities (152) (150) (302) –
(152) (150) (302) –
Liabilities classified as held for sale (164) (424) (588) –
Net assets classified as held for sale 18 154 172 –
Notes to the consolidated financial statements

174 Pearson plc Annual report and accounts 2017
Notes to the consolidated financial statements
33. Cash generated from operations
All figures in £ millions Notes 2017 2016
Profit/(loss) 408 (2,335)
Adjustments for:
Income tax 13 (222)
Depreciation 10 90 95
Amortisation and impairment of acquired intangibles and goodwill 11 138 2,733
Amortisation of software 11 85 84
Net finance costs 6 30 60
Share of results of joint ventures and associates 12 (78) (97)
Profit on disposal of subsidiaries, associates, investments and fixed assets (116) 40
Net foreign exchange adjustment from transactions (26) 43
Share-based payment costs 26 33 22
Pre-publication (35) (19)
Inventories 24 17
Trade and other receivables 133 156
Trade and other liabilities 6 61
Retirement benefit obligations (232) (106)
Provisions for other liabilities and charges (11) (10)
Net cash generated from operations 462 522
Dividends from joint ventures and associates 458 131
Re-capitalisation dividends from Penguin Random House (312) –
Purchase of property, plant and equipment (82) (88)
Purchase of intangible software assets (150) (157)
Proceeds from sale of property, plant and equipment and intangible software assets – 4
Finance lease principal payments (5) (6)
Special pension contribution 227 90
Cost of major restructuring paid 71 167
Operating cash flow 669 663
Operating tax paid (75) (63)
Net operating finance costs paid (69) (51)
Operating free cash flow 525 549
Special pension contribution (227) (90)
Cost of major restructuring paid (71) (167)
Non-operating tax received – 18
Free cash flow 227 310
Dividends paid (including to non-controlling interests) (318) (424)
Net movement of funds from operations (91) (114)
Acquisitions and disposals 416 19
Re-capitalisation dividends from Penguin Random House 312 –
Loans (advanced)/repaid (including to related parties) (13) 14
Purchase of treasury shares 28 – (27)
New equity 5 7
Buyback of equity 27 (149) –
Other movements on financial instruments 14 4
Net movement of funds 494 (97)
Exchange movements on net debt 166 (341)
Total movement in net debt 660 (438)

175Section 5 Financial statements
33. Cash generated from operations continued
Net cash generated from operations is translated at an exchange rate approximating the rate at the date of cash flow. The difference between this rate and the average rate used to translate profit gives rise to a currency adjustment in the reconciliation between net profit and net cash generated from operations. This adjustment reflects the timing difference between recognition of profit and the related cash receipts or payments.
Operating cash flow, operating free cash flow and total free cash flow are non-GAAP (non-statutory) measures and have been disclosed and reconciled in the above table as they are commonly used by investors to measure the cash performance of the Group.
In the cash flow statement, proceeds from sale of property, plant and equipment comprise:
All figures in £ millions 2017 2016
Net book amount 12 9
Loss on sale of property, plant and equipment (12) (5)
Proceeds from sale of property, plant and equipment – 4
The movements in the Group’s current and non-current borrowings are as follows:
2016Financing
cash flows
Foreign exchange
movements
Fair value and other
movements 2017
Financial liabilities
Non-current borrowings 2,517 (1,292) (149) (10) 1,066
Current borrowings 9 (7) (1) 3 4
Total 2,526 (1,299) (150) (7) 1,070
Non-current borrowings include bonds, derivative financial instruments and finance leases. Current borrowings include loans repayable within one year and finance leases, but exclude overdrafts classified within cash and cash equivalents.
34. Contingencies
There are contingent Group liabilities that arise in the normal course of business in respect of indemnities, warranties and guarantees in relation to former subsidiaries and in respect of guarantees in relation to subsidiaries, joint ventures and associates. In addition, there are contingent liabilities of the Group in respect of legal claims, contract disputes, royalties, copyright fees, permissions and other rights. None of these claims are expected to result in a material gain or loss to the Group.
On 24 November 2017, the European Commission published an opening decision that the United Kingdom controlled foreign company group financing partial exemption (FCPE) constitutes State Aid. No final decision has yet been published, and it may be challenged by the UK tax authorities. The Group has benefited from FCPE in 2017 and prior periods in total by approximately £90m. At present the Group believes no provision is required in respect of this issue.
Notes to the consolidated financial statements

176 Pearson plc Annual report and accounts 2017
Notes to the consolidated financial statements
35. Commitments
At the balance sheet date there were no commitments for capital expenditure contracted for but not yet incurred.
The Group leases various offices and warehouses under non-cancellable operating lease agreements. The leases have varying terms and renewal rights. The Group also leases various plant and equipment under operating lease agreements, also with varying terms. Lease expenditure charged to the income statement was £178m (2016: £186m).
The future aggregate minimum lease payments in respect of operating leases are as follows:
All figures in £ millions 2017 2016
Not later than one year 156 174
Later than one year and not later than two years 139 147
Later than two years and not later than three years 121 129
Later than three years and not later than four years 100 115
Later than four years and not later than five years 86 96
Later than five years 599 661
1,201 1,322
In the event that the Group has excess capacity in its leased offices and warehouses it will enter into sub-lease contracts in order to offset costs. The future aggregate minimum sub-lease payments expected to be received under non-cancellable sub-leases are as follows:
All figures in £ millions 2017 2016
Not later than one year 45 44
Later than one year and not later than two years 45 46
Later than two years and not later than three years 40 44
Later than three years and not later than four years 35 39
Later than four years and not later than five years 33 34
Later than five years 138 155
336 362
36. Related party transactions
Joint ventures and associates
Amounts advanced to joint ventures and associates during the year and at the balance sheet date are set out in note 12.
Key management personnel
Key management personnel are deemed to be the members of the Pearson executive (see p11). It is this Committee which had responsibility for planning, directing and controlling the activities of the Group in 2017. Key management personnel compensation is disclosed below:
All figures in £millions 2017 2016
Short-term employee benefits 12 6
Retirement benefits 1 1
Share-based payment costs 2 1
Total 15 8
There were no other material related party transactions. No guarantees have been provided to related parties.

177Section 5 Financial statements
37. Events after the balance sheet date
During January 2018, the Group successfully executed market tenders to repurchase €250m of its €500m euro 1.875% notes due May 2021 and €200m of its €500m euro 1.375% notes due May 2025.
On 16 February, the Group completed its £300m share buyback programme. In aggregate between 18 October 2017 and 16 February 2018, the Group repurchased 42,835,577 shares, including 21,839,676 repurchased since 31 December 2017 at a cost of £151m.
38. Accounts and audit exemptions
The Pearson plc subsidiary companies listed below are exempt from the requirements of the Companies Act 2006 relating to the audit of individual accounts by virtue of section 479A.
Company number
Aldwych Finance Limited 04720439
Edexcel Limited 04496750
Education Development International plc 03914767
Longman Group (Overseas Holdings) Limited 00690236
Major123 Limited 05333023
Pearson Affordable Learning Fund Limited 08038068
Pearson Australia Finance Unlimited 05578463
Pearson Books Limited 02512075
Pearson Brazil Finance Limited 08848874
Pearson Canada Finance Unlimited 05578491
Pearson Dollar Finance plc 05111013
Pearson Dollar Finance Two plc 06507766
Pearson Education Holdings Limited 00210859
Pearson Education Investments Limited 08444933
Pearson Education Limited 00872828
Pearson Funding Four plc 07970304
Company number
Pearson International Finance Limited 02496206
Pearson Loan Finance No. 3 Limited 05052661
Pearson Loan Finance No. 4 Limited 02635107
Pearson Loan Finance Unlimited 05144467
Pearson Management Services Limited 00096263
Pearson Overseas Holdings Limited 00145205
Pearson Pension Nominees Limited 10809680
Pearson Pension Trustee Services Limited 10803853
Pearson PRH Holdings Limited 08561316
Pearson Real Estate Holdings Limited 09768242
Pearson Services Limited 01341060
Pearson Shared Services Limited 04623186
TQ Catalis Limited 07307943
TQ Clapham Limited 07307925
TQ Global Limited 07802458
Notes to the consolidated financial statements

Pearson plc Annual report and accounts 2017178
Company balance sheetAs at 31 December 2017
All figures in £ millions Notes 2017 2016
Assets
Non-current assets
Investments in subsidiaries 2 6,691 7,441
Amounts due from subsidiaries 3,118 133
Financial assets – derivative financial instruments 6 140 171
9,949 7,745
Current assets
Amounts due from subsidiaries 209 4,190
Amounts due from related parties 46 33
Cash and cash equivalents (excluding overdrafts) 4 119 867
374 5,090
Total assets 10,323 12,835
Liabilities
Non-current liabilities
Amounts due to subsidiaries (3,530) (3,253)
Financial liabilities – borrowings 5 – (254)
Financial liabilities – derivative financial instruments 6 (140) (264)
(3,670) (3,771)
Current liabilities
Amounts due to subsidiaries (1,739) (3,470)
Financial liabilities – borrowings 5 (3) (13)
Current income tax liabilities (4) (52)
Other liabilities (158) (4)
(1,904) (3,539)
Total liabilities (5,574) (7,310)
Net assets 4,749 5,525
Equity
Share capital 7 200 205
Share premium 7 2,602 2,597
Treasury shares 8 (16) (34)
Capital redemption reserve 5 –
Special reserve 447 447
Retained earnings – including loss for the year of £163m (2016: loss of £1,288m) 1,511 2,310
Total equity attributable to equity holders of the company 4,749 5,525
These financial statements have been approved for issue by the Board of Directors on 14 March 2018 and signed on its behalf by
Coram Williams Chief Financial Officer

Section 5 Financial statements 179
Company statement of changes in equityYear ended 31 December 2017
All figures in £ millions
Equity attributable to equity holders of the company
Share capital
Share premium
Treasury shares
Capital redemption
reserveSpecial
reserveRetained earnings Total
At 1 January 2017 205 2,597 (34) – 447 2,310 5,525
Loss for the year – – – – – (163) (163)
Issue of ordinary shares under share option schemes* – 5 – – – – 5
Buyback of equity (5) – – 5 – (300) (300)
Purchase of treasury shares – – – – – – –
Release of treasury shares – – 18 – – (18) –
Dividends – – – – – (318) (318)
At 31 December 2017 200 2,602 (16) 5 447 1,511 4,749
All figures in £ millions
Equity attributable to equity holders of the company
Share capital
Share premium
Treasury shares
Capital redemption
reserveSpecial
reserveRetained earnings Total
At 1 January 2016 205 2,590 (27) – 447 4,042 7,257
Loss for the year – – – – – (1,288) (1,288)
Issue of ordinary shares under share option schemes* – 7 – – – – 7
Purchase of treasury shares – – (27) – – – (27)
Release of treasury shares – – 20 – – (20) –
Dividends – – – – – (424) (424)
At 31 December 2016 205 2,597 (34) – 447 2,310 5,525
The capital redemption reserve reflects the nominal value of shares cancelled in the Group’s share buyback programme. The special reserve represents the cumulative effect of cancellation of the company’s share premium account.
Included within retained earnings is an amount of £162m (2016: £162m) relating to profit on intra-Group disposals that is not distributable.
* Full details of the share-based payment plans are disclosed in note 26 to the consolidated financial statements.

180 Pearson plc Annual report and accounts 2017
All figures in £ millions Notes 2017 2016
Cash flows from operating activities
Net loss (163) (1,288)
Adjustments for:
Income tax 70 (80)
Net finance costs 26 7
Disposals, liquidations and impairment charges 790 1,337
Amounts due (to)/from subsidiaries (748) 748
Net cash (used in)/generated from operations (25) 724
Interest paid (21) (15)
Tax received 9 24
Net cash (used in)/generated from operating activities (37) 733
Cash flows from investing activities
Loans (advanced to )/repaid by related parties (13) 14
Interest received 7 11
Net cash (used in)/received from investing activities (6) 25
Cash flows from financing activities
Proceeds from issue of ordinary shares 7 5 7
Buyback of equity (149) –
Net purchase of treasury shares – (27)
Repayment of borrowings (243) (30)
Dividends paid to company’s shareholders (318) (424)
Net cash used in financing activities (705) (474)
Effects of exchange rate changes on cash and cash equivalents 10 (18)
Net (decrease)/increase in cash and cash equivalents (738) 266
Cash and cash equivalents at beginning of year 854 588
Cash and cash equivalents at end of year 4 116 854
Company cash flow statementAs at 31 December 2017

181Section 5 Financial statements
Notes to the company financial statements
1. Accounting policies
The financial statements on p178-189 comprise the separate financial statements of Pearson plc.
As permitted by section 408 of the Companies Act 2006, only the consolidated income statement and statement of comprehensive income have been presented.
The company has no employees.
The accounting policies applied in the preparation of these company financial statements are the same as those set out in note 1 to the consolidated financial statements with the addition of the following:
Investments
Investments in subsidiaries are stated at cost less provision for impairment, with the exception of certain hedged investments that are held in a foreign currency and revalued at each balance sheet date.
2. Investments in subsidiaries
All figures in £ millions 2017 2016
At beginning of year 7,441 7,744
Subscription for share capital in subsidiaries 164 800
Disposals/liquidations (430) –
Impairments (360) (1,337)
Currency revaluations (124) 234
At end of year 6,691 7,441
In 2017, impairments, disposals and liquidations relate to restructuring of intermediate holding companies. Impairments are largely offset by dividends received. In 2016, impairments relate to the carrying value of intermediate holding company investments following impairment reviews and the subsequent impairment of assets in the Pearson plc Group (see note 11 in the Group consolidated financial statements for further details).
3. Financial risk management
The company’s financial instruments comprise amounts due to/from subsidiary undertakings, cash and cash equivalents, derivative financial instruments, a liability to purchase own shares (included within other liabilities) and current and non-current borrowings. Derivative financial instruments are held at fair value, with all other financial instruments held at amortised cost, which approximates fair value. The company’s approach to the management of financial risks is consistent with the Group’s treasury policy, as discussed in note 19 to the consolidated financial statements. The company believes the value of its financial assets to be fully recoverable.
The company designates certain qualifying derivative financial instruments as hedges of the fair value of its bonds (fair value hedges). Changes in the fair value of these derivative financial instruments are recorded in the income statement, together with any change in the fair value of the hedged liability attributable to the hedged risk.
The carrying value of the company’s financial instruments is exposed to movements in interest rates and foreign currency exchange rates (primarily US dollars). The company estimates that a 1% increase in interest rates would result in an £26m decrease in the carrying value of its financial instruments, with a 1% decrease in interest rates resulting in a £26m increase in their carrying value. The company also estimates that a 10% strengthening in sterling would decrease the carrying value of its financial instruments by £140m, while a 10% weakening in the value of sterling would increase the carrying value by £183m. These increases and decreases in carrying value would be recorded through the income statement. Sensitivities are calculated using estimation techniques such as discounted cash flow and option valuation models. Where modelling an interest rate decrease of 1% led to negative interest rates, these points on the yield curve were adjusted to 0%.

182 Pearson plc Annual report and accounts 2017
Notes to the company financial statements
3. Financial risk management continued
The following table analyses the company’s bonds and derivative assets and liabilities into relevant maturity groupings based on the remaining period at the balance sheet date to the contractual maturity date. The amounts disclosed in the table are the contractual undiscounted cash flows (including interest) and as such may differ from the amounts disclosed on the balance sheet.
All figures in £ millions
Analysed by maturity
Total
Analysed by currency
TotalLess than one year
Later than one year but less than five
yearsFive years or
more USD GBP Other
At 31 December 2017
Bonds – – – – – – – –
Rate derivatives – inflows (38) (975) (684) (1,697) (53) (751) (893) (1,697)
Rate derivatives – outflows 48 1,060 667 1,775 1,003 751 21 1,775
Total 10 85 (17) 78 950 – (872) 78
At 31 December 2016
Bonds 12 249 – 261 261 – – 261
Rate derivatives – inflows (103) (1,086) (867) (2,056) (239) (838) (979) (2,056)
Rate derivatives – outflows 82 1,202 891 2,175 1,308 838 29 2,175
Total (9) 365 24 380 1,330 – (950) 380
All cash flow projections shown above are on an undiscounted basis. Any cash flows based on a floating rate are calculated using interest rates as set at the date of the last rate reset. Where this is not possible, floating rates are based on interest rates prevailing at 31 December in the relevant year. All derivative amounts are shown gross, although the company net settles these amounts wherever possible.
Any amounts drawn under revolving credit facilities and commercial paper are assumed to mature at the maturity date of the relevant facility, with interest calculated as payable in each calendar year up to and including the date of maturity of the facility.
4. Cash and cash equivalents (excluding overdrafts)
All figures in £ millions 2017 2016
Cash at bank and in hand 2 4
Short-term bank deposits 117 863
119 867
Short-term bank deposits are invested with banks and earn interest at the prevailing short-term deposit rates.
At the end of 2017, the currency split of cash and cash equivalents was US dollar 82% (2016: 38%), sterling 17% (2016: 62%) and other 1% (2016: 0%).
Cash and cash equivalents have fair values that approximate their carrying amounts due to their short-term nature.
Cash and cash equivalents include the following for the purpose of the cash flow statement:
All figures in £ millions 2017 2016
Cash and cash equivalents 119 867
Bank overdrafts (3) (13)
116 854

183Section 5 Financial statements
Notes to the company financial statements
5. Financial liabilities – borrowings
All figures in £ millions 2017 2016
Non-current
4.625% US dollar notes 2018 (nominal amount $300m) – 254
– 254
Current
Due within one year or on demand:
Bank loans and overdrafts 3 13
3 13
Total borrowings 3 267
Movements in non-current borrowings during the year (including derivative financial instruments) comprise financing cash outflows of £243m, exchange gains of £124m and fair value and other movements of £(20)m. Current borrowings in both years are classified within cash and cash equivalents and do not give rise to financing cash flows.
The maturity of the company’s non-current borrowings is as follows:
All figures in £ millions 2017 2016
Between one and two years – 254
Between two and five years – –
Over five years – –
– 254
The carrying amounts and market values of borrowings are as follows:
All figures in £ millions
2017 2016
Effective interest rate
Carrying amount
Market value
Effective interest rate
Carrying amount
Market value
Bank loans and overdrafts n/a 3 3 n/a 13 13
4.625% US dollar notes 2018 n/a – – 4.69% 254 250
3 3 267 263
The market values are based on clean market prices at the year end or, where these are not available, on the quoted market prices of comparable debt issued by other companies. The effective interest rates above relate to the underlying debt instruments.
The carrying amounts of the company’s borrowings are denominated in the following currencies:
All figures in £ millions 2017 2016
US dollar – 254
Sterling 3 8
Euro – 5
3 267
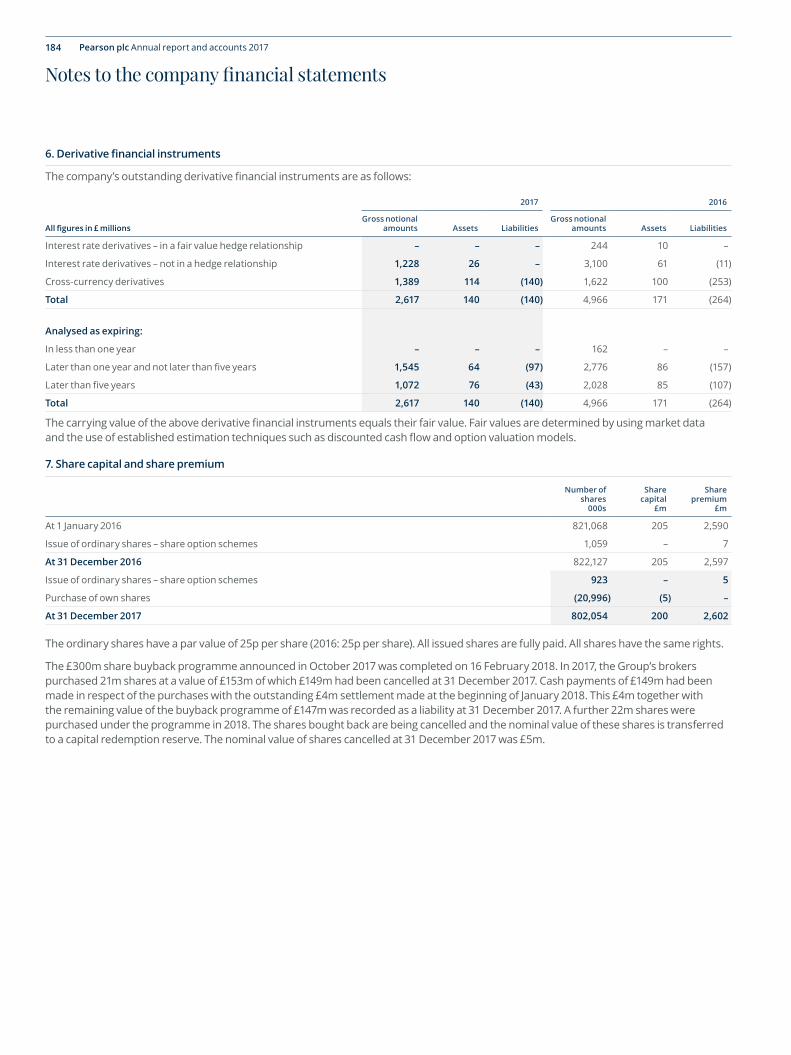
184 Pearson plc Annual report and accounts 2017
Notes to the company financial statements
6. Derivative financial instruments
The company’s outstanding derivative financial instruments are as follows:
All figures in £ millions
2017 2016
Gross notional amounts Assets Liabilities
Gross notional amounts Assets Liabilities
Interest rate derivatives – in a fair value hedge relationship – – – 244 10 –
Interest rate derivatives – not in a hedge relationship 1,228 26 – 3,100 61 (11)
Cross-currency derivatives 1,389 114 (140) 1,622 100 (253)
Total 2,617 140 (140) 4,966 171 (264)
Analysed as expiring:
In less than one year – – – 162 – –
Later than one year and not later than five years 1,545 64 (97) 2,776 86 (157)
Later than five years 1,072 76 (43) 2,028 85 (107)
Total 2,617 140 (140) 4,966 171 (264)
The carrying value of the above derivative financial instruments equals their fair value. Fair values are determined by using market data and the use of established estimation techniques such as discounted cash flow and option valuation models.
7. Share capital and share premium
Number of shares
000s
Share capital
£m
Share premium
£m
At 1 January 2016 821,068 205 2,590
Issue of ordinary shares – share option schemes 1,059 – 7
At 31 December 2016 822,127 205 2,597
Issue of ordinary shares – share option schemes 923 – 5
Purchase of own shares (20,996) (5) –
At 31 December 2017 802,054 200 2,602
The ordinary shares have a par value of 25p per share (2016: 25p per share). All issued shares are fully paid. All shares have the same rights.
The £300m share buyback programme announced in October 2017 was completed on 16 February 2018. In 2017, the Group’s brokers purchased 21m shares at a value of £153m of which £149m had been cancelled at 31 December 2017. Cash payments of £149m had been made in respect of the purchases with the outstanding £4m settlement made at the beginning of January 2018. This £4m together with the remaining value of the buyback programme of £147m was recorded as a liability at 31 December 2017. A further 22m shares were purchased under the programme in 2018. The shares bought back are being cancelled and the nominal value of these shares is transferred to a capital redemption reserve. The nominal value of shares cancelled at 31 December 2017 was £5m.

185Section 5 Financial statements
8. Treasury shares
Number of shares
000s £m
At 1 January 2016 6,705 27
Purchase of treasury shares 3,000 27
Release of treasury shares (1,986) (20)
At 31 December 2016 7,719 34
Purchase of treasury shares – –
Release of treasury shares (1,725) (18)
At 31 December 2017 5,994 16
The company holds its own shares in trust to satisfy its obligations under its restricted share plans. These shares are treated as treasury shares for accounting purposes and have a par value of 25p per share. The nominal value of the company’s treasury shares amounts to £1.5m (2016: £1.9m). At 31 December 2017, the market value of the company’s treasury shares was £44m (2016: £63m). The gross book value of the shares at 31 December 2017 amounts to £61m. This value has been netted off with contributions received from operating companies of £45m, resulting in a net debit value of £16m.
9. Contingencies
There are contingent liabilities that arise in the normal course of business in respect of indemnities, warranties and guarantees in relation to former subsidiaries and in respect of guarantees in relation to subsidiaries. In addition, there are contingent liabilities in respect of legal claims. None of these claims are expected to result in a material gain or loss to the company.
10. Audit fees
Statutory audit fees relating to the company were £35,000 (2016: £35,000).
11. Related party transactions
Subsidiaries
The company transacts and has outstanding balances with its subsidiaries. Amounts due from subsidiaries and amounts due to subsidiaries are disclosed on the face of the company balance sheet.
These loans are generally unsecured and interest is calculated based on market rates. The company has interest payable to subsidiaries for the year of £122m (2016: £138m) and interest receivable from subsidiaries for the year of £111m (2016: £109m). Management fees payable to subsidiaries in respect of centrally provided services amounted to £42m (2016: £118m). Management fees receivable from subsidiaries in respect of centrally provided services amounted to £69m (2016: £76m). Dividends received from subsidiaries were £701m (2016: £87m).
Associates
Amounts due from related parties, disclosed on the face of the company balance sheet, relate to loans to Penguin Random House, an associate of the Group. These loans are unsecured and interest is calculated based on market rates. The amount outstanding at 31 December 2017 was £46m (2016: £33m). The loans are provided under a working capital facility and fluctuate during the year.
Key management personnel
Key management personnel are deemed to be the members of the Pearson executive.
It is this committee which had responsibility for planning, directing and controlling the activities of the company in 2017. Key management personnel compensation is disclosed in note 36 to the consolidated financial statements.
There were no other material related party transactions. No guarantees have been provided to related parties.
Notes to the company financial statements

186 Pearson plc Annual report and accounts 2017
Notes to the company financial statements
12. Group companies
In accordance with section 409 of the Companies Act 2006 a full list of subsidiaries, partnerships, associates, joint ventures and joint arrangements, the country of incorporation, the registered address and the effective percentage of equity owned, as at 31 December 2017 is disclosed below. Unless otherwise stated, the shares are all indirectly held by Pearson plc. Unless otherwise stated, all wholly-owned and partly-owned subsidiaries are included in the consolidation and all associated undertakings are included in the Group’s financial statements using the equity method of accounting. Principal Group companies are identified in bold.
Wholly-owned subsidiaries
Registered company nameCountry of Incorp.
Reg office
A Plus Education Solutions Private Limited* IN 2
Addison Wesley Longman, Inc. US 3
Addison-Wesley Educational Publishers Inc. US 4
AEL (S) PTE Limited SG 5
Aldwych Finance Limited UK 1
America’s Choice, Inc. US 4
ATI Professional Development LLC US 4
Atkey Finance Limited IE 7
Axis Finance Inc. US 4
Beijing Wall Street English Training Centre Company Limited
CN 9
Blue Wharf Limited* UK 6
Camsaw, Inc. US 4
CAMSAWUSA, Inc. US 11
Casapsi Livraria e Editora Ltda BR 12
Centro Cultural Americano Franquias e Comércio Ltda.
BR 13
Century Consultants Ltd. US 14
Certiport China Holding, LLC US 4
Certiport, Inc. US 4
Cogmed Systems AB SE 15
Connections Academy of Alaska, LLC US 16
Connections Academy of Arizona, LLC US 17
Connections Academy of Arkansas, LLC US 18
Connections Academy of DC, LLC US 21
Connections Academy of Florida, LLC US 22
Connections Academy of Georgia, LLC US 23
Connections Academy of Indiana, LLC US 25
Connections Academy of Iowa, LLC US 26
Connections Academy of Kansas, LLC US 27
Connections Academy of Kentucky, LLC US 28
Connections Academy of Louisiana, LLC US 29
Connections Academy of Maine, LLC US 30
Connections Academy of Maryland, LLC US 31
Connections Academy of Massachusetts LLC US 3
Connections Academy of Minnesota, LLC US 32
Connections Academy of Missouri, LLC US 33
Connections Academy of Nevada, LLC US 34
Connections Academy of New Jersey, LLC US 14
Connections Academy of New Mexico, LLC US 35
Connections Academy of New York, LLC US 36
Connections Academy of North Carolina, LLC US 37
Connections Academy of Oregon, LLC US 40
Connections Academy of Pennsylvania LLC US 41
Connections Academy of South Carolina, LLC US 42
Connections Academy of Tennessee, LLC US 43
Connections Academy of Texas, LLC US 44
Connections Academy of Virginia, LLC US 46
Connections Education LLC US 4
Connections Education of Florida, LLC US 22
Connections Education, Inc. US 4
CTI Education Group (Pty) Limited ZA 50
Dominie Press, Inc. US 19
Dorian Finance Limited IE 7
Dorling Kindersley Australasia Pty Limited AU 51
Registered company nameCountry of Incorp.
Reg office
EBNT Canada Holdings ULC CA 127
EBNT Holdings Limited CA 128
EBNT USA Holdings Inc. US 4
eCollege.com US 4
Edexcel Limited† UK 52
Edexcel South Africa Pty Ltd* ZA 50
Éditions Du Renouveau Pédagogique Inc. CA 53
Education Development International Plc† UK 1
Education Resources (Cyprus) Limited CY 54
Educational Management Group, Inc. US 55
Educational Resources (HK) Limited* CN 56
Embanet ULC CA 47
Embanet-Compass Knowledge Group Inc. US 22
Embankment Finance Limited* UK 6
English Language Learning and Instruction System, Inc.
US 57
Escape Studios Limited* UK 6
Falstaff Holdco Inc. US 4
Falstaff Inc. US 58
FBH, Inc. US 4
Franchise Support & Services, SL ES 60
Gamma Master China, Limited CN 61
Global Elite Education & Technology (Shanghai) Co. Limited
CN 63
Global George I Limited KY 8
Global George II limited CN 56
Global English India Private Limited IN 2
Globe Fearon Inc. US 19
Green Wharf Limited* UK 6
Guangzhou Crescent Software Co., Ltd CN 64
Heinemann Education Botswana (Publishers) (Proprietary) Limited
BW 65
Icodeon Limited* UK 6
IndiaCan Education Private Limited IN 2
Integral 7, Inc. US 4
INTELLIPRO, INC. US 14
J M Soluções Exportação e Importação Ltda BR 67
Kagiso Education Pty Ltd* ZA 50
Knowledge Analysis Technologies, LLC US 20
LCCI International Qualifications (Malaysia) Sdn. Bhd.*
MY 68
LCCIEB Training Consultancy., Ltd CN 69
LessonLab, Inc. US 19
Lignum Oil Company US 4
Linx Brasil Distribuidora Ltda. BR 13
Longman (Malawi) Limited MW 70
Longman Australasia Pty Ltd AU 71
Longman Group(Overseas Holdings) Limited UK 1
Longman Indochina Acquisition, L.L.C. US 4
Longman Kenya Limited KE 72
Longman Mocambique Ltda MZ 45
Longman Swaziland (Pty) Limited SZ 73
Longman Tanzania Limited* TZ 74
Longman Zambia Educational Publishers Pty Ltd
ZM 75
Longman Zambia Limited ZM 75
Registered company nameCountry of Incorp.
Reg office
Longman Zimbabwe (Private) Ltd ZW 76
Longmaned Ecuador S.A. EC 77
Major123 Limited UK 78
MeasureUp, LLC US 4
Modern Curriculum Inc. US 19
Multi Treinamento e Editora Ltda BR 79
National Computer Systems Japan Co. Ltd JP 80
NCS Information Services Technology (Beijing) Co Ltd
CN 81
NCS Pearson Pty Ltd AU 51
NCS Pearson Puerto Rico, Inc. PR 82
NCS Pearson, Inc. US 32
Ordinate Corporation US 19
Pearson (Beijing) Management Consulting Co., Ltd.
CN 83
Pearson (Guizhou) Education Technology Co., Ltd.
CN 84
Pearson Affordable Learning Fund Limited UK 1
Pearson America LLC US 4
Pearson Amsterdam B.V. NL 85
Pearson Australia Finance Unlimited UK 1
Pearson Australia Group Pty Ltd AU 51
Pearson Australia Holdings Pty Ltd AU 51
Pearson Australia Pty Ltd AU 51
Pearson Benelux B.V. NL 85
Pearson Books Limited† UK 1
Pearson Brazil Finance Limited UK 1
Pearson Business (Asia Pacific) Pte. Ltd. SG 5
Pearson Business Services Inc. US 4
Pearson Canada Assessment Inc CA 86
Pearson Canada Finance Unlimited UK 1
Pearson Canada Holdings Inc CA 86
Pearson Canada Inc. CA 86
Pearson Central Europe Spółka z ograniczoną odpowiedzialnością
PL 126
Pearson Charitable Foundation US 57
Pearson College Limited UK 1
Pearson DBC Holdings Inc. US 4
Pearson Desarrollo y Capacitación Profesional Chile Limitada
CL 87
Pearson Deutschland GmbH DE 88
Pearson Digital Learning Puerto Rico, Inc. PR 82
Pearson Dollar Finance plc† UK 1
Pearson Dollar Finance Two Limited UK 1
Pearson Educacion de Chile Limitada CL 89
Pearson Educacion de Colombia S A S CO 90
Pearson Educacion de Mexico, S.A. de C.V. MX 91
Pearson Educacion de Panama SA PA 92
Pearson Educacion de Peru S.A. PE 93
Pearson Educacion SA ES 94
Pearson Education (Singapore) Pte Ltd SG 5
Pearson Education Africa (Pty) Ltd ZA 50
Pearson Education and Assessment, Inc. US 4
Pearson Education Asia Limited CN 56
Pearson Education Botswana (Proprietary) Limited
BW 65

187Section 5 Financial statements
Registered company nameCountry of Incorp.
Reg office
Pearson Education do Brasil S.A BR 129
Pearson Education Hellas SA GR 122
Pearson Education Holdings Inc. US 4
Pearson Education Holdings Limited† UK 1
Pearson Education Indochina Limited TH 95
Pearson Education Investments Limited UK 1
Pearson Education Korea Limited KR 96
Pearson Education Limited UK 1
Pearson Education Namibia (Pty) Limited NA 97
Pearson Education Publishing Limited NG 98
Pearson Education S.A. UY 99
Pearson Education SA AR 100
Pearson Education South Africa (Pty) Ltd ZA 50
Pearson Education South Asia Pte. Ltd. SG 5
Pearson Education Taiwan Ltd TW 101
Pearson Education, Inc. US 4
Pearson Educational Measurement Canada, Inc.
CA 39
Pearson Educational Publishers, LLC US 4
Pearson Egitim Cozumleri Tikaret Limited Sirketi
TR 102
Pearson Falstaff (Holdings) Inc. US 4
Pearson Falstaff Holdco LLC US 4
Pearson France FR 103
Pearson Funding Five plc† UK 1
Pearson Funding Four plc† UK 1
Pearson Funding Two Limited*† UK 6
Pearson Holdings Inc. US 4
Pearson Holdings Southern Africa (Pty) Limited
ZA 50
Pearson in Practice Holdings Limited* UK 6
Pearson in Practice Skills Based Learning Limited*
UK 6
Pearson in Practice Technology Limited* UK 6
Pearson Inc. US 4
Pearson India Education Services Private Limited
IN 2
Pearson Institute of Higher Education ZA 50
Pearson International Finance Limited† UK 1
Pearson Investment Holdings, Inc. US 4
Pearson IOKI Spółka z ograniczoną odpowiedzialnością
PL 104
Pearson Italia S.p.A IT 105
Pearson Japan KK JP 106
Pearson Lanka (Private) Limited LK 107
Pearson Learning China (HK) Limited CN 56
Pearson Lesotho (Pty) Ltd LS 66
Pearson Loan Finance No. 3 Limited UK 1
Pearson Loan Finance No. 4 Limited UK 1
Pearson Loan Finance No.2 Unlimited* UK 6
Pearson Loan Finance Unlimited UK 1
Pearson Longman LLC US 4
Pearson Longman Uganda Limited UG 108
Pearson Malaysia Sdn. Bhd. MY 62
Pearson Management Services Limited† UK 1
Pearson Management Services Philippines Inc.
PH 109
Pearson Netherlands B.V. NL 85
Pearson Netherlands Holdings B.V. NL 85
Pearson Nominees Limited† UK 1
Pearson Online Tutoring LLC US 4
Pearson Overseas Holdings Limited† UK 1
Pearson PEM P.R., Inc. PR 82
Pearson Pension Nominees Limited UK 1
Pearson Pension Property Fund Limited UK 1
Registered company nameCountry of Incorp.
Reg office
Pearson Pension Trustee Limited UK 1
Pearson Pension Trustee Services Limited† UK 1
Pearson PRH Holdings Limited UK 1
Pearson Professional Assessments Limited UK 1
Pearson Real Estate Holdings Inc. US 4
Pearson Real Estate Holdings Limited† UK 1
Pearson Schweiz AG CH 110
Pearson Services Limited† UK 1
Pearson Shared Services Limited† UK 1
Pearson Strand Finance Limited† UK 1
Pearson Sweden AB SE 15
Pearson VUE Philippines, Inc. PH 111
Peisheng Yucai (Beijing) Technology Development Limited*
CN 112
Penguin Capital, LLC US 4
Phumelela Publishers (Pty) Ltd* ZA 50
PN Holdings Inc. US 4
Prentice-Hall Hispanoamericana SA de CV MX 91
ProctorCam, Inc. US 113
PT Efficient English Services ID 114
Reading Property Holdings LLC US 115
Rebus Planning Associates, Inc. US 10
Reston Publishing Company, Inc. US 4
Rycade Capital Corporation US 4
Shanghai AWL Education Software Ltd CN 116
Silver Burdett Ginn Inc. US 4
Skylight Training and Publishing Inc. US 55
Smarthinking, Inc. US 4
Sound Holdings Inc. US 4
Spear Insurance Company Limited† BM 48
Stark Verlag GmbH DE 88
Sunnykey International Holdings Limited (BVI)
VG 117
Tecquipment Services Limited* UK 6
Testchange Limited*† UK 6
The Financial Times (I) Pvt Ltd IN 24
The Learning Edge International pty Ltd AU 71
The SIOP Institute LLC US 118
The Waite Group Inc US 19
TQ Catalis Limited UK 78
TQ Clapham Limited UK 78
TQ Education and Training Limited UK 78
TQ Education and Training Limited SA 59
TQ Global Limited UK 1
TQ Group Limited UK 78
TQ Holdings Limited UK 1
USLS Holdings LLC US 4
Vue Testing Services Israel Ltd IL 49
Vue Testing Services Korea Limited KR 38
Wall Street English Training Centre (Shanghai) Company Limited
CN 119
Wall Street Institute Kft. HU 120
Wall Street Institute Master Italia Srl IT 121
WSE Hong Kong Limited CN 61
WSE Training Centre (Guangdong) Co., Ltd. CN 123
WSI Education GmbH DE 124
WSI International, Inc. US 125
* In liquidation
† Directly owned by Pearson plc
Subsidiary addresses
The following list includes all Pearson registered offices worldwide. Please see wholly-owned subsidiaries list opposite for each subsidiary’s registered office code.
Registered office address
1 80 Strand, London, WC2R 0RL, England
2 4th Floor Software Block, Elnet Software City, TS 140 Block 2 & 9, Rajiv Gandhi Salai, Taramani, Chennai, TN, 600113, India
3 C T Corporation System, 155 Federal St., Suite 700, Boston, MA, 02110, United States
4 The Corporation Trust Company, Corporation Trust Center, 1209 Orange Street, Wilmington, New Castle, DE, 19801, United States
5 9, #13-05/06, North Buona Vista Drive, The Metropolis Tower One, 138588, Singapore
6 Acre House, 11-15 William Road, London, NW1 3ER, England
7 1st Floor Riverview House, 21/23 City Quay, Dublin, D02FP21, Ireland
8 Maples Corporate Services Limited P.O. Box 309, Ugland House, South Church Street, George Town, Grand Cayman, KY!-1104, Cayman Islands
9 3F, Building R2 China Merchants Tower, No.118 Jianguo Road, Chaoyang District, Beijing, China
10 The Corporation Company, 40600 Ann Arbor Rd E Suite 201, Plymouth, MI, 48170, United States
11 The Prentice-Hall Corporation System, MA, 7 St. Paul Street, Suite 1660, Baltimore, MD, 21202, United States
12 No 15000, Francisco Matarazzo Avenue, Cj. 51 – Bloco 1 – Edificio New York, City of São Paulo, São Paulo, 05001-100, Brazil
13 Comendador Aladino Selmi Avenue, 4630, Galpao 1, Sala 1, Parque Cidade Campinas, City of Campinas, São Paulo 13069-036, Brazil
14 820, Bear Tavern Road, West Trenton, Mercer, NJ, 08628, United States
15 Gustavslundsvägen 137, 167 51 Bromma, Stockholm, Sweden
16 C T Corporation System, 9360 Glacier Hwy Suite 202, Juneau, AK, 99801, United States
17 C T Corporation System, 3800 N Central Ave Suite 460, Phoenix, AZ, 85012, United States
18 The Corporation Company, 124 West Capitol Avenue, Suite 1900, Little Rock, AR, 72201, United States
19 C T Corporation System, 818 West Seventh Street, Suite 930, Los Angeles, CA, 90017, United States
20 The Corporation Company, 7700 E Arapahoe Rd Suite 220, Centennial, CO, 80112-1268, United States
21 C T Corporation System, 1015 15th Street 10th Floor, Washington, DC, 20005, United States
22 1200, South Pine Island Road, Plantation, FL, 33324, United States
23 1201, Peachtree Street, NE, Atlanta, GA, 30361, United States
24 Plot No. 3, Bharti Colony Vikas Marg, New Dehli, DL 110092, India
25 CT Corporation System, 150 West Market Street, Suite 800, Indianapolis, IN, 46204, United States
26 C T Corporation System, 400 E Court Ave, Des Moines, IA, 50309, United States
27 The Corporation Company, Inc., 112 SW 7th Street, Suite 3C, Topeka, KS, 66603, United States
28 CT Corporation System, 306 W. Main Street, Suite 512, Frankfort, KY, 40601, United States
29 3867, Plaza Tower, 1st Floor, Baton Rouge, LA, 70816, United States
30 C T Corporation System, 128 State St #3, Augusta, ME, 04330, United States
31 7 St. Paul Street, Suite 1660, Baltimore, MD, 21202
Notes to the company financial statements

Pearson plc Annual report and accounts 2017188
Notes to the company financial statements
Registered office address
32 C T Corporation System Inc., 1010 Dale St N, St Paul, MN, 55117-5603, United States
33 120, 400, South Central Avenue, Clayton, MO, 63105, United States
34 The Corporation Trust Company of Nevada, 701 S Carson St, Suite 200, Carson City, NV, 89701, United States
35 C T Corporation System, 206 S Coronado Ave, Espanola, NM, 87532-2792, United States
36 CT Corporation, 111 Eighth Avenue, New York, NY 10011, United States
37 CT Corporation System, 160 Mine Lake Ct Suite 200, Raleigh, NC, 27615, United States
38 21, Mugyo-ro Jung-gu, Seoul, Republic of Korea
39 199 Bay Street, Commerce Court West, Suite 2800, Toronto, ON, M5L1A9, Canada
40 C T Corporation System, 388 State St Suite 420, Salem, OR, 97301, United States
41 C T Corporation System, 116 Pine Street, Suite 320, Harrisburg, Dauphin, PA, 17101, United States
42 C T Corporation System, 2 Office Park Court, Suite 103, Columbia, SC, 29223, United States
43 C T Corporation System, 800 S Gay St, Suite 2021, Knoxville, TN, 37929-9710, United States
44 CT Corporation System, 1999 Bryan Street, Suite 900, Dallas, TX, 75201, United States
45 Numero 776, Avenida 24 de Julho, Maputo, Mozambique
46 C T Corporation System, 4701 Cox Road, Suite 285, Glen Allen, Henrico, VA, 23060-0000, United States
47 3500, 855 – 2nd Street, S.W., Calgary, AB, T2P 4K7, Canada
48 Thistle House, 4 Burnaby Street, Hamilton, HM11, Bermuda
49 Derech Ben Gurion 2, BSR Building 9th Floor, Ramat Gan, 52573, Israel
50 Auto Atlantic, 4th Floor, Corner Hertzog Boulevard and Heerengracht, Cape Town, 8001, South Africa
51 707 Collins Street, Docklands, Melbourne, VIC, 3008, Australia
52 190, High Holborn, London, WC1V 7BH, England
53 1611, Boul. Cremazie Est, 10th Floor, Montréal, PQ, H2M 2P2, Canada
54 195, Archbishop Makarios III Avenue, Neocleous House, Limassol, 3030, Cyprus
55 Illinois Corporation Service Company, 700 S 2nd Street, Springfield, IL, 62703, United States
56 28/F, 1063 King’s Road, Quarry Bay, Hong Kong
57 C/o Corporation Service Company, 2711 Centerville Road, Suite 400, Wilmington, Delaware, 19808, United States
58 111, 13th Floor, Eighth Avenue, New York, NY, 10011, United States
59 King Fahad Road, Olaya, Riyadh, 58774, 11515, Saudi Arabia
60 Tuset 20-24, No. 5, Barcelona, 08006, Spain
61 Level 54, Hopewell Centre, 183 Queen’s Road East, Hong Kong
62 Unit 30-01, Level 30, Tower A, Vertical Business Suite, Avenue 3, Bangsar South, No 8, Jalan Kerinchi, 59200 Kuala Lumpur, Malaysia
63 Room 2001-2, Ambassador Road 18, Yangpu District, Shanghai City, China
64 Suite 1503, 1504, 1505, No. 376 Xingang Middle Road, Haizhu District, Guangzhou, China
65 Plot 50371, Fairground Office Park, Gaborone, Botswana
66 C/o Du Preez, LIebetrau & Co, 252 Kingsway, Next to USA Embassy, Maseru, Lesotho
67 João Scarparo Netto Avenue, 84, Bloco B, Ground Floor, Sala 44, Ed Unique Village Offices, Loteamento Center Santa Genebra, City of Campinas, São Paulo, 13080-655, Brazil
Registered office address
68 Unit 621, 6th Floor, Block A, Kelana Centre Point. No 3, Jalan SS7/9, Kelana Jaya 47301 Petaling Jaya, Selangor Darul Ehsan, Malaysia
69 Room 305, Building 2, 65555 Shangchuan Road, Pudong District, Shanghai, China
70 Parkway House, Hannover Avenue, Blantyre, Malawi
71 707 Collins Street, Docklands, Melbourne, VIC, 3008, Australia
72 Queensway House, Kaunda Street, Nairobi, Kenya
73 Robinson Bertram, 3rd Floor, Sokhzmlilio Bldg, Mbabane, Swaziland
74 P O Box 45, IPS Building, Maktaba Street, Dar es Salaam, Tanzania
75 Mlungushi Conference Centre, Centre Annex, Great East Road, Lusaka, Zambia
76 Stand 1515, Cnr Tourle Road/Harare Drive, Ardbennie, Harare, Zimbabwe
77 Andalucía y cordero E12-35. Edificio CYEDE piso 1, Oficina 11, Sector “La Floresta”, Quito, Pichincha, Ecuador
78 The Pearson Academy of Vocational Training, Bangrave Road, Corby, Northamptonshire, NN17 1NN, England
79 Rodovia Anhanguera, km317, 4, Bloco B, modulo 27, Jardim Salgado Filho, Ribeirao Preto, São Paulo, 14.079-000, Brazil
80 Teikoku Hotel Tower 18F, 1-1-1 Uchi Saiwai-Cho, Chiyoda-ku, Tokyo, Japan
81 Suite 1201, Tower 2, No. 36 North Third Rign East Road, Dongcheng District, Beijing, China
82 268 Munoz Rivera Avenue, Suite 1400, San Juan, 00918, Puerto Rico
83 Suite 1212, 12/F, Tower 2, No. 36 North Third Rign East Road, Dongcheng District, Beijing, China
84 Zone B, 1/F, Digital Content Industrial Park, High Technical & Industrial Development District, Guiyang City, Guizhou Province, China
85 Gatwickstraat 1, Amsterdam, 1043 GK, Netherlands
86 26 Prince Andrew Place, Don Mills, Toronto, ON, M3C 2T8, Canada
87 Vitacura 5950, Comuna de Vitacura, Santiago, Chile
88 2, Lilienthalstrasse, Hallbergmoos, 85399, Germany
89 Jose Ananias #505, Macul, Santiago, Chile
90 Carrera 7 Nro 156 – 68, Piso 26, Bogota, Colombia
91 Calle Antonio Dovalijaime #70, Torre B, Piso 6, Col. Zedec ed Plaza Santa Fe, del. Álvaro Obregon, Ciudad de Mexico, CP 01210, Mexico
92 Punta Pacifica, Torres de las Americas, Torre A Piso 15 Ofic. 1517, Panama, 0832-0588, Panama
93 Calle Río de la Plata N° 152. Piso 5. San Isidro. Lima – Perú
94 28, Ribera del Loira, Madrid, 28042, Spain
95 87/1 Capital Tower Building, All Seasons Place unit 1604 – 6 16th floor, Wireless Road, Lumpini, Pathumwan, Bangkok, Thailand
96 6F Kwanjeong Building, 35, Cheonggyecheon-Ro, Jongno-gu, Seoul, 03188, Republic of Korea
97 Unit 7 Kingland Park, 98 Nickel Street, Prosperita, Windhoek, Namibia
98 8, Secretariat Road, Obafemi Awolowo Way, Alausa, Ikeja, Lagos State, Nigeria
99 Juan Benito Blanco 780 – Plaza Business Center Montevideo, Uruguay
100 Humboldt 1509 piso 6 (C1414CTM), Ciudad Autonoma de Buenos Aires, Argentina
101 No 219, Room D, 11F, Sec 3, Beixin Road, New Taipei City, Xindian District, 23143, Taiwan
102 Barbaros Bulvarı. No:149, Dr. Orhan Birman İş Merkezi Kat:3, Gayrettepe Beşiktaş, Istanbul, 34349, Turkey
103 3-15, Immeuble Terra Nova II, Rue Henri Rol Tanguy, Montreuil, 93100, France
104 Ulica Jana Henryka Dąbrowskiego 77A 60-529, Poznań, Poland
105 16, Corso Trapani, Turin, 10100, Italy
Registered office address
106 1-5-15, Kanda-Sarugakucho, Chiyoda-ku, Tokyo, Japan
107 Orion City, Irgel Building #752, Colombo, 09, Sri Lanka
108 Plot 8, Berkley Road, Old Kampala, Uganda
109 7/F North Tower, Rockwell Business Center COR. Sheridan & United Street, Brgy. Highway Hills, Mandaluyong, Philippines
110 Chollerstrasse 37, 6300 Zug, Switzerland
111 27/F Trident Tower, 312 Sen. Gil Puyat Avenue, Makati City, Metro Manila, Philippines
112 Suite 15A11,Tian Xing Jian Commercial Plaza, No. 47 Fuxing Road, Haidian District, Beijing, China
113 National Registered Agents, inc., 160 Greentree Dr Ste 101, Dover, Kent, DE, 19904, United States
114 30th Floor, Ratu Plaza Office Tower, Jl. Jend. Sudirman Kav 9, Jakarta, 10270, Indonesia
115 C/O Pearson Education, 501 Bolyston St, Boston, MA, 02116, United States
116 Suite 3H, No. 6, Block 2, 365 Nong Xin Hua Road, Changning District, Shanghai City, China
117 Commerce House, Wickhams Cay 1, P.O. Box 3140, Road Town, Tortola, British Virgin Islands
118 P O BOX 905, Carnelian Bay, CA, 96140, United States
119 Zone 1 3F, Jin Mao Tower, No.88 Century Avenue, Pilot Free Trade Zone, Shanghai City, China
120 Hermina út 17. 8th floor, Budapest, 1146, Hungary
121 79, Corso Buenos Aires, Milan, 20124, Italy
122 21, Amfitheas Avenue, Paleo Faliro Athens, 17564, Greece
123 2F, No.118 East Ti Yu Road, Tianhe District, Guangzhou, China
124 2, Lilienthalstrasse, Hallbergmoos, 85399, Germany
125 The Corporation Trust Incorporated, 351 West Camden Street, Baltimore, MD, 21201, United States
126 Ulica Szamocka 8 01-748, Warszawa, Poland
127 Suite 2600, Three Bentall Centre, P.O. Box 49314, 595 Burrard Street, Vancouver, BC, V7X 1L3, Canada
128 44 Chipman Hill, Suite 1000, Saint Jon, NB, E2L 4S6, Canada
129 Comendador Aladino Selmi Avenue, 4630, Galpão 1, Sala 3, Parque Cidade Campinas, City of Campinas,São Paulo, 13069-036, Brazil
130 Comendador Aladino Selmi Avenue, 4630, Galpão 1, Mezanino, Sala 5, Parque Cidade Campinas, City of Campinas,São Paulo, 13069-036, Brazil

Section 5 Financial statements 189
Partly-owned subsidiaries
Registered company NameCountry of Incorp.
% Owned
Reg office
Certiport China Co Ltd CN 50.69 1
CG Manipal Schools Private Limited* NP 51 2
Chongqing WSE Training Centre Co Ltd
CN 95 3
Educational Publishers LLP UK 85 4
GED Domains LLC US 70 5
GED Testing Service LLC US 70 6
Heilongjiang WSE Training Centre Co Ltd
CN 95 7
Heinemann Publishers (Pty) Ltd SA 75 8
Maskew Miller Longman (Pty) Limited
SA 75 8
Pearson Education Achievement Solutions (RF) (Pty) Limited
SA 97.3 8
Pearson South Africa (Pty) Ltd SA 75 8
* In liquidation
Associated undertakings
Registered company NameCountry of Incorp.
% Owned
Reg office
ACT Aspire LLC US 50 9
Affordable Private Education Center Inc‡
PH 29.36 10
Avanti Learning Centres Private Limited‡
IN 22.54 11
eAdvance Proprietary Limited‡ ZA 38.01 12
HE Distributions, LLC US 35.3 13
Institute for Private Education & Training KSCC*
KU 49.02 14
Karadi Path learning Company Private Limited‡
IN 27.64 16
Learn Capital Special Opportunities Fund I, L.P.‡
US 99.59 22
Learn Capital Venture Partners II, L.P.‡
US 72.93 22
Learn Capital Venture Partners IIIA, L.P.‡
KY 99.00 15
Learn Capital Venture Partners, L.P.‡ US 99.15 22
Omega Schools Franchise Limited GH 49.05 17
Peking University Pearson (Beijing) Cultural Development Co., Ltd
CN 45 18
Penguin Random House Limited UK 25 4
Penguin Random House LLC US 25 9
Scala Higher Education , S.C. ME 45 19
Scala Latin America S.A.P.I. de C.V. ME 45 19
Scala Student, S.A. de C.V. ME 45 19
The Egyptian International Publishing Company-Longman
EG 49 20
Zaya Learning Labs Private Limited‡ IN 20 21
* In liquidation‡ Accounted for as an ‘Other financial asset’ within
non-current assets
Partly-owned subsidiaries & associated undertakings company addressesRegistered office address
1 Suite 1804, No.99 Huichuan Road, Changning District, Shanghai City, China
2 Lalitpur, Sub-Metropolitan City, - 2, Bagmati, Nepal
3 9-4#, Unit 4, 24 Jintang Street, Yuzhong District, Chongqing, China
4 80 Strand, London, WC2R 0RL, England
5 C T Corporation System, 4701 Cox Road, Suite 285, Glen Allen, Henrico, VA, 23060-0000, United States
6 The Corporation Trust Company, Corporation Trust Center, 1209 Orange Street, Wilmington, New Castle, DE, 19801, United States
7 Room 503, 5F, Xin’an Building, No.238 Xinyang Road, Dao Li District, Harbin, China
8 Auto Atlantic, 4th Floor, Corner Hertzog Boulevard and Heerengracht, Cape Town, 8001, South Africa
9 C/o Corporation Service Company, 2711 Centerville Road, Suite 400, Wilmington, Delaware, 19808, United States
10 33rd Floor, Tower One & Exchange Plaza, Ayala Triangle, Ayala Avenue, Makati City, Philippines
11 16 Paschimi Marg, Vasant Vihar, New Delhi, DL, India
12 Office 201, Parktown Quarter, Corner 3rd & 7th Avenue, Parktown North, Johannesburg 2193. South Africa
13 United Corporate Services, Inc., 874 Walker Road Suite C, Dover, Kent, DE, 19904, United States
14 P.O. Box No. 6320, 32038 Hawalli, Kuwait City, Kuwait
15 Campbells Corporate Services Limited, Floor 4, Willow House, Cricket Square, Grand Cayman, KY1-9010, Cayman Islands
16 3A Dev Regency II, First Main Road, Gandhinagar, Adyar, Chennai, TN, India
17 2nd Floor OTS Building, off Accra-Winneba Road, Kasoa second, Kasoa P.O. Box WJ973, Weija, Accra. Ghana
18 Suite 216, No. 127-1 Zhongguancun North Street, Haidian District, Beijing, China
19 Calz. de la Naranja # 159, Col. Fracc. Industrial Alce Blanco, Naucalpan de Juarez, Edo. De Mex., 53370, Mexico
20 10a Hussein Wassef St, Midan Missaha, Dokki Giza, 12311, Egypt
21 Unit No. 404, New Udyog Mandir 2, Mogul Lane, Mahim(West), Mumbai, MH, 400016, India
22 Incorporating Services, Ltd. 3500 S Dupont Way, Dover, Kent DE, 19901 United States
Notes to the company financial statements

Pearson plc Annual report and accounts 2017190
Five-year summary
All figures in £ millions 2013 2014 2015 2016 2017
Sales: By geography
North America 3,008 2,906 2,940 2,981 2,929
Core 1,008 910 815 803 815
Growth 712 724 713 768 769
Continuing 4,728 4,540 4,468 4,552 4,513
Discontinued 962 343 312 – –
Total sales 5,690 4,883 4,780 4,552 4,513
Adjusted operating profit: By geography
North America 464 444 480 420 394
Core 103 122 105 57 50
Growth 35 32 (3) 29 38
Penguin Random House 50 69 90 129 94
Continuing 652 667 672 635 576
Discontinued 84 55 51 – –
Total adjusted operating profit 736 722 723 635 576
All figures in £ millions 2013 2014 2015 2016 2017
Operating margin – continuing 13.8% 14.7% 15.0% 13.9% 12.8%
Adjusted earnings
Total adjusted operating profit 736 722 723 635 576
Net finance costs (72) (64) (46) (59) (79)
Income tax (97) (118) (105) (95) (55)
Non-controlling interest (1) 1 – (2) (2)
Adjusted earnings 566 541 572 479 440
Weighted average number of shares (millions) 807.8 810.9 813.3 814.8 813.4
Adjusted earnings per share 70.1p 66.7p 70.3p 58.8p 54.1p

Section 5 Financial statements 191
All figures in £ millions 2013 2014 2015 2016 2017
Cash flow
Operating cash flow 588 649 435 663 669
Operating cash conversion 80% 90% 60% 104% 116%
Operating free cash flow 324 413 255 549 525
Operating free cash flow per share 40.1p 50.9p 31.4p 67.4p 64.5p
Free cash flow 269 413 152 310 227
Free cash flow per share 33.3p 50.9p 18.7p 38.0p 27.9p
Net assets 5,706 5,985 6,418 4,348 4,021
Net debt 1,379 1,639 654 1,092 432
Return on invested capital
Total adjusted operating profit 736 722 723 635 576
Operating tax paid (191) (163) (129) (63) (75)
Return 545 559 594 572 501
Gross basis:
Average invested capital 10,130 9,900 10,317 11,464 11,568
Return on invested capital 5.4% 5.6% 5.8% 5.0% 4.3%
Net basis:
Average invested capital 10,130 9,835 9,422 7,906 8,126
Return on invested capital 5.4% 5.7% 6.3% 7.2% 6.2%
Dividend per share 48.0p 51.0p 52.0p 52.0p 17.0p
Five-year summary

Pearson plc Annual report and accounts 2017192
Financial key performance indicators
The following tables and narrative provide further analysis of the financial key performance indicators which are described in the financial review of the annual report on p34-40 , are shown within the key performance indicators on p2 of the annual report and shown in notes 2 and 8 of the notes to the consolidated financial statements.
Adjusted performance measures
The annual report and accounts reports results and performance on a headline basis which compares the reported results both on a statutory and on a non-GAAP (non-statutory) basis. The Group’s adjusted performance measures are non-GAAP (non-statutory) financial measures and are also included in the annual report as they are key financial measures used by management to evaluate performance and allocate resources to business segments. The measures also enable investors to more easily, and consistently, track the underlying operational performance of the Group and its business segments by separating out those items of income and expenditure relating to acquisition and disposal transactions, and major restructuring programmes.
The Group’s definition of adjusted performance measures may not be comparable to other similarly titled measures reported by other companies. A reconciliation of the adjusted measures to their corresponding statutory measures is shown below.
Sales
Underlying sales movements exclude the impact of portfolio changes arising from acquisitions and disposals and are stated at constant exchange rates. Portfolio changes are calculated by taking account of the additional contribution (at constant exchange rates) from acquisitions made in both the current year and the prior year. For acquisitions made in the prior year the additional contribution is calculated as the sales made in the period of the current year that corresponds to the pre-acquisition period in the prior year. Sales made by businesses disposed in either the current year or the prior year are also excluded. Constant exchange rates are calculated by assuming the average exchange rates in the prior year prevailed throughout the current year. These non-GAAP measures enable management and investors to track more easily, and consistently, the underlying sales performance of the Group.
All figures in £ millions 2017
Statutory sales 2017 4,513
Statutory sales 2016 4,552
Statutory sales decrease (39)
Comprising:
Underlying decrease (111)
Portfolio changes (54)
Exchange differences 126
Statutory sales decrease (39)
Statutory decrease (1)%
Underlying decrease (2)%
Constant exchange rate decrease (4)%

Section 5 Financial statements 193
Adjusted operating profit
Adjusted operating profit excludes the cost of major restructuring; other net gains and losses on the sale of subsidiaries, joint ventures, associates and other financial assets; intangible charges, including impairment, relating only to goodwill and intangible assets acquired through business combinations and the direct costs of acquiring those businesses; and the impact of US tax reform in 2017. Further details are given below under ‘Adjusted earnings per share’. Underlying adjusted operating profit movements exclude the impact of portfolio changes arising from acquisitions and disposals and are stated at constant exchange rates. Portfolio changes are calculated by taking account of the additional contribution (at constant exchange rates) from acquisitions made in both the current year and the prior year. For acquisitions made in the prior year the additional contribution is calculated as the operating profit made in the period of the current year that corresponds to the pre-acquisition period in the prior year. Operating profit made by businesses disposed in either the current year or the prior year is also excluded. Constant exchange rates are calculated by assuming the average exchange rates in the prior year prevailed throughout the current year. This non-GAAP measure enables management and investors to track more easily, and consistently, the underlying operating profit performance of the Group.
All figures in £ millions 2017 2016
Operating profit/(loss) 451 (2,497)
Cost of major restructuring 79 338
Other net gains and losses (128) 25
Intangible charges 166 2,769
Impact of US tax reform 8 –
Adjusted operating profit 576 635
All figures in £ millions 2017
Adjusted operating profit decrease (59)
Comprising:
Underlying decrease (58)
Portfolio changes (24)
Exchange differences 23
Adjusted operating profit decrease (59)
Underlying decrease (9)%
Constant exchange rate decrease (13)%
Adjusted earnings per share
Adjusted earnings includes adjusted operating profit and adjusted finance and tax charges. Adjusted earnings is included as a non-GAAP measure as it is used by management to evaluate performance and allocate resources to business segments and by investors to more easily, and consistently, track the underlying operational performance of the Group. Adjusted earnings per share is calculated as adjusted earnings divided by the weighted average number of shares in issue on an undiluted basis.
The following items are excluded from adjusted earnings:
Cost of major restructuring In January 2016 the Group announced that it was embarking on a restructuring programme to simplify the business, reduce costs and position the Group for growth in its major markets. The costs of this programme in 2016 were significant enough to exclude from the adjusted earnings measure so as to better highlight the underlying performance. A new programme of restructuring, announced in May 2017, began in the second half of 2017 and is expected to drive further significant cost savings. The costs of this new programme have also been excluded from adjusted earnings.
Other net gains and losses These represent profits and losses on the sale of subsidiaries, joint ventures, associates and other financial assets and are excluded from adjusted earnings as they distort the performance of the Group as reported on a statutory basis.
Intangible charges These represent charges in respect of goodwill, including impairment, and intangible assets acquired through business combinations and the direct costs of acquiring those businesses. These charges are excluded as they reflect past acquisition activity and do not necessarily reflect the current year performance of the Group.
Financial key performance indicators

Pearson plc Annual report and accounts 2017194
Other net finance income/costs These include finance costs in respect of retirement benefits, finance costs of deferred consideration and foreign exchange and other gains and losses. Finance income relating to retirement benefits are excluded as management does not believe that the consolidated income statement presentation under IAS 19 reflects the economic substance of the underlying assets and liabilities. Finance costs relating to acquisition transactions are excluded as these relate to future earn outs or acquisition expenses and are not part of the underlying financing. Foreign exchange and other gains and losses are excluded as they represent short-term fluctuations in market value and are subject to significant volatility. Other gains and losses may not be realised in due course as it is normally the intention to hold the related instruments to maturity.
Impact of US tax reform In 2017, as a result of US tax reform, the Group’s share of profit from associates was adversely impacted by £8m. This amount has been excluded from adjusted earnings as it is considered to be a transition adjustment that is not expected to recur in the near future.
Tax Tax on the above items is excluded from adjusted earnings. Where relevant the Group also excludes the benefit from recognising previously unrecognised pre-acquisition and capital losses. The tax benefit from tax deductible goodwill and intangibles is added to the adjusted income tax charge as this benefit more accurately aligns the adjusted tax charge with the expected rate of cash tax payments.
All figures in £ millions 2017 2016
Profit/(loss) for the year 408 (2,335)
Non-controlling interest (2) (2)
Cost of major restructuring 79 338
Other net gains and losses (128) 25
Intangible charges 166 2,769
Other net finance income/costs (49) 1
Impact of US tax reform 8 –
Tax (42) (317)
Adjusted earnings 440 479
Weighted average number of shares (millions) 813.4 814.8
Adjusted earnings per share 54.1p 58.8p
Return on invested capital
Return on invested capital (ROIC) is included as a non-GAAP measure as it is used by management and investors to track investment returns and by management to help inform capital allocation decisions within the business. ROIC is calculated as adjusted operating profit less operating cash tax paid expressed as a percentage of average invested capital. Invested capital includes the original unamortised goodwill and intangibles. Average values for total invested capital are calculated as the average monthly balance for the year. ROIC is also presented on a net basis after removing impaired goodwill from the invested capital balance. The net approach assumes that goodwill which has been impaired is treated consistently to goodwill disposed as it is no longer being used to generate returns.
All figures in £ millions2017
Gross2016
Gross2017 Net
2016 Net
Adjusted operating profit 576 635 576 635
Operating tax paid (75) (63) (75) (63)
Return 501 572 501 572
Average goodwill 7,236 6,987 3,794 3,429
Average other non-current intangibles 2,606 2,481 2,606 2,481
Average intangible assets – pre-publication 995 926 995 926
Average tangible fixed assets and working capital 731 1,070 731 1,070
Average invested capital 11,568 11,464 8,126 7,906
Return on invested capital 4.3% 5.0% 6.2% 7.2%
Financial key performance indicators

Section 5 Financial statements 195
Operating cash flow
Operating cash flow is calculated as net cash generated from operations before the impact of items excluded from the adjusted income statement plus dividends from joint ventures and associates (less the re-capitalisation dividends from Penguin Random House); less capital expenditure on property, plant and equipment and intangible software assets; plus proceeds from the sale of property, plant and equipment and intangible software assets; less finance lease principal payments; plus special pension contributions paid; and plus cost of major restructuring paid. Operating cash flow is included as a non-GAAP measure in order to align the cash flows with the corresponding adjusted operating profit measures.
All figures in £ millions 2017 2016
Net cash generated from operations 462 522
Dividends from joint ventures and associates 458 131
Re-capitalisation dividends from Penguin Random House (312) –
Purchase of property, plant and equipment (82) (88)
Purchase of intangible software assets (150) (157)
Proceeds from sale of property, plant and equipment and intangible software assets – 4
Finance lease principal payments (5) (6)
Special pension contribution 227 90
Cost of major restructuring paid 71 167
Operating cash flow 669 663
For information, cash conversion, calculated as operating cash flow as a percentage of adjusted operating profit, is also shown as a non-GAAP measure as this is used by management and investors to measure underlying cash generation by the Group.
All figures in £ millions 2017 2016
Adjusted operating profit 576 635
Operating cash flow 669 663
Cash conversion 116% 104%
For information, operating cash flow, operating free cash flow and total free cash flow, which are non-GAAP measures, are disclosed and reconciled in note 33 of the notes to the consolidated financial statements as they are commonly used by investors to measure the cash performance of the Group.
Net debt and earnings before interest, tax, depreciation and amortisation (EBITDA)
For information, the net debt/EBITDA ratio is shown as a non-GAAP measure as it is commonly used by investors to measure balance sheet strength. EBITDA is calculated as adjusted operating profit less depreciation on property, plant and equipment and less amortisation on intangible software assets.
All figures in £ millions 2017 2016
Adjusted operating profit 576 635
Depreciation (excluding items included in ‘cost of major restructuring’) 80 80
Amortisation on intangible software assets (excluding items included in ‘cost of major restructuring’) 82 70
EBITDA 738 785
Cash and cash equivalents 518 1,459
Marketable securities 8 10
Derivative financial instruments – (93)
Bank loans and overdrafts (15) (39)
Bonds (1,062) (2,420)
Finance lease liabilities (8) (9)
Total (559) (1,092)
Cash and cash equivalents classified as held for sale 127 –
Net debt (432) (1,092)
Net debt/EBITDA ratio 0.6x 1.4x
Financial key performance indicators

Pearson plc Annual report and accounts 2017196
Shareholder information
Pearson ordinary shares are listed on the London Stock Exchange and on the New York Stock Exchange in the form of American Depositary Receipts.
Corporate website
The investors’ section of our corporate website www.pearson.com/investors.html provides a wealth of information for shareholders. It is also possible to sign up to receive e-mail alerts for reports and press releases relating to Pearson at https://www.pearson.com/news/media/email-alert-signup.html
Shareholder information online
Shareholder information can be found on our website https://www.pearson.com/investors/investor-information.html
Our registrar, Equiniti, also provides a range of shareholder information online. You can check your holding and find practical help on transferring shares or updating your details at www.shareview.co.uk. For more information, please contact our registrar, Equiniti, Aspect House, Spencer Road, Lancing, West Sussex, BN99 6DA. Telephone 0371 384 2233* or, for those shareholders with hearing difficulties, textphone number 0371 384 2255*.
Information about the Pearson share price
The company’s share price can be found on our website at www.pearson.com. It also appears in the financial columns of the national press.
2017 dividends
Payment date Amount per share
Interim 15 September 2017 5 pence
Final 11 May 2018 12 pence
Payment of dividends to mandated accounts
Should you elect to have your dividends paid through BACS, this can be done directly into a bank or building society account, with the tax voucher sent to the shareholder’s registered address. Equiniti can be contacted for information on 0371 384 2043*.
Dividend reinvestment plan (DRIP)
The DRIP gives shareholders the right to buy the company’s shares on the London stock market with their cash dividend. For further information, please contact Equiniti on 0371 384 2268*.
Individual Savings Accounts (ISAs)
Equiniti offers ISAs in Pearson shares. For more information, please go to www.shareview.co.uk/dealing or call customer services on 0345 300 0430*.
Share dealing facilities
Equiniti offers telephone and internet services for dealing in Pearson shares. For further information, please contact their telephone dealing helpline on 03456 037 037* or, for online dealing, log on to www.shareview.co.uk/dealing. You will need your shareholder reference number as shown on your share certificate.
A postal dealing service is also available through Equiniti. Please telephone 0371 384 2248* for details or log on to www.shareview.co.uk to download a form.
* Lines open 8.30 am to 5.30 pm Monday to Friday (excluding UK public holidays).
ShareGift
Shareholders with small holdings of shares, whose value makes them uneconomic to sell, may wish to donate them to ShareGift, the share donation charity (registered charity number 1052686). Further information about ShareGift and the charities it has supported may be obtained from their website, www.ShareGift.org, or by contacting them at ShareGift, PO Box 72253, London, SW1P 9LQ.
American Depositary Receipts (ADRs)
Pearson’s ADRs are listed on the New York Stock Exchange and traded under the symbol PSO. Each ADR represents one ordinary share. For enquiries regarding registered ADR holder accounts and dividends, please contact Bank of New York Mellon, Shareholder Correspondence (ADR), PO Box 505000, Louisville, KY 40233-5000, telephone 1 (866) 259 2289 (toll free within the US) or 001 201 680 6825 (outside the US). Alternatively, you may e-mail [email protected]
Voting rights for registered ADR holders can be exercised through Bank of New York Mellon, and for beneficial ADR holders (and/or nominee accounts) through your US brokerage institution. Pearson will file with the Securities and Exchange Commission a Form 20-F.
Share register fraud: protecting your investment
Pearson does not contact its shareholders directly to provide recommendation advice and neither does it appoint third parties to do so. As required by law, our shareholder register is available for public inspection but we cannot control the use of information obtained by persons inspecting the register. Please treat any approaches purporting to originate from Pearson with caution.
For more information, please log on to our website at https://www.pearson.com/investors/managing-your-shares/ share-register-fraud.html
Tips on protecting your shares
Keep any documentation that contains your shareholder reference number in a safe place and shred any unwanted documentation Inform our registrar, Equiniti, promptly when you change address Be aware of dividend payment dates and contact the registrar if you do not receive your dividend cheque or, better still, make arrangements to have the dividend paid directly into your bank account Consider holding your shares electronically in a CREST account via a nominee.
2018 financial calendar
Ex-dividend date 5 April
Record date 6 April
Last date for dividend reinvestment election 19 April
Annual General Meeting 4 May
Payment date for dividend and share purchase date for dividend reinvestment 11 May

Reliance on this document The intention of this document is to provide information to shareholders and is not designed to be relied upon by any other party or for any other purpose.
Forward-looking statements This document includes forward-looking statements concerning Pearson’s financial condition, business and operations and its strategy, plans and objectives. In particular, all statements that express forecasts, expectations and projections, including trends in results of operations, margins, growth rates, overall market trends, the impact of interest or exchange rates, the availability of financing, anticipated cost savings and synergies and the execution of Pearson’s strategy, are forward-looking statements.
By their nature, forward-looking statements involve known and unknown risks and uncertainties because they relate to events and depend on circumstances that may occur in the future. They are based on numerous expectations, assumptions and beliefs regarding Pearson’s present and future business strategies and the environment in which it will operate in the future. There are various factors which could cause Pearson’s actual financial condition, results and development to differ materially from the plans, goals, objectives and expectations expressed or implied by these forward-looking statements, many of which are outside Pearson’s control. These include international, national and local conditions, as well as the impact of competition. They also include other risks detailed from time to time in Pearson’s publicly-filed documents and, in particular, the risk factors set out in this document, which you are advised to read. Any forward-looking statements speak only as of the date they are made and, except as required by law, Pearson gives no undertaking to update any forward-looking statements in this document whether as a result of new information, future developments, changes in its expectations or otherwise. Readers are cautioned not to place undue reliance on such forward-looking statements.
Designed and produced by Friend. www.friendstudio.com Print: Pureprint Group
Front cover illustrator Tang Yau Hoong
Photographs p23 and p41: Jo Moon Price p19: Chet Strange p33: Achala Saman
Pearson has supported the planting of 71.5 square metres of new native woodland with the Woodland Trust, helping to remove 2.052 metric tonnes of carbon dioxide generated by the production of this report and associated documents.
This report has been printed on Edixion Challenger Offset which is FSC® certified and made from 100% Elemental Chlorine Free (ECF) pulp. The mill and the printer are both certified to ISO 14001 environmental management system and registered to EMAS the eco management Audit Scheme. The report was printed using vegetable-based inks by a CarbonNeutral® printer.

www.pearson.com@pearson
Principal offices80 Strand, London WC2R 0RL, UK T +44 (0)20 7010 2000 F +44 (0)20 7010 6060
330 Hudson Street, New York, NY 10013, USA T +1 212 390 7100
Pearson plcRegistered number 53723 (England)
Pearson Annual report and accounts 2017