pearson edexcel level 3 gce mathematics · (source: pearson edexcel gce as and a level mathematics...
TRANSCRIPT
1
Pearson Edexcel Level 3 GCE Mathematics Advanced Level Paper 3: Statistics & Mechanics
Practice Paper G Time: 2 hours
Paper Reference(s) 9MA0/03
You must have: Mathematical Formulae and Statistical Tables, calculator
Candidates may use any calculator permitted by Pearson regulations. Calculators must not have the facility for algebraic manipulation, differentiation and integration, or have retrievable mathematical formulae stored in them. Instructions • Use black ink or ball-point pen. • If pencil is used for diagrams/sketches/graphs it must be dark (HB or B). • Answer all questions and ensure that your answers to parts of questions are clearly
labelled. • Answer the questions in the spaces provided – there may be more space than you need. • You should show sufficient working to make your methods clear. Answers without
working may not gain full credit. • Inexact answers should be given to three significant figures unless otherwise stated. Information • A booklet ‘Mathematical Formulae and Statistical Tables’ is provided. • There are 11 questions in this paper. The total is 100. • The for each question are shown in brackets – use this as a guide as to how much time to
spend on each question. Advice • Read each question carefully before you start to answer it. • Try to answer every question. • Check your answers if you have time at the end. • If you change your mind about an answer, cross it out and put your new answer and any
working underneath.
2
SECTION A: STATISTICS Answer ALL questions.
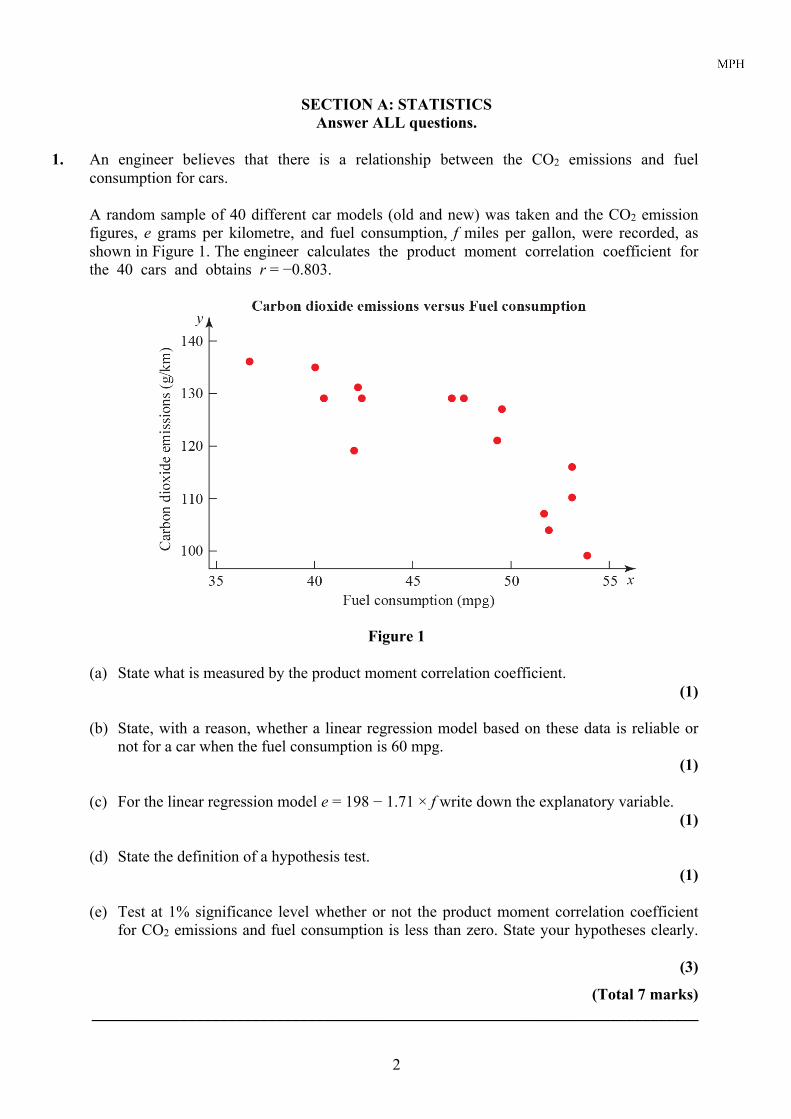
1. An engineer believes that there is a relationship between the CO2 emissions and fuel
consumption for cars. A random sample of 40 different car models (old and new) was taken and the CO2 emission figures, e grams per kilometre, and fuel consumption, f miles per gallon, were recorded, as shown in Figure 1. The engineer calculates the product moment correlation coefficient for the 40 cars and obtains r = −0.803.
Figure 1
(a) State what is measured by the product moment correlation coefficient. (1)
(b) State, with a reason, whether a linear regression model based on these data is reliable or
not for a car when the fuel consumption is 60 mpg. (1)
(c) For the linear regression model e = 198 − 1.71 × f write down the explanatory variable.
(1) (d) State the definition of a hypothesis test.
(1) (e) Test at 1% significance level whether or not the product moment correlation coefficient
for CO2 emissions and fuel consumption is less than zero. State your hypotheses clearly.
(3)
(Total 7 marks) ____________________________________________________________________________
3
2. A mechanic carried out a survey on the defects of cars he was servicing. He found that the probability of a car needing a new tyre is 0.33 and that a car needing a new tyre has a probability of 0.7 of needing tracking. A car not needing a new tyre has a probability of 0.04 of needing tracking.
(a) Draw a tree diagram to represent this information.
(3) (b) Find the probability that a randomly chosen car has exactly one of the two defects,
needing a new tyre or needing tracking. (2)
The mechanic also finds that cars need new brake pads with probability 0.35 and that this is independent of needing new tyres or tracking. A car is chosen at random. (c) Find the probability that the car has at least one of these three defects.
(2) (d) What advice would you give to motorists?
(1)
(Total 8 marks) ____________________________________________________________________________
4
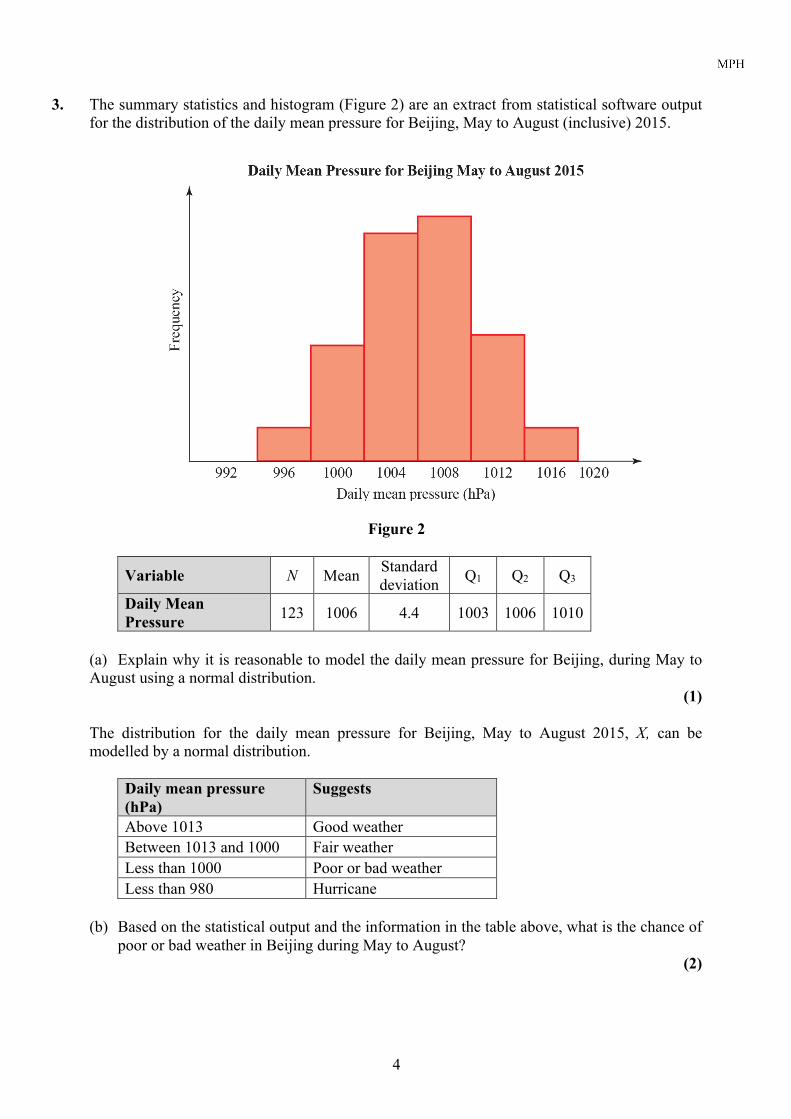
3. The summary statistics and histogram (Figure 2) are an extract from statistical software output for the distribution of the daily mean pressure for Beijing, May to August (inclusive) 2015.
Figure 2
Variable N Mean Standard deviation Q1 Q2 Q3
Daily Mean Pressure 123 1006 4.4 1003 1006 1010
(a) Explain why it is reasonable to model the daily mean pressure for Beijing, during May to August using a normal distribution.
(1) The distribution for the daily mean pressure for Beijing, May to August 2015, X, can be modelled by a normal distribution.
Daily mean pressure (hPa)
Suggests
Above 1013 Good weather Between 1013 and 1000 Fair weather Less than 1000 Poor or bad weather Less than 980 Hurricane
(b) Based on the statistical output and the information in the table above, what is the chance of
poor or bad weather in Beijing during May to August? (2)
5
(c) Although very unlikely, based on the model in part a, give a reason why we cannot say there is no chance of a hurricane in Beijing during May to August.
(1)
The distribution for daily mean pressure for Jacksonville during May to August can also be considered normally distributed with mean 1017 hPa and standard deviation 3.26 hPa. A student claims that you can depend on better weather in Jacksonville than in Beijing during May to August. (d) State, giving reasons, whether the information in this question supports this claim.
(4)
(Total 8 marks) ____________________________________________________________________________
6
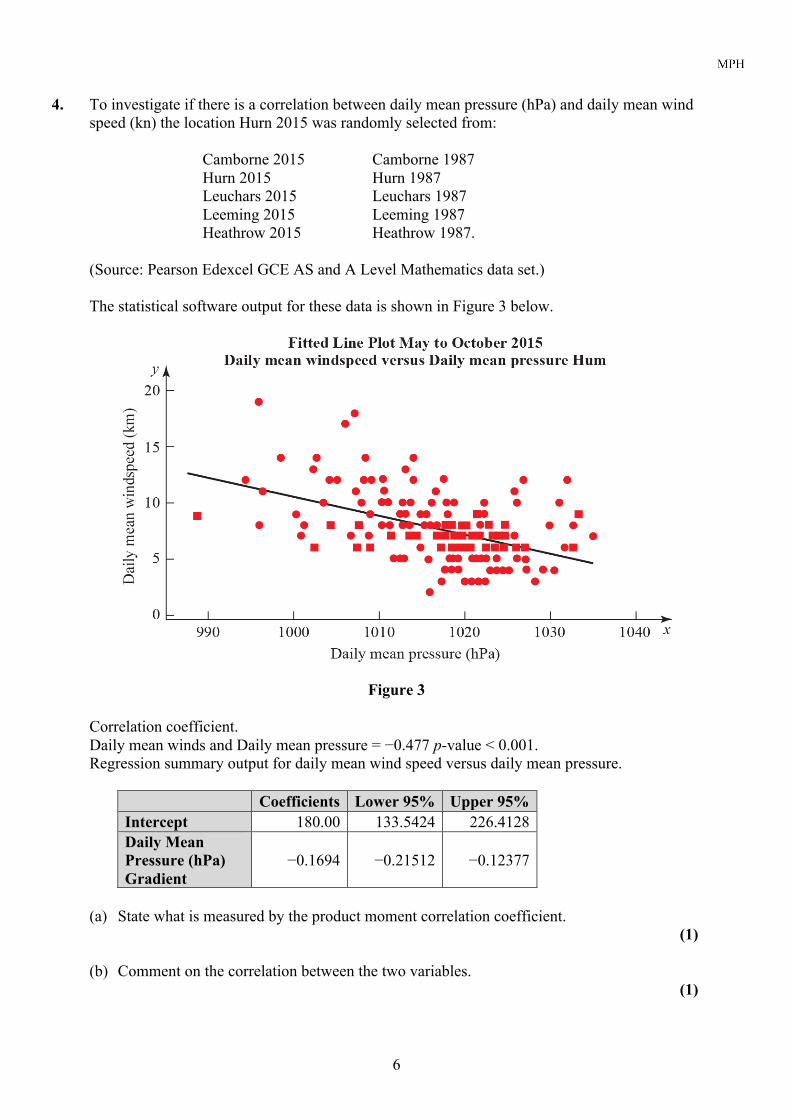
4. To investigate if there is a correlation between daily mean pressure (hPa) and daily mean wind speed (kn) the location Hurn 2015 was randomly selected from:
Camborne 2015 Camborne 1987 Hurn 2015 Hurn 1987 Leuchars 2015 Leuchars 1987 Leeming 2015 Leeming 1987 Heathrow 2015 Heathrow 1987.
(Source: Pearson Edexcel GCE AS and A Level Mathematics data set.) The statistical software output for these data is shown in Figure 3 below.
Figure 3 Correlation coefficient. Daily mean winds and Daily mean pressure = −0.477 p-value < 0.001. Regression summary output for daily mean wind speed versus daily mean pressure.
Coefficients Lower 95% Upper 95% Intercept 180.00 133.5424 226.4128 Daily Mean Pressure (hPa) Gradient
−0.1694 −0.21512 −0.12377
(a) State what is measured by the product moment correlation coefficient.
(1) (b) Comment on the correlation between the two variables.
(1)

7
(c) Give an interpretation of the correlation between the two variables. (1)
(d) Test at 5% significance level whether or not the product moment correlation coefficient
for the population is less than zero. State your hypotheses clearly. (3)
(e) Write down the regression model for daily mean wind speed versus daily mean pressure.
(2) (f) Interpret the gradient of the line of regression stated in part e.
(1) (g) The regression model (equation of regression) was used to predict the daily mean wind
speed of 11.15 knots for a daily mean pressure of 995 hPa. Comment on the accuracy of this prediction.
(1) ____________________________________________________________________________
5. P(E) = 0.25, P(F) = 0.4 and P(E F) = 0.12
(a) Find P(E ¢|F ¢)
(2) (b) Explain, showing your working, whether or not E and F are statistically independent. Give
reasons for your answer. (2)
The event G has P(G) = 0.15. The events E and G are mutually exclusive and the events F and G are independent. (c) Draw a Venn diagram to illustrate the events E, F and G, giving the probabilities for each
region. (5)
(d) Find P([F G]')
(2)
(Total 11 marks) ____________________________________________________________________________
6. In a town, 54% of the residents are female and 46% are male. A random sample of 200
residents is chosen from the town. Using a suitable approximation, find the probability that more than half the sample are female.
(Total 6 marks) ____________________________________________________________________________
Ç
È
8
SECTION B: MECHANICS
Answer ALL questions.
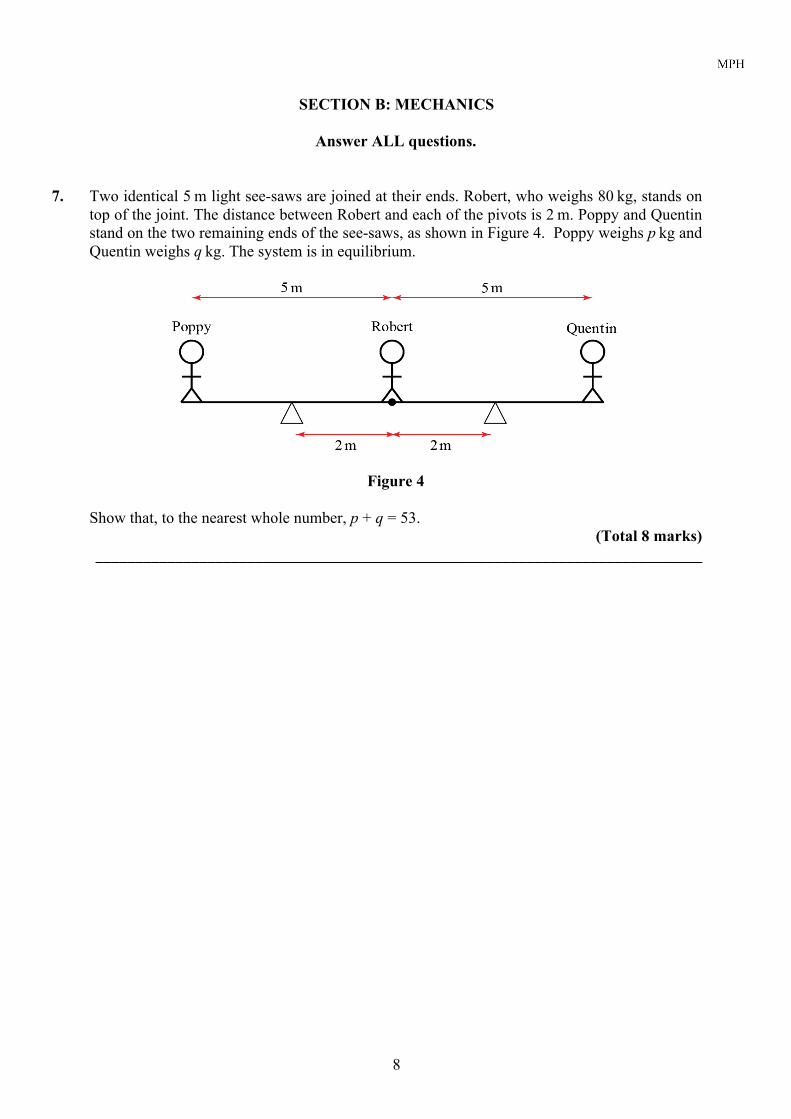
7. Two identical 5 m light see-saws are joined at their ends. Robert, who weighs 80 kg, stands on top of the joint. The distance between Robert and each of the pivots is 2 m. Poppy and Quentin stand on the two remaining ends of the see-saws, as shown in Figure 4. Poppy weighs p kg and Quentin weighs q kg. The system is in equilibrium.
Figure 4
Show that, to the nearest whole number, p + q = 53. (Total 8 marks)
____________________________________________________________________________
9
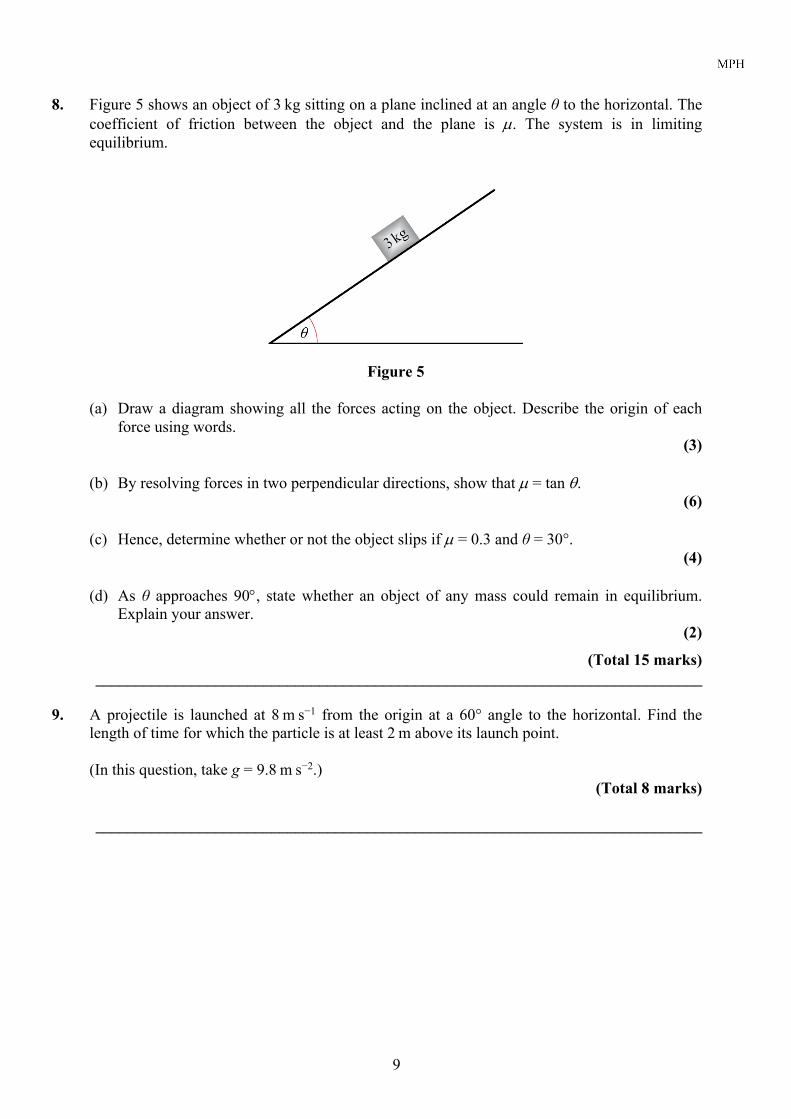
8. Figure 5 shows an object of 3 kg sitting on a plane inclined at an angle θ to the horizontal. The coefficient of friction between the object and the plane is µ. The system is in limiting equilibrium.
Figure 5 (a) Draw a diagram showing all the forces acting on the object. Describe the origin of each
force using words. (3)
(b) By resolving forces in two perpendicular directions, show that µ = tan q.
(6) (c) Hence, determine whether or not the object slips if µ = 0.3 and θ = 30°.
(4) (d) As θ approaches 90°, state whether an object of any mass could remain in equilibrium.
Explain your answer. (2)
(Total 15 marks) ____________________________________________________________________________
9. A projectile is launched at 8 m s−1 from the origin at a 60° angle to the horizontal. Find the
length of time for which the particle is at least 2 m above its launch point. (In this question, take g = 9.8 m s−2.)
(Total 8 marks) ____________________________________________________________________________
10
10. A 0.5 kg particle experiences two forces, A = (2i – j) N and B = I N. Initially, the particle is at rest and has position vector (3i + 4j) m.
(a) Find the x and y coordinates of the particle t seconds later.
(9) (b) Explain why the particle never returns to its starting point.
(2) (c) Describe a physical situation which this mathematical model could represent and give
physical meanings to A and B. (2)
(Total 13 marks) ____________________________________________________________________________
11. The position, r, of a planet orbiting a star at time t is given by .
(a) Find the velocity v and acceleration a of the planet in terms of t.
(3) (b) Show that a = −4r.
(1) (c) Sketch the trajectory of the particle and draw arrows showing its velocity and acceleration
when t = 0. (2)
(Total 6 marks) ____________________________________________________________________________
TOTAL FOR PAPER IS 100
cos 2sin 2
tt
=æ öç ÷è ø
r