pearl river watershed jackson metropolitan area, … · 2018-08-23 · pearl river watershed, hinds...
TRANSCRIPT
Appendix B: Economics
1
PEARL RIVER WATERSHED 2
JACKSON METROPOLITAN AREA, MISSISSIPPI 3
4
5
6
7
8
APPENDIX B 9
ECONOMIC ANALYSIS 10
11
12
13
14
15
16
17
18
19
October 2017 20
Appendix B: Economics
1
2
3
4
5
6
7
8
9
10
11
This Page Intentionally Left Blank 12
Integrated Draft Feasibility and Environmental Impact Statement Pearl River Watershed, Hinds and Rankin Counties, MS
Appendix B: Economics
Table of Contents 1
SECTION I - INTRODUCTION ..................................................................................... 1 2
SECTION II-DESCRIPTION OF STUDY AREA ........................................................ 1 3
SECTION III – ECONOMIC ANALYSIS ..................................................................... 5 4
Appendix B, Amendment 1 Levee Fragility Curves .................................................... 31 5
Appendix B, Amendment 2 Performance Statistics ..................................................... 35 6
Appendix B, Amendment 3 Recreation Benefits .......................................................... 37 7
8
9
10

Integrated Draft Feasibility and Environmental Impact Statement Pearl River Watershed, Hinds and Rankin Counties, MS
Appendix B: Economics
1
2
3
4
5
6
7
8
9
10
11
This Page Intentionally Left Blank 12

Integrated Draft Feasibility and Environmental Impact Statement Pearl River Watershed, Hinds and Rankin Counties, MS
Appendix B: Economics 1
APPENDIX B 1 ECONOMIC ANALYSIS 2
3
SECTION I - INTRODUCTION 4
General - In accordance with congressional authorization, the Rankin-Hinds Pearl River Flood 5 and Drainage Control District (RHPRFDCD) is preparing a Feasibility Study and Environmental 6 Impact Statement, (FS/EIS), for the purpose of identifying the federal interest in the Pearl River 7 Watershed, Mississippi. An economic evaluation of the improvements being considered is 8 presented in this appendix. It was prepared in accordance with Engineering Regulation (ER) 1105-9 2-100 and ER 1105-2-101, Planning Guidance. The National Economic Development Procedures 10 Manual for Flood Risk Management and Coastal Storm Risk Management, prepared by the Water 11 Resources Support Center, Institute of Water Resourses, was also used as a reference, along with 12 User’s Manual for the Hydrologic Engineering Center Flood Damage Analysis Model (HEC-13 FDA). 14 This evaluation consists of a description of the methodology used to determine economic damages 15 and benefits under existing and with project conditions, project costs, and benefit-to-cost analysis. 16 October 2017 price levels were used in the evaluation. The proposed improvements were 17 evaluated by comparing estimated annual project benefits that would accrue to the Study Area with 18 estimated annual project costs. Benefits and costs were converted to average annual equivalent 19 values utilizing a federal discount rate of 2 ¾ percent and a project life of 50 years. The estimated 20 based year (the year in which significant project benefits will accrue as a result of project 21 construction) is the year 2020. 22 23 National Economic Development Benefits Considered - The National Economic Development 24 (NED) Procedures Manual for Urban Flood Damage recognizes four (4) primary categories of 25 benefits for urban flood control plans: inundation reduction, intensification, location, and 26 employment benefits. The majority of the benefits attributable to a project alternative generally 27 result from the reduction of actual or potential damages caused by inundation. Inundation 28 reduction includes the reduction of physical damages to structures, contents, and vehicles. It also 29 includes reduced damages to roads and bridges and other infrastructure. It also includes the 30 reduction of emergency costs, evacuation and subsistence costs, reoccupation costs, commercial 31 clean up, and Federal Insurance Administration costs saved. Other categories such as 32 intensification, reduced fill requirements, and location are discussed in this appendix. 33 34
SECTION II-DESCRIPTION OF STUDY AREA 35
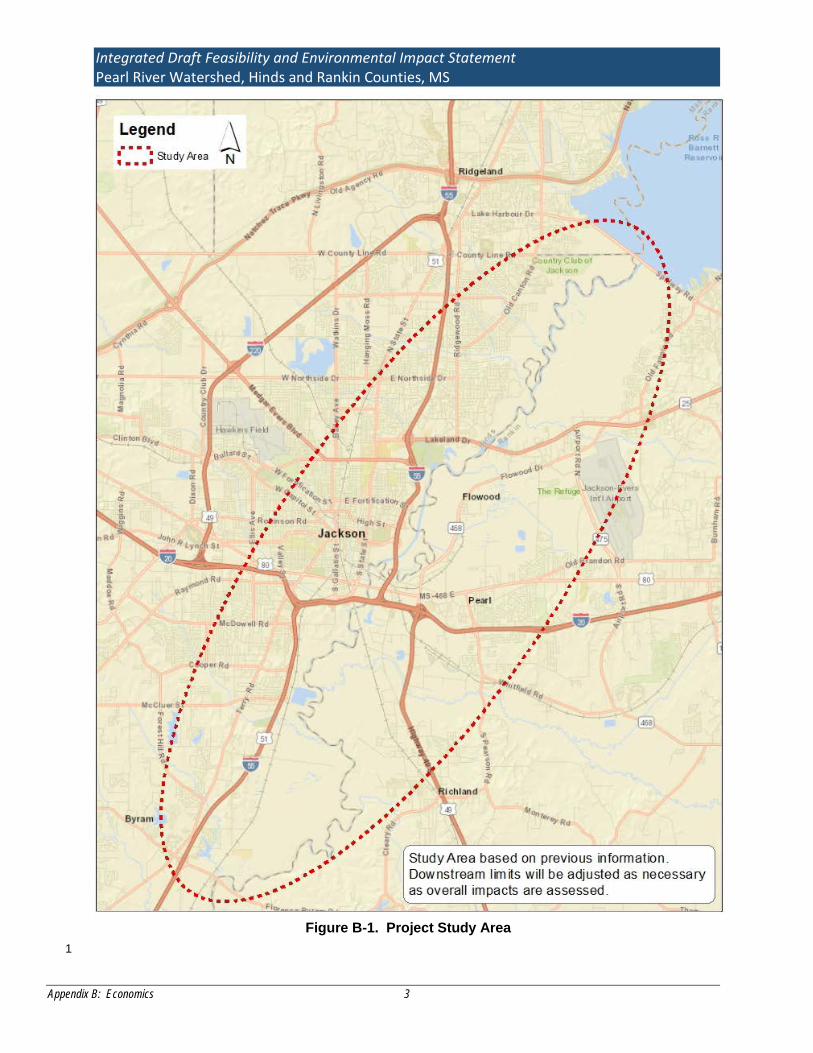
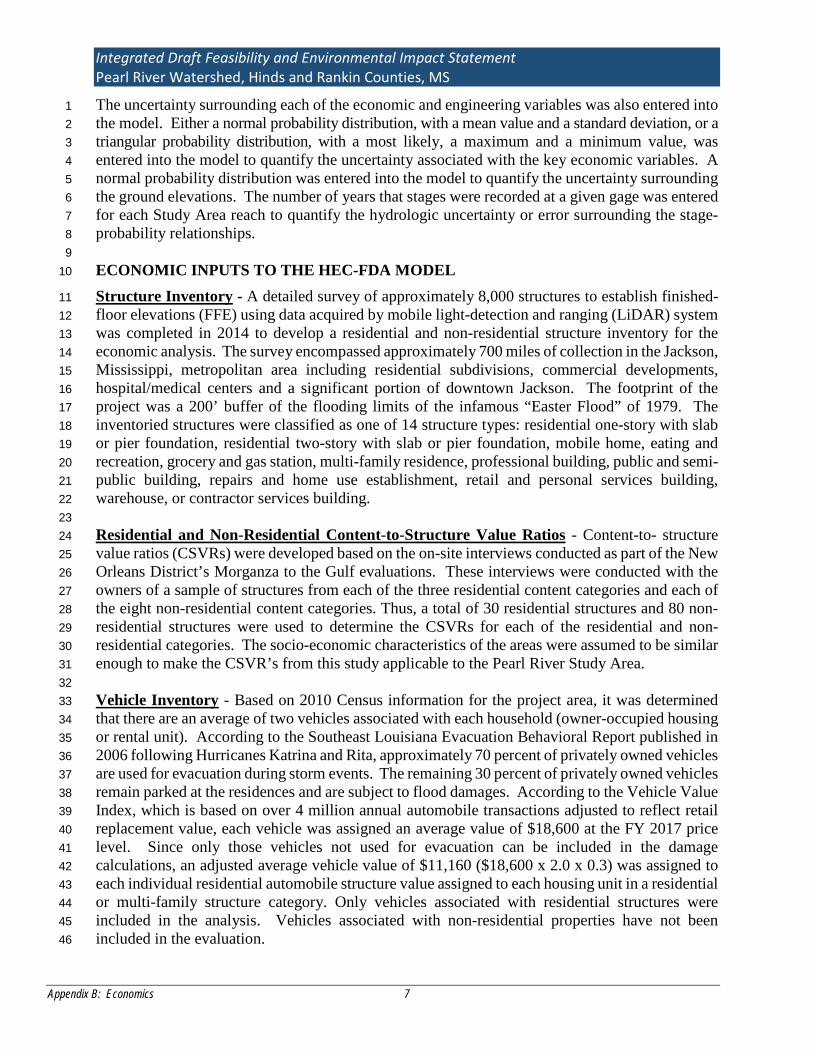
Geographical Location - The Pearl River Basin is located in the south-central portion of 36 Mississippi and in a small part of southeastern Louisiana. The river drains an area of 8,760 square 37 miles consisting of all, or parts, of 23 counties in Mississippi and parts of 3 Louisiana parishes. 38 The primary Study Area, shown in Figure B-1, comprises the Pearl River Basin between River 39 Mile (RM) 280.0 (south of Richland MS) and RM 301.77, (at the dam of Ross Barnett Reservoir). 40 Municipalities within the Study Area include, Flowood, Jackson, Pearl, and Richland. The Study 41 Area includes parts of Hinds, and Rankin Counties. Major tributaries of the Pearl River within the 42 Study Area include Caney, Eubanks, Hanging Moss, Hog, Lynch, Prairie Branch, Purple, 43 Richland, and Town Creeks. The Study Area is primarily affected by headwater flooding caused 44
Integrated Draft Feasibility and Environmental Impact Statement Pearl River Watershed, Hinds and Rankin Counties, MS
Appendix B: Economics 2
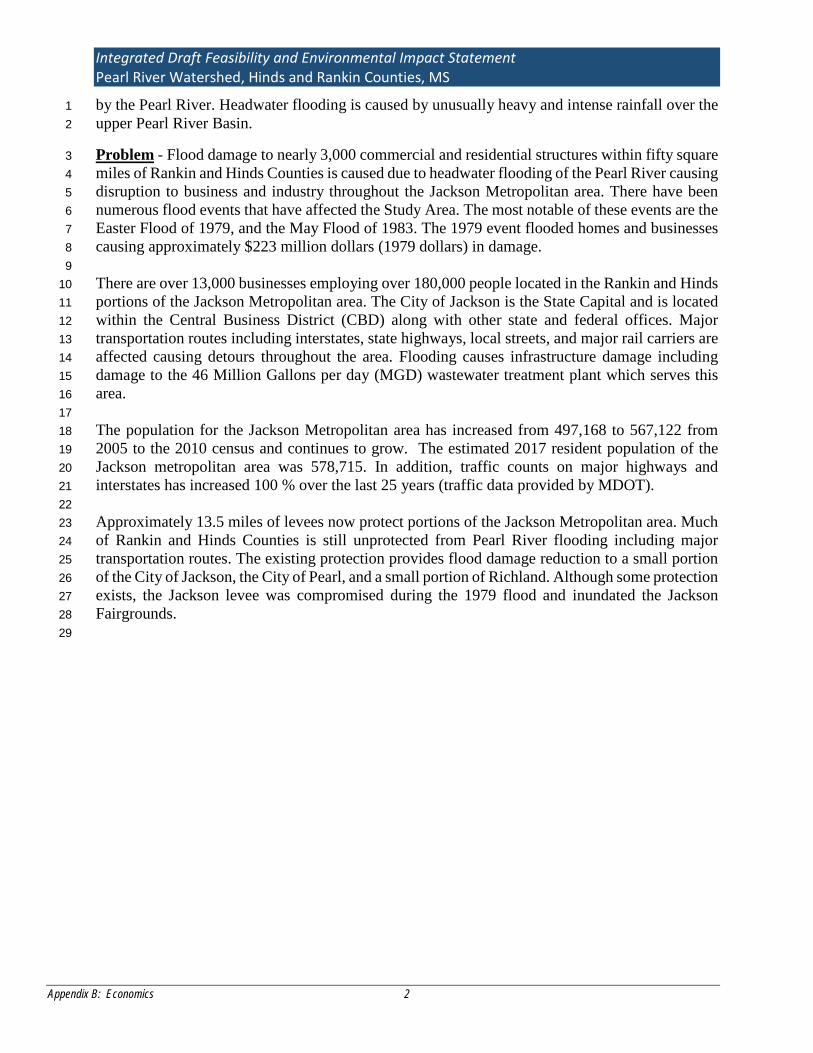
by the Pearl River. Headwater flooding is caused by unusually heavy and intense rainfall over the 1 upper Pearl River Basin. 2
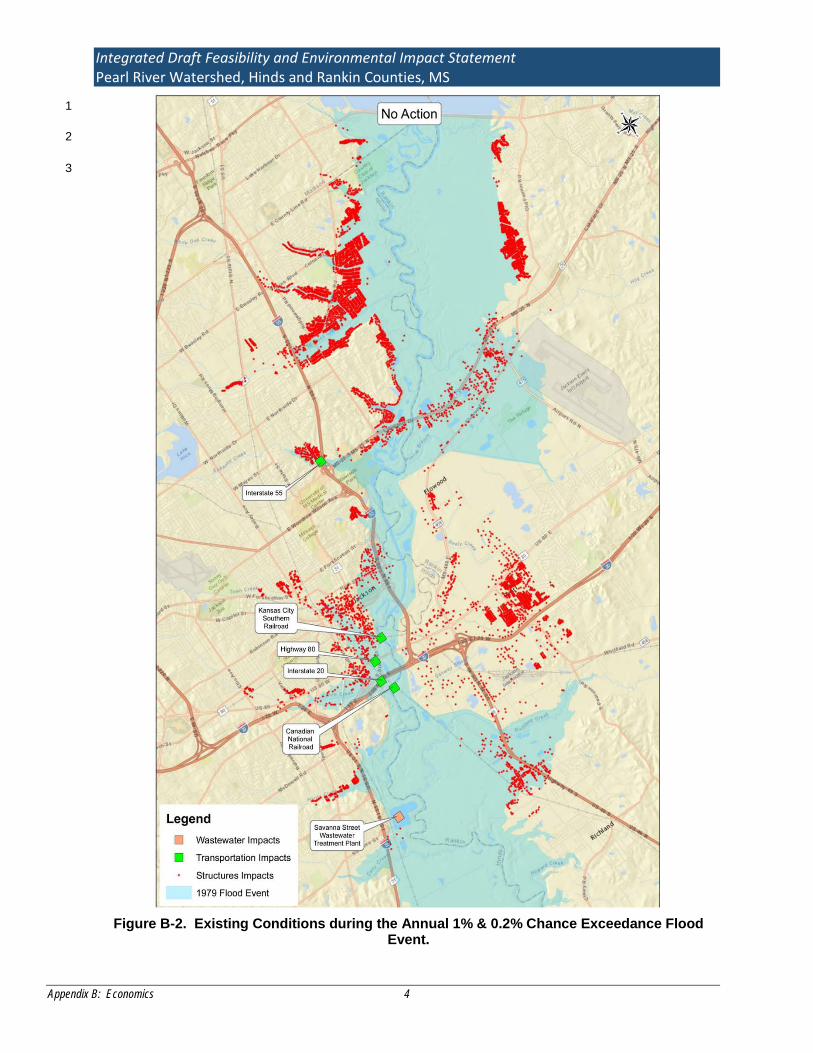
Problem - Flood damage to nearly 3,000 commercial and residential structures within fifty square 3 miles of Rankin and Hinds Counties is caused due to headwater flooding of the Pearl River causing 4 disruption to business and industry throughout the Jackson Metropolitan area. There have been 5 numerous flood events that have affected the Study Area. The most notable of these events are the 6 Easter Flood of 1979, and the May Flood of 1983. The 1979 event flooded homes and businesses 7 causing approximately $223 million dollars (1979 dollars) in damage. 8 9 There are over 13,000 businesses employing over 180,000 people located in the Rankin and Hinds 10 portions of the Jackson Metropolitan area. The City of Jackson is the State Capital and is located 11 within the Central Business District (CBD) along with other state and federal offices. Major 12 transportation routes including interstates, state highways, local streets, and major rail carriers are 13 affected causing detours throughout the area. Flooding causes infrastructure damage including 14 damage to the 46 Million Gallons per day (MGD) wastewater treatment plant which serves this 15 area. 16 17 The population for the Jackson Metropolitan area has increased from 497,168 to 567,122 from 18 2005 to the 2010 census and continues to grow. The estimated 2017 resident population of the 19 Jackson metropolitan area was 578,715. In addition, traffic counts on major highways and 20 interstates has increased 100 % over the last 25 years (traffic data provided by MDOT). 21 22 Approximately 13.5 miles of levees now protect portions of the Jackson Metropolitan area. Much 23 of Rankin and Hinds Counties is still unprotected from Pearl River flooding including major 24 transportation routes. The existing protection provides flood damage reduction to a small portion 25 of the City of Jackson, the City of Pearl, and a small portion of Richland. Although some protection 26 exists, the Jackson levee was compromised during the 1979 flood and inundated the Jackson 27 Fairgrounds. 28 29
Integrated Draft Feasibility and Environmental Impact Statement Pearl River Watershed, Hinds and Rankin Counties, MS
Appendix B: Economics 3
1 Figure B-1. Project Study Area
Integrated Draft Feasibility and Environmental Impact Statement Pearl River Watershed, Hinds and Rankin Counties, MS
Appendix B: Economics 4
1
2
3
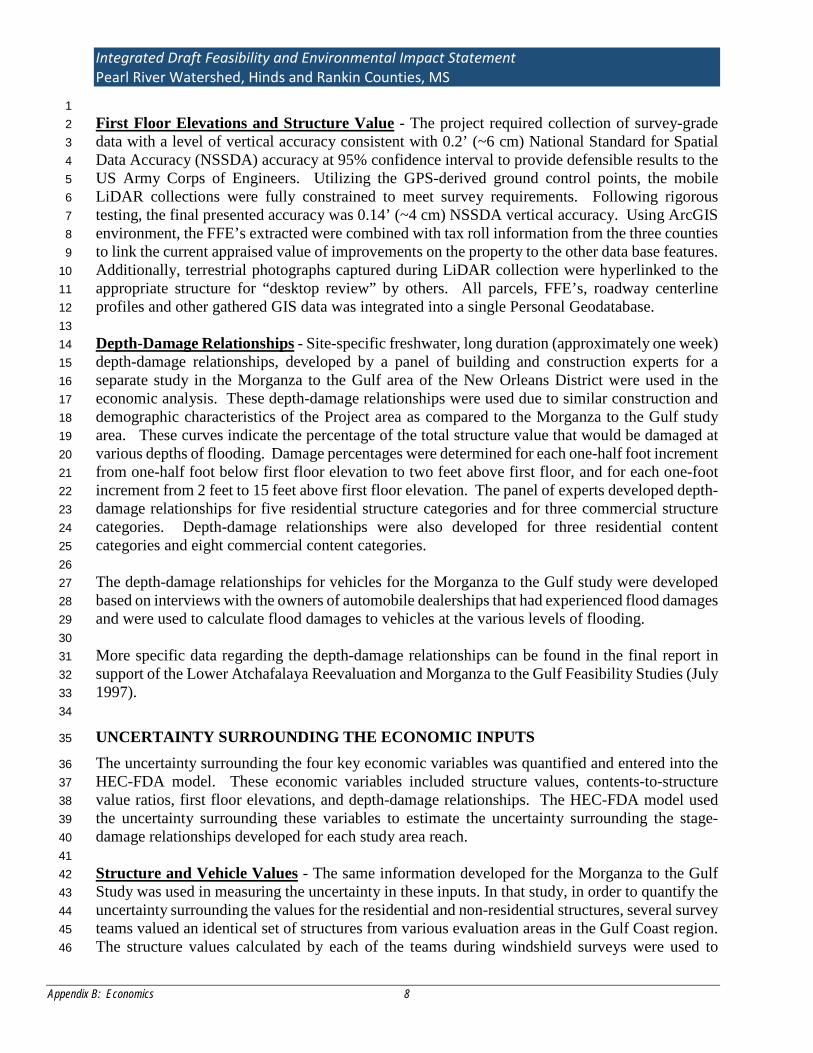
Figure B-2. Existing Conditions during the Annual 1% & 0.2% Chance Exceedance Flood Event.
Integrated Draft Feasibility and Environmental Impact Statement Pearl River Watershed, Hinds and Rankin Counties, MS
Appendix B: Economics 5
SECTION III – ECONOMIC ANALYSIS 1
REACH DELINEATION 2
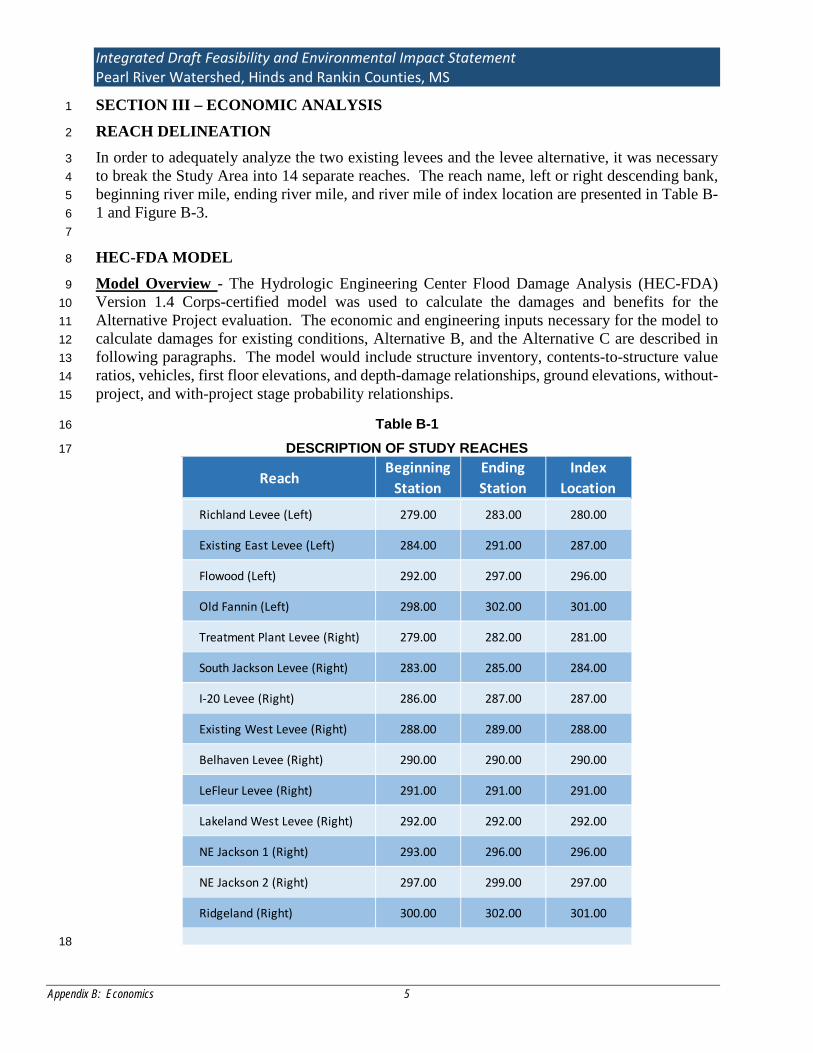
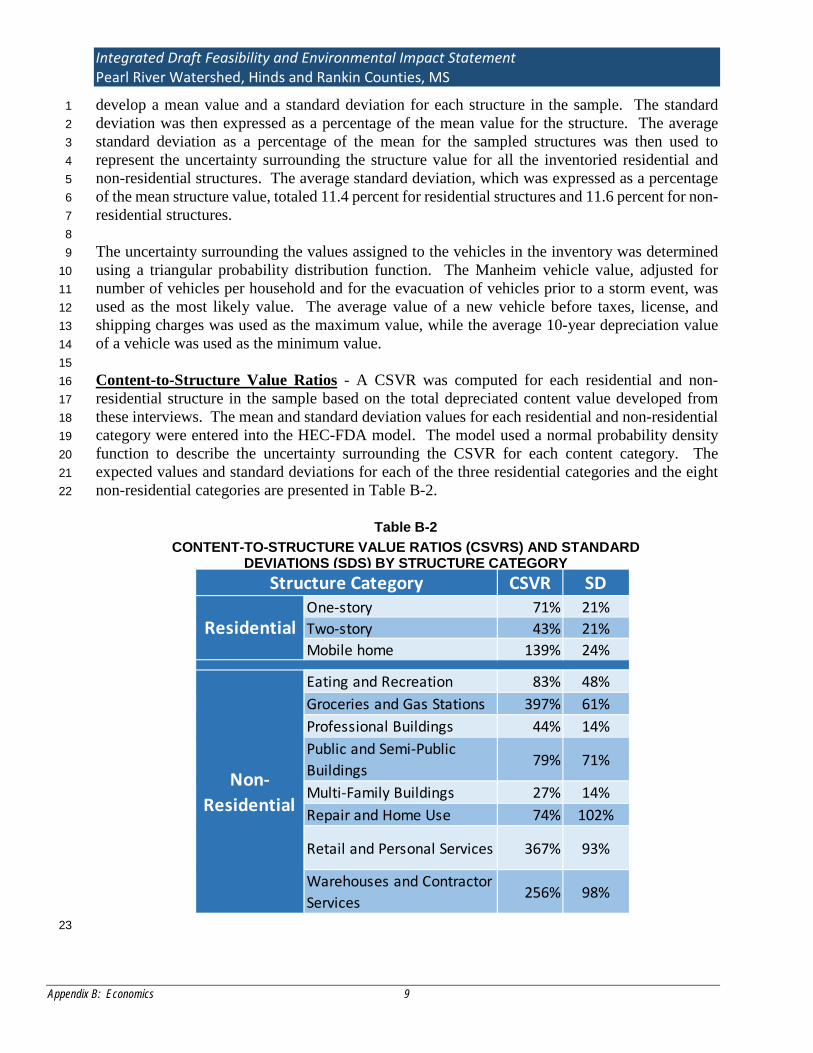
In order to adequately analyze the two existing levees and the levee alternative, it was necessary 3 to break the Study Area into 14 separate reaches. The reach name, left or right descending bank, 4 beginning river mile, ending river mile, and river mile of index location are presented in Table B-5 1 and Figure B-3. 6 7
HEC-FDA MODEL 8
Model Overview - The Hydrologic Engineering Center Flood Damage Analysis (HEC-FDA) 9 Version 1.4 Corps-certified model was used to calculate the damages and benefits for the 10 Alternative Project evaluation. The economic and engineering inputs necessary for the model to 11 calculate damages for existing conditions, Alternative B, and the Alternative C are described in 12 following paragraphs. The model would include structure inventory, contents-to-structure value 13 ratios, vehicles, first floor elevations, and depth-damage relationships, ground elevations, without-14 project, and with-project stage probability relationships. 15
Table B-1 16
DESCRIPTION OF STUDY REACHES 17
ReachBeginning
StationEnding Station
Index Location
Richland Levee (Left) 279.00 283.00 280.00
Existing East Levee (Left) 284.00 291.00 287.00
Flowood (Left) 292.00 297.00 296.00
Old Fannin (Left) 298.00 302.00 301.00
Treatment Plant Levee (Right) 279.00 282.00 281.00
South Jackson Levee (Right) 283.00 285.00 284.00
I-20 Levee (Right) 286.00 287.00 287.00
Existing West Levee (Right) 288.00 289.00 288.00
Belhaven Levee (Right) 290.00 290.00 290.00
LeFleur Levee (Right) 291.00 291.00 291.00
Lakeland West Levee (Right) 292.00 292.00 292.00
NE Jackson 1 (Right) 293.00 296.00 296.00
NE Jackson 2 (Right) 297.00 299.00 297.00
Ridgeland (Right) 300.00 302.00 301.00
18
Integrated Draft Feasibility and Environmental Impact Statement Pearl River Watershed, Hinds and Rankin Counties, MS
Appendix B: Economics 6
1
Figure B-3. Study Reaches
Integrated Draft Feasibility and Environmental Impact Statement Pearl River Watershed, Hinds and Rankin Counties, MS
Appendix B: Economics 7
The uncertainty surrounding each of the economic and engineering variables was also entered into 1 the model. Either a normal probability distribution, with a mean value and a standard deviation, or a 2 triangular probability distribution, with a most likely, a maximum and a minimum value, was 3 entered into the model to quantify the uncertainty associated with the key economic variables. A 4 normal probability distribution was entered into the model to quantify the uncertainty surrounding 5 the ground elevations. The number of years that stages were recorded at a given gage was entered 6 for each Study Area reach to quantify the hydrologic uncertainty or error surrounding the stage-7 probability relationships. 8 9 ECONOMIC INPUTS TO THE HEC-FDA MODEL 10
Structure Inventory - A detailed survey of approximately 8,000 structures to establish finished-11 floor elevations (FFE) using data acquired by mobile light-detection and ranging (LiDAR) system 12 was completed in 2014 to develop a residential and non-residential structure inventory for the 13 economic analysis. The survey encompassed approximately 700 miles of collection in the Jackson, 14 Mississippi, metropolitan area including residential subdivisions, commercial developments, 15 hospital/medical centers and a significant portion of downtown Jackson. The footprint of the 16 project was a 200’ buffer of the flooding limits of the infamous “Easter Flood” of 1979. The 17 inventoried structures were classified as one of 14 structure types: residential one-story with slab 18 or pier foundation, residential two-story with slab or pier foundation, mobile home, eating and 19 recreation, grocery and gas station, multi-family residence, professional building, public and semi-20 public building, repairs and home use establishment, retail and personal services building, 21 warehouse, or contractor services building. 22 23 Residential and Non-Residential Content-to-Structure Value Ratios - Content-to- structure 24 value ratios (CSVRs) were developed based on the on-site interviews conducted as part of the New 25 Orleans District’s Morganza to the Gulf evaluations. These interviews were conducted with the 26 owners of a sample of structures from each of the three residential content categories and each of 27 the eight non-residential content categories. Thus, a total of 30 residential structures and 80 non-28 residential structures were used to determine the CSVRs for each of the residential and non-29 residential categories. The socio-economic characteristics of the areas were assumed to be similar 30 enough to make the CSVR’s from this study applicable to the Pearl River Study Area. 31 32 Vehicle Inventory - Based on 2010 Census information for the project area, it was determined 33 that there are an average of two vehicles associated with each household (owner-occupied housing 34 or rental unit). According to the Southeast Louisiana Evacuation Behavioral Report published in 35 2006 following Hurricanes Katrina and Rita, approximately 70 percent of privately owned vehicles 36 are used for evacuation during storm events. The remaining 30 percent of privately owned vehicles 37 remain parked at the residences and are subject to flood damages. According to the Vehicle Value 38 Index, which is based on over 4 million annual automobile transactions adjusted to reflect retail 39 replacement value, each vehicle was assigned an average value of $18,600 at the FY 2017 price 40 level. Since only those vehicles not used for evacuation can be included in the damage 41 calculations, an adjusted average vehicle value of $11,160 ($18,600 x 2.0 x 0.3) was assigned to 42 each individual residential automobile structure value assigned to each housing unit in a residential 43 or multi-family structure category. Only vehicles associated with residential structures were 44 included in the analysis. Vehicles associated with non-residential properties have not been 45 included in the evaluation. 46
Integrated Draft Feasibility and Environmental Impact Statement Pearl River Watershed, Hinds and Rankin Counties, MS
Appendix B: Economics 8
1 First Floor Elevations and Structure Value - The project required collection of survey-grade 2 data with a level of vertical accuracy consistent with 0.2’ (~6 cm) National Standard for Spatial 3 Data Accuracy (NSSDA) accuracy at 95% confidence interval to provide defensible results to the 4 US Army Corps of Engineers. Utilizing the GPS-derived ground control points, the mobile 5 LiDAR collections were fully constrained to meet survey requirements. Following rigorous 6 testing, the final presented accuracy was 0.14’ (~4 cm) NSSDA vertical accuracy. Using ArcGIS 7 environment, the FFE’s extracted were combined with tax roll information from the three counties 8 to link the current appraised value of improvements on the property to the other data base features. 9 Additionally, terrestrial photographs captured during LiDAR collection were hyperlinked to the 10 appropriate structure for “desktop review” by others. All parcels, FFE’s, roadway centerline 11 profiles and other gathered GIS data was integrated into a single Personal Geodatabase. 12 13 Depth-Damage Relationships - Site-specific freshwater, long duration (approximately one week) 14 depth-damage relationships, developed by a panel of building and construction experts for a 15 separate study in the Morganza to the Gulf area of the New Orleans District were used in the 16 economic analysis. These depth-damage relationships were used due to similar construction and 17 demographic characteristics of the Project area as compared to the Morganza to the Gulf study 18 area. These curves indicate the percentage of the total structure value that would be damaged at 19 various depths of flooding. Damage percentages were determined for each one-half foot increment 20 from one-half foot below first floor elevation to two feet above first floor, and for each one-foot 21 increment from 2 feet to 15 feet above first floor elevation. The panel of experts developed depth-22 damage relationships for five residential structure categories and for three commercial structure 23 categories. Depth-damage relationships were also developed for three residential content 24 categories and eight commercial content categories. 25 26 The depth-damage relationships for vehicles for the Morganza to the Gulf study were developed 27 based on interviews with the owners of automobile dealerships that had experienced flood damages 28 and were used to calculate flood damages to vehicles at the various levels of flooding. 29 30 More specific data regarding the depth-damage relationships can be found in the final report in 31 support of the Lower Atchafalaya Reevaluation and Morganza to the Gulf Feasibility Studies (July 32 1997). 33 34
UNCERTAINTY SURROUNDING THE ECONOMIC INPUTS 35
The uncertainty surrounding the four key economic variables was quantified and entered into the 36 HEC-FDA model. These economic variables included structure values, contents-to-structure 37 value ratios, first floor elevations, and depth-damage relationships. The HEC-FDA model used 38 the uncertainty surrounding these variables to estimate the uncertainty surrounding the stage-39 damage relationships developed for each study area reach. 40 41 Structure and Vehicle Values - The same information developed for the Morganza to the Gulf 42 Study was used in measuring the uncertainty in these inputs. In that study, in order to quantify the 43 uncertainty surrounding the values for the residential and non-residential structures, several survey 44 teams valued an identical set of structures from various evaluation areas in the Gulf Coast region. 45 The structure values calculated by each of the teams during windshield surveys were used to 46
Integrated Draft Feasibility and Environmental Impact Statement Pearl River Watershed, Hinds and Rankin Counties, MS
Appendix B: Economics 9
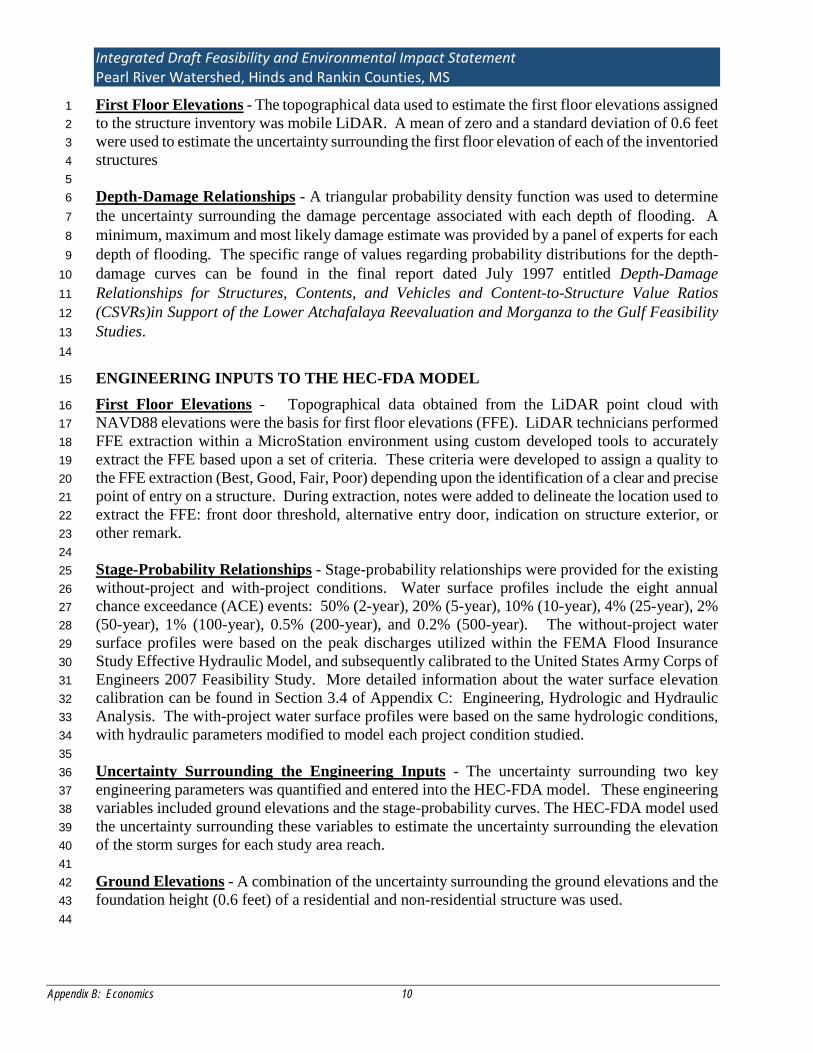
develop a mean value and a standard deviation for each structure in the sample. The standard 1 deviation was then expressed as a percentage of the mean value for the structure. The average 2 standard deviation as a percentage of the mean for the sampled structures was then used to 3 represent the uncertainty surrounding the structure value for all the inventoried residential and 4 non-residential structures. The average standard deviation, which was expressed as a percentage 5 of the mean structure value, totaled 11.4 percent for residential structures and 11.6 percent for non-6 residential structures. 7 8 The uncertainty surrounding the values assigned to the vehicles in the inventory was determined 9 using a triangular probability distribution function. The Manheim vehicle value, adjusted for 10 number of vehicles per household and for the evacuation of vehicles prior to a storm event, was 11 used as the most likely value. The average value of a new vehicle before taxes, license, and 12 shipping charges was used as the maximum value, while the average 10-year depreciation value 13 of a vehicle was used as the minimum value. 14 15 Content-to-Structure Value Ratios - A CSVR was computed for each residential and non-16 residential structure in the sample based on the total depreciated content value developed from 17 these interviews. The mean and standard deviation values for each residential and non-residential 18 category were entered into the HEC-FDA model. The model used a normal probability density 19 function to describe the uncertainty surrounding the CSVR for each content category. The 20 expected values and standard deviations for each of the three residential categories and the eight 21 non-residential categories are presented in Table B-2. 22
23
CSVR SDOne-story 71% 21%Two-story 43% 21%Mobile home 139% 24%
Eating and Recreation 83% 48%Groceries and Gas Stations 397% 61%Professional Buildings 44% 14%Public and Semi-Public Buildings 79% 71%
Multi-Family Buildings 27% 14%Repair and Home Use 74% 102%
Retail and Personal Services 367% 93%
Warehouses and Contractor Services 256% 98%
Non-Residential
Structure Category
Residential
Table B-2 CONTENT-TO-STRUCTURE VALUE RATIOS (CSVRS) AND STANDARD
DEVIATIONS (SDS) BY STRUCTURE CATEGORY
Integrated Draft Feasibility and Environmental Impact Statement Pearl River Watershed, Hinds and Rankin Counties, MS
Appendix B: Economics 10
First Floor Elevations - The topographical data used to estimate the first floor elevations assigned 1 to the structure inventory was mobile LiDAR. A mean of zero and a standard deviation of 0.6 feet 2 were used to estimate the uncertainty surrounding the first floor elevation of each of the inventoried 3 structures 4 5 Depth-Damage Relationships - A triangular probability density function was used to determine 6 the uncertainty surrounding the damage percentage associated with each depth of flooding. A 7 minimum, maximum and most likely damage estimate was provided by a panel of experts for each 8 depth of flooding. The specific range of values regarding probability distributions for the depth-9 damage curves can be found in the final report dated July 1997 entitled Depth-Damage 10 Relationships for Structures, Contents, and Vehicles and Content-to-Structure Value Ratios 11 (CSVRs)in Support of the Lower Atchafalaya Reevaluation and Morganza to the Gulf Feasibility 12 Studies. 13 14
ENGINEERING INPUTS TO THE HEC-FDA MODEL 15
First Floor Elevations - Topographical data obtained from the LiDAR point cloud with 16 NAVD88 elevations were the basis for first floor elevations (FFE). LiDAR technicians performed 17 FFE extraction within a MicroStation environment using custom developed tools to accurately 18 extract the FFE based upon a set of criteria. These criteria were developed to assign a quality to 19 the FFE extraction (Best, Good, Fair, Poor) depending upon the identification of a clear and precise 20 point of entry on a structure. During extraction, notes were added to delineate the location used to 21 extract the FFE: front door threshold, alternative entry door, indication on structure exterior, or 22 other remark. 23 24 Stage-Probability Relationships - Stage-probability relationships were provided for the existing 25 without-project and with-project conditions. Water surface profiles include the eight annual 26 chance exceedance (ACE) events: 50% (2-year), 20% (5-year), 10% (10-year), 4% (25-year), 2% 27 (50-year), 1% (100-year), 0.5% (200-year), and 0.2% (500-year). The without-project water 28 surface profiles were based on the peak discharges utilized within the FEMA Flood Insurance 29 Study Effective Hydraulic Model, and subsequently calibrated to the United States Army Corps of 30 Engineers 2007 Feasibility Study. More detailed information about the water surface elevation 31 calibration can be found in Section 3.4 of Appendix C: Engineering, Hydrologic and Hydraulic 32 Analysis. The with-project water surface profiles were based on the same hydrologic conditions, 33 with hydraulic parameters modified to model each project condition studied. 34 35 Uncertainty Surrounding the Engineering Inputs - The uncertainty surrounding two key 36 engineering parameters was quantified and entered into the HEC-FDA model. These engineering 37 variables included ground elevations and the stage-probability curves. The HEC-FDA model used 38 the uncertainty surrounding these variables to estimate the uncertainty surrounding the elevation 39 of the storm surges for each study area reach. 40 41 Ground Elevations - A combination of the uncertainty surrounding the ground elevations and the 42 foundation height (0.6 feet) of a residential and non-residential structure was used. 43 44
Integrated Draft Feasibility and Environmental Impact Statement Pearl River Watershed, Hinds and Rankin Counties, MS
Appendix B: Economics 11
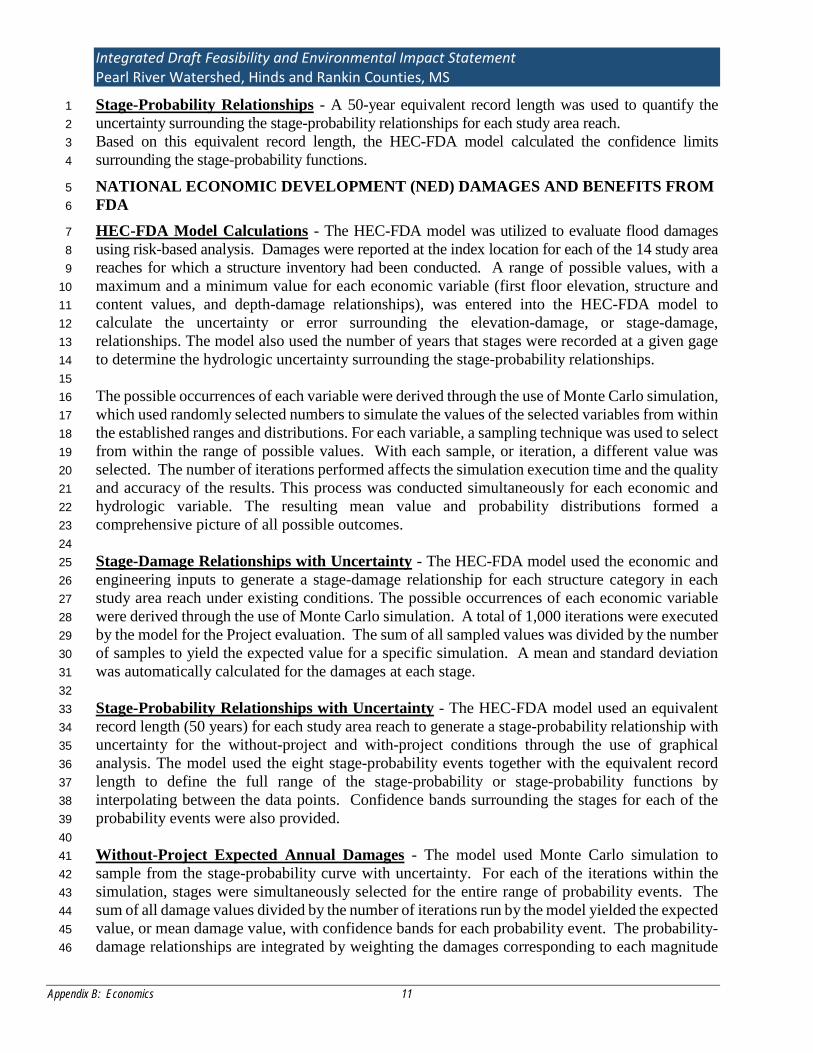
Stage-Probability Relationships - A 50-year equivalent record length was used to quantify the 1 uncertainty surrounding the stage-probability relationships for each study area reach. 2 Based on this equivalent record length, the HEC-FDA model calculated the confidence limits 3 surrounding the stage-probability functions. 4
NATIONAL ECONOMIC DEVELOPMENT (NED) DAMAGES AND BENEFITS FROM 5 FDA 6
HEC-FDA Model Calculations - The HEC-FDA model was utilized to evaluate flood damages 7 using risk-based analysis. Damages were reported at the index location for each of the 14 study area 8 reaches for which a structure inventory had been conducted. A range of possible values, with a 9 maximum and a minimum value for each economic variable (first floor elevation, structure and 10 content values, and depth-damage relationships), was entered into the HEC-FDA model to 11 calculate the uncertainty or error surrounding the elevation-damage, or stage-damage, 12 relationships. The model also used the number of years that stages were recorded at a given gage 13 to determine the hydrologic uncertainty surrounding the stage-probability relationships. 14 15 The possible occurrences of each variable were derived through the use of Monte Carlo simulation, 16 which used randomly selected numbers to simulate the values of the selected variables from within 17 the established ranges and distributions. For each variable, a sampling technique was used to select 18 from within the range of possible values. With each sample, or iteration, a different value was 19 selected. The number of iterations performed affects the simulation execution time and the quality 20 and accuracy of the results. This process was conducted simultaneously for each economic and 21 hydrologic variable. The resulting mean value and probability distributions formed a 22 comprehensive picture of all possible outcomes. 23 24 Stage-Damage Relationships with Uncertainty - The HEC-FDA model used the economic and 25 engineering inputs to generate a stage-damage relationship for each structure category in each 26 study area reach under existing conditions. The possible occurrences of each economic variable 27 were derived through the use of Monte Carlo simulation. A total of 1,000 iterations were executed 28 by the model for the Project evaluation. The sum of all sampled values was divided by the number 29 of samples to yield the expected value for a specific simulation. A mean and standard deviation 30 was automatically calculated for the damages at each stage. 31 32 Stage-Probability Relationships with Uncertainty - The HEC-FDA model used an equivalent 33 record length (50 years) for each study area reach to generate a stage-probability relationship with 34 uncertainty for the without-project and with-project conditions through the use of graphical 35 analysis. The model used the eight stage-probability events together with the equivalent record 36 length to define the full range of the stage-probability or stage-probability functions by 37 interpolating between the data points. Confidence bands surrounding the stages for each of the 38 probability events were also provided. 39 40 Without-Project Expected Annual Damages - The model used Monte Carlo simulation to 41 sample from the stage-probability curve with uncertainty. For each of the iterations within the 42 simulation, stages were simultaneously selected for the entire range of probability events. The 43 sum of all damage values divided by the number of iterations run by the model yielded the expected 44 value, or mean damage value, with confidence bands for each probability event. The probability-45 damage relationships are integrated by weighting the damages corresponding to each magnitude 46
Integrated Draft Feasibility and Environmental Impact Statement Pearl River Watershed, Hinds and Rankin Counties, MS
Appendix B: Economics 12
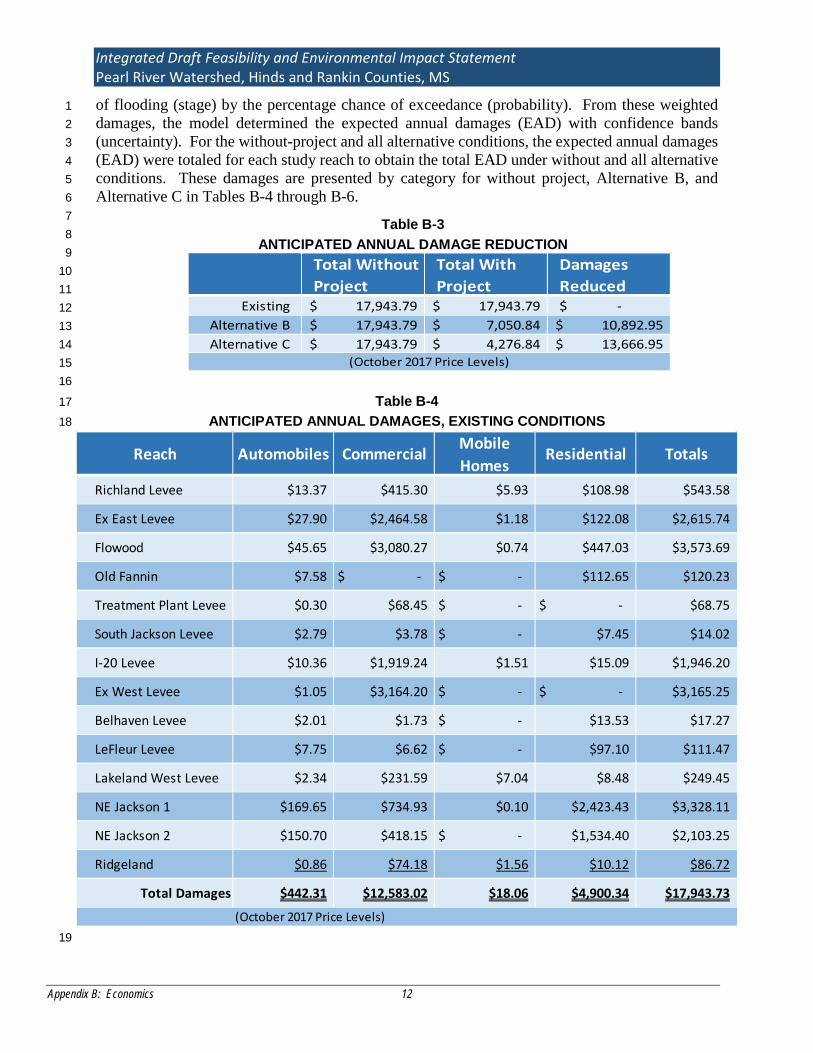
of flooding (stage) by the percentage chance of exceedance (probability). From these weighted 1 damages, the model determined the expected annual damages (EAD) with confidence bands 2 (uncertainty). For the without-project and all alternative conditions, the expected annual damages 3 (EAD) were totaled for each study reach to obtain the total EAD under without and all alternative 4 conditions. These damages are presented by category for without project, Alternative B, and 5 Alternative C in Tables B-4 through B-6. 6 7 8 9 10 11 12 13 14 15 16
Table B-4 17 ANTICIPATED ANNUAL DAMAGES, EXISTING CONDITIONS 18
19
Total Without Project
Total With Project
Damages Reduced
Existing 17,943.79$ 17,943.79$ $ - Alternative B 17,943.79$ 7,050.84$ 10,892.95$ Alternative C 17,943.79$ 4,276.84$ 13,666.95$
(October 2017 Price Levels)
Reach Automobiles Commercial Mobile Homes
Residential Totals
Richland Levee $13.37 $415.30 $5.93 $108.98 $543.58
Ex East Levee $27.90 $2,464.58 $1.18 $122.08 $2,615.74
Flowood $45.65 $3,080.27 $0.74 $447.03 $3,573.69
Old Fannin $7.58 $ - $ - $112.65 $120.23
Treatment Plant Levee $0.30 $68.45 $ - $ - $68.75
South Jackson Levee $2.79 $3.78 $ - $7.45 $14.02
I-20 Levee $10.36 $1,919.24 $1.51 $15.09 $1,946.20
Ex West Levee $1.05 $3,164.20 $ - $ - $3,165.25
Belhaven Levee $2.01 $1.73 $ - $13.53 $17.27
LeFleur Levee $7.75 $6.62 $ - $97.10 $111.47
Lakeland West Levee $2.34 $231.59 $7.04 $8.48 $249.45
NE Jackson 1 $169.65 $734.93 $0.10 $2,423.43 $3,328.11
NE Jackson 2 $150.70 $418.15 $ - $1,534.40 $2,103.25
Ridgeland $0.86 $74.18 $1.56 $10.12 $86.72
Total Damages $442.31 $12,583.02 $18.06 $4,900.34 $17,943.73
(October 2017 Price Levels)
Table B-3 ANTICIPATED ANNUAL DAMAGE REDUCTION
Integrated Draft Feasibility and Environmental Impact Statement Pearl River Watershed, Hinds and Rankin Counties, MS
Appendix B: Economics 13
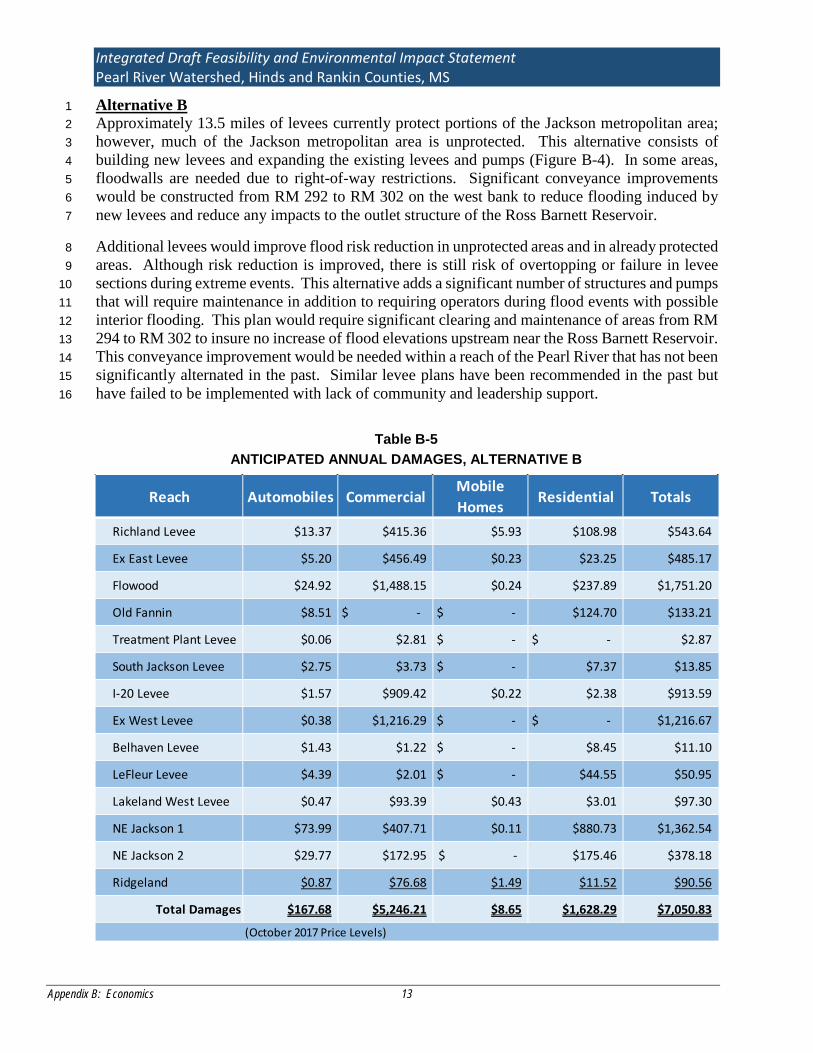
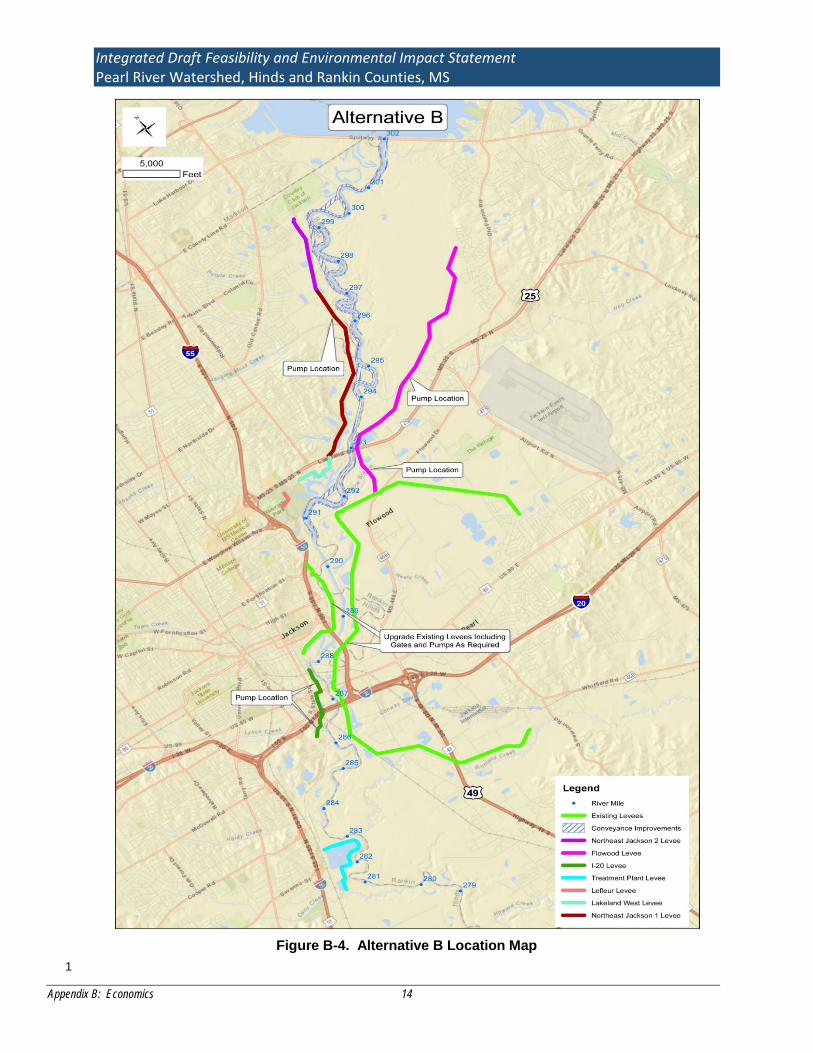
Alternative B 1 Approximately 13.5 miles of levees currently protect portions of the Jackson metropolitan area; 2 however, much of the Jackson metropolitan area is unprotected. This alternative consists of 3 building new levees and expanding the existing levees and pumps (Figure B-4). In some areas, 4 floodwalls are needed due to right-of-way restrictions. Significant conveyance improvements 5 would be constructed from RM 292 to RM 302 on the west bank to reduce flooding induced by 6 new levees and reduce any impacts to the outlet structure of the Ross Barnett Reservoir. 7
Additional levees would improve flood risk reduction in unprotected areas and in already protected 8 areas. Although risk reduction is improved, there is still risk of overtopping or failure in levee 9 sections during extreme events. This alternative adds a significant number of structures and pumps 10 that will require maintenance in addition to requiring operators during flood events with possible 11 interior flooding. This plan would require significant clearing and maintenance of areas from RM 12 294 to RM 302 to insure no increase of flood elevations upstream near the Ross Barnett Reservoir. 13 This conveyance improvement would be needed within a reach of the Pearl River that has not been 14 significantly alternated in the past. Similar levee plans have been recommended in the past but 15 have failed to be implemented with lack of community and leadership support. 16
Reach Automobiles CommercialMobile Homes Residential Totals
Richland Levee $13.37 $415.36 $5.93 $108.98 $543.64
Ex East Levee $5.20 $456.49 $0.23 $23.25 $485.17
Flowood $24.92 $1,488.15 $0.24 $237.89 $1,751.20
Old Fannin $8.51 $ - $ - $124.70 $133.21
Treatment Plant Levee $0.06 $2.81 $ - $ - $2.87
South Jackson Levee $2.75 $3.73 $ - $7.37 $13.85
I-20 Levee $1.57 $909.42 $0.22 $2.38 $913.59
Ex West Levee $0.38 $1,216.29 $ - $ - $1,216.67
Belhaven Levee $1.43 $1.22 $ - $8.45 $11.10
LeFleur Levee $4.39 $2.01 $ - $44.55 $50.95
Lakeland West Levee $0.47 $93.39 $0.43 $3.01 $97.30
NE Jackson 1 $73.99 $407.71 $0.11 $880.73 $1,362.54
NE Jackson 2 $29.77 $172.95 $ - $175.46 $378.18
Ridgeland $0.87 $76.68 $1.49 $11.52 $90.56
Total Damages $167.68 $5,246.21 $8.65 $1,628.29 $7,050.83
(October 2017 Price Levels)
Table B-5 ANTICIPATED ANNUAL DAMAGES, ALTERNATIVE B
Integrated Draft Feasibility and Environmental Impact Statement Pearl River Watershed, Hinds and Rankin Counties, MS
Appendix B: Economics 14
1 Figure B-4. Alternative B Location Map
Integrated Draft Feasibility and Environmental Impact Statement Pearl River Watershed, Hinds and Rankin Counties, MS
Appendix B: Economics 15
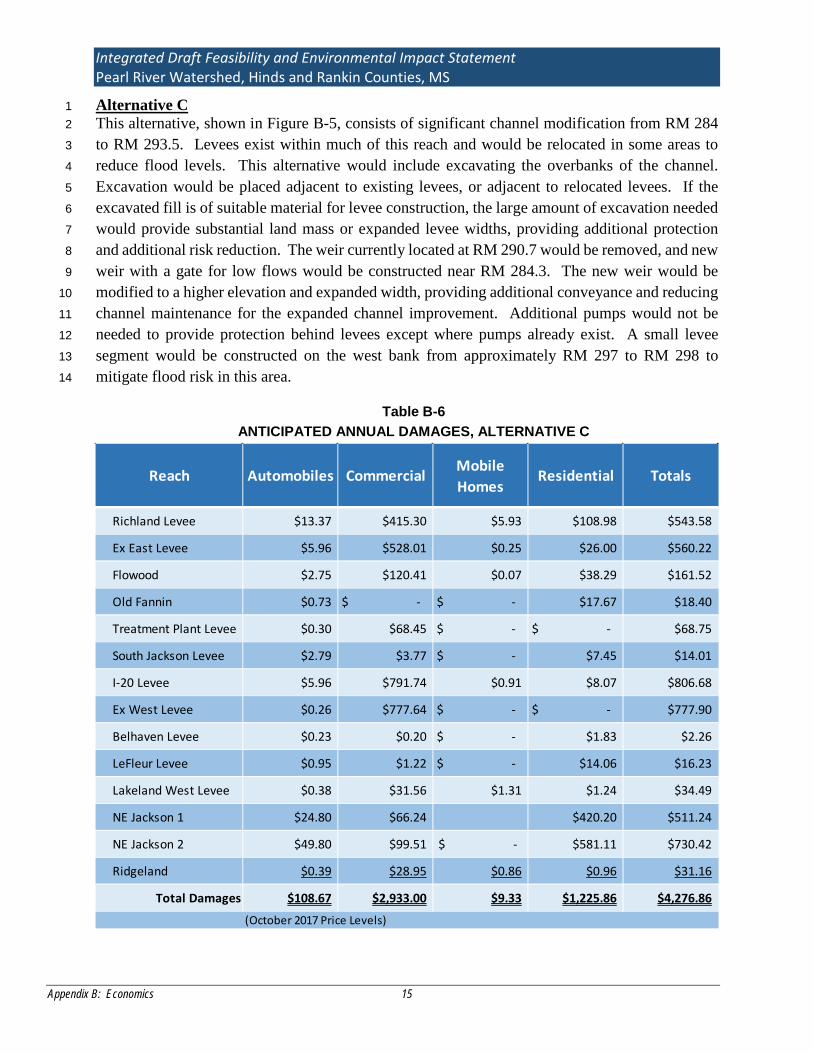
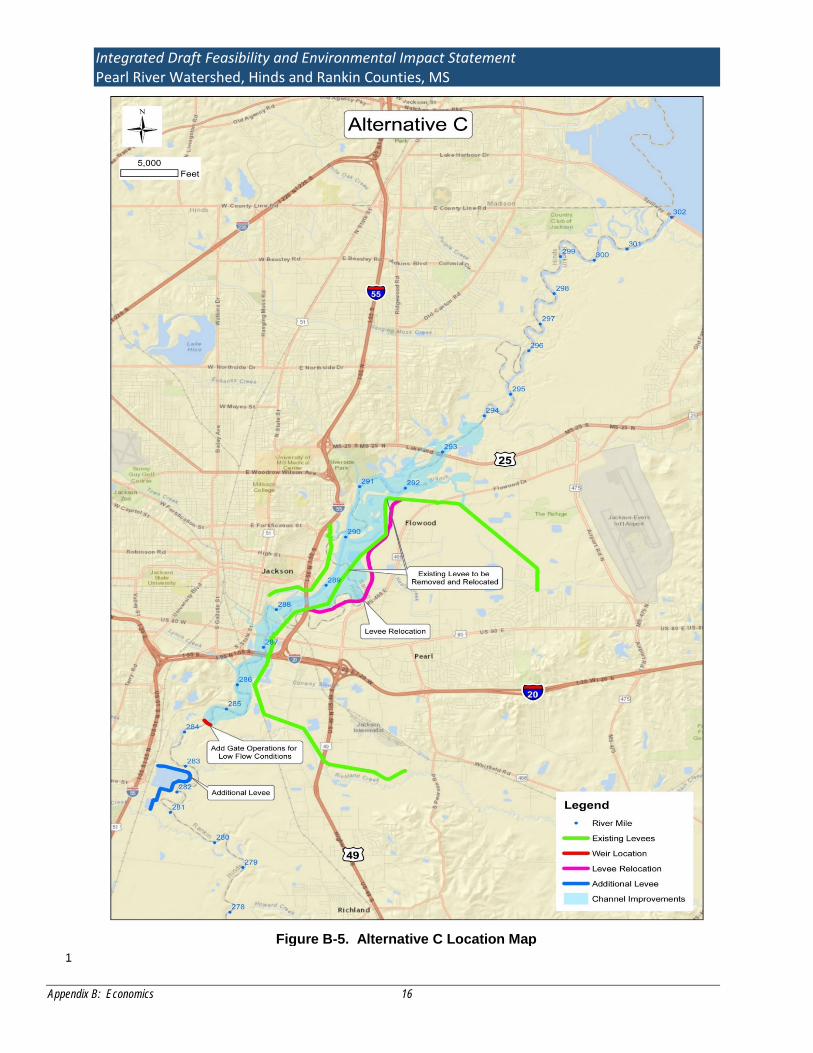
Alternative C 1 This alternative, shown in Figure B-5, consists of significant channel modification from RM 284 2 to RM 293.5. Levees exist within much of this reach and would be relocated in some areas to 3 reduce flood levels. This alternative would include excavating the overbanks of the channel. 4 Excavation would be placed adjacent to existing levees, or adjacent to relocated levees. If the 5 excavated fill is of suitable material for levee construction, the large amount of excavation needed 6 would provide substantial land mass or expanded levee widths, providing additional protection 7 and additional risk reduction. The weir currently located at RM 290.7 would be removed, and new 8 weir with a gate for low flows would be constructed near RM 284.3. The new weir would be 9 modified to a higher elevation and expanded width, providing additional conveyance and reducing 10 channel maintenance for the expanded channel improvement. Additional pumps would not be 11 needed to provide protection behind levees except where pumps already exist. A small levee 12 segment would be constructed on the west bank from approximately RM 297 to RM 298 to 13 mitigate flood risk in this area. 14
Reach Automobiles Commercial Mobile Homes
Residential Totals
Richland Levee $13.37 $415.30 $5.93 $108.98 $543.58
Ex East Levee $5.96 $528.01 $0.25 $26.00 $560.22
Flowood $2.75 $120.41 $0.07 $38.29 $161.52
Old Fannin $0.73 $ - $ - $17.67 $18.40
Treatment Plant Levee $0.30 $68.45 $ - $ - $68.75
South Jackson Levee $2.79 $3.77 $ - $7.45 $14.01
I-20 Levee $5.96 $791.74 $0.91 $8.07 $806.68
Ex West Levee $0.26 $777.64 $ - $ - $777.90
Belhaven Levee $0.23 $0.20 $ - $1.83 $2.26
LeFleur Levee $0.95 $1.22 $ - $14.06 $16.23
Lakeland West Levee $0.38 $31.56 $1.31 $1.24 $34.49
NE Jackson 1 $24.80 $66.24 $420.20 $511.24
NE Jackson 2 $49.80 $99.51 $ - $581.11 $730.42
Ridgeland $0.39 $28.95 $0.86 $0.96 $31.16
Total Damages $108.67 $2,933.00 $9.33 $1,225.86 $4,276.86
(October 2017 Price Levels)
Table B-6 ANTICIPATED ANNUAL DAMAGES, ALTERNATIVE C
Integrated Draft Feasibility and Environmental Impact Statement Pearl River Watershed, Hinds and Rankin Counties, MS
Appendix B: Economics 16
1 Figure B-5. Alternative C Location Map
Integrated Draft Feasibility and Environmental Impact Statement Pearl River Watershed, Hinds and Rankin Counties, MS
Appendix B: Economics 17
EMERGENCY AND OTHER POST-FLOOD COST CATEGORIES 1
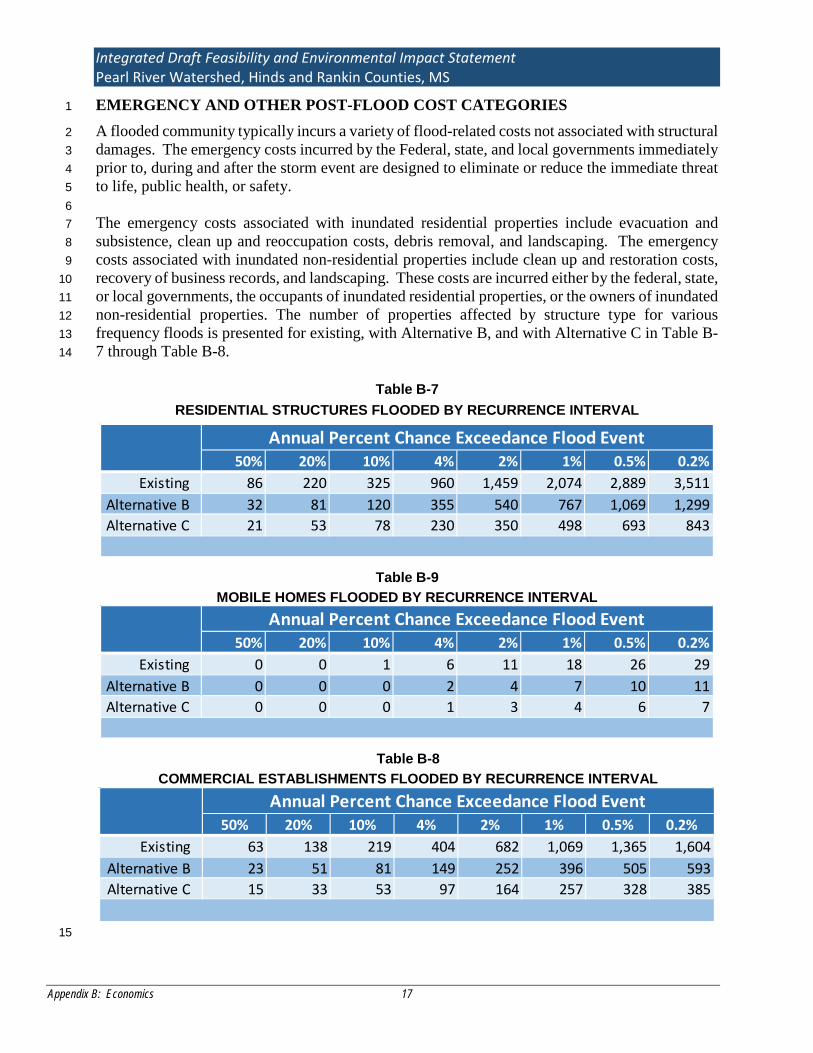
A flooded community typically incurs a variety of flood-related costs not associated with structural 2 damages. The emergency costs incurred by the Federal, state, and local governments immediately 3 prior to, during and after the storm event are designed to eliminate or reduce the immediate threat 4 to life, public health, or safety. 5 6 The emergency costs associated with inundated residential properties include evacuation and 7 subsistence, clean up and reoccupation costs, debris removal, and landscaping. The emergency 8 costs associated with inundated non-residential properties include clean up and restoration costs, 9 recovery of business records, and landscaping. These costs are incurred either by the federal, state, 10 or local governments, the occupants of inundated residential properties, or the owners of inundated 11 non-residential properties. The number of properties affected by structure type for various 12 frequency floods is presented for existing, with Alternative B, and with Alternative C in Table B-13 7 through Table B-8. 14
15
50% 20% 10% 4% 2% 1% 0.5% 0.2%Existing 86 220 325 960 1,459 2,074 2,889 3,511
Alternative B 32 81 120 355 540 767 1,069 1,299Alternative C 21 53 78 230 350 498 693 843
Annual Percent Chance Exceedance Flood Event
Table B-7 RESIDENTIAL STRUCTURES FLOODED BY RECURRENCE INTERVAL
50% 20% 10% 4% 2% 1% 0.5% 0.2%Existing 0 0 1 6 11 18 26 29
Alternative B 0 0 0 2 4 7 10 11Alternative C 0 0 0 1 3 4 6 7
Annual Percent Chance Exceedance Flood Event
Table B-9 MOBILE HOMES FLOODED BY RECURRENCE INTERVAL
50% 20% 10% 4% 2% 1% 0.5% 0.2%Existing 63 138 219 404 682 1,069 1,365 1,604
Alternative B 23 51 81 149 252 396 505 593Alternative C 15 33 53 97 164 257 328 385
Annual Percent Chance Exceedance Flood Event
Table B-8 COMMERCIAL ESTABLISHMENTS FLOODED BY RECURRENCE INTERVAL
Integrated Draft Feasibility and Environmental Impact Statement Pearl River Watershed, Hinds and Rankin Counties, MS
Appendix B: Economics 18
Reduction of State and Local Government Emergency Costs - The emergency costs incurred 1 by state and local governments include the increased police and fire personnel costs; costs of 2 emergency measures such as evacuation of hospitals; flood fighting costs such as pumps, sandbags, 3 and other levee enhancement measures and flood fight personnel; and restoration of private, 4 commercial, and public properties. The benefits from reduction of government emergency costs 5 are $63,241 for the Levee Alternative and $76,291 for the Alternative C. This is a result of flood 6 fighting, evacuations, pumping, and emergency personnel cost being greatly reduced due to the 7 reduction in flood risk. 8 9 Evacuation and Reoccupation Costs - Evacuation is one of the best ways to avoid human losses 10 during an emergency event. Evacuation and its associated costs can take place before, during, or 11 after a flood event and include transportation out of the floodplain. Even though evacuation costs 12 are typically incurred in a flood event, the cost is usually relatively small compared to 13 infrastructure damages and other emergency costs (Whitehead, 2005). Residents affected by a 14 large flood either self-evacuate or are assisted in evacuation by one or more of a number of public 15 agencies. 16 17 Reoccupation is when members of an affected population returns to their residences, and includes 18 travel to settle insurance claims and repair residences (e.g., use of rental trucks and other vehicles). 19 Inhabitants displaced during a large flood event are expected to repopulate the area they left. 20 Dislocated civilians may make multiple visits to their properties for home repair and insurance 21 issues before they resettle. Evacuated populations would use their own means to transport their 22 belongings from storage facilities and temporary housing. 23 24 A study conducted by MWH Americas in 2012 for the New Orleans District developed emergency 25 cost information for freshwater and saltwater flooding for selected parishes in south Louisiana. 26 Since the construction type, humidity, etc. in the Jackson area are similar to those in the New 27 Orleans study area referenced above, and floods of four (4) or more feet lasting four (4) or more 28 days are extremely damaging, the data was considered valid as a basis for estimates of the 29 evacuation and reoccupation costs and the other emergency costs described in the following 30 paragraphs. Adjustments made in some calculations are described. The estimate for evacuation 31 and reoccupation of $5,489 per residential structure was used in this analysis. The evacuation and 32 reoccupation benefits are $610,448 for the Alternative B and $734,869 for the Alternative C (Table 33 B-10). 34 35 Subsistence Costs - Data developed by the New Orleans District, U.S. Army Corps of Engineers 36 based on the experiences of residents affected by previous flood events were used to estimate the 37 evacuation and subsistence costs incurred by property owners and the Federal government 38 immediately following a storm event. Residents of structures inundated between one and three 39 feet above first floor elevation were evacuated from their homes for approximately three months 40 following the flood event. A 3-5 month time frame is consistent with the experience of many 41 Study Area residents during the 1979 and 1983 flood events. 42 43 However, since no data is available on housing arrangements for these evacuated residents, a 45-44 day timeframe was used in the following analysis. It is assumed that during this period, the 45 residents of evacuated households lived in hotels in the Jackson area. Based on the fiscal year 46
Integrated Draft Feasibility and Environmental Impact Statement Pearl River Watershed, Hinds and Rankin Counties, MS
Appendix B: Economics 19
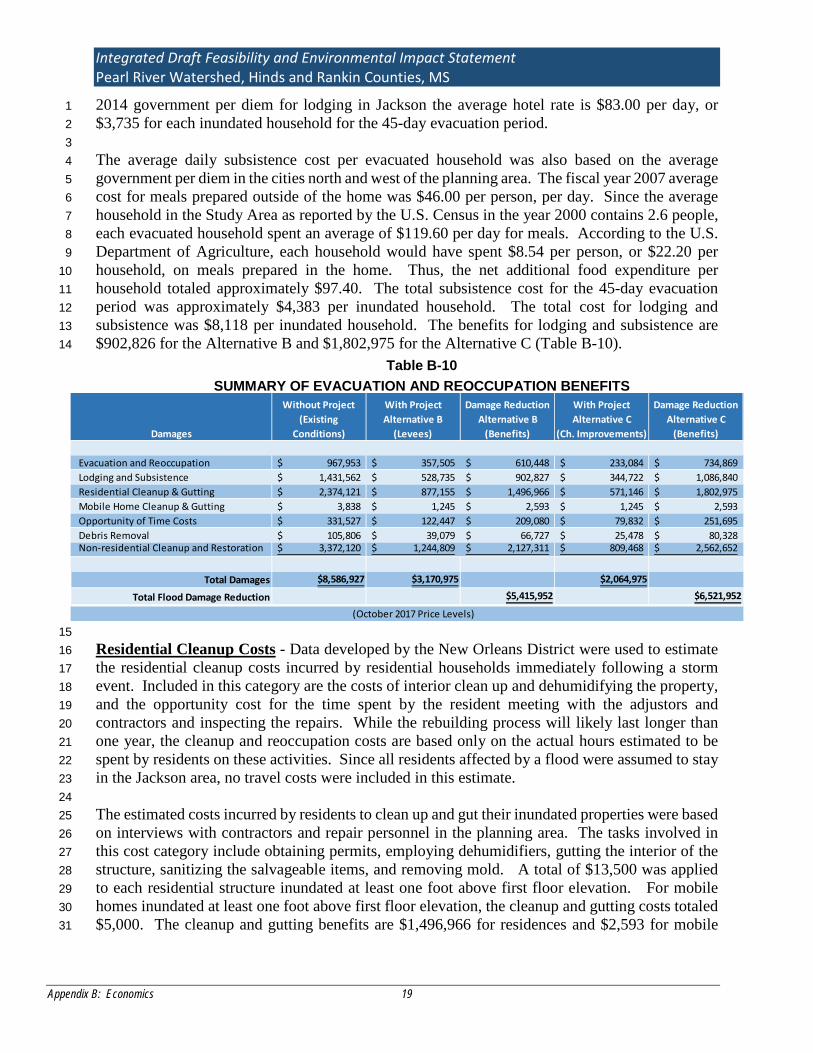
2014 government per diem for lodging in Jackson the average hotel rate is $83.00 per day, or 1 $3,735 for each inundated household for the 45-day evacuation period. 2 3 The average daily subsistence cost per evacuated household was also based on the average 4 government per diem in the cities north and west of the planning area. The fiscal year 2007 average 5 cost for meals prepared outside of the home was $46.00 per person, per day. Since the average 6 household in the Study Area as reported by the U.S. Census in the year 2000 contains 2.6 people, 7 each evacuated household spent an average of $119.60 per day for meals. According to the U.S. 8 Department of Agriculture, each household would have spent $8.54 per person, or $22.20 per 9 household, on meals prepared in the home. Thus, the net additional food expenditure per 10 household totaled approximately $97.40. The total subsistence cost for the 45-day evacuation 11 period was approximately $4,383 per inundated household. The total cost for lodging and 12 subsistence was $8,118 per inundated household. The benefits for lodging and subsistence are 13 $902,826 for the Alternative B and $1,802,975 for the Alternative C (Table B-10). 14
15 Residential Cleanup Costs - Data developed by the New Orleans District were used to estimate 16 the residential cleanup costs incurred by residential households immediately following a storm 17 event. Included in this category are the costs of interior clean up and dehumidifying the property, 18 and the opportunity cost for the time spent by the resident meeting with the adjustors and 19 contractors and inspecting the repairs. While the rebuilding process will likely last longer than 20 one year, the cleanup and reoccupation costs are based only on the actual hours estimated to be 21 spent by residents on these activities. Since all residents affected by a flood were assumed to stay 22 in the Jackson area, no travel costs were included in this estimate. 23 24 The estimated costs incurred by residents to clean up and gut their inundated properties were based 25 on interviews with contractors and repair personnel in the planning area. The tasks involved in 26 this cost category include obtaining permits, employing dehumidifiers, gutting the interior of the 27 structure, sanitizing the salvageable items, and removing mold. A total of $13,500 was applied 28 to each residential structure inundated at least one foot above first floor elevation. For mobile 29 homes inundated at least one foot above first floor elevation, the cleanup and gutting costs totaled 30 $5,000. The cleanup and gutting benefits are $1,496,966 for residences and $2,593 for mobile 31
Table B-10 SUMMARY OF EVACUATION AND REOCCUPATION BENEFITS
Damages
Without Project (Existing
Conditions)
With Project Alternative B
(Levees)
Damage Reduction Alternative B
(Benefits)
With Project Alternative C
(Ch. Improvements)
Damage Reduction Alternative C
(Benefits)
Evacuation and Reoccupation 967,953$ 357,505$ 610,448$ 233,084$ 734,869$ Lodging and Subsistence 1,431,562$ 528,735$ 902,827$ 344,722$ 1,086,840$ Residential Cleanup & Gutting 2,374,121$ 877,155$ 1,496,966$ 571,146$ 1,802,975$ Mobile Home Cleanup & Gutting 3,838$ 1,245$ 2,593$ 1,245$ 2,593$ Opportunity of Time Costs 331,527$ 122,447$ 209,080$ 79,832$ 251,695$ Debris Removal 105,806$ 39,079$ 66,727$ 25,478$ 80,328$ Non-residential Cleanup and Restoration 3,372,120$ 1,244,809$ 2,127,311$ 809,468$ 2,562,652$
Total Damages $8,586,927 $3,170,975 $2,064,975
Total Flood Damage Reduction $5,415,952 $6,521,952
(October 2017 Price Levels)
Integrated Draft Feasibility and Environmental Impact Statement Pearl River Watershed, Hinds and Rankin Counties, MS
Appendix B: Economics 20
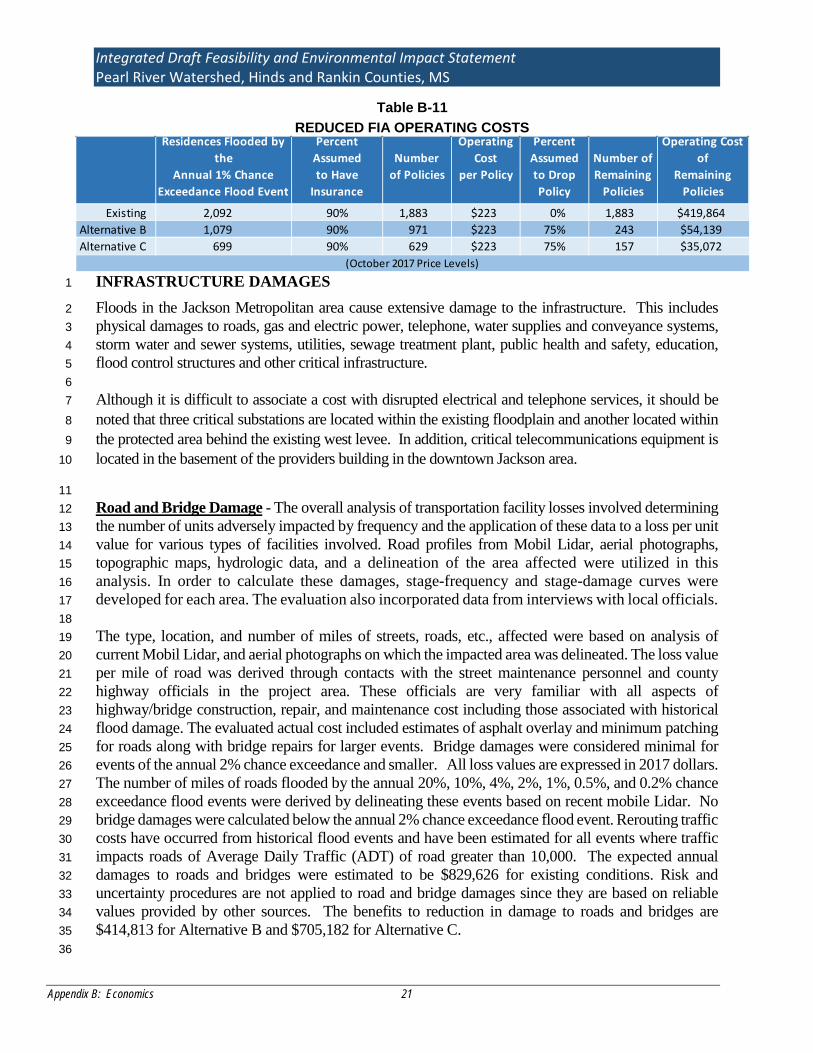
homes for the Alternative B and $1,802,975 for residences and $2,593 for mobile homes for the 1 Alternative C (Table B-10). 2 3 During their period of evacuation, homeowners will devote many hours applying for governmental 4 assistance, filing insurance claims, scheduling appointments, meeting with insurance adjustors and 5 contractors, and supervising repair work. The opportunity cost associated with the time spent 6 completing these tasks can be measured by the average hourly wage for residents in the Study 7 Area. Based on the New Orleans District data, residents of inundated structures spent an average 8 of 100 hours completing these tasks. The average nonagricultural wage rate in the Study Area was 9 estimated to be $18.80 per hour. Thus, the total opportunity cost for each resident whose property 10 was inundated was determined to be $1,880. The benefits for opportunity of time cost reduction 11 are $209,080 for the Alternative B and $251,695 for the Alternative C (Table B-10). 12 13 Debris Removal - The costs associated with the removal of debris from the curbside in front of 14 inundated structures and the transporting of this debris to waste disposal sites were also based on 15 data from the New Orleans District. It was estimated that each inundated residential structure 16 created approximately 30 cubic yards of debris. The cost to remove this debris ranged from $15 17 to $25 per cubic yard with an average of $20 per cubic yard. Thus, the average cost of debris 18 removal was $600 per inundated residential structure. This amount was applied to all residential 19 structures that incurred flooding. Debris removal benefits are $66,728 for the Alternative B and 20 $80,328 for the Alternative C (Table B-10). 21 22 Non-Residential Clean Up and Restoration Costs - Based on the information developed by 23 MWH for the New Orleans District in the report referenced in evacuation and reoccupation costs, 24 the cleanup and restoration costs for non-residential costs were $34,818 per structure. Clean up 25 and restoration costs include the cost of labor and materials to clean the interior and exterior of the 26 building and to remove and dispose of debris. Based on the characteristics and depth of flooding 27 occurring on non-residential property in the Study Area, this amount was considered to be 28 reasonable. The non-residential cleanup and restoration benefits are $2,127,311 for the Alternative 29 B and $2,562,652 for the Alternative C (Table B-10). 30 31 FIA Operating Cost - When a flood damage reduction project removes residential structures from 32 the annual 1% chance exceedance flood event floodplain, the owners are no longer required, by 33 law, to have flood insurance. Since there is still some risk of flooding some owners may determine 34 that it is in their best interest to maintain the insurance. For the purpose of this study, it was 35 assumed that 90 percent of residences within the annual 1% chance exceedance flood event 36 floodplain currently have flood insurance and that 75 percent of the residential structures that are 37 no longer in the annual 1% chance exceedance flood event floodplain under with project conditions 38 will no longer maintain flood insurance. This reduction in the number of policies will reduce the 39 cost of operating the flood insurance program. Since the Corps of Engineers has not published 40 FIA Operating Costs since FY 2006, the costs for that year of $192 per policy was used to calculate 41 this benefit category, When the 2006 value is updated to 2013 price levels using the CPI, the cost 42 per operating cost per policy is $223. The benefits from reduced FIA operating costs are presented 43 in Table B-11. 44 45 46
Integrated Draft Feasibility and Environmental Impact Statement Pearl River Watershed, Hinds and Rankin Counties, MS
Appendix B: Economics 21
INFRASTRUCTURE DAMAGES 1
Floods in the Jackson Metropolitan area cause extensive damage to the infrastructure. This includes 2 physical damages to roads, gas and electric power, telephone, water supplies and conveyance systems, 3 storm water and sewer systems, utilities, sewage treatment plant, public health and safety, education, 4 flood control structures and other critical infrastructure. 5 6 Although it is difficult to associate a cost with disrupted electrical and telephone services, it should be 7 noted that three critical substations are located within the existing floodplain and another located within 8 the protected area behind the existing west levee. In addition, critical telecommunications equipment is 9 located in the basement of the providers building in the downtown Jackson area. 10
11 Road and Bridge Damage - The overall analysis of transportation facility losses involved determining 12 the number of units adversely impacted by frequency and the application of these data to a loss per unit 13 value for various types of facilities involved. Road profiles from Mobil Lidar, aerial photographs, 14 topographic maps, hydrologic data, and a delineation of the area affected were utilized in this 15 analysis. In order to calculate these damages, stage-frequency and stage-damage curves were 16 developed for each area. The evaluation also incorporated data from interviews with local officials. 17 18 The type, location, and number of miles of streets, roads, etc., affected were based on analysis of 19 current Mobil Lidar, and aerial photographs on which the impacted area was delineated. The loss value 20 per mile of road was derived through contacts with the street maintenance personnel and county 21 highway officials in the project area. These officials are very familiar with all aspects of 22 highway/bridge construction, repair, and maintenance cost including those associated with historical 23 flood damage. The evaluated actual cost included estimates of asphalt overlay and minimum patching 24 for roads along with bridge repairs for larger events. Bridge damages were considered minimal for 25 events of the annual 2% chance exceedance and smaller. All loss values are expressed in 2017 dollars. 26 The number of miles of roads flooded by the annual 20%, 10%, 4%, 2%, 1%, 0.5%, and 0.2% chance 27 exceedance flood events were derived by delineating these events based on recent mobile Lidar. No 28 bridge damages were calculated below the annual 2% chance exceedance flood event. Rerouting traffic 29 costs have occurred from historical flood events and have been estimated for all events where traffic 30 impacts roads of Average Daily Traffic (ADT) of road greater than 10,000. The expected annual 31 damages to roads and bridges were estimated to be $829,626 for existing conditions. Risk and 32 uncertainty procedures are not applied to road and bridge damages since they are based on reliable 33 values provided by other sources. The benefits to reduction in damage to roads and bridges are 34 $414,813 for Alternative B and $705,182 for Alternative C. 35 36
Table B-11 REDUCED FIA OPERATING COSTS
Residences Flooded by the
Percent Assumed Number
Operating Cost
Percent Assumed Number of
Operating Cost of
Annual 1% Chance Exceedance Flood Event
to Have Insurance
of Policies per Policy to Drop Policy
Remaining Policies
Remaining Policies
Existing 2,092 90% 1,883 $223 0% 1,883 $419,864Alternative B 1,079 90% 971 $223 75% 243 $54,139Alternative C 699 90% 629 $223 75% 157 $35,072
(October 2017 Price Levels)
Integrated Draft Feasibility and Environmental Impact Statement Pearl River Watershed, Hinds and Rankin Counties, MS
Appendix B: Economics 22
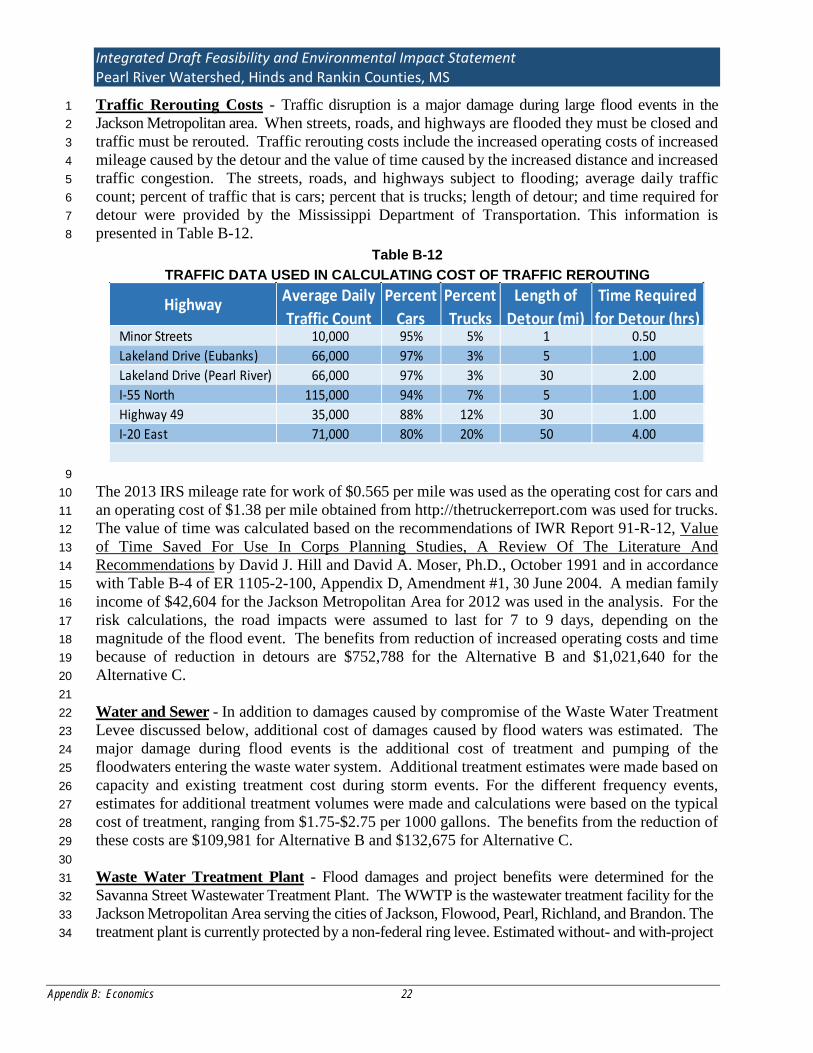
Traffic Rerouting Costs - Traffic disruption is a major damage during large flood events in the 1 Jackson Metropolitan area. When streets, roads, and highways are flooded they must be closed and 2 traffic must be rerouted. Traffic rerouting costs include the increased operating costs of increased 3 mileage caused by the detour and the value of time caused by the increased distance and increased 4 traffic congestion. The streets, roads, and highways subject to flooding; average daily traffic 5 count; percent of traffic that is cars; percent that is trucks; length of detour; and time required for 6 detour were provided by the Mississippi Department of Transportation. This information is 7 presented in Table B-12. 8
9 The 2013 IRS mileage rate for work of $0.565 per mile was used as the operating cost for cars and 10 an operating cost of $1.38 per mile obtained from http://thetruckerreport.com was used for trucks. 11 The value of time was calculated based on the recommendations of IWR Report 91-R-12, Value 12 of Time Saved For Use In Corps Planning Studies, A Review Of The Literature And 13 Recommendations by David J. Hill and David A. Moser, Ph.D., October 1991 and in accordance 14 with Table B-4 of ER 1105-2-100, Appendix D, Amendment #1, 30 June 2004. A median family 15 income of $42,604 for the Jackson Metropolitan Area for 2012 was used in the analysis. For the 16 risk calculations, the road impacts were assumed to last for 7 to 9 days, depending on the 17 magnitude of the flood event. The benefits from reduction of increased operating costs and time 18 because of reduction in detours are $752,788 for the Alternative B and $1,021,640 for the 19 Alternative C. 20 21 Water and Sewer - In addition to damages caused by compromise of the Waste Water Treatment 22 Levee discussed below, additional cost of damages caused by flood waters was estimated. The 23 major damage during flood events is the additional cost of treatment and pumping of the 24 floodwaters entering the waste water system. Additional treatment estimates were made based on 25 capacity and existing treatment cost during storm events. For the different frequency events, 26 estimates for additional treatment volumes were made and calculations were based on the typical 27 cost of treatment, ranging from $1.75-$2.75 per 1000 gallons. The benefits from the reduction of 28 these costs are $109,981 for Alternative B and $132,675 for Alternative C. 29 30 Waste Water Treatment Plant - Flood damages and project benefits were determined for the 31 Savanna Street Wastewater Treatment Plant. The WWTP is the wastewater treatment facility for the 32 Jackson Metropolitan Area serving the cities of Jackson, Flowood, Pearl, Richland, and Brandon. The 33 treatment plant is currently protected by a non-federal ring levee. Estimated without- and with-project 34
Table B-12 TRAFFIC DATA USED IN CALCULATING COST OF TRAFFIC REROUTING
Highway Average Daily Traffic Count
Percent Cars
Percent Trucks
Length of Detour (mi)
Time Required for Detour (hrs)
Minor Streets 10,000 95% 5% 1 0.50Lakeland Drive (Eubanks) 66,000 97% 3% 5 1.00Lakeland Drive (Pearl River) 66,000 97% 3% 30 2.00I-55 North 115,000 94% 7% 5 1.00Highway 49 35,000 88% 12% 30 1.00I-20 East 71,000 80% 20% 50 4.00
Integrated Draft Feasibility and Environmental Impact Statement Pearl River Watershed, Hinds and Rankin Counties, MS
Appendix B: Economics 23
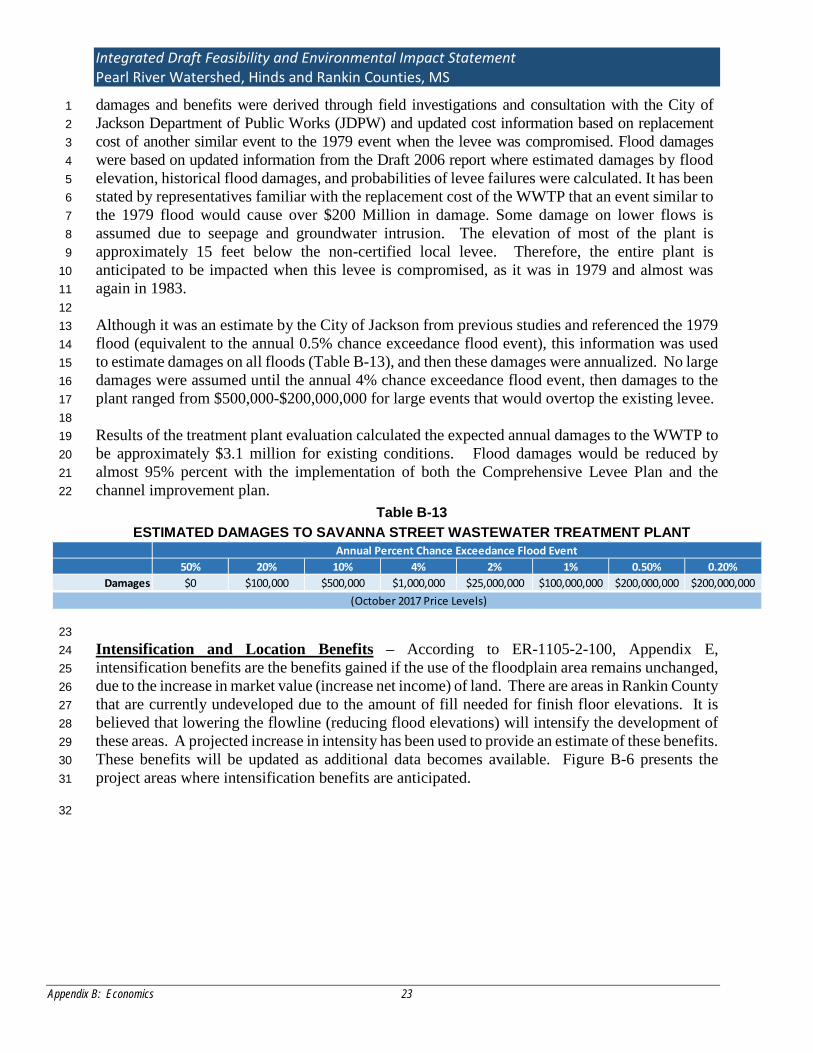
damages and benefits were derived through field investigations and consultation with the City of 1 Jackson Department of Public Works (JDPW) and updated cost information based on replacement 2 cost of another similar event to the 1979 event when the levee was compromised. Flood damages 3 were based on updated information from the Draft 2006 report where estimated damages by flood 4 elevation, historical flood damages, and probabilities of levee failures were calculated. It has been 5 stated by representatives familiar with the replacement cost of the WWTP that an event similar to 6 the 1979 flood would cause over $200 Million in damage. Some damage on lower flows is 7 assumed due to seepage and groundwater intrusion. The elevation of most of the plant is 8 approximately 15 feet below the non-certified local levee. Therefore, the entire plant is 9 anticipated to be impacted when this levee is compromised, as it was in 1979 and almost was 10 again in 1983. 11 12 Although it was an estimate by the City of Jackson from previous studies and referenced the 1979 13 flood (equivalent to the annual 0.5% chance exceedance flood event), this information was used 14 to estimate damages on all floods (Table B-13), and then these damages were annualized. No large 15 damages were assumed until the annual 4% chance exceedance flood event, then damages to the 16 plant ranged from $500,000-$200,000,000 for large events that would overtop the existing levee. 17 18 Results of the treatment plant evaluation calculated the expected annual damages to the WWTP to 19 be approximately $3.1 million for existing conditions. Flood damages would be reduced by 20 almost 95% percent with the implementation of both the Comprehensive Levee Plan and the 21 channel improvement plan. 22
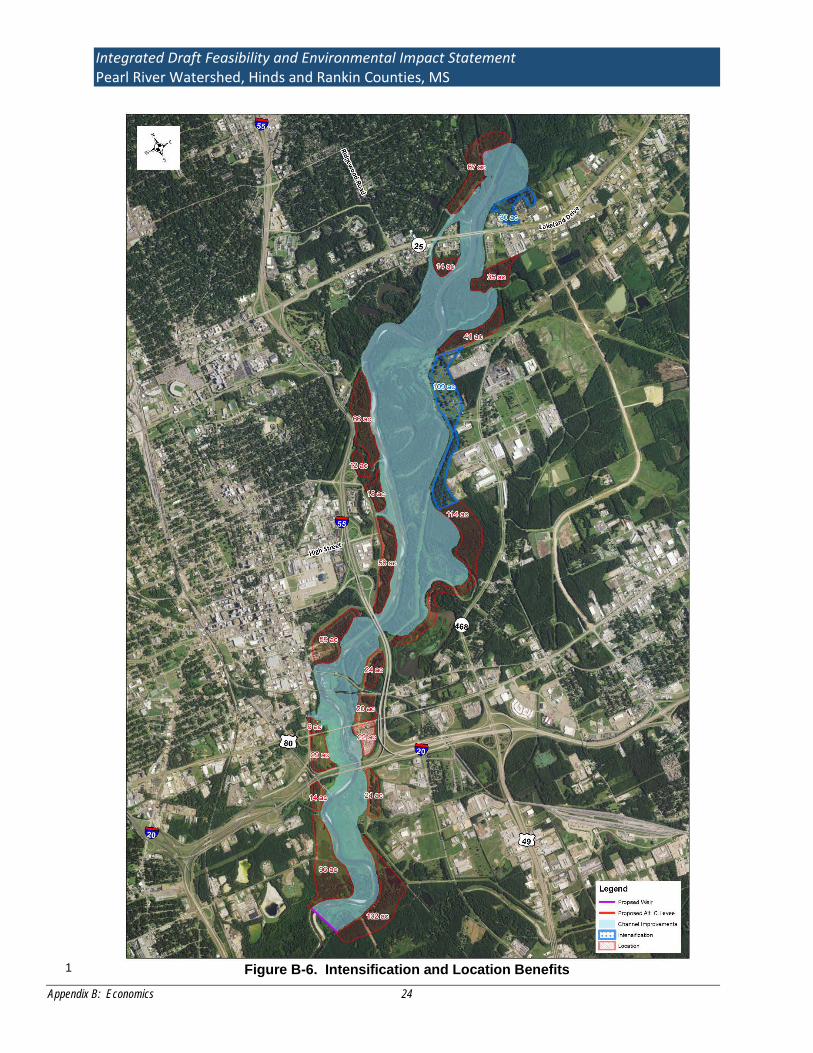
23 Intensification and Location Benefits – According to ER-1105-2-100, Appendix E, 24 intensification benefits are the benefits gained if the use of the floodplain area remains unchanged, 25 due to the increase in market value (increase net income) of land. There are areas in Rankin County 26 that are currently undeveloped due to the amount of fill needed for finish floor elevations. It is 27 believed that lowering the flowline (reducing flood elevations) will intensify the development of 28 these areas. A projected increase in intensity has been used to provide an estimate of these benefits. 29 These benefits will be updated as additional data becomes available. Figure B-6 presents the 30 project areas where intensification benefits are anticipated. 31
32
Table B-13 ESTIMATED DAMAGES TO SAVANNA STREET WASTEWATER TREATMENT PLANT
50% 20% 10% 4% 2% 1% 0.50% 0.20%
Damages $0 $100,000 $500,000 $1,000,000 $25,000,000 $100,000,000 $200,000,000 $200,000,000(October 2017 Price Levels)
Annual Percent Chance Exceedance Flood Event
Integrated Draft Feasibility and Environmental Impact Statement Pearl River Watershed, Hinds and Rankin Counties, MS
Appendix B: Economics 24
1 Figure B-6. Intensification and Location Benefits
Integrated Draft Feasibility and Environmental Impact Statement Pearl River Watershed, Hinds and Rankin Counties, MS
Appendix B: Economics 25
According to ER-1105-2-100, Appendix E, location benefits are benefits from land use that would 1 be different with and without the floodplain and certain adjacent land. Location benefits are 2 associated with a change in land use or activity added to the floodplain area because of the flood 3 reduction plan. In the case of the Alternative C, the land use changes are due to changing of the 4 floodplain limits and the new land being formed. Although the NED plan was formulated to 5 protect existing development, location benefits would accrue because land use changes would 6 cause an increase in the aggregate net income (economic rent). However, Alternative B does not 7 gain significant benefit from land use value changes since the low areas behind the levees would 8 be utilized as sump area for pumping plants. Additionally, no new large land areas would be 9 produced with the Alternative B. Although a final land use plan is not available at this time, 10 estimates based on planning and land use judgments have been made to assist to obtain a range of 11 these benefits. From discussions with local officials, it is believed lands that will be available next 12 to the expanded river will provide for multi-use developments along with parks and other 13 recreational features developed in the recreational analysis. 14 15
1. There will be land available on both Hinds County and Rankin County sides of the 16 expanded Pearl River banks. The elevations of these lands will be greater than the annual 17 0.2% chance exceedance and therefore, out of the floodplain. No sites with this size 18 acreage in Hinds County located near the Jackson Downtown area can provide this type of 19 development. Flowood developments continue to develop north away from downtown. 20 Flowood has no large sites available to develop except those north on Highway 25. It is 21 not believed alternative sites would be affected in Rankin County due to sites being limited. 22
2. Due to the location of the project, it will provide unique opportunities along the Pearl River 23 in addition to the unique recreation benefits. Utilities are typically in proximity of the lands 24 outlined on Figure B-6. This proximity offers an opportunity to extend needed utility 25 services to comparable sites in Rankin County to provide the same benefits. 26
3. Figure B-6 presents the areas discussed in the above paragraphs. Although a final land use 27 plan has not been developed, the unique opportunities these locations will present for future 28 market values is clear. 29
4. Land values for floodplain and non-floodplain areas have been used to estimate increase in 30 land values where land use is expected to change. In addition, the amount of land estimated 31 to be utilized as park areas was not included in the projections of improved market value. 32
5. It is understood that land values will not increase instantaneously. The increase in land 33 values have conservatively been assumed to take place over the 50 year period of the 34 project. 35
Due to the uniqueness of this project, it is possible the location benefits could be underestimated. 36 The benefits will be dependent on land markets at the time of project completion. Intensification 37 and location benefits will be revised as more data becomes available. In an effort to ensure 38 conservative projections and to not overstate the expected location and intensification benefits, 39 which are subject to fluctuating market conditions, only 50% of the estimated benefits were used 40 in the calculations of total net benefits. 41
With intensification benefits to 139 acres and location benefits to 594 acres, it was estimated that 42 these benefits would be approximately $10.2 million annually within Flowood and Jackson. The 43
Integrated Draft Feasibility and Environmental Impact Statement Pearl River Watershed, Hinds and Rankin Counties, MS
Appendix B: Economics 26
reduction in required fill is estimated to contribute to the annual benefits for areas within both 1 Flowood and Jackson. The land uses would be specific based on the uniqueness of the area and 2 would not significantly reduce economic rent from other areas in the region. Assuming land values 3 increased from $5,000 to $40,000 per acre for a projected land value of $10,000 to $80,000 per 4 acre post-project (Table B-14). This increase (intensification) was assumed to begin immediately 5 and continue over the life of the project. The intensification does not include development cost- 6 only the expected land rent stream based on the value of the raw land. 7
8
Recreation Benefits - Recreation benefits were calculated using the User Day Value (UDV) and 9 the capacity method as described in Amendment #1 of this Appendix. Based on the climate in the 10 Study Area, the user days calculated based on 70 percent of capacity. The calculation of the 11 recreation benefits is presented in Table B-15. Recreation facilities are proposed for Alternative 12 C only and the estimated annual benefits are $4,208,764. 13
14 TOTAL BENEFITS, PROJECT COSTS, AND BENEFIT-COST ANALYSIS 15
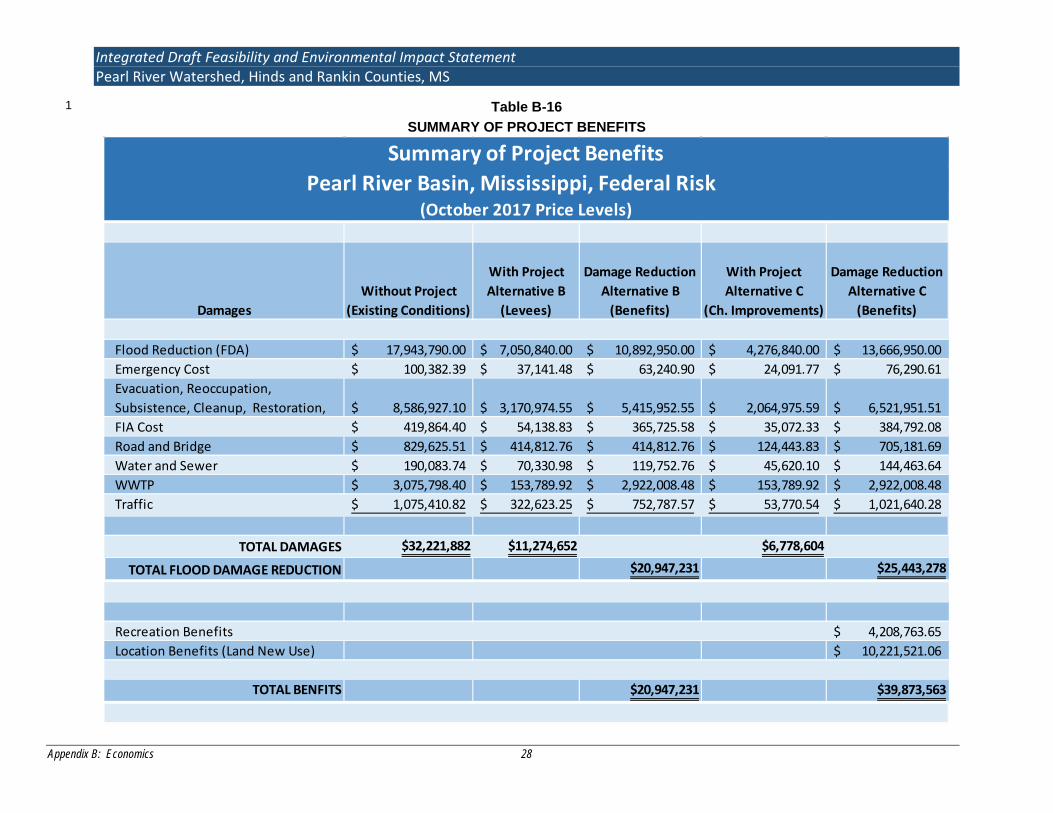
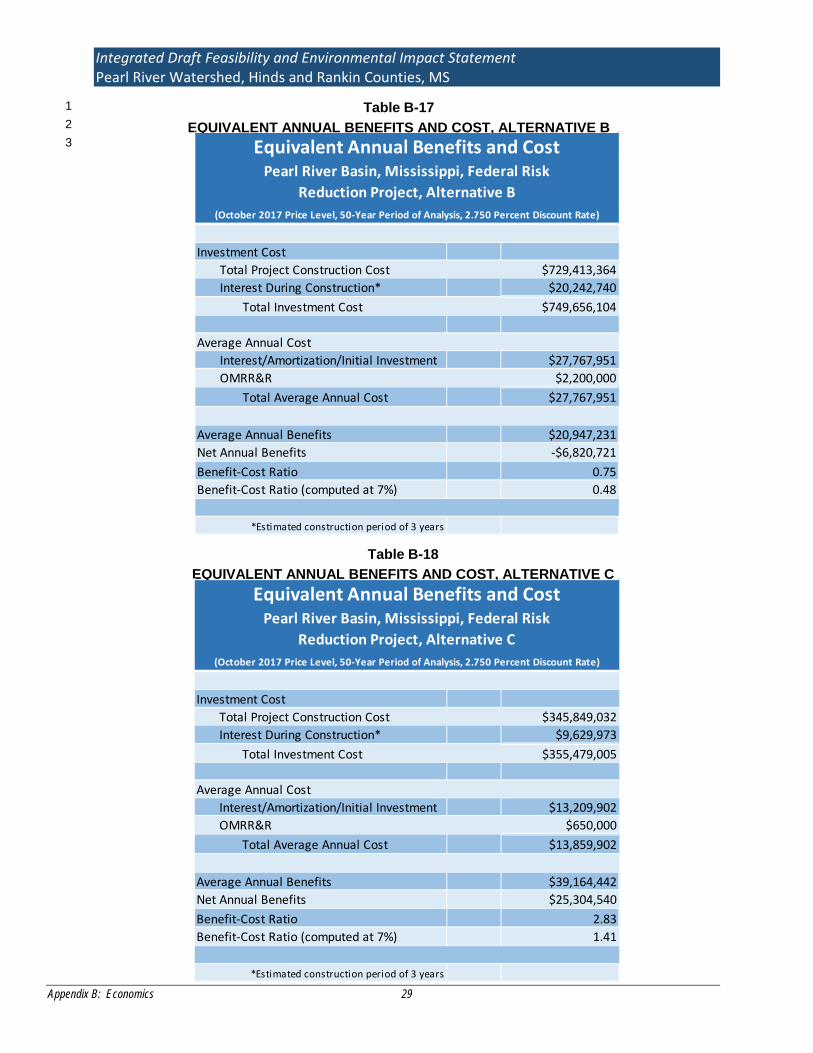
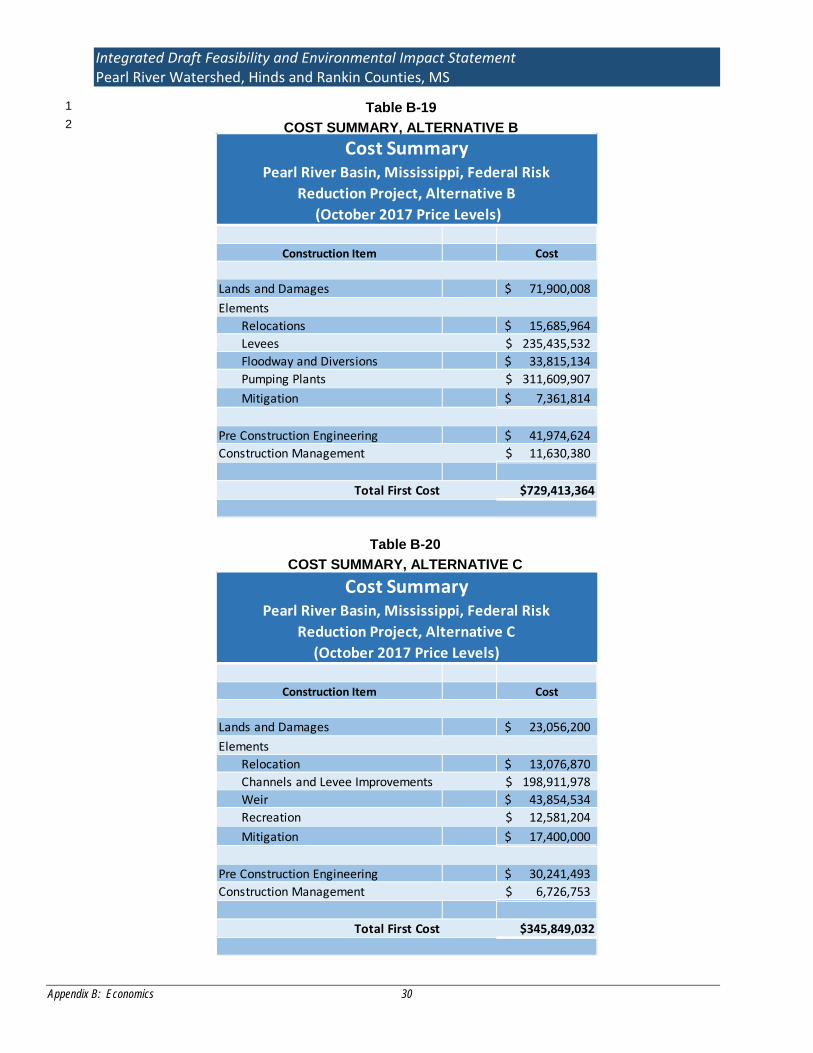
Total Benefits - The summaries of all benefits are presented in Table B-16, Table B-17 and Table 16 B-18. 17 18 Projects Costs - The project implementation costs; operation, maintenance, and major 19 replacement costs; average annual equivalent cost; benefit-cost ratio; and excess benefits over 20 costs are presented in Table B-17 through Table B-20. The average annual equivalent costs, 21 benefit-cost ratio, and excess benefits over costs are based on a three year construction period, a 22 base year of 2020, a 2 3/4 percent discount rate, and a period of analysis of 50 years. Recreation 23
Typical Unit
Unit Measure
Annual Users Per Unit
Annual Capacity
Proposed Units
User Day Value
Annual Benefit Benefit
RV Pads 1 ea. 720 0.7 150 $9.41 $711,396Trails 1500 FT 6,125 0.7 53 $9.41 $2,138,305Fishing Piers 500 sq. ft. 8,045 0.7 6 $9.41 $317,954Wildlife Viewing 1500 sq. ft. 18,125 0.7 3 $9.41 $358,168Boat Ramps 1 lanes 17,280 0.7 6 $9.41 $682,940
Total Recreation Benefits $4,208,764(October 2017 Price Levels)
Table B-15 CALCULATION OF RECREATION BENEFITS
Table B-14 INTENSIFICATION AND LOCATION BENEFITS (LAND VALUE)
Undeveloped Land in
Floodplain
Land Value/ Unit Value (per/acre)
Land Value Without Project
Land Value/ Unit Value (per/acre)
Land Value With Project
Intensification Benefits
RANKIN Intensification Benefits 139.0 $40,000 $5,560,000 $80,000 $11,120,000 $5,560,000RANKIN Location Benefits 305.6 $5,000 $1,528,000 $80,000 $24,448,000 $22,920,000
Park Areas (estimated) 76.4 $5,000 $382,000 $10,000 $764,000 $382,000HINDS Location Benefits 351.2 $5,000 $1,756,000 $80,000 $28,096,000 $26,340,000
Park Areas (estimated) 87.8 $5,000 $439,000 $10,000 $878,000 $439,000TOTAL LOCATION BENEFITS $55,641,000
(October 2017 Price Levels)
Integrated Draft Feasibility and Environmental Impact Statement Pearl River Watershed, Hinds and Rankin Counties, MS
Appendix B: Economics 27
costs and benefits are presented for Alternative C, only, and do not include operation and 1 maintenance costs. These costs will be refined for the tentatively selected plan in the final analysis. 2 3 Benefit-Cost Analysis - From this analysis, it can be seen that Alternative C, Channel 4 Improvement, is the economically superior plan, providing a much higher benefit cost ratio and 5 excess benefits over costs. Of the plans analyzed, it is the least costly and is also the NED Plan. 6 Alternative C is also the locally preferred plan.7
Integrated Draft Feasibility and Environmental Impact Statement Pearl River Watershed, Hinds and Rankin Counties, MS
Appendix B: Economics 28
1 Table B-16 SUMMARY OF PROJECT BENEFITS
DamagesWithout Project
(Existing Conditions)
With Project Alternative B
(Levees)
Damage Reduction Alternative B
(Benefits)
With Project Alternative C
(Ch. Improvements)
Damage Reduction Alternative C
(Benefits)
Flood Reduction (FDA) 17,943,790.00$ 7,050,840.00$ 10,892,950.00$ 4,276,840.00$ 13,666,950.00$ Emergency Cost 100,382.39$ 37,141.48$ 63,240.90$ 24,091.77$ 76,290.61$ Evacuation, Reoccupation, Subsistence, Cleanup, Restoration, 8,586,927.10$ 3,170,974.55$ 5,415,952.55$ 2,064,975.59$ 6,521,951.51$ FIA Cost 419,864.40$ 54,138.83$ 365,725.58$ 35,072.33$ 384,792.08$ Road and Bridge 829,625.51$ 414,812.76$ 414,812.76$ 124,443.83$ 705,181.69$ Water and Sewer 190,083.74$ 70,330.98$ 119,752.76$ 45,620.10$ 144,463.64$ WWTP 3,075,798.40$ 153,789.92$ 2,922,008.48$ 153,789.92$ 2,922,008.48$ Traffic 1,075,410.82$ 322,623.25$ 752,787.57$ 53,770.54$ 1,021,640.28$
TOTAL DAMAGES $32,221,882 $11,274,652 $6,778,604
TOTAL FLOOD DAMAGE REDUCTION $20,947,231 $25,443,278
Recreation Benefits 4,208,763.65$ Location Benefits (Land New Use) 10,221,521.06$
TOTAL BENFITS $20,947,231 $39,873,563
Summary of Project BenefitsPearl River Basin, Mississippi, Federal Risk
(October 2017 Price Levels)
Integrated Draft Feasibility and Environmental Impact Statement Pearl River Watershed, Hinds and Rankin Counties, MS
Appendix B: Economics 29
1 2
3
Table B-17 EQUIVALENT ANNUAL BENEFITS AND COST, ALTERNATIVE B
Table B-18 EQUIVALENT ANNUAL BENEFITS AND COST, ALTERNATIVE C
Investment CostTotal Project Construction Cost $729,413,364Interest During Construction* $20,242,740
Total Investment Cost $749,656,104
Average Annual CostInterest/Amortization/Initial Investment $27,767,951OMRR&R $2,200,000
Total Average Annual Cost $27,767,951
Average Annual Benefits $20,947,231Net Annual Benefits -$6,820,721Benefit-Cost Ratio 0.75Benefit-Cost Ratio (computed at 7%) 0.48
*Estimated construction period of 3 years
Equivalent Annual Benefits and CostPearl River Basin, Mississippi, Federal Risk
Reduction Project, Alternative B(October 2017 Price Level, 50-Year Period of Analysis, 2.750 Percent Discount Rate)
Investment CostTotal Project Construction Cost $345,849,032Interest During Construction* $9,629,973
Total Investment Cost $355,479,005
Average Annual CostInterest/Amortization/Initial Investment $13,209,902OMRR&R $650,000
Total Average Annual Cost $13,859,902
Average Annual Benefits $39,164,442Net Annual Benefits $25,304,540Benefit-Cost Ratio 2.83Benefit-Cost Ratio (computed at 7%) 1.41
*Estimated construction period of 3 years
Equivalent Annual Benefits and CostPearl River Basin, Mississippi, Federal Risk
Reduction Project, Alternative C(October 2017 Price Level, 50-Year Period of Analysis, 2.750 Percent Discount Rate)
Integrated Draft Feasibility and Environmental Impact Statement Pearl River Watershed, Hinds and Rankin Counties, MS
Appendix B: Economics 30
1 2
Table B-20 COST SUMMARY, ALTERNATIVE C
Table B-19 COST SUMMARY, ALTERNATIVE B
Construction Item Cost
Lands and Damages 71,900,008$ Elements
Relocations 15,685,964$ Levees 235,435,532$ Floodway and Diversions 33,815,134$ Pumping Plants 311,609,907$ Mitigation 7,361,814$
Pre Construction Engineering 41,974,624$ Construction Management 11,630,380$
Total First Cost $729,413,364
Cost SummaryPearl River Basin, Mississippi, Federal Risk
Reduction Project, Alternative B (October 2017 Price Levels)
Construction Item Cost
Lands and Damages 23,056,200$ Elements
Relocation 13,076,870$ Channels and Levee Improvements 198,911,978$ Weir 43,854,534$ Recreation 12,581,204$ Mitigation 17,400,000$
Pre Construction Engineering 30,241,493$ Construction Management 6,726,753$
Total First Cost $345,849,032
Cost SummaryPearl River Basin, Mississippi, Federal Risk
Reduction Project, Alternative C(October 2017 Price Levels)
Integrated Draft Feasibility and Environmental Impact Statement Pearl River Watershed, Hinds and Rankin Counties, MS
Appendix B: Economics 31
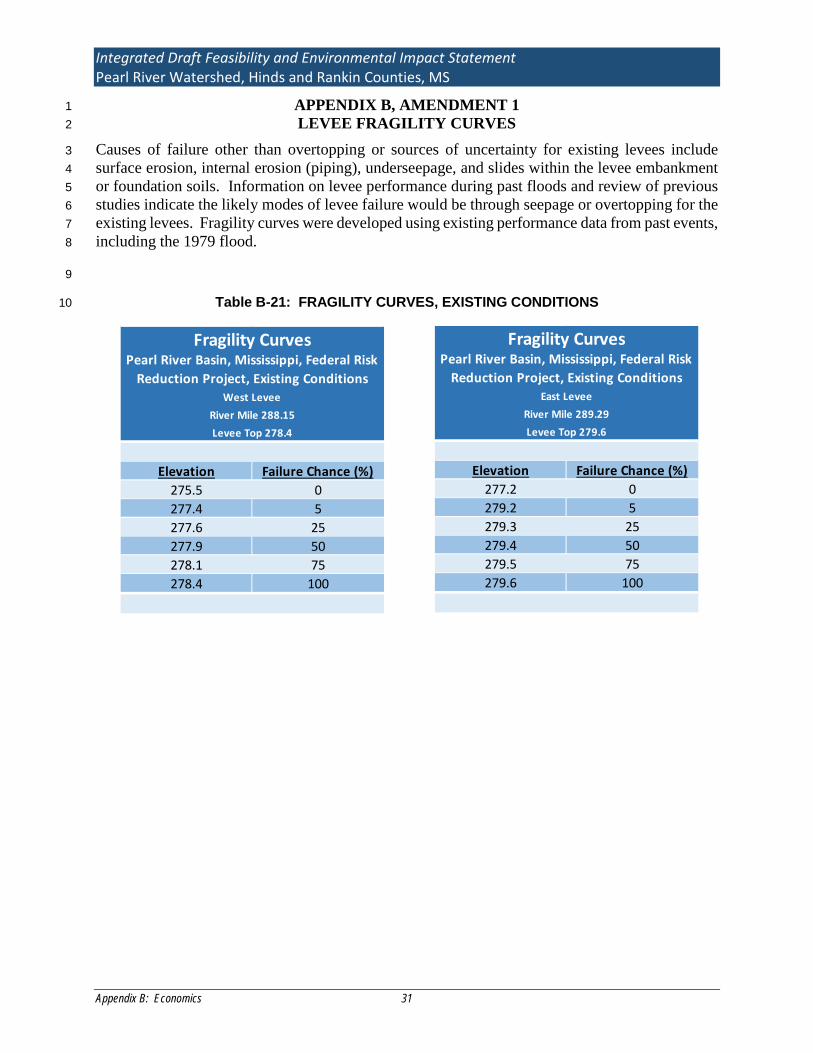
APPENDIX B, AMENDMENT 1 1 LEVEE FRAGILITY CURVES 2
Causes of failure other than overtopping or sources of uncertainty for existing levees include 3 surface erosion, internal erosion (piping), underseepage, and slides within the levee embankment 4 or foundation soils. Information on levee performance during past floods and review of previous 5 studies indicate the likely modes of levee failure would be through seepage or overtopping for the 6 existing levees. Fragility curves were developed using existing performance data from past events, 7 including the 1979 flood. 8
9
Table B-21: FRAGILITY CURVES, EXISTING CONDITIONS 10
11
12
Elevation Failure Chance (%)275.5 0277.4 5277.6 25277.9 50278.1 75278.4 100
Fragility CurvesPearl River Basin, Mississippi, Federal Risk
Reduction Project, Existing ConditionsWest Levee
Levee Top 278.4River Mile 288.15
Elevation Failure Chance (%)277.2 0279.2 5279.3 25279.4 50279.5 75279.6 100
Fragility CurvesPearl River Basin, Mississippi, Federal Risk
Reduction Project, Existing ConditionsEast Levee
River Mile 289.29Levee Top 279.6
Integrated Draft Feasibility and Environmental Impact Statement Pearl River Watershed, Hinds and Rankin Counties, MS
Appendix B: Economics 32
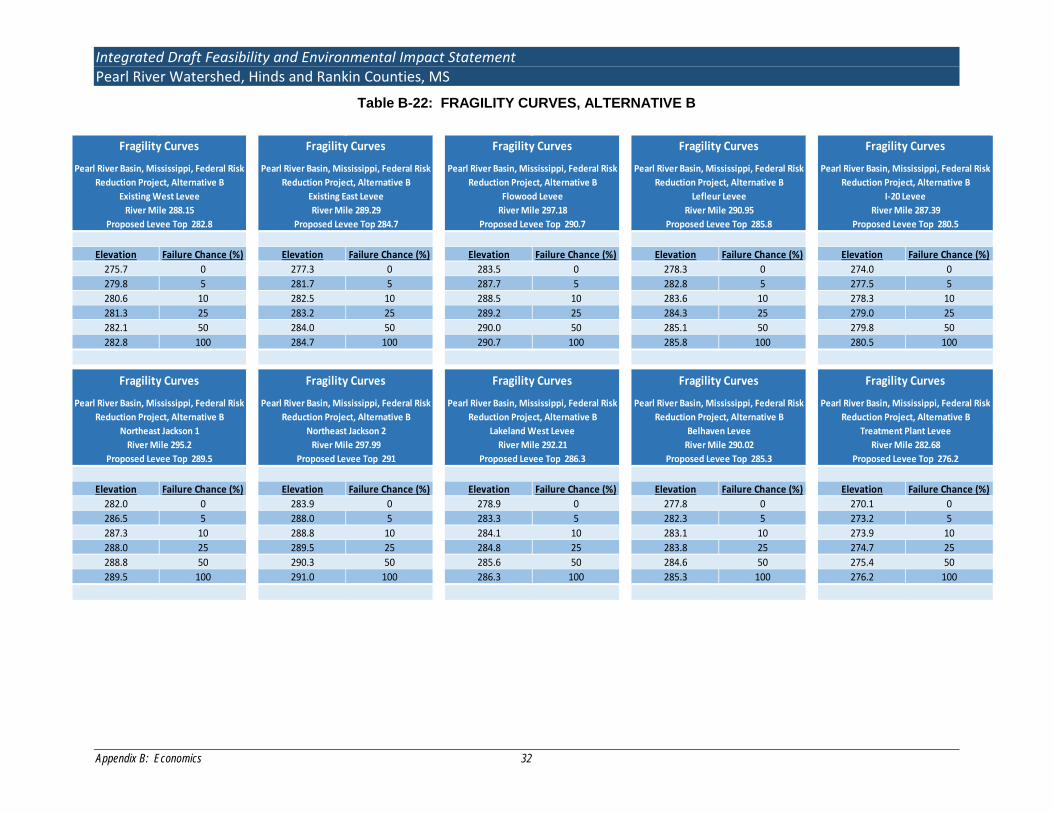
Table B-22: FRAGILITY CURVES, ALTERNATIVE B
Elevation Failure Chance (%) Elevation Failure Chance (%) Elevation Failure Chance (%) Elevation Failure Chance (%) Elevation Failure Chance (%)275.7 0 277.3 0 283.5 0 278.3 0 274.0 0279.8 5 281.7 5 287.7 5 282.8 5 277.5 5280.6 10 282.5 10 288.5 10 283.6 10 278.3 10281.3 25 283.2 25 289.2 25 284.3 25 279.0 25282.1 50 284.0 50 290.0 50 285.1 50 279.8 50282.8 100 284.7 100 290.7 100 285.8 100 280.5 100
Elevation Failure Chance (%) Elevation Failure Chance (%) Elevation Failure Chance (%) Elevation Failure Chance (%) Elevation Failure Chance (%)282.0 0 283.9 0 278.9 0 277.8 0 270.1 0286.5 5 288.0 5 283.3 5 282.3 5 273.2 5287.3 10 288.8 10 284.1 10 283.1 10 273.9 10288.0 25 289.5 25 284.8 25 283.8 25 274.7 25288.8 50 290.3 50 285.6 50 284.6 50 275.4 50289.5 100 291.0 100 286.3 100 285.3 100 276.2 100
Proposed Levee Top 291
Fragility Curves
Fragility Curves
Existing West LeveeRiver Mile 288.15
Proposed Levee Top 282.8
Fragility Curves
River Mile 289.29Proposed Levee Top 284.7
River Mile 295.2
Existing East Levee
Pearl River Basin, Mississippi, Federal Risk Reduction Project, Alternative B
Northeast Jackson 1
Proposed Levee Top 289.5
Fragility Curves
Pearl River Basin, Mississippi, Federal Risk Reduction Project, Alternative B
Flowood LeveeRiver Mile 297.18
Proposed Levee Top 290.7
Fragility Curves
Pearl River Basin, Mississippi, Federal Risk Reduction Project, Alternative B
Lakeland West LeveeRiver Mile 292.21
Pearl River Basin, Mississippi, Federal Risk Reduction Project, Alternative B
Pearl River Basin, Mississippi, Federal Risk Reduction Project, Alternative B
Fragility Curves
Pearl River Basin, Mississippi, Federal Risk Reduction Project, Alternative B
Northeast Jackson 2River Mile 297.99
Proposed Levee Top 286.3
Fragility Curves
Pearl River Basin, Mississippi, Federal Risk Reduction Project, Alternative B
Lefleur LeveeRiver Mile 290.95
Proposed Levee Top 285.8
Fragility Curves
Pearl River Basin, Mississippi, Federal Risk Reduction Project, Alternative B
Belhaven LeveeRiver Mile 290.02
Proposed Levee Top 285.3
Fragility Curves
Pearl River Basin, Mississippi, Federal Risk Reduction Project, Alternative B
I-20 Levee
Fragility Curves
Pearl River Basin, Mississippi, Federal Risk Reduction Project, Alternative B
River Mile 282.68Proposed Levee Top 276.2
Treatment Plant Levee
River Mile 287.39Proposed Levee Top 280.5
Integrated Draft Feasibility and Environmental Impact Statement Pearl River Watershed, Hinds and Rankin Counties, MS
Appendix B: Economics 33
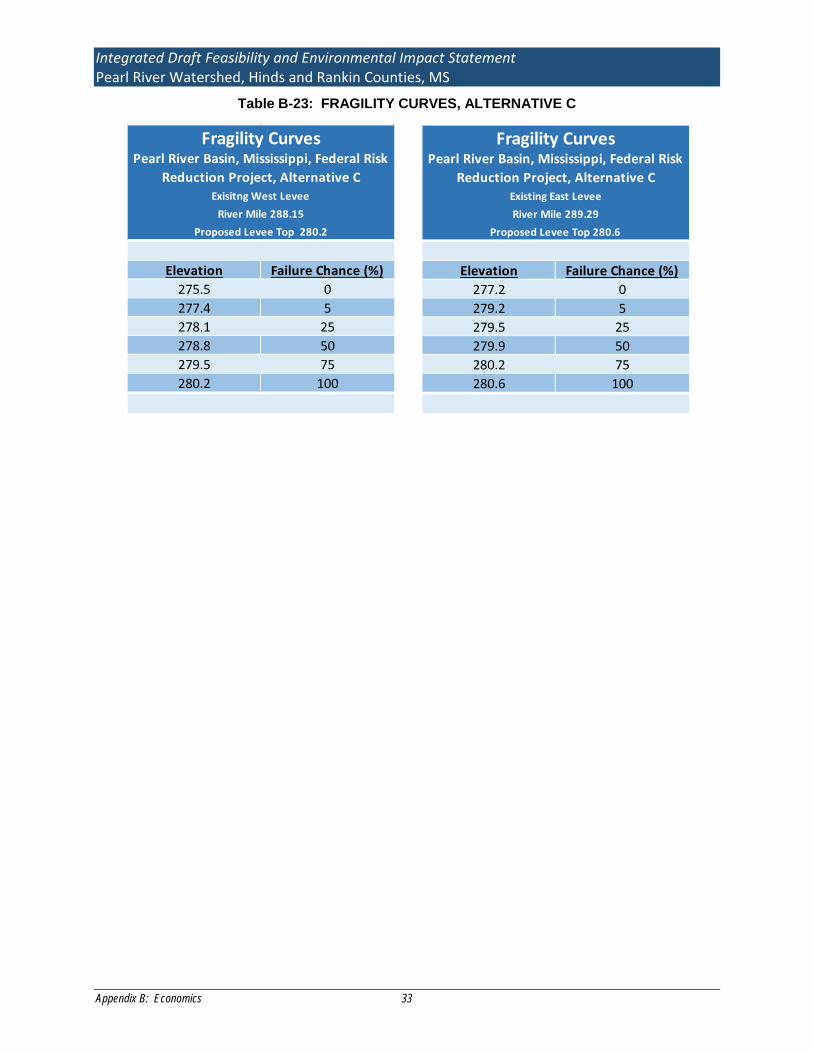
Table B-23: FRAGILITY CURVES, ALTERNATIVE C
Elevation Failure Chance (%)277.2 0279.2 5279.5 25279.9 50280.2 75280.6 100
Fragility CurvesPearl River Basin, Mississippi, Federal Risk
Reduction Project, Alternative CExisting East LeveeRiver Mile 289.29
Proposed Levee Top 280.6
Elevation Failure Chance (%)275.5 0277.4 5278.1 25278.8 50279.5 75280.2 100
Fragility CurvesPearl River Basin, Mississippi, Federal Risk
Reduction Project, Alternative CExisitng West Levee
River Mile 288.15Proposed Levee Top 280.2
Integrated Draft Feasibility and Environmental Impact Statement Pearl River Watershed, Hinds and Rankin Counties, MS
Appendix B: Economics 34
This Page Intentionally Left Blank
Integrated Draft Feasibility and Environmental Impact Statement Pearl River Watershed, Hinds and Rankin Counties, MS
Appendix B: Economics 35
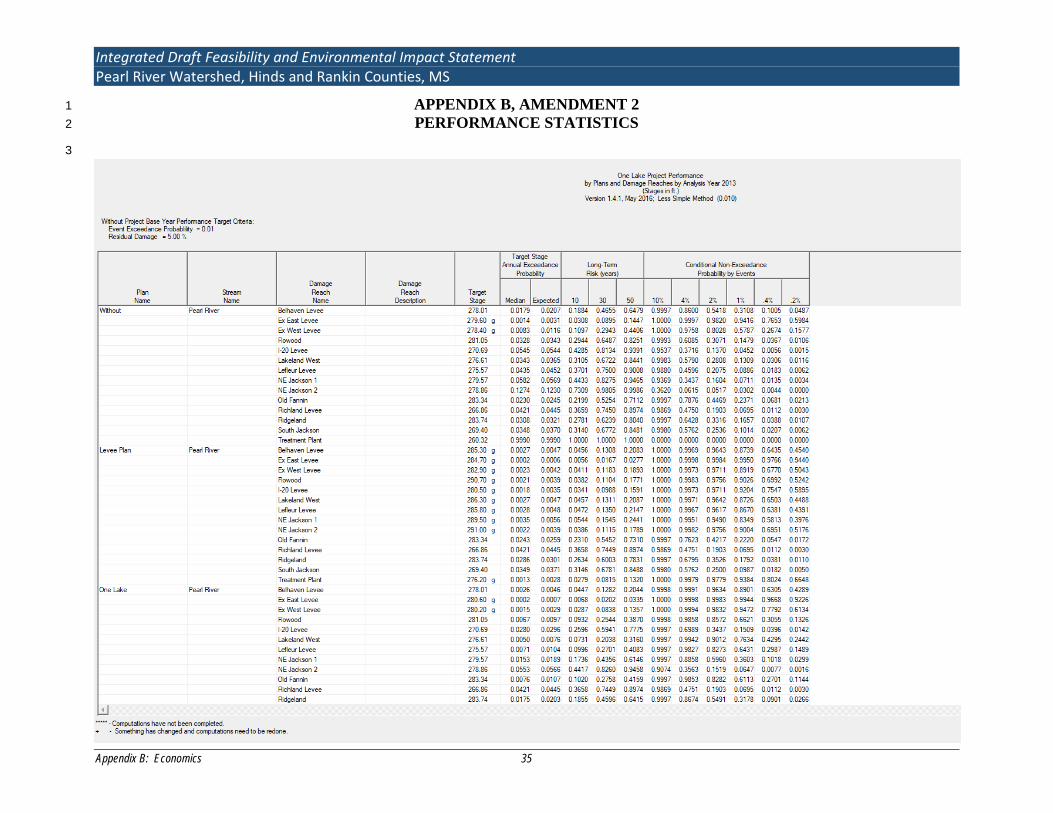
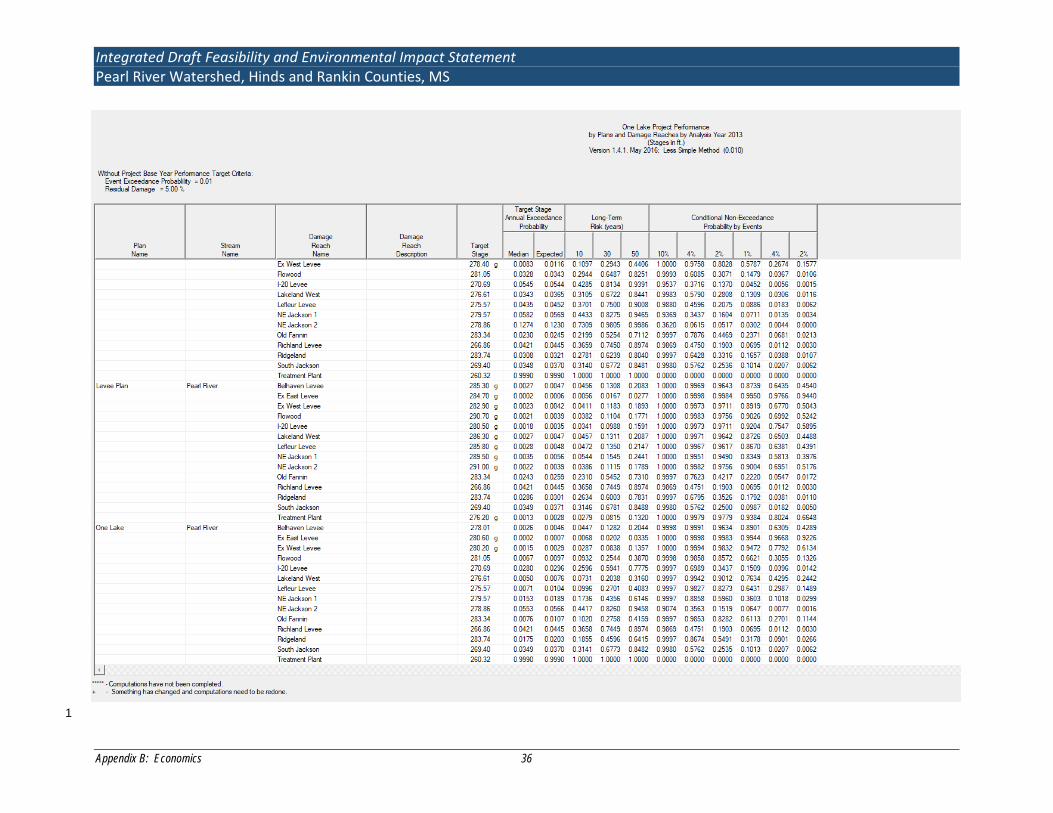
APPENDIX B, AMENDMENT 2 1 PERFORMANCE STATISTICS 2
3
Integrated Draft Feasibility and Environmental Impact Statement Pearl River Watershed, Hinds and Rankin Counties, MS
Appendix B: Economics 36
1
Integrated Draft Feasibility and Environmental Impact Statement Pearl River Watershed, Hinds and Rankin Counties, MS
Appendix B: Economics 37
1
APPENDIX B, AMENDMENT 3 2 RECREATION BENEFITS 3
4
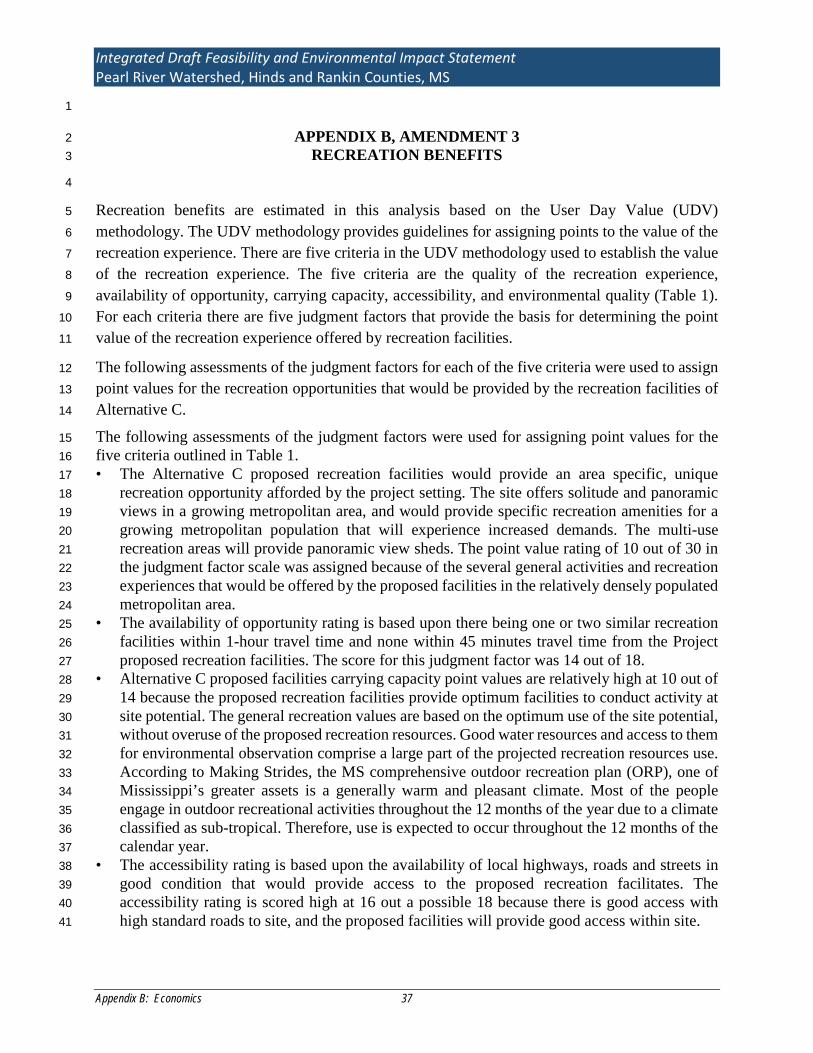
Recreation benefits are estimated in this analysis based on the User Day Value (UDV) 5 methodology. The UDV methodology provides guidelines for assigning points to the value of the 6 recreation experience. There are five criteria in the UDV methodology used to establish the value 7 of the recreation experience. The five criteria are the quality of the recreation experience, 8 availability of opportunity, carrying capacity, accessibility, and environmental quality (Table 1). 9 For each criteria there are five judgment factors that provide the basis for determining the point 10 value of the recreation experience offered by recreation facilities. 11
The following assessments of the judgment factors for each of the five criteria were used to assign 12 point values for the recreation opportunities that would be provided by the recreation facilities of 13 Alternative C. 14
The following assessments of the judgment factors were used for assigning point values for the 15 five criteria outlined in Table 1. 16 • The Alternative C proposed recreation facilities would provide an area specific, unique 17
recreation opportunity afforded by the project setting. The site offers solitude and panoramic 18 views in a growing metropolitan area, and would provide specific recreation amenities for a 19 growing metropolitan population that will experience increased demands. The multi-use 20 recreation areas will provide panoramic view sheds. The point value rating of 10 out of 30 in 21 the judgment factor scale was assigned because of the several general activities and recreation 22 experiences that would be offered by the proposed facilities in the relatively densely populated 23 metropolitan area. 24
• The availability of opportunity rating is based upon there being one or two similar recreation 25 facilities within 1-hour travel time and none within 45 minutes travel time from the Project 26 proposed recreation facilities. The score for this judgment factor was 14 out of 18. 27
• Alternative C proposed facilities carrying capacity point values are relatively high at 10 out of 28 14 because the proposed recreation facilities provide optimum facilities to conduct activity at 29 site potential. The general recreation values are based on the optimum use of the site potential, 30 without overuse of the proposed recreation resources. Good water resources and access to them 31 for environmental observation comprise a large part of the projected recreation resources use. 32 According to Making Strides, the MS comprehensive outdoor recreation plan (ORP), one of 33 Mississippi’s greater assets is a generally warm and pleasant climate. Most of the people 34 engage in outdoor recreational activities throughout the 12 months of the year due to a climate 35 classified as sub-tropical. Therefore, use is expected to occur throughout the 12 months of the 36 calendar year. 37
• The accessibility rating is based upon the availability of local highways, roads and streets in 38 good condition that would provide access to the proposed recreation facilitates. The 39 accessibility rating is scored high at 16 out a possible 18 because there is good access with 40 high standard roads to site, and the proposed facilities will provide good access within site. 41
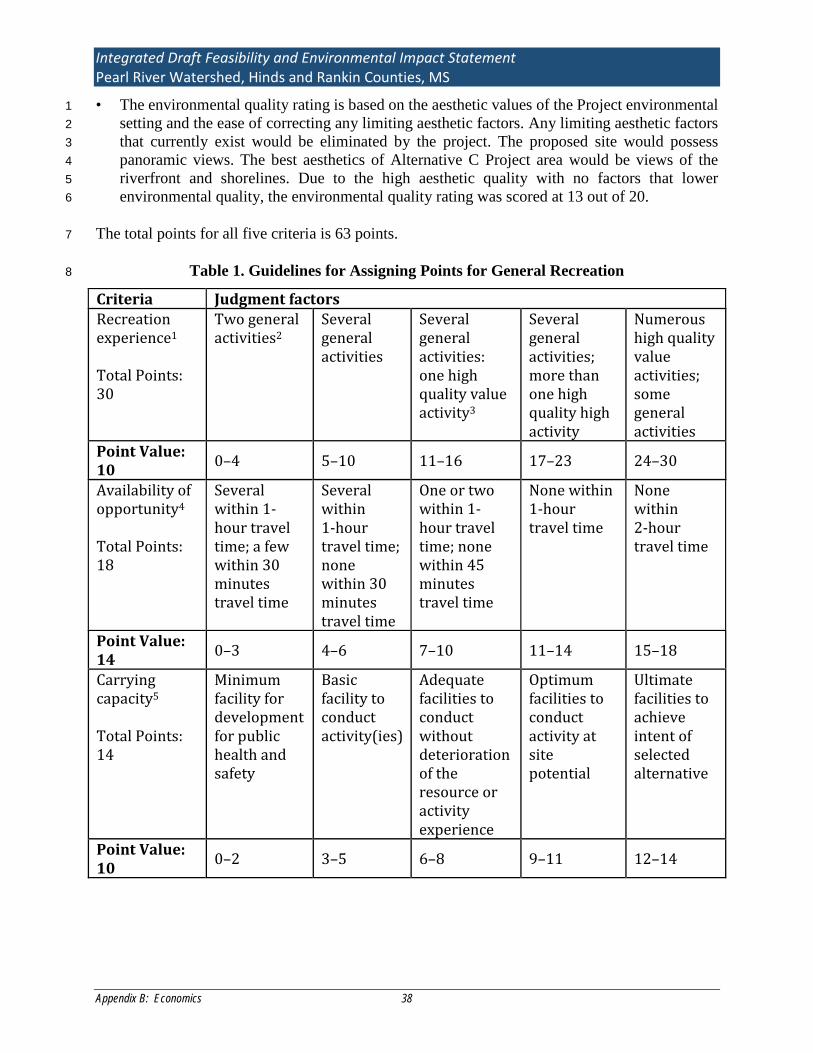
Integrated Draft Feasibility and Environmental Impact Statement Pearl River Watershed, Hinds and Rankin Counties, MS
Appendix B: Economics 38
• The environmental quality rating is based on the aesthetic values of the Project environmental 1 setting and the ease of correcting any limiting aesthetic factors. Any limiting aesthetic factors 2 that currently exist would be eliminated by the project. The proposed site would possess 3 panoramic views. The best aesthetics of Alternative C Project area would be views of the 4 riverfront and shorelines. Due to the high aesthetic quality with no factors that lower 5 environmental quality, the environmental quality rating was scored at 13 out of 20. 6
The total points for all five criteria is 63 points. 7
Table 1. Guidelines for Assigning Points for General Recreation 8
Criteria Judgment factors Recreation experience1
Total Points: 30
Two general activities2
Several general activities
Several general activities: one high quality value activity3
Several general activities; more than one high quality high activity
Numerous high quality value activities; some general activities
Point Value: 10 0–4 5–10 11–16 17–23 24–30
Availability of opportunity4
Total Points: 18
Several within 1-hour travel time; a few within 30 minutes travel time
Several within 1-hour travel time; none within 30 minutes travel time
One or two within 1-hour travel time; none within 45 minutes travel time
None within 1-hour travel time
None within 2-hour travel time
Point Value: 14 0–3 4–6 7–10 11–14 15–18
Carrying capacity5 Total Points: 14
Minimum facility for development for public health and safety
Basic facility to conduct activity(ies)
Adequate facilities to conduct without deterioration of the resource or activity experience
Optimum facilities to conduct activity at site potential
Ultimate facilities to achieve intent of selected alternative
Point Value: 10 0–2 3–5 6–8 9–11 12–14
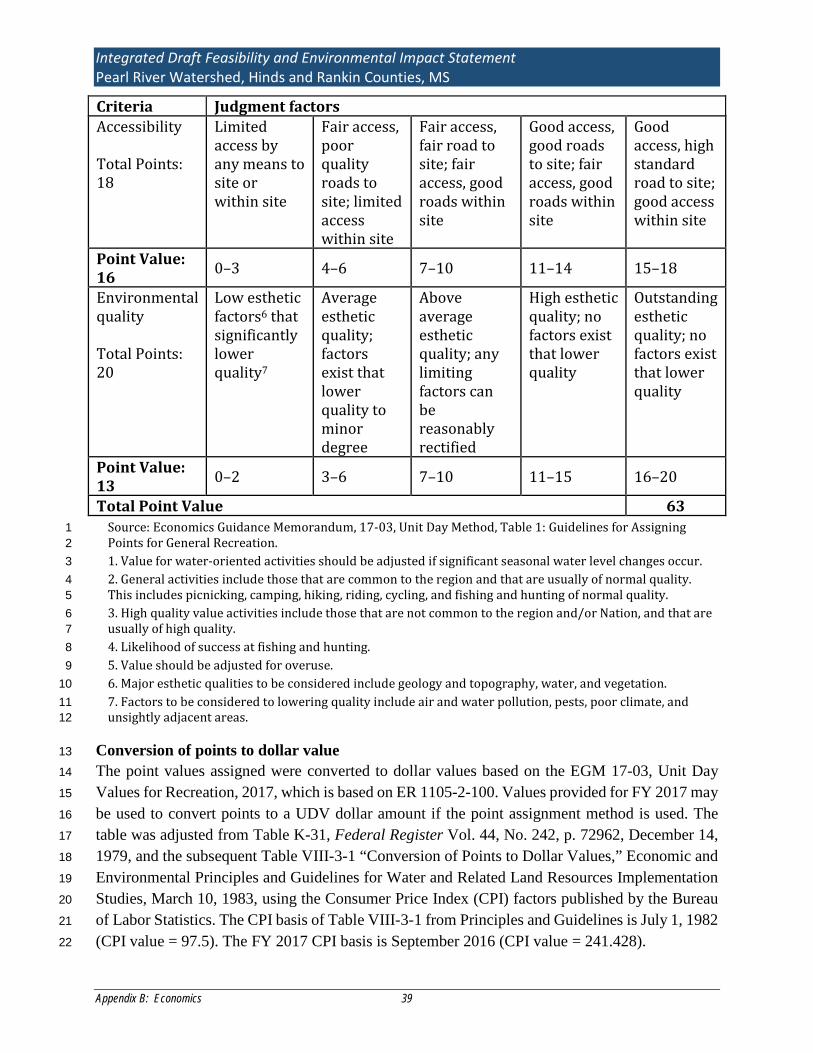
Integrated Draft Feasibility and Environmental Impact Statement Pearl River Watershed, Hinds and Rankin Counties, MS
Appendix B: Economics 39
Criteria Judgment factors Accessibility Total Points: 18
Limited access by any means to site or within site
Fair access, poor quality roads to site; limited access within site
Fair access, fair road to site; fair access, good roads within site
Good access, good roads to site; fair access, good roads within site
Good access, high standard road to site; good access within site
Point Value: 16 0–3 4–6 7–10 11–14 15–18
Environmental quality Total Points: 20
Low esthetic factors6 that significantly lower quality7
Average esthetic quality; factors exist that lower quality to minor degree
Above average esthetic quality; any limiting factors can be reasonably rectified
High esthetic quality; no factors exist that lower quality
Outstanding esthetic quality; no factors exist that lower quality
Point Value: 13 0–2 3–6 7–10 11–15 16–20
Total Point Value 63 Source: Economics Guidance Memorandum, 17-03, Unit Day Method, Table 1: Guidelines for Assigning 1 Points for General Recreation. 2 1. Value for water-oriented activities should be adjusted if significant seasonal water level changes occur. 3 2. General activities include those that are common to the region and that are usually of normal quality. 4 This includes picnicking, camping, hiking, riding, cycling, and fishing and hunting of normal quality. 5 3. High quality value activities include those that are not common to the region and/or Nation, and that are 6 usually of high quality. 7 4. Likelihood of success at fishing and hunting. 8 5. Value should be adjusted for overuse. 9 6. Major esthetic qualities to be considered include geology and topography, water, and vegetation. 10 7. Factors to be considered to lowering quality include air and water pollution, pests, poor climate, and 11 unsightly adjacent areas. 12
Conversion of points to dollar value 13 The point values assigned were converted to dollar values based on the EGM 17-03, Unit Day 14 Values for Recreation, 2017, which is based on ER 1105-2-100. Values provided for FY 2017 may 15 be used to convert points to a UDV dollar amount if the point assignment method is used. The 16 table was adjusted from Table K-31, Federal Register Vol. 44, No. 242, p. 72962, December 14, 17 1979, and the subsequent Table VIII-3-1 “Conversion of Points to Dollar Values,” Economic and 18 Environmental Principles and Guidelines for Water and Related Land Resources Implementation 19 Studies, March 10, 1983, using the Consumer Price Index (CPI) factors published by the Bureau 20 of Labor Statistics. The CPI basis of Table VIII-3-1 from Principles and Guidelines is July 1, 1982 21 (CPI value = 97.5). The FY 2017 CPI basis is September 2016 (CPI value = 241.428). 22
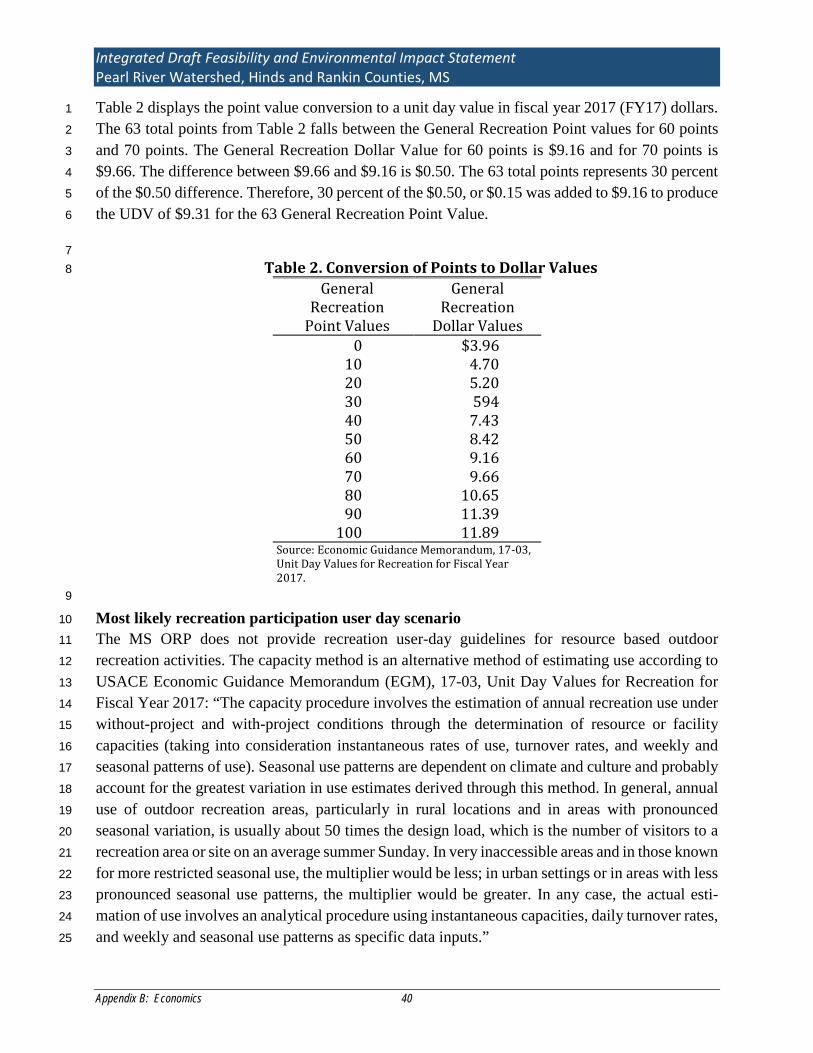
Integrated Draft Feasibility and Environmental Impact Statement Pearl River Watershed, Hinds and Rankin Counties, MS
Appendix B: Economics 40
Table 2 displays the point value conversion to a unit day value in fiscal year 2017 (FY17) dollars. 1 The 63 total points from Table 2 falls between the General Recreation Point values for 60 points 2 and 70 points. The General Recreation Dollar Value for 60 points is $9.16 and for 70 points is 3 $9.66. The difference between $9.66 and $9.16 is $0.50. The 63 total points represents 30 percent 4 of the $0.50 difference. Therefore, 30 percent of the $0.50, or $0.15 was added to $9.16 to produce 5 the UDV of $9.31 for the 63 General Recreation Point Value. 6
7 Table 2. Conversion of Points to Dollar Values 8
General Recreation
Point Values
General Recreation
Dollar Values 0 $3.96
10 4.70 20 5.20 30 594 40 7.43 50 8.42 60 9.16 70 9.66 80 10.65 90 11.39
100 11.89 Source: Economic Guidance Memorandum, 17-03, Unit Day Values for Recreation for Fiscal Year 2017.
9
Most likely recreation participation user day scenario 10 The MS ORP does not provide recreation user-day guidelines for resource based outdoor 11 recreation activities. The capacity method is an alternative method of estimating use according to 12 USACE Economic Guidance Memorandum (EGM), 17-03, Unit Day Values for Recreation for 13 Fiscal Year 2017: “The capacity procedure involves the estimation of annual recreation use under 14 without-project and with-project conditions through the determination of resource or facility 15 capacities (taking into consideration instantaneous rates of use, turnover rates, and weekly and 16 seasonal patterns of use). Seasonal use patterns are dependent on climate and culture and probably 17 account for the greatest variation in use estimates derived through this method. In general, annual 18 use of outdoor recreation areas, particularly in rural locations and in areas with pronounced 19 seasonal variation, is usually about 50 times the design load, which is the number of visitors to a 20 recreation area or site on an average summer Sunday. In very inaccessible areas and in those known 21 for more restricted seasonal use, the multiplier would be less; in urban settings or in areas with less 22 pronounced seasonal use patterns, the multiplier would be greater. In any case, the actual esti-23 mation of use involves an analytical procedure using instantaneous capacities, daily turnover rates, 24 and weekly and seasonal use patterns as specific data inputs.” 25
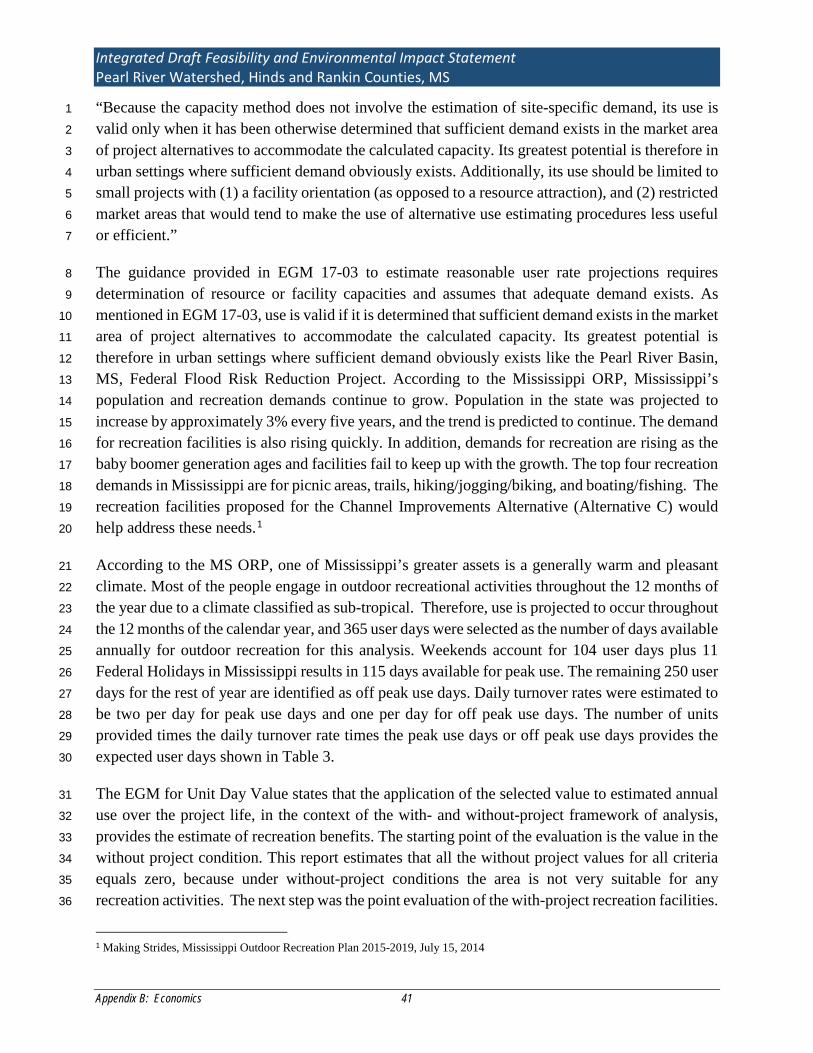
Integrated Draft Feasibility and Environmental Impact Statement Pearl River Watershed, Hinds and Rankin Counties, MS
Appendix B: Economics 41
“Because the capacity method does not involve the estimation of site-specific demand, its use is 1 valid only when it has been otherwise determined that sufficient demand exists in the market area 2 of project alternatives to accommodate the calculated capacity. Its greatest potential is therefore in 3 urban settings where sufficient demand obviously exists. Additionally, its use should be limited to 4 small projects with (1) a facility orientation (as opposed to a resource attraction), and (2) restricted 5 market areas that would tend to make the use of alternative use estimating procedures less useful 6 or efficient.” 7
The guidance provided in EGM 17-03 to estimate reasonable user rate projections requires 8 determination of resource or facility capacities and assumes that adequate demand exists. As 9 mentioned in EGM 17-03, use is valid if it is determined that sufficient demand exists in the market 10 area of project alternatives to accommodate the calculated capacity. Its greatest potential is 11 therefore in urban settings where sufficient demand obviously exists like the Pearl River Basin, 12 MS, Federal Flood Risk Reduction Project. According to the Mississippi ORP, Mississippi’s 13 population and recreation demands continue to grow. Population in the state was projected to 14 increase by approximately 3% every five years, and the trend is predicted to continue. The demand 15 for recreation facilities is also rising quickly. In addition, demands for recreation are rising as the 16 baby boomer generation ages and facilities fail to keep up with the growth. The top four recreation 17 demands in Mississippi are for picnic areas, trails, hiking/jogging/biking, and boating/fishing. The 18 recreation facilities proposed for the Channel Improvements Alternative (Alternative C) would 19 help address these needs.1 20
According to the MS ORP, one of Mississippi’s greater assets is a generally warm and pleasant 21 climate. Most of the people engage in outdoor recreational activities throughout the 12 months of 22 the year due to a climate classified as sub-tropical. Therefore, use is projected to occur throughout 23 the 12 months of the calendar year, and 365 user days were selected as the number of days available 24 annually for outdoor recreation for this analysis. Weekends account for 104 user days plus 11 25 Federal Holidays in Mississippi results in 115 days available for peak use. The remaining 250 user 26 days for the rest of year are identified as off peak use days. Daily turnover rates were estimated to 27 be two per day for peak use days and one per day for off peak use days. The number of units 28 provided times the daily turnover rate times the peak use days or off peak use days provides the 29 expected user days shown in Table 3. 30
The EGM for Unit Day Value states that the application of the selected value to estimated annual 31 use over the project life, in the context of the with- and without-project framework of analysis, 32 provides the estimate of recreation benefits. The starting point of the evaluation is the value in the 33 without project condition. This report estimates that all the without project values for all criteria 34 equals zero, because under without-project conditions the area is not very suitable for any 35 recreation activities. The next step was the point evaluation of the with-project recreation facilities. 36
1 Making Strides, Mississippi Outdoor Recreation Plan 2015-2019, July 15, 2014
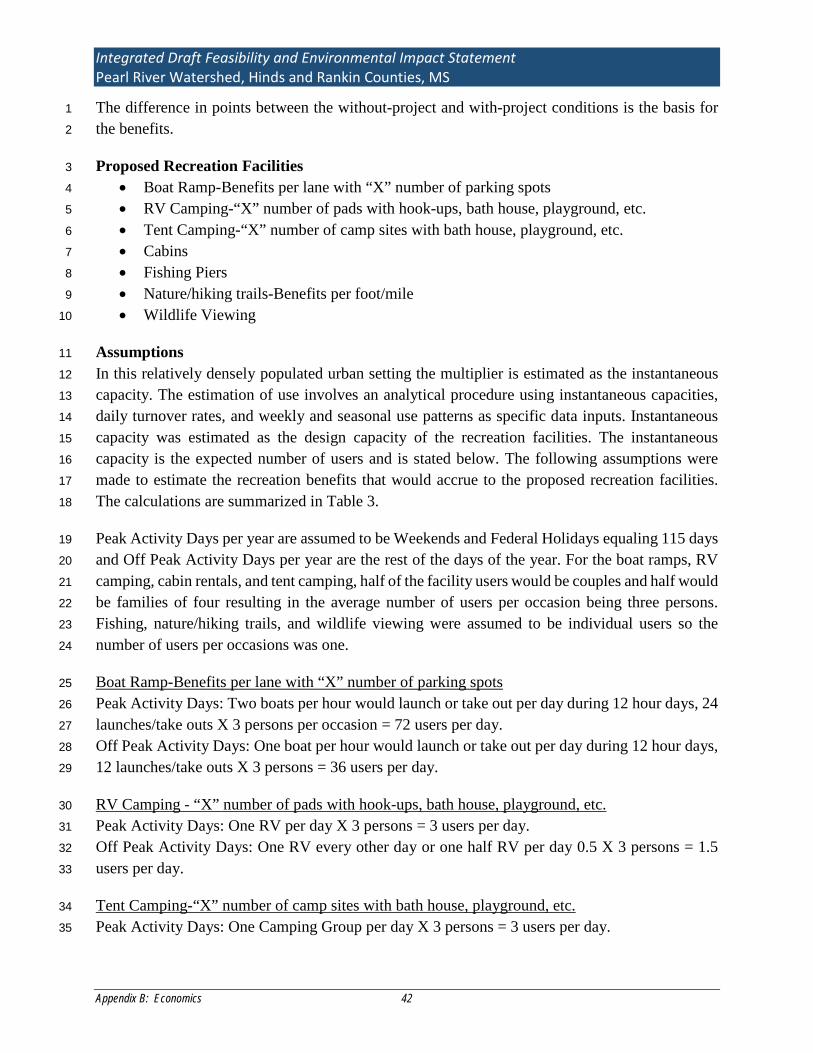
Integrated Draft Feasibility and Environmental Impact Statement Pearl River Watershed, Hinds and Rankin Counties, MS
Appendix B: Economics 42
The difference in points between the without-project and with-project conditions is the basis for 1 the benefits. 2
Proposed Recreation Facilities 3 • Boat Ramp-Benefits per lane with “X” number of parking spots 4 • RV Camping-“X” number of pads with hook-ups, bath house, playground, etc. 5 • Tent Camping-“X” number of camp sites with bath house, playground, etc. 6 • Cabins 7 • Fishing Piers 8 • Nature/hiking trails-Benefits per foot/mile 9 • Wildlife Viewing 10
Assumptions 11 In this relatively densely populated urban setting the multiplier is estimated as the instantaneous 12 capacity. The estimation of use involves an analytical procedure using instantaneous capacities, 13 daily turnover rates, and weekly and seasonal use patterns as specific data inputs. Instantaneous 14 capacity was estimated as the design capacity of the recreation facilities. The instantaneous 15 capacity is the expected number of users and is stated below. The following assumptions were 16 made to estimate the recreation benefits that would accrue to the proposed recreation facilities. 17 The calculations are summarized in Table 3. 18
Peak Activity Days per year are assumed to be Weekends and Federal Holidays equaling 115 days 19 and Off Peak Activity Days per year are the rest of the days of the year. For the boat ramps, RV 20 camping, cabin rentals, and tent camping, half of the facility users would be couples and half would 21 be families of four resulting in the average number of users per occasion being three persons. 22 Fishing, nature/hiking trails, and wildlife viewing were assumed to be individual users so the 23 number of users per occasions was one. 24
Boat Ramp-Benefits per lane with “X” number of parking spots 25 Peak Activity Days: Two boats per hour would launch or take out per day during 12 hour days, 24 26 launches/take outs X 3 persons per occasion = 72 users per day. 27 Off Peak Activity Days: One boat per hour would launch or take out per day during 12 hour days, 28 12 launches/take outs X 3 persons = 36 users per day. 29
RV Camping - “X” number of pads with hook-ups, bath house, playground, etc. 30 Peak Activity Days: One RV per day X 3 persons = 3 users per day. 31 Off Peak Activity Days: One RV every other day or one half RV per day 0.5 X 3 persons = 1.5 32 users per day. 33
Tent Camping-“X” number of camp sites with bath house, playground, etc. 34 Peak Activity Days: One Camping Group per day X 3 persons = 3 users per day. 35
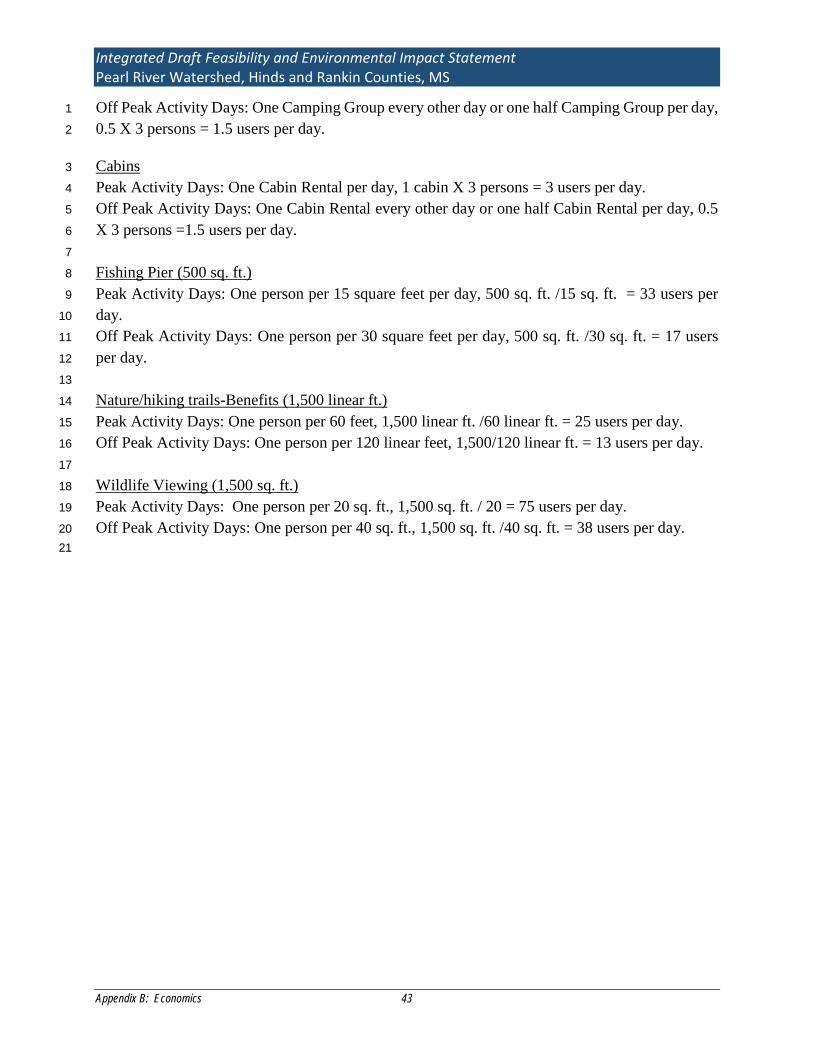
Integrated Draft Feasibility and Environmental Impact Statement Pearl River Watershed, Hinds and Rankin Counties, MS
Appendix B: Economics 43
Off Peak Activity Days: One Camping Group every other day or one half Camping Group per day, 1 0.5 X 3 persons = 1.5 users per day. 2
Cabins 3 Peak Activity Days: One Cabin Rental per day, 1 cabin X 3 persons = 3 users per day. 4 Off Peak Activity Days: One Cabin Rental every other day or one half Cabin Rental per day, 0.5 5 X 3 persons =1.5 users per day. 6 7 Fishing Pier (500 sq. ft.) 8 Peak Activity Days: One person per 15 square feet per day, 500 sq. ft. /15 sq. ft. = 33 users per 9 day. 10 Off Peak Activity Days: One person per 30 square feet per day, 500 sq. ft. /30 sq. ft. = 17 users 11 per day. 12 13 Nature/hiking trails-Benefits (1,500 linear ft.) 14 Peak Activity Days: One person per 60 feet, 1,500 linear ft. /60 linear ft. = 25 users per day. 15 Off Peak Activity Days: One person per 120 linear feet, 1,500/120 linear ft. = 13 users per day. 16 17 Wildlife Viewing (1,500 sq. ft.) 18 Peak Activity Days: One person per 20 sq. ft., 1,500 sq. ft. / 20 = 75 users per day. 19 Off Peak Activity Days: One person per 40 sq. ft., 1,500 sq. ft. /40 sq. ft. = 38 users per day. 20 21
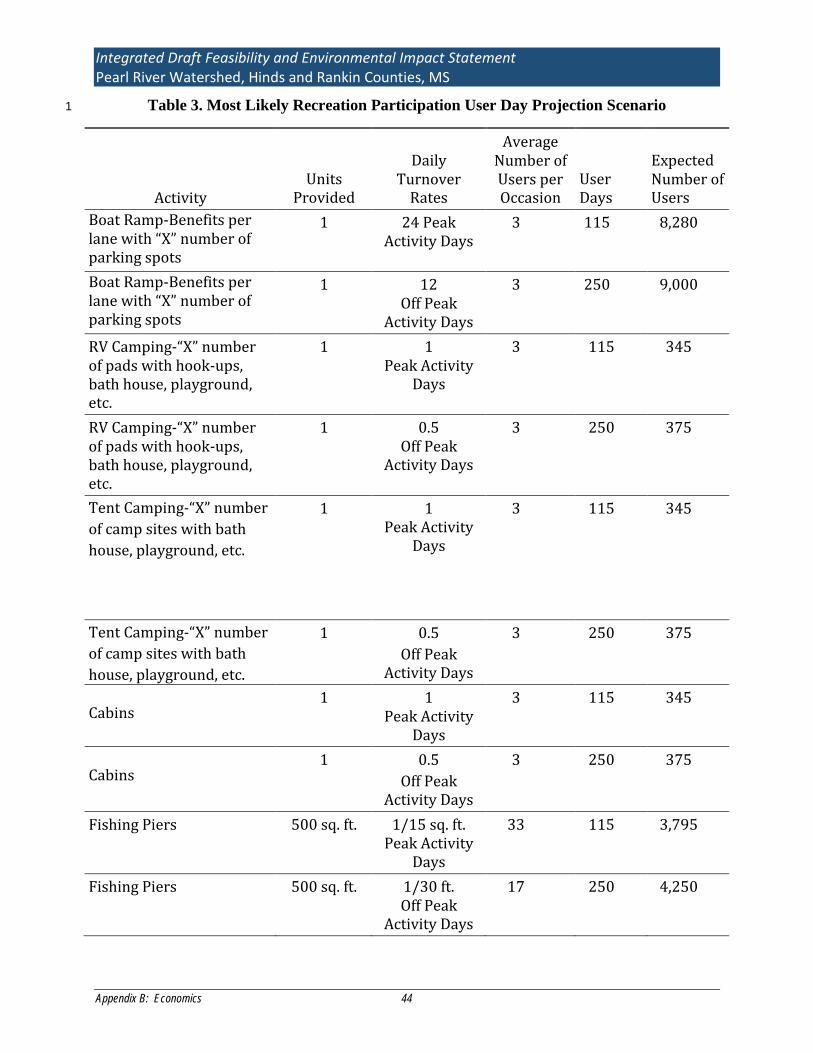
Integrated Draft Feasibility and Environmental Impact Statement Pearl River Watershed, Hinds and Rankin Counties, MS
Appendix B: Economics 44
Table 3. Most Likely Recreation Participation User Day Projection Scenario 1
Activity Units
Provided
Daily Turnover
Rates
Average Number of Users per Occasion
User Days
Expected Number of Users
Boat Ramp-Benefits per lane with “X” number of parking spots
1 24 Peak Activity Days
3 115 8,280
Boat Ramp-Benefits per lane with “X” number of parking spots
1 12 Off Peak
Activity Days
3 250 9,000
RV Camping-“X” number of pads with hook-ups, bath house, playground, etc.
1 1 Peak Activity
Days
3 115 345
RV Camping-“X” number of pads with hook-ups, bath house, playground, etc.
1 0.5 Off Peak
Activity Days
3 250 375
Tent Camping-“X” number of camp sites with bath house, playground, etc.
1 1 Peak Activity
Days
3 115 345
Tent Camping-“X” number of camp sites with bath house, playground, etc.
1 0.5 Off Peak
Activity Days
3 250 375
Cabins 1 1
Peak Activity Days
3 115 345
Cabins 1 0.5
Off Peak Activity Days
3 250 375
Fishing Piers 500 sq. ft. 1/15 sq. ft. Peak Activity
Days
33 115 3,795
Fishing Piers 500 sq. ft. 1/30 ft. Off Peak
Activity Days
17 250 4,250
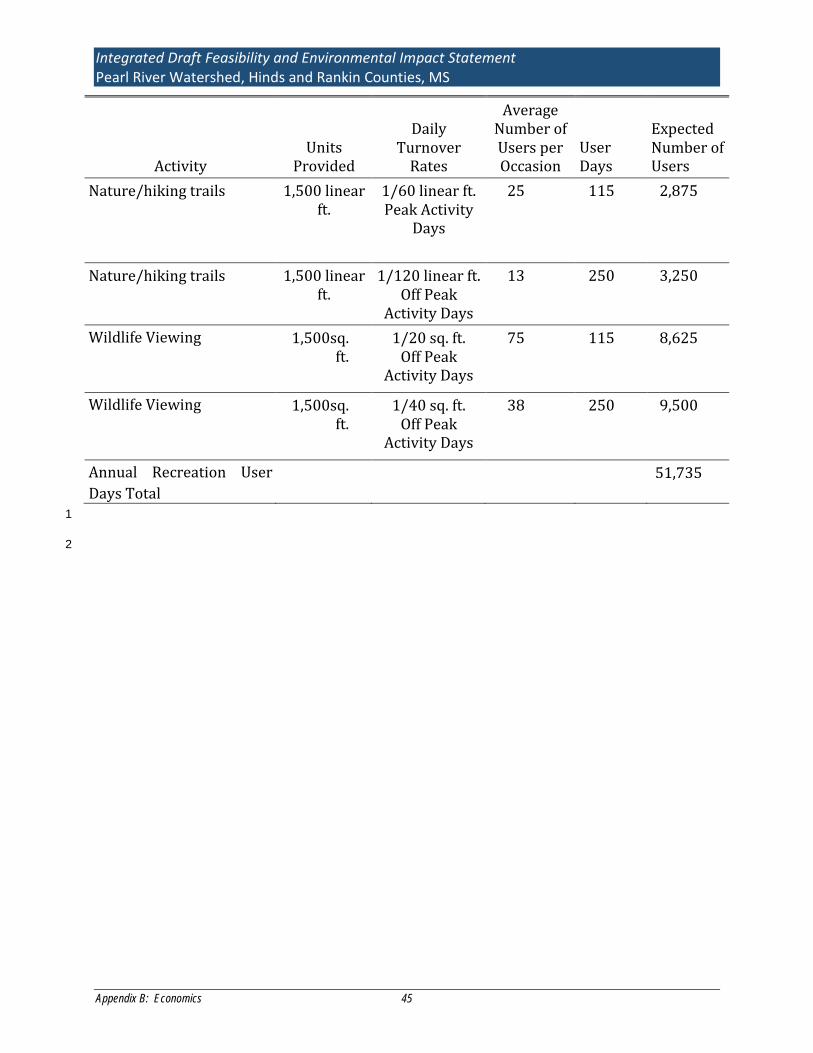
Integrated Draft Feasibility and Environmental Impact Statement Pearl River Watershed, Hinds and Rankin Counties, MS
Appendix B: Economics 45
Activity Units
Provided
Daily Turnover
Rates
Average Number of Users per Occasion
User Days
Expected Number of Users
Nature/hiking trails 1,500 linear ft.
1/60 linear ft. Peak Activity
Days
25 115 2,875
Nature/hiking trails 1,500 linear ft.
1/120 linear ft. Off Peak
Activity Days
13 250 3,250
Wildlife Viewing
1,500sq. ft.
1/20 sq. ft. Off Peak
Activity Days
75 115 8,625
Wildlife Viewing
1,500sq. ft.
1/40 sq. ft. Off Peak
Activity Days
38 250 9,500
Annual Recreation User Days Total
51,735
1
2
Integrated Draft Feasibility and Environmental Impact Statement Pearl River Watershed, Hinds and Rankin Counties, MS
Appendix B: Economics 46
1
2
3
4
5
6
7
8
9
10
11
This Page Intentionally Left Blank 12
13