pearl millet (pennisetum glaucum) contrasting for the...
TRANSCRIPT
Pearl millet (Pennisetum glaucum) contrasting for the transpirationresponse to vapour pressure deficit also differ in their dependenceon the symplastic and apoplastic water transport pathways
Murugesan TharanyaA,B, Kaliamoorthy SivasakthiA,B, Gloria BarzanaA, Jana KholováA,Thiyagarajan ThirunalasundariB and Vincent VadezA,C,D
AInternational Crops Research Institute for the Semi-Arid Tropics (ICRISAT), Crop Physiology Laboratory,Patancheru 502324, Telangana, India.
BBharathidasan University, Tiruchirappalli 620 024, Tamilnadu, India.CInstitut de Recherche pour le Developpement (IRD) – Université de Montpellier – UMR DIADE,911 Avenue Agropolis, BP 64501, 34394 Montpellier cedex 5, France.
DCorresponding author. Emails: [email protected]; [email protected]
Abstract. Genotypic differences in transpiration rate responses to high vapour pressure deficit (VPD)was earlier reported.Here we tested the hypothesis that this limitation could relate to different degrees of dependence on the apoplastic (spacesbetween cells), and symplasticwater transport pathways (through cells via aquaporin-facilitated transport),which are knownto have different hydraulic conductivities. The low transpiration rate (Tr) genotype PRLT 2/89/33 either restricted itstranspiration under high VPD, or was more sensitive to VPD than H77/833-2, when grown hydroponically or in soil.The slope of the transpiration response to an ascending series of VPD was lower in whole plants than in de-rooted shoots.In addition, the transpiration response of detached leaves to moderately high VPD (2.67 kPa), normalised against leavesexposed to constant VPD (1.27 kPa), was similar in low and high Tr genotypes. This suggested that roots hydraulics werea substantial limitation to water flow in pearl millet, especially under high VPD. The dependence on the apoplastic andsymplastic water transport pathways was investigated by assessing the transpiration response of plants treated withinhibitors specific to the AQP-mediated symplastic pathway (AgNO3 andH2O2) and to the apoplastic pathway (precipitatesof Cu(Fe(CN)6) or Cu(CuFe(CN)6)). When CuSO4 alone was used, Cu ions caused an inhibition of transpiration in bothgenotypes and more so in H77/833-2. The transpiration of high Tr H77/833-2 was decreased more by AQP inhibitorsunder lowVPD (1.8 kPa) than in PRLT 2/89/33, whereas under high VPD (4.2 kPa), the transpiration of PRLT 2/89/33 wasdecreased more by AQP inhibitors than in H77/833-2. The transpiration rate of detached leaves from H77/833-2 whentreated with AgNO3 decreased more than in PRLT 2/89/33. Although the root hydraulic conductivity of both genotypeswas similar, it decreased more upon the application of a symplastic inhibitor in H77/833-2. The transpiration of low TrPRLT 2/89/33 was decreased more by apoplastic inhibitors under both low and high VPD. Then the hydraulic conductivitydecreased more upon the application of an apoplastic inhibitor in PRLT 2/89/33. In conclusion, both pathways contributedto water transport, and their contribution varied with environmental conditions and genotypes. Roots were a main sourceof hydraulic limitation in these genotypes of pearl millet, although a leaf limitation was not excluded. The similaritybetween genotypes in root hydraulic conductivity under normal conditions also suggests changes in this conductivityupon changes in the evaporative demand. The low Tr genotype depended more on the apoplastic pathway for watertransport, whereas the high Tr genotype depended on both pathway, may be by ‘tuning-up’ the symplastic pathway underhigh transpiration demand, very likely via the involvement of aquaporins.
Additional keywords: apoplastic pathway, aquaporins, aquaporin inhibitors, hydraulic conductance, transpiration, VPD.
Received 18 October 2016, accepted 17 January 2018, published online 13 March 2018
Introduction
Pearl millet is a well-adapted crop to dry conditions, butwater limitation remains the major constraint to its production(Mahalakshmi et al. 1987). Previouswork has shown that a lowertranspiration rate, especially under high vapour pressure deficit(VPD) contributed to small but critical water savings during the
vegetative stage (Kholová et al. 2010a, 2010b; Kholová andVadez 2013) that led to increased yield under terminal droughtin pearl millet (Vadez et al. 2013a). This mechanism hasbeen described in other species (soybean – Sinclair et al. 2008;sorghum – Gholipoor et al. 2010; peanut – Devi et al. 2010;chickpea - Zaman-Allah et al. 2011a) and its benefits for crops
CSIRO PUBLISHING
Functional Plant Biologyhttps://doi.org/10.1071/FP17161
Journal compilation � CSIRO 2018 www.publish.csiro.au/journals/fpb
production under terminal stress limitations were shown(Sinclair et al. 2005, 2010; Zaman-Allah et al. 2011b; Vadezet al. 2013b, 2014). A review of the different types oftranspiration response showed that differences could either belinear with genotypic differences in the slope and interceptof the transpiration response, or with a breakpoint in thisresponse and genotypic differences in the breakpoint valueand/or the slope of the response before or after the breakpoint(Vadez et al. 2013b), in both cases resulting in transpirationrate (Tr) differences allowing water savings. The underlyingphysiological mechanisms responsible for such plants responsesto the atmospheric stimuli are still largely unexplained. Inearlier work in pearl millet, we hypothesised that hydraulicsignals may be responsible for the rapid stomatal responseto an increase in VPD (Vadez 2014). For instance, in soybean,Sinclair and colleagues (2008) showed that hydraulic limitationwas indeed the cause for the transpiration restriction, andleaves were interpreted to be the location of this limitation.Similar conclusion was drawn in a study between twosorghum genotypes contrasting for the transpiration responseto VPD in sorghum (Choudhary et al. 2013). In two studies inwheat roots, hydraulics was shown to be the main causelimiting water movement (Kudoyarova et al. 2011; Schoppachet al. 2014). In one of these studies, the root hydrauliclimitation was explained by smaller meta-xylem vessels, thinnerendodermis and a smaller population of mercury-sensitiveaquaporins in the roots (Schoppach et al. 2014). The otherstudy in wheat also concluded that the mercury-sensitivityof root aquaporin explained the root hydraulic limitation, andfurther, showed a role of ABA accumulating preferentially inthe roots in restoring root hydraulic conductivity (Kudoyarovaet al. 2011). Therefore, assuming the cause of lower Tr inPRLT 2/89-33 is a hydraulic limitation, the first objective ofthis work was to locate this putative hydraulic limitation, eitherin the root or in the shoot, and determine whether there wasany genotypic difference in it. This was addressed by comparingtranspiration response across a range of VPD conditions inwhole plants, de-rooted shoot, or detached leaves, of low andhigh Tr genotypes.
The movement of water through plant tissues to the xylemin the root cylinder, or from the xylem in the leaves, occursthrough both the cell-to-cell and apoplastic pathways (Steudle2000a, 2000b). The dominant pathway has been exploredin maize, barley, rice, wheat and lupins, and the conclusionis generally that water flow occurs via a combination of thesepathways (see Steudle 2000a; Ranathunge et al. 2005; Bramleyet al. 2009; Knipfer et al. 2011). However, whether thepredominance of either pathway changes with the evaporativedemand is unknown, and is important to address this tounderstand how plants’ transpiration adapts to these changes.The transport in the cell-to-cell pathway can occur viaplasmodesmata and/or by crossing membranes. The drivingforce in the cell-to-cell pathway can be osmotic and/orhydrostatic, the former being in the absence of transpiration,e.g. at night. The cell-to-cell water transport may involvespecialised membrane transporters called aquaporins (AQP),wherein the apoplastic water transport involves a watermovement in the intercellular space, driven by gradient ofhydrostatic pressure. So far the cell-to-cell (hereafter called
‘AQP-mediated’) water transport pathway has been exploredin several crops like wheat (Bramley et al. 2009), soybean(Sadok and Sinclair 2010a), barley (Knipfer et al. 2011),peanut (Devi et al. 2012), sorghum (Choudhary et al. 2013),whereas the apoplastic water transport has been studied in maize(Zimmermann and Steudle 1998), rice (Ranathunge et al. 2005)and lupin (Bramley et al. 2009). The preferred pathway differsamong species, organs, developmental stage and environmentalparameters (Johansson et al. 2000). For instance, a study byBramley et al. (2009) showed that lupin uses predominantly theapoplastic pathway, whereas much of the water movement inthe roots of wheat was through the AQP-mediated pathway.
To date there has been no study to assess possible intra-species variation in the dependence on either one pathway, orwhether the dependence on either one pathway varies with theevaporative demand. This is an important gap for our researchtopic because there is still controversy as to which pathwayhas the highest water conductivity (Steudle 2000a; Javotand Maurel 2002). Assuming there are indeed conductivitydifferences between the two pathways, differences in therespective proportion of water going through either pathwaymight then lead to differences in the overall hydraulicconductivity, and could then be linked with how planttranspiration responds to environmental stimuli. Several studieshave shown that higher hydraulic conductivity of the root isclosely linked to increases in expression of several aquaporingenes (e.g.; Ehlert et al. 2009; Hachez and Chaumont 2010;Knipfer et al. 2011), indicating that plants have the capacity toincrease the hydraulic conductivity of the roots by altering theAQP-mediated pathway of water transport, as it was found inthe roots of wheat under ABA control (Kudoyarova et al. 2011).By contrast and intuitively, although a recent report concludedto the contrary (Cuneo et al. 2016), species, or genotypes, thatare more dependent on the apoplastic pathway for watertransport would not have this flexibility since the apoplasticspace depends on the cell sizes and arrangement between oneanother, offering a frame that is somewhat fixed once cells arefully developed. Therefore, the main hypothesis of the presentwork was that genotypes of pearl millet contrasting for thetranspiration rate across a range of low to high VPD conditionswill vary in their dependence on either of the AQP-mediatedor apoplastic pathways. It has been reported that to test theapoplastic pathway inhibition, combination of K4(Fe(CN)6) andCuSO4 can be used (Ranathunge et al. 2005). In contrast, therewere also reports where Cu salt is used for the inhibition ofAQP-mediated pathway (Ligaba et al. 2011). So the effect ofCuSO4 alone was also tested along with the combined effectof K4(Fe(CN)6) and CuSO4 on plant transpiration responseto vapour pressure deficit.
Hence, the main objective of this study was to locate aputative hydraulic limitation to water movement in pearl milletand characterise the water transport pathways in genotypesthat have been previously found to contrast for their responseto atmospheric stimuli (VPD).Specifically,weaimed to: (i) assesswhich of the shoot or the root appeared to be responsiblefor putative hydraulic limitations during the response oftranspiration to high VPD, (ii) evaluate plants’ transpirationresponse to water transport pathways inhibitors under low andhigh VPD regimes; and (iii) evaluate plant organs’ conductance
B Functional Plant Biology M. Tharanya et al.
(leaves/roots) under regular conditions and upon action ofinhibitors of various water transport pathways.
Materials and methodsPlant material and plant growth
Two pearl millet (Pennisetum glaucum (L.) R.Br.) genotypes;PRLT 2/89-33 (low Tr) and H77/833-2 (high Tr) differing forterminal drought tolerance under field conditions were selectedfor the study (Yadav et al.2002;Serraj et al.2005). PRLT2/89-33has low Tr and shows restriction in transpiration rate toincreasing VPD whereas H77/833-2 has high Tr and showsa linear transpiration rate response to raising VPD (Kholováet al. 2010b; Vadez et al. 2015). PRLT 2/89-33 was derivedfrom the ICRISAT Bold Seeded Early Composite, which isan elite breeding population based largely on Iniadi landracegermplasm fromWestAfrica (Andrews andAnandKumar1996).This Iniadi germplasm is known for better grain filling underterminal drought stress conditions. H77/833-2 is the male parentof several thermo tolerant, extra early, high tillering and highyielding pearl millet hybrids including HHB67.
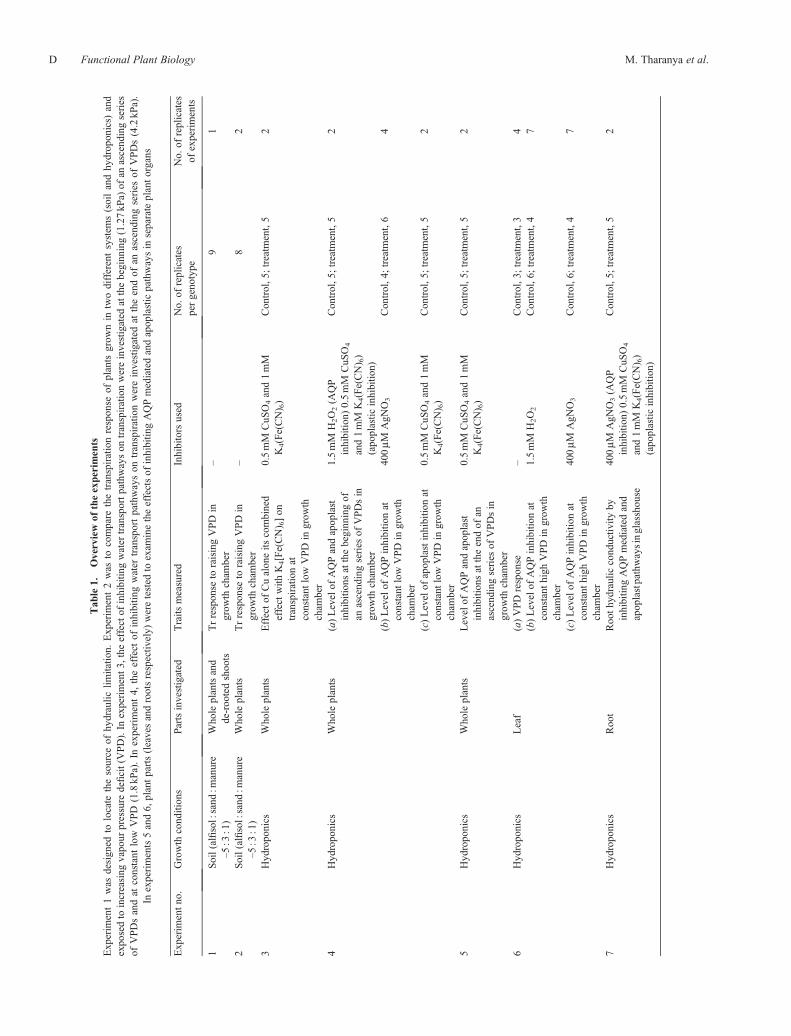
For all experiments (see experimental summaries in Table 1)the plants were grown in glasshouse conditions under naturalday-light oscillations and with day/night average temperaturearound 28/22�C and RH 70/90%. Intact plants were grown inboth soil, using 4 L pots and hydroponic solutions, using 350mLErlenmeyer flasks. The purpose of growing plants in bothconditions was 2-fold: (i) first to confirm that the VPD responseof transpiration was similar in hydroponic conditions, whereroots develop differently from soil conditions (Peterson 1988;Zimmermann and Steudle 1998; Freundl et al. 2000); (ii) toallow for the application of inhibitors. For the soil grown plants,the pot filling used was a mixture of soil, sand and manure(5 : 3 : 1) and two seeds per hill sown in three hills. Themanure used was approximately 1 year old, processed fromcow dung. Di-ammonium phosphate and urea, at a rate of 1 gpot–1, was applied after thinning on the secondweek after sowingand plants were thinned to maintain a single plant per pot. Forthe hydroponic plants, the seeds were sown in sand irrigated withnutrient solution (modified Hoagland solution; macronutrients:MgSO4 (2.05mM), K2SO4 (1.25mM), CaCl2*2H2O (3.3mM),KH2PO4 (0.5mM), Fe-EDTA (0.04mM), urea (5mM) andmicronutrients: H3BO3 (4mM), MnSO4 (6.6mM), ZnSO4
(1.55mM), CuSO4 (1.55mM), CoSO4 (0.12mM), Na2MoO4
(0.12mM)). At the 3rd leaf stage they were transferred tothe trays containing nutrient solution. The pH of the nutrientsolution was maintained between 6.0 and 6.3. Aeration wascontinuously provided to enable the nutrient absorption bythe roots. The nutrient solution was changed once every3 days. At 4th leaf stage, plants were transferred into theErlenmeyer flasks and grown until the end of the experiment(either 6th or 7th leaf stage).
Transpiration response to increasing VPD in soil-grownde-rooted shoot and whole plantsThe purpose of this experiment was to compare the transpirationresponse to increasing VPD in both whole plants and de-rootedshoots, as an attempt to locate a putative source of hydrauliclimitation in the root or the shoot. Hypothetically, a limitation
in the roots would lead to a higher transpiration of de-rootedshoots, especially under high VPD conditions. Whole plantswere acclimatised for an entire day in the growth chamber, toadapt to the daytime regime (06:30–18 : 30 hours) at a VPD of1.8 kPa and night-time regime (19:30–05 : 30 hours) at a VPDof 0.9 kPa. The 1 hour time between 05 : 30 and 06 : 30 and 18 : 30to 19 : 30 hours was used for a gradual transition in the conditionsbetween day/night. The plants were exposed to a light intensityof ~550mmol at plant canopy level. VPD levels were obtainedby simultaneously increasing the temperature and decreasing therelative humidity (see Table S1, available as SupplementaryMaterial to this paper, for details of the ranges that were used).This has the drawback of having two factors involved inchanging the VPD. Although this is a natural phenomenon, thecaveat was in not being able to distinguish VPD effects froma potential temperature effect. A temperature and relativehumidity data logger (Lascar Electronics) was positioned atthe plant canopy level to record the temperature and humidityevery 5min inside the chamber until the end of experiment.Pots were brought to field capacity and a layer of plastic beadswas added to avoid direct evaporation of water from the soil.For the preparation of de-rooted shoots, whole plants werede-rooted from soil in the following early morning (around05:00–06 : 00 hours), on the day of the experiment. The soilparticles were washed and root was immersed in deionisedwater. The de-rooted shoots (Fig. S1, available as SupplementaryMaterial to this paper) were then prepared by severing theshoot from the root at the hypocotyl region. These de-rootedshoots were then rapidly placed in flasks containing 0.1mMEDTA (Kholová et al. 2010a). EDTA was used to preservethe tissues and avoid the oxidative stress (Habiba et al. 2015)due to de-rooting injury. The mouths of the flasks werewrapped with aluminium foil to avoid direct evaporation. Theywere then placed in a dark room for an hour. Later on the de-rooted shoots were gradually exposed to light (ranging from 120to 550mmol) at a low VPD (0.60 kPa) for 2 h. Whole plants usedfor the experiment were exposed to the same pre-experimentalconditions. Thereafter, the whole plants and de-rooted shootswere exposed to an ascending series of VPDs ranging from 0.60(24�C/80% RH) to 4.2 kPa (40�C/43% RH) (temperature wasgradually raised to achieve higher VPD; Table S1 for a full detailof T�C and RH% conditions). Each VPD was maintained foran hour and a 15min transition time was allowed betweensuccessive VPD levels. These protocols were used earlier tocharacterise the transpiration response across a range of VPDconditions (e.g. Kholová et al. 2010b). The transpiration valueswere recorded for 1 hour at each VPD level, by successiveweighing of pots/flasks with an analytical balance (KERN3600-2N, Kern and Sohn GmbH). At the end of theexperiment, leaf area was recorded using leaf area meter (LI-3100C area meter, LI-COR BioSciences) to calculate thetranspiration rate, Tr (mg water loss cm–2 min–1).
Transpiration response to VPD in plants grown in soiland in hydroponic
Both types of plants (soil, hydroponic) were grown in theglasshouse under natural daylight oscillations and with day/night average temperature around 31/22�C and RH 40/55%.
Water transport pathway and sensitivity to VPD Functional Plant Biology C
Tab
le1.
Overviewof
theexperiments
Experim
ent1was
designed
tolocate
thesource
ofhydraulic
limitatio
n.Experim
ent2was
tocompare
thetranspirationresponse
ofplants
grow
nin
twodifferentsystem
s(soilandhydroponics)
and
exposedto
increasing
vapo
urpressure
deficit(VPD).In
experiment3,
theeffectof
inhibitin
gwater
transportp
athw
ayson
transpirationwereinvestigated
atthebeginning(1.27kP
a)of
anascendingseries
ofVPDsandat
constant
low
VPD
(1.8kP
a).In
experiment4,
theeffect
ofinhibitin
gwater
transportpathwayson
transpirationwereinvestigated
attheendof
anascendingseries
ofVPDs(4.2kP
a).
Inexperiments5and6,
plantparts(leavesandrootsrespectiv
ely)
weretested
toexam
inetheeffectsof
inhibitin
gAQPmediatedandapoplasticpathwaysin
separateplantorgans
Experim
entno.
Growth
conditions
Partsinvestigated
Traits
measured
Inhibitorsused
No.
ofreplicates
pergeno
type
No.
ofreplicates
ofexperiments
1Soil(alfisol:sand
:manure
–5:3
:1)
Wholeplantsand
de-roo
tedshoo
tsTrrespon
seto
raisingVPDin
grow
thcham
ber
–9
1
2Soil(alfisol:sand
:manure
–5:3
:1)
Wholeplants
Trrespon
seto
raisingVPDin
grow
thcham
ber
–8
2
3Hyd
ropo
nics
Wholeplants
Effectof
Cualon
eits
combined
effectwith
K4[Fe(CN) 6]on
transpirationat
constant
lowVPDin
grow
thcham
ber
0.5mM
CuS
O4and1mM
K4(Fe(CN) 6)
Con
trol,5
;treatm
ent,5
2
4Hyd
ropo
nics
Wholeplants
(a)Levelof
AQPandapop
last
inhibitio
nsatthebeginn
ingof
anascendingseries
ofVPDsin
grow
thcham
ber
1.5mM
H2O2(A
QP
inhibitio
n)0.5mM
CuS
O4
and1mM
K4(Fe(CN) 6)
(apo
plastic
inhibitio
n)
Con
trol,5
;treatm
ent,5
2
(b)Levelof
AQPinhibitio
nat
constant
lowVPDin
grow
thcham
ber
400mM
AgN
O3
Con
trol,4
;treatm
ent,6
4
(c)Levelof
apop
lastinhibitio
nat
constant
lowVPDin
grow
thcham
ber
0.5mM
CuS
O4and1mM
K4(Fe(CN) 6)
Con
trol,5
;treatm
ent,5
2
5Hyd
ropo
nics
Wholeplants
Levelof
AQPandapop
last
inhibitio
nsattheendof
anascendingseries
ofVPDsin
grow
thcham
ber
0.5mM
CuS
O4and1mM
K4(Fe(CN) 6)
Con
trol,5
;treatm
ent,5
2
6Hyd
ropo
nics
Leaf
(a)VPDrespon
se–
Con
trol,3
;treatm
ent,3
4(b)Levelof
AQPinhibitio
nat
constant
high
VPDin
grow
thcham
ber
1.5mM
H2O2
Con
trol,6
;treatm
ent,4
7
(c)Levelof
AQPinhibitio
nat
constant
high
VPDin
grow
thcham
ber
400mM
AgN
O3
Con
trol,6
;treatm
ent,4
7
7Hyd
ropo
nics
Root
Roo
thyd
rauliccond
uctiv
ityby
inhibitin
gAQPmediatedand
apop
lastpathwaysinglasshouse
400mM
AgN
O3(A
QP
inhibitio
n)0.5mM
CuS
O4
and1mM
K4(Fe(CN) 6)
(apo
plastic
inhibitio
n)
Con
trol,5
;treatm
ent,5
2
D Functional Plant Biology M. Tharanya et al.
One day before experimenting the transpiration responseto increasing VPD, the plants were moved to the growthchambers and acclimatised to the daytime regime (06 : 30 to18 : 30 hours) at a VPD of 1.8 kPa (31�C/60% RH) and night-time regime (19 : 30 to 05 : 30 hours) at a VPD of 0.9 kPa (27�C/75% RH) (see Table S1 for a full detail of T�C and RH%conditions). On that day, the soil grown plants were broughtto field capacity and a layer of beads was added over the soilto reduce soil evaporation, while the mouths of the flasks withhydroponically grown plants were covered with aluminium foilto avoid direct evaporation. The following morning, on the dayof the experiment, a measured amount of fresh solution wasgiven back in case of hydroponic plants. Hereafter, the VPDwas gradually increased to several steps maintaining each VPDfor an hour (covering a range of VPD values between 1 (31�C/60% RH) and 4 kPa (38�C/40% RH)) (see Table S1 for a fulldetail of T�C and RH% conditions). Again, changing VPD bychanging both RH% and temperature dismissed the possibilityto assess possible temperature effects on the transpiration.However, it should be mentioned that pearl millet is commonlyexposed to these temperature regimes innature.BetweensuccessiveVPD steps, a 15min transition was allowed to adjust and stabilisethe conditions in the growth chamber. Weighing was done duringthe transition period so that the weight loss due to transpirationwas recorded before and after VPD change. At the end of theexperiments, leaf area was recorded to calculate the transpirationrate (mg water loss cm–2 min–1).
Transpiration response to increasing VPD in soil-growndetached leaves
For detached leaf experiments, single leaves of identicalposition (6th or 7th leaf) were collected on the day of theexperiment, from soil grown plant of both genotypes. At thatstage of the plant development there was no or very limitedtillering and therefore the leaves from the main stem were used.The initial cut was done with scissors and the cut leaves wererapidly put in deionised water to avoid exposure of the cut partto the air. The cut part was then re-cut under water. To avoidclogging of the vessels, re-cutting was done again under0.1mM EDTA (Na2 + EDTA� 2H2O; Kholová et al. 2010a),and leaves inserted in test tubes containing 50mL of 0.1mMEDTA, earlier prepared with their mouths wrapped withparafilm. The detached leaves were inserted into the test tubesby piercing the parafilm and the mouth of the test tubes waswrapped with aluminium foil to avoid direct evaporation. Eachreplication consisted of three test tubes, each containing oneindividual leaf, and these were placed on a 0.01 g precisionbalance (KERN 3600-2N, Kern and Sohn GmbH) witha 0.01 g precision where the weight loss due to transpirationwas recorded every 20min. The period during which thetranspiration of detached leaves (three replicates per genotype)remained constant had been earlier evaluated to be at least 5 hafter detaching and the experiments were designed not to exceedthis time span. The test tubes containing leaves were placedin two different chambers, one with the VPD of 1.27 kPa (30�C/70% RH) throughout the experiment and the other chamberwith 1.27 kPa VPD for a period of 2 h and then with 2.65 kPa(35�C/53%) for 2.5 hours. At the end of the experiment, leaf area
was measured using a LI3000 (LI-COR BioSciences) leafarea meter.
Inhibition of AQP-mediated and apoplastic pathwaysin hydroponic plantsFor the inhibition of the AQP-mediated water transport pathwayof whole plants (Experiments 6 and 7), an initial standardisationhadbeendone to test theoptimumstageof the plant. For this, threesets of hydroponically grown plants differing in phenologicalstages (spanning across 21–27DAS, 5th–8th leaf stage) had beeninhibited with 1.5mM H2O2 and 400mM AgNO3. Theseconcentrations of inhibitors had been previously tested onpearl millet (Fig. S2). They were chosen in a way they lead toa transpiration inhibition, in comparison to lower and higherconcentrations, but also allowing at least a partial recovery of thetranspiration after treatment removal from the solution.H2O2wasinitially used and we shifted to AgNO3 for its demonstratedinhibitory effect on transpiration and a relatively easier way touse than H2O2. In this standardisation experiment, a non-significant variation in the level of inhibition among the setshad been observed (data not shown). Therefore, we settled fortesting after the complete development of the 6th leaf, i.e. usuallybetween 24–27 DAS in our temperature conditions. We are alsoaware that other inhibitors were used earlier in other works (Deviet al. 2012), and settled for AgNO3 and H2O2 since these wereable to pinpoint genotypic differences.We chose to not useHgCl2for its unknown effects on other physiological processes.One daybefore experimenting the inhibition responses, the hydroponicplants were move to the growth chambers and acclimatised tothe daytime regime (06 : 30 to 18 : 30 hours) at a VPD of 1.8 kPa(31�C/60%RH) and night-time regime (19 : 30 to 05 : 30 hours) ata VPD of 0.9 kPa (27�C/75% RH). On the day of the experimentthe acclimatised plants were given a measured amount of freshnutrient solution and they were positioned on separate balanceswith 0.01 g accuracy (Kern KB 3600-2N) and their weight loss(due to transpiration) was recorded every 20min. Inhibitors(1.5mM H2O2 and 400mM AgNO3) were applied after 2 h ofinitiating the experiment and subsequently transpiration responseto treatment was followed up for a minimum of 3 h.
According to previous work (Ranathunge et al. 2005) thereaction between 1mM K4(Fe(CN)6) and 0.5mM CuSO4 insidethe root tissues produces rusty brown crystals (precipitates) ofCu2(Fe(CN)6)6 or Cu(CuFe(CN)6) and these restrict theapoplastic water flow. As CuSO4 permeates faster than K4(Fe(CN)6), the K4(Fe(CN)6) was applied first to the hydroponicsolution allowing its slow penetration overnight into the rootapoplast followed by exchange with CuSO4 solution in thefollowing morning (half molarity of CuSO4 was used to assureall molecules react with K4(Fe(CN)6) and to avoid a putativepoisonous effect of copper on root cells). Longer (maximum of4 h) exposure of the plants to 1mM K4(Fe(CN)6) didn’t affecttranspiration and the genotypic difference was not observed(Fig. S3). So the plants were exposed to 1mM K4(Fe(CN)6)overnight that again did not affect the plant transpiration in thefollowing morning hours before the application of CuSO4
(Fig. S4). Thereafter, the solution exchange with 0.5mMCuSO4 resulted in the maximum transpiration inhibition andresolution between genotypes (Fig. S4). The experiment then
Water transport pathway and sensitivity to VPD Functional Plant Biology E
consisted in assessing transpiration for 2 h before CuSO4
application, and then following-up transpiration for at least 3 hafter CuSO4 application. Here to test a putative effect of CuSO4
on transpiration, a set of plants were exposed to CuSO4 onthe day of experiment without the application of 1mM K4(Fe(CN)6) overnight. Then to test the recovery of plant transpiration,inhibitors were removed and the roots were washed. They werethen placed in deionisedH2O and their transpirationwas assessedfor 3 h. The treated roots appeared darker in comparison withuntreated control roots. Free-hand sectioning of root tissues ofboth H77/833-2 and PRLT 2/89/33 were taken from untreatedcontrol and treated plants with K4(Fe(CN)6 and CuSO4 testedfor apoplast inhibition. The sections were cut free-hand, takenfrom a distance of 4–5 cm from the root apex and stained withacid fuchsin dye. Anatomical structures were viewed underlight microscope (Olympus) at 10� 10 magnification andcaptured using camera (Fig. S5A, B). Whether differentgenotypes absorbed different amount of the K4(Fe(CN)6) wasnot tested.
Transpiration response to AQP inhibitionon detached leaves
The transpiration response to AQP inhibition on detached leaveswas tested with leaves collected from soil-grown plants, preparedas in the above section describing the transpiration response toVPD in detached leaves. Initially the inhibition was tested at1.8 kPa (31�C/60% RH) and showed no transpiration inhibitionresponse from the detached leaves (data not shown). Then, thetranspiration response to AQP inhibition was tested at 3.5 kPa(38�C/48% RH). The transpiration was measured initially fora period of 2 h and then the inhibitors (H2O2 and AgNO3) wereinjected into the test tubes by piercing the aluminium foil andparafilm with a needle and syringe. Again, the transpiration wasmonitored for ~3 h. Transpiration was recorded gravimetricallyfor every 30min. At the end of the experiment, leaf area wasmeasured and transpiration rate was calculated.
Root hydraulic measurements
For the measurement of root hydraulic conductivity,hydroponically grown plants were used and the experimentwas conducted in the glasshouse, therefore in plants thatwere exposed to mild VPD conditions, i.e. day/night averagetemperature around 28/17�C and RH 70/80%. No roothydraulic conductivity measurement was done after exposingthe plants to increases in VPD. During hydraulic conductivitymeasurement, the roots of the plants were immersed in smallcontainer with the solution (nutrient solution in case ofuntreated control or deionised water with inhibitors in case oftreatment) and placed in a Scholander pressure chamber (PMSInstruments) and sealed at the hypocotyl level using siliconglue and polyvinylsiloxane (Coltene President Co.). The shootwas then removedwith single cut by razor leaving the de-toppedroots in the chamber (Miyamoto et al. 2001) and the exudedsap was immediately collected using pre-weighed Eppendorfstuffed with tissue paper (Kimtech Science). The sap wascollected at three different pressures (0.1, 0.2 and 0.3MPa).Each pressure was maintained for 15min and the exuded sapwas collected every 5min. The next pressure was applied once
a constant exudation rate was reached. The average valuewas taken and the exudation rate was normalised with rootsurface area and the pressure applied. The root surface areawas determined by scanning them with Shimadzu scannerand analysing with Winrhizo software (Winrhizo, RegentLtd). The measurements were made between 07 : 00 hours till18 : 00 hours. Both the genotypes were measured side by side,which allowed us to compare the root hydraulic conductivitydespite the diurnal effect.
Data analysis
In each experiment, transpiration values (T; g of water loss perunit of time) were divided by leaf area (transpiration rate, Tr; g ofwater loss per unit of time and leaf area (gwater loss cm–2 min–1).In inhibition experiments, Tr data were double normalised toa non-treated control. The first normalisation consisted individing the individual Tr data by the mean Tr of the controlplants for each genotype (transpiration ratio, TrR). To controlpossible plant to plant differences in size and thereforetranspiration, the values of the Tr ratio before the inhibitortreatment were averaged for each replicated plant and theneach individual Tr ratio value was divided by this average(normalised TrR, NTrR). Inhibition effects were thereforecompared on the basis of the NTrR differences. Root hydraulicconductivity was calculated by normalising the root exudationto root surface area, time and pressure applied, and expressed inthe SI unit of ms–1 MPa–1, following similar methodology usedearlier in lupin and wheat (Bramley et al. 2009), tomato (Bárzanaet al. 2012) and maize (Zimmermann and Steudle 1998).
Analysis of variance (ANOVA) was done with statisticalprogram package CoStat ver. 6.204 (Cohort Software). Two-way ANOVA was used to evaluate the effect of treatment andgenotype and their interaction.One-wayANOVAwas conductedto test the effect of treatment within the genotypes. For thestatistical analysis of inhibition experiments, the average valueof stabilisedNTrRafter the inhibition treatmentwereused.Meanswere analysed using Tukey–Kramer test and l.s.d. Tr response toincreasing VPD were analysed with linear and non-linearregressions of Graph pad prism ver. 6 (Graph pad software Inc.).
Results
Transpiration response to VPD of soil-grown whole plants,de-rooted shoots, detached leaves, and plants grownin hydroponics
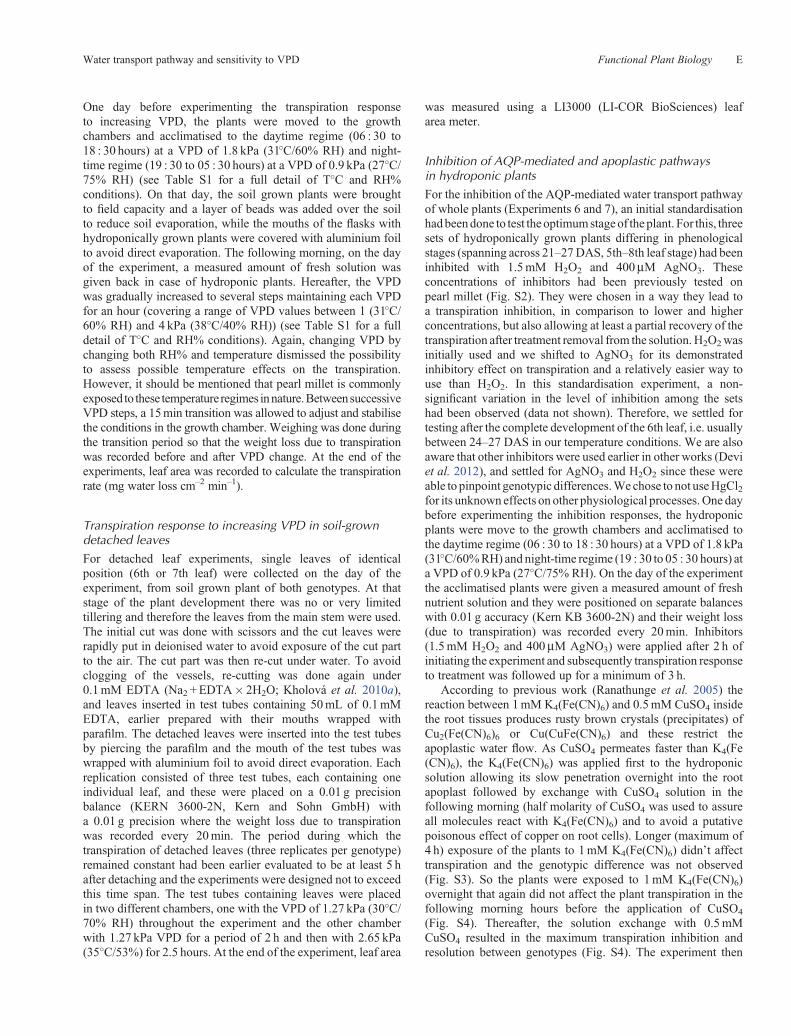
The de-rooted shoot, exposed to an ascending series of VPDs(range of 0.67 to 4.2 kPa), had higher Tr than the whole plantsin both genotypes (Fig. 1). The de-rooted shoots of H77/833-2had higher Tr and higher slope value than the de-rooted shootsof PRLT 2/89-33 (Table 2). In the case of H77/833-2, thetranspiration response to increasing VPD was linear for bothde-rooted shoots and whole plants, although the slope of thelinear response (slope = 0.07) was ~30% higher in de-rootedshoots than for the whole plant (slope = 0.05; see inset inFig. 1). In the case of PRLT 2/89-33, the transpirationresponse of the de-rooted shoot was linear while thetranspiration response of whole plants showed a breakpoint at1.8 kPa (Table 3). The slope value of the de-rooted shoot(slope = 0.04) was ~100% higher than the slope value beyond
F Functional Plant Biology M. Tharanya et al.
the breakpoint (1.8 kPa) in whole plants (slope = 0.02; see insertin Fig. 1). The increase in slope caused by de-rooting was thenlarger in PRLT 2/89-33 (Fig. 1) than in H77/833-2 (Fig. 1).Therefore, de-rooting facilitated water transport to supporttranspiration, especially under high VPD conditions and thenmore so in low Tr PRLT 2/89-33 than in high Tr H77/833-2.
The transpiration response to increasing VPD was alsocompared between soil and hydroponics growth conditions. Inboth growing systems the low Tr genotype PRLT 2/89-33 hadlower Tr than the high Tr genotype H77/833-2 over the wholerange ofVPDconditions (Fig. 2), whichwas in linewith previousresults (Kholová et al.2010b).Hence, the genotypic Tr differenceacross the range of VPD conditions was consistent across bothhydroponics and soil-based growth systems (Fig. 2). The plantsgrown in hydroponics had about twice the transpiration rate (mgof H2O cm–2 min–1; Table 2) of plants grown in soil.
In summary, the genotypic differences in the transpirationresponse to high VPD of whole plants grown in soil identifiedearlier (Kholová et al. 2010a) were confirmed in plants grown inhydroponics and roots limited water transport to supporttranspiration in pearl millet, and more so in low Tr PRLT 2/89-33 than in high Tr H77/833-2, which seemed to have a higherTr capacity than PRLT 2/89-33.
Root hydraulic conductivity under non-inhibited controlcondition
Root hydraulic conductivity measurements were made fromcontrol plants grown in the glasshouse, in two experimentsdescribed below. No genotypic differences in the root hydraulicconductivity (ms–1 MPa–1) were found under non-inhibitedcondition (see the ‘control’ bars in Fig. 3a, b; Table 2).
Transpiration response to VPD in detached leaves
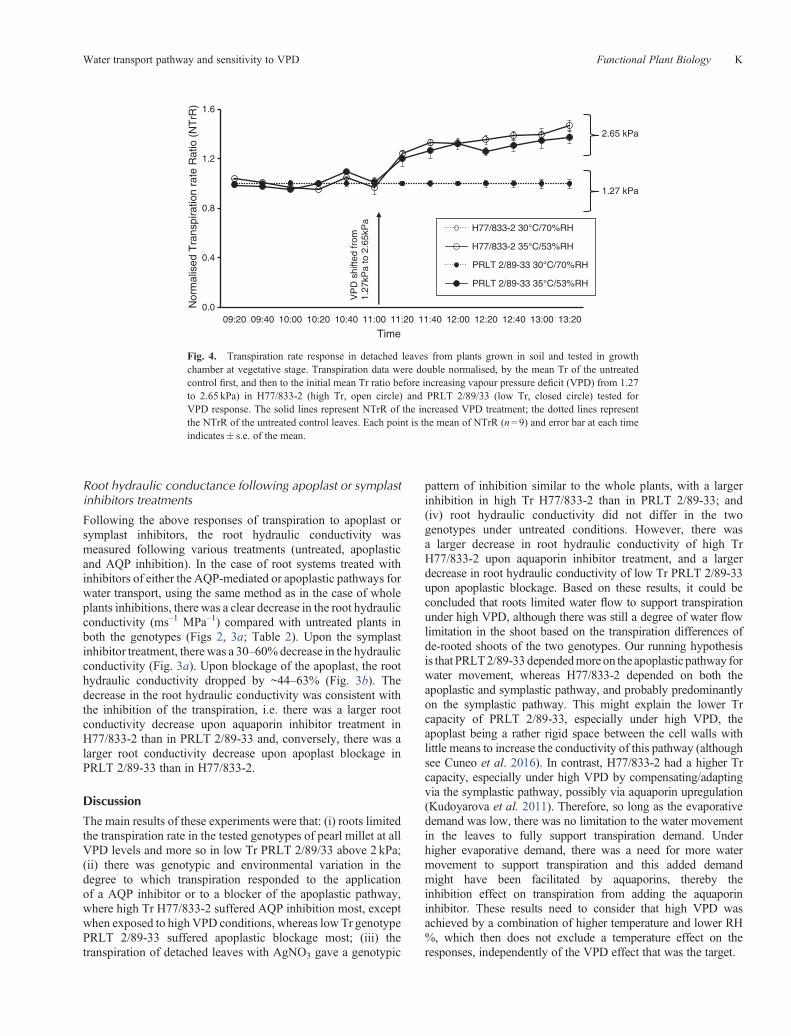
The transpiration rate under varying VPDs was assessed indetached leaves under two VPD conditions (1.27–2.65 kPa).The transpiration was stable and similar in PRLT 2/89-33and H77/833-2 under the low VPD condition (1.27 kPa)before increasing VPD. Upon increasing VPD conditions, thetranspiration of the detached leaves increased by ~30% in thefirst 40min following the VPD increase and then somewhatstabilised or further slightly increased another 5–10%. Also,the transpiration of the low VPD control remained stableuntil ~4 h after harvesting the leaves (Fig. 4). The NTrR(normalised transpiration rate ratio) of detached leaves fromboth the parents, H77/833-2 and PRLT 2/89-33 showedno genotypic difference (Table 2). The transpiration rate
0.40
0.35
0.30
0.25
0.20
0.15
0.10
0.05
0.000 1 2
Vapour pressure deficit (kPa)
H77/833-2 de-rooted shoot
H77/833-2 de-rooted shoot
a
b
b b
c
Slo
pe (
mgH
2O c
m–2
min
–1)
0.04
0.03
0.02
0.01
0
H77/833-2 whole plant
H77/833-2 whole plant
PRLT 2/89-33 de-rooted shoot
PRLT 2/89-33de-rooted
shoot
PRLT 2/89-33whole plant
slope1
PRLT 2/89-33whole plant
slope2
PRLT 2/89-33 whole plant
Tran
spira
tion
rate
(m
gH2O
cm
–2 m
in–1
)
3 4 5
Fig. 1. Comparison of the transpiration rate (Tr) response in whole plants (solid line) and de-rooted shoots (dashed line) of soil grownplants tested in the growth chamber at vegetative stage in genotypes H77/833-2 (high Tr, open circle) and PRLT 2/89-33 (low Tr, closedcircle). Eachpoint is themeanofTr values (n= 9) and the error bars indicate� s.e. of themean.The inset graph represents the slope values ofde-rooted shoot (open bar) andwhole plant (closed bar) of H77/833-2 and PRLT 2/89-33 (before vapour pressure deficit (VPD) breakpoint(slope 1) and after VPD breakpoint (slope 2)). Bars with different letters are significantly different (P < 0.05, Tukey–Kramer test).
Water transport pathway and sensitivity to VPD Functional Plant Biology G
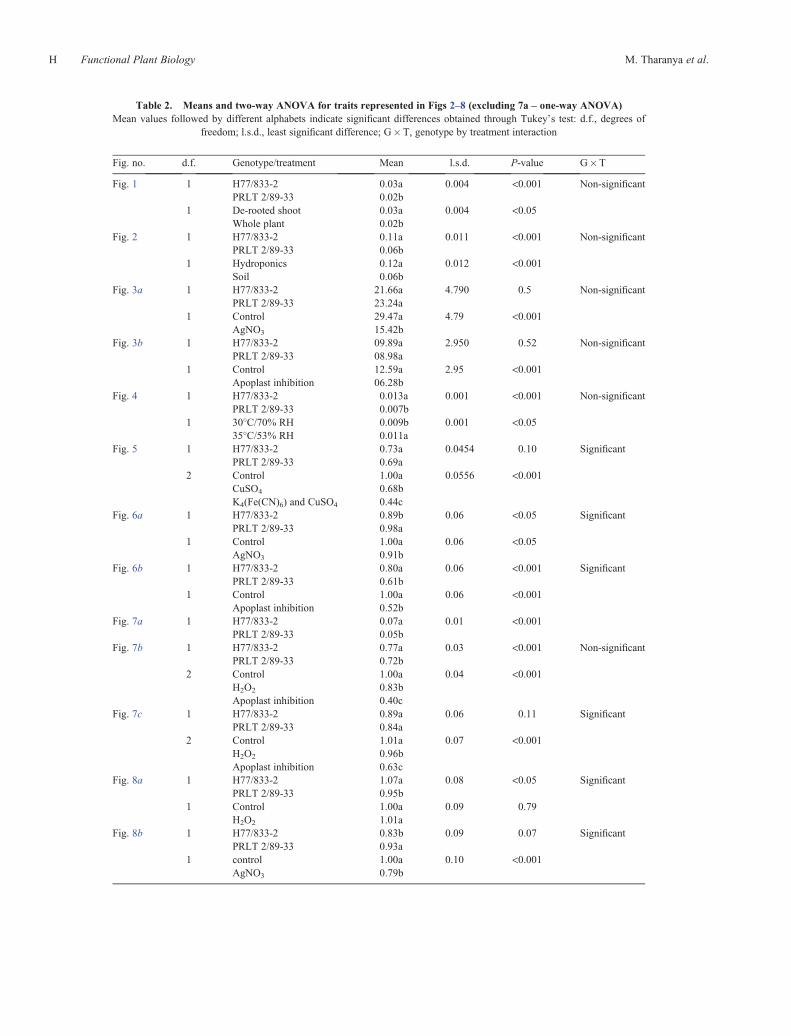
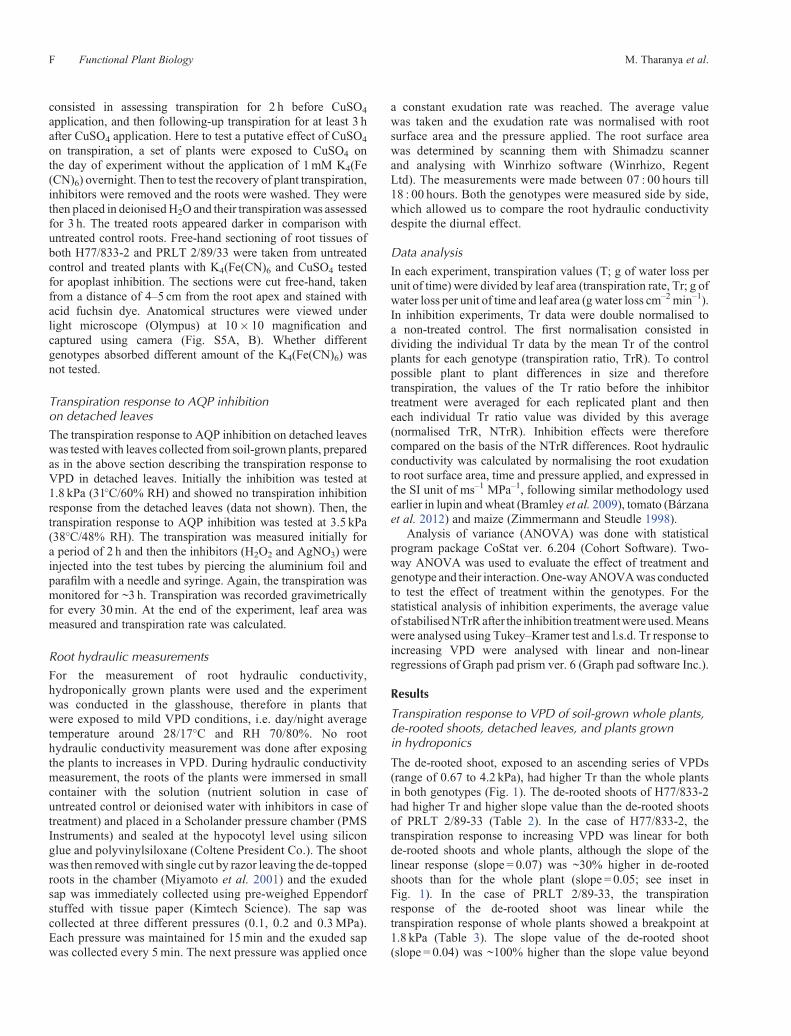
Table 2. Means and two-way ANOVA for traits represented in Figs 2–8 (excluding 7a – one-way ANOVA)Mean values followed by different alphabets indicate significant differences obtained through Tukey’s test: d.f., degrees of
freedom; l.s.d., least significant difference; G�T, genotype by treatment interaction
Fig. no. d.f. Genotype/treatment Mean l.s.d. P-value G�T
Fig. 1 1 H77/833-2 0.03a 0.004 <0.001 Non-significantPRLT 2/89-33 0.02b
1 De-rooted shoot 0.03a 0.004 <0.05Whole plant 0.02b
Fig. 2 1 H77/833-2 0.11a 0.011 <0.001 Non-significantPRLT 2/89-33 0.06b
1 Hydroponics 0.12a 0.012 <0.001Soil 0.06b
Fig. 3a 1 H77/833-2 21.66a 4.790 0.5 Non-significantPRLT 2/89-33 23.24a
1 Control 29.47a 4.79 <0.001AgNO3 15.42b
Fig. 3b 1 H77/833-2 09.89a 2.950 0.52 Non-significantPRLT 2/89-33 08.98a
1 Control 12.59a 2.95 <0.001Apoplast inhibition 06.28b
Fig. 4 1 H77/833-2 0.013a 0.001 <0.001 Non-significantPRLT 2/89-33 0.007b
1 30�C/70% RH 0.009b 0.001 <0.0535�C/53% RH 0.011a
Fig. 5 1 H77/833-2 0.73a 0.0454 0.10 SignificantPRLT 2/89-33 0.69a
2 Control 1.00a 0.0556 <0.001CuSO4 0.68bK4(Fe(CN)6) and CuSO4 0.44c
Fig. 6a 1 H77/833-2 0.89b 0.06 <0.05 SignificantPRLT 2/89-33 0.98a
1 Control 1.00a 0.06 <0.05AgNO3 0.91b
Fig. 6b 1 H77/833-2 0.80a 0.06 <0.001 SignificantPRLT 2/89-33 0.61b
1 Control 1.00a 0.06 <0.001Apoplast inhibition 0.52b
Fig. 7a 1 H77/833-2 0.07a 0.01 <0.001PRLT 2/89-33 0.05b
Fig. 7b 1 H77/833-2 0.77a 0.03 <0.001 Non-significantPRLT 2/89-33 0.72b
2 Control 1.00a 0.04 <0.001H2O2 0.83bApoplast inhibition 0.40c
Fig. 7c 1 H77/833-2 0.89a 0.06 0.11 SignificantPRLT 2/89-33 0.84a
2 Control 1.01a 0.07 <0.001H2O2 0.96bApoplast inhibition 0.63c
Fig. 8a 1 H77/833-2 1.07a 0.08 <0.05 SignificantPRLT 2/89-33 0.95b
1 Control 1.00a 0.09 0.79H2O2 1.01a
Fig. 8b 1 H77/833-2 0.83b 0.09 0.07 SignificantPRLT 2/89-33 0.93a
1 control 1.00a 0.10 <0.001AgNO3 0.79b
H Functional Plant Biology M. Tharanya et al.
absolute values at 2.65 kPa also showed no significant genotypicdifferences (Fig. S6).
Transpiration response to CuSO4 and to apoplasticblockage treatments
Though K4(Fe(CN)6) and CuSO4 have been reported to inhibitthe apoplastic pathway, there have been reports on AQPinhibition by Cu alone (Ligaba et al. 2011). The effect ofCuSO4 on plant transpiration was then compared with itscombined effect with K4(Fe(CN)6). When 0.5mM CuSO4
alone was applied, transpiration decreased more in H77/833-2
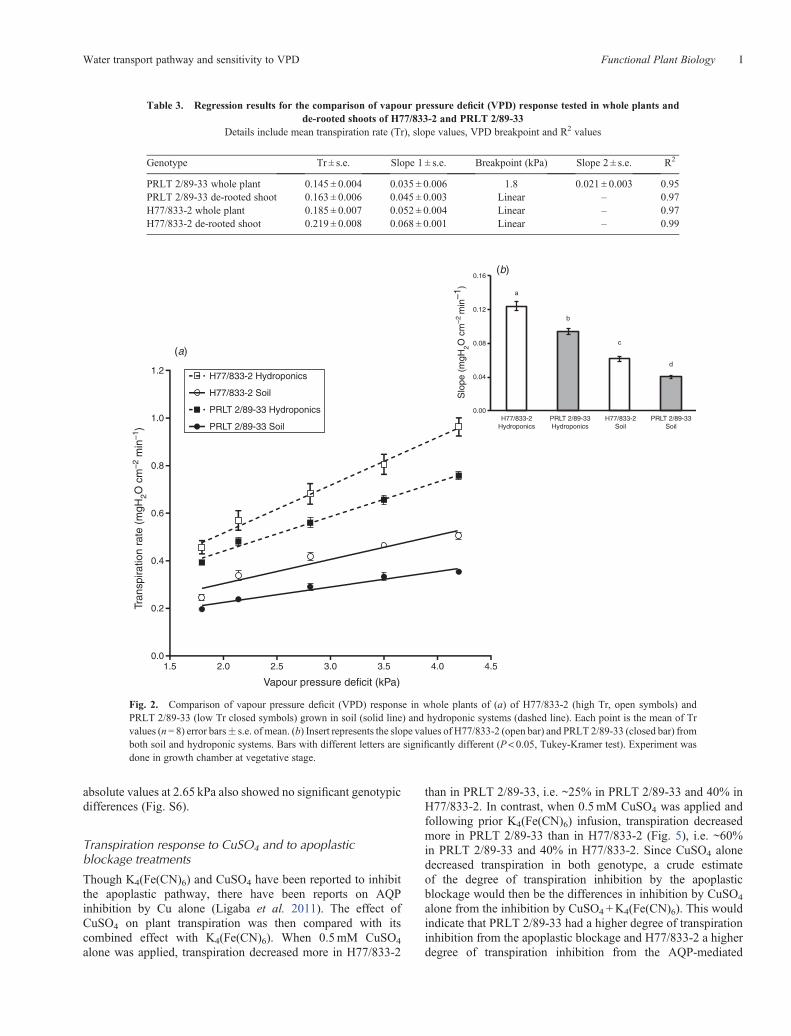
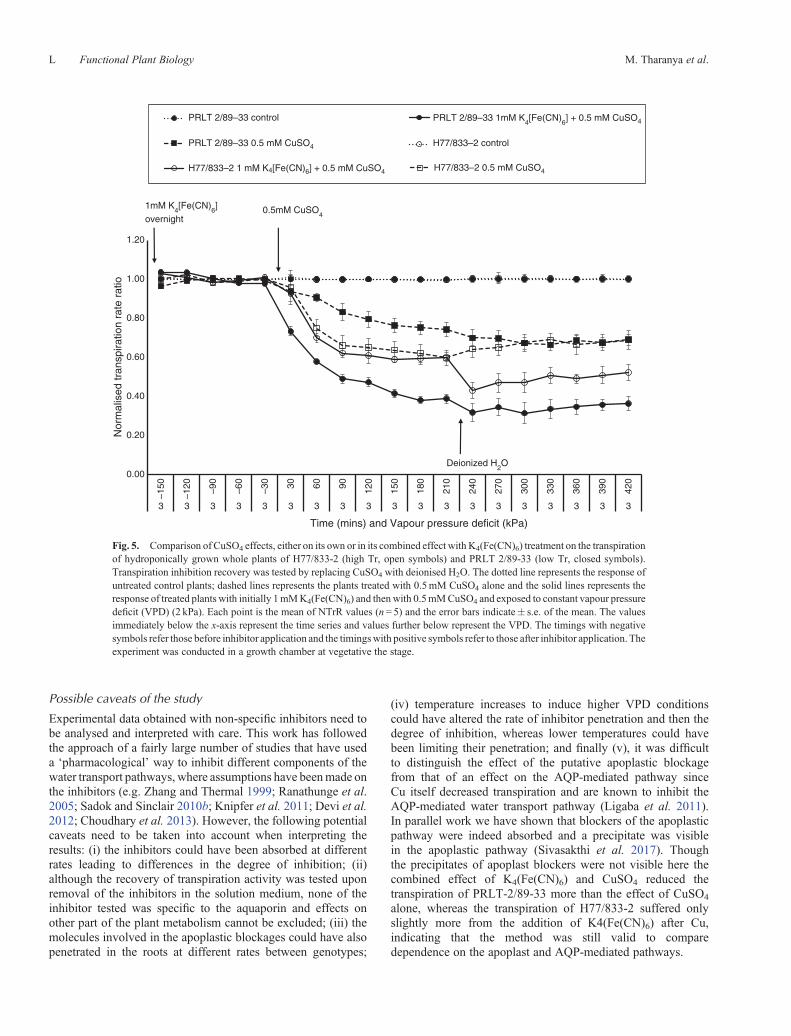
than in PRLT 2/89-33, i.e. ~25% in PRLT 2/89-33 and 40% inH77/833-2. In contrast, when 0.5mM CuSO4 was applied andfollowing prior K4(Fe(CN)6) infusion, transpiration decreasedmore in PRLT 2/89-33 than in H77/833-2 (Fig. 5), i.e. ~60%in PRLT 2/89-33 and 40% in H77/833-2. Since CuSO4 alonedecreased transpiration in both genotype, a crude estimateof the degree of transpiration inhibition by the apoplasticblockage would then be the differences in inhibition by CuSO4
alone from the inhibition by CuSO4 +K4(Fe(CN)6). This wouldindicate that PRLT 2/89-33 had a higher degree of transpirationinhibition from the apoplastic blockage and H77/833-2 a higherdegree of transpiration inhibition from the AQP-mediated
Table 3. Regression results for the comparison of vapour pressure deficit (VPD) response tested in whole plants andde-rooted shoots of H77/833-2 and PRLT 2/89-33
Details include mean transpiration rate (Tr), slope values, VPD breakpoint and R2 values
Genotype Tr ± s.e. Slope 1 ± s.e. Breakpoint (kPa) Slope 2 ± s.e. R2
PRLT 2/89-33 whole plant 0.145 ± 0.004 0.035 ± 0.006 1.8 0.021± 0.003 0.95PRLT 2/89-33 de-rooted shoot 0.163 ± 0.006 0.045 ± 0.003 Linear – 0.97H77/833-2 whole plant 0.185 ± 0.007 0.052 ± 0.004 Linear – 0.97H77/833-2 de-rooted shoot 0.219 ± 0.008 0.068 ± 0.001 Linear – 0.99
1.2H77/833-2 Hydroponics
H77/833-2Hydroponics
Slo
pe (
mgH
2O c
m–2
min
–1)
PRLT 2/89-33 HydroponicsPRLT 2/89-33HydroponicsPRLT 2/89-33 Soil
PRLT 2/89-33Soil
0.16
a
b
c
d
0.12
0.08
0.04
0.00
H77/833-2 Soil
H77/833-2Soil
1.0
0.8
0.6
0.4
0.2
0.01.5 2.0 2.5 3.0 3.5
Vapour pressure deficit (kPa)
Tran
spira
tion
rate
(m
gH2O
cm
–2 m
in–1
)
4.0 4.5
(a)
(b)
Fig. 2. Comparison of vapour pressure deficit (VPD) response in whole plants of (a) of H77/833-2 (high Tr, open symbols) andPRLT 2/89-33 (low Tr closed symbols) grown in soil (solid line) and hydroponic systems (dashed line). Each point is the mean of Trvalues (n= 8) error bars� s.e. of mean. (b) Insert represents the slope values of H77/833-2 (open bar) and PRLT 2/89-33 (closed bar) fromboth soil and hydroponic systems. Bars with different letters are significantly different (P< 0.05, Tukey-Kramer test). Experiment wasdone in growth chamber at vegetative stage.
Water transport pathway and sensitivity to VPD Functional Plant Biology I
pathway. Recovery with deionised H2O showed that H77/833-2treated with 0.5mM CuSO4 was able to recover its transpirationslightly. Anatomical sections of root segments taken from H77/833-2 and PRLT 2/89-33 did not show any visible evidence ofprecipitates in extracellular spaces following treatment withK4(Fe(CN)6) and CuSO4 as reported previously (Ranathungeet al. 2005) (Fig. S5).
Transpiration response to aquaporin inhibitor or apoplastblockage treatments in whole plants under low VPD
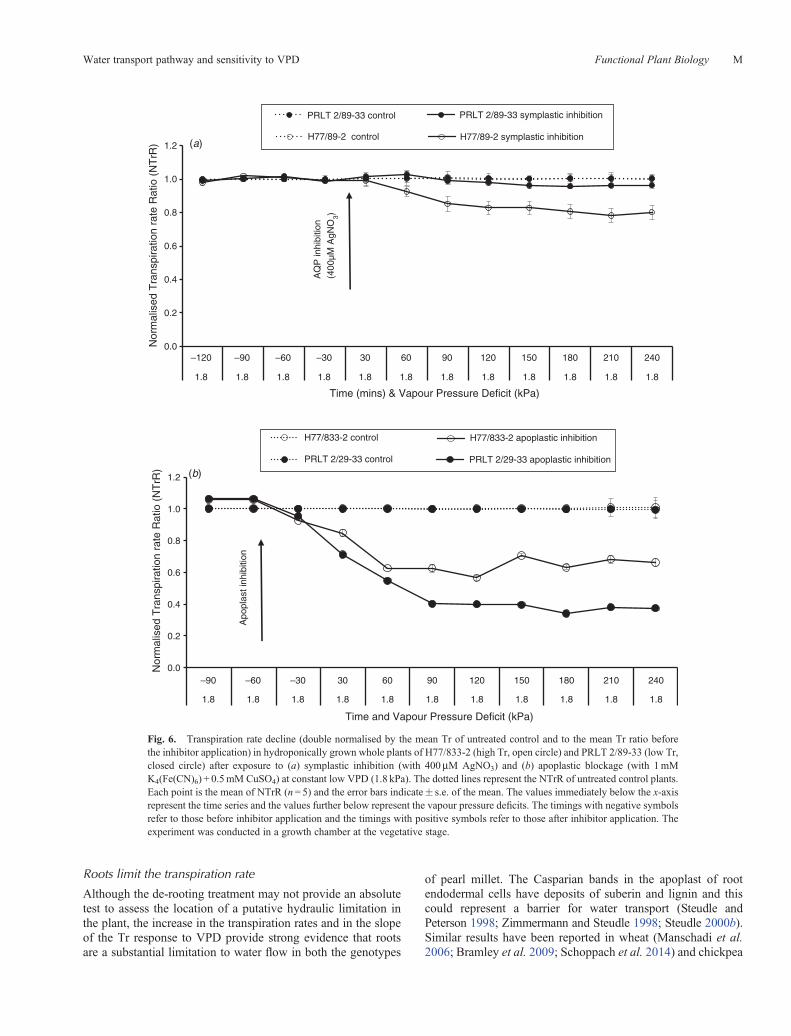
A comparison of the transpiration response to the inhibitorstreatment of the AQP (400mM AgNO3) and of the apoplasticpathway (1mM K4(Fe(CN)6) + 0.5mM CuSO4) was conductedunder a constant VPD regime (1.8 kPa). Transpiration ofhigh Tr genotype H77/833-2 was decreased by ~20% byAgNO3, whereas transpiration of low Tr PRLT 2/89-33 wasnot significantly affected by AgNO3 (Fig. 6a). The genotypicdifferences for the inhibition treatment were statisticallysignificant (Table 2; Fig. 6a). Overall, the blockage of theapoplast resulted in a larger inhibition of transpiration than theinhibition of the AQP-mediated water transport pathway (Fig. 6;Table 2). The blockage of the apoplastic pathway resultedin more transpiration inhibition in the low Tr genotype
PRLT 2/89-33 (60%) than in the high Tr genotype H77/833-2(40%) (Table 2) (Fig. 7b) in agreement with Fig. 5.
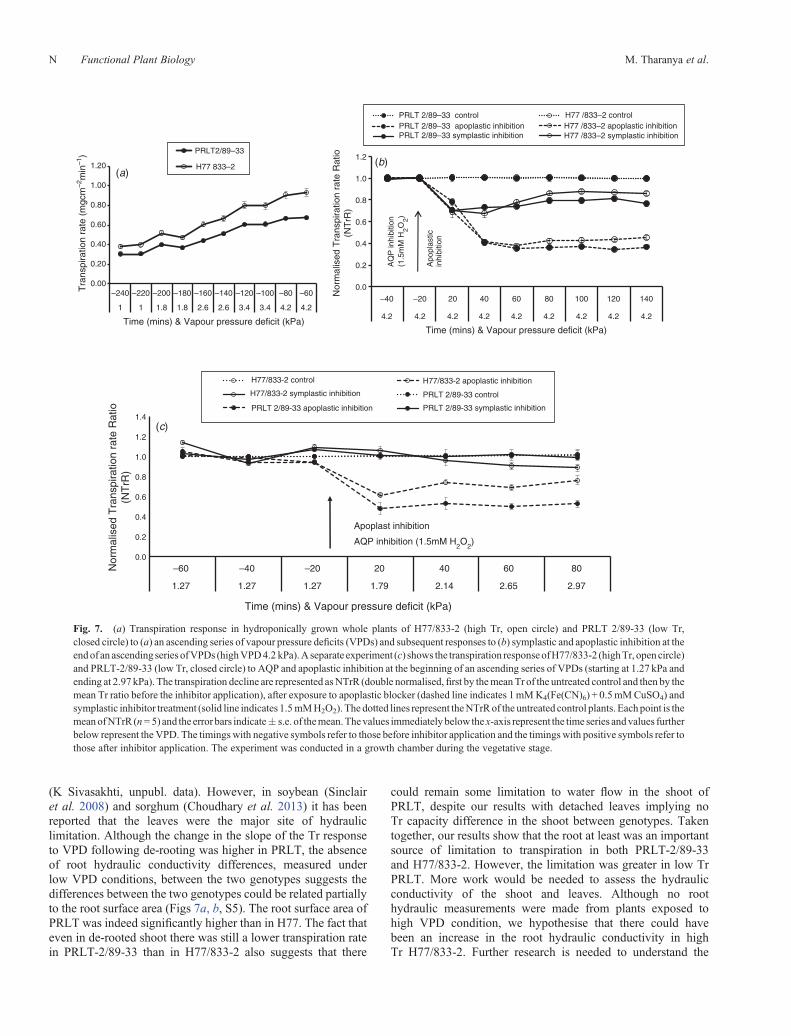
Transpiration response to aquaporin inhibitor or apoplastblockage treatments in whole plants under high VPD
The effect of symplast and apoplast inhibition was also tested atthe end of an ascending series of VPDs. First, the transpirationresponse to increasing VPD confirmed the lower Tr of low TrPRLT 2/89/33 than high Tr H77/833-2 (lower slope; Fig. 7a).At this stage, under high VPD (4.2 kPa), the inhibitors wereapplied. Again, the apoplastic blockage resulted in a largerinhibition of transpiration than the inhibition of the AQP-mediated pathway (Fig. 7b), and the decrease in thetranspiration of PRLT 2/89-33 was comparatively higher thanin H77/833-2 (Table 2). However, the AQP inhibition (1.5mMH2O2) at the end of this ascending series of VPDs (4.2 kPa)differed from the inhibition pattern at lowVPD (Fig. 7a). Indeed,the transpiration of PRLT 2/89-33, this time under high VPD,declined more than in H77/833-2 (Fig. 7b; Table 2; P < 0.001).
A comparison of the transpiration response to the inhibitorstreatment of the AQP (1.5mM H2O2) and of the apoplasticpathway (1mM K4(Fe(CN)6) + 0.5mM CuSO4) was alsoconducted in plants exposed initially to low VPD (1.27 kPa)and where the VPD was increased up to 2.97 kPa during theexposure to the aquaporin inhibitor. Here also, the blockage ofthe apoplastic pathway led to a larger decrease of the transpirationthan the inhibition of the AQP-mediated water transportpathway (Fig. 7c). When the apoplastic pathway was blockedthe normalised transpiration rate (NTrR) of lowTr PRLT 2/89-33dropped significantly more than the high Tr H77/833-2 andthe level of apoplastic inhibition were typically between 40and 50% (Fig. 7c). By contrast, the AQP inhibition by 1.5mMH2O2 showed a significantly higher NTrR decline in H77/833-2than inPRLT2/89-33, although the level of inhibitionwas limitedto ~10–15% (Fig. 7c).
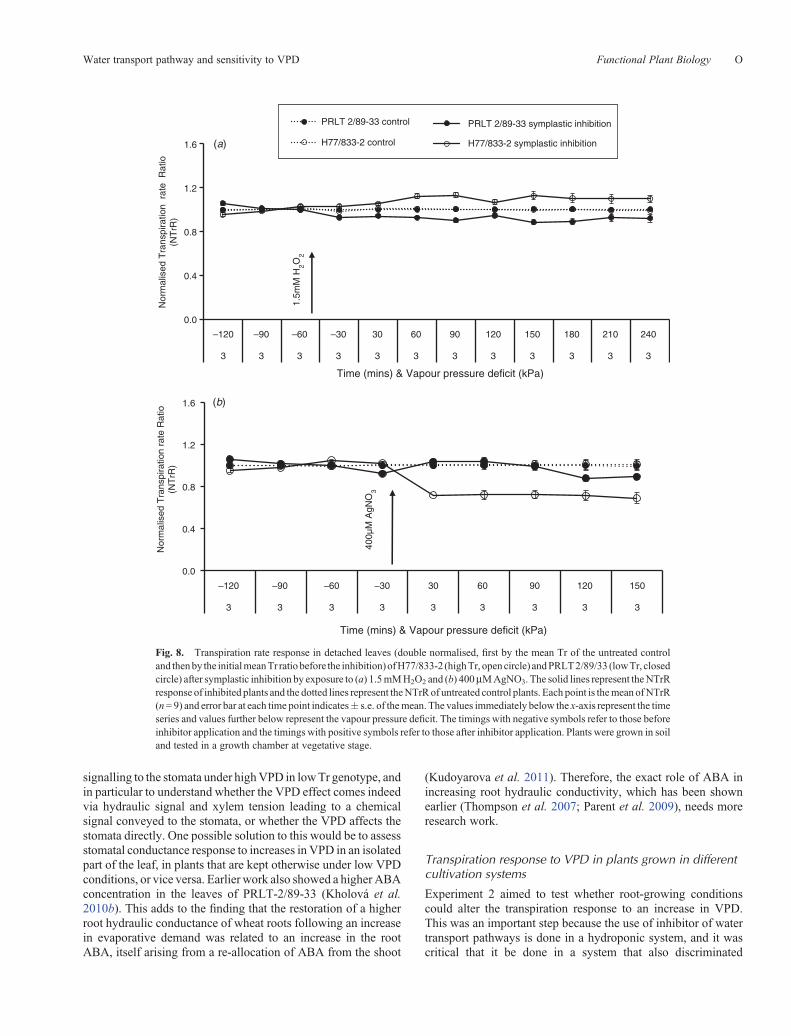
Transpiration response to aquaporin inhibitors treatmentin detached leaves
Although the apoplast blockage treatment was targeted to theroot, the aquaporin inhibitor treatment could have affected theaquaporins both in the roots and in the leaves.Therefore, the effectof aquaporin inhibitorswas tested on the transpiration of detachedleaves. The transpiration of detached leaves did not respond to1.5mMH2O2 and even slightly increased inH77/833-2 (Fig. 8a).This contrasted with the whole-plant transpiration response to1.5mM H2O2 treatment applied to the roots of whole plants(Fig. 7c). Similarly, different concentrations of AgNO3 rangingfrom 50 to 800mMwere tested. With low concentration (50mM)there was no drop in transpiration (data not shown) and from400mM and above concentrations an inhibition in transpirationand genotypic difference was observed. In contrast toH2O2, treatment with 400mM AgNO3 treatment of detachedleaves resulted in a significant decline in the transpiration ofH77/833-2 (~25%), whereas the transpiration of low TrPRLT 2/89-33 either did not decrease in the first 90min aftertreatment and decreased only by ~10% in the following 60min(Fig. 8b; genotype effect, P< 0.05, Tukey’s test; Table 2).
0.00
0.01
0.02
0.03
0.04
control apoplasticinhibition
control apoplasticinhibition
H77/833-2
(a)
(b)
PRLT2/89-33
Roo
t hyd
raul
ic c
ondu
ctiv
ity(1
0–6m
s–1M
Pa–1
) R
oot h
ydra
ulic
con
duct
ivity
(10–6
ms–1
MP
a–1)
a
aa
0.00
0.01
0.02
0.03
0.04
control symplasticinhibition
control symplasticinhibition
H77/833-2 PRLT2/89-33
b
bb
a
b
60% inhibition35% inhibition
44% inhibition 63% inhibition
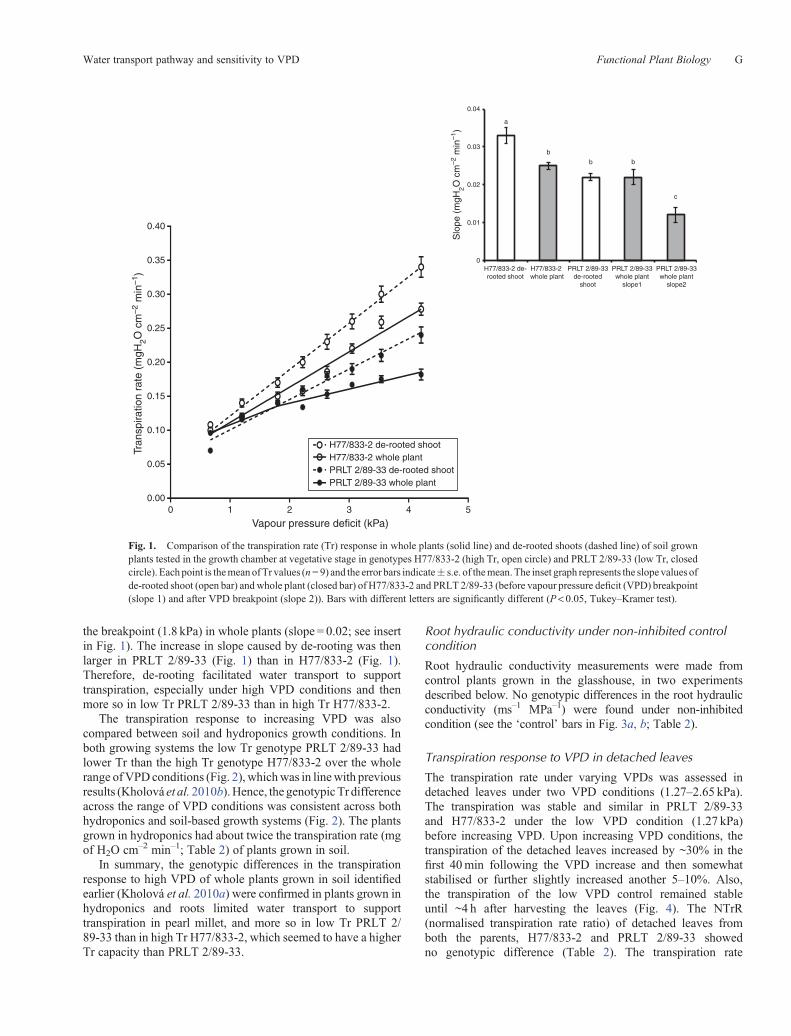
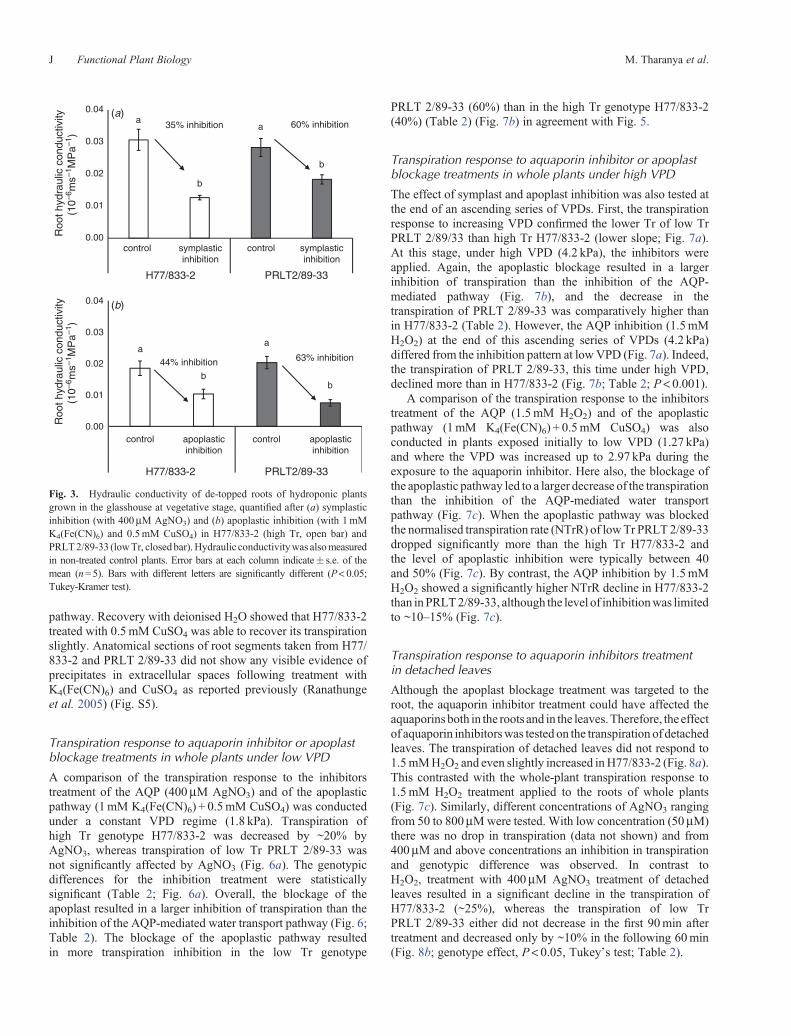
Fig. 3. Hydraulic conductivity of de-topped roots of hydroponic plantsgrown in the glasshouse at vegetative stage, quantified after (a) symplasticinhibition (with 400mM AgNO3) and (b) apoplastic inhibition (with 1mMK4(Fe(CN)6) and 0.5mM CuSO4) in H77/833-2 (high Tr, open bar) andPRLT2/89-33 (lowTr, closedbar).Hydraulic conductivitywas alsomeasuredin non-treated control plants. Error bars at each column indicate� s.e. of themean (n=5). Bars with different letters are significantly different (P< 0.05;Tukey-Kramer test).
J Functional Plant Biology M. Tharanya et al.
Root hydraulic conductance following apoplast or symplastinhibitors treatments
Following the above responses of transpiration to apoplast orsymplast inhibitors, the root hydraulic conductivity wasmeasured following various treatments (untreated, apoplasticand AQP inhibition). In the case of root systems treated withinhibitors of either the AQP-mediated or apoplastic pathways forwater transport, using the same method as in the case of wholeplants inhibitions, there was a clear decrease in the root hydraulicconductivity (ms–1 MPa–1) compared with untreated plants inboth the genotypes (Figs 2, 3a; Table 2). Upon the symplastinhibitor treatment, therewas a 30–60%decrease in the hydraulicconductivity (Fig. 3a). Upon blockage of the apoplast, the roothydraulic conductivity dropped by ~44–63% (Fig. 3b). Thedecrease in the root hydraulic conductivity was consistent withthe inhibition of the transpiration, i.e. there was a larger rootconductivity decrease upon aquaporin inhibitor treatment inH77/833-2 than in PRLT 2/89-33 and, conversely, there was alarger root conductivity decrease upon apoplast blockage inPRLT 2/89-33 than in H77/833-2.
Discussion
The main results of these experiments were that: (i) roots limitedthe transpiration rate in the tested genotypes of pearl millet at allVPD levels and more so in low Tr PRLT 2/89/33 above 2 kPa;(ii) there was genotypic and environmental variation in thedegree to which transpiration responded to the applicationof a AQP inhibitor or to a blocker of the apoplastic pathway,where high Tr H77/833-2 suffered AQP inhibition most, exceptwhen exposed to high VPD conditions, whereas low Tr genotypePRLT 2/89-33 suffered apoplastic blockage most; (iii) thetranspiration of detached leaves with AgNO3 gave a genotypic
pattern of inhibition similar to the whole plants, with a largerinhibition in high Tr H77/833-2 than in PRLT 2/89-33; and(iv) root hydraulic conductivity did not differ in the twogenotypes under untreated conditions. However, there wasa larger decrease in root hydraulic conductivity of high TrH77/833-2 upon aquaporin inhibitor treatment, and a largerdecrease in root hydraulic conductivity of low Tr PRLT 2/89-33upon apoplastic blockage. Based on these results, it could beconcluded that roots limited water flow to support transpirationunder high VPD, although there was still a degree of water flowlimitation in the shoot based on the transpiration differences ofde-rooted shoots of the two genotypes. Our running hypothesisis that PRLT2/89-33dependedmoreon the apoplastic pathway forwater movement, whereas H77/833-2 depended on both theapoplastic and symplastic pathway, and probably predominantlyon the symplastic pathway. This might explain the lower Trcapacity of PRLT 2/89-33, especially under high VPD, theapoplast being a rather rigid space between the cell walls withlittle means to increase the conductivity of this pathway (althoughsee Cuneo et al. 2016). In contrast, H77/833-2 had a higher Trcapacity, especially under high VPD by compensating/adaptingvia the symplastic pathway, possibly via aquaporin upregulation(Kudoyarova et al. 2011). Therefore, so long as the evaporativedemand was low, there was no limitation to the water movementin the leaves to fully support transpiration demand. Underhigher evaporative demand, there was a need for more watermovement to support transpiration and this added demandmight have been facilitated by aquaporins, thereby theinhibition effect on transpiration from adding the aquaporininhibitor. These results need to consider that high VPD wasachieved by a combination of higher temperature and lower RH%, which then does not exclude a temperature effect on theresponses, independently of the VPD effect that was the target.
Nor
mal
ised
Tra
nspi
ratio
n ra
te R
atio
(N
TrR
)
Time
VP
D s
hifte
d fr
om
1.27
kPa
to 2
.65k
Pa
2.65 kPa
1.27 kPa
0.0
0.4
0.8
1.2
1.6
09:20 09:40 10:00 10:20 10:40 11:00 11:20 11:40 12:00 12:20 12:40
H77/833-2 30°C/70%RH
PRLT 2/89-33 30°C/70%RH
H77/833-2 35°C/53%RH
PRLT 2/89-33 35°C/53%RH
13:00 13:20
Fig. 4. Transpiration rate response in detached leaves from plants grown in soil and tested in growthchamber at vegetative stage. Transpiration data were double normalised, by the mean Tr of the untreatedcontrol first, and then to the initial mean Tr ratio before increasing vapour pressure deficit (VPD) from 1.27to 2.65 kPa) in H77/833-2 (high Tr, open circle) and PRLT 2/89/33 (low Tr, closed circle) tested forVPD response. The solid lines represent NTrR of the increased VPD treatment; the dotted lines representthe NTrR of the untreated control leaves. Each point is the mean of NTrR (n= 9) and error bar at each timeindicates� s.e. of the mean.
Water transport pathway and sensitivity to VPD Functional Plant Biology K
Possible caveats of the study
Experimental data obtained with non-specific inhibitors need tobe analysed and interpreted with care. This work has followedthe approach of a fairly large number of studies that have useda ‘pharmacological’ way to inhibit different components of thewater transport pathways, where assumptions have beenmade onthe inhibitors (e.g. Zhang and Thermal 1999; Ranathunge et al.2005; Sadok and Sinclair 2010b; Knipfer et al. 2011; Devi et al.2012; Choudhary et al. 2013). However, the following potentialcaveats need to be taken into account when interpreting theresults: (i) the inhibitors could have been absorbed at differentrates leading to differences in the degree of inhibition; (ii)although the recovery of transpiration activity was tested uponremoval of the inhibitors in the solution medium, none of theinhibitor tested was specific to the aquaporin and effects onother part of the plant metabolism cannot be excluded; (iii) themolecules involved in the apoplastic blockages could have alsopenetrated in the roots at different rates between genotypes;
(iv) temperature increases to induce higher VPD conditionscould have altered the rate of inhibitor penetration and then thedegree of inhibition, whereas lower temperatures could havebeen limiting their penetration; and finally (v), it was difficultto distinguish the effect of the putative apoplastic blockagefrom that of an effect on the AQP-mediated pathway sinceCu itself decreased transpiration and are known to inhibit theAQP-mediated water transport pathway (Ligaba et al. 2011).In parallel work we have shown that blockers of the apoplasticpathway were indeed absorbed and a precipitate was visiblein the apoplastic pathway (Sivasakthi et al. 2017). Thoughthe precipitates of apoplast blockers were not visible here thecombined effect of K4(Fe(CN)6) and CuSO4 reduced thetranspiration of PRLT-2/89-33 more than the effect of CuSO4
alone, whereas the transpiration of H77/833-2 suffered onlyslightly more from the addition of K4(Fe(CN)6) after Cu,indicating that the method was still valid to comparedependence on the apoplast and AQP-mediated pathways.
0.00
0.20
0.40
0.60
0.80
1.00
1.20
–150
–120 –9
0
–60
–30 30 60 90 120
150
180
210
240
270
300
330
360
390
420
3 3 3 3 3 3 3 3 3 3 3 3 3 3 3 3 3 3 3
Nor
mal
ised
tran
spira
tion
rate
rat
io
Time (mins) and Vapour pressure deficit (kPa)
1mM K4[Fe(CN)
6]
overnight
Deionized H2O
0.5mM CuSO4
PRLT 2/89–33 control PRLT 2/89–33 1mM K4[Fe(CN)
6] + 0.5 mM CuSO4
PRLT 2/89–33 0.5 mM CuSO4 H77/833–2 control
H77/833–2 1 mM K4[Fe(CN)6] + 0.5 mM CuSO4 H77/833–2 0.5 mM CuSO4
Fig. 5. Comparison of CuSO4 effects, either on its own or in its combined effect with K4(Fe(CN)6) treatment on the transpirationof hydroponically grown whole plants of H77/833-2 (high Tr, open symbols) and PRLT 2/89-33 (low Tr, closed symbols).Transpiration inhibition recovery was tested by replacing CuSO4 with deionised H2O. The dotted line represents the response ofuntreated control plants; dashed lines represents the plants treated with 0.5mM CuSO4 alone and the solid lines represents theresponse of treated plants with initially 1mMK4(Fe(CN)6) and thenwith 0.5mMCuSO4 and exposed to constant vapour pressuredeficit (VPD) (2 kPa). Each point is the mean of NTrR values (n= 5) and the error bars indicate� s.e. of the mean. The valuesimmediately below the x-axis represent the time series and values further below represent the VPD. The timings with negativesymbols refer those before inhibitor application and the timingswith positive symbols refer to those after inhibitor application. Theexperiment was conducted in a growth chamber at vegetative the stage.
L Functional Plant Biology M. Tharanya et al.
Roots limit the transpiration rate
Although the de-rooting treatment may not provide an absolutetest to assess the location of a putative hydraulic limitation inthe plant, the increase in the transpiration rates and in the slopeof the Tr response to VPD provide strong evidence that rootsare a substantial limitation to water flow in both the genotypes
of pearl millet. The Casparian bands in the apoplast of rootendodermal cells have deposits of suberin and lignin and thiscould represent a barrier for water transport (Steudle andPeterson 1998; Zimmermann and Steudle 1998; Steudle 2000b).Similar results have been reported in wheat (Manschadi et al.2006; Bramley et al. 2009; Schoppach et al. 2014) and chickpea
0.0
0.2
0.4
0.6
0.8
1.0
1.2
–120 –90 –60 –30 30 60 90 120 150 180 210 240
1.8 1.8 1.8 1.8 1.8 1.8 1.8 1.8 1.8 1.8 1.8 1.8
Nor
mal
ised
Tra
nspi
ratio
n ra
te R
atio
(N
TrR
)
Time (mins) & Vapour Pressure Deficit (kPa)
(a)
(b)
PRLT 2/89-33 control PRLT 2/89-33 symplastic inhibition
H77/89-2 control H77/89-2 symplastic inhibition
AQ
P in
hibi
tion
(400
µM A
gNO
3)
0.0
0.2
0.4
0.6
0.8
1.0
1.2
–90 –60 –30 30 60 90 120 150 180 210 240
1.8 1.8 1.8 1.8 1.8 1.8 1.8 1.8 1.8 1.8 1.8
Nor
mal
ised
Tra
nspi
ratio
n ra
te R
atio
(N
TrR
)
Time and Vapour Pressure Deficit (kPa)
H77/833-2 control H77/833-2 apoplastic inhibition
PRLT 2/29-33 control PRLT 2/29-33 apoplastic inhibition
Apo
plas
t inh
ibiti
on
Fig. 6. Transpiration rate decline (double normalised by the mean Tr of untreated control and to the mean Tr ratio beforethe inhibitor application) in hydroponically grown whole plants of H77/833-2 (high Tr, open circle) and PRLT 2/89-33 (low Tr,closed circle) after exposure to (a) symplastic inhibition (with 400mM AgNO3) and (b) apoplastic blockage (with 1mMK4(Fe(CN)6) + 0.5mM CuSO4) at constant low VPD (1.8 kPa). The dotted lines represent the NTrR of untreated control plants.Each point is the mean of NTrR (n= 5) and the error bars indicate� s.e. of the mean. The values immediately below the x-axisrepresent the time series and the values further below represent the vapour pressure deficits. The timings with negative symbolsrefer to those before inhibitor application and the timings with positive symbols refer to those after inhibitor application. Theexperiment was conducted in a growth chamber at the vegetative stage.
Water transport pathway and sensitivity to VPD Functional Plant Biology M
(K Sivasakhti, unpubl. data). However, in soybean (Sinclairet al. 2008) and sorghum (Choudhary et al. 2013) it has beenreported that the leaves were the major site of hydrauliclimitation. Although the change in the slope of the Tr responseto VPD following de-rooting was higher in PRLT, the absenceof root hydraulic conductivity differences, measured underlow VPD conditions, between the two genotypes suggests thedifferences between the two genotypes could be related partiallyto the root surface area (Figs 7a, b, S5). The root surface area ofPRLT was indeed significantly higher than in H77. The fact thateven in de-rooted shoot there was still a lower transpiration ratein PRLT-2/89-33 than in H77/833-2 also suggests that there
could remain some limitation to water flow in the shoot ofPRLT, despite our results with detached leaves implying noTr capacity difference in the shoot between genotypes. Takentogether, our results show that the root at least was an importantsource of limitation to transpiration in both PRLT-2/89-33and H77/833-2. However, the limitation was greater in low TrPRLT. More work would be needed to assess the hydraulicconductivity of the shoot and leaves. Although no roothydraulic measurements were made from plants exposed tohigh VPD condition, we hypothesise that there could havebeen an increase in the root hydraulic conductivity in highTr H77/833-2. Further research is needed to understand the
0.0
0.2
0.4
0.6
0.8
1.0
1.2
–40 –20 20 40 60 80 100 120 140
4.2 4.2 4.2 4.2 4.2 4.2 4.2 4.2 4.2
Nor
mal
ised
Tra
nspi
ratio
n ra
te R
atio
(NT
rR)
PRLT 2/89–33 controlPRLT 2/89–33 apoplastic inhibitionPRLT 2/89–33 symplastic inhibition
H77 /833–2 controlH77 /833–2 apoplastic inhibitionH77 /833–2 symplastic inhibition
AQ
P in
hibi
tion
(1.5
mM
H2O
2)
Apo
plas
tic
inhi
bitio
n
0.00
0.20
0.40
0.60
0.80
1.00
1.20
–240 –220 –200 –180 –160 –140 –120 –100 –80 –60
1 1 1.8 1.8 2.6 2.6 3.4 3.4 4.2 4.2
Tra
nspi
ratio
n ra
te (
mgc
m–2
min
–1)
Time (mins) & Vapour pressure deficit (kPa)Time (mins) & Vapour pressure deficit (kPa)
Time (mins) & Vapour pressure deficit (kPa)
(a)
(c)
(b)
PRLT2/89–33
H77 833–2
0.0
0.2
0.4
0.6
0.8
1.0
1.2
1.4
–60 –40 –20 20 40 60 80
1.27 1.27 1.27 1.79 2.14 2.65 2.97
Nor
mal
ised
Tra
nspi
ratio
n ra
te R
atio
(NT
rR)
H77/833-2 control H77/833-2 apoplastic inhibition
H77/833-2 symplastic inhibition PRLT 2/89-33 control
PRLT 2/89-33 apoplastic inhibition PRLT 2/89-33 symplastic inhibition
Apoplast inhibition
AQP inhibition (1.5mM H2O
2)
Fig. 7. (a) Transpiration response in hydroponically grown whole plants of H77/833-2 (high Tr, open circle) and PRLT 2/89-33 (low Tr,closed circle) to (a) an ascending series of vapour pressure deficits (VPDs) and subsequent responses to (b) symplastic and apoplastic inhibition at theendof an ascendingseries ofVPDs (highVPD4.2 kPa).Aseparate experiment (c) shows the transpiration responseofH77/833-2 (highTr, opencircle)and PRLT-2/89-33 (low Tr, closed circle) to AQP and apoplastic inhibition at the beginning of an ascending series of VPDs (starting at 1.27 kPa andending at 2.97 kPa). The transpiration decline are represented asNTrR (double normalised,first by themeanTr of the untreated control and then by themean Tr ratio before the inhibitor application), after exposure to apoplastic blocker (dashed line indicates 1mMK4(Fe(CN)6) + 0.5mMCuSO4) andsymplastic inhibitor treatment (solid line indicates 1.5mMH2O2). The dotted lines represent theNTrRof the untreated control plants. Eachpoint is themeanofNTrR (n= 5) and the error bars indicate� s.e. of themean.Thevalues immediately below the x-axis represent the time series andvalues furtherbelow represent the VPD. The timingswith negative symbols refer to those before inhibitor application and the timingswith positive symbols refer tothose after inhibitor application. The experiment was conducted in a growth chamber during the vegetative stage.
N Functional Plant Biology M. Tharanya et al.
signalling to the stomata under highVPD in lowTr genotype, andin particular to understand whether the VPD effect comes indeedvia hydraulic signal and xylem tension leading to a chemicalsignal conveyed to the stomata, or whether the VPD affects thestomata directly. One possible solution to this would be to assessstomatal conductance response to increases in VPD in an isolatedpart of the leaf, in plants that are kept otherwise under low VPDconditions, or vice versa. Earlier work also showed a higher ABAconcentration in the leaves of PRLT-2/89-33 (Kholová et al.2010b). This adds to the finding that the restoration of a higherroot hydraulic conductance of wheat roots following an increasein evaporative demand was related to an increase in the rootABA, itself arising from a re-allocation of ABA from the shoot
(Kudoyarova et al. 2011). Therefore, the exact role of ABA inincreasing root hydraulic conductivity, which has been shownearlier (Thompson et al. 2007; Parent et al. 2009), needs moreresearch work.
Transpiration response to VPD in plants grown in differentcultivation systems
Experiment 2 aimed to test whether root-growing conditionscould alter the transpiration response to an increase in VPD.This was an important step because the use of inhibitor of watertransport pathways is done in a hydroponic system, and it wascritical that it be done in a system that also discriminated
0.0
0.4
0.8
1.2
1.6
–120 –90 –60 –30 30 60 90 120 150
3 3 3 3 3 3 3 3 3
Time (mins) & Vapour pressure deficit (kPa)
Time (mins) & Vapour pressure deficit (kPa)
400µ
M A
gNO
3
0.0
0.4
0.8
1.2
1.6 (a)
(b)
–120 –90 –60 –30 30 60 90 120 150 180 210 240
3 3 3 3 3 3 3 3 3 3 3 3
Nor
mal
ised
Tra
nspi
ratio
n r
ate
Rat
io(N
TrR
)N
orm
alis
ed T
rans
pira
tion
rate
Rat
io(N
TrR
)
PRLT 2/89-33 control PRLT 2/89-33 symplastic inhibition
H77/833-2 control H77/833-2 symplastic inhibition
1.5m
M H
2O2
Fig. 8. Transpiration rate response in detached leaves (double normalised, first by the mean Tr of the untreated controland thenby the initialmeanTr ratio before the inhibition)ofH77/833-2 (highTr, opencircle) andPRLT2/89/33 (lowTr, closedcircle) after symplastic inhibition by exposure to (a) 1.5mMH2O2 and (b) 400mMAgNO3. The solid lines represent theNTrRresponse of inhibited plants and the dotted lines represent theNTrRof untreated control plants. Each point is themeanofNTrR(n= 9) and error bar at each time point indicates� s.e. of themean. The values immediately below the x-axis represent the timeseries and values further below represent the vapour pressure deficit. The timings with negative symbols refer to those beforeinhibitor application and the timings with positive symbols refer to those after inhibitor application. Plants were grown in soiland tested in a growth chamber at vegetative stage.
Water transport pathway and sensitivity to VPD Functional Plant Biology O
genotypes for the transpiration response to high VPD. Resultsshowed that variation in Tr between genotypes was consistentwith both systems, so that both hydroponic and soil systemscould be used for investigating differences in the plant hydraulicfeatures. The fact that Tr was higher in hydroponics than in soilalso suggests that the restriction to transpiration water flow tookplace at the root–soil interface. Hydroponically grown plants arereported to not fully develop apoplastic barriers, i.e. Casparianbands in the hypodermis and endodermis (Peterson 1988;Zimmermann and Steudle 1998; Freundl et al. 2000) but whengrown in soil they do develop Casparian bands (Perumalla et al.1990; Damus et al. 1997; Enstone and Peterson 1998), and thishas consequences for the hydraulic conductivity of the rootsystem. Differences in the root anatomical features betweensoil-grown and hydroponic-grown plants could have thenaffected the response to VPD or to the inhibitors. The highertranspiration rate in hydroponics than in soil could also becaused by a smaller leaf area development in hydroponicplants. The absence of a VPD threshold breakpoint in thetranspiration response of PRLT-2/89-33 could relate to thefact that the Tr response started at a fairly high VPD (1.8 kPa),whereas the VPD breakpoint response was earlier reported inthe range from 1.40 to 1.90 kPa in soil grown PRLT-2/89-33(Kholová et al. 2010b).
Water transport pathway
Experiments 3 and 4 were meant to provide a basic insightwhether various water transport pathways that could possiblyunderlay the transpiration variations between genotypes onwhole plant level. One of the usual interpretations is thata genotype showing significant transpiration decrease upon theapplication of an inhibitor might be utilising the inhibitedwater transport pathway comparatively more than othergenotypes showing less inhibition (Sadok and Sinclair 2010b).Alternatively, a genotype maintaining transpiration after inhibitionmight either have AQP insensitive to the applied inhibitors(Daniels et al. 1994; Biela et al. 1999) or might be able tocompensate the inhibition by enhancing AQP population(Beaudette et al. 2007; Tamás et al. 2008; Ligaba et al. 2011),or by having lower population of inhibitor-sensitive aquaporins(Schoppach et al. 2014) or by channelling more water throughother water transport pathways (Morillon and Chrispeels2001). Therefore, even though the effect of inhibitors are notfully understood and may have many side-effects on plantmetabolism (Coskun et al. 2012), using low concentration forshort-duration is one of the common protocols (Maggio andJoly 1995; Sadok and Sinclair 2010a, 2010b; Devi et al. 2012;Choudhary et al. 2013).
The fact that the inhibition differed between genotypesindicated some genotypic differences in the relative proportionof water channelled through either the AQP-mediated orapoplastic pathway. Low Tr PRLT-2/89-33 depended more onthe apoplast pathway for water transport than the high Tr H77/833-2. By contrast, even the inhibition of the apoplasticpathway in the case of H77/833-2 was partially caused by Cuitself, lending to apparently only a small portion of apoplastblockage inhibition (Fig. 3). More research would be needed toconfirm such trends using dyes to infer the relative proportion
of water flowing through each of the pathways (Hanson et al.1985; Bárzana et al. 2012). Here, the apoplastic pathway mightbe seen as the predominant and ‘fixed’ part of water transportsystems, set by the tissue architecture (i.e. long-termdevelopmentof plant in particular conditions, Zimmermann and Steudle1998; Steudle 2000b). This was confirmed by the largerhydraulic conductivity reduction in the low Tr PRLT-2/89-33.In contrast, the inhibition of transpiration by the applicationof aquaporin inhibitors was more in high Tr H77 under lowVPD. The variable range of transpiration responses followingAQP inhibition across experimental conditions (low or highVPD) and inhibitor used (AgNO3 vs H2O2) also suggests thatthe AQP-mediated water transport pathway may be a highlyflexible, dynamic part of water transport, which depends onenvironment changes of short- and long term (Steudle 2000a).There are most likely genotypic differences in (i) the portionof water transported through symplast; and (ii) the plasticity ofsymplast under the environmental fluctuations (here uponchanging VPD). There were also slight differences in theresponse to different inhibitors, indicating that there existdifferent populations of aquaporins with specific sensitivitiesto these different inhibitors, as shown earlier (Devi et al.2012). In any case, the higher transpiration inhibition in highTr H77/833-2 than in PRLT-2/89-33 upon aquaporin inhibitortreatment along with transpiration inhibition upon apoplasticblockage suggests that high Tr H77/833-2 depends on bothwater transport pathways, and probably predominantly on theAQP-mediated pathway. This is in agreement with similarfindings in wheat where high Tr cultivar Kukri had a higherdecrease in transpiration following symplastic inhibition thanlow Tr cultivar RAC875 (Schoppach et al. 2014). This wassupported by the larger root hydraulic conductivity decreaseof H77/833-2 than in PRLT-2/89-33 upon AQP inhibitortreatment. The fact that H77/833-2 had higher transpirationinhibition at low VPD, but lower transpiration inhibitionfrom the application of an aquaporin inhibitor at the end of anascending series of VPDs allow us to speculate/hypothesisethat this genotype could have upregulated the synthesis of thepopulation of aquaporins targeted by the inhibition, and thisis currently the object of additional research. Indeed, thedecrease in root hydraulic conductivity of PRLT-2/89-33following apoplastic blockage, i.e. ~60%, was within a closerange of the transpiration inhibition. By contrast, the roothydraulic conductivity of H77/833-2 following aquaporininhibition was also in the order of 60% but the transpirationdecline was only 20% or so, which suggest that this genotypehas means to compensate transpiration demand via other means,either upregulation of same/other populations of aquaporins,in agreement with earlier report of an increasing in the roothydraulic conductivity of wheat roots following an increase inthe evaporative demand (Kudoyarova et al. 2011).
Conflicts of interest
The authors declare no conflicts of interest.
Acknowledgements
The authors acknowledge the support of ICRISAT (Blue Sky ResearchProject on aquaporins), from the CGIAR Research Program on Dryland
P Functional Plant Biology M. Tharanya et al.
Cereals (CRP-DC), and from the USAID FTF Innovation laboratoryon Climate Resilient Pearl Millet. The authors thank Mr Mathew V Josephfor this expert technical support for the operation of growth chamber.
References
Andrews DJ, Anand Kumar K (1996) Use of West African millet landraceIniadi in cultivar development. Plant Genetic Resources Newsletter 105,15–22.
Bárzana G, Aroca R, Paz JA, Chaumont F, Martinez-Ballesta MC,Carvajal M, Ruiz-Lazano JM (2012) Arbuscular mycorrhizal symbiosisincreases relative apoplastic water flow in roots of the host plant underboth well-watered and drought stress conditions. Annals of Botany 109,1009–1017. doi:10.1093/aob/mcs007
Beaudette PC, Chlup M, Yee J, Emery RJN (2007) Relationships of roothydraulic conductivity and aquaporin gene expression in Pisum sativum:diurnal patterns and the response of HgCl2 and ABA. Journal ofExperimental Botany 58, 1291–1300. doi:10.1093/jxb/erl289
Biela A, Grote K, Otto B, Hoth S, Hedrich R, Kaldenroff R (1999) TheNicotiana tobacum plasma membrane aquaporin NtAQP1 is mercurysensitive and permeable for glycerol. The Plant Journal 18, 565–570.doi:10.1046/j.1365-313X.1999.00474.x
Bramley H, Turner NC, Turner DW, Tyerman SD (2009) Roles ofmorphology, anatomy and aquaporins in determining contrastinghydraulic behavior of roots. Plant Physiology 150, 348–364. doi:10.1104/pp.108.134098
Choudhary S, Sinclair TR, Prasad PVV (2013) Hydraulic conductance ofintact plants of two contrasting sorghum lines, SC15 and SC1205.Functional Plant Biology 40, 730–738. doi:10.1071/FP12338
Coskun D, Britto DV, Jean YK, Schulze LM, Becker A, Kronzucker HJ(2012) Silver ions disrupt K+ homeostasis and cellular integrity in intactbarley (Hordeum vulgare L.) roots. Journal of Experimental Botany 63,151–162. doi:10.1093/jxb/err267
Cuneo IF, Knipfer T, Brodersen CR, McElrone AJ (2016) Mechanicalfailure of fine root cortical cells initiates plant hydraulic decline duringdrought. Plant Physiology 172, 1669–1678. doi:10.1104/pp.16.00923
Damus M, Peerson RL, Enstone DE, Peterson CA (1997) Modificationsof cortical cell walls in roots of seedless vascular plants Botanica Acta110, 190–195. doi:10.1111/j.1438-8677.1997.tb00628.x
Daniels MJ, Mirkov TE, Chrispeels MJ (1994) The plasma membraneof Arabidopsis thaliana contains a mercury sensitive aquaporins thatis a homologous of the tonoplast water channels protein TIP. PlantPhysiology 106, 1325–1333. doi:10.1104/pp.106.4.1325
Devi JM, Sinclair TR, Vadez V (2010) Genotypic variation in peanut(Arachis hypogea L.) for transpiration sensitivity to atmospheric vaporpressure deficit. Crop Science 50, 191–196. doi:10.2135/cropsci2009.04.0220
Devi MJ, Sadok W, Sinclair TR (2012) Transpiration response of de-rootedpeanut plants to aquaporin inhibitors. Environmental and ExperimentalBotany 78, 167–172. doi:10.1016/j.envexpbot.2012.01.001
Ehlert C, Maurel C, Tardieu F, Simonneau T (2009) Aquaporin-mediatedreduction in maize root hydraulic conductivity impacts cell turgor andleaf elongation even without changing transpiration. Plant Physiology150, 1093–1104. doi:10.1104/pp.108.131458
Enstone DE, Peterson CA (1998) Effects of exposure to humid air onepidermal viability and suberin deposition in maize (Zea mays L.)roots. Plant, Cell & Environment 21, 837–844. doi:10.1046/j.1365-3040.1998.00310.x
Freundl E, Steudle E, Hartaung W (2000) Apoplastic transport of abscisicacid through of maize: effect of exodermis. Planta 210, 222–231.doi:10.1007/PL00008129
Gholipoor M, Prasad PVV, Mutava RN, Sinclair TR (2010) Geneticvariability of transpiration response to vapor pressure deficit amongsorghum genotypes. Field Crops Research 119, 85–90. doi:10.1016/j.fcr.2010.06.018
Habiba U, Ali S, Farid M, Shakoor MB, Rizwan M, IbrahimM, Abbasi GH,Hayat T, Ali B (2015) EDTA enhanced plant growth, antioxidantdefense system and phytoextraction of copper by Brassica napus L.Environmental Science and Pollution Research International 22(2),1534–1544. doi:10.1007/s11356-014-3431-5
Hachez C, Chaumont F (2010) Aquaporins: a family of highly regulatedmultifunctional channels. Advances in Experimental Medicine andBiology 679, 1–17. doi:10.1007/978-1-4419-6315-4_1
Hanson PJ, Sucoff EI, Markhart AH (1985) Quantifying apoplastic waterflow through red pine root systems using trisodium, 3-hydroxy-5,8,10-pyrenetrisulfonate’. Plant Physiology 77, 21–24. doi:10.1104/pp.77.1.21
Javot H, Maurel C (2002) The role of aquaporins in root water uptake.Annals of Botany 90, 301–313. doi:10.1093/aob/mcf199
Johansson I, Karlsson M, Johanson U, Larsson C, Kjellbom P (2000) Therole of aquaporins in cellular andwhole plantwater balance.Biochimica etBiophysica Acta 1465, 324–342. doi:10.1016/S0005-2736(00)00147-4
Kholová J, Vadez V (2013) Water extraction under terminal droughtexplains the genotypic differences in yield, not the anti – oxidantchanges in leaves of pearl millet (Pennisetum glaucum). FunctionalPlant Biology 40, 44–53. doi:10.1071/FP12181
Kholová J, Hash CT, Kakkera A, Ko�cová M, Vadez V (2010a)Constitutive water saving mechanisms are correlated with the terminaldrought tolerance of pearl millet (Pennisetum glaucum (L.) R.Br.).Journal of Experimental Botany 61, 369–377. doi:10.1093/jxb/erp314
Kholová J, Hash CT, Kumar PL, Yadav RS, Ko�cová M, Vadez V (2010b)Terminal drought –tolerant pearl millet (Pennisetum glaucum (L.) R.Br.)have high leaf ABA and limit transpiration at high vapor pressure deficit.Journal of Experimental Botany 61, 1431–1440. doi:10.1093/jxb/erq013
Knipfer T, Basse M, Verdeil JL, Fricke W (2011) Aquaporin-facilitatedwater uptake in barley (Hordeum vulagare L.) roots. Journal ofExperimental Botany 62, 4115–4126. doi:10.1093/jxb/err075
Kudoyarova G, Veselova S, Hartung W, Farhutdinov R, Veselov D,Sharipova G (2011) Involvement of root ABA and hydraulicconductivity in the control of water relations in wheat plants exposedto increased evaporative demand. Planta 233, 87–94. doi:10.1007/s00425-010-1286-7
Ligaba A, Katsuhara M, Shibasaka M, Djira G (2011) Abiotic stressmodulates the expression of major intrinsic proteins in barley(Hordeum vulgarae). Comptes Rendus Biologies 334, 127–139.doi:10.1016/j.crvi.2010.11.005
Maggio A, Joly RJ (1995) Effects of mercuric chloride on the hydraulicconductivity of tomato root systems. Plant Physiology 109, 331–335.doi:10.1104/pp.109.1.331
Mahalakshmi V, Bidinger FR, Raju DS (1987) Effect of timing of waterdeficit on pearl millet (Pennisetum americanum). Field Crops Research15, 327–339. doi:10.1016/0378-4290(87)90020-7
Manschadi AM, Christopher J, Devoil P, Hammer GL (2006) The role rootarchitectural traits in adaptaion of wheat to water limited environments.Functional Plant Biology 33, 823–837. doi:10.1071/FP06055
Miyamoto N, Steudle E, Hirasawa T, Lafitte R (2001) Hydraulicconductivity of rice roots. Journal of Experimental Botany 52,1835–1846. doi:10.1093/jexbot/52.362.1835
Morillon R, Chrispeels MJ (2001) The role of ABA and the transpirationstream in the regulation of the osmotic water permeability of leaf cells.Proceedings of the National Academy of Sciences of the United States ofAmerica 98, 14138–14143. doi:10.1073/pnas.231471998
ParentB,HachezC,RedondoE,SimonneauT,ChaumontF,TardieuF (2009)Drought and abscisic acid effects on aquaporin content translate intochanges in hydraulic conductivity and leaf growth rate: a trans-scaleapproach. Plant Physiology 149, 2000–2012. doi:10.1104/pp.108.130682
Perumalla CJ, Peterson CA, Enstone DE (1990) A survey of angiospermspecies to detect hypodermal Casparian bands. Roots with uniseratehypodermis and epidermis. Botanical Journal of the Linnean Society103, 93–112. doi:10.1111/j.1095-8339.1990.tb00176.x
Water transport pathway and sensitivity to VPD Functional Plant Biology Q
Peterson CA (1988) Exodermal Casparian bands, their significance for ionuptake by roots. Plant Physiology 72, 204–208. doi:10.1111/j.1399-3054.1988.tb06644.x
Ranathunge K, Steudle E, Lafitte R (2005) Blockage of apoplastic bypass-flow of water in rice roots by insoluble salt precipitates analogous toa Pfeffer cell. Plant, Cell & Environment 28, 121–133. doi:10.1111/j.1365-3040.2004.01245.x
Sadok W, Sinclair TR (2010a) Transpiration of ‘slow wilting’ andcommercial soybean (Glycine max (L.) Merr.) genotypes to threeaquaporin inhibitors. Journal of Experimental Botany 61, 821–829.doi:10.1093/jxb/erp350
Sadok W, Sinclair TR (2010b) Genetic variability of transpiration responseof soybean (Glycine max (L.) Merr.) shoots to leaf hydraulic conductanceinhibitor AgNO3. Crop Science 50, 1423–1430. doi:10.2135/cropsci2009.10.0575
Schoppach R, Wauthelet D, Jeanguenin L, Sadok W (2014) Conservativewater use under high evaporative demand associated with smaller rootmetaxylem and limited trans-membrane water transport in wheat.Functional Plant Biology. doi:10.1071/FP13211
Serraj R, Hash CT, Rizvi SMH, Sharma A, Yadav RS, Bidinger FR (2005)Recent advances in marker assisted selection for drought tolerance inpearlmillet.PlantProductionScience8, 334–337. doi:10.1626/pps.8.334
Sinclair TR, Hammer GL, Van Oosterom EJ (2005) Potential yield andwater use efficiency benefits in sorghum from limited transpirationrate. Functional Plant Biology 32, 945–952. doi:10.1071/FP05047
Sinclair TR, Zwieniecki MA, Holbrook NM (2008) Low leaf hydraulicconductance associated with drought tolerance in soybean. PhysiologiaPlantarum 132, 446–451. doi:10.1111/j.1399-3054.2007.01028.x
Sinclair TR, Messina CD, Beatty A, Samples M (2010) Assessment acrossthe United States of the benefits of altered soybean drought traits.Journal of Agronomy 102, 475–482. doi:10.2134/agronj2009.0195
Sivasakthi K, Tharanya M, Kholova J, Wangari RM, Thirunalasundari T,Vadez V (2017) Chickpea genotypes contrasting for vigour and canopyconductance also differ in their dependence on different water transportpathways. Frontiers in Plant Science 8, 1663. doi:10.3389/fpls.2017.01663
Steudle E (2000a) Water uptake by roots: an integration of views. Plant andSoil 226, 45–56. doi:10.1023/A:1026439226716
Steudle E (2000b) Water uptake by roots: effects of water deficit. Journalof Experimental Botany 51, 1531–1542. doi:10.1093/jexbot/51.350.1531
Steudle E, Peterson CA (1998) How does water through roots? Journalof Experimental Botany 49, 775–788.
Tamás L, Dudíková J, Dur�ceková K, Halušková L, Huttová J, Mistrík I,Ollé M (2008) Alterations of gene expression, lipid peroxidation, praline
and thiol content along the barley root exposed to cadmium. Journalof Plant Physiology 165, 1193–1203. doi:10.1016/j.jplph.2007.08.013
Thompson AJ, Andrews J, Mulholland BJ, McKee JMT (2007)Overproduction of abscisic acid in tomato increases transpirationefficiency and root hydraulic conductivity and influences leafexpansion. Plant Physiology 143, 1905–1917. doi:10.1104/pp.106.093559
Vadez V (2014) Root hydraulics: the forgotten side of root in droughtadaptation. Field Crops Research 165, 15–24. doi:10.1016/j.fcr.2014.03.017
VadezV,Kholova J, YadavRS,HashCT (2013a) Small temporal differencesin water uptake among varieties of pearl millet (Pennisetum glaucum (L.)R.Br.) are critical for grain yield under terminal drought. Plant and Soil371, 447–462. doi:10.1007/s11104-013-1706-0
Vadez V, Kholova J, Zaman-Allah M, Belko N (2013b) Water: the mostimportant ‘molecular’ component of water stress tolerance research.Functional Plant Biology 40, 1310–1322. doi:10.1071/FP13149
VadezV,Kholova J,Medina S, AparnaK, AnderbergH (2014) Transpirationefficiency: new insights into an old story. Journal of Experimental Botany65, 6141–6153. doi:10.1093/jxb/eru040
Vadez V, Kholová J, Hummel G, Zhokhavets U, Gupta SK, Hash CT (2015)LeasyScan: a novel concept combining 3D imaging and lysimetry forhigh-throughput phenotyping of traits controlling plant water budget.Journal of Experimental Botany 66, 5581–5593. doi:10.1093/jxb/erv251
Yadav RS, Hash CT, Bidinger FR, Cavan GP, Howarth CJ (2002)Quantitative trait loci associated with traits determining grain andstover yield in pearl millet under terminal drought stress. Theoreticaland Applied Genetics 104, 67–83. doi:10.1007/s001220200008
Zaman-Allah M, Jenkinson DM, Vadez V (2011a) A conservative patternof water use, rather than deep or profuse rooting, is critical for theterminal drought tolerance of chickpea. Journal of ExperimentalBotany 62, 4239–4252. doi:10.1093/jxb/err139
Zaman-Allah M, Jenkinson DM, Vadez V (2011b) Chickpea genotypescontrasting for seed yield under terminal drought stress in the fielddiffer for traits related to the control of water use. Functional PlantBiology 38, 270–281. doi:10.1071/FP10244
Zhang WH, Thermal SD (1999) Inhibition of water channels by HgCl2in intact wheat cells. Plant Physiology 120, 849–858. doi:10.1104/pp.120.3.849
Zimmermann HM, Steudle E (1998) Apoplastic transport across youngmaize roots: effects of the exodermis. Planta 206, 7–19. doi:10.1007/s004250050368
R Functional Plant Biology M. Tharanya et al.
www.publish.csiro.au/journals/fpb