pdnt kch nuclear plant y operated by nuclear management ... · y operated by nuclear management...
TRANSCRIPT

Committed to Nuclear Excellence Pdnt k c h Nuclear Plant Y Operated by Nuclear Management Company, LLC
December 19,2006 NRC 2006-0091 10 CFR 50.90
U.S. Nuclear Regulatory Commission ATTN: Document Control Desk Washington, DC 20555-0001
Point Beach Nuclear Plant, Units 1 and 2 Dockets 50-266 and 50-301 License Nos. DPR-24 and DPR-27
License Amendment Reauest 245. Response to Reauest for Additional Information; Technical Specification 3.3.4, Loss of Power Diesel Generator Start and Load Seauence Instrumentation
References: 1) Letter from NMC to NRC dated March 23,2006 (NRC 2006-0033) 2) Letter from NRC to NMC dated November 27,2006
I In Reference 1, Nuclear Management Company, LLC (NMC), dubmitted a request for an amendment to the Technical Specifications (TS) for Point Beach Nuclear Plant, Units 1 and 2. The proposed amendment would revise TS 3.3-4, "Loss of Power (LOP) Diesel Generator (DG) Start and Load Sequence Instrumentation".
In Reference 2, the Nuclear Regulatory Commission (NRC) staff requested additional information (RAI) to complete its evaluation. Enclosure 1 provides NMC's response to the staffs questions. Enclosure 2 provides supporting information requested in the staffs RAI.
Summaw of Commitments
1. Surveillance Procedures 1 RMP 9056-1, 1 RMP 9056-2,2RMP 9056-1 and 2RMP 9056-2 will be updated, prior to performance of the next channel calibration, to explicitly require that the subject relays be recalibrated within the as-left range if the as-found value is found outside the as-left range.
2. Surveillance Procedures 1 RMP 9056-1, 1 RMP 9056-2,2RMP 9056-1 and 2RMP 9056-2 will be revised to be consistent with the guidance provided in NRC RIS 2006-1 7 prior to performance of the next channel calibration.
3. Separate tolerance ranges established in the calculations will be incorporated into the relay data sheets for the calibration procedures (1 RMP 9056-1, 1 RMP 9056-2, 2RMP 9056-1 and 2RMP 9056-2) prior to performance of the next channel calibration. I
6590 Nuclear Road . Two Rivers, Wisconsin 5424' Telephone: 920.755.2321

Document Control Desk Page 2
I declare under penalty of perjury that the foregoing is true and correct. Executed on December 19,2006. 'I
Dennis L. Koehl / Site Vice-President, Point Beach Nuclear Plant Nuclear Management Company, LLC
Enclosures
cc: Regional Administrator, Region Ill, USNRC Project Manager, Point Beach Nuclear Plant, USNRC ~esidenll, c-mr Point T7.T-n==.mFF.sr,. Beach Nuclear 4 - Plant, , lL, 4 , ,, USNRC .<. - .. PSCW I
I

ENCLOSURE 1
RESPONSE TO REQUEST FOR ADDITIONAL INFORMATION LICENSE AMENDMENT REQUEST 245
TECHNICAL SPECIFICATION 3.3.4, LOSS OF POWER DIESEL GENERATOR START AND LOAD SEQUENCE INSTRUMENTATION
POINT BEACH NUCLEAR PLANT, UNITS 1 AND 2
The following information is provided in response to the Nuclear Regulatory Commission (NRC) staff's request for additional information (RAI) regarding Nuclear Management Company (NMC) letter dated March 23, 2006, which proposed an amendment to the license for Point Beach Nuclear Plant (PBNP) Units 1 and 2, to revise Technical Specification (TS) 3.3.4, “Loss of Power (LOP) Diesel Generator (DG) Start and Load Sequence Instrumentation”. The NRC staff's request is restated below with the NMC response following. NRC Request 1: Setpoint Calculation Methodology: Provide documentation (including sample calculations) of the methodology used for establishing the limiting setpoint (or nominal trip setpoint, NSP) and the limiting acceptable values for the as-found and as-left setpoints as measured in periodic surveillance testing as described below. Indicate the related analytical limits and other limiting design values (and the sources of these values) for each setpoint. NMC Response: The degraded voltage time delay setpoint calculation is performed within PBNP Calculation 2004-0002, “AC Electrical System Analysis”. The setpoint methodology utilized in the calculation was based on the guidance of PBNP Design Guide DG-I01, “Instrument Setpoint Methodology”, which is comparable to Method 3 in ISA recommended practice RP67.04.02-2000. However, the calculation is a stand alone document that provides the method in which the bus degraded voltage relay and bus time delay relay setpoints and their associated allowable values (AV) are determined. The sections of the calculation (listed below) that include the setpoint methodology, sample calculation, and limiting design values with their source are provided in Enclosure 2. 1. Methodology section (Pages 45, 50-51, 69 - 82 of Calc 2004-0002)
Applicable Items: Figure 1, Eq. 1 (pg. 50), Eq. 2 (pg. 51), and Section III.2.10
2. Assumption Section (Pages 86 - 89 of Calc. 2004-0002) Applicable Items: Section III.4.01 - III.4.03, and III.4.05 - III.4.08
Page 1 of 10

3. Input Section (Pages 90 – 97 of Calc. 2004-0002) Applicable Items: Section III.5.03 – III.5.13, and III.5.16 – III.5.18
4. Calculation Section (Pages 119 – 126, and Attachment C pages 3-8 of Calculation 2004-0002)
Applicable Items: Section III.6.09, Statistical Analysis (Attachment C pages 3-8)
5. Results Section (Pages 137 – 138 of Calculation 2004-0002) Applicable Items: Section III.7.07, III.7.08
6. Reference Section (Pages 142 – 147 of Calculation 2004-0002) 7. Calculation Minor Revision 2004-0002-00I (Pages 4 – 10) The calculation section (Items 4 and 7) includes the setpoint calculation based on the methodology (Item 1). The limiting design values (with sources) utilized within the setpoint calculation are provided in the assumption, input and calculation sections (Items 2, 3, 4 and 7). In addition, the analytical limits applied to the setpoint calculation as determined within calculation 2004-0002 are as follows. I. Safety Limit for maximum allowable time delay with SI signal present for the bus
degraded voltage relay (Block C Relay) [SLSI]
Value: 6 seconds Basis: The maximum time delay with an SI signal (SLSI) of 6 seconds ensures that all safety-related equipment supplied by the 4.16kV and 480V safeguards buses is protected from tripping on overcurrent while connected to offsite power under a degraded voltage condition and ensures the emergency diesel generators (EDGs) are ready to load within 15 seconds of the event. If an equipment breaker were to trip on overcurrent while connected to offsite power, the equipment would not be available for subsequent loading onto the EDGs when bus power is restored. The maximum time delay is established for the most limiting motor attempting to start in the voltage range between the degraded and loss of voltage setpoints, when the motor may not have sufficient voltage to start and will be in locked rotor condition for the entire duration. In addition, if the total time delay is greater than 9.3 seconds (to support 15 seconds ready to load), the assumptions within Chapter 14 Accident Analysis in the PBNP Final Safety Analysis Report (FSAR) would not be supported. By choosing a maximum time small enough to prevent overcurrent tripping of the most limiting safety-related motor that is also < 9.3 seconds required to support EDG breaker closure, all of the required loads will be available to operate when the EDG restores power to
Page 2 of 10

the safeguards buses to support the assumptions within the FSAR Chapter 14 Accident Analysis.
II. Analytical Limit for minimum allowable time delay with SI signal present for the bus degraded voltage relay (Block C Relay) [ALC-low]
Value: 4.6 seconds Basis: The minimum time delay with a SI signal (ALC-low) of 4.6 seconds ensures the time delay is long enough to ride through the starting of safety related loads in a loss of coolant accident without prematurely separating from the preferred offsite power source. The minimum time delay is established by performing a motor starting analysis at the minimum acceptable steady state minimum switchyard voltage and determines the longest time duration at which the 4.16 kV bus voltage drops below the worst-case maximum bus degraded voltage relay dropout voltage and until it recovers above the maximum bus degraded voltage relay pickup voltage for the most limiting starting sequence. Choosing a minimum time delay large enough prevents prematurely separating from the preferred offsite power source during a loss of coolant accident during short term undervoltage transients (e.g. motor starting).
III. Safety limit for maximum allowable time without SI signal present to support the
setpoint for the bus time delay relay (Block D Relay) [SLNSI]
Value: 48 seconds Basis: The maximum time delay without an SI signal (SLNSI) of 48 seconds ensures that all running safety-related equipment supplied by the 4.16kV and 480V safeguards buses is protected from tripping on overcurrent while connected to offsite power under a degraded voltage condition during normal plant operation. If an equipment breaker were to trip on overcurrent while connected to offsite power, the equipment would not be available for subsequent loading onto the EDGs when bus power is restored without manually resetting the overcurrent device. The maximum time delay is established for the most limiting safety-related equipment operating at voltages between the degraded and loss of voltage setpoints, when some equipment (e.g. motors) would be experiencing higher running currents as a result of the reduced bus voltages. Choosing a maximum time small enough to prevent overcurrent tripping of the most limiting safety-related equipment, all of the required loads will be available to operate if the safeguard buses are separated from offsite power by the degraded voltage logic and the EDG subsequently restores power to the safeguards buses.
Page 3 of 10

IV. Analytical Limit for minimum allowable time delay without SI signal present to support the setpoint for the bus time delay relay (Block D Relay) [ALD-low]
Value: 27.85 seconds Basis: The minimum time delay without an SI signal of 33 seconds is required to ensure the time delay is long enough to prevent unnecessary separation from the preferred offsite power source during a voltage transient for the starting of largest motor during normal plant operation. The minimum time delay was established by reviewing the maximum acceleration times of the larger 4 kV motors and determined the Reactor Coolant Pumps would provide the worst-case voltage transient as a result of the longest acceleration time. The minimum time delay (ALD-low) for the bus time delay relay of 27.85 seconds is established by subtracting the minimum expected time delay ( ) of the bus degraded voltage relay (Block C Relay) [5.15 seconds] from 33 seconds. This calculation is performed in section III.6.09 (7)b and provided in item 4 above. Choosing a minimum time delay large enough prevents prematurely separating from the preferred offsite power source during normal plant operation.
MINCTD
The As-left and As-found setting Limits determined within the setpoint calculation are as follows:
Value:
Bus degraded voltage relay (Block C Relay) As-found (Max): 5.68 seconds (Calculation Variable - AVC) As-found (Min): 5.38 seconds (Calculation Variable - MAFC) As-left (Max): 5.63 seconds (Calculation Variable – NTSPC) As-left (Min): 5.43 seconds (Calculation Variable – MATSPC)
Bus time delay relay (Block D Relay)
As-found (Max): 39.14 seconds (Calculation Variable – AVD) As-found (Min): 34.90 seconds (Calculation Variable – MAFD) As-left (Max): 38.09 seconds (Calculation Variable – NTSPD) As-left (Min): 35.89 seconds (Calculation Variable – MATSPD)
Basis:
New as-found and as-left setting limits for the bus degraded voltage relay and bus time delay relay are established in Calculations 2004-0002 and 2004-0002-00I. The current surveillance procedures (1RMP 9056-1, 1RMP 9056-2, 2RMP 9056-1 and 2RMP 9056-2), which calibrate the bus degraded voltage relay and bus time delay relay, include a single setting band for
Page 4 of 10

both the as-left and as-found limits (i.e., the limits are identical). The current calibration procedures require the as-left setting to be placed within the acceptable as-left/as-found tolerance range and a corrective action to be initiated if the as-found setting is outside the range. However, NMC will revise the procedure to include the acceptable as-found and as-left ranges as listed above. The procedure will also be revised to include an explicit statement that the relay will be recalibrated within the as-left range if the as-found setting is found to be outside the as-left range. The response to Question 4 provides further clarification on the process.
NRC Request 2: Safety Limit (SL)-related Determination: Provide a statement as to whether or not the setpoint is a limiting safety system setting (LSSS) for a variable on which a safety limit (SL) has been placed as discussed in Title 10 of the Code of Federal Regulations (10 CFR) Section 50.36(c)(1)(ii)(A). Such setpoints are described as “SL-Related” in the discussions that follow. In accordance with 10 CFR 50.36(c)(1)(ii)(A), the following guidance is provided for identifying a list of functions to be included in the subset of LSSSs specified for variables on which SLs have been placed as defined in Standard Technical Specifications (STS) Sections 2.1.1, “Reactor Core SLs” and 2.1.2, “Reactor Coolant System Pressure SLs.” This subset includes automatic protective devices in TSs for specified variables on which SLs have been placed that: (1) initiate a reactor trip or (2) actuate safety systems. As such, these variables provide protection against violating reactor core SLs, or reactor coolant system pressure boundary SLs. An example of instrument functions that might have LSSSs included in this subset in accordance with the plant-specific licensing basis, is the pressurizer pressure reactor trip. For each setpoint, or related group of setpoints that NMC determines not to be SL-related, explain the basis for this determination. NMC Response: The degraded voltage allowable values in TS 3.3.4 are not limiting safety system settings (LSSSs) upon which a safety limit has been placed as discussed in 10 CFR 50.36(c)(1)(ii)(A). Safety Limits for the reactor core and reactor coolant system (RCS) pressure are identified in PBNP TS Section 2.0. TS Bases state that safety limits are used to define the various RPS functions such that fuel design criteria are satisfied during steady state operation, normal operational transients, and anticipated operational occurrences. PBNP TS Bases 3.3.1, “Reactor Protection System (RPS) Instrumentation”, define limiting safety system settings (LSSS) as the allowable value setpoints, which in conjunction with the LCOs, establish the threshold for RPS action to prevent exceeding acceptable limits during design basis accidents. For PBNP, LSSSs are limited to RPS
Page 5 of 10

allowable values listed in TS 3.3.1. Setpoints in accordance with the allowable values ensure that safety limits are not violated during anticipated operational occurrences. These setpoints are chosen so that automatic protective actions will correct the most severe, anticipated abnormal situation before a safety limit is exceeded. The degraded voltage function provides for separation of the 4.16 kV safeguards buses from offsite power when sufficient offsite voltage is not available, thereby allowing the onsite EDG power sources to power the buses. This function is not directly related to the reactor core or RCS pressure safety limits in TS Section 2.0. The degraded voltage allowable values listed in TS SR 3.3.4.3.b establish as-found limits for the degraded voltage relays tested during channel calibration. The degraded voltage relay function supports reliable emergency power to both normal and accident loads when offsite power voltage is not sufficient. However, the degraded voltage trip circuits are not designed to correct any anticipated combination of transient conditions to protect a safety limit. Instead, they provide electrical bus protection during a degraded voltage condition. Therefore, the degraded voltage trip does not meet the PBNP TS criteria for an LSSS. NRC Request 3: For setpoints that are determined to be SL-related: The NRC letter to the Nuclear Energy Institute Setpoint Methods Task Force dated September 7, 2005 (ADAMS Accession No. ML052500004), describes setpoint-related TS (SRTS) that are acceptable to the NRC for instrument settings associated with SL-related setpoints. Specifically: Part “A” of the enclosure to the letter provides limiting conditions for operation notes to be added to the TS, and Part “B” includes a check list of the information to be provided in the TS Bases related to the proposed TS changes.
a. Describe whether and how NMC plans to implement the SRTS suggested in the September 7, 2005 letter. If NMC does not plan to adopt the suggested SRTS, then explain how NMC will ensure compliance with 10 CFR 50.36, “Technical Specifications,” by addressing Items 3b and 3c, below.
b. As-Found Setpoint evaluation: Describe how surveillance test results and
associated TS limits are used to establish operability of the safety system. Show that this evaluation is consistent with the assumptions and results of the setpoint calculation methodology. Discuss the plant corrective action processes (including plant procedures) for restoring channels to operable status when channels are determined to be “inoperable” or “operable but degraded.” If the criteria for determining operability of the instrument being tested are located in a document other than the TS (e.g., plant test procedure) explain how the requirements of 10 CFR 50.36 are met.
Page 6 of 10

c. As-Left Setpoint control: Describe the controls employed to ensure that the instrument setpoint is, upon completion of surveillance testing, consistent with the assumptions of the associated analyses. If the controls are located in a document other than the TS (e.g., plant test procedure) explain how the requirements of 10 CFR 50.36 are met.
NMC Response: As discussed in the response to Question 2, the subject setpoints are not SL-related. Therefore, Question 3 does not apply. NRC Request 4: For setpoints that are not determined to be SL-related: Describe the measures to be taken to ensure that the associated instrument channel is capable of performing its specified safety functions in accordance with applicable design requirements and associated analyses. Include in the discussion information on the controls NMC employs to ensure that the as-left trip setting after completion of periodic surveillance is consistent with NMC’s setpoint methodology. Also, discuss the plant corrective action processes (including plant procedures) for restoring channels to operable status when channels are determined to be “inoperable” or “operable but degraded.” If the controls are located in a document other than the TS (e.g., plant test procedure), describe how it is ensured that the controls will be implemented. NMC Response: Surveillance testing (channel calibration) is performed on the degraded voltage time delay relays on an 18-month frequency as required by TS SR 3.3.4.3. Channel calibration verifies that the relay settings are within the limits assumed in the degraded voltage analysis and the relays are therefore capable of performing their safety function. The specific test procedures for the 18-month calibration are Routine Maintenance Procedures (RMPs) 1&2 RMP 9056-1 and 1&2 RMP 9056-2. Presently, the RMP as-left and as-found setting tolerances for the relay time delays are a single range equal to the as-left tolerance, rather than separate ranges with an as-found tolerance larger than the as-left tolerance. This single range is the same range as the as-left setting tolerance used in the degraded voltage analysis calculation. Separate as-left and as-found setting tolerances have been established in Calculation 2004-0002 and Calculation Minor Revision 2004-0002-00I, as discussed in Question 1. The separate tolerance ranges established in the calculations will be incorporated into the relay data sheets in the RMP calibration procedures before the next channel calibration occurs. The current calibration procedures require the relay as-left setting to be within the as-left/as-found range at the completion of each calibration; however, that requirement
Page 7 of 10

is not explicitly stated. When the procedures are updated with the separate as-left and as-found setting bands, the procedure will also be revised to explicitly require that the relay be recalibrated within the as-left range if the as-found value is found outside the as-left range. The explicit requirement will further support the calculation methodology by reinforcing the requirement that the relays must always be placed within the as-left range at the completion of calibration. If an as-found setting is currently found to be outside the single as-left/as-found tolerance range, the calibration procedure requires that a corrective action be initiated. Further, if the as-found setting is found to be outside the allowable value (currently administratively controlled to the allowable value determined in Calculation 2004-0002), the relay would also be declared inoperable. For either of these two conditions, the relay could be returned to service if the relay can be recalibrated within the as-left setting tolerance. However, NMC will revise the subject surveillance procedures to be consistent with the guidance provided in NRC RIS 2006-17 dated August 17, 2006. Specifically, the procedure will be revised as follows: (1) A separate as-found tolerance range will be added to the relay calibration data sheets based on calculation; the upper limit of this as-found range will be the allowable value for the relay time delay setting; (2) The procedure will include a requirement to recalibrate the relay within the as-left range if the as-found value is outside the as-left range but still within the as-found range; (3) The procedure will require declaring the relay inoperable if the as-found value is outside the as-found tolerance range. (4) The procedure will require an evaluation of the relay operability by Engineering prior to returning the relay to an operable status if the as-found value is outside the as-found tolerance range (i.e., inoperable) and can be recalibrated within the acceptable as-left tolerance range. The evaluation of operability will ensure the relay is functioning as designed by verifying the relay calibration history is within a 95/95 confidence level consistent with the calculation setpoint methodology. This procedure revision will be implemented prior to the next calibration of the degraded voltage relays. In addition to the 18-month surveillance, a Trip Actuating Device Operational Test (TADOT) is performed every 31 days on the combined trip time of the degraded voltage relay (Block C Relay) and bus time delay relay (Block D Relay) to support TS SR 3.3.4.2. The TADOT functional test records the total degraded voltage delay time without an SI signal present. The TADOT ensures the relays are operating as expected and the total time delay is within the degraded voltage analysis tolerance. The TADOT is performed by Procedures 1&2 RMP 9071-1 and 1&2 RMP 9071-2. In summary, the relay calibration tests performed for TS SR 3.3.4.3 and the relay functional tests performed for TS SR 3.3.4.2 ensure that the associated instrument channels are capable of performing their specified safety functions within the limits of the degraded voltage analysis.
Page 8 of 10

NRC Request 5: NMC’s justifications for changing the wording in SR 3.3.4.3b from “with SI signal present” to “bus degraded voltage relay” and from “without SI signal present” to “bus time delay relay,” is not clear to the NRC staff. The NRC staff believes that the current wording is clear and is consistent with Branch Technical Position PSB-1 which clearly requires two-time delay functions one with and the other without SI signal. Provide additional justification for this proposed change. NMC Response: The purpose of the proposed terminology change is to reduce ambiguity in the conduct of the surveillance requirements. The terminology change does not alter any surveillance requirements, it merely clarifies existing requirements. Two time delay functions, one with and the other without a SI signal, will continue to be required by the SR. The Point Beach degraded voltage protection design has a “with SI signal present” time delay and “without SI signal present” time delay. The time delays are established as follows:
(1) The “with SI signal present” time delay is synonymous with the bus degraded voltage relay (Block C Relay) time delay that actuates the degraded voltage protection if an SI signal is present coincident with degraded voltage; (2) The “without SI signal present” time delay consists of the sum of the bus degraded voltage relay (Block C Relay) delay plus the bus time delay relay (Block D Relay) delay that occur in series if degraded voltage exists during normal plant operation.
This series relationship of the Block C and Block D relays is shown in Figure 1 of Calculation 2004-0002 (see Enclosure 2) and in the following relay block diagram:
Page 9 of 10

Page 10 of 10
Please note that the above diagram clarifies (and differs from) the corresponding diagram in the March 23, 2006 submittal (Reference 1). Relay Blocks D and E in the above diagram are reversed from those shown in the original submittal. The clarification to Blocks D and E was made to align this diagram with Figure 1 in Calculation 2004-0002 so that Block D represents the bus time delay relay without an SI signal present. (Only the above description was revised; the physical relay arrangement remains unchanged.) The purpose for reassigning the allowable values (AVs) to specific relays, rather than to the “with SI” and “without SI” functions, is to provide consistency with relay calibration practices and other TS AVs. The bus degraded voltage relay and bus time delay relay are calibrated independently. Individual AVs for each relay would allow the direct comparison of the relay’s as-found time delay to the AV for determining operability of each individual relay. The current combined time delay AV for “without SI signal present” requires that the “with SI signal” delay be subtracted from the “without SI signal” delay to determine the acceptable AV for the bus time delay relay (Block D relay). The proposed change will allow the AV to be directly compared to the as-found time delay in the relay calibration procedures to determine relay operability. Applying the AV to specific relays is consistent with AVs in RPS TS 3.3.1 and ESFAS TS 3.3.2 that apply to specific trip bistables. The proposed nomenclature change to the two time delay AVs will continue to provide time delays for degraded voltage protection scheme “with” and “without” an SI signal present, consistent with Branch Technical Position PSB-1. Revised TS Bases page B 3.3.4-6 describes how the “with” and “without” SI signal time delays are provided in the degraded voltage protection design.

ENCLOSURE 2
PBNP CALCULATION 2004-0002, “AC ELECTRICAL SYSTEM ANALYSIS”
LICENSE AMENDMENT REQUEST 245 TECHNICAL SPECIFICATION 3.3.4, LOSS OF POWER
DIESEL GENERATOR START INSTRUMENTATION
POINT BEACH NUCLEAR PLANT, UNITS 1 AND 2
The following sections of PBNP Calculation 2004-0002, “AC Electrical System Analysis”, are provided:
1. Methodology section (Pages 45, 50 - 51, 69 - 82 of Calc. 2004-0002)
Applicable Items: Figure 1, Eq. 1 (pg. 50), Eq. 2 (pg. 51), and Section III.2.10
2. Assumption Section (Pages 86 - 89 of Calc. 2004-0002) Applicable Items: Section III.4.01 - III.4.03, and III.4.05 - III.4.08
3. Input Section (Pages 90 – 97 of Calc. 2004-0002) Applicable Items: Section III.5.03 – III.5.13, and III.5.16 – III.5.18
4. Calculation Section (Pages 119 – 126, and Attachment C pages 3-8 of Calculation 2004-0002)
Applicable Items: Section III.6.09, Statistical Analysis (Attachment C pages 3-8)
5. Results Section (Pages 137 – 138 of Calculation 2004-0002) Applicable Items: Section III.7.07, III.7.08
6. Reference Section (Pages 142 – 147 of Calculation 2004-0002)
7. Calculation Minor Revision 2004-0002-00I (Pages 4 – 10)
(58 pages follow)

Calculation 2004-0002 Revision 0
Section III– Degraded Voltage Analysis
Page 45
Figure 1: Degraded Voltage Protection Loop Block Diagram:
A06
4160 to 120VPotential
Transformer
UndervoltageRelay
UV dropout andpickup functions
UndervoltageRelay
Time delayfunction
Time delay Relay
Auxiliary Relay 1
with SI signal
A B C D
E
Auxiliary Relay 2
withou SI signal
Trip Bus MainBreaker
B-Train Degraded Voltage Scheme
F
A-Train Degraded Voltage SchemeA05
4160 to 120VPotential
Transformer
UndervoltageRelay
UV dropout andpickup functions
UndervoltageRelay
Time delayfunction
Time delayRelay
AuxiliaryRelay 1
A B C D
E
Trip BusMain Breaker
2/3 trip logicto
without SI signal
with SI signalTrip Bus
Main Breaker
2/3 trip logicto
Trip BusMain Breaker
2/3 trip logicto
Table 1: Degraded Voltage Loop Component Information
Component ID Block Diagram Component Mfr / Model
1-A05 1-A06 2-A05 2-A06
A – Potential XFMR West 1483798 or GE Type JVM-3
No ID No ID No ID No ID
B & C – UV Relay ABB 27N
411T4175-HF-L
PB1 274/A05 PB1 275/A05 PB1 276/A05
PB1 274/A06 PB1 275/A06 PB1 276/A06
PB2 274/A05 PB2 275/A05 PB2 276/A05
PB2 274/A06 PB2 275/A06 PB2 276/A06
D – TD Relay
(no SI signal present)
Agastat ETR 14D3D004 or
14D3D003
PB1 TDRA/A05 PB1 TDRB/A05 PB1 TDRC/A05
PB1 62-1/A-06 PB1 62-2/A-06 PB1 62-3/A-06
PB2 TDRA/A05 PB2 TDRB/A05 PB2 TDRC/A05
PB2 62-1/A-06 PB2 62-2/A-06 PB2 62-3/A-06
E – Aux Relay 1
(SI signal present) Westinghouse NBFD65NR
PB1 274X/A05 PB1 275X/A05 PB1 276X/A05
PB1 274X/A06 PB1 275X/A06 PB1 276X/A06
PB2 274X/A05 PB2 275X/A05 PB2 276X/A05
PB2 274X/A06 PB2 275X/A06 PB2 276X/A06
F – Aux Relay 2 ABB
RXMA-2 N/A
PB1 62-1X1/A06 PB1 62-2X1/A06 N/A
PB2 62-1X1/A06 PB2 62-2X1/A06

Calculation 2004-0002 Revision 0
Section III– Degraded Voltage Analysis
Page 50
on the spreadsheet. To make the sample size representative of the nominal 18-month calibration interval, only those as-left/as-found pairings that were measured within ± 25% of 18 months (between 400 and 675 days apart) were analyzed.
c. Several calibrations were performed with M&TE that was less accurate than the M&TE required by the calibration procedure (This issue was documented in CAP032002). These readings were discarded from the final sample set.
d. From the population of as-left/as-found pairings that were suitable for analysis, the standard deviation was calculated using the Excel STDEV function.
e. The standard deviation was then multiplied by a factor based on the sample size to determine a 95% confidence level drift value.
f. DG-I01 provides the method of identifying and removing “outliers” from the sample population.
g. The data set was tested for “normalcy” by determining skewness and kurtosis using the procedure in DG-I01 Appendix H.
(3) The total loop error (TLE) includes all relay uncertainties (except the PT
ratio correction) and is determined in accordance with the requirements of Design Guide DG-I01 (Reference IV.4.03). The setpoint methodology at PBNP utilizes a combination of the straight sum and the square root sum of the square (SRSS) plus algebraic approaches. The error effects are evaluated based on known behavior and are characterized as independent, dependent, random or non-random. The random elements of uncertainty are combined by SRSS, and any non-random uncertainties (commonly known as a bias) are added algebraically (straight sum) to the SRSS result according to sign. The uncertainty equation for each instrument is based on the characteristics of each applicable element of uncertainty. Therefore, the following general equation is utilized to calculate the positive (TLE+) and negative (TLE-) total loop uncertainty and is developed in design guide DG-I01.
(Eq. 1) ( )[ ] ∑∑∑ −+±+++±= ZYXDCBATLE 21222
Where: A, B = Independent and Random uncertainty errors C, D = Dependent and Random uncertainty errors X = Non-random error with unknown sign Y = Non-random positive bias Z = Non-random negative bias

Calculation 2004-0002 Revision 0
Section III– Degraded Voltage Analysis
Page 51
(4) The total measurable uncertainty (TMU) is determined similarly to TLE, but is limited to those errors that are included in the portion of the loop that is measured during the calibration of the instruments/relays. The TMU is utilized to establish the Technical Specification value (Allowable Value) for the degraded voltage relays by “backing off” of the nominal trip setpoint (NTSP). Therefore, the following equation is utilized to calculate the measurable total loop uncertainty and is developed based on Design Guide DG-I01.
(Eq. 2) ( )[ ] ∑∑∑ −+±+++±= WVUHGFETMU 21222
Where: E, F = Independent and Random uncertainty errors
included in Calibration (Measurable error) G, H = Dependent and Random uncertainty errors included
in Calibration (Measurable error) U = Non-random error with unknown sign included in
Calibration (Measurable error) V = Non-random positive bias included in Calibration
(Measurable error) W = Non-random negative bias included in Calibration
(Measurable error)
(5) The degraded voltage Safety Limit (SL) is determined for each safety related 4.16 kV bus in Sections III.2.04 and III.2.05. The SL is established on a base voltage relative to the 4.16 kV system (See Figure 2, Item 1 ). The degraded voltage Analytical Limit (AL) is established based on the most limiting SL for the safety related 4.16 kV buses. This provides a common AL for each safety related 4.16 kV bus in which the degraded voltage relays setpoints will be determined and will establish a single Technical Specification Allowable Value for the 4.16 kV system. (See Figure 2, Item 2 ).
(6) The degraded voltage relays require an input voltage of 0 – 150 VAC.
Therefore, a potential transformer (PT) is used to convert the 4.16kV nominal bus voltage signal to a low voltage (120V nominal) signal using a PT with a nominal 35:1 turns ratio. The low voltage signal is determined by dividing the Analytical Limit by the nominal turns ratio of the PT (n) and by the ratio correction factor in the negative direction of the PT (PT-). The low voltage signal corresponding to the Analytical Limit will be defined as VAL and is determined by the following equation:
(Eq. 3) −=PTn
ALVAL *

Calculation 2004-0002 Revision 0
Section III– Degraded Voltage Analysis
Page 69
f. 4160 - 480V station service transformer breakers: The station service transformers (1X-13, 1X-14, 2X-13, and 2X-14) that feed the safety related 480V switchgear are protected on both the primary and secondary side of the transformer. As shown in Calculation 2001-0049 (Reference IV.1.02) the primary and secondary protective devices fully coordinate with each other. Therefore, the overcurrent trip time of the primary protective device on the 4.16 kV switchgear will be at a minimum equal to or greater than the trip time established for secondary main protective device on 480V switchgear. Therefore, the secondary protective device (480V switchgear main breaker) will be used to establish the limiting time delay for both protective devices.
g. The maximum allowable time delay during normal plant operation
without a safety injection is determined to be the most limiting trip time from a main breaker or individual protective devices for the equipment. This will establish the safety limit for the degraded voltage relays time delay setpoint without a safety injection signal.
III.2.10 Determine Degraded Voltage Relays Time Delay Setpoints
The degraded voltage time delay relays perform two design functions to initiate a degraded voltage trip to disconnect the 4.16 kV safeguards buses from offsite power following either (1) time delay associated with a safety injection signal and (2) time delay associated without a safety injection signal (See Figure 1 in Section III.2.06). The first time delay setpoint (with a safety injection signal) is established to ensure quick grid separation from a sustained degraded voltage signal during a loss of coolant accident, but must be long enough to ride through the starting of accident loads without separating if the preferred offsite power voltage is acceptable. The second time delay setpoint is established to ensure that operating safety related equipment is not damaged or becomes unavailable due to protective device actuation under a sustained degraded voltage condition during normal plant operations (no safety injection signal present). Therefore, the two degraded voltage relay time delay setpoints are established for the safety related buses to ensure no spurious (unnecessary) trips of protective devices and/or no thermal damage occurs to safety related components. The degraded voltage time delay relays provide the means to power the safety related buses with emergency power (via Emergency Diesel Generators) when offsite power is insufficient (i.e. degraded voltage or loss of voltage) to allow safe unit shutdown. Therefore, the degraded voltage time delay relays are provided in two-out-of-three logic to actuate after a specified time frame when a sustained degraded voltage condition is detected for each 4.16 kV safety related bus (References IV.5.02, IV.5.04, and IV.5.07). The degraded voltage time delay relays ensure that the Engineering Safety Features (ESF) equipment is protected from damage during the time frame that the degraded voltage relays

Calculation 2004-0002 Revision 0
Section III– Degraded Voltage Analysis
Page 70
have sensed a sustained degraded voltage until the relays actuate. The degraded voltage time delay relays are categorized as Category A instrument setpoints per Design Guide DG-I01 (Reference IV.4.03) and will utilize a criteria which corresponds to a 95% probability at a 95% confidence level (95/95) after the degraded voltage relay dropout setting is reached. The Block F relay time delay is also considered for the Train B (A06) safeguards buses. Figure 1, in Section III.2.06, is a block diagram of the components that makeup each 4.16 kV safety related bus degraded voltage protection loop on both units. There are two buses (A-train and B-train) per unit. There are three independent loops per bus that supply a two-out-of-three coincidence logic (twelve independent loops total). This section describes the time delay set points established by blocks C, D and E. Figures 3 and 4 below illustrate the setpoint determination sequence (numbered circles) and the relationship between the Safety Limit (SL), Analytical Limit (AL), Nominal Trip Setpoint (NTSP), Allowable Value (AV) and the Actual Trip Setpoint (ATSP) for the degraded voltage time delay relays. Figure 3 applies to time delay with a safety injection signal and Figure 4 applies to time delay without a safety injection signal.

Calculation 2004-0002 Revision 0
Section III– Degraded Voltage Analysis
Page 71
Figure 3: Degraded Voltage Time Delay with a Safety Injection Signal
Allowable Value (AVC) inTechnical Specification 3.3.4.3.b
Analytical Limit (ALC-low)
(+)
Total Loop Error
3
4
1
5
ATSPC
MATSPC
Total Loop Error
(+)
(-)
NTSPC
6 7
t = 0 seconds
Safety Limit (SLSI)
Analytical Limit (ALC-high)
Margin
Total Measurable Uncertainties
2
Block C Allowablesetting tolerance
(+) Block F(B-Train Only)
Block E
Block C(Figure 1)
Fixed TimeDelay
Fixed TimeDelay
Largest Motor Starting Transient(+)
4 5
8
9
Start of Degraded Voltage Event

Calculation 2004-0002 Revision 0
Section III– Degraded Voltage Analysis
Page 72
Figure 4: Degraded Voltage Time Delay without a Safety Injection Signal
ATSPD
NTSPD
Allowable Value (AVD) inTechnical Specification 3.3.4.3.b
Analytical Limit (ALD-low)
(+)
(-)
Total Loop Error
3
4
1
5
Total Loop Error
6 7
8
t = 0 seconds
Safety Limit (SLNSI)
Analytical Limit (ALD-high)Margin
Total Measurable Uncertainties
2
Block D Allowablesetting range
(+)
MATSPD
Block F(B-Train Only)
Block D
Block C (MaximumTime Delay)
Fixed TimeDelay
(+)
(-) Block C (MinimumTime Delay)
(+)
Largest Motor Starting Transient
TDCMIN
Start of Degraded Voltage Event
5
4
9
Calculation 2004-0002 Revision 0
Section III– Degraded Voltage Analysis
Page 73
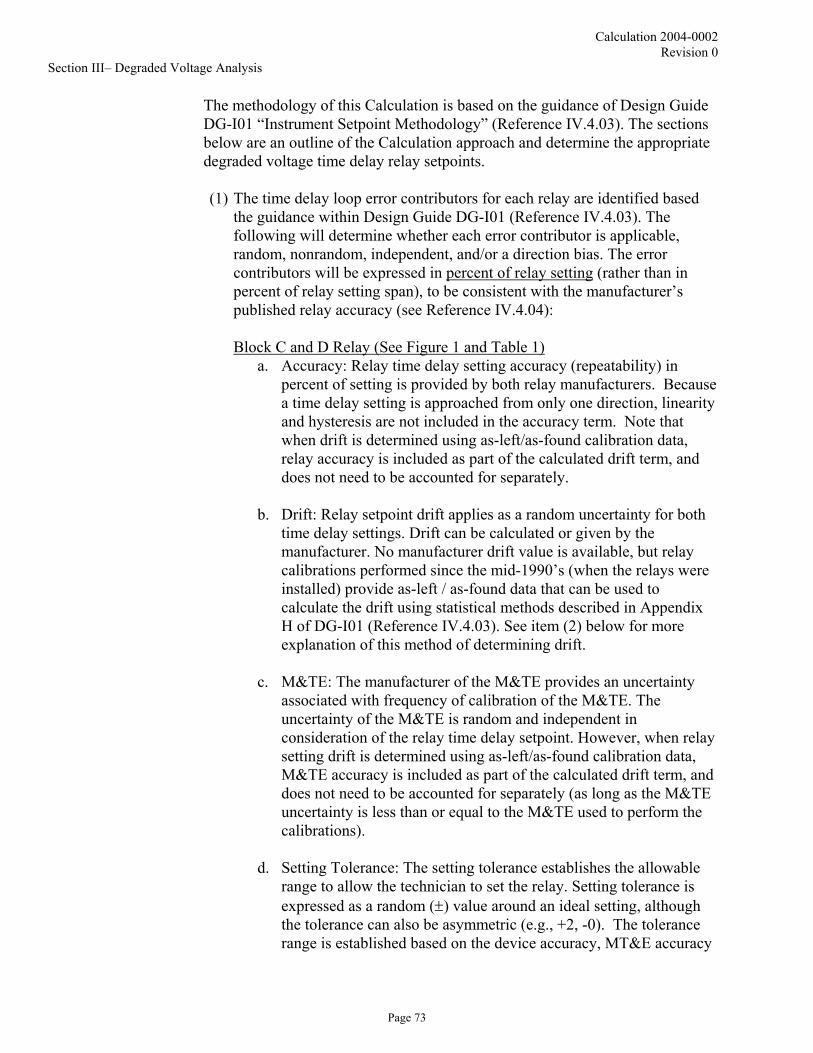
The methodology of this Calculation is based on the guidance of Design Guide DG-I01 “Instrument Setpoint Methodology” (Reference IV.4.03). The sections below are an outline of the Calculation approach and determine the appropriate degraded voltage time delay relay setpoints. (1) The time delay loop error contributors for each relay are identified based
the guidance within Design Guide DG-I01 (Reference IV.4.03). The following will determine whether each error contributor is applicable, random, nonrandom, independent, and/or a direction bias. The error contributors will be expressed in percent of relay setting (rather than in percent of relay setting span), to be consistent with the manufacturer’s published relay accuracy (see Reference IV.4.04):
Block C and D Relay (See Figure 1 and Table 1)
a. Accuracy: Relay time delay setting accuracy (repeatability) in percent of setting is provided by both relay manufacturers. Because a time delay setting is approached from only one direction, linearity and hysteresis are not included in the accuracy term. Note that when drift is determined using as-left/as-found calibration data, relay accuracy is included as part of the calculated drift term, and does not need to be accounted for separately.
b. Drift: Relay setpoint drift applies as a random uncertainty for both
time delay settings. Drift can be calculated or given by the manufacturer. No manufacturer drift value is available, but relay calibrations performed since the mid-1990’s (when the relays were installed) provide as-left / as-found data that can be used to calculate the drift using statistical methods described in Appendix H of DG-I01 (Reference IV.4.03). See item (2) below for more explanation of this method of determining drift.
c. M&TE: The manufacturer of the M&TE provides an uncertainty
associated with frequency of calibration of the M&TE. The uncertainty of the M&TE is random and independent in consideration of the relay time delay setpoint. However, when relay setting drift is determined using as-left/as-found calibration data, M&TE accuracy is included as part of the calculated drift term, and does not need to be accounted for separately (as long as the M&TE uncertainty is less than or equal to the M&TE used to perform the calibrations).
d. Setting Tolerance: The setting tolerance establishes the allowable
range to allow the technician to set the relay. Setting tolerance is expressed as a random (±) value around an ideal setting, although the tolerance can also be asymmetric (e.g., +2, -0). The tolerance range is established based on the device accuracy, MT&E accuracy

Calculation 2004-0002 Revision 0
Section III– Degraded Voltage Analysis
Page 74
used to calibrate the relays, the limitations of the technician in adjusting the device, and the need to minimize calibration and testing time.
e. Power Supply Effect: Relay time delay power supply affect is
included in the total uncertainty provided by the manufacturer for both relays. The manufacturer provided a total uncertainty of the time delay relay to be utilized.
f. Temperature Effect: Relay time delay power supply affect is
included in the total uncertainty provided by the manufacturer for both relays. The manufacturer provided a total uncertainty of the time delay relay to be utilized.
g. Humidity Effect: There is no uncertainty due to humidity changes
provided by the relay manufacturer. The relays are rated over a temperature range of +10°C to +40°C (+50°F to +104°F) and have performed well under varying humidity conditions in the switchgear rooms for 10 years. Because the as-left/as-found calibration data includes any effect caused by these humidity variations, no separate uncertainty due to humidity is considered in the total relay error.
h. Radiation Effect: The relays are located in shielded plant areas
(control building and diesel generator building) that will not experience radiation exposure greater than background, even under accident conditions. Therefore, no radiation effect is considered in the total relay error.
i. Seismic or Vibration Effect: Seismic or Vibration Effect: There is
no uncertainty due to seismic or vibration effect provided by the relay manufacturer. The Model 27N (Block C) relay is a solid-state device rated at more than 6g ZPA biaxial broadband multi-frequency vibration without damage or malfunction, per ANSI C37.98-1978 (Reference IV.4.04). The Model ETR (Block D) is a solid-state relay that is qualified for a standard response spectrum shape in IEEE Std. 501-1978. Therefore, no additional uncertainty is required for the relay for seismic conditions when maintained within capability.
Block E and F Relay (See Figure 1 and Table 1)
a. Accuracy: The block E (NBFD) relay and block F (RXMA-2) relay are fixed operating time relays. The manufacturer provides a maximum operating time of the relays that includes all uncertainty for the relays. The relays do not require calibration because no setpoint is required therefore drift and M&TE do not contribute additional uncertainty to the relay time delay.

Calculation 2004-0002 Revision 0
Section III– Degraded Voltage Analysis
Page 75
(2) As-found/as-left calibration data will be utilized to perform a statistical
analysis to establish the drift error on the degraded voltage time delay relays for Block C and Block D. The general approach in performing a statistical analysis of the data is provided in Appendix H of Design Guide DG-I01 (Reference IV.4.03). The following is a summary of the steps performed in the statistical analysis:
a. As-left and as-found values for the degraded voltage relay dropout
settings were compiled from historical plant relay calibration data collected between 1996 and 2004. The raw data for each of the twelve degraded voltage relays were tabulated in Attachment A, including as-left and as-found dropout values and as-left and as-found dates.
b. From the dropout values and dates, the number of days between
calibrations and the measured drift over the interval was determined on the spreadsheet. To make the sample size representative of the nominal 18-month calibration interval, only those as-left/as-found pairings that were measured within ± 25% of 18 months (between 400 and 675 days apart) were analyzed.
c. From the population of as-left/as-found pairings that were suitable
for analysis, the standard deviation was calculated using the Excel STDEV function.
d. The standard deviation was then multiplied by a factor based on
the sample size to determine a 95% confidence level drift value.
e. DG-I01 provides the method of identifying and removing “outliers” from the sample population.
f. The data set was tested for “normalcy” by determining skewness
and kurtosis using the procedure in DG-I01 Appendix H.
(3) The total loop error (TLE) for each degraded voltage time delay relay is determined in accordance with Section III.2.06, Item (3) and Equation 1. The total measurable uncertainty (TMU) for each degraded voltage time delay relay is determined in accordance with Section III.2.06, Item (3) and Equation 2

Calculation 2004-0002 Revision 0
Section III– Degraded Voltage Analysis
Page 76
(4) The degraded voltage time delay relays have two different schemes that account for the different plant operating conditions. The schemes are developed for a loss of coolant accident (safety injection signal) and for normal plant operations (without a safety injection signal). Figure 1 shows a block diagram representation of the A-train and B-train degraded voltage sequence. Blocks C, D, and E (and F for B-train only) represent the time delay portion once the 4.16 kV bus voltage meets the dropout voltage setpoint. Note that Block C is a common time delay that contributes to both delays with and without a safety injection signal. Figures 3 and 4 show a pictorial representation of the process in which the degraded voltage time delay relays are established. The time delay with a safety injection signal will be established in Step (5) and the time delay for normal plant operation (without a safety injection signal) will be established in Step (6).
(5) Refer to Figure 3 for the following discussion. The total degraded voltage
time delay with a safety injection signal is established with Blocks C and E (and F for B-train only) from Figure 1. The total time delay of the degraded voltage relays are a summation of Blocks C, E, and F relays actuation times. Blocks E and F are fixed operating time relays and therefore have a fixed time delay as shown in Figure 3. Block C provides an adjustable time delay established to ensure the operation of safety related equipment during a loss of coolant accident coincident with a degraded voltage condition. Therefore, the setpoint of the Block C time delay relay is determined to ensure the plant equipment is protected and no spurious overcurrent trips occur on safety related equipment during a loss of coolant event (safety injection signal) because the adjustable time delays for Blocks C and D are additive. This setpoint will also be used to establish the setpoint for the Block D relay during normal plant operation (without a safety injection signal). The following steps develop the Safety Limit (SLSI), Analytical limits (ALhigh and ALlow), Technical Specification Allowable Value (AVC), and Block C relay setpoints (NTSPC, ATSPC, and MATSPC) for the degraded voltage time delay scheme with a safety injection signal (see Figure 1).
a. The maximum allowable total combined time delay of the relays
must ensure that during an accident coincident with degraded voltage, the time delay relays allow the safety related buses to separate from offsite power prior to spurious protection device trips due to overcurrent that would make safeguards equipment unavailable to sequence automatically onto the emergency diesel generators. The maximum allowable time delay is considered the safety limit (SLSI) to protect all safety related equipment. The safety limit time delay is established based on the methodology in Section III.2.09 (See Figure 3, Item 1 ).

Calculation 2004-0002 Revision 0
Section III– Degraded Voltage Analysis
Page 77
b. Two Analytical Limits (maximum and minimum) are required for the degraded voltage time delay with a safety injection signal (ALC-
high and ALC-low). The ALC-high is established to protect the SLSI maximum allowable time delay by including the fixed operating time relays (Blocks E and F) and also including margin to permit a small change in the SLSI without the requiring the Technical Specification Allowable Value to change. Block E and F fixed delays are included between the SLSI and ALC-high to establish a Technical Specification Allowable Value to be directly compared to the as-found relay setpoint during calibrations to evaluate the operability of the relays to protect the Safety Limit. The ALC-high is determined by Equation 15 for A-train and B-train, which adds the fixed operate time delay (Blocks E and F). (See Figure 3, Item 2 )
The ALC-low is established to ensure that the time delay is long enough to ride through the starting of any one accident load without prematurely separating from the preferred offsite power source at the minimum allowable 345 kV system voltage. The ALC-
low is determined in Section III.2.05. (See Figure 3, Item 3 ).
(Eq. 15) ( )FESIhighC TDTDSLAL +−=− Where:
SLSI = Maximum allow time delay, safety limit TDE = maximum operate time of Block E relay
in seconds TDF = maximum operate time of Block F relay
in seconds
c. The time delay nominal trip setpoint (NTSPC) for Block C is determined to ensure that the Block C relay trip occurs before the analytical limit (ALC-high) is reached. The difference between the NTSPC and ALC-high accounts for all the uncertainties associated with the Block C relay for worst-case conditions (i.e. the Total Loop Error (TLE) for the Block C relay time delay). The NTSPC is calculated based on the guidance within Design Guide DG-I01 (Reference IV.4.03) as follows (See Figure 3, Item 4 ):
(Eq. 16) +
−
+=
TLEAL
NTSP highCC 1
Where: NTSPC = Block C time delay nominal trip
setpoint TLE+ = max time delay total loop error (%)

Calculation 2004-0002 Revision 0
Section III– Degraded Voltage Analysis
Page 78
d. The Technical Specification Allowable Value (AVC) is determined to ensure sufficient margin exists between the Block C time delay relay nominal trip setpoint (NTSPC) and the Analytical Limit (ALC-
high) to account for instrument uncertainties that are either not present or are not measured during periodic testing. This establishes Technical Specification SR 3.3.4.3.b (Reference IV.8.01) maximum time delay with a safety injection signal present. The AVC is calculated based on the guidance within design guide DG-I01 (Reference IV.4.03) as follows (See Figure 3, Item 5 ):
(Eq. 17) CCC NTSPTMUNTSPAV *+=
Where: AVC = Technical Specification Allowable value
for Block C time delay TMU = Total Measurable error – total
instrument error for calibration conditions of these uncertainties that can be measured during performance of the surveillance
e. The setting tolerance for the Block C time delay relay is established
is to allow an acceptable setpoint range for technicians to sufficiently set the relays. The setting tolerance will be determined to be equal to or greater than the timing accuracy of the degraded voltage relays (Block C) and the M&TE accuracy. This will ensure that the setting tolerance is large enough to allow the trip setpoints to be easily adjusted between the limits. The following equation establishes the setting tolerance (See Figure 3, Item 6 ):
(Eq. 18) CC NTSPmaST *22 +±=
Where: STC: Block C allowable setting tolerance in
seconds a: accuracy of the Block C relay time delay (%) m: M&TE error that are used to calibrate the
relays (%) NTSPC: nominal trip setpoint for Block C relay
in seconds

Calculation 2004-0002 Revision 0
Section III– Degraded Voltage Analysis
Page 79
f. The time delay actual trip setpoint (ATSPC) and minimum actual trip setpoint (MATSPC) are determined to provide a positive and negative range for calibration of the relays by the technicians (MATSPC to NTSPC). The ATSPC is determined by subtracting STC
+ from the NTSPC (See Figure 3, Item 7 ). The MATSPC is determined by subtracting STC
- from the ATSPC (See Figure 3, Item 8 ).
g. The minimum time delay of the Block C relay is then calculated to
be compared to the lower analytical limit (ALC-low) to ensure that the time delay relay does not actuate prematurely during starting of any one accident load when the preferred offsite power voltage is acceptable. The minimum time delay is calculated with the following equation (See Figure 3, Item 9 ):
(Eq. 19) CCC MATSPTLEMATSPTD *min −−=
Where: TLE-: min time delay relay total loop error (%) TDC
min: minimum actuation time of the Block C relay
(6) Refer to Figure 4 for the following discussion. The total degraded voltage
time delay during normal plant operation (without a safety injection signal) is established with Blocks C and D (and F for B-train only) from Figure 1. The Block C time delay was determined in Step (5). The minimum and maximum time delay for the Block C relay contributes to the total time delay during normal plant operation. The total time delay of the degraded voltage relays are a summation of Blocks C, D, and F relays actuation times. Block F is a fixed time relay (for B-train only) and therefore has a fixed time delay as shown in Figure 4. For the development of the degraded voltage time delay during normal plant operation, Block C relay contributes two-fixed time delays based on the maximum actuation time (ALC-High from Figure 3) and the minimum actuation time (TDC
min from Figure 4) in establishing the setpoint for the Block D relay.
The Block D relay is established to ensure the operation of safety related equipment during normal plant operation (without a safety injection signal) with a degraded voltage condition. Therefore, the setpoint of the Block D time delay relay is determined to ensure safety related equipment will not be damaged or become unavailable due to a protective device actuation on overcurrent. The following steps develop the Safety Limit (SLNSI), Analytical limits (ALD-high and ALD-low), Technical Specification Allowable Value (AVD), and setpoints Block D relays (NTSPD, ATSPD, and MATSPD) for the degraded voltage time delay scheme for normal plant

Calculation 2004-0002 Revision 0
Section III– Degraded Voltage Analysis
Page 80
operation (without a safety injection signal) in setting the Block D relay (Figure 1). Note t = 0 seconds in Figure 4 represents the time at which Block D relay receives signal to begin timing.
a. The maximum allowable time delay of the relays is established to ensure that during normal plant operation, the time delay relay separates the safety related bus from offsite power prior to damage to equipment or spurious protection device trips due to overcurrent that would make equipment unavailable to automatically load onto the emergency diesel generators. The maximum allowable time delay is considered the safety limit (SLNSI) to protect all safety related equipment. The safety limit is established in Section III.2.09. (See Figure 4, Item 1 ).
b. The degraded voltage time delay relays have a maximum and
minimum Analytical Limit (ALD-high and ALD-low) for normal plant operation. The ALD-high is established to protect the SLNSI maximum allowable time delay by including definite time delay relay (Block F), Block C maximum time delay (ALC-High) and include margin to permit a small change in the SLNSI without requiring a change to the Technical Specification Allowable Value. Block C and F (B-train only) are included between the SLNSI and ALD-high to establish a Technical Specification Allowable value to be directly compared to the as-found relay setpoint during calibrations to evaluate operability of the relays. The ALD-high is determined in Equation 20 for A-train and B-train, which adds the specified time delay relays and margin. (See Figure 4, Item 2 ).
The ALD-low is established to ensure that the time delay is long enough to ride through the largest motor starting voltage transient during normal plant operation without separating the bus from the preferred offsite power source. Typically, this transient is the start of a reactor coolant pump when recovering from an outage. ALD-
low is determined in Equation 21 for A-train and B-train. (See Figure 4, Item 3 ).
(Eq. 20) ( )FhighCNSIhighD TDALSLAL +−= −− Where:
SL = Maximum allow time delay, safety limit ALC-high = maximum time delay of Block C
relay in seconds, which is the analytical limit

Calculation 2004-0002 Revision 0
Section III– Degraded Voltage Analysis
Page 81
TDF = maximum operate time of Block F relay in seconds (B-Train only)
(Eq. 21) Min
CSTlowD TDMAL −=− Where:
MST = largest motor starting transient in seconds TDC
Min = minimum actuation time of the Block C relay (see Step (5)g)
Note: The t = 0 in Figure 4 establishes the time at which the Block D time delay begins, which is after the completion of the Block C relay as shown in Figure 1
c. The time delay nominal trip setpoint (NTSPD) for Block D is determined to ensure that the Block D relay trip occurs before the analytical limit (ALD-high) is reached. The difference between the NTSPD and ALD-high accounts for all the uncertainties associated with the Block D relay for worst-case conditions. The NTSPD is calculated based on the guidance within Design Guide DG-I01 (Reference IV.4.03) as follows (See Figure 3, Item 4 ):
(Eq. 22) +
−
+=
TLEAL
NTSP highDD 1
Where: NTSPD = Block D time delay nominal trip
setpoint TLE+ = max time delay relay total loop error
(%)
d. The Technical Specification Allowable Value (AVD) is determined to ensure sufficient margin exists between the Block D time delay relay nominal trip setpoint (NTSPD) and the Analytical Limit (ALD-high) to account for instrument uncertainties that are either not present or are not measured during periodic testing. This establishes Technical Specification SR 3.3.4.3.b (Reference IV.8.01) maximum time delay without a safety injection signal present. The AVD is calculated based on the guidance within Design Guide DG-I01 (Reference IV.4.03) as follows (See Figure 4, Item 5 ):
(Eq. 23) DDD NTSPTMUNTSPAV *+=
Where: AVD = Technical Specification Allowable value
for Block D time delay

Calculation 2004-0002 Revision 0
Section III– Degraded Voltage Analysis
Page 82
TMU = Total Measurable error – total instrument error for calibration conditions of these uncertainties that can be measured during performance of the surveillance
e. The setting tolerance for the Block D time delay relay is established
to allow an acceptable setpoint range for technicians to sufficiently set the relays. The setting tolerance will be determined to be equal to or greater than the timing accuracy of the Block D relays and the M&TE accuracy. This will ensure that the setting tolerance is large enough to allow the trip setpoints to be easily adjusted between the limits. The following equation establishes the setting tolerance (See Figure 4, Item 6 ):
(Eq. 24) DD NTSPmaST *22 +±=
Where: STD: Block D allowable setting tolerance (%) a: accuracy of the Block D time delay relays
(%) m: M&TE error that are used to calibrate the
relays (%)
f. The time delay actual trip setpoint (ATSPD) and minimum actual trip setpoint (MATSPD) are determined to provide a positive and negative range for calibration of the relays by the technicians (MATSPD to NTSPD). The ATSPD is determined by subtracting STC
+ from NTSPD (See Figure 4, Item 7 ). The MATSPD is determined by subtracting STD
- from ATSPD (See Figure 4, Item 8 ).
g. The minimum time delay of the Block D relay is then calculated to
be compared to the lower analytical limit (ALD-low) to ensure that the time delay relay does not actuate prematurely during starting of any load when the preferred offsite power voltage is acceptable. The minimum time delay is calculated with the following equation (see Figure 4, Item 9 ):
(Eq. 25) DDD MATSPTLEMATSPTD *min −−=
Where: TLE-: min time delay relay total loop error (%) TDD
min: minimum actuation time of the Block D relay

Calculation 2004-0002 Revision 0
Section III– Degraded Voltage Analysis
Page 86
III.4 Assumptions
Validated assumptions: III.4.01 It is assumed that the uncertainty of the M&TE utilized to calibrate the dropout
and pickup voltage setting of the degraded voltage relays will be +0.105% or less.
Basis: The M&TE currently required by calibration procedure is a Fluke 8505A or equivalent, which has an uncertainty of 0.105% when calibrated on a 12 month cycle (References IV.6.01, IV.6.02, IV.6.03, IV.6.04, IV.6.07, and IV.4.19). Therefore the M&TE uncertainty will be equal to or less than +0.105% when performing the calibration of the dropout and pickup voltage setting of the degraded voltage relays. The calibrations utilize the 100V range, for which a maximum full scale reading is 160.000V, to measure an approximate 120V signal. This provides approximately an additional 0.005% error to account for the number of counts with a 1 mV resolution.
III.4.02 It is assumed that the uncertainty of the M&TE utilized to calibrate the time
delay settings of the degraded voltage relays will be + 0.01% or less.
Basis: The M&TE currently required by calibration procedure is a Multi-Amp TV-2 or equivalent, which has an uncertainty of 1,000,000 Hz + 25 Hz or +0.0025% as a acceptance criteria to calibrate the M&TE (References IV.4.32)
III.4.03 It is assumed that the temperature range of the degraded voltage relay in the
Vital Switchgear Room is 60 degrees Fahrenheit to 104 degrees Fahrenheit.
Basis: The design of the HVAC system is that with a worst-case outside air temperature of –15 degrees Fahrenheit, the ambient temperatures in the general areas of the turbine building are 65 degrees Fahrenheit (Reference IV.4.25). The maximum allowable temperature allowed by operator rounds for the Vital Switchgear Room is 85 degree Fahrenheit and is established to maintain the D-05 and D-06 Battery Rooms to less then 90 degrees Fahrenheit for operability of the batteries (Reference IV.4.26). A review of operator logs of the Vital Switchgear room reveal the temperature between 60 and 85 degrees Fahrenheit (See Attachment D), therefore it is conservative to assume the maximum ambient temperature of 60 to 85 degrees Fahrenheit for the Vital Switchgear Room. Also, an additional 9 to 18 degrees Fahrenheit were included to account for difference in temperature between inside and outside the cubicle. This is conservative because the only heat load in the cubicles is the heat from the bus bar and other relays. Therefore, the temperature range of the degraded voltage relays would range between 60 and 104 degrees Fahrenheit.

Calculation 2004-0002 Revision 0
Section III– Degraded Voltage Analysis
Page 87
III.4.04 It is assumed that the minimum steady state operating voltage of Battery Chargers D-07, D-08, D-09, D-107, D-108 and D-109 is 412 V. Basis: The battery chargers provide power to the safety-related 125 VDC system and maintain the station batteries at full charge. The fully charged station batteries are capable of providing power to the 125 VDC system for at least one hour. The minimum voltage (-10% of 480 V) stated in the charger manuals ensure that 1% voltage regulation is maintained at the output of the charger over its full output current range. If the battery charger is supplied with a voltage outside the stated range, the voltage regulation may increase (i.e. regulation could be >1%), but the charger output will not fail. The battery charger would still be capable of providing sufficient voltage to the DC system to support the 125 VDC system load and maintain the battery at full charge. The battery charger test report for the PCP chargers shows that at a minimum voltage of 412 V and the output voltage is maintained within DC system voltage requirements. The Westinghouse battery chargers are of similar design and would operate in a similar manner. (References IV.4.28 and IV.4.29)
III.4.05 It is assumed that the temperature range of the degraded voltage relay in the
Diesel Generator Building Switchgear rooms is 50 to 105 degrees Fahrenheit with an uncertainty of + 0.4% for the ABB 27N relay over this temperature range.
Basis: The basis for the temperature range of the Switchgear rooms in the Diesel Generator Buildings is developed in Engineering Evaluation EE 2005-0013 (Reference IV.1.10). The engineering evaluation accounts for the temperature inside the switchgear cubicle during minimum and maximum conditions. The vendor provides a uncertainty of + 0.4% for a temperature range of 50 to 104 degrees Fahrenheit (10 to 40°C). However, Work Order 0510753 (Reference IV.4.31) performed a test on the ABB 27N by varying the relay ambient temperature between approximately 60 to 110 degrees Fahrenheit while maintaining control voltage constant. The relay test showed that over the range a maximum variation of 0.2% of setting. Therefore, the vendor provided uncertainty of + 0.4% was used over the range of 50 to 105 degrees Fahrenheit. 1 degree Fahrenheit over the vendor stated range would have a negligible affect on the uncertainty based on the test performed under Work Order 0510753 (Reference IV.4.31)

Calculation 2004-0002 Revision 0
Section III– Degraded Voltage Analysis
Page 88
III.4.06 It is assumed that the cable and fuse impedance will have a negligible effect on the burden and ratio correction factor of the potential transformer supplying the degraded voltage relays.
Basis: The highest burden on the potential transformer, when the relay is
required to operate, is 5.2 VA (or approximately 0.043 amps at 120 V nominal voltage). The voltage drop across the cables would be negligible to the degraded voltage relays because the potential transformer and degraded voltage relay are located in either the same or adjacent switchgear cubicle with a relatively short cable length. Additionally, the voltage drop across the fuse would be negligible due to the maximum current of 0.043 Amps since the resistance would be significantly less than 1 ohm. Therefore, the cable and fuse impedance have a negligible affect on the ratio correction factor of the potential transformer.
III.4.07 It is assumed that the ABB 27N degraded voltage time delay repeatability is
+5% of setting.
Basis: The manufacturer’s published 27N relay time delay repeatability is ± 10% of setting (Reference IV.4.04). The published +10% value is based on the setting the relay’s time dial using tap (dial) settings on the 27N front bezel. However, the time delay setting may be adjusted more a precisely using time delay potentiometer R41. The manufacturer does not provide the affects of repeatability on the accuracy of the 27N relay if calibrated using the R41 potentiometer. The manufacturer factory calibrates the relays prior to release with a maximum allowable variation from the dial setting of +5% of tap setting.
Point Beach relay calibration practice is to set the 27N time delay precisely using the relay’s R41 internal potentiometer, rather than by the dial settings. ABB has acknowledged that the potentiometer will provide tighter time delay repeatability than the dial settings. Repeatability of the time delay setting is affected by temperature, control voltage, and inherent accuracy, similar to the 27N relay degraded voltage setting repeatability (Reference IV.4.04). To determine the 27N sensitivity to variations in ambient temperature and control voltage, Work Order 0510753 was performed to bench test a spare 27N relay (Reference IV.4.31). The test showed that the relay time delay setting varied approximately 0.3% of setting over the voltage range of 100 to 140 VDC, and approximately 1.5% of setting over the temperature range of 60 to 110 degrees F. The temperature and voltage ranges during the test reasonably bound the conditions expected for the relay’s installed location. The test data supports a 27N time delay total repeatability value that is smaller than the manufacturer’s published value of ± 10%.

Calculation 2004-0002 Revision 0
Section III– Degraded Voltage Analysis
Page 89
Therefore, a repeatability value of ± 5% (greater than 2 sigma) of setting is conservatively assumed when calibrated is performed with the internal potentiometer. This provides more than twice the uncertainty observed from combined temperature and control voltage effects during bench testing of a spare relay. The value is also consistent with the manufacturer’s own release criterion. Relay drift includes the relay inherent accuracy. Drift of the 27N time delay setting has been determined separately (see Section III.2.06) based on as-found/as-left calibration data, and will be combined statistically with the ± 5% repeatability to account for any unmeasurable time delay errors caused by relay temperature and control voltage variations.
III.4.08 It is assumed that the time delay between the main source breaker opening until the loss of voltage relay picks up is 1.3 seconds.
Basis: The degraded voltage relay actuation opens the main source breaker for
the safeguards 4.16 kV buses (1A-05, 1A-06, 2A-05 and 2A-6), which initiates the loss of voltage protection scheme and provides a permissive to close the main breaker for the emergency diesel generator. A time delay of 1.3 seconds between the main source breaker opening and the loss of voltage relay actuating is accounting for the residual bus voltage decay from the initial bus voltage to below the trip setpoint of the loss of voltage relay. The loss of voltage relay will trip at less than or equal to 3156V (75.9% of 4160V) (Reference IV.1.08). The bus voltage decay time depends on how quickly the stored electromagnetic energy dissipates. The magnetic field strength varies as e-t/c (where c is the circuit equivalent open circuit time constant and t equals the time after the main source breaker is opened). The total bus voltage will have a complex average response such that the voltage will decay faster than the voltage for the largest individual motor and slower than for a single small motor. A 1.3 seconds time delay was determined based on the largest motor’s open circuit time constant of 2.55 seconds (for the 700HP safety injection pump motor) and at ½ time constant (2.55 seconds/2) the voltage would be less than 60% of the initial bus voltage. This allows for sufficient time for the residual bus voltage to decay below the loss of voltage relay actuation of 75.9%. (Reference IV.2.10 and IV.4.33)

Calculation 2004-0002 Revision 0
Section III– Degraded Voltage Analysis
Page 90
III.5 Inputs
The following design inputs are used to in performing Degraded Voltage Analysis:
III.5.01 AC Electrical System Model in ETAP (Reference IV.1.01)
Calculation 2004-0001 (Reference IV.1.01) develops the electrical AC system model from the 345 kV system through the 480V system. The model includes all the individual equipment technical data, plant operating scenarios, equipment status, demand factors and study cases. The AC electrical system model in ETAP will be utilized to perform the load flow and dynamic motor starting analysis.
III.5.02 Pressurizer Heater Power Panel Loading:
(1) Power Panel PP-12: 480V, 231A (Reference IV.1.03) (2) Power Panel PP-17: 480V, 231A (Reference IV.1.03)
III.5.03 Safeguards Bus 1A-05 Degraded Voltage Scheme
(1) Relay Locations: Vital Switchgear Room (Reference IV.9) (2) Schematics for Degraded Voltage Scheme: Reference IV.5.03 and IV.5.04 (3) Potential Transformer (PT)
a. PT Manufacturer: Westinghouse (Reference IV.4.20) b. PT Model: Style # 1483798 (Reference IV.4.20) c. PT Ratio: 4200V – 120V (35:1) (Reference IV.5.04) d. PT Loads (Reference IV.5.04):
• 3 – ABB 27D relays (1.2 VA, 100% P.F. each) (Reference IV.4.18, IV.5.04)
• 3 – ABB 27N relays (0.5 VA each) (Reference IV.4.04, IV.5.04)
• 1 – Voltmeter (0.096 VA, 100% P.F.) (Reference IV.4.21, IV.9)
e. PT Burden: 5.2 VA (Sum of III.5.03(3), Item d) f. PT Accuracy: 0.6 (z accuracy); 0.3 (thru y burden) (Reference
IV.4.20) g. PT Curve Number: Reference IV.4.23 (Attachment D)

Calculation 2004-0002 Revision 0
Section III– Degraded Voltage Analysis
Page 91
(4) Degraded Voltage Relay a. Relay ID’s: PB1 274/A05, PB1 275/A05, and PB1 276/A05
(Reference IV.5.04 and IV.9) b. Relay Manufacturer: ABB (Reference IV.4.04 and IV.9) c. Relay Type: 27N (Reference IV.5.04 and IV.9) d. Relay Part Number: 27N411T4175-HF-L (Reference IV.4.22 and
IV.9) e. Present Dropout Setting: 113.1 V (Reference IV.7.01) f. Present Pickup Setting: 113.7 V (Reference IV.7.01) g. Present Time Delay Setting: 5.7 seconds (Reference IV.7.01)
(5) Degraded Voltage Auxiliary Relay a. Relay ID’s: PB1 274X/A05, PB1 275X/A05, and PB1 276X/A05
(Reference IV.5.04 and IV.9) b. Relay Manufacturer: Westinghouse (Reference IV.5.04 and IV.9) c. Relay Type: NBFD (Reference IV.5.04 and IV.9) d. Relay Part Number: NBFD65NR (Reference IV.5.04 and IV.9)
(6) Time Delay Relay a. Relay ID’s: PB1 TDRA/A05, PB1 TDRB/A05, and PB1
TDRC/A05 (Reference IV.5.04 and IV.9) b. Relay Manufacturer: Agastat (Reference IV.5.04 and IV.9) c. Relay Type: ETR (Reference IV.5.04 and IV.9) d. Relay Part Number: ETR14D3D004 (Reference IV.5.04 and IV.9) e. Present Time Delay Setting: 37 seconds (Reference IV.7.01)
III.5.04 Safeguards Bus 1A-06 Degraded Voltage Scheme
(1) Relay Locations: Diesel Generator Building – G-03 Switchgear Room (Reference IV.9)
(2) Schematics for Degraded Voltage Scheme: Reference IV.5.02 and IV.5.05 (3) Potential Transformer (PT)
a. PT Manufacturer: GE (Reference IV.4.06) b. PT Model: JVM3 (Reference IV.4.06) c. PT Ratio: 4200V – 120V (35:1) (Reference IV.4.06 and IV.5.02) d. PT Loads (Reference IV.5.02):
• 3 – ABB 27D relays (1.2 VA, 100% P.F. each) (Reference IV.4.18, IV.5.02)
• 3 – ABB 27N relays (0.5 VA each) (Reference IV.4.04, IV.5.02)
• 1 – Voltmeter (0.096 VA, 100% P.F.) (Reference IV.4.21, IV.9)
e. PT Burden: 5.2 VA (Sum of III.5.04(3), Item d) f. PT Curve Number: Reference IV.4.24 (Attachment D)

Calculation 2004-0002 Revision 0
Section III– Degraded Voltage Analysis
Page 92
(4) Degraded Voltage Relay a. Relay ID’s: PB1 274/A06, PB1 275/A06, and PB1 276/A06
(Reference IV.5.02 and IV.9) b. Relay Manufacturer: ABB (Reference IV.5.02 and IV.9) c. Relay Type: 27N (Reference IV.5.02 and IV.9) d. Relay Part Number: 27N411T4175-HF-L (Reference IV.4.22 and
IV.9) e. Present Dropout Setting: 113.1 V (Reference IV.7.03) f. Present Pickup Setting: 113.7 V (Reference IV.7.03) g. Present Time Delay Setting: 5.7 seconds (Reference IV.7.03)
(5) Degraded Voltage Auxiliary Relay a. Relay ID’s: PB1 274X/A06, PB1 275X/A06, and PB1 276X/A06
(Reference IV.5.02 and IV.9) b. Relay Manufacturer: Westinghouse (Reference IV.5.02) c. Relay Type: NBFD (Reference IV.5.02) d. Relay Part Number: NBFD65NR (Reference IV.5.02)
(6) Time Delay Relay a. Relay ID’s: PB1 62-1/A06, PB1 62-2/A06 and PB1 62-3/A06
(Reference IV.5.02 and IV.9) b. Relay Manufacturer: Agastat (Reference IV.5.02 and IV.9) c. Relay Type: ETR (Reference IV.5.02 and IV.9) d. Relay Part Number: ETR14D3D003 (Reference IV.4.06) e. Present Time Delay Setting: 37 seconds (Reference IV.7.03)
(7) Degraded Voltage Auxiliary Relay a. Relay ID’s: PB1 62-1X1 and PB1 62-2X1 (Reference IV.5.02 and
IV.9) b. Relay Manufacturer: ABB (Reference IV.5.02 and IV.9) c. Relay Type: RXMA-2 (Reference IV.5.02 and IV.9) d. Relay Part Number: RK211189AN (Reference IV.4.06 and IV.9)
III.5.05 Safeguards Bus 2A-05 Degraded Voltage Scheme (1) Relay Locations: Vital Switchgear Room (Reference IV.9) (2) Schematics for Degraded Voltage Scheme: Reference IV.5.06 and IV.5.07 (3) Potential Transformer (PT)
a. PT Manufacturer: Westinghouse (Reference IV.4.20) b. PT Model: Style # 1483798 (Reference IV.4.20) c. PT Ratio: 4200V – 120V (35:1) (Reference IV.5.07) d. PT Loads (Reference IV.5.07):
• 3 – ABB 27D relays (1.2 VA each) (Reference IV.4.18, IV.5.07)
• 3 – ABB 27N relays (0.5 VA each) (Reference IV.4.04, IV.5.07)
• 1 – Voltmeter (0.096 VA) (Reference IV.4.21, IV.9) e. PT Burden: 5.2 VA (Sum of III.5.05(3), Item d) f. PT Accuracy: 0.6 (z accuracy); 0.3 (thru y burden) (Reference
IV.4.20)

Calculation 2004-0002 Revision 0
Section III– Degraded Voltage Analysis
Page 93
g. PT Curve Number: Reference IV.4.23 (Attachment D) (4) Degraded Voltage Relay
a. Relay ID’s: PB2 274/A05, PB2 275/A05, and PB2 276/A05 (Reference IV.5.07 and IV.9)
b. Relay Manufacturer: ABB (Reference IV.5.07 and IV.9) c. Relay Type: 27N (Reference IV.5.07 and IV.9) d. Relay Part Number: 27N411T4175-HF-L (Reference IV.4.22 and
IV.9) e. Present Dropout Setting: 113.1 V (Reference IV.7.02) f. Present Pickup Setting: 113.7 V (Reference IV.7.02) g. Present Time Delay Setting: 5.7 seconds (Reference IV.7.02)
(5) Degraded Voltage Auxiliary Relay a. Relay ID’s: PB1 274X/A05, PB1 275X/A05, and PB1 276X/A05
(Reference IV.5.07 and IV.9) b. Relay Manufacturer: Westinghouse (Reference IV.5.07 and IV.9) c. Relay Type: NBFD (Reference IV.5.07 and IV.9) d. Relay Part Number: NBFD65NR (Reference IV.5.07 and IV.9)
(6) Time Delay Relay a. Relay ID’s: PB2 TDRA/A05, PB2 TDRB/A05, and PB2
TDRC/A05 (Reference IV.5.07 and IV.9) b. Relay Manufacturer: Agastat (Reference IV.5.07 and IV.9) c. Relay Type: ETR (Reference IV.5.07 and IV.9) d. Relay Part Number: ETR14D3D004 (Reference IV.5.07 and IV.9) e. Present Time Delay Setting: 37 seconds (Reference IV.7.02)
III.5.06 Safeguards Bus 2A-06 Degraded Voltage Scheme
(1) Relay Locations: Diesel Generator Building – G-04 Switchgear Room (Reference IV.9)
(2) Schematics for Degraded Voltage Scheme: (3) Potential Transformer (PT)
a. PT Manufacturer: GE (Reference IV.4.06) b. PT Model: JVM3 (Reference IV.4.06) c. PT Ratio: 4200V – 120V (35:1) (Reference IV.4.06 and IV.5.02) d. PT Loads (Reference IV.5.02):
• 3 – ABB 27D relays (1.2 VA, 100% P.F. each) (Reference IV.4.18, IV.5.02)
• 3 – ABB 27N relays (0.5 VA each) (Reference IV.4.04, IV.5.02)
• 1 – Voltmeter (0.096 VA, 100% P.F.) (Reference IV.4.21, IV.9)
e. PT Burden: 5.2 VA (Sum of III.5.06(3), Item d) f. PT Curve Number: Reference IV.4.24 (Attachment D)

Calculation 2004-0002 Revision 0
Section III– Degraded Voltage Analysis
Page 94
(4) Degraded Voltage Relay a. Relay ID’s: PB2 274/A06, PB2 275/A06, and PB2 276/A06
(Reference IV.5.02 and IV.9) b. Relay Manufacturer: ABB (Reference IV.5.02 and IV.9) c. Relay Type: 27N (Reference IV.5.02 and IV.9) d. Relay Part Number: 27N411T4175-HF-L (Reference IV.4.22 and
IV.9) e. Present Dropout Setting: 113.1 V (Reference IV.7.04) f. Present Pickup Setting: 113.7 V (Reference IV.7.04) g. Present Time Delay Setting: 5.7 seconds (Reference IV.7.04)
(5) Degraded Voltage Auxiliary Relay a. Relay ID’s: PB2 274X/A06, PB2 275X/A06, and PB2 276X/A06
(Reference IV.5.02 and IV.9) b. Relay Manufacturer: Westinghouse (Reference IV.5.02) c. Relay Type: NBFD (Reference IV.5.02) d. Relay Part Number: NBFD65NR (Reference IV.5.02)
(6) Time Delay Relay a. Relay ID’s: PB2 62-1/A06, PB2 62-2/A06 and PB2 62-3/A06
(Reference IV.5.02 and IV.9) b. Relay Manufacturer: Agastat (Reference IV.5.02 and IV.9) c. Relay Type: ETR (Reference IV.5.02 and IV.9) d. Relay Part Number: ETR14D3D003 (Reference IV.4.06) e. Present Time Delay Setting: 37 seconds (Reference IV.7.04)
(7) Degraded Voltage Auxiliary Relay a. Relay ID’s: PB2 62-1X1 and PB2 62-2X1 (Reference IV.5.02 and
IV.9) b. Relay Manufacturer: ABB (Reference IV.5.02 and IV.9) c. Relay Type: RXMA-2 (Reference IV.5.02 and IV.9) d. Relay Part Number: RK211189AN (Reference IV.4.06 and IV.9)
III.5.07 High Accuracy Undervoltage Relay Type 27N
(1) Manufacturer: ABB (Reference IV.4.04) (2) Relay Type: 27N (Reference IV.4.04) (3) Relay Part Number: 27N411T4175-HF (Reference IV.4.04) (4) Pickup Range: 60 – 110V (Reference IV.4.04) (5) Dropout Range: 70 – 99% (Reference IV.4.04) (6) Potentiometer Range: +5% (Reference IV.4.04) (7) Time Delay Pickup: Instantaneous (Reference IV.4.04) (8) Time Delay Dropout: 1 – 10 seconds (Reference IV.4.04) (9) Operating Temperature Range: –30 to +70 degrees C (Reference IV.4.04) (10) Control Voltage Variation: 100 – 140 VDC (Reference IV.4.04) (11) Tolerances:
a. Repeatability at constant temperature and constant control voltage: +0.1% (Reference IV.4.04)

Calculation 2004-0002 Revision 0
Section III– Degraded Voltage Analysis
Page 95
b. Repeatability over “allowable” DC control voltage: +0.1% (Reference IV.4.04)
c. Repeatability over temperature range with harmonic filter: +50 to +105 degrees Fahrenheit (+10 to +40.6°C) = +0.40% (Reference IV.4.04, Assumption III.4.05)
d. Time Delay – Definite time models = + 5% (Assumption III.4.07) (12) Burden: 0.5 VA at 120 VAC (Reference IV.4.04)
III.5.08 Agastat Nuclear Qualified Control Relays
(1) Manufacturer: Agastat (Reference IV.4.07) (2) Relay Type: ETR (Reference IV.4.07) (3) Relay Part Number: ETR14D3D003 and ETR14D3D004 (Reference
IV.4.07) (4) Time Delay Pickup: 2 to 60 seconds (Reference IV.4.07) (5) Time Delay Dropout (Recycle): 75 milliseconds (Reference IV.4.07) (6) Operating Temperature Range: 40 – 156 degrees F {Normal 70-104°F}
(Reference IV.4.07) (7) Control Voltage Variation: 80 – 110% (Reference IV.4.07) (8) Humidity (R.H. %): 10 – 95% {Normal 40 – 60%} (Reference IV.4.07) (9) Tolerances:
a. Normal Operating Condition Repeat Accuracy: +5% (Reference IV.4.07)
b. Abnormal Operating Condition Repeat Accuracy: +10% (Reference IV.4.07)
III.5.09 Class 1E NBFD Nuclear Control Relay
(1) Manufacturer: Westinghouse (Reference IV.4.08) (2) Relay Type: NBFD (Reference IV.4.08) (3) Relay Part Number: NBFD65NR (Reference IV.4.08) (4) Pickup Time: <50 milliseconds (Reference IV.4.08) (5) Operating Temperature Range: 40 – 130 degrees F (Reference IV.4.08) (6) Control Voltage Variation: 100 – 145 VDC (Reference IV.4.08) (7) Humidity (R.H. %): 40 – 95% (Reference IV.4.08)
III.5.10 ABB Auxiliary Relay RXMA-2
(1) Manufacturer: ABB (Reference IV.4.09) (2) Relay Type: RXMA-2 (Reference IV.4.09) (3) Relay Part Number: RK211189AN (Reference IV.4.09) (4) Pickup Time: 30 milliseconds (Reference IV.4.09) (5) Operating Temperature Range: -25 – +55 degrees C (Reference IV.4.09) (6) Control Voltage Variation: 80 – 115% (Reference IV.4.09)

Calculation 2004-0002 Revision 0
Section III– Degraded Voltage Analysis
Page 96
III.5.11 Room/Equipment Temperature (1) Vital Switchgear Room Temperature Range: 60 to 104°F (15.6 to 40°C)
(Assumption III.4.03) (2) Diesel Generator Building Switchgear Rooms Temperature Range: 50°F to
105°F (10°C to 40.6°C) (Assumption III.4.05) III.5.12 M&TE Utilized to Calibrate Degraded Voltage and Time Delay Relays
(1) Fluke 8505A a. M&TE ID’s: ICTI-236, ICTI-269 (Reference IV.6.05, IV.9) b. Function: Voltmeter c. Tolerance: 0.105% of reading based on 12 month calibration with
1 mV resolution (Reference IV.4.19) d. Time between M&TE Calibration: 12 Months (Reference IV.9,
IV.6.08) (2) Multi-Amp TV-2
a. M&TE ID’s: APMA-003, APMA-006, APMA-008 (Reference IV.6.05, IV.9)
b. Function: Timer c. Tolerance: 0.0025% (Reference IV.4.32, IV.9) e. Time between M&TE Calibration: 12 Months (Reference IV.9,
IV.6.08) III.5.13 Calibration history of the relays in Sections III.5.02, III.5.04, III.5.05, and
III.5.06 from 1996 through 2005. The calibration data provides the as-found and as-left settings of the ABB 27N relay and Agastat ETR relay in the degraded voltage scheme of each safeguards bus. The calibration history will be used to support the statistical analysis of these relays. The calibration data was gathered from Reference IV.6.05 and is contained in Attachment A. The M&TE equipment utilized is determined from Reference IV.6.07 and IV.9 by the M&TE ID in the calibration procedure.
III.5.14 The equipment and protective device technical data on the safeguards buses are
documented in Attachment B.
III.5.15 Computer Software Utilized
(1) ETAP PowerStation (Reference IV.3.01) (2) Microsoft Excel (Reference IV.3.02)
III.5.16 Existing Technical Specifications for Degraded Voltage Protection Scheme:
(1) 4.16 kV System Voltage: > 3937 volts (Reference IV.8.01) (2) Time Delay with Safety Injection Signal: < 6.47 seconds (Reference
IV.8.01) (3) Time Delay without a Safety Injection Signal: < 54 seconds (Reference
IV.8.01)

Calculation 2004-0002 Revision 0
Section III– Degraded Voltage Analysis
Page 97
III.5.17 Existing Degraded Voltage Protection Scheme Settings: (References IV.6.01,
IV.6.02, IV.6.03, IV.6.04, IV.7.01, IV.7.02, IV.7.03, and IV.7.04)
(1) ABB 27N relays settings for all safeguards buses a. Dropout Setting: 113.1 V b. Dropout Setting Tolerance: 113.0 to 113.2 V c. Pickup Setting: 113.7 V d. Pickup Setting Tolerance: 113.6 to 113.8 V e. Time Delay Setting: 5.7 seconds f. Time Delay Setting Tolerance: 5.5 to 5.87 seconds
(2) Agastat ETR relays settings for all safeguards buses a. Time Delay Setting: 37 seconds b. Time Delay Setting Tolerance 33.3 to 40.7 seconds
III.5.18 Largest 4 kV motor starting acceleration times:
a. Largest 4 kV motors: 1P-001A, 1P-001B, 2P-001A and 2P-001B are 6000 HP reactor coolant pump motors (Reference IV.1.04)
b. Acceleration time at 80% voltage: 33 seconds (Attachment C in Reference IV.1.04)

Calculation 2004-0002 Revision 0
Section III– Degraded Voltage Analysis
Page 119
k. Column MULT. OF TRIP (LRC) is the multiple of TOR heater trip current versus the locked rotor current of the equipment. This is determined by dividing column Current at 90% LRC by column HTR RATING. MCCs that do not have TOR heaters installed will not contain this column.
l. Column MULT. OF TRIP (at 75% voltage) is the multiple of
TOR heater trip current versus the running current of the equipment. This is determined by dividing column FLA at 75% rated voltage by column HTR RATING. MCCs that do not have heaters installed will not contain this column.
m. Column HTR TIME TO TRIP (Load Flow) is the TOR heater
trip time based on the current in multiple of heater rating provided in column MULT. OF TRIP (Load Flow) and on the protective device time-current curve from technical data.
n. Column HTR TIME TO TRIP (LRC) is the overload heater trip
time based on the current provided in column MULT. OF TRIP (LRC) and on the protective device time-current curve from technical data.
o. Column HTR TIME TO TRIP (at 75% voltage) is the overload
heater trip time based on the current provided in column MULT. OF TRIP (at 75% voltage) and on the protective device time-current curve from technical data.
(4) The maximum allowable time delay will then be determined for the most
limiting trip time for a main (source) breaker or individual component protective device during normal plant operation and during a LOCA. This will establish the safety limit for the degraded voltage relays time delay setpoint.
III.6.09 The following steps perform the degraded voltage relay time delay setpoints
with and without a safety injection signal present for each safeguards bus. This section will develop the Technical Specifications for the degraded voltage time delay scheme with and without a safety injection signal. Figure 3 and 4 shows a pictorial representation of the relay time delay setpoint Calculation process. (Methodology Section III.2.10)
(1) The evaluation of the as-left and as-found calibration data for the ABB 27N
and Agastat ETR time delay setting of the degraded voltage relays are determined within a Microsoft Excel spreadsheet base on the methodology described in Section III.2.10, Item (2). The following is a description of the analytical process performed within the Microsoft Excel Spreadsheets and is included in Attachment C:

Calculation 2004-0002 Revision 0
Section III– Degraded Voltage Analysis
Page 120
a. Column Unit and Relay Number identifies the relay number that was calibrated.
b. Column As-left value (AL) is the as-left setting of the relay
calibration.
c. Column As-found value (AF) is the subsequent calibration as-found setting of the relay from the as-left setting calibration data.
d. Column As-left Date is the date at which the as-left setting
calibration was performed.
e. Column As-found Date is the date at which the as-found setting calibration was performed subsequent to the as-left calibration.
f. Column Days between Calibrations (T) is the number of days
between the as-left and as-fond calibrations by subtracting column As-found Date from the As-left Date. The as-left / as-found parings that did not meet the requirements of being between 400 and 675 days were removed and not included in the analysis as discussed in Section III.2.10, Item (2).
g. Column AF – AL Difference (Di) secs is the difference between
the as-found and the as-left setting. This is determined by subtraction column As-found value (AF) from the As-left value (AL).
h. Column Di/AL Percent Drift (%Di) is the difference between the
As-found setting versus the last performed as-left setting divided by the as-left setting. This provides the percent drift from the last calibration in percent of setting. This is determined by dividing column AF – AL Difference (Di) secs by the As-left value (AL).
i. The sample size, mean and standard deviation will be determined
for to total data set. The sample size is determined by the number of as-left / as-found calibration pairs in the data set. The mean (average) is determined by a summation of Column Di/AL Percent Drift (%Di) divided by the sample size. The standard deviation is determined utilizing the Excel function STDEV.
j. An outlier screening is performed to remove erroneous data and
errors in transcriptions to be removed from the data sample. The outlier is determined by calculating the extreme studentized deviate as follows: the critical value (CV - significance level) is calculated by taking the absolute value of the Column Di/AL Percent Drift (%Di) minus the mean (all data sets) and dividing it

Calculation 2004-0002 Revision 0
Section III– Degraded Voltage Analysis
Page 121
by the standard deviation of the data set. The critical value will be compared to the Outlier Criteria in Table A contained in Appendix H of Reference IV.4.03 and is based on the sample size. If the sample size is between values, the next largest sample size is utilized which provides more stringent requirements. If the critical value is greater than the Outlier Criteria then “Outlier” will be placed in Column Outlier Screening, other wise Column Outlier Screening will be equal to Column Di/AL Percent Drift (%Di).
k. Utilizing the “Descriptive Statistics” tool in Excel, the data set in
Column Outlier Screening is analyzed to determine the mean, standard deviation, Kurtosis, Skewness, count, range, minimum, and maximum.
l. .Normalcy testing is performed to determine if the data set is
normal or bounded by a normal curve. Therefore an evaluation of the skewness and kurtosis of the data is performed. Skewness is the third moment about the mean and is used to describe the symmetry of a distribution. The skewness calculated in the previous step is compared to Table B contained in Appendix H of Reference IV.4.03 to ensure the value is less than values for the appropriate sample size. The kurtosis is the fourth moment about the mean and describes the peakedness of the data distribution. The kurtosis calculated in the previous step is compared to Table D contained in Appendix H of Reference IV.4.03 to ensure the value between than values for the appropriate sample size. If the sample size is between values the next largest sample size is utilized which provide more stringent requirements.
m. The 95/95 percent tolerance level is determined based on the
Outlier Screening performed. If the absolute mean of the data set is less than 0.1%, then a bias is assumed not to exist and the absolute value is added to the final 95/95 percent tolerance level. If the absolute mean of the data set is greater than 0.1%, then a bias with the appropriate sign is assumed to exist and it is not added to the 95/95 percent tolerance. The bias would then be utilized as an additional term in the setpoint Calculation.

Calculation 2004-0002 Revision 0
Section III– Degraded Voltage Analysis
Page 122
(2) The error contributors for the Block C and D relays to the total uncertainty of the degraded voltage relays time delay settings with a safety injection are as follows:
a. The relay accuracy, drift and M&TE uncertainties (d) are included
in the statistical analysis. Therefore, the total uncertainty for the ABB 27N relay is + 0.92% of setting and for the Agastat ETR relay the total uncertainty is + 2.75% of setting base from Item (1) and is considered random and independent from other variables. The M&TE uncertainty by itself is 0.01% of setting (Assumption III.4.02)
b. The ABB 27N relay provide a total tolerance (t) including all
potential error including temperature, power supply, and humidity and is taken as + 5% of setting (Input III.5.07). The Agastat ETR relays have a potential to be outside the normal operating environment, therefore the Agastat ETR relay provides a total tolerance (t) including all potential error of + 10% (Input III.5.08).
c. There is no additionally uncertainty for radiation or seismic effect
for the 27N relays.
(3) The error contributors for Block E and F relays are a fixed time delay because they are fixed operating time relays. The following is the total error for these relays:
a. Block E relay: Westinghouse NDFD relay = 50 milliseconds (Input
III.5.09) b. Block F Relay: ABB RXMA-2 relay = 30 milliseconds (Input
III.5.10)
(4) The total loop error (TLE) is calculated based on Equation 1 to determined the largest positive (TLE+) and largest negative (TLE-) for the degraded voltage relays.
[ ][ ]
%1.5592.0 2
122
2122
±=+±=
+±=
C
C
C
TLETLE
tdTLE
[ ][ ]
%4.101075.2 2
122
2122
±=+±=
+±=
D
D
D
TLETLE
tdTLE

Calculation 2004-0002 Revision 0
Section III– Degraded Voltage Analysis
Page 123
(5) The total measurable uncertainty (TMU) is calculated based on Equation 2, however since a statistical analysis of the as-left and as-found data was performed for both the Block C and D relays. The total measurable uncertainty will be equal to the drift (d) in percent of setting.
TMUC = + 0.92 % TMUD = + 2.75 %
(6) The degraded voltage time delay relay with a safety injection signal is established in Figure 1, where the total time delay is the summation of Blocks C and E (and F for B-train only). Therefore, refer to Figure 3. The following steps are performed to establish the time delay settings with a safety injection signal:
a. The maximum allowable time delay to ensure to no spurious trips
of equipments protective devices occur during a loss of coolant accident, which provides a safety injection signal, is calculated in Section III.6.07 and ensures that the emergency diesel generators are ready to load within 15 seconds (Acceptance Criteria III.3.10). The maximum time delay with a safety injection signal is 6 seconds determined from Section III.6.08, which is less than 9.3 seconds required for Acceptance Criteria III.3.10 and is considered the Safety Limit (SLSI).
b. There are two Analytical Limits (maximum and minimum)
required for the degraded voltage time delay relays with a safety injection signal. The Analytical Low Limit (ALC-low) is calculated in Section III.6.06 and the Analytical Maximum Limit (ALC-high) is calculated based on Equation 15.
( )
( )ondsAL
ALTDTDSLAL
highC
highC
FESIhighC
sec92.5
03.005.06
=
+−=
+−=
−
−
−
c. The Block C time delay nominal trip setpoint (NTSPC) is
calculated based on Equation 16:
ondsNTSP
NTSP
TLEAL
NTSP
C
C
highCC
sec63.5%1.51
92.51
=+
=
+=
+
−

Calculation 2004-0002 Revision 0
Section III– Degraded Voltage Analysis
Page 124
d. The Technical Specification Allowable Value (AVC) for the Block C time delay relay is calculated based on Equation 17:
ondsAVAV
NTSPTMUNTSPAV
C
C
CCCC
sec68.563.5*%92.063.5*
=+=
+=
e. The setting tolerance for the Block C time delay relay is
established based on Equation 18. The accuracy (a) of the Block C relay will be equal to the drift calculated in statistical analysis calculated in Section III.6.09, Item (1).
)(sec1.063.5*%01.0%92.0
*22
22
tenthnearesttoroundedondsSTST
NTSPmaST
C
C
CC
±=+±=
+±=
f. The time delay actual trip setpoint (ATSPC) and minimum actual
trip setpoint (MATSPC) are determined from STC and are calculated as follows:
ondsMATSPMATSP
STATSPMATSPondsATSP
ATSPSTNTSPATSP
C
C
CCC
C
C
CCC
sec43.51.053.5
sec53.51.063.5
=−=
−==
−=−=
g. The minimum time delay of Block C relay is calculated by
equation 19 and the minimum time must be greater than the ALC-
Low (4.6 seconds).
ondsTDTD
MATSPTLEMATSPTD
C
C
CCCC
sec15.5
43.5*%1.543.5
*
min
min
min
=
−=
−= −

Calculation 2004-0002 Revision 0
Section III– Degraded Voltage Analysis
Page 125
(7) The degraded voltage time delay relay without a safety injection signal, normal plant operation, is established in Figure 1, where the total time delay is the summation of Blocks C and D (and F for B-train only). Therefore, refer to Figure 4 and the following steps are performed to establish the time delay settings for normal plant operations when a safety injection signal is not present:
a. The maximum allowable time delay to ensure no spurious trips of
equipments protective devices occur during normal plant operation with no safety injection signal is calculated in Section III.6.08. The maximum time delay during normal plant operation is 48 seconds and is considered the Safety Limit (SLNSI).
b. There are two Analytical Limits (maximum and minimum)
required for the degraded voltage time delay relays during normal plant operation when no safety injection signal is present. The Analytical Low Limit (ALD-low) is calculated based on Equation 21 and the Analytical Maximum Limit (ALD-high) is calculated based on Equation 20. The Analytical Limits will be established utilizing the B-Train because the additional time delays due to the Block F relay. This will provide equivalent settings for both A-train and B-train time delay settings with additional margin for the A-train equivalent to the Block F fixed time delay. The largest motor start (MST) is the reactor coolant pump motor, which is 33 seconds (Input III.5.18)
( )( )
ondsALAL
TDALSLAL
highD
highD
FhighCNSIhighD
sec05.42
030.092.548
=
+−=
+−=
−
−
−−
ondsAL
ALTDMAL
lowD
lowD
MinCSTlowD
sec85.2715.533
=−=−=
−
−
−
c. The Block D time delay nominal trip setpoint (NTSPD) is
calculated based on Equation 22:
ondsNTSP
NTSP
TLEAL
NTSP
D
D
highDD
sec09.38%4.101
05.421
=+
=
+=
+
−

Calculation 2004-0002 Revision 0
Section III– Degraded Voltage Analysis
Page 126
d. The Technical Specification Allowable Value (AVD) for the Block D time delay relay is calculated based on Equation 23:
SecondsAV
AVNTSPTMUNTSPAV
D
D
DDDD
14.3909.38*%75.209.38
*
=+=+=
e. The setting tolerance for the Block D time delay relay is
established based on Equation 24. The accuracy (a) of the Block D relay will be equal to the drift calculated in statistical analysis calculated in Section III.6.09, Item (1).
ondsST
ST
NTSPmaST
D
D
DD
sec1.109.38*01.0%75.2
*22
22
±=+±=
+±=
f. The time delay actual trip setpoint (ATSPD) and minimum actual
trip setpoint (MATSPD) are determined from STD and are calculated as follows:
ondsMATSPMATSP
STATSPMATSPondsATSP
ATSPSTNTSPATSP
D
D
DDD
D
D
DDD
sec89.351.199.36
sec99.361.109.38
=−=−=
=−=−=
g. The minimum time delay of Block C relay is calculated by
Equation 25 and the minimum time must be greater than the ALD-
Low (27.85 seconds).
ondsTDTD
MATSPTLEMATSPTD
D
D
DDD D
sec16.32
89.35*%4.1089.35
*
min
min
min
=
−=
−= −

Calculation 2004-0002 Revision 0
Attachment C Degraded Voltage Relays Statistical Analysis
Page 3
Degraded Voltage Relays: ABB 27N Time Delay Setting Statistical Analysis:
Unit and Relay
Number
As-left value (AL)
As-found value (AF) As-left Date
As-found Date
Days between
Calibrations (T)
AF - AL Difference (Di) secs
Di/AL Percent
Drift (%Di)
Outlier Screening
1-274/A05 5.71 5.72 4/1/96 9/27/97 544 0.01 0.175 0.175 1-274/A05 5.72 5.69 4/6/98 11/19/99 592 -0.03 -0.524 -0.524 1-274/A05 5.69 5.71 11/19/99 4/23/01 521 0.02 0.351 0.351 1-274/A05 5.71 5.71 4/23/01 8/28/02 492 0.00 0.000 0.000 1-274/A06 5.68 5.71 4/6/96 10/1/97 543 0.03 0.564 0.564 1-274/A06 5.73 5.71 4/10/98 11/12/99 581 -0.02 -0.349 -0.349 1-274/A06 5.71 5.72 11/12/99 5/1/01 536 0.01 0.175 0.175 1-274/A06 5.72 5.70 5/1/01 8/22/02 478 -0.02 -0.350 -0.350 1-275/A05 5.71 5.72 4/1/96 7/31/97 486 0.01 0.175 0.175 1-275/A05 5.73 5.69 4/6/98 11/19/99 592 -0.04 -0.698 -0.698 1-275/A05 5.69 5.70 11/19/99 4/23/01 521 0.01 0.176 0.176 1-275/A05 5.70 5.72 4/23/01 8/28/02 492 0.02 0.351 0.351 1-275/A06 5.68 5.72 4/6/96 10/1/97 543 0.04 0.740 0.740 1-275/A06 5.72 5.69 4/10/98 11/12/99 581 -0.03 -0.524 -0.524 1-275/A06 5.69 5.71 11/12/99 5/1/01 536 0.02 0.351 0.351 1-275/A06 5.71 5.70 5/1/01 8/22/02 478 -0.01 -0.175 -0.175 1-276/A05 5.72 5.73 4/1/96 9/27/97 544 0.01 0.175 0.175 1-276/A05 5.74 5.70 4/6/98 11/19/99 592 -0.04 -0.697 -0.697 1-276/A05 5.70 5.71 11/19/99 4/23/01 521 0.01 0.175 0.175 1-276/A05 5.71 5.73 4/23/01 8/28/02 492 0.02 0.350 0.350 1-276/A06 5.71 5.71 4/6/96 8/2/97 483 0.00 0.088 0.088 1-276/A06 5.72 5.72 4/10/98 11/12/99 581 0.00 0.000 0.000 1-276/A06 5.72 5.70 11/12/99 5/1/01 536 -0.02 -0.350 -0.350 1-276/A06 5.70 5.70 5/1/01 8/22/02 478 0.00 0.000 0.000 2-274/A05 5.72 5.70 11/13/96 12/20/97 402 -0.02 -0.332 -0.332 2-274/A05 5.70 5.71 12/20/97 2/10/99 417 0.01 0.158 0.158 2-274/A05 5.71 5.72 2/10/99 10/29/00 627 0.01 0.175 0.175 2-274/A05 5.72 5.72 10/29/00 6/6/02 585 0.00 0.000 0.000 2-274/A05 5.74 5.74 10/6/03 3/10/05 521 0.00 -0.017 -0.017 2-274/A06 5.71 5.69 10/25/96 12/18/97 419 -0.01 -0.263 -0.263 2-274/A06 5.69 5.68 12/18/97 1/30/99 408 -0.01 -0.176 -0.176 2-274/A06 5.68 5.71 1/30/99 11/16/00 656 0.03 0.528 0.528 2-274/A06 5.71 5.70 11/16/00 6/21/02 582 -0.01 -0.140 -0.140 2-274/A06 5.68 5.69 12/3/03 2/16/05 441 0.01 0.176 0.176 2-275/A05 5.75 5.72 11/13/96 12/20/97 402 -0.03 -0.522 -0.522 2-275/A05 5.72 5.71 12/20/97 2/10/99 417 -0.01 -0.175 -0.175 2-275/A05 5.71 5.74 2/10/99 10/29/00 627 0.03 0.525 0.525 2-275/A05 5.74 5.73 10/29/00 6/6/02 585 -0.01 -0.174 -0.174

Calculation 2004-0002 Revision 0
Attachment C Degraded Voltage Relays Statistical Analysis
Page 4
Unit and Relay
Number
As-left value (AL)
As-found value (AF) As-left Date
As-found Date
Days between
Calibrations (T)
AF - AL Difference (Di) secs
Di/AL Percent
Drift (%Di)
Outlier Screening
2-275/A05 5.73 5.73 8/8/03 3/10/05 580 0.00 0.000 0.000 2-275/A06 5.71 5.64 10/25/96 12/18/97 419 -0.07 -1.261 OUTLIER2-275/A06 5.64 5.69 12/18/97 1/30/99 408 0.05 0.887 0.887 2-275/A06 5.69 5.70 1/30/99 11/16/00 656 0.01 0.176 0.176 2-275/A06 5.70 5.72 11/16/00 6/21/02 582 0.02 0.281 0.281 2-275/A06 5.70 5.71 12/3/03 2/16/05 441 0.01 0.175 0.175 2-276/A05 5.71 5.68 11/13/96 12/20/97 402 -0.03 -0.525 -0.525 2-276/A05 5.68 5.71 12/20/97 2/10/99 417 0.03 0.528 0.528 2-276/A05 5.71 5.72 2/10/99 10/29/00 627 0.01 0.175 0.175 2-276/A05 5.72 5.73 10/29/00 6/6/02 585 0.01 0.175 0.175 2-276/A05 5.71 5.74 8/8/03 3/10/05 580 0.03 0.525 0.525 2-276/A06 5.72 5.70 10/25/96 12/18/97 419 -0.02 -0.402 -0.402 2-276/A06 5.70 5.69 12/18/97 1/30/99 408 -0.01 -0.175 -0.175 2-276/A06 5.69 5.73 1/30/99 11/16/00 656 0.04 0.668 0.668 2-276/A06 5.73 5.73 11/16/00 6/21/02 582 0.01 0.105 0.105 2-276/A06 5.72 5.73 12/3/03 2/16/05 441 0.01 0.175 0.175
All Data:
Sample size: 54 Mean = 0.027 % Di Standard Deviation = 0.406 Data excluding Outliers: Sample size: 53 Mean = 0.051 % Di Standard Deviation = 0.368 DG-I01 Appendix H Table A multiplier for 53 samples = 2.37 95/95 Drift value = (Std Deviation x multiplier) + |Mean| = +/- 0.92 % of setting

Calculation 2004-0002 Revision 0
Attachment C Degraded Voltage Relays Statistical Analysis
Page 5
Statistical Analysis
Mean 0.051
Standard Error 0.051 Median 0.158
Mode 0.175 Standard Deviation 0.368
Sample Variance 0.135 Kurtosis -0.351
Skewness -0.074 Range 1.585
Minimum -0.698 Maximum 0.887
Sum 2.709 Count 53
Confidence Level(95.0%) 0.101 Conclusion: The statistical analysis was performed on the ABB 27N relay (Time Delay) and resulted in a 95/95 percent drift value of + 0.92% of setting. The statistical analysis shows the data to have a normal curve distribution because the Kurtosis was between the range of –0.697 and +1.015 for a sample size of 75 (Table D in Reference IV.4.03) and the Skewness was less than 0.492 for a sample size of 60 (Table B in Reference IV.4.03). The next largest sample size provides more stringent requirements, therefore the data set is considered to have a normal distribution. The mean of the data set was less than 0.1% of the as-left setting and no bias was assumed. The 95/95 percent tolerance multiplier was linear interpolated from Table A in Reference IV.4.03 to be 2.37. Therefore the 95/95 percent tolerance level was determined to be + 0.92% of setting for the ABB 27N relay (Time Delay).

Calculation 2004-0002 Revision 0
Attachment C Degraded Voltage Relays Statistical Analysis
Page 6
Degraded Voltage Relays: Agastat ETR Time Delay Setting Statistical Analysis:
Unit and Relay
Number
As-left value (AL)
As-found value (AF)
As-left Date
As-found Date
Days between
Calibrations (T)
AF - AL Difference (Di) secs
Di/AL Percent
Drift (%Di)
Outlier Screening
1-62-1/A06 36.98 37.55 4/6/96 10/1/97 543 0.57 1.541 1.541 1-62-1/A06 37.05 37.40 4/10/98 11/12/99 581 0.35 0.945 0.945 1-62-1/A06 37.40 37.00 11/12/99 5/1/01 536 -0.40 -1.070 -1.070 1-62-1/A06 37.00 37.49 5/1/01 8/22/02 478 0.49 1.324 1.324 1-62-1/A06 37.49 37.17 8/22/02 2/3/04 530 -0.32 -0.854 -0.854 1-62-2/A06 37.22 37.68 4/6/96 10/1/97 543 0.46 1.236 1.236 1-62-2/A06 37.61 38.60 4/10/98 11/12/99 581 0.99 2.632 2.632 1-62-2/A06 38.60 37.40 11/12/99 5/1/01 536 -1.20 -3.109 -3.109 1-62-2/A06 37.40 37.84 5/1/01 8/22/02 478 0.44 1.176 1.176 1-62-2/A06 37.84 37.37 8/22/02 2/3/04 530 -0.47 -1.242 -1.242 1-62-3/A06 36.85 39.10 4/6/96 8/2/97 483 2.25 6.106 OUTLIER1-62-3/A06 36.73 36.80 4/10/98 11/12/99 581 0.07 0.191 0.191 1-62-3/A06 36.80 36.70 11/12/99 5/1/01 536 -0.10 -0.272 -0.272 1-62-3/A06 36.70 37.24 5/1/01 8/22/02 478 0.54 1.471 1.471 1-62-3/A06 37.24 37.78 8/22/02 2/3/04 530 0.54 1.450 1.450
1-TDRA/A05 36.80 36.70 11/19/99 4/23/01 521 -0.10 -0.272 -0.272 1-TDRA/A05 36.70 37.12 4/23/01 8/28/02 492 0.42 1.144 1.144 1-TDRA/A05 37.12 36.43 8/28/02 1/29/04 519 -0.69 -1.859 -1.859 1-TDRB/A05 36.80 36.70 11/19/99 4/23/01 521 -0.10 -0.272 -0.272 1-TDRB/A05 36.70 37.17 4/23/01 8/28/02 492 0.47 1.281 1.281 1-TDRB/A05 37.17 36.48 8/28/02 1/29/04 519 -0.69 -1.856 -1.856 1-TDRC/A05 36.70 36.80 11/19/99 4/23/01 521 0.10 0.272 0.272 1-TDRC/A05 36.80 37.13 4/23/01 8/28/02 492 0.33 0.897 0.897 1-TDRC/A05 37.13 36.45 8/28/02 1/29/04 519 -0.68 -1.831 -1.831 2-62-1/A06 37.11 36.99 10/25/96 12/18/97 419 -0.12 -0.313 -0.313 2-62-1/A06 36.99 37.05 12/18/97 1/29/99 407 0.06 0.162 0.162 2-62-1/A06 37.05 37.30 1/29/99 11/10/00 651 0.25 0.675 0.675 2-62-1/A06 37.30 37.15 11/10/00 6/20/02 587 -0.15 -0.402 -0.402 2-62-1/A06 37.15 37.13 6/20/02 12/2/03 530 -0.02 -0.054 -0.054 2-62-1/A06 37.13 36.97 12/2/03 2/15/05 441 -0.16 -0.431 -0.431 2-62-2/A06 36.84 36.56 10/25/96 12/18/97 419 -0.28 -0.760 -0.760 2-62-2/A06 36.56 36.58 12/18/97 1/29/99 407 0.02 0.055 0.055 2-62-2/A06 36.58 37.03 1/29/99 11/10/00 651 0.45 1.230 1.230 2-62-2/A06 37.03 37.74 11/10/00 6/20/02 587 0.71 1.917 1.917 2-62-2/A06 37.74 36.77 6/20/02 12/2/03 530 -0.97 -2.570 -2.570 2-62-2/A06 36.77 36.69 12/2/03 2/15/05 441 -0.08 -0.218 -0.218 2-62-3/A06 37.12 36.93 10/25/96 12/18/97 419 -0.19 -0.512 -0.512 2-62-3/A06 36.93 36.87 12/18/97 1/29/99 407 -0.06 -0.162 -0.162

Calculation 2004-0002 Revision 0
Attachment C Degraded Voltage Relays Statistical Analysis
Page 7
Unit and Relay
Number
As-left value (AL)
As-found value (AF)
As-left Date
As-found Date
Days between
Calibrations (T)
AF - AL Difference (Di) secs
Di/AL Percent
Drift (%Di)
Outlier Screening
2-62-3/A06 36.87 37.10 1/29/99 11/10/00 651 0.23 0.624 0.624 2-62-3/A06 37.10 37.04 11/10/00 6/20/02 587 -0.06 -0.162 -0.162 2-62-3/A06 37.04 37.00 6/20/02 12/2/03 530 -0.04 -0.108 -0.108 2-62-3/A06 37.00 36.70 12/2/03 2/15/05 441 -0.30 -0.811 -0.811
2-TDRA/A05 36.90 37.04 2/10/99 10/29/00 627 0.14 0.379 0.379 2-TDRA/A05 37.04 36.75 10/29/00 6/5/02 584 -0.29 -0.783 -0.783 2-TDRA/A05 36.75 36.97 6/5/02 8/7/03 428 0.22 0.599 0.599 2-TDRA/A05 36.97 36.62 8/7/03 3/9/05 580 -0.35 -0.947 -0.947 2-TDRB/A05 36.60 36.68 2/10/99 10/29/00 627 0.08 0.219 0.219 2-TDRB/A05 36.68 36.38 10/29/00 6/5/02 584 -0.30 -0.818 -0.818 2-TDRB/A05 36.38 36.59 6/5/02 8/7/03 428 0.21 0.577 0.577 2-TDRB/A05 36.59 36.21 8/7/03 3/9/05 580 -0.38 -1.039 -1.039 2-TDRC/A05 37.50 37.73 2/10/99 10/29/00 627 0.23 0.613 0.613 2-TDRC/A05 37.73 37.36 10/29/00 6/5/02 584 -0.37 -0.981 -0.981 2-TDRC/A05 37.36 37.57 6/5/02 8/7/03 428 0.21 0.562 0.562 2-TDRC/A05 37.57 37.15 8/7/03 3/9/05 580 -0.42 -1.118 -1.118
All Data:
Sample size: 54 Mean = 0.083 % Di Standard Deviation = 1.409 Data excluding Outliers:
Sample size: 53 Mean = -0.031 % Di Standard Deviation = 1.146 DG-I01 Appendix H Table A multiplier for 53 samples = 2.37
95/95 Drift value = (Std Deviation x multiplier) + |Mean| = +/- 2.75 % of setting

Calculation 2004-0002 Revision 0
Attachment C Degraded Voltage Relays Statistical Analysis
Page 8
Statistical Analysis
Mean -0.031
Standard Error 0.157 Median -0.108
Mode -0.272 Standard Deviation 1.146
Sample Variance 1.313 Kurtosis 0.227
Skewness -0.273 Range 5.741
Minimum -3.109 Maximum 2.632
Sum -1.649 Count 53
Confidence Level(95.0%) 0.316 Conclusion: The statistical analysis was performed on the Agastat ETR relay (Time Delay) and resulted in a 95/95 percent drift value of + 2.75% of setting. The statistical analysis shows the data to have a normal curve distribution because the Kurtosis was between the range of –0.697 and +1.015 for a sample size of 75 (Table D in Reference IV.4.03) and the Skewness was less than 0.492 for a sample size of 60 (Table B in Reference IV.4.03). The next largest sample size provides more stringent requirements, therefore the data set is considered to have a normal distribution. The mean of the data set was less than 0.1% of the as-left setting and no bias was assumed. The 95/95 percent tolerance multiplier was linear interpolated from Table A in Reference IV.4.03 to be 2.37. Therefore the 95/95 percent tolerance level was determined to be + 2.75% of setting for the ABB 27N relay (Time Delay).

Calculation 2004-0002 Revision 0
Section III– Degraded Voltage Analysis
Page 137
III.7.07 Degraded Voltage Relay (ABB 27N) time delay setpoint with a safety injection signal.
The drift uncertainty for the ABB 27N relays time delay is +0.92% of setting based on the statistical analysis performed of the as-found / as-left data from past relay calibrations and is contained in Attachment C. New Technical Specification Allowable Value: The maximum as-found relay time delay settings for the degraded voltage relay to ensure 95/95 confidence is 5.68 seconds. The nominal and actual settings for the degraded voltage relays’ time delay setting and the minimum actuation time are as follows: NTSPC = 5.63 seconds (Currently 5.87 seconds) ATSPC = 5.53 seconds (Currently 5.7 seconds) MATSPC = 5.43 seconds (Currently 5.5 seconds) TDC
min = 5.15 seconds The current Technical Specification and current settings for the degraded voltage time delay relays with a safety injection signal do not provide adequate protection to ensure the time delay safety limit of 5.92 seconds is maintained (Acceptance Criteria III.3.10). Therefore, new Technical Specification and relay settings described above are required to ensure the time delay safety limit of 5.92 seconds is maintained (Acceptance Criteria III.3.10). As descried in Section III.7.06, Acceptance Criteria III.3.09 is not maintained for thermal overload heater protective devices in Cubicles 2B52-328F and 2B52-427J because they may trip within 4.5 seconds.

Calculation 2004-0002 Revision 0
Section III– Degraded Voltage Analysis
Page 138
III.7.08 Degraded Voltage Relay (Agastat ETR) without safety injection signal.
The drift uncertainty for the Agastat ETR relays time delay is +2.75% of setting based on the statistical analysis performed of the as-found / as-left data from past relay calibrations and is contained in Attachment C. New Technical Specification Allowable Value: The maximum as-found relay dropout settings for the degraded voltage relay to ensure 95/95 confidence is 39.14 seconds. The nominal settings for the degraded voltage relay time delay setting and the minimum actuation time are as follows: NTSPC = 38.09 seconds (Currently 40.7 seconds) ATSPC = 36.99 seconds (Currently 37 seconds) MATSPC = 35.89 seconds (Currently 33.3 seconds) TDC
min = 32.16 seconds The current Technical Specification and current settings for the degraded voltage time delay relays without a safety injection signal do not provide adequate protection to ensure the time delay safety limit of 48 seconds is maintained (Acceptance Criteria III.3.11). Therefore, new Technical Specification and relay settings described above are required to ensure the time delay safety limit of 48 seconds is maintained (Acceptance Criteria III.3.11).

Calculation 2004-0002 Revision 0
Section IV – References
Page 142
IV. References
IV.1 Calculations
IV.1.01 Calculation 2004-0001, Revision 2, AC Electrical Distribution System Model in ETAP
IV.1.02 Calculation 2001-0049, Revision 0, Coordination – 480V Switchgear IV.1.03 Calculation 2003-0008, Revision 2, Power Panel Master Input Calculation IV.1.04 Calculation 2001-0033, Revision 6, Electrical Input Calculation – 345kV to
480V Switchgear Circuit” IV.1.05 Calculation 2003-0007, 480 V MCC Master Input Calculation, Rev. 7 IV.1.06 Calculation P-89-031, Voltage Drop Across MOV Power Lines, Rev. 9 and
Calculation P-94-004, MOV Overload Heater Evaluation, Rev. 13 IV.1.07 Calculation 2004-0009, Revision 1, Safety Injection Pump Motor Protection IV.1.08 Calculation N-94-130, Revision 1, 4160V and 480V Safeguards Buses Loss of
Voltage Relay Setpoints IV.1.09 Not Used IV.1.10 Engineering Evaluation EE 2005-0013, Revision 0
IV.2 Standards
IV.2.01 IEEE Std. C37.010-1999 IV.2.02 IEEE Std. C37.13-1990 IV.2.03 IEEE Std. 141-1993 IV.2.04 IEEE Std. 1015-1997 IV.2.05 IEEE Std. 242-2001 IV.2.06 IEEE Std. C57.13-1993 IV.2.07 NEMA Std. MG-1-1998 IV.2.08 ANSI Std. C50.41-1977 IV.2.09 IEEE Transactions on Industry Applications, Vol. IA-8, No. 4, July/August
1972, “Effects of Power Supply Variations on AC Motor Characteristics” IV.2.10 EPRI Power Plant Electrical Reference Series, Volume 6, “Motors”, 1987
IV.3 Software
IV.3.01 ETAP PowerStation 5.0.2N Computer Program (CWO-2005-032) IV.3.02 Microsoft Excel 2000
IV.4 Miscellaneous
IV.4.01 SUI-ETAP-18 R1, 3/24/2005, Software User Instruction – Chapter 15 Short Circuit
IV.4.02 FP-IT-SQA-01, Revision 2, NMC Software Quality Assurance (SQA) Program IV.4.03 Design Guide DG-I01, “Instrument Setpoint Methodology”, Revision 3 IV.4.04 ABB Product Instruction IB 7.4.1.7-7 Issue D, Single Phase Voltage Relays,
“Type 27N High Accuracy Undervoltage Relay” (CIM ABBTD 01554)

Calculation 2004-0002 Revision 0
Section IV – References
Page 143
IV.4.05 Technical Corrections to Generation-Transmission Interconnection Agreement for the Point Beach Power Plant, Docket No. ER02-558-001, dated 1/2/2002
IV.4.06 CIM ABBTD 01554 IV.4.07 ECR-1, “Agastat Nuclear Qualified Control Relays”, Industry Control
Products, November 1989 (CIM AMRAC 01562) IV.4.08 RCS-008-0685.37815.8, “Class 1E NBFD Nuclear Control Relays”,
Westinghouse, Copyright 1991 and 1995 (CIM WEST 00132A) IV.4.09 UG03-0203E, “Auxiliary Relays Self-reset and Latching”, ABB Relays, May
1984 (CIM ABBTD 01554) IV.4.10 Cutler Hammer Application Data 29-167F, AB DE-ION Circuit Breakers
Types EHD, FDB, FD, and HFD breakers, Pages 18-33a, October 1997, with the exception of page 33a which is effective September 2001.
IV.4.11 CIM STROG 00558, Sump B Containment Isolation Valves IV.4.12 CAP064393, Configuration Control of Overload Heater Elements on MCC
1B32. IV.4.13 CIM WEST 00146 IV.4.14 Field Walkdown of MCC Breakers, 3/17/2005 (See Attachment D) IV.4.15 Westinghouse Application Data 29-167E, Curve SC 4121-87A, Motor Circuit
Protector Time Current Curve Series C – Type HMCP, September 1991 IV.4.16 Square D, KC Family Molded Case Circuit Breakers Characteristic Trip Curve
No. 655-4, April 1989. IV.4.17 Square D, FA/FH/FC Family Molded Case Circuit Breakers Characteristic Trip
Curve No. 650-5, April 1990. IV.4.18 ABB Descriptive Bulletin 41-231S “Type 27, 27D, 27H; Types 59, 59D, 59H
Undervoltage and Overvoltage Relays,” October 1993 (CIM ABBTD 01554) IV.4.19 CIM FLUKE 00115 IV.4.20 CIM WEST 00178 IV.4.21 CIM WEST 00132A IV.4.22 Field Walkdown of Degraded Voltage Relays, 8/4/2005 (See Attachment D) IV.4.23 Westinghouse PT Curve 363891, 1/17/1952 (See Attachment D) IV.4.24 General Electrical Type JVM-3 PT Curve, 11/16/1976 (See Attachment D) IV.4.25 Bechtel Specification 6118-M-40 Revision 1, 5/7/1969, “HVAC Controls” IV.4.26 PBF-2032, Revision 79, “Daily Logsheet Turbine BDLG Log Unit 1” IV.4.27 Square D, I-Line Circuit Breaker Panelboards, Class 2110, June, 1984 (CIM
CRAFT 01405) IV.4.28 CIM PCP 00638 IV.4.29 CIM WEST 00170 IV.4.30 Memo NPM 2004-0118, dated 2/17/2004, “Equipment Status for Plant
Conditions Load Study” IV.4.31 Work Order 0510753, Test of the ABB model 27N Relay IV.4.32 Bulletin-5 TV-2, Multi-Amp Corporation, 1988 (See Attachment D) IV.4.33 Westinghouse Letter WEP-05-198, Revision 1, dated 8/1/05

Calculation 2004-0002 Revision 0
Section IV – References
Page 144
IV.5 Drawings
IV.5.01 Westinghouse 883D195 sh. 8, Revision 18 IV.5.02 Westinghouse 499B466 sh. 225, Revision 16 IV.5.03 Westinghouse 499B466 sh. 265A, Revision 8 IV.5.04 Westinghouse 499B466 sh. 266B, Revision 6 IV.5.05 Westinghouse 499B466 sh. 272, Revision 10 IV.5.06 Westinghouse 499B466 sh. 295A, Revision 9 IV.5.07 Westinghouse 499B466 sh. 296B, Revision 5 IV.5.08 Westinghouse 499B466 sh. 412A Revision 2 IV.5.09 Westinghouse 499B466 sh. 412B, Revision 1 IV.5.10 Westinghouse 499B466 sh. 540A, Revision 5 IV.5.11 Westinghouse 499B466 sh. 540B, Revision 5 IV.5.12 Westinghouse 499B466 sh. 543A, Revision 3 IV.5.13 Westinghouse 499B466 sh. 543B, Revision 9 IV.5.14 Westinghouse 499B466 sh. 596A, Revision 5 IV.5.15 Westinghouse 499B466 sh. 596B, Revision 6 IV.5.16 Westinghouse 499B466 sh. 597A, Revision 5 IV.5.17 Westinghouse 499B466 sh. 597B, Revision 6 IV.5.18 Westinghouse 499B466 sh. 651, Revision 7 IV.5.19 Westinghouse 499B466 sh. 654, Revision 8 IV.5.20 Westinghouse 499B466 sh. 655, Revision 7 IV.5.21 Westinghouse 499B466 sh. 657, Revision 7 IV.5.22 Westinghouse 499B466 sh. 664, Revision 8 IV.5.23 Westinghouse 499B466 sh. 669, Revision 5 IV.5.24 Westinghouse 499B466 sh. 715A, Revision 1 IV.5.25 Westinghouse 499B466 sh. 715C, Revision 5 IV.5.26 Westinghouse 499B466 sh. 716AA, Revision 3 IV.5.27 Westinghouse 499B466 sh. 716AB, Revision 3 IV.5.28 Westinghouse 499B466 sh. 716E, Revision 1 IV.5.29 Westinghouse 499B466 sh. 716F, Revision 1 IV.5.30 Westinghouse 499B466 sh. 716J, Revision 3 IV.5.31 Westinghouse 499B466 sh. 716K, Revision 4 IV.5.32 Westinghouse 499B466 sh. 716L, Revision 4 IV.5.33 Westinghouse 499B466 sh. 716M, Revision 2 IV.5.34 Westinghouse 499B466 sh. 716N, Revision 4 IV.5.35 Westinghouse 499B466 sh. 716T, Revision 2 IV.5.36 Westinghouse 499B466 sh. 716U, Revision 3 IV.5.37 Westinghouse 499B466 sh. 716X, Revision 4 IV.5.38 Westinghouse 499B466 sh. 716Y, Revision 5 IV.5.39 Westinghouse 499B466 sh. 716Z, Revision 3 IV.5.40 Westinghouse 499B466 sh. 717A, Revision 5 IV.5.41 Westinghouse 499B466 sh. 717B, Revision 4 IV.5.42 Westinghouse 499B466 sh. 719A, Revision 4 IV.5.43 Westinghouse 499B466 sh. 719B, Revision 3 IV.5.44 Westinghouse 499B466 sh. 721A, Revision 2 IV.5.45 Westinghouse 499B466 sh. 721B, Revision 2 IV.5.46 Westinghouse 499B466 sh. 721C, Revision 2 IV.5.47 Westinghouse 499B466 sh. 721D, Revision 3 IV.5.48 Westinghouse 499B466 sh. 721E, Revision 3
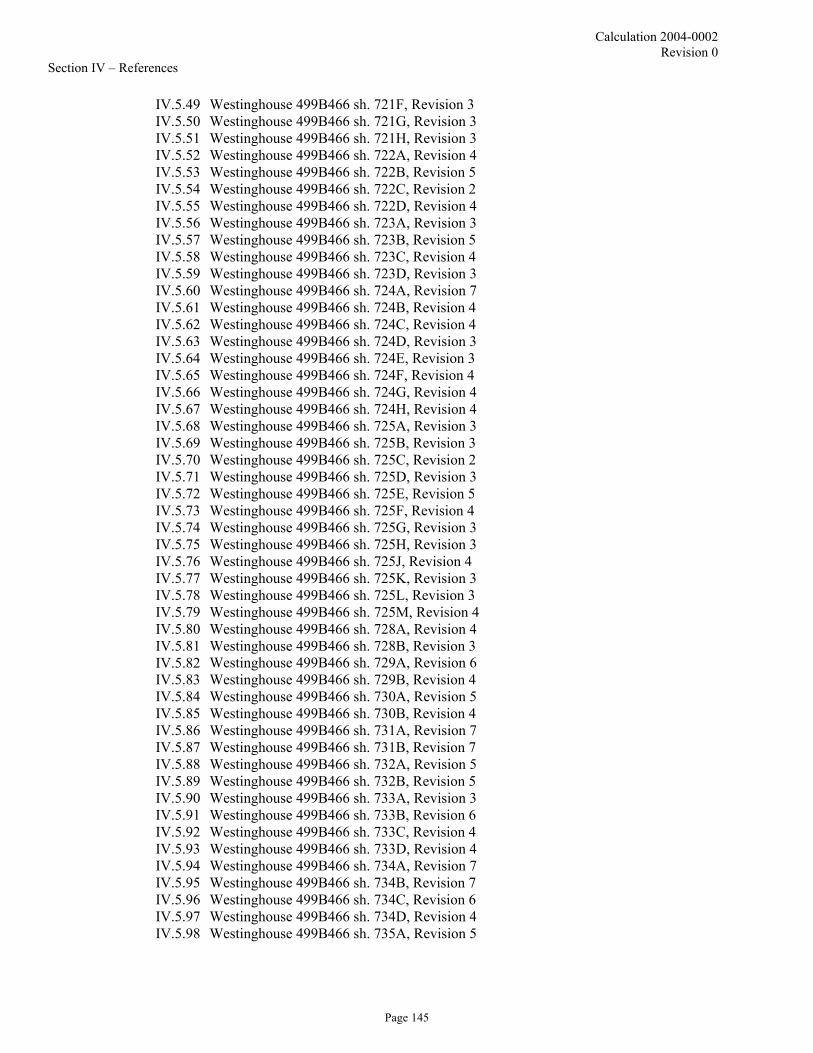
Calculation 2004-0002 Revision 0
Section IV – References
Page 145
IV.5.49 Westinghouse 499B466 sh. 721F, Revision 3 IV.5.50 Westinghouse 499B466 sh. 721G, Revision 3 IV.5.51 Westinghouse 499B466 sh. 721H, Revision 3 IV.5.52 Westinghouse 499B466 sh. 722A, Revision 4 IV.5.53 Westinghouse 499B466 sh. 722B, Revision 5 IV.5.54 Westinghouse 499B466 sh. 722C, Revision 2 IV.5.55 Westinghouse 499B466 sh. 722D, Revision 4 IV.5.56 Westinghouse 499B466 sh. 723A, Revision 3 IV.5.57 Westinghouse 499B466 sh. 723B, Revision 5 IV.5.58 Westinghouse 499B466 sh. 723C, Revision 4 IV.5.59 Westinghouse 499B466 sh. 723D, Revision 3 IV.5.60 Westinghouse 499B466 sh. 724A, Revision 7 IV.5.61 Westinghouse 499B466 sh. 724B, Revision 4 IV.5.62 Westinghouse 499B466 sh. 724C, Revision 4 IV.5.63 Westinghouse 499B466 sh. 724D, Revision 3 IV.5.64 Westinghouse 499B466 sh. 724E, Revision 3 IV.5.65 Westinghouse 499B466 sh. 724F, Revision 4 IV.5.66 Westinghouse 499B466 sh. 724G, Revision 4 IV.5.67 Westinghouse 499B466 sh. 724H, Revision 4 IV.5.68 Westinghouse 499B466 sh. 725A, Revision 3 IV.5.69 Westinghouse 499B466 sh. 725B, Revision 3 IV.5.70 Westinghouse 499B466 sh. 725C, Revision 2 IV.5.71 Westinghouse 499B466 sh. 725D, Revision 3 IV.5.72 Westinghouse 499B466 sh. 725E, Revision 5 IV.5.73 Westinghouse 499B466 sh. 725F, Revision 4 IV.5.74 Westinghouse 499B466 sh. 725G, Revision 3 IV.5.75 Westinghouse 499B466 sh. 725H, Revision 3 IV.5.76 Westinghouse 499B466 sh. 725J, Revision 4 IV.5.77 Westinghouse 499B466 sh. 725K, Revision 3 IV.5.78 Westinghouse 499B466 sh. 725L, Revision 3 IV.5.79 Westinghouse 499B466 sh. 725M, Revision 4 IV.5.80 Westinghouse 499B466 sh. 728A, Revision 4 IV.5.81 Westinghouse 499B466 sh. 728B, Revision 3 IV.5.82 Westinghouse 499B466 sh. 729A, Revision 6 IV.5.83 Westinghouse 499B466 sh. 729B, Revision 4 IV.5.84 Westinghouse 499B466 sh. 730A, Revision 5 IV.5.85 Westinghouse 499B466 sh. 730B, Revision 4 IV.5.86 Westinghouse 499B466 sh. 731A, Revision 7 IV.5.87 Westinghouse 499B466 sh. 731B, Revision 7 IV.5.88 Westinghouse 499B466 sh. 732A, Revision 5 IV.5.89 Westinghouse 499B466 sh. 732B, Revision 5 IV.5.90 Westinghouse 499B466 sh. 733A, Revision 3 IV.5.91 Westinghouse 499B466 sh. 733B, Revision 6 IV.5.92 Westinghouse 499B466 sh. 733C, Revision 4 IV.5.93 Westinghouse 499B466 sh. 733D, Revision 4 IV.5.94 Westinghouse 499B466 sh. 734A, Revision 7 IV.5.95 Westinghouse 499B466 sh. 734B, Revision 7 IV.5.96 Westinghouse 499B466 sh. 734C, Revision 6 IV.5.97 Westinghouse 499B466 sh. 734D, Revision 4 IV.5.98 Westinghouse 499B466 sh. 735A, Revision 5

Calculation 2004-0002 Revision 0
Section IV – References
Page 146
IV.5.99 Westinghouse 499B466 sh. 735B, Revision 4 IV.5.100 Westinghouse 499B466 sh. 735C, Revision 6 IV.5.101 Westinghouse 499B466 sh. 735D, Revision 5 IV.5.102 Westinghouse 499B466 sh. 735E, Revision 7 IV.5.103 Westinghouse 499B466 sh. 735F, Revision 4 IV.5.104 Westinghouse 499B466 sh. 735G, Revision 6 IV.5.105 Westinghouse 499B466 sh. 735H, Revision 5 IV.5.106 Westinghouse 499B466 sh. 735J, Revision 5 IV.5.107 Westinghouse 499B466 sh. 735K, Revision 4 IV.5.108 Westinghouse 499B466 sh. 735L, Revision 7 IV.5.109 Westinghouse 499B466 sh. 735M, Revision 6 IV.5.110 Westinghouse 499B466 sh. 739A, Revision 4 IV.5.111 Westinghouse 499B466 sh. 739B, Revision 4 IV.5.112 Westinghouse 499B466 sh. 741, Revision 6 IV.5.113 Westinghouse 499B466 sh. 742, Revision 7 IV.5.114 Westinghouse 499B466 sh. 803A, Revision 3 IV.5.115 Westinghouse 499B466 sh. 803B, Revision 3 IV.5.116 Westinghouse 499B466 sh. 804A, Revision 5 IV.5.117 Westinghouse 499B466 sh. 804B, Revision 5 IV.5.118 Westinghouse 499B466 sh. 804C, Revision 6 IV.5.119 Westinghouse 499B466 sh. 804D, Revision 8 IV.5.120 Westinghouse 499B466 sh. 804E, Revision 4 IV.5.121 Westinghouse 499B466 sh. 804F, Revision 4 IV.5.122 Westinghouse 499B466 sh. 812A, Revision 6 IV.5.123 Westinghouse 499B466 sh. 812B, Revision 5 IV.5.124 Westinghouse 499B466 sh. 812C, Revision 7 IV.5.125 Westinghouse 499B466 sh. 812D, Revision 7 IV.5.126 Westinghouse 499B466 sh. 812E, Revision 8 IV.5.127 Westinghouse 499B466 sh. 812F, Revision 7 IV.5.128 Westinghouse 499B466 sh. 818, Revision 9 IV.5.129 Westinghouse 499B466 sh. 829A, Revision 5 IV.5.130 Westinghouse 499B466 sh. 836A, Revision 5 IV.5.131 Westinghouse 499B466 sh. 836B, Revision 7 IV.5.132 Westinghouse 499B466 sh. 842B, Revision 1 IV.5.133 Westinghouse 499B466 sh. 856A, Revision 2 IV.5.134 Westinghouse 499B466 sh. 856B, Revision 2 IV.5.135 Westinghouse 499B466 sh. 857A, Revision 5 IV.5.136 Westinghouse 499B466 sh. 857B, Revision 6 IV.5.137 Westinghouse 499B466 sh. 861A, Revision 5 IV.5.138 Westinghouse 499B466 sh. 861B, Revision 4 IV.5.139 Westinghouse 499B466 sh. 863, Revision 12 IV.5.140 Westinghouse 499B466 sh. 1655, Revision 8 IV.5.141 Westinghouse 499B466 sh. 1658, Revision 10

Calculation 2004-0002 Revision 0
Section IV – References
Page 147
IV.6 Procedures
IV.6.01 Procedure 1RMP 9056-1, “Calibration and Testing of Safety Related Protective Relays A-05”, Revision 14
IV.6.02 Procedure 1RMP 9056-2, “Calibration and Testing of Safety Related Protective Relays A-06”, Revision 12
IV.6.03 Procedure 2RMP 9056-1, “Calibration and Testing of Safety Related Protective Relays A-05”, Revision 12
IV.6.04 Procedure 2RMP 9056-2, “Calibration and Testing of Safety Related Protective Relays A-06”, Revision 15
IV.6.05 Completed Calibration Procedures 1RMP 9056-1, 1RMP 9056-2, 2RMP 9056-1 and 2RMP 9056-2, 1996 through 2005
IV.6.06 Procedure OP 2A, “Normal Power Operation”, Revision 56 IV.6.07 Procedure ICI 12, “Selection of M and TE for Field Calibration”, Revision 8 IV.6.08 Procedure NP 8.7.1, “Measurement and Test Equipment”, Revision 11
IV.7 Setpoint Document
IV.7.01 Setpoint Document STPT 21.1, Sheet 74, Revision 8, Bus 1A05 Cubicle 57 IV.7.02 Setpoint Document STPT 21.1, Sheet 77, Revision 7, Bus 2A05 Cubicle 76 IV.7.03 Setpoint Document STPT 21.1, Sheet 103, Revision 7, Bus 1A06 Cubicle 82 IV.7.04 Setpoint Document STPT 21.1, Sheet 112, Revision 6, Bus 2A06 Cubicle 91 IV.7.05 Setpoint Document STPT 2.1, Revision 2 IV.7.06 Setpoint Document STPT 2.3, Revision 4
IV.8 Licensing Basis Documents
IV.8.01 Technical Specification 3.3.4 IV.8.02 FSAR 8.8, Revision 3, “Diesel Generator (DG) System” IV.8.03 FSAR 8.1, Revision 4, “345K VAC Electrical Distribution System (345KV)” IV.8.04 FSAR Chapter 8, Electrical Distribution System, Revision 3 IV.8.05 FSAR 14.3.2, Revision 5, “Large Break LOCA Analysis” IV.8.06 WEP-05-209, dated 7/16/05, “High Head Safety Injection Pump Spin-Up Time
Accident Analysis Evaluation” IV.8.07 FSAR 14.2.5, Revision 5, “Rupture of a Steam Pipe” IV.8.08 FSAR 14.3.1, Revision 5, “Small Break LOCA Analysis” IV.8.09 WE Letter to Westinghouse, NPL 96-0273, Dated 8/27/1996, “Engineering Safety
Feature Time Delays for the Fuel Upgrade Program at PBNP Units 1 and 2” IV.8.10 Westinghouse Letter WEP-05-283, dated 9/23/2005, “Final Evaluation of the
Impact of Degradation to Containment Spray Pump and Fan Cooler Performance”
IV.9 CHAMPS

Calculation 2004-0002
Revision 00I
Page 4
1.0 Purpose and Scope
The purpose of this minor revision is to determine the minimum and maximum as-found values for the Degraded Voltage Relay voltage and time delay setpoints with and without a safety injection signal (the Block B, C and D relays shown in Figure 1 within Reference 4.1). The as-found minimum and maximum values are provided to support the relay calibration procedures. The margin between the as-left and as-found tolerance limits accounts for performance-based drift of the device under test. Calibration settings found within the as-found range limits ensure the relays are not drifting excessively and are responding in accordance with the setpoint methodology to protect the relay setting safety limits established in the degraded voltage analysis. Calculation addenda 2004-0002-00-A thru H have been reviewed and have no impact on this minor revision. Scope: The minimum and maximum as-found values will be established for the Block B, C and D relays for the current plant configuration. A proposed plant configuration (several transformer tap changes) described in section III.2 within Reference 4.1 will not be implemented. Therefore, this minor revision only provides the relay as-found tolerance ranges for the current plant configuration and is not applicable to any other configuration.

Calculation 2004-0002
Revision 00I
Page 5
2.0 Methodology
The following steps describe the methodology to determine the minimum and maximum as-found settings for the degraded voltage relays (Block B, C and D relays shown in Figure 1 within Reference 4.1). The methodology below supplements the methodology provided in Sections III.2.06 and III.2.10 within Calculation 2004-0002 Revision 0 (Reference 4.1). The following methodology supplements Section III.2.06: (8) Add the following note to the end of the existing paragraph: Note: The Allowable Value (AV) also provides the minimum as-found setting for the Block B relay based on TMU. This as-found limit ensures that the Block B Safety Limit (SL) is protected and that the relay is exhibiting a 95/95 level of response. (15) The degraded voltage relay dropout Maximum As-found Value ( MAX
DOMAF ) is the maximum acceptable as-found value during relay calibration above the Block B degraded voltage dropout maximum actual trip setpoint ( MAX
DOATSP ). This tolerance accounts for instrument uncertainties that are present and can be measured during periodic testing. The as-found limit ensures that the Block B relay is exhibiting a 95/95 level of response and is consistent with the setpoint methodology. The MAX
DOMAF is calculated based on the guidance within design guide DG-I01 (Reference IV.4.03) as follows:
MAXDOMAF = MAX
DOATSP +TMU * MAXDOATSP (Equation 2.1)
Where: MAX
DOMAF = Maximum As-Found value for Block B degraded voltage relay dropout. TMU = Total Measurable error – total instrument error for calibration conditions of those uncertainties
that can be measured during performance of the surveillance. The TMU is applied to the as-left tolerance limit of interest ( MAX
DOATSP ) consistent with other parts of this calculation (Reference 4.1), in which the error/uncertainty is based on a percent of the as-left calibrated value.
(16) The degraded voltage relay pickup Minimum As-found Value ( MIN
PUMAF ) is the minimum acceptable value
during relay calibration below the Block B degraded voltage pickup nominal trip setpoint ( PUNTSP ). This tolerance accounts for instrument uncertainties that are present and can be measured during periodic testing. The as-found limit ensures that the Block B relay is exhibiting a 95/95 level of response and is consistent with the setpoint methodology. The MIN
PUMAF is calculated based on the guidance within design guide DG-I01 (Reference IV.4.03) as follows:
MINPUMAF = PUNTSP -TMU * PUNTSP (Equation 2.2)
Where: MIN
PUMAF = Minimum As-Found value for Block B degraded voltage relay pickup. TMU = Total Measurable error – total instrument error for calibration conditions of those uncertainties
that can be measured during performance of the surveillance. The TMU is applied to the as-left tolerance limit of interest ( PUNTSP ) consistent with other parts of this calculation (Reference 4.1), in which the error/uncertainty is based on a percent of the as-left calibrated value.

Calculation 2004-0002
Revision 00I
Page 6
(17) The degraded voltage relay pickup Maximum As-found Value ( MAXPUMAF ) is the maximum acceptable as-
found value during relay calibration above the Block B degraded voltage pickup maximum actual trip setpoint ( MAX
PUATSP ). This tolerance accounts for instrument uncertainties that are present and can be measured during periodic testing. The as-found limit ensures that the Block B relay is exhibiting a 95/95 level of response and is consistent with the setpoint methodology. The MAX
PUMAF is calculated based on the guidance within design guide DG-I01 (Reference IV.4.03) as follows:
MAX
PUMAF = MAXPUATSP +TMU * MAX
PUATSP (Equation 2.3)
Where: MAX
PUMAF = Maximum As-Found value for Block B degraded voltage relay pickup. TMU = Total Measurable error – total instrument error for calibration conditions of those uncertainties
that can be measured during performance of the surveillance. The TMU is applied to the as-left tolerance limit of interest ( MAX
PUATSP ) consistent with other parts of this calculation (Reference 4.1), in which the error/uncertainty is based on a percent of the as-left calibrated value.
This following methodology supplements Section III.2.10: (5) d. Add the following note to the end of the existing paragraph: Note: The Allowable Value (AVC) also provides the maximum as-found setting for the Block C relay based on TMU. This as-found limit ensures that the Block C Safety Limit (SLSI) is protected and that the relay is exhibiting a 95/95 level of response. (5) h. The Minimum As-found Value (MAFC) is determined to ensure sufficient margin exists between the Block C time delay minimum actual trip setpoint (MATSPC) and the Analytical Limit (ALC-LOW) to account for instrument uncertainties that are not measured during periodic testing. This as-found limit ensures that the Block C Analytical Limit (ALC-low) is protected and that the relay is exhibiting a 95/95 level of response. The MAFC is calculated based on the guidance within design guide DG-I01 (Reference IV.4.03) as follows: MAFC = MATSPC –TMUC * MATSPC (Equation 2.4) Where: MAFC = Minimum As-Found value for Block C time delay. TMUC = Total Measurable error – total instrument error for calibration conditions of those uncertainties
that can be measured during performance of the surveillance. The TMU is applied to the as-left tolerance limit of interest (MATSPC) consistent with other parts of this calculation (Reference 4.1), in which the error/uncertainty is based on a percent of the as-left calibrated value.
(6) d. Add the following note to the end of the existing paragraph: Note: The Allowable Value (AVD) also provides the maximum as-found setting for the Block D relay based on TMU. This as-found limit ensures that the Block D Safety Limit (SLNSI) is protected and that the relay is exhibiting a 95/95 level of response.

Calculation 2004-0002
Revision 00I
Page 7
(6) h. The Minimum As-found Value (MAFD) is determined to ensure sufficient margin exists between the Block D time delay minimum actual trip setpoint (MATSPD) and the Analytical Limit (ALD-LOW) to account for instrument uncertainties that are not measured during periodic testing. This as-found limit ensures that the Block D Analytical Limit (ALD-low) is protected and that the relay is exhibiting a 95/95 level of response. The MAFD is calculated based on the guidance within design guide DG-I01 (Reference IV.4.03) as follows: MAFD = MATSPD –TMUD * MATSPD (Equation 2.5) Where: MAFD = Minimum As-Found value for Block D time delay. TMUD = Total Measurable error – total instrument error for calibration conditions of those uncertainties
that can be measured during performance of the surveillance. The TMU is applied to the as-left tolerance limit of interest (MATSPD) consistent with other parts of this calculation (Reference 4.1), in which the error/uncertainty is based on a percent of the as-left calibrated value.
3.0 Acceptance Criteria
The same acceptance criteria for major revision 0 of Calculation 2004-0002 will be followed.
4.0 References
The same references for major revision 0 and minor revisions 0A thru H of calculation 2004-0002 will be utilized within this minor revision. The following reference was included for ease of reference.
4.1 Calculation 2004-0002, Revision 0 “AC Electrical System Analysis”
5.0 Assumptions
The same assumptions for revision 0 of calculation 2004-0002 will be utilized for this minor revision.

Calculation 2004-0002
Revision 00I
Page 8
6.0 Inputs
The following design inputs are used in performing the calculation: 6.1 Block B Relay (Degraded Voltage Relay Dropout and Pickup)
(1) Allowable Value (AV) for Block B relay: 112.8 volts (Reference 4.1 page 104) (2) Block B Relay Total Measurable Uncertainty (TMU): +0.26% (Reference 4.1 page 103) (3) Block B Relay dropout maximum actual trip setpoint ( MAX
DOATSP ): 113.4 volts (Reference 4.1 page 106)
(4) Block B Relay pickup nominal trip setpoint (NTSPPU): 113.7 volts (Reference 4.1 page 105) (5) Block B Relay pickup maximum actual trip setpoint ( MAX
PUATSP ): 114.0 volts (Reference 4.1 page 106)
6.2 Block C Relay (Degraded Voltage Relay Time Delay)
(1) Block C Relay Allowable Value (AVC): 5.68 seconds (Reference 4.1 page 124) (2) Block C Relay time delay minimum actual trip setpoint (MATSPC): 5.43 seconds (Reference 4.1 page
124) (3) Block C Relay Total Measurable Uncertainty (TMUC): +0.92% (Reference 4.1 page 123)
6.3 Block D Relay (Time Delay Relay)
(1) Block D Relay Allowable Value (AVD): 39.14 seconds (Reference 4.1 page 126) (2) Block D Relay time delay minimum actual trip setpoint (MATSPD): 35.89 seconds (Reference 4.1
page 126) (3) Block D Relay Total Measurable Uncertainty (TMUD): +2.75% (Reference 4.1 page 123)

Calculation 2004-0002
Revision 00I
Page 9
7.0 Calculation
The following steps determine the minimum and maximum as-found values for the Block B, C and D relays to be utilized within the calibration of the relays to ensure the relays exhibit a 95/95 level of response to be consistent with the methodology of the calculation.
7.1 The minimum as-found value for the degraded voltage relay dropout (Block B Relay) is equal to the
Allowable Value (AV) as discussed in the methodology section. Therefore, the minimum as-found value for the degraded voltage relay dropout (Block B Relay) is 112.8 volts.
7.2 The degraded voltage relay dropout Maximum As-found ( MAX
DOMAF ) for Block B relay is calculated based on equation 2.1:
MAX
DOMAF = MAXDOATSP +TMU * MAX
DOATSP MAX
DOMAF = 113.4 volts +0.26% * 113.4 volts MAX
DOMAF = 113.6 volts (Conservatively Rounded Down)
7.3 The degraded voltage relay pickup Minimum As-found ( MINPUMAF ) for Block B relay is calculated based on
equation 2.2:
MINPUMAF = PUNTSP -TMU * PUNTSP MIN
PUMAF = 113.7 volts -0.26% * 113.7 volts
MINPUMAF = 113.4 volts
7.4 The degraded voltage relay pickup Maximum As-found ( MAX
PUMAF ) for Block B relay is calculated based on equation 2.3:
MAX
PUMAF = MAXPUATSP +TMU * MAX
PUATSP MAX
PUMAF = 114.0 volts +0.26% * 114.0 volts
MAXPUMAF = 114.2 volts (Conservatively Rounded Down)
7.5 The maximum as-found value for the Block C time delay relay is equal to the Allowable Value (AVC) as
discussed in the methodology section. Therefore, the maximum as-found value for the Block C time delay relay is 5.68 seconds.
7.6 The minimum As-found Value (MAFC) for the Block C time delay relay is calculated based on equation 2.4:
MAFC = MATSPC –TMUC * MATSPC MAFC = 5.43 seconds - 0.92%*5.43 seconds MAFC = 5.38 seconds

Calculation 2004-0002
Revision 00I
Page 10
7.7 The maximum as-found value for the Block D time delay relay is equal to the Allowable Value (AVD) as discussed in the methodology section. Therefore, the maximum as-found value for the Block D time delay relay is 39.14 seconds.
7.8 The minimum As-found Value (MAFD) for the Block D time delay relay is calculated based on equation 2.5:
MAFD = MATSPD –TMUD * MATSPD MAFD = 35.89 seconds - 2.75%*35.89 seconds MAFD = 34.90 seconds
8.0 Results and Conclusion
The results of the calculation show the minimum and maximum as-found tolerance limits for the Block B, C and D relays to ensure the relays exhibit a 95/95 level of response, as follows: Block B Relay: Degraded Voltage Relay Dropout Voltage Setting: Minimum As-found (AV): 112.8 volts Maximum As-found ( MAX
DOMAF ): 113.6 volts Degraded Voltage Relay Pickup Voltage Setting: Minimum As-found ( MIN
PUMAF ): 113.4 volts
Maximum As-found ( MAXPUMAF ): 114.2 volts
Block C Relay Time Delay Minimum As-found (MAFC): 5.38 seconds Maximum As-found (AVC): 5.68 seconds Block D Relay Time Delay Minimum As-found (MAFD): 34.90 seconds Maximum As-found (AVD): 39.14 seconds In conclusion, the as-found tolerance range was determined for the Block B, C and D relays for the degraded voltage protection scheme. The as-found tolerances have been established to verify during calibration that the relays exhibit a 95% probability with a 95% confidence level. This ensures Acceptance Criteria III.3.06, III.3.09, III.3.10 and III.3.11 of calculation 2004-0002 (Reference 4.1) are satisfied by providing a 95/95 level of response. A review of associated documents has been performed to identify the effects of this minor revision. It has been determined the Routine Maintenance Procedures 1RMP 9056-1, 1RMP 9056-2, 2RMP 9056-1 and 2RMP 9056-2 require revision to incorporate the as-found tolerance ranges. The following PCR’s have been initiated to incorporate the as-found tolerances into the affected RMPs:
PCR 1066445 (1RMP-9056-1) PCR 1066450 (1RMP-9056-2) PCR 1066457 (2RMP-9056-1) PCR 1066462 (2RMP-9056-2)