pdf.usaid.govpdf.usaid.gov/pdf_docs/pnabe866.pdf · a loan is . overdue a penalty charge of 6% is...
TRANSCRIPT

- ~ Jt~ ~ ~ ~ AtKK~~k ~ cA1
Utft ~ t22t~j~tf ~
i ~A~ts- -~~ ft
55
S
to 2
t
ft 0
2
t
~
~ o~
~
ttt~
105~ 0
~
550 ft
~~0 0~ 5
0
tot S
tt 5 0-
~
~
05
5 0 tO
00~50
-1 - - t 55 tS ~ 5 ttj
~Vto SO
OS
to
S
tot
-5
A
5-55 5
St
o(t
05
SOt
- t~
F Ln~ir~s~amp
R31~U~ ~ (5
~i~o iecL Phwse
Nurnb~r I
II
- -
2 5
55
-
5
is
05 E
Forrest - Cook~on
5 5
to 0 Of 55~ -
jot
t~tyt ~
Oo5 - t~i
plusmn~oL)e3A H Nathan
t0d~bIILJJ~3 tofl
t
Associates
- -
0
0
I
O~ tobcu 1986 ~ S
---shy ft
~ ~j2~tlt ~
5i554i-5-- S o-2 04
Of
So~f
5-St 5
0
5
to 5of05
0550
~ ________________
5 5 50
2 t
J~f A~
S
t
St 2 55
~
55
t
~
foO55~ t0 -~
Table of Contents
Introduction 1
Portrait of- a Rural Branch Bank 4
Recovery Mt-asured by Branch Accounts 9
Loan Recovery Measured from Individual Loan Records 12
e tcI Iil IIIP ne I nq I oa n Recovery 17
Table List
Table 1 A Typica] Branch Bank Balance Sheet June 30 1985
2 A T vpi a I PuRra1 Bank Profit and Loss S I-almunt ]98o4
3 Estimated Returns on Assets and Liabilities 1984 8
4 Typical Disbursement and Recovery Ratios of Short Term Agricultural Loans 11
5 Disbursements and Recoveries of Short Term Agricultunral Loans Branch Means I1
6 Distribution of RecoveryOutstanding Ratio 12
7 Distribution of Loan Size of Short Term Ag riculLura[ loans ]
8 Loan Recovery Measures 14 9 Year of Disbursement and Loan Recovery 15
10 Distribution of Mean Recovery Ratios for 20 Short Term Agricultural Loans
11 Mean Recovery Rates by Bank for Short Term 21 Agricu]tural1 Loans
12 Nominal Ratio of Short Term Agricultural Credit by Bank 22
13 Nominal Rna ioof Short Term Agricultural c-ilIi y Prdaich Size 23
14 tWminal Recovery Ratio of Short Term AqricItu1 lr wr-it by Growth of Branch 253
15 N Iin I i tPtio of Short Termi Ag ii-tura l Cred it by Age of Branch
16 tmiI fmcovery Ratio of Short Term Aiiltural Crudit and Branch Remoteness 26
17 loan Recovery iI Interest Rates 30
18 P Patio for Short Term A rilturl IW s and the Collateral Ratio 3I
19 Nominol PcoveVr Ratio for Short Term Ac~r ltu-al QIuns and Size nf Principal 3
Accronyms
ACD AclriculiuvilVredit Department
BB ) )gL ~ l l a~
DPS l)|posi t PCnsion Scheme
110 ll(ad OfF ic -)fa bank
RBBUS NiiiralBk ind Bank User Survey
RFP RuLral Fiiace Project
Pecovery ofrm Agricultural Loans
1 Introduction Phit- paper pres(ents results from a survey uljl
taken as part I tLhe Rural Finance Project(RFP) of the Bangl ad(l
Bank financed by the Unitod States Agency for International
Development WitIin1 Hie ork program of the RFP the Rural
and Bnk ULsers ~livet (PBlII was udertaken to provide a detailed s of ctiri-e if l - il-inq wi th a number of issues of importanc ill
rural finance
Perhaps tHn meodv i mportant issue currently under discussion w ih
respect to ru-il ijiance is that of loan recovery There are two quesLi o s tliil r((l 1-o 1) addressed
1 What is the recovery rate of agricultural loans This fun lshyV (10 ii i I y to answer from available Lll
tiia plalje r detai Led evidence will be presented on recuvlfi
rates of short term agricultural loans
2 What factors influence recovery There are a number of possishy
bilities
a) The general social environment and the existence of free
riders a permissive environment will allow people to
default ()n I-leir loans leading to manywho are capabl of repaying willfully refusing to do so we call this
group the free riders
b) The pgterformance of the banks and bank branches Does ban]
or branch inainagcnen t made any difference
c) The choics miic-ade by a rational household willing to rly
the A-i th e oromic factors which inf uenc In
d) 1l tura dli asters and their impract on repayment capacit- P( hIf l- a mnjo impact on recovery
e) V I i I whctl result in no marlet
surplus AIC rural LLr(fers simply too poor to rt
The approach of this paper is to describe each of these fiv
factors and then consider what evidence is available from RBI3US or oth(er sou ( inidicate L e( which would oir mportance Howe vr relevant dat iK d I icl thtain for some factors The PkBIJ
data presented 1 no provids some information on b) and c) n
liMLUed data oni a) d) P)
It is commonplac and in onr view an unsatisfactory simplMI cation to at ti [rfri_nce by the political authoritVLr It in
as the root cause of poor loan recovery Now it certainly may be true that the i ti(-i]polt agivotion around issues of loan recovery
makes things difficult for the banksHowewer the real question is whether given the poitiical environment now extant it is possibl- ti [ rpv Lu lean recovery Whatever the viewpoints of the political authoLities there is considerable scope for action to improve loan recovery Howeverunderstanding should preco
action
The RBBUS data di scussed in this paper was collected from 100 branch banks whic h roprosiit a stratified random sample of tlh approximately 3000 rural branch banks From these banks some 60011 lit term anqri cullural loans were studied these ao-
represen t a proability sample of the short term agricultural loan portfolio of those loans disbursed during the period 1979-80
to 1983-84
Existing data on loan recovery of short term agricultural credit
is preparedlby oadeti Creditin L Bank Aqricul tural DepartmentI
based on returns by the five banks The bank level data is a compilation of Klie data ioiprted by individual branches Proceshydures torcompiliirg this data audit of the returns management
of non-reporting branches and octual branch coverage are a1 poorly defi ed To rmed th isthe B3ACD has been developing a detailed loan recory reporting system this system will soon be providing roports on loan recovery The RFP review of existiUg
reporting and a branch level review of loan ledger formats and procedures resulted grave that it toin doubts was feasible obtain accurate data from t1ic branch reporting of the entire loan universe ProvisLon of a bench mark for the loan recovery position r enle f the important purposes of RBBUS
What does measurinig loan recovery mean As this is not as s-iqp e an issue as it appears at first sight we describe the procediir used in Bangiladc Bank reporting and in RBBUS
1 An individLual liJOrI- Imm igricultural credit loan is dibu sed in kind and in cash
hoei cor2 Tieui i dce ii totality plus charges on a
dite Tlhe charges include the interest (currently 12) anid
a seryice charge (currently 4)
3 After the loan becomes due any unpaid interest or service charge is added to the original principal so that the loan on the books (blance outstanding) becomes larger (ie the unpaid interest is capitalized) Furthermore once a loan is overdue a penalty charge of 6 is added increasing the nominal interest rate to 22 This procedure makes it imposhyssible without a loan-by-loan calculation to identify payshyments made on interest or on principal
4 The usual way to measure the recovery rate for a specified period of time is to compare what should have been r)aid with what has been paid This ratio is in principle easy for the branch to comput-e retrospectively After the portshyfolio is brougLh up to date with interest accruals the total rce(vriF- diii i u the period are determined (R) Next tLhe
Tba [lce e-10I liug oF ry loan which is due prior to -ir end of tl perild is L II ] (1) The recovery ratio iF
then simpl y P P Se 1] as the interest accruals current at Ith t i me oII t reporting this poses no di I iIshyties Tis pr c-dure worlks perfectly for short term agricu]shy
tlra I vre I levor I hi precise procedures used by bnks
- I shy
to define amount due seem not will defined This ratio will be one of tho two measures used in this paper t
[4Y wAI il used if C1ye numuber of loans whcLch I 1K
or partial ly repaid a a percent of the total nu )e ni
loans disbursed T1 is is a good measure of branch perforshymance andin many ways a more useful indicator than the alternative value ratio described above The value ratio is influence0 d by interest rates and is difficult to interpret wvhen loans are several years overdue and inLerest
rates are high
This report describes first a typical rural branch bank This provi-des the reader with a snapshot of the rural branchs finaincial position Of course there is anot single type of branch balk and we have deliberately siinpshylified the complex spectrum into a single representative Next P13B3S results on recovery measurements are descrihLel Finally the factors influencing recovery are analyzed
2 Portrailt ol a ral Brainch Bank In this sectionfor ref-rr a fincc I portlrait of a rural branch bank in Bangladesh is asselfll)lcd fl a1pe r the rural branchs fin inr l I-ii tion ate ted irA 1gtlnice sheet a profit and mont and I ~L()
The profoin bailance sheet for June 30 1985 in summarized in T 1ab P ich m u-a- presented with medians summijri zd ai3 IWI)- l i llS
- 5 -
Table 1
A Typical Branch Bank Balance Sheet June 301985
(Thousand Taka bracketted figure give- percentof total advances in branches for assetspercent
of total deposits for liabilities)
Advances Deposits
Short len Agricultural loasL 4006 (40) Current Accounts 1(137 (19) Medium Tem Agricuturalamp Fishenr [inns 2011 (20) Saving(non-checking) 113 (13) lOflij O]I I I Ii i III11-a Deposits amp fifshr l I I (104) SavJing (cickiiig)Detx ii I31 H I1r (i Total -j-i-i 111 1 1 1-1ns 74 11) (74) Fixed deposits I
Other SiHl T- l1hs 824 ( 8) Other Short Tenmi IXcpn_-it )
Other 11k-diu Itim I ans 1122 (11) DPS -3 9) ( ) Othot I ruTg li n I)Ins 16) ( 7) Other Deposits 193 (4)
I 1o-I inI I jIi IlII I ( i6) 1(JL[ ILcx)sits 5465 (10) )
Grand To I of ilvii ices 1006 I(1()0)
towliij to tR 1 97 (19)
lolal JV-S J]P9t
1 Head O1li((
2 Balamcing itcm
3 [)ejjsitcIio-[iSchmuie
cui~tuid) dviu (nxnposition
Short TeIin 4830 (48)
MkRituu Tcnu 3133 (31)
long Teorm 2098 (21)
1BorromUi frn 110 I
Total Ii abiLities 1214
Ncudnal New Worth 2
- - 51
Mmuoranda Medians
Total Advances 578)
Lending to 110 0
Total assets 5780
Total deposits 329
Borrowing frail 110 277 Total liabilities 607
The balance sheeL indicates that measured by means Lhe typical branch Ii has Ltl idvlarces of 10 mill-ion Taka aniel lends 19 million Taka to its Ilead office It covers thi
with 55 mi i 1ic Tj-ka iii deposits and by borrowing 7 ti I I ii
laka f rom i I llo f ie on June 20 1985 deposits wef-re
50 of adwances the reminder was financed by transfers from t ilt lt (I ()f fice Ayri ctil tural loans amouLnted to 747A f total Loans (i the etiLire portfolio short term loans toQtaI lcd] 1H imdium term 31 and long term 21 However in agrl-i cuLI u slcort term loans were 54 medium term 21
and long term [9 somewhat more short term than for the non-aqrci l I t t A portfo)]io
From the port Felbo colposition we can see that the crediLI share is fairly close to the share of the labor force it
rural areas
Deposits averaged 5L million Taka per branch of which 15t were saving accounts 26 fixed deposits 19 current accounshy
ts and ]0 in various other deposits The sample branches reported a nominal average negative networth of 520 thousand
Taka This should be taken as a measure of the errors in the reported iaLa oiie hi rnihos have a number of other balitli- sheet items not reported in the survey which account foir tHie
difference
The median values are approximately half of the means inidishycating that tlhere are a tiumber of branches which are rather large and skew the statistical distribution
-7-
About half of the br-anch banks do not lend to their ilead
Office )n lr- hasis 11I h means net borrowing from the
head (4t ice is 9H (I(1posits on the basis of tHeitdiem i I
is 84 The iw-in ratii 1Finances 54 of its advances I
deposits i1o median liili 57
In Table 2 tt( fypica l profit and loss statement is r
The data i ci I tci F with current accounting policy so LI ii
income is usually (ove-sLated and there are no bad debt allowshy
ances maintLaiined at tie branch level Both the means and
mindian ar( 11rer income earned 77 accrues from ra rshy
nings (e ]lt)all and 157 from lending to head office Note tLhat
aht)iI lill IIf iaii lies lend to Head Office Other inceiiishy
reprs- - 8i lie total Of total costs 57~illy (A
in tercFee H- to and to offic)(22 depositors 36 head
wlmi II I i e- I cIa ociated administrative costs FiI- IP-r
are 26 (i I arpproximately 80 of the branches ripv I
Positi Vo pl()its
Table 2
A Tical Rural Bank Profit and Loss Statement 1984
(Thousand Taka percent of total income in brackets)
Mean Median
Interest earned from loans 1162 (77A) 734
Inte-est eaoi-d from 110 220 (146) 3
Other income 121 ( 81) 48 Total income 1503 1080
Interest paid to depositors 326 (217) 190
Interest paid to 110 538 (358) 217
Salary costs 147 ( 98) 129
Other costs 105 ( 70) 81
Total cost 1316 (743) 852
Profits 387 (257) 177
- 8 -
The various ratios releviinL t-o atnitig the branch are given in Table 3 Earnings on lodns avei-)p 162 while interest earned from lending to Hlead Wf[ic I 6_1 The average
return was then 146 Ij[ t cosls trk l interest
cost including transfers 1rcin H ave iged 86 Thus the
rural branches had a spread of 67 c Ii HhLt these
estimates do not questiol Cteamp11it 111iij p[Lactice but
reflect the rural finance system as il- Js reported today in
the accounts of he iead ()I ice
Estimated Returns on Assets and iiabilities (1984)
Assets
Interest t d on [2 IC1 Interest paid by lead tIi cu 6 3t
Average earnings 146 3
Interest paid on deposi[ 95 -
Interest )Lild Uo iead 01 ic- 1-
Average cost of funds 86
Other
Ratio of non-interest cost to loans 29
Ratio of profits to total 4sets413
1 Computed from average advances and reported earnings
2 Reported by branches
3 Asset composition of June 30 1985
4 As reported by branches
5 Liability composition on June 30 1985
-9shy
3 Recovery Measured Branchby Accounts
This section describes recovery rates estimated from branch data Tables 4 and 5 prusuiLt the hask- onicata disbursement and recovery In Table 4 we have reported the medians of ttie distributions of branch Values Use of the medians-has the advantage that it protects against some of the c- --eme mnireposhyrting errors by branches Over the five year period 1981-1985 the disbursements as a por-(t21 ofL I onot sHn gs at the beginning of the period lhve incrctnuXI I Fv-iidy pealltjng in 1983-1984 and then dcld i in iliij DisbursumiiL have continued to i I[V Inc-eI J190i L i of single disbursements has iru Lhi icmdaled over this period these increases are esstn il 1Iji tcl eses in input prices corresponding to iniiA]a t i (dIm 7] In real terms the typical short Lvitt agr loain has been consshytant or declining slightiy in size
The recovery ratio computed asis ilit noint recovered to the amount due The amount- due Ji ti1i iniLia] balance outstanshyding plus the interest charges assating tLhat the loans are repaid smoothly durinj the year an it_ ernative definition relates amount due to Vn] ()f the yai- ()tstand ng plus reco-shyveries less disbursements Limes an itltecst rate factor
The recovery rates have lI t a tc(t -Iim 31 in 1)81 and 1982 rising to 39 in 198j3 an ihten dcclini hg o 27 in 1984 and to 21 in 1985 There is li tile diit tht r ecove ry rates i 1986 are low and may I I I1c1I l -rtfrr m the lows o 1985 Repea Li tjg s kui IciiI atl-althe K I 1 t hbrnch means (Table 5) we sc-e essen il Iif 1t 101t1 1a recovery
- 10 -
The recovery ratio using the ul ian is sini lar to the recovery ratio
of the means The two metlic1i o pu Li ii L ( (M Iv01ry ra Li o give a( amp
similar result method 2 being systmatica]l Iv higher than method 1
There is an overall consistency in this daML indicating an increase in
the recovery rates upto 1983 followed by a shalrp decline to approximately
20
The size of a loan recovery deflated with an index of disbursement size
has developed as fol loMs
Real mean recovery (ndcex 1985=100) 1981 1982 1983 1984 1985
166 126 131 133 i0
Disbursenents in real terms using the same defLation (disburs(aent size
in Table 4) is as follcwqs
Real disLhisnents (index 1985=100) 1981 1982 1983 1981 1985
48 44 104 13] 100
Following the rapid rise in real terms (ie acreage covered by short
term credit) there was a substanial decl inu in 1985 a furt11her decline
will take place in 1986
Next we describe in Table 6 the distriltio oitf the ratio of recovery
outstanding ratio This indicates that th( c-L 30U of the branches have
very low recovery rates currently averagrwj 1esnq than 10 of the amount
due This effect of a substUantial niouixr (I I (upwt one third)with
very poor loan recovery records suggests tht a pr(opsa targetted at the
branches with such low recovery penrformance vould be tartictularly effective
in raising overall recover-y raTes The (l 1 ir VCV4)- I S ]S Seeni(t
in the deterioration of the median and 3C1i IWth 51-h fictiles ccawupred
by branch many branches havinj rlLainud st is factory recovery rates while
others deteriorated Tiie dewroration ot rc(2Jer rates has not been
uniform across the sample The icovery xceedi ng 100 result fraii1tt
a ccmbination of mi srerxrti j rt( c-ry oi I I t( - al oCC01iotstandi ng
canbined with loans less than one lear eg i I loans are for three months
and fully repaid then the roti recoveries 1-o the balance outstanding
would be Meurtlietimi ng (d LCOVe)fi s iii y reducealmost 500 [ne
the balance outstanding on the rcpiorting ct
- 11 shy
Tab]e 4
Typical Disbursement and Recovery Ratios for Short Tr Aqji- II_ [on ( Pcrcent)
(Branch m diitiws)
m _ _
1981 1982 1983 1984 1985
Disbursementoutstanding 50 54Th 119 93 25
Disbursement size (Taka) 1500 21() 2400 2700 3260
Recoverydue 1 315 307 39 269 21
Recovery size (Taka) 1913 203h 2420 2760 2500
I Method 1 for dues Due Outsl-andii kiLtcirc-sL vatl-e factor
Notes The value of Lhe vaL-iI-L is coiiputcd to - alL sampled branch the medians ar c-por-Led ij Lh1Js Labl e
Tolk-te 5
Disbursements and 1ecovurit is of Short Term Agricultural Lii- Branch lMeans
(Thou s n il Pla k a
981 1982 1983 1984 1989
Outstandings 1 606 750 1014 1874 3560
Disbursements 366 467 1260 1789 1650
Recoveries 272 26] 499 614 824
Disbursementsoutstandings 60 62 327 95 46
RecoveriesDue Method 1 39 305 43 275 195
Method 2 429 335 48 27 na
1 Start of year
Method 1 Duet = Outstandings tIiLerest rate factor
Method 2 Duet = Out tandingst+1 + Recoveriest- Disbursements
Interest rate factor
- 12 -
Table 6
Distribution of RecoveryOutstanding Ratio
(Percentage)
Fractile 1981 1982 1983 1984 l95
95 325 09 503 267 265
90 180 102 200 134 148
70 58 47 H7 44 53
50 36 35 45 32 25
30 19 22 29 20 13
10 8 11 14 3 4
5 6 8 3 2 2
4 Loan Recovery Measured from ndividual Loan Records
This section reports the results of analysis of 6000 plus
loans The ratio of the balance outst-anding at the time of
data collection to the loan principal was computed for each
loan We call this the nominal ratio Another ratio was compushy
ted deflating both the t tiltsiii iny and the original
principal to a common base year We call this the reel ratio
The short ter-m agriculLnii ln f)] i nLitutes sameI [)it
40 of the value of loans (usLutandi ng (se Table 1) The
distribution of loan sizes is given in Table 7
The nominal ratio takes on values mqing Iii zero Lo arbitrarily large
number When t h lan is reazid has been removedthe ratio is ZEfl-C) k fullV and
from the branch ix)rtfoio Ii up interest paynentsWhnriii rreiqc 1pt
and other charges then the noninal ratio is )nc_ wlict lieLio is less than
one some progress has been made in loan re(overy Finally whie the raLio is
greater than one then even the intf-rst paqueILs are not beirg met(ne
real ratio includes whatever recovery has been obtained through inflation
1
Ta b I e 7
DisLribution of Loan Size of Short ______erm A r iP(- I uir it Lodns shy
(Percentage of Loans D)IiLti1Lud JuJy 1978 - June 1985)
Class interval (Taka) Nomina] Real (1985 prices)
0 - 1000 32 15
1000 - 2000 36 32
2000 - 3000 16 27
3000 - 4000 10 11
4000 - 6000 4 12
6000 - 8000 1 2
8000 - 10000 0 1
10000 - 15000 0 1
Mean loan size(Taka) 1720 2570
The distribution of loan size indicates very clearly the type
of loans with which we are dealing There are no short term
agricultural loans greater than 1000() Ika in nominal terms
85 of the loans are less than 3000 TlVt in 19811 prices 8
are less than 4000 TPaka One is de -1inq with very small lrans
and collection effort per lo n could nver be very large
Using the direct data reported by B olies for 1984 and 1985
we find rather Ia-rger means (3400 Paand 3450 Taka respeshy
ctively) and medians(2700 Taka and Tka) There has been
onsiderable increase in the individual loan siz in nominal
terms over the period (1979-1985)
- 14 shy
The loan recovery measurement is summarized in Vabe 8 following
Ta b I e 8
Loan Recovery NlMea_sire-e (PercentL ()I foans)
Value of Ratio Normal a io Real Ratio
0 1 49 49 0- 4 2 3
4- 8 3 4
8 - 10 4 13 10 - 15 30 27 15 - 20 9 3 20 + 3 1
Repaid 49 49 Principal reduced 9 20 Total improved 58 69 Principal not reduced 42 31
1 Loan fully recovered
- 15 -
The nominal loan recovery ratio indicates that 49 of the
loans disbursed were fully recovered All of the loans were
due prior to the period of data coli clici Ano l ietr 9 of the loans had a balance otHt ldiilj in- thlan tir origina]
principal and hence should somu progrss towards recovery
However the remaining 42 haid a iInine oLtstanding greater than the Lgina1 princili l i Liatti interestor o payments
were not beiny met
When denominated in real terms we fIind Lhat 20 of the loans
had a balance outstanding less than original principal This
reflects the impact of intli ion ini dLi tile debt burden
felt by the borrower
We next examine the recoviy rate and the year of disburseshyment These results are prusented in ihle 9
Tahlu) 9 ]
Year of Disbursene and li Recovery 4
(Percentage ofi columioLotis)
(I j so( L Value of nominal ratio 79 80 81 82 83 84
0 66 70 63 43 28--
0- 4 2 Ii 0 2 5
4- 8 0 2 ] 3 4 4
8 shy 10 1 1 2 2 3 13
10 - 15 5 5 5 18 11 50
15 - 20 8 15 19 13 5 1
20 + 17 6 9 1 0 0
Repaid 66 70 63 63 43 28
Principal reduced 3 3 5 5 8 21
Total improved 69 73 68 68 51 49
Principal not reduced 31 27 32 32 49 51
- 16 -
Table 9 reports that loan recovery (fully repaid) measured
by the number of loans begins with 28 repaid in the first
year after disbursementrising to 43 in the second year 63 in the third year and then approaching 65-70 over the next two years The number of loans which show a reduced
principal ie interest charges are paid and some progress has been made in recovering principal begins at 21 one
year after disbursement and decreases to 3 after five years
Lhe number of loans for which there is no progress on prinshy
cipal repayment decreases from 51 one year after disbursement
towards 30 after 5 years
Examining the relationship between the recovery ratio and the
year of disburseient a numoer of conclusions are apparent
1) The recovery rate reachus 70 Hi i 11eis not
repaid
2) The loan portfolio car be separated into three categories
a) Repaid b) Repayment- underway or potential1y repayable
c) Non-recoverable We can simplit tLhu data in Table 9
as follows to indicate the four year pattern
Percent of loansyciLeqv
Year after isbn iInt~nt
1 2 3 4
Repaid
Potentially repa
Non-recoverable
id
30
70)
0
45
50
5
65
20
15
70
0
30
This suggests that 2 and 3 ifte-r di sbuirsment
are the critical times when many loa ns become non-recoshy
verab]e In year 2 two Lhirds )i Hie iiddle category
are repai-d one tiiI de non-i hivurjblein year 3
only 25 of the middle category are recovered 75 become
non-recoverable
- 17shy
3) Loans divide into two c(joups IiW)sc which are nver going to be repaid and those that- are If we subtract
out the 30 that are never repaid then we see the recoshy
very pattern as ()fl i
Recoverypatt ii for loim hil-i iro repaid
h-dr after d i sluruemenL I2 3 41
Repaid 43 64 93 100
In process of repayment 51 366 I 0
5 Factors Influencing Loan Recovery
This section presents data and analysis on the factors which
influence loan recovery The entire subject of loan recovery
is a very difficult one to investigate for there are strong opinions but limited facts This sectiot reviews five factors
which potentially influence loan recovery
51 The general souial C1avJronment There is widespread
informal expression of the vitw that the social and
political environment influences the rate of loan recoshy
very While thJ7 is a common--onse observation there is
no real evidence t support it A number of remarks are
of relevance
a) Different banks and branches how very different
loan recovery rates The vriations among branches
are very large () Iiht th l i i ulffect must be quite dii t1iriit I i (ltn( ld[ict2 [o anoth r
or it must be quiti weak
- 18 shy
b) There have been considerable variations in the
annual recovery rates (see Tables 4 and 5) Thure
is no obvious correlation of these rates with the
changes in the poiliLica] cvironmnnt
c) The immediate correlation that strikes one from
Table 4 is between the disb iirementoutstandings
ratio grd the recoverieshu Li Thete are only
five observation of this macrn le(vel data a but a
close relationship is suggested One would have
thought that politica] con( wit 1otildhe nianifest in a high growth of dit i sbursem rl Iltw-v1r he eidenice
is ambiguous A hicgh growth raLe in disbursements is
accompained by higher recvcry rates A large absoshy
lute volume of disinursement i accompained by lower
recovery rates
It appears from thesu iildicators that there is little
empirical suLtport tot the contention that changes in the
recovery level are int lmniuced by lI poli]tical environshy
ment However the a()s-I e 1t 1 t-ecove -y may will
be ifluenced by t he p i tica I lv i -onment Tho level of
70 recovery of a ortlroflio dishursed four years preshy
viously is not a very sct-isfacto y recovery rate (no
viable rural finance sfem ci Iki iL on this level of
recovery) The fai li 1 ra i Ili( -c(overy rate above
this 71 level may lt JiL ted withi i prolonged unshy
willingness of the soci-tt sys Wi- ccI Ictl more loans
This may also reflect a iiuitber of persons simply unable
to repair due to natural calamities What is evident is
thlt there is nio evidence which indicates a relationshy
ship between political and social otA i ttdes and short term
changes in rocovery rate3 Thu (ne should not look to a
stiffer political stance even as anecessa y much less
sufficient condition fo i imptrovinq rtovery rates from
say 20 to 40 of the amount due
- 19shy
52 Performance of banks i [id rc T aie signifishy
cant differences in loan recovury performance of differshy
ent branches and different banks Table 6 above indicated
the wide dispersion in Lhe ratio of recovery to outstanshy
dings a proxy for the recovery rate Table 10 gives the
distribution of mean recovery ratio for the branches
and also annual esLiuates Tie resulL is striking
loan recovery differs greatly from one branch to another
Table ]] presents the mean recovery rates by ban This
provides both the mean of branch means (unweighted) and
the recovery rate for the bank Again we see a considershy
able variation from one bank to inother
Turning to the individual lotns those are cross classishy
fied against a number of branch related variables in
Tables 12 13 14 15 16
i) Table Le records tLhe recovcry rates of banks This
indicates as does Tlb] e 1 taiti thvi-e ir signifishy
cant differLnces ii i- j ii It is t-1h existence
of such differences tLhat illdicates action is
possible to improve 1onn ivey
ii) Next we examine ba-ink si ze ii1 i rltnvery (Tab]e 13)
The RBBUS data shows that lhii i overy declines
with size of branch Sinall Iiiilh with total advanshy
ces less than 3million hl a have rccoe ry rates
of the range 65-70( This ii- Jcclines to 50 for
larger branches but incLuaii a fOL larycitddiin the
branches The upturn of the recovery rates for very
large branches is not sLa i a ly1 siqnificant
Although this ainilysis exntimesiWiiis I (lLt vari able
(branch size) it is highly suggestive of the conshyclusion that rwov ry will dec1 i iewith branch
- 20 -
Table 10
Distribution of Mean Recovery Ratios for Short Term Agricultural Loans
(Percent)
Fractile 81 82 83 84 85 Mean
5 94 113 99 71 85 92
10 64 71 79 43 44 60
30 39 33 41] 28 33 34
50 22 27 30 22 16 23
70 11 17 21 14 7 14
90 3 9 [0 2 2 5
95 0 6 5 1 0 2
Mean 30 33 36 24 22
Recovery Ratio Method 2
- 21 -
Tab] e I 1
Mean Recovery Rates by Bank for Short Term Agricultural] Loans
(Percen L)
Agrani Janata Rupali Sonali NCBs BKB Total
Branch Means
1981 3o9 186 172 I ()0 30()
1982 400 258 52 282 35 24 332
1983 442 267 537 287 346 408 362
1984 238 143 378 2h 8 241 233 239
1985 186 175 504 I7 215 243 222
Mean 315 206 489 2I90 294 291
Bank
1981 280 191 151 715 306 312 307
1982 214 120 265 9 245 259 248
1983 430 260 271 267 293 478 333
1984 280 73 156 241 207 282 232
1985 270 113 236 218 204 214 209
Mean 295 1514 216 268 250 309 266
Recovery Ratio Method 2
- 22 -
Tabl I 2
Nominal Ratio of Shuv-t Term Agr-icultural Cred i t l Iiink
Value of ratio AKa n j JanaLiai Upa Ii Sonali BKB
0 54 43 58 47 48 0- 4 1 1 1 3 3
4- 8 4 1 2 2 3 8 -10 8 6 2 4 2
10 - 15 26 24 26 31 36 15 -20 7 4 8 9 7 20 + 1 10 3 4 1
Repaid 54 43 58 47 48
Principal reduced 13 9 5 9 8
Total improved 67 52 63 56 56
Principal not reduced 33 48 37 441 44
- 23 shy
Table 13
Nominal Ratio of Short 1W nn Agqric ilt r li Credit bI wlc -_zu
(Percent of loans recoveit i by size cawegory)
~ l
Value of Ratio 0-1 1-2 2-1 3-4 4-- 6-8 8-10 10-20 20 +
0 66 59 4I 35 13 47 1 43 47 48
0- A 1 2 3 1 1 2 2 2 2 3
4- 8 4 3 3 3 2 2 3 2 2 2
8 - 10 3 4 5 I0 4 1 5 3 3 6
10 15 22 21 25 28 2( 37 35 38 36 35
15 - 20 4 7 1 15 i IH 9 9 9 5
20 + 1 4 5 8 I1 3 3 3 1 1
M wiW 66 59 48 35 41 i1 43 47 48
Principal reduced 7 9 1) 14 7 5 9 7 7 11
Total improved 73 68 58 19 50 2 53 50 54 59
Principal not reduced 27 32 42 51 50 48 47 50 46 41
Notes 1 Branch size measured by total advances outstanding in
million on June 30 1985
- 24 shy
size This is a reasonable conclusion As branch
operations expand the branch loses regular contact
with its customers and recovery rates decline At the branch level this suggests that the decline in recovery rates nay be a consequence of Lhe rapid
expansion of disbursements
iii) Another po~sible hrwLh chnL [rl i iK the rate
of growth of the ranch in lable 11 wc report tLhu
behavior of the in )nina] r- vhry iratio I)r branches
according to the rateoM growth of outstanding
loans This data i nJ icnIA no Mt a L -l 2hip betwoen
the growth rate and Lhe nominaii i ry ratio
Althogh large branches show poorer recovery than
smaller branchen rapidlv qrowinq hra-ancls do not
seem to be poorer at r Acvn I s I ow qjq br uihes
iv) The branch leia rnts iothi ng trom experience in loan recovery Table 10 sots out the nominal recovery
ratio by he agu oI Lhe 1ran t Altlhough there are
substantial variatiouns tlh r is no trend The older
branches do not improve tlhei- recovery rates
v) Very remote Qanuhrli- liavu pitrer recovery ratios
than do more accussible brinhes However for most branches accsii IiLy ha w influrence on the recoshyvery rate (td1n I )
l]e
Nominal Recovery RaLio i IiorL Term Agricultural Crccl i t n 3ranchBrawth
1) -11
Annua ro wL )wh I u Ot advances ( -25 Lo 0 0-10 ]10--20 20-30 30-40 40-50
Ioans repaid 61 63 33 58 47 49
Principal reduced 5 7 6 5 11 6
Total improved 65 70 38 63 58 55
Principal not reduced 35 30 62 37 42 45
Table 1
Nominal Recovery Ratio of Short Term Agriculural Credit by Age of Branch
(Percentage of loans)
Age of branch inye ars 4 5 6 7 0 q 10 ]0l1t
loans repaid 46 50 37 19 61 62 43 4q
Principal reduced 13 15 12 9 9 8 4 8
Total improved 59 65 49 58 70 70 48 57
Principal not reduced 41 35 51 2 30 30 52 43
- 26 -
Table ]6
Nominal Rucovery Ratio of Shout rl )n Agricultural Credit and Branch Reilotfenss
(Percentage of cases)
Remoteness index
1 2 3 4 5
Repaid 45 41 49 57 28
Principal reduced 8 11 10 7 11
Total improved 53 52 59 64 39
Principal not reduced 47 48 41 36 61
Note 1 is most accessablc 5 za sJhl] is Iccc
- 27 -
The conclusion to be dirawii r r-w 11 a I i L L Lhe ba-1t11
and the make Idi ll xcc hit loweverbranches e-i- Ii rt(cvury
the experience location (rcrmotceess) and growth of tile
bi ch do not infucICe r I ii does which is
strongly suggestive of d i a2ttL)nOl l 1i L 11l cove]7y Pile
major conclusion that o l II mpt banksis aI 1e the and
Lihe branchies f roi resomiailbi Ii Ly le - r ratesr recovery
53 Household conditiorIn I 111 11112 thi rd major aspeshy
ct of loani rucovery _ lI il I i iitI -I LI Iiw-laoid towards
repayi-i - IH th ii (ii I I WI_ I J I w ith L e
household that helI eve I t111 iilil i j-Piii uit throshy
ugh influence Instl ead wV c coi h iL LI aLc tiona]
farmer who faces the Itsi i I a orr to deferw
payment to thc future Pio j a iaaie aind we do
not examiie in this Vijw t Lii 1oan recovery A
numihrr of qtuestiors (i I in
i) One would expect recovery to I lavese]y related to the
availability of fresh credit Tie rrmer faced with unshy
certainly over availaIn lity ir Lrsi cr dit from the
banking system may preler tu defer repaymuiit the altershy
natives are no credilt or paying ligqi iiiI evest rates to
the informal sector versus a 22s banlk rate including the
penalty charge So long as the expected return from using
short term credit is gea ter l] ii 22[ but ting off repayshy
ment- would be the pic Feurred appi-oacl The data from the
branches supports the contenti on Llhat repayment is better
when loan sanctioiiinj is XpiniI g
ii) Another aspect of households aLti liide towards recovery
is the real interest rate The ic2a] iliterest rates for
the short term agiicultitira loans -r j i iii iihle16 The median
real interest rate is 107 Thi s is i le a hicih rea rate When the rate
- 28 -
Table 16
Real Interest Rates for Short TermAgricul tural 1ai
Interest rate interval Percent of loans
-50 to -10 11
-10 to 5- 2
- 5 to 0 6
0 to + 5 14
5 to 10 25
10 to 15 19
15 to 20 11
20 to 30 9
More than 30 10
Mean 108 Median 10
is high will the huwuhold LuLd to repay or defer
repayment The high real rates arises from the
decline in rice prices which has the simultaneous effect of raising the pricu inidex and reducing income from surplus rice sales The farmer on the one hand wishs to repay Lhe o oan sInc Lhe interest rate is higher and he pi-efeirs to dter current consumption
for future consumption which is now cheaper (this is the same effect 3 jvi j) ytuL Ills iicome may be
reduced and his ability to repay weak ened Table 17
gives the relationhip CLetUUH interest rates and both the nominal and real rucvery rate Thi- table
indicates that recovery rates declAine wvith riE-ing real raLs for the range -10 to +102 (approximately
half the loans) cind then incrieasu with real interet
rate Using the rel- recovry rilt ows essential ly
the same effect
For borrowers expticu i ng raIl rates less than 10
lowering the intc itae ni ( improve the recovery
rate whereas for the liiqlic ti rates thi recovery
rate would be rudic d
iii) The collateral used for short term agricultural credit has no impact- o ic i t tyili (i le If)
The conclusion of this brief JCrLipt ion Of household
response is that thert Js good _vikluiice tihat interest rates and the avaiIabii ty of l i 1()Li1s in luence the
willingnens to repay [Iowever late-al requirementsra have no influence Phis is no i ii i-iu ltis collateral
requirements are noi~inal and have no significance in the
recovery processr
- 3o -
Loan Recov-yrmand Ii l Ini s
(Percunt L)I loais)
-50 to -10 Lo -5 Lo 0 Lo UL 10 Lo 15 to 20 tc 30+ -10 - 5 C) 5- 1 15 20 30
Nominal
Repaid 55 77 70 51 35 17 51 58 62
hliincipal reduced 6 13 l1 7 9 9 12 8 6
IbLal improved 61 90 81 58 44 56 63 66 68
Ili icikil noL i-tducud 39 0 19 42 56 44 37 34 32
FRia 1
Repaid 55 77 70 51 35 47 51 58 62
Pri ncipal reduced 21 18 19 21 28 20 22 17 6 IYAdI improved 76 95 89 74 oi 67 73 75 68
Principal not reduced 24 5 11 16 T 33 27 25 32
- 31 -
Table 18
Nominal Recovery Ratio for Short Term Agricultural Loans and the Collateral Ratio
0-1
(ol 1ater-I Lit K
1-2 2-3 3-4 4-5 5-6 6-8 8-10 12 2 +
Repaid
Principal reduced
Total improved
Principal not reduced bull
40
11
51
49
36
8
44
56
35
10
45
55
43
9
52
48
16
10
56
44
46
12
58
42
57
7
64
36
63
5
68
32
46
0
46
54
31
8
39
61
1 Ratio of collateral to princilvd
5 4 Natural disasters and Lxi n rIc(( yf The branch data
from RBI3JS do H(t it )vidle any _iifo rilmiLion wiLh regard to
naturil disa r- i1i is liIt) I t)wve f Lhat natural
disasters are an im(F t L-ailt in tih management of
rural ci-li L in 1n [ 11 ii lC)51 of rice
acreage i gi l i i t il- iiti an occashyijt)L Iflhi
ssionl year greater thain 5 - nuh e Lect approxishy
mately 5A of the 1 i1w di sbn 1 a 4a r would on the
average b iiur|-rLt v jt i n L1ni-Il disasters
This is a suffi ci itl l-i iigtitlL tiLt lltlnce variashy
tions ldly lhave ai ]u is i ii I (-ii I I _ry Furthershy
more if these loans arer not pturq(d from the financial
systerm then the vali xmn blti 1 Iili) i ntou a considerable
amount as they are mliijliiwud (n Lhc books At present
no one has any relialie esLima te a1( ut the volume of
such loans in the short Lerm i i tI lios
5 5 Poverty and loan recovery The issue of poverty and
loan recovery is widely di scussed in Bangladesh This is
a particularly comp]2x problem as Lrut-h is very illusive rio repay any loan there must ho a surplus available for
sal [or the rural liousuhold tlhe usual argument is
to consider that there is a reasonably well defined
minimum level of consumpt ion Ill(e maximAm available
surplus is then production less this niiimum If the
extension of a loan resulLs -in iner--ased production but
the surplus availabl- tr t alt iiiiimui r(quirements
are met is not sufficient then thC ( ULnieII is thr
loan cannot be fully i Vid Ii i i available
then presunably mJiitilmt iictI li L L ( )(hLth W St
the availability of Lit 1oan1 WIII(i provide an increment
in producti on suI-i(ii I 1 [Fti- II 1l14 l) The household
with less the 1 Laij ti_I I in longthan I red 11li a
run decline in hea L and prod u L i wc cipac i L LThe evishy
dence on systemic de Lu i c)a Li oi I C i I ii Hiia ad eshi
health and nutritional sLaLus i (l ) ire not clear Cut
- 33 -
The one piece of evidun~ ziri si I iii l1 l i- that
small borrowers are not v I (i yAys t1101 ntLje borrshy
owes (all within the con xf of tlwu smalI short term
loans under discussioni) Table P) suLs out the repayment reccrd by loan size cot(gqory T mA 1 luns have a
better recovery rate l ini the 1 ij
The effect is not ]argc Lu iL is coinclusive that
smaller loan do not lu v a Jo( ru rrCOverY rite Most
of the loans are less ihuin 20011i i Ixiciji i of to a
common base year for the value i ci ani using tlhe real loan recovery ra[ti+ does no clha ge the conlusion
6 Conclusions
The preiminary nterpr(t it of the MiIl IS evidence on short term agricuLtural i i -covevy I uic+ls to the following
colic I uS i ou s
I) Some 70 of loans are riovered wi thiii three years of cofling duo- lIi s lt- l i- () +l Lohan
previousiy supposed
2) Recovery rates rose iiom 1981 t- 19HI ciiiJ then declined
In 1985 recoveiu-s wU 20 of Ow miount duu
3) The imporLanL I o th I inu probably
the reduction in sanctioning and thlu i icreas in real interest rate both fatois Iclj iij 1() borrowers buing
less likely to repay 11oviuvor thu decline ini disbursements
is probably most important
most iiiare
4) Branch banks and banks have very diferent recovery rates
large branches have poorer recovery rates than small branctes Greater efforts by banks and branches can improve
recovery rates
- 34 -
Table
Nominal Recovery Ratio for Short Perm Agriuultural Loins and Size f Principal
Value of Ratio
0 1
0- 4
4 8
8 -10
10 - 15
15 -20
20+
Repaid
Principal reduced
Total inproved
Principal not reduced
Nuiber of loans
J Repaid
0-1000
64
2
2
2
15
9
6
64
6
70
30
1879
NCmlina] ampin Size a
10r-2000 2000-3000 3000-4000 4000-6000 6000+
46 36 36 41 36
3 1 1 3 6
3 1 3 4 3
4 7 7 8 5
30 44 49 40 47
12 6 3 4 I
3 2 1 0 1
16 36 36 41 36
9 12 11 15 15
55 48 17 56 5]
45 52 53 44 41
2111 919 559 250 81
- 35 shy
5) Poverty and natural disnt-ers are significant factors
in rural Bangladesh It is not likely that either is responsible for the I)c)c-r loan rt r ery record
6) Although the social ad politicul ti vi ronment presently makes loan recovery rateo-s more di ti cult -here is no evidence that the loan raccovery t(s cire deteriorating
due to the politicilizLi i (f [ H ition The theme of
interf ronc by (AL IfI i i I I tI ()1 loction is nothing new in BanglacdL--ili
7) This paper has not addressed tLlit tiiestion of what to do
to improve loan recovery However some of the answers
follow directly from the analysis
a) The responsibility Cor recovery should rest squarely
with the banks It should itot be blamed on the
Government nature poverty etc
b) Collection of loans means greater resource inputs
Loth fiscal incentives anid manpower by the banks
More staff at the regional and branch level more
time in Lntact with the banks customers and a
greater commitment of bLaff to work in rural areas
Banks find all of these Lhings difficult Ivore
resources add to cocts but under present accounting
policy do not change revenues Programs requiring
g Late- resource Iup ts ret It i ri -wi l ok profits UltinmateJl -u u l o
requires a lot of by )raich f Athi ank sLa
present they sue lit tle reoao to make such effort
- 36 shy
c) Reduction of loan -vanctions as a stick to drive branch banks and hanks to ct_cover is self defeating Lower disbursement rates ](e I) more borrower resistance even i f branch sLafl would respond to
such a stick
d) Interest rates need to be miiiLtincid potsitive in real tu s for good economic management To improve recoshy
very rates from pruiunL level s reIuires either higher rates or lower rates The current meca real interest
rate is at the Iiinimum of tie relationship between
recovery and real rtLes ITn Wrest rate policy is
very complex and pLrhaps beyond prope- management
Interest rates ar- n L un pieW Uven for the same
nominal terms but arut very dependent upon the partishy
cular circumstances of the loan
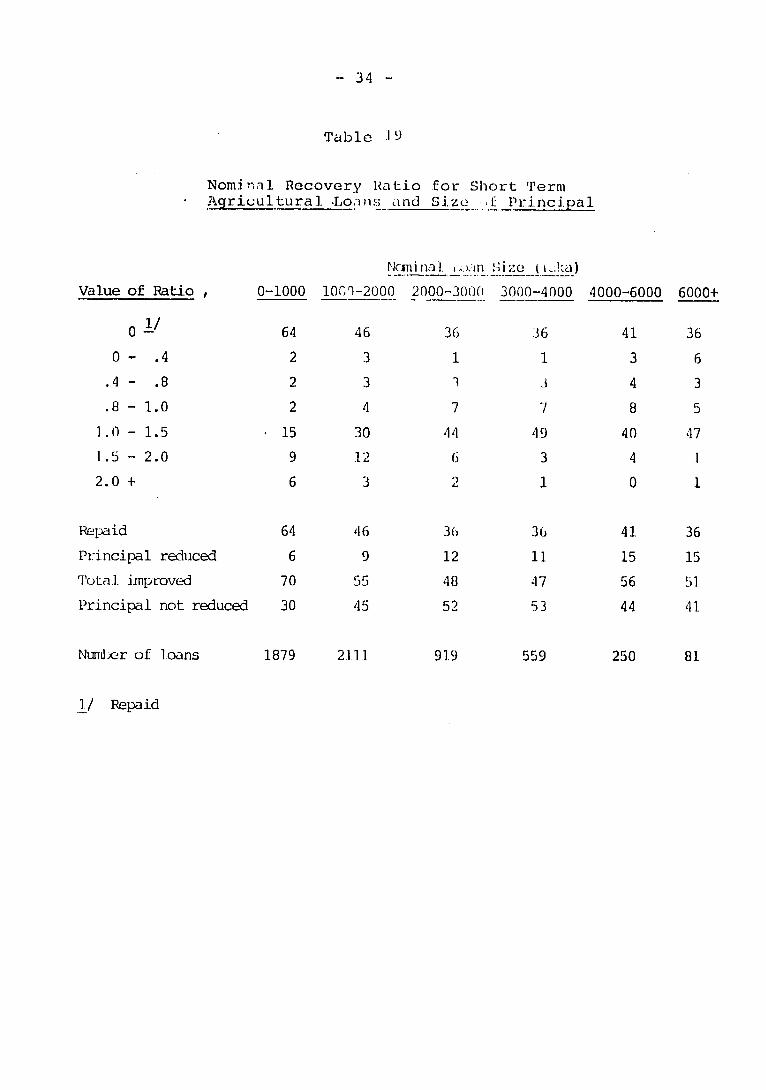