us lng: a benchmark for the future - platts these regasification terminals. all five lng export...
TRANSCRIPT

www.platts.com/natural-gas
Natural gas special report
May 2017Chris Pedersen, North American LNG Pricing Analyst
US LNG: a benchmark for the future

2© 2017 S&P Global Platts, a division of S&P Global Inc. All rights reserved.
Special report: Natural gas US LNG: a benchmark for the future
competitive with other LNG liquefaction projects that were being proposed around the world. Meanwhile, the Henry Hub-linked pricing associated with these new projects offered offtakers an opportunity to diversify their LNG price exposure. Asian utility buyers also saw this new model as a chance to reduce costs at a time when Asian LNG supplies were commanding a premium over international gas markets with oil prices over $100/b and corresponding oil-indexed LNG prices above $15/MMBtu.
Sabine Pass LNG terminalCheniere Energy’s Sabine Pass project, currently the US’ only operating export facility, has three of the project’s six trains commissioned and operating. Platts Analytics’ Eclipse Energy expects Train 4 to start commissioning at the end of September 2017. Feedgas flows to the plant
INTRODUCTION
We are currently witnessing a paradigm shift in the way LNG is priced and traded around the globe. From the first major shipment from Algeria to the UK in 1964, LNG has typically been sold under long-term contracts, usually between producers and utilities. These long-term contracts were almost always priced off of an oil-indexation linked to North Sea Brent crude or Japan Customs-cleared crude (JCC) because of the liquidity and transparency of these markets. While LNG supply growth increased significantly over the next four decades, the way LNG was traded and sold did not change much at all. By 2000, short-term LNG, defined as transactions under contracts of four years or fewer, only represented 2% of the market1. Since the new millennium, though, short-term LNG trading has increased to become nearly 30% of the market. Spot transactions, defined as trades whereby cargoes are delivered within 12 months of the transaction date, now account for half of these short-term transactions2. This momentum for shorter-term trading, supported by US LNG supplies and a growing number of LNG consumers and traders, is set to fundamentally alter the way LNG is priced and traded.
This paper will examine the US LNG market, the distinct characteristics of US LNG, and how the global LNG market is fundamentally changing the way LNG is traded and priced. Destination-flexible US LNG, along with structural changes in global LNG market fundamentals — notably the foreseeable oversupply in the market in the coming years, a corresponding oversupply in the LNG carrier market, the growing importance of traders, and the number of new buyers entering the market that are seeking shorter-term contracts — are some of the key factors that will fuel the transformation of global LNG trading and pricing.
FIG 1. FEEDGAS TO SABINE PASS
0.0
0.5
1.0
1.5
2.0
2.5
May-17Feb-17Nov-16Aug-16May-16Feb-16
(Bcf/d)
Source: Platts Analytics’ Eclipse Energy
T1 capacity
T3 capacityT2 capacity
LNG feedgas
US LNG overviewLess than a decade ago, discussion in the US regarding LNG was about imports, not exports. In April 2008, Cheniere Energy inaugurated its Sabine Pass LNG import regasification terminal in Louisiana. Sabine Pass wasn’t an outlier. The US went on to build 178.6 million mt/year (22.9 Bcf/d of gas) of regasification capacity, which is the second largest in the world, behind Japan with 204.2 million mt/year. Since 2008, though, the outlook for natural gas in the US completely changed, as the market went from predicting natural gas shortages to the US Energy Information Administration now stating that the US is well-supplied with domestic gas reserves for almost a century at today’s rate of consumption3. This 180-degree change in outlook was primarily the result of the combination of horizontal drilling and hydraulic fracturing drilling methods.
While the US’ regasification capacity has been extremely underutilized, there have been some advantages to building these regasification terminals. All five LNG export terminals that are currently under construction — including Sabine Pass, currently the only active exporting terminal in the US — are LNG regasification terminals that are being retrofitted to be bi-directional and add liquefaction capabilities. Put simply, these regasification terminals have made it so proposed LNG export terminals are considered brownfield projects instead of greenfield projects. From a permitting, time, infrastructure and economic perspective, these brownfield sites made US export projects much more
1 GIIGNL Annual Report, 20172 Pirrong, Craig, Liquefying a Market: The Transition of LNG to a Traded Commodity, Winter 20173 U.S. Energy Information Administration, Natural Gas Proved Reserves: December 14, 2016
3© 2017 S&P Global Platts, a division of S&P Global Inc. All rights reserved.
Special report: Natural gas US LNG: a benchmark for the future
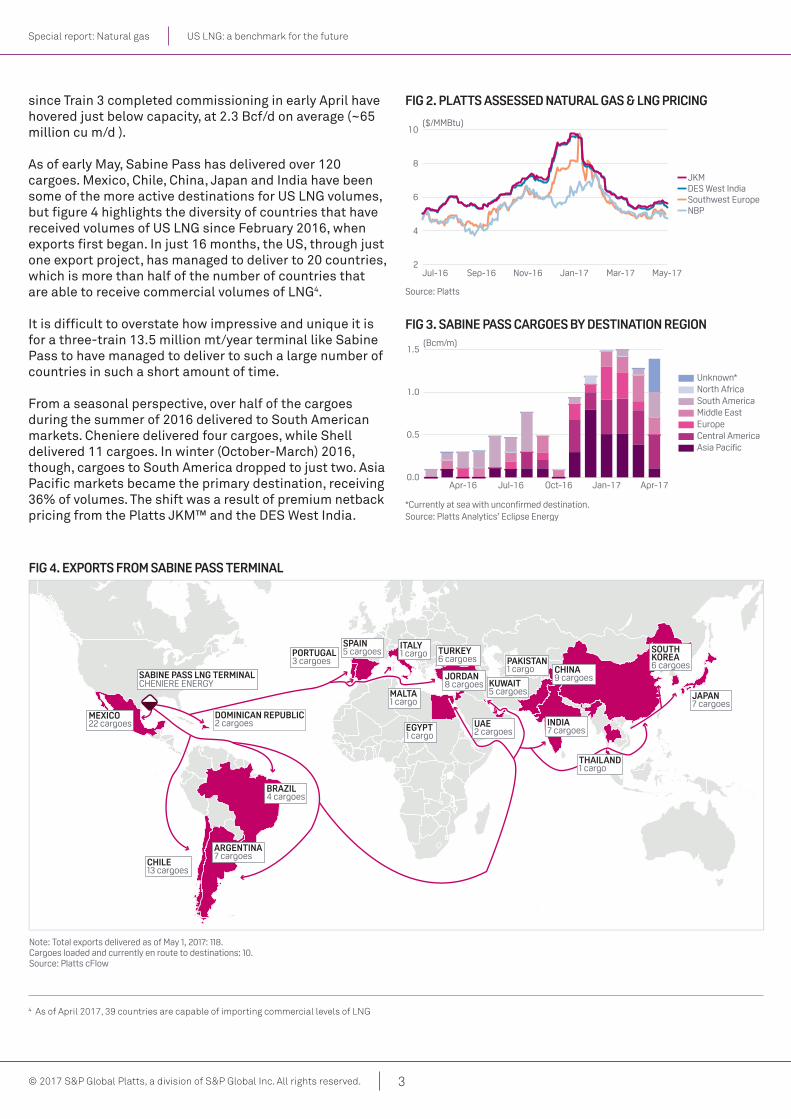
since Train 3 completed commissioning in early April have hovered just below capacity, at 2.3 Bcf/d on average (~65 million cu m/d ).
As of early May, Sabine Pass has delivered over 120 cargoes. Mexico, Chile, China, Japan and India have been some of the more active destinations for US LNG volumes, but figure 4 highlights the diversity of countries that have received volumes of US LNG since February 2016, when exports first began. In just 16 months, the US, through just one export project, has managed to deliver to 20 countries, which is more than half of the number of countries that are able to receive commercial volumes of LNG4.
It is difficult to overstate how impressive and unique it is for a three-train 13.5 million mt/year terminal like Sabine Pass to have managed to deliver to such a large number of countries in such a short amount of time.
From a seasonal perspective, over half of the cargoes during the summer of 2016 delivered to South American markets. Cheniere delivered four cargoes, while Shell delivered 11 cargoes. In winter (October-March) 2016, though, cargoes to South America dropped to just two. Asia Pacific markets became the primary destination, receiving 36% of volumes. The shift was a result of premium netback pricing from the Platts JKM™ and the DES West India.
Note: Total exports delivered as of May 1, 2017: 118.Cargoes loaded and currently en route to destinations: 10.Source: Platts cFlow
FIG 4. EXPORTS FROM SABINE PASS TERMINAL
MEXICO22 cargoes
SABINE PASS LNG TERMINALCHENIERE ENERGY
DOMINICAN REPUBLIC2 cargoes
ARGENTINA7 cargoes
CHILE13 cargoes
BRAZIL4 cargoes
SPAIN5 cargoesSPAIN5 cargoesPORTUGAL
3 cargoesTURKEY6 cargoes
JORDAN8 cargoesJORDAN8 cargoes
EGYPT1 cargoEGYPT1 cargo
ITALY1 cargoITALY1 cargo
MALTA1 cargoMALTA1 cargo
KUWAIT5 cargoes
PAKISTAN1 cargo
UAE2 cargoes
INDIA7 cargoes
THAILAND1 cargo
CHINA9 cargoes
JAPAN7 cargoes
SOUTHKOREA6 cargoes
FIG 2. PLATTS ASSESSED NATURAL GAS & LNG PRICING
($/MMBtu)
Source: Platts
2
4
6
8
10
May-17Mar-17Jan-17Nov-16Sep-16Jul-16
DES West IndiaSouthwest EuropeNBP
JKM
4 As of April 2017, 39 countries are capable of importing commercial levels of LNG
FIG 3. SABINE PASS CARGOES BY DESTINATION REGION(Bcm/m)
Source: Platts Analytics’ Eclipse Energy*Currently at sea with uncon�rmed destination.
0.0
0.5
1.0
1.5
Apr-17Jan-17Oct-16Jul-16Apr-16
Unknown*North AfricaSouth AmericaMiddle EastEuropeCentral AmericaAsia Paci�c

4© 2017 S&P Global Platts, a division of S&P Global Inc. All rights reserved.
Special report: Natural gas US LNG: a benchmark for the future
Also during this time, US cargoes delivered into Spain, Portugal and Turkey as netbacks to these destinations increased on winter fundamentals and supply interruptions from Algeria. While some US LNG exporters earlier predicted that up to half of US LNG could go to Europe, at the time of publication, just one cargo has delivered into Northwest Europe, (Belgium, France, Netherlands, UK, and Poland)5.
US LNG trendsThere are few observable trends when taking a closer look at exports out of Sabine Pass thus far. Shell Energy, an offtaker of 3.5 million mt/year from Train 1, has sent large volumes to Chile and Jordan, which both have supply contracts with Shell. The other clear trend is the strong demand from Mexico. These cargoes have been delivered by Cheniere, Shell, Gas Natural and other unknown parties. Some of these cargoes were delivered after Sabine Pass offtakers won tenders issued by CFE, the state-owned electric utility of Mexico.
Figure 6 details Sabine Pass exports by charterer to destination country.
Beyond these two trends, however, the diversity of charterers and export destinations is a reflection of the terminal’s destination flexibility, which was built into its supply structure and portfolio optimization behavior.
Cheniere’s latest investor presentation said that Sabine Pass will load more than 200 cargoes of LNG in 20176.
Cheniere
Gas Natural
Other
Shell
Argentina
Brazil
Chile
China
Dominican Republic
DubaiEgypt
India
Italy
Japan
Jordan
Kuwait
Mexico
Pakistan
Portugal
South Korea
Spain
Turkey
Source: Platts Analytics’ Eclipse Energy
FIG 6. SABINE PASS EXPORTS BY CHARTERER TO DESTINATION COUNTRY
FIG 5. RIOJA KNUTSEN VOYAGE TO MEXICO
Source: Platts cFlow
UNI TED S TATES
MEXI CO
5 Platts: Cheniere sees half of its US LNG exports headed for Europe: official6 Cheniere Energy Analyst Day 2017 Presentation

5© 2017 S&P Global Platts, a division of S&P Global Inc. All rights reserved.
Special report: Natural gas US LNG: a benchmark for the future
Key distinctions of US LNGDestination flexibility is the key differentiator when comparing US LNG contracts with other LNG contracts around the world. LNG contracts usually have destination clauses, specifying a location where the LNG is delivered, and that the buyer must take delivery at that location. As a result, the buyer cannot divert a cargo to a market that is paying a premium for LNG and resell it there7. A key feature of US LNG contracts is that none of them have destination clauses. This means that when LNG is loaded from US terminals, it can literally go anywhere in the world.
From the US already, we have seen some examples of US LNG offtakers utilizing this flexibility. Figure 5 shows the Gas Natural Fenosa-chartered Rioja Knutsen traveling past Florida and headed to Portugal, but then heading southwest and eventually delivering into Mexico.
Over the winter, in the Pacific Basin, the Shell-chartered Methane Lydon Volney looked to be delivering into China, but took a sharp right turn into Japan, figure 7 shows.
LNG and natural gas hubsToday, LNG is mainly priced off of four commodities: Henry Hub, National Balancing Point (NBP), the Platts Japan Korea Marker (JKM), and oil-indexation. While roughly 116 countries consume natural gas on a commercial level,
figure 8 highlights the limited options for pricing natural gas around the world.
Oil indexation has traditionally dominated contracting for LNG for reasons previously discussed, but the prevalence of oil indexation is now losing ground to gas and LNG indexation as market participants seek a more rational pricing mechanism that reflects the supply and demand of the commodity being traded.
In Europe, the NBP has provided a deep and liquid natural gas market for pricing LNG cargoes. In Asia, however, in the absence of a liquid and transparent natural gas market, participants have sought other pricing mechanisms to replace oil indexation.
Paci�cOcean
UNI TED S TATES
MEXI CO
JAPAN
FIG 7. METHANE LYDON VOLNEY VOYAGE TO JAPAN
Source: Platts cFlow
Developing
Mature/Transparent/Liquid market
Immature market/Limited liquidity
Source: Platts cFlow
FIG 8. EVOLUTION OF GLOBAL GAS PRICES: LIBERALIZATION
7 Pirrong, Craig, Liquefying a Market: The Transition of LNG to a Traded Commodity
6© 2017 S&P Global Platts, a division of S&P Global Inc. All rights reserved.
Special report: Natural gas US LNG: a benchmark for the future
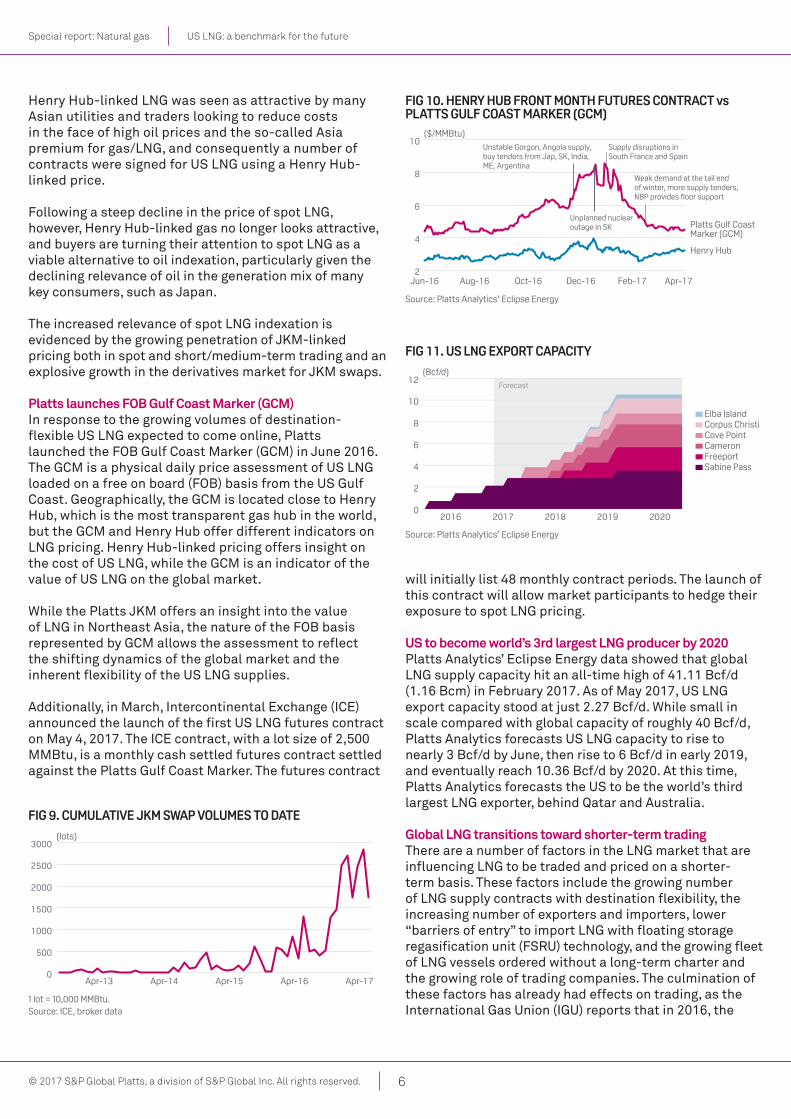
Henry Hub-linked LNG was seen as attractive by many Asian utilities and traders looking to reduce costs in the face of high oil prices and the so-called Asia premium for gas/LNG, and consequently a number of contracts were signed for US LNG using a Henry Hub-linked price.
Following a steep decline in the price of spot LNG, however, Henry Hub-linked gas no longer looks attractive, and buyers are turning their attention to spot LNG as a viable alternative to oil indexation, particularly given the declining relevance of oil in the generation mix of many key consumers, such as Japan.
The increased relevance of spot LNG indexation is evidenced by the growing penetration of JKM-linked pricing both in spot and short/medium-term trading and an explosive growth in the derivatives market for JKM swaps.
Platts launches FOB Gulf Coast Marker (GCM)In response to the growing volumes of destination-flexible US LNG expected to come online, Platts launched the FOB Gulf Coast Marker (GCM) in June 2016. The GCM is a physical daily price assessment of US LNG loaded on a free on board (FOB) basis from the US Gulf Coast. Geographically, the GCM is located close to Henry Hub, which is the most transparent gas hub in the world, but the GCM and Henry Hub offer different indicators on LNG pricing. Henry Hub-linked pricing offers insight on the cost of US LNG, while the GCM is an indicator of the value of US LNG on the global market.
While the Platts JKM offers an insight into the value of LNG in Northeast Asia, the nature of the FOB basis represented by GCM allows the assessment to reflect the shifting dynamics of the global market and the inherent flexibility of the US LNG supplies.
Additionally, in March, Intercontinental Exchange (ICE) announced the launch of the first US LNG futures contract on May 4, 2017. The ICE contract, with a lot size of 2,500 MMBtu, is a monthly cash settled futures contract settled against the Platts Gulf Coast Marker. The futures contract
will initially list 48 monthly contract periods. The launch of this contract will allow market participants to hedge their exposure to spot LNG pricing.
US to become world’s 3rd largest LNG producer by 2020Platts Analytics’ Eclipse Energy data showed that global LNG supply capacity hit an all-time high of 41.11 Bcf/d (1.16 Bcm) in February 2017. As of May 2017, US LNG export capacity stood at just 2.27 Bcf/d. While small in scale compared with global capacity of roughly 40 Bcf/d, Platts Analytics forecasts US LNG capacity to rise to nearly 3 Bcf/d by June, then rise to 6 Bcf/d in early 2019, and eventually reach 10.36 Bcf/d by 2020. At this time, Platts Analytics forecasts the US to be the world’s third largest LNG exporter, behind Qatar and Australia.
Global LNG transitions toward shorter-term tradingThere are a number of factors in the LNG market that are influencing LNG to be traded and priced on a shorter-term basis. These factors include the growing number of LNG supply contracts with destination flexibility, the increasing number of exporters and importers, lower “barriers of entry” to import LNG with floating storage regasification unit (FSRU) technology, and the growing fleet of LNG vessels ordered without a long-term charter and the growing role of trading companies. The culmination of these factors has already had effects on trading, as the International Gas Union (IGU) reports that in 2016, the
Forecast
FIG 11. US LNG EXPORT CAPACITY
0
2
4
6
8
10
12
20202019201820172016
(Bcf/d)
Source: Platts Analytics’ Eclipse Energy
Sabine Pass
CameronCove Point
Freeport
Corpus ChristiElba Island
FIG 10. HENRY HUB FRONT MONTH FUTURES CONTRACT vs PLATTS GULF COAST MARKER (GCM)
2
4
6
8
10
Apr-17Feb-17Dec-16Oct-16Aug-16Jun-16
($/MMBtu)
Unstable Gorgon, Angola supply, buy tenders from Jap, SK, India, ME, Argentina
Supply disruptions in South France and Spain
Weak demand at the tail end of winter, more supply tenders, NBP provides �oor support
Unplanned nuclear outage in SK
Henry Hub
Platts Gulf CoastMarker (GCM)
Source: Platts Analytics’ Eclipse Energy
FIG 9. CUMULATIVE JKM SWAP VOLUMES TO DATE
(lots)
1 lot = 10,000 MMBtu.Source: ICE, broker data
0
500
1000
1500
2000
2500
3000
Apr-17Apr-16Apr-15Apr-14Apr-13

7© 2017 S&P Global Platts, a division of S&P Global Inc. All rights reserved.
Special report: Natural gas US LNG: a benchmark for the future
volume of LNG traded without a long-term contract was more than double the amount traded a decade ago8.
US LNG trade to benefit from trend toward shorter-term tradingLooking ahead, destination-flexible US LNG set to come online in the coming years is well-positioned to thrive in a global LNG market that is transitioning toward shorter-term trading and pricing. A large portion of US LNG is contracted out to big portfolio players, such as Shell, Gas Natural, Total and EDF, which have positions on both the buy and sell side of the market. They also have their own shipping fleets. Because of these variables, a clear or consistent pricing incentive may not be required to see high levels of US LNG exports from these portfolio players9.
Beyond portfolio players, Asian utilities that have capacity offtake agreements for US LNG are beginning to trade volumes of LNG on a spot and short-term basis. In May, Japan’s JERA Co., the world’s largest LNG buyer, agreed to sell 1.5 million mt to EDF Trading at European LNG terminals over a period of roughly 2.5 years beginning in June 2018. Last September, JERA re-sold an LNG cargo to South Korea, marking the first actual delivery to a buyer outside of Japan. JERA has publicly said it plans to trade excess capacity within its portfolio.
With the goal of minimizing shipping costs, US LNG offtakers are also swapping cargoes. In November 2016, Tokyo Gas agreed to trade its US LNG to U.K.-based
Centrica for the same amount of LNG in Asia. Gail India Ltd. and Indonesian-based PT Pertamina are also looking to swap US LNG cargoes in exchange for LNG supply in the Pacific Basin.
US Gulf Coast to play growing role in global LNG pricingThe US Gulf Coast is already home to Henry Hub, probably the most recognized gas hub in the world. By 2020, though, Platts Analytics’ Eclipse Energy expects nearly 80 million mt/year of LNG liquefaction capacity (10 Bcf/d of gas) will also be located off the US Gulf Coast. This would make the US Gulf Coast the third largest LNG supplier in the world behind Australia and Qatar. Of the 10 Bcf/d of capacity, Platts Analytics also forecasts that the US will have the largest volume of destination-flexible LNG.
The combination of large volumes of flexible US LNG and a diverse range of US LNG offtakers and the flexibility associated with these contracts will have a profound impact on liquidity and transparency of the global market. The large number of countries that have already received US LNG speaks to the need for destination flexibility, and shows how important the US will be to balance the global supply/demand imbalance. These factors — combined with the desire for more rational pricing mechanisms for LNG and the current and forward price transparency the Platts Gulf Coast Marker and the ICE LNG futures contract will bring — mean that there is a real opportunity for US LNG to play a key role in global LNG pricing in the future.
8 IGU World LNG Report, 2017 Edition9 Wyeno, Ross, LNG Exports Part III: Global Gas Prices, November 2016

8© 2017 S&P Global Platts, a division of S&P Global Inc. All rights reserved.
Special report: Natural gas US LNG: a benchmark for the future
For more information, please visit us online or speak to one of our sales specialists:
NORTH AMERICA +1-800-PLATTS8 (toll-free) +1-212-904-3070 (direct)
EMEA +44-(0)20-7176-6111
LATIN AMERICA +55-11-3371-5755
ASIA-PACIFIC +65-6530-6430
RUSSIA +7-495-783-4141
© 2017 S&P Global Platts, a division of S&P Global Inc. All rights reserved.
The names “S&P Global Platts” and “Platts” and the S&P Global Platts logo are trademarks of S&P Global Inc. Permission for any commercial use of the S&P Global Platts logo must be granted in writing by S&P Global Inc.
You may view or otherwise use the information, prices, indices, assessments and other related information, graphs, tables and images (“Data”) in this publication only for your personal use or, if you or your company has a license for the Data from S&P Global Platts and you are an authorized user, for your company’s internal business use only. You may not publish, reproduce, extract, distribute, retransmit, resell, create any derivative work from and/or otherwise provide access to the Data or any portion thereof to any person (either within or outside your company, including as part of or via any internal electronic system or intranet), firm or entity, including any subsidiary, parent, or other entity that is affiliated with your company, without S&P Global Platts’ prior written consent or as otherwise authorized under license from S&P Global Platts. Any use or distribution of the Data beyond the express uses authorized in this paragraph above is subject to the payment of additional fees to S&P Global Platts.
S&P Global Platts, its affiliates and all of their third-party licensors disclaim any and all warranties, express or implied, including, but not
limited to, any warranties of merchantability or fitness for a particular purpose or use as to the Data, or the results obtained by its use or as to the performance thereof. Data in this publication includes independent and verifiable data collected from actual market participants. Any user of the Data should not rely on any information and/or assessment contained therein in making any investment, trading, risk management or other decision. S&P Global Platts, its affiliates and their third-party licensors do not guarantee the adequacy, accuracy, timeliness and/or completeness of the Data or any component thereof or any communications (whether written, oral, electronic or in other format), and shall not be subject to any damages or liability, including but not limited to any indirect, special, incidental, punitive or consequential damages (including but not limited to, loss of profits, trading losses and loss of goodwill).
Permission is granted for those registered with the Copyright Clearance Center (CCC) to copy material herein for internal reference or personal use only, provided that appropriate payment is made to the CCC, 222 Rosewood Drive, Danvers, MA 01923, phone +1-978-750-8400. Reproduction in any other form, or for any other purpose, is forbidden without the express prior permission of S&P Global Inc. For article reprints contact: The YGS Group, phone +1-717-505-9701 x105 (800-501-9571 from the U.S.).
For all other queries or requests pursuant to this notice, please contact S&P Global Inc. via email at [email protected].