trash reduction plantrash reduction plan reduction plantrash reduction plan . t. r. a. s. h. r. e....
TRANSCRIPT
Hawaii State Department of Transportation
Highways Division, Oahu District
Storm Water Management Program
NPDES Permit No. HI S000001
October 2016
Trash Reduction PlanTrash Reduction Plan

TTRRAASSHH RREEDDUUCCTTIIOONN PPLLAANN
STATE OF HAWAII DEPARTMENT OF TRANSPORTATION HIGHWAYS DIVISION, OAHU DISTRICT
October 2016 Version: Final
This page intentionally left blank.
State of Hawaii Department of Transportation, Highways Division, Oahu District Trash Reduction Plan, October 2016 i
TTAABBLLEE OOFF CCOONNTTEENNTTSS LIST OF FIGURES ..................................................................................................................... iv LIST OF TABLES ........................................................................................................................ v ACRONYMS AND ABBREVIATIONS .................................................................................... vi TERMINOLOGY .......................................................................................................................vii EXECUTIVE SUMMARY ......................................................................................................... xi 1. INTRODUCTION ...................................................................................................................1
1.1 DOT-HWYS NPDES Permit ........................................................................................1
1.2 Definitions, Sources, Pathways, and Drivers ................................................................2
1.3 Characteristics of DOT-HWYS Right-of-Way and MS4 Network ..............................2
1.4 Trash Reduction Plan Overview ...................................................................................4 2. DOT-HWYS TRASH BASELINE LOAD ............................................................................5
2.1 Trash Baseline Load Quantification Method ................................................................5
2.1.1 Land Use Types Definition ...............................................................................5
2.1.2 Quantification of Trash Loading Rates .............................................................9
2.1.2.1 Literature Review ..............................................................................9 2.1.2.2 Trash Characterization Study ..........................................................10
A Site Selection ...................................................................................10 B Data Collection ................................................................................12 C Trash Characterization .....................................................................14 D Calculation of Trash Loading Rates ................................................15
2.2 DOT-HWYS Trash Baseline Load .............................................................................16 3. EXISTING TRASH CONTROL MEASURES ..................................................................17
3.1 Institutional Control Measures ....................................................................................17
3.1.1 Legislative Actions .........................................................................................17
3.1.2 Public Education and Outreach Program ........................................................18
3.1.2.1 School and Youth Outreach ............................................................18 3.1.2.2 Community Outreach ......................................................................18 3.1.2.3 Advertising Campaigns ...................................................................18 3.1.2.4 Media Relations ...............................................................................19

State of Hawaii Department of Transportation, Highways Division, Oahu District Trash Reduction Plan, October 2016 ii
3.2 Land-Based Interception Control Measures ...............................................................19
3.2.1 Land-Based Trash Cleanup Programs ............................................................20
3.2.2 Street Sweeping Program ................................................................................21
3.3. MS4 Interception Control Measures ...........................................................................23
3.3.1 MS4 Inspection and Cleaning Program ..........................................................23
3.3.2 Permanent BMP Program ...............................................................................24
4. DOT-HWYS FIVE STEP METHOD TO TRACK FUTURE
TRASH REDUCTIONS .......................................................................................................27 4.1 DOT-HWYS Five Step Method ..................................................................................27
4.1.1 Overview .........................................................................................................27
4.1.2 Principles and Assumptions ............................................................................28
4.2 Step 1 – Institutional Control Measures ......................................................................29
4.2.1 Legislative Actions .........................................................................................30
4.2.1.1 Single-Use Carryout Plastic Bag Ordinances ..................................30 4.2.1.2 Polystyrene Foam Food Service Ware Ordinances .........................31 4.2.1.3 Uncovered Loads Enforcement .......................................................31 4.2.1.4 Anti-Littering and Illegal Dumping Enforcement ...........................32
4.2.2 Public Education and Outreach .......................................................................32
4.2.3 Summary of Trash Load Reduction Credits ....................................................33
4.3 Step 2 – Land-Based Interception Control Measures .................................................34
4.3.1 Land-Based Trash Cleanups ...........................................................................34
4.3.1.1 Land-Based Cleanups Trash Load Reduction Formula ..................34
4.3.2 Street Sweeping ..............................................................................................35
4.3.2.1 Street Sweeping Trash Load Reduction Formula ............................36
4.4 Step 3 – MS4 Interception Control Measures .............................................................36
4.4.1 MS4 Inspection and Cleaning .........................................................................37
4.4.1.1 MS4 Inspection and Cleaning Trash Load Reduction Formula ......37
4.4.2 Partial Trash Capture Devices ........................................................................37
4.4.2.1 Partial Trash Capture Devices Trash Load Reduction Formula .....38 4.4.2.2 Punahou Pump Station Trash Load Reduction Formula .................38
4.4.3 Full Trash Capture Devices ............................................................................39
4.4.3.1 Full Trash Capture Devices Trash Load Reduction Formula .........39

State of Hawaii Department of Transportation, Highways Division, Oahu District Trash Reduction Plan, October 2016 iii
4.5 Step 4 – Waterbody Interception Control Measures ...................................................40
4.5.1 Litter Booms and/or Curtains ..........................................................................40
4.5.1.1 Litter Booms and/or Curtains Trash Load Reduction Formula .......40
4.5.2 Stream and/or Beach Cleanups .......................................................................40
4.5.2.1 Stream and/or Beach Cleanups Trash Load Reduction Formula ....41
4.6 Step 5 – Calculate Trash Load Reduction ...................................................................41 5. GEOGRAPHICAL TARGETS ...........................................................................................43
5.1 Delineation and Prioritization of Trash Management Areas ......................................43
5.2 MS4 Trash Hotspots ...................................................................................................46
5.3 Findings .......................................................................................................................46 6. IMPLEMENTATION SCHEDULE ...................................................................................49
6.1 Considerations of Uncertainty ....................................................................................49
6.2 Trash Baseline Load ...................................................................................................49
6.3 Short-Term Plan Enhanced Control Measures ...........................................................49
6.3.1 Existing Enhanced Control Measures .............................................................49
6.3.2 Future Enhanced Control Measures ................................................................51
6.3.3 Short-Term Plan Summary .............................................................................53
6.4 Long-Term Plan Enhanced Control Measures .............................................................55
6.5 Implementation Schedule ............................................................................................55
6.5.1 Short-Term Plan (2013 – 2023) ......................................................................55
6.5.2 Long-Term Plan (2013 – 2036) ......................................................................56 7. TRASH LOAD REDUCTION MONITORING AND REPORTING .............................59
7.1 Trash Load Reduction Monitoring Plan .....................................................................59
7.1.1 Monitoring Institutional Control Measures ....................................................60
7.1.2 Monitoring Land-Based Interception Control Measures ................................60
7.1.3 Monitoring MS4 Interception Control Measures ............................................60
7.2 Visual Trash Rapid Assessment ..................................................................................60
7.3 Annual Reporting ........................................................................................................61 REFERENCES ............................................................................................................................63
State of Hawaii Department of Transportation, Highways Division, Oahu District Trash Reduction Plan, October 2016 iv
LLIISSTT OOFF FFIIGGUURREESS NUMBER TITLE PAGE Figure 1 DOT-HWYS ROW map and inset of the MS4 network .....................................3
Figure 2 HoLIS Zoning classes and reclassified key land use types within DOT-HWYS jurisdictional area .....................................................7
Figure 3 Trash Characterization Study sampling sites location ......................................11
Figure 4 Trash trap located at Site #3 ..............................................................................12
Figure 5 Volume of both organic debris and trash accumulated at each sample site .................................................................................................13
Figure 6 Trash volume and composition at each sample site ..........................................15
Figure 7 Total volume of trash removed by HWY-OM Litter Removal and Disposal Program on Oahu, 2013-2015 ......................................19
Figure 8 Total volume of trash removed by Adopt-A-Highway Program on Oahu, 2013-2015 ...........................................................................20
Figure 9 Adopt-A-Highway Program on Oahu in 2015 ..................................................20
Figure 10 Total volume of trash collected by Street Sweeping Program on Oahu, 2013-2015 ..........................................................................................21
Figure 11 Existing Street Sweeping Program schedule .....................................................22
Figure 12 Existing MS4 Inspection and Cleaning Program schedule ...............................23
Figure 13 Total volume of trash removed from inlets and manholes cleaning on Oahu, 2013-2015 ...........................................................................24
Figure 14 Location of existing Permanent BMPs ..............................................................25
Figure 15 DOT-HWYS Five Step Method (adapted from BASMAA 2011) ....................28
Figure 16 DOT-HWYS total trash generated by trash management area .........................45
Figure 17 MS4 trash hotspots ............................................................................................47
Figure 18 Sites of planned Permanent BMPs and their implementation phase .................50
Figure 19 Short-Term Plan anticipated trash load reductions ...........................................53
Figure 20 Proposed Implementation Schedule ..................................................................57
Figure 21 Trash rate categories and visual indicators ........................................................61

State of Hawaii Department of Transportation, Highways Division, Oahu District Trash Reduction Plan, October 2016 v
LLIISSTT OOFF TTAABBLLEESS TABLE TITLE PAGE Table 1 MS4 Permit requirements ....................................................................................1 Table 2 Total area and relative percent of land use types
within DOT-HWYS jurisdictional area ...............................................................6 Table 3 Trash loading rates per land use type derived from
the literature review .............................................................................................9 Table 4 Description of Trash Characterization Study sampling sites ............................11 Table 5 Trash composition in volume (x 10-3 cy/ha-yr) per sample site ........................14 Table 6 DOT-HWYS ROW land use types, areas, associated
trash loading rates, and trash baseline loads .....................................................16 Table 7 Summary of potential available Institutional Control
Measures and associated trash load reduction credits .......................................33 Table 8 Trash generated in terms of trash loads and trash intercepted
by trash management area .................................................................................45 Table 9 Anticipated annual trash reductions based on
existing enhanced control measures ..................................................................51 Table 10 Anticipated additional annual trash reductions based on
future enhanced control measures .....................................................................52 Table 11 Summary of anticipated annual trash reductions based on
existing and future enhanced control measures .................................................53 Table 12 Short-Term Plan anticipated trash reductions by
BMP Programs ..................................................................................................54

State of Hawaii Department of Transportation, Highways Division, Oahu District Trash Reduction Plan, October 2016 vi
AACCRROONNYYMMSS AANNDD AABBBBRREEVVIIAATTIIOONN ADT Average Daily Traffic
BMP Best Management Practice
CCH City and County of Honolulu
CWA Clean Water Act
cy Cubic Yard
DOH State of Hawaii Department of Health
DOT-HWYS State of Hawaii Department of Transportation, Highways Division, Oahu District
EDOP Effective Date of the MS4 Permit
GIS Geographic Information System
ha Hectare
HoLIS Honolulu Land Information System
HRS Hawaii Revised Statute
HWY-OM State of Hawaii Department of Transportation, Highways Division, Oahu District, Maintenance Section
MS4 Municipal Separate Storm Sewer System
NPDES National Pollutant Discharge Elimination System
PBMP Permanent BMP
PSA Public Service Announcements
RF Reduction Formula
RC Reduction Credit
ROW Right-of-Way
ROH Revised Ordinances of Honolulu
SWMP Storm Water Management Program
SWMPP Storm Water Management Program Plan
TMDL Total Maximum Daily Load
TRP Trash Reduction Plan
WLA Waste Load Allocation
yr Year
State of Hawaii Department of Transportation, Highways Division, Oahu District Trash Reduction Plan, October 2016 vii
TTEERRMMIINNOOLLOOGGYY Area‐specific (with regard to control measures or reductions): Control measures which are implemented within defined areas of the DOT-HWYS jurisdictional area (e.g., full capture treatment devices or street sweeping). Area‐wide (with regard to control measures or reductions): Control measures which are implemented throughout DOT-HWYS jurisdictional area (e.g., region‐wide public education). Baseline Implementation: The level of implementation for a specific trash control measure that forms the starting point for tracking progress towards trash load reduction. Baseline Load: Sum of trash volume from DOT-HWYS jurisdictional areas and adjusted for baseline implementation of existing control measure. Best Management Practices or Control Measures: Best Management Practices include any schedules of activity, prohibitions of practices, maintenance procedures [40 CFR § 122.2], as well as any technology, process, operational method or measure, or engineered system, which when implemented prevents, controls, removes, or reduces pollution/trash from entering waters of the United States. Clean Water Act 303(d) List: Under Section 303(d) of the Clean Water Act, the States are required to compile a list of impaired waters that fail to meet any of their applicable water quality standards or cannot support their designated or existing uses. This “303(d) list” is submitted to Congress every two years, and States are required to develop a total maximum daily load (TMDL) for each pollutant causing impairment for waterbodies on the list. Drainage Area: An area of land where all surface water from rain converges to a single point at a lower elevation. Enhanced (with regard to control measures): New or expanded control measures which have been implemented after the effective date of the MS4 Permit (October 28, 2013) baseline year. Effectiveness (with regard to control measure): A measure of how well a control measure reduces trash from entering the MS4. Existing (with regard to control measures): Existing control measures which have been implemented prior to the effective date of the MS4 Permit (October 28, 2013) baseline year. Full Trash Capture Devices: Full trash capture devices have removal efficiencies of 100% up to their intended design flow.

State of Hawaii Department of Transportation, Highways Division, Oahu District Trash Reduction Plan, October 2016 viii
Geographical Targets: Trash management areas where the pollutant of concern is observed in high and very high quantities, and should be prioritized with future control measures. Institutional Control Measures: Control measures that alter people’s behavior, either through corrective actions, such as the implementation of new laws or better enforcement of existing ones; or preventive actions, such as Public Education and Outreach. Interception (with regard to control measures): The process of removing trash with an area‐specific or area‐wide control measure. Land-Based Interception Control Measures: Control measures that intercept trash on the streets and roadsides, such as land-based trash cleanups and enhanced street sweeping. Litter: As defined in the Revised Ordinances of Honolulu Section 29-4.1, “litter” means rubbish, waste material, garbage, or trash; and includes improperly discarded paper, metal, plastic, glass or solid waste thrown or deposited on the land and water. Litter does not include non-manmade materials (such as branches, leaves, and other vegetation) naturally deposited in the waterbodies. Moku: Land division that sections the island into districts. Municipal Separate Storm Sewer System (MS4) Network: A conveyance including roads with drainage systems, catch basins, curbs, gutters, ditches, manmade channels, or storm drains that is designed or used for collecting or conveying storm water, that is not a combined sewer, and that is not part of a publicly owned treatment work [40 CFR 122.26(b)(8)]. MS4 Load: Volume of trash estimated to enter the MS4 through storm drain inlets. Volume of trash estimated to enter the MS4 after the implementation of Institutional Control Measures and Land-Based Interception Control Measures, and available for interception via MS4 Interception Control Measures. MS4 Interception Control Measures: Control measures that intercept trash in the MS4, such as full and partial capture devices, or enhanced MS4 structure inlet cleaning. Outfall: The discharge point of an MS4 to a receiving State waterbody; and does not include open conveyances connecting two MS4s, pipes, tunnels, or other conveyances which connect segments of the same stream or State waterbodies and are used to convey State waterbodies [40 CFR 122.26(b)(9)]. Partial Trash Capture Devices: Partial trash capture devices may be similar to full trash capture devices, but due to engineering challenges do not meet the full capture definition; or they may be completely different types of devices (e.g., trash booms or retractable curb inlet screens).
State of Hawaii Department of Transportation, Highways Division, Oahu District Trash Reduction Plan, October 2016 ix
Reduction Credit: Institutional control measures, such as public education, can result in trash reductions but remain challenging to quantify. Therefore, trash load reduction credits were adopted for institutional control measures to reflect their trash reductions. The recommended theoretical percent reductions from the trash baseline load were derived from discussions amongst members of the Bay Area Stormwater Management Agencies Associations Trash Committee in California (BASMAA 2011). Reduction Formula: Trash load reduction formulas are applied to land-based, MS4, and waterbody interception control measures, such as street sweeping and MS4 cleaning (BASMAA 2011). The application of the trash load reduction formulas relies on readily available information. In cases where information is very limited, assumptions are made and may be tested and revised accordingly as methods evolve. State waterbodies: Natural waterbodies, such as streams, bays, and estuaries, which receive discharges from municipal storm water drainage systems. Storm water: Runoff generated during rainfall events from roads and surfaces into the MS4. Storm Drain Inlets: Part of the storm water drainage system where surface runoff enters the MS4. Street Load: Volume of trash estimated to enter the environment after the implementation of Institutional Control Measures, and available for interception via Land-Based Interception Control Measures. Trash: Manmade litter that cannot pass through a 5 mm mesh screen; excluding sediment, sand, vegetation, oil and grease, and exotic species (refer to Litter definition). Trash Baseline Load: Total amount of trash that originates from DOT HWYS jurisdictional area and enters a waterbody during a given time (e.g., cubic yards of trash per year), prior to the implementation of enhanced or new control measures to target trash removal. Trash Generation: Volume of trash that accumulates in a specific geographical area. Trash generated is the sum of trash loads and trash intercepted by control measures. Trash Interception: Volume of trash intercepted through implementation of control measures (e.g., street sweeping). Trash Impaired Watersheds: Waterbodies listed as impaired for trash on the State’s Clean Water Act Section 303(d) list.
State of Hawaii Department of Transportation, Highways Division, Oahu District Trash Reduction Plan, October 2016 x
Trash Load: Total amount of trash discharged from the MS4 and entering a waterbody during a given time (e.g., cubic yards of trash per year). Trash Load Reduction: The amount by which the trash load is reduced by implementing enhanced control measures. Trash Loading Rates: The rate in cubic yards per hectare per year for a specific land use type at which trash is available to enter an MS4 outfall or waterbody. Trash Management Areas: Delineation of DOT-HWYS ROW into six smaller management units to track trash control measure implementation, and assess progress towards trash reduction targets. Trash Removal Efficiency (with regard to BMPs): A measurement that indicates how well a BMP system removes trash from a designated treated area. Waterbody Load: Volume of trash discharge to a receiving State waterbodies from the MS4. Water-Based Interception Control Measures: Control measures that intercept trash in streams or coastal waters, such as Water-Based Trash Cleanups or Partial Capture Devices.
EXECUTIVE SUMMARY
State of Hawaii Department of Transportation, Highways Division, Oahu District Trash Reduction Plan, October 2016 xi
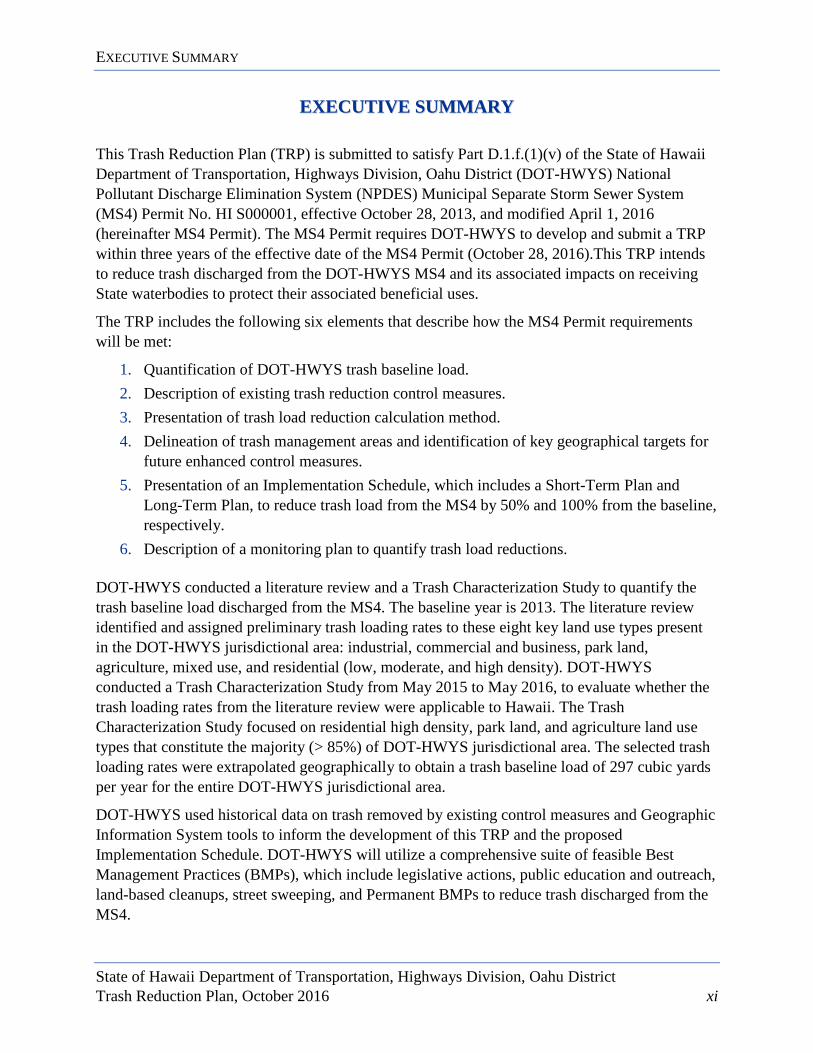
EEXXEECCUUTTIIVVEE SSUUMMMMAARRYY This Trash Reduction Plan (TRP) is submitted to satisfy Part D.1.f.(1)(v) of the State of Hawaii Department of Transportation, Highways Division, Oahu District (DOT-HWYS) National Pollutant Discharge Elimination System (NPDES) Municipal Separate Storm Sewer System (MS4) Permit No. HI S000001, effective October 28, 2013, and modified April 1, 2016 (hereinafter MS4 Permit). The MS4 Permit requires DOT-HWYS to develop and submit a TRP within three years of the effective date of the MS4 Permit (October 28, 2016).This TRP intends to reduce trash discharged from the DOT-HWYS MS4 and its associated impacts on receiving State waterbodies to protect their associated beneficial uses.
The TRP includes the following six elements that describe how the MS4 Permit requirements will be met:
1. Quantification of DOT-HWYS trash baseline load. 2. Description of existing trash reduction control measures. 3. Presentation of trash load reduction calculation method. 4. Delineation of trash management areas and identification of key geographical targets for
future enhanced control measures. 5. Presentation of an Implementation Schedule, which includes a Short-Term Plan and
Long-Term Plan, to reduce trash load from the MS4 by 50% and 100% from the baseline, respectively.
6. Description of a monitoring plan to quantify trash load reductions. DOT-HWYS conducted a literature review and a Trash Characterization Study to quantify the trash baseline load discharged from the MS4. The baseline year is 2013. The literature review identified and assigned preliminary trash loading rates to these eight key land use types present in the DOT-HWYS jurisdictional area: industrial, commercial and business, park land, agriculture, mixed use, and residential (low, moderate, and high density). DOT-HWYS conducted a Trash Characterization Study from May 2015 to May 2016, to evaluate whether the trash loading rates from the literature review were applicable to Hawaii. The Trash Characterization Study focused on residential high density, park land, and agriculture land use types that constitute the majority (> 85%) of DOT-HWYS jurisdictional area. The selected trash loading rates were extrapolated geographically to obtain a trash baseline load of 297 cubic yards per year for the entire DOT-HWYS jurisdictional area.
DOT-HWYS used historical data on trash removed by existing control measures and Geographic Information System tools to inform the development of this TRP and the proposed Implementation Schedule. DOT-HWYS will utilize a comprehensive suite of feasible Best Management Practices (BMPs), which include legislative actions, public education and outreach, land-based cleanups, street sweeping, and Permanent BMPs to reduce trash discharged from the MS4.
EXECUTIVE SUMMARY
State of Hawaii Department of Transportation, Highways Division, Oahu District Trash Reduction Plan, October 2016 xii
DOT-HWYS adapted a quantitative tracking method to document compliance with the required trash load reductions and avoid double counting. The DOT-HWYS Five Step Method applies a combination of two trash load reduction methods to the trash baseline load, and demonstrates trash load reductions attributable to specific control measures: 1) trash load reduction credits; and 2) trash load reduction formulas. Due to natural variability, DOT-HWYS will report compliance with required trash reduction goals using a three-year running average.
Given the geographical extent of DOT-HWYS ROW and the complexity of the MS4 network, DOT-HWYS conducted a Geographical Targets Analysis to define trash management areas and key geographical targets for future enhanced control measures, and attain the trash reduction targets in the shortest practicable timeframe.
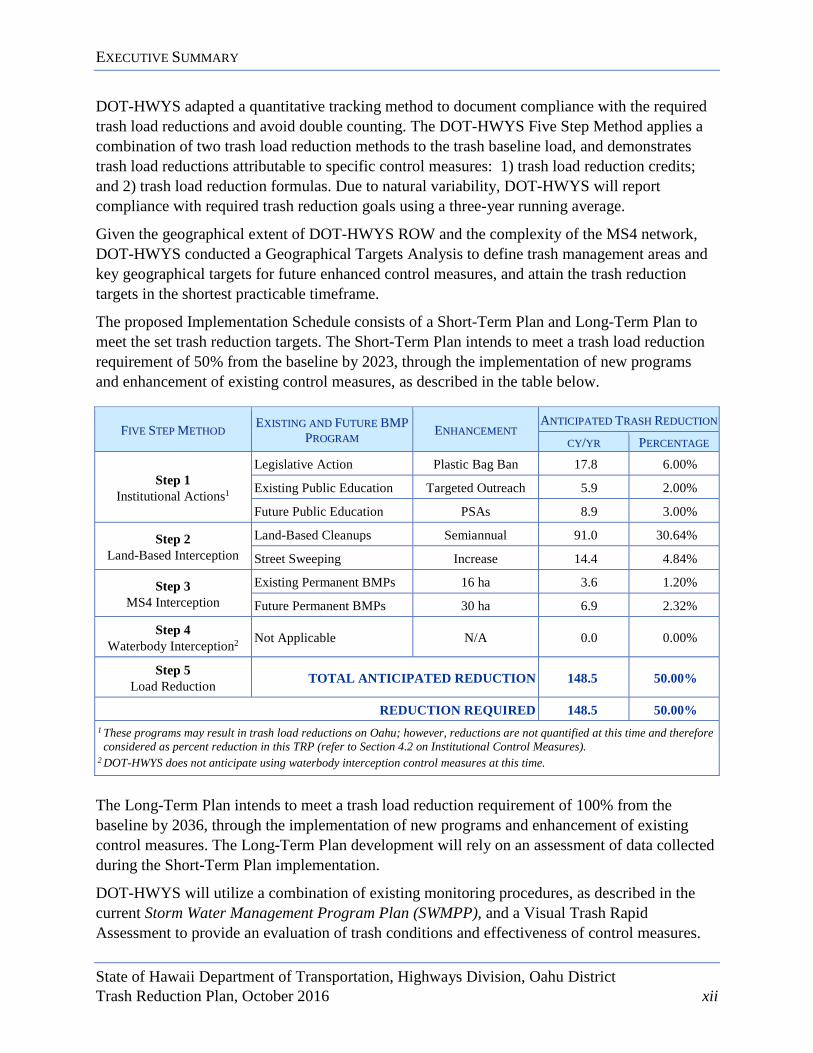
The proposed Implementation Schedule consists of a Short-Term Plan and Long-Term Plan to meet the set trash reduction targets. The Short-Term Plan intends to meet a trash load reduction requirement of 50% from the baseline by 2023, through the implementation of new programs and enhancement of existing control measures, as described in the table below.
FFIIVVEE SSTTEEPP MMEETTHHOODD EEXXIISSTTIINNGG AANNDD FFUUTTUURREE BBMMPP PPRROOGGRRAAMM EENNHHAANNCCEEMMEENNTT
AANNTTIICCIIPPAATTEEDD TTRRAASSHH RREEDDUUCCTTIIOONN
CCYY//YYRR PPEERRCCEENNTTAAGGEE
Step 1 Institutional Actions1
Legislative Action Plastic Bag Ban 17.8 6.00%
Existing Public Education Targeted Outreach 5.9 2.00%
Future Public Education PSAs 8.9 3.00%
Step 2 Land-Based Interception
Land-Based Cleanups Semiannual 91.0 30.64%
Street Sweeping Increase 14.4 4.84%
Step 3 MS4 Interception
Existing Permanent BMPs 16 ha 3.6 1.20%
Future Permanent BMPs 30 ha 6.9 2.32%
Step 4 Waterbody Interception2 Not Applicable N/A 0.0 0.00%
Step 5 Load Reduction TOTAL ANTICIPATED REDUCTION 148.5 50.00%
REDUCTION REQUIRED 148.5 50.00% 1 These programs may result in trash load reductions on Oahu; however, reductions are not quantified at this time and therefore considered as percent reduction in this TRP (refer to Section 4.2 on Institutional Control Measures).
2 DOT-HWYS does not anticipate using waterbody interception control measures at this time.
The Long-Term Plan intends to meet a trash load reduction requirement of 100% from the baseline by 2036, through the implementation of new programs and enhancement of existing control measures. The Long-Term Plan development will rely on an assessment of data collected during the Short-Term Plan implementation.
DOT-HWYS will utilize a combination of existing monitoring procedures, as described in the current Storm Water Management Program Plan (SWMPP), and a Visual Trash Rapid Assessment to provide an evaluation of trash conditions and effectiveness of control measures.
1. INTRODUCTION
State of Hawaii Department of Transportation, Highways Division, Oahu District Trash Reduction Plan, October 2016 1
11.. IINNTTRROODDUUCCTTIIOONN 1.1 DOT-HWYS NPDES Permit This Trash Reduction Plan (TRP) is submitted to satisfy Part D.1.f.(1)(v) of the State of Hawaii Department of Transportation, Highways Division, Oahu District (DOT-HWYS) National Pollutant Discharge Elimination System (NPDES) Municipal Separate Storm Sewer System (MS4) Permit No. HI S000001, effective October 28, 2013, and modified April 1, 2016 (hereinafter MS4 Permit). The MS4 Permit requires DOT-HWYS to develop and submit a TRP within three years of the effective date of the MS4 Permit (October 28, 2016).
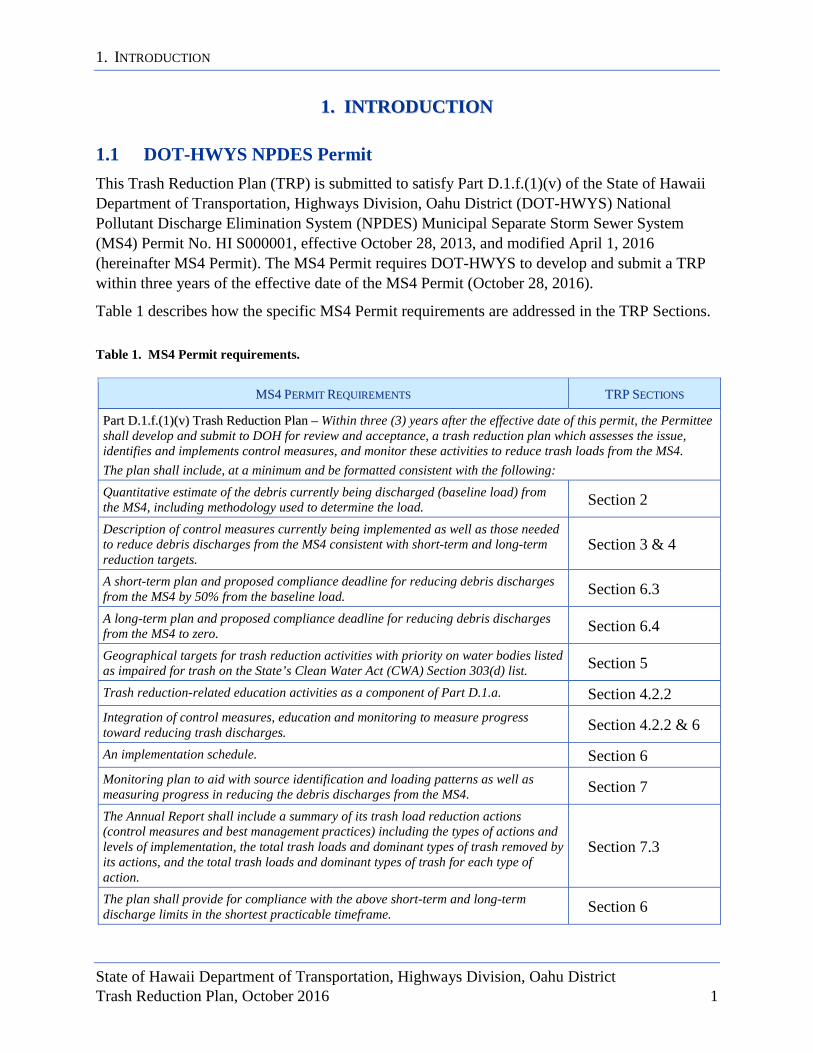
Table 1 describes how the specific MS4 Permit requirements are addressed in the TRP Sections. Table 1. MS4 Permit requirements.
MMSS44 PPEERRMMIITT RREEQQUUIIRREEMMEENNTTSS TTRRPP SSEECCTTIIOONNSS
PPaarrtt DD..11..ff..((11))((vv)) TTrraasshh RReedduuccttiioonn PPllaann –– Within three (3) years after the effective date of this permit, the Permittee shall develop and submit to DOH for review and acceptance, a trash reduction plan which assesses the issue, identifies and implements control measures, and monitor these activities to reduce trash loads from the MS4. The plan shall include, at a minimum and be formatted consistent with the following: Quantitative estimate of the debris currently being discharged (baseline load) from the MS4, including methodology used to determine the load. Section 2
Description of control measures currently being implemented as well as those needed to reduce debris discharges from the MS4 consistent with short-term and long-term reduction targets.
Section 3 & 4
A short-term plan and proposed compliance deadline for reducing debris discharges from the MS4 by 50% from the baseline load. Section 6.3
A long-term plan and proposed compliance deadline for reducing debris discharges from the MS4 to zero. Section 6.4
Geographical targets for trash reduction activities with priority on water bodies listed as impaired for trash on the State’s Clean Water Act (CWA) Section 303(d) list. Section 5
Trash reduction-related education activities as a component of Part D.1.a. Section 4.2.2 Integration of control measures, education and monitoring to measure progress toward reducing trash discharges. Section 4.2.2 & 6
An implementation schedule. Section 6 Monitoring plan to aid with source identification and loading patterns as well as measuring progress in reducing the debris discharges from the MS4. Section 7
The Annual Report shall include a summary of its trash load reduction actions (control measures and best management practices) including the types of actions and levels of implementation, the total trash loads and dominant types of trash removed by its actions, and the total trash loads and dominant types of trash for each type of action.
Section 7.3
The plan shall provide for compliance with the above short-term and long-term discharge limits in the shortest practicable timeframe. Section 6

1. INTRODUCTION
State of Hawaii Department of Transportation, Highways Division, Oahu District Trash Reduction Plan, October 2016 2
1.2 Definitions, Sources, Pathways, and Drivers For the purpose of this TRP, “debris” is considered analogous to litter and trash (> 4.75 millimeter) as defined in the Revised Ordinances of Honolulu (ROH), but excluding sediment, sand, vegetation, oil and grease, and exotic species. The ROH Section 29-4.1 defines “litter” as rubbish, waste material, garbage, or trash; and includes improperly discarded paper, metal, plastic, glass or solid waste. Litter also includes “refuse”, as defined in the ROH Section 29-1.1, as all solid wastes, such as animal feces, garbage, rubbish, ashes, street cleanings, dead animals, abandoned automobiles, and solid market and industrial wastes capable (or not) of decaying.
Previous studies concluded that trash composition, deposition in the environment and transportation to waterbodies are highly variable, and likely depend on both anthropogenic and natural factors (Armitage and Rooseboom 1999, County of Los Angeles 2004). Trash originates from automobiles and uncovered loads; inadequate waste management, such as overflowing containers; and dispersion of household and business-related trash, before, during, and after trash collection. Once trash enters the environment, it can deposit on roadways and street surfaces, and be transported by the wind or through the MS4 to receiving State waterbodies. The volume of trash discharged from MS4s is influenced by land use type, population density, existing control measures, and climatic conditions (Marais et al. 2004, BASMAA 2012).
1.3 Characteristics DOT-HWYS Right-of-Way and MS4 Network DOT-HWYS owns and operates approximately 250 miles of highways covering 2,031 hectares on Oahu in terms of Right-of-Way (ROW). The DOT-HWYS MS4 network is complex and consists of the following key structures to drain storm water from highway surfaces:
• 8,133 Inlets • 1,588 Manholes • 1,387 Outfalls • 872 Culverts Entrances • 868 Culverts • 629 or 33 miles of Open Channels • 7,421 or 150 miles of Pipes
Figure 1 shows the DOT-HWYS ROW map on Oahu with an inset of the MS4 network.

1. INTRODUCTION
State of Hawaii Department of Transportation, Highways Division, Oahu District Trash Reduction Plan, October 2016 3
Figure 1. DOT-HWYS ROW map and inset of the MS4 network.

1. INTRODUCTION
State of Hawaii Department of Transportation, Highways Division, Oahu District Trash Reduction Plan, October 2016 4
1.4 Trash Reduction Plan Overview The TRP includes the following six elements that describe how the MS4 Permit requirements will be met:
1. Quantification of DOT-HWYS trash baseline load.
2. Description of existing trash reduction control measures.
3. Presentation of the trash load reduction calculation method.
4. Delineation of trash management areas and identification of key geographical targets for future enhanced control measures.
5. Presentation of an Implementation Schedule, which includes a Short-Term Plan and Long-Term Plan, to reduce trash load from the MS4 by 50% and 100% from the baseline, respectively.
6. Description of a monitoring program to quantify and track trash load reductions. This TRP focuses on reducing trash discharged from the DOT-HWYS MS4 and its associated impacts on receiving State waterbodies to protect their associated beneficial uses.
2. DOT-HWYS TRASH BASELINE LOAD
State of Hawaii Department of Transportation, Highways Division, Oahu District Trash Reduction Plan, October 2016 5
22.. DDOOTT--HHWWYYSS TTRRAASSHH BBAASSEELLIINNEE LLOOAADD DOT-HWYS conducted a literature review and a Trash Characterization Study to quantify the trash baseline load. The literature review identified and assigned preliminary trash loading rates to the eight key land use types present in the DOT-HWYS jurisdictional area: industrial, commercial, park land, agriculture, mixed use, and residential (low, moderate, and high density). DOT-HWYS conducted a yearlong Trash Characterization Study from May 2015 to May 2016 to evaluate whether the trash loading rates from the literature review were applicable to Hawaii. The Trash Characterization Study focused on the three land use types (residential high density, park land, and agriculture), which constitute the majority (> 85%) of DOT-HWYS jurisdictional area. Data from the literature review and the Trash Characterization Study were then extrapolated geographically to derive the trash baseline load for the entire DOT-HWYS ROW.
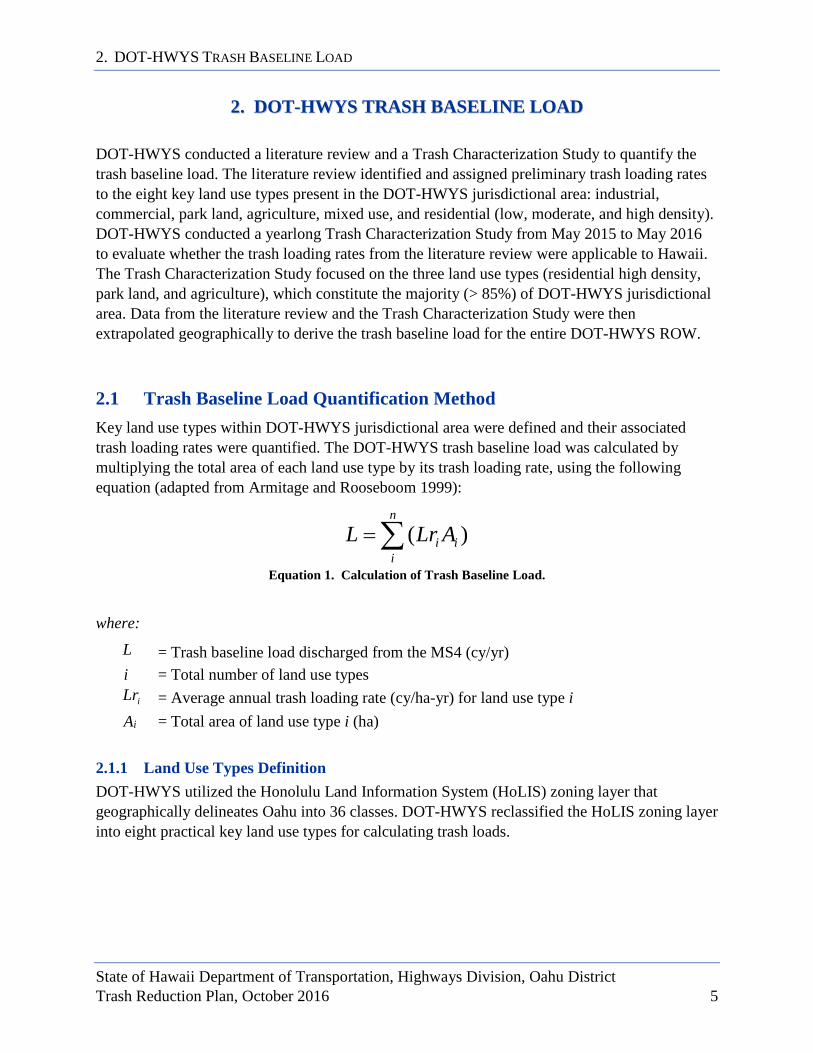
2.1 Trash Baseline Load Quantification Method Key land use types within DOT-HWYS jurisdictional area were defined and their associated trash loading rates were quantified. The DOT-HWYS trash baseline load was calculated by multiplying the total area of each land use type by its trash loading rate, using the following equation (adapted from Armitage and Rooseboom 1999):
∑=n
iii ALrL )(
Equation 1. Calculation of Trash Baseline Load.
where:
L = Trash baseline load discharged from the MS4 (cy/yr) i = Total number of land use types
iLr = Average annual trash loading rate (cy/ha-yr) for land use type i Ai = Total area of land use type i (ha)
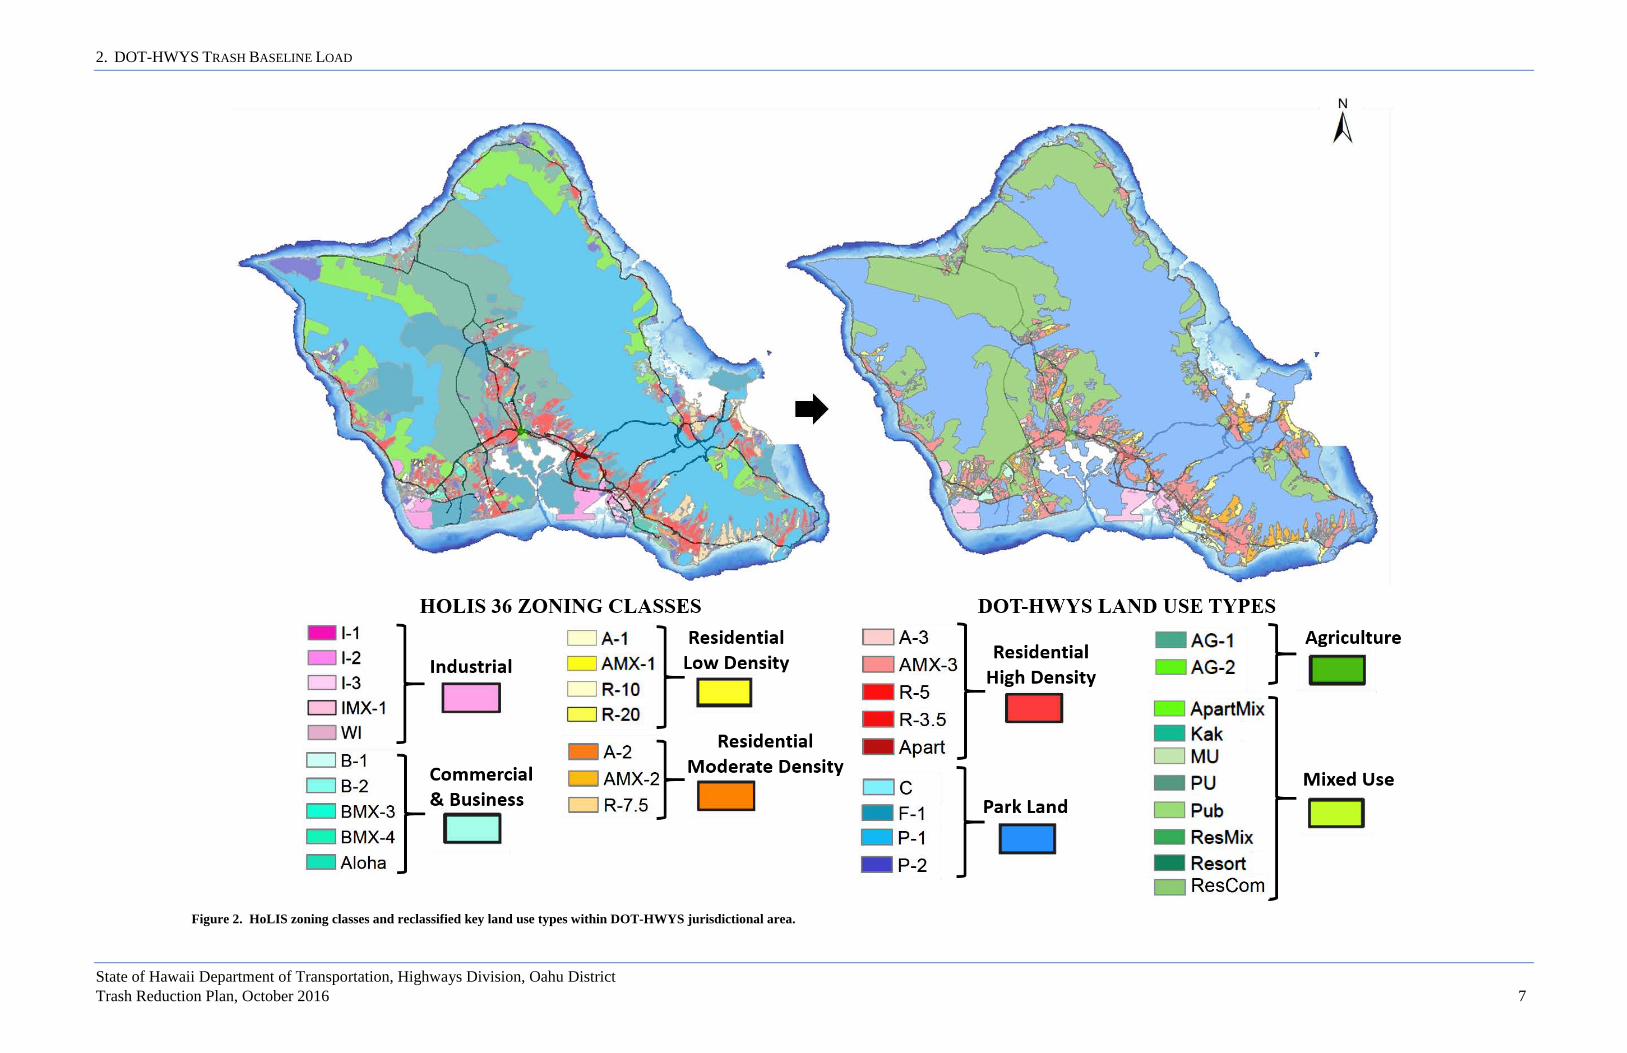
2.1.1 Land Use Types Definition DOT-HWYS utilized the Honolulu Land Information System (HoLIS) zoning layer that geographically delineates Oahu into 36 classes. DOT-HWYS reclassified the HoLIS zoning layer into eight practical key land use types for calculating trash loads.

2. DOT-HWYS TRASH BASELINE LOAD
State of Hawaii Department of Transportation, Highways Division, Oahu District Trash Reduction Plan, October 2016 6
Table 2 describes these eight land use types and the corresponding HoLIS zoning classes in terms of total area and relative percent within DOT-HWYS jurisdictional area.
Table 2. Total area and relative percent of land use types within DOT-HWYS jurisdictional area.
LLAANNDD UUSSEE TTYYPPEE HHOOLLIISS ZZOONNIINNGG CCLLAASSSSEESS AARREEAA ((HHAA)) %% AARREEAA
Industrial I-1, I-2, I-3, IMX-1, Waterfront Industrial Precinct 46.93 2.31%
Commercial and Business
B-1, B-2, BMX-3, BMX-4, Aloha Towers Project 56.18 2.77%
Residential Low Density A-1, AMX-1, R-10, R-20 81.43 4.01%
Residential Moderate Density A-2, AMX-2, R-7.5 64.04 3.15%
Residential High Density A-3, AMX-3, R-5, R-3.5, Apartment Precinct 602.60 29.66%
Park Land C, F-1, P-1, P-2 552.40 27.19%
Agriculture AG-1, AG-2 617.00 30.37%
Mixed Use*
Apartment Mixed Use Sub-precinct, Kakaako Community Development District, Mixed Use Precinct, Public Use Precinct, Public Precinct, Resort Mixed Use Precinct, Resort, Resort Commercial Precinct
10.89 0.54%
TOTAL 2,031.47 100.00% * Land use that includes a mix of Industrial, Commercial, and Residential (low, moderate, and high density) land use types.
Figure 2 shows the HoLIS zoning layer and the reclassified eight key land use types on Oahu.
2. DOT-HWYS TRASH BASELINE LOAD
State of Hawaii Department of Transportation, Highways Division, Oahu District Trash Reduction Plan, October 2016 7
Figure 2. HoLIS zoning classes and reclassified key land use types within DOT-HWYS jurisdictional area.

2. DOT-HWYS TRASH BASELINE LOAD
State of Hawaii Department of Transportation, Highways Division, Oahu District Trash Reduction Plan, October 2016 8
This page intentionally left blank.
2. DOT-HWYS TRASH BASELINE LOAD
State of Hawaii Department of Transportation, Highways Division, Oahu District Trash Reduction Plan, October 2016 9
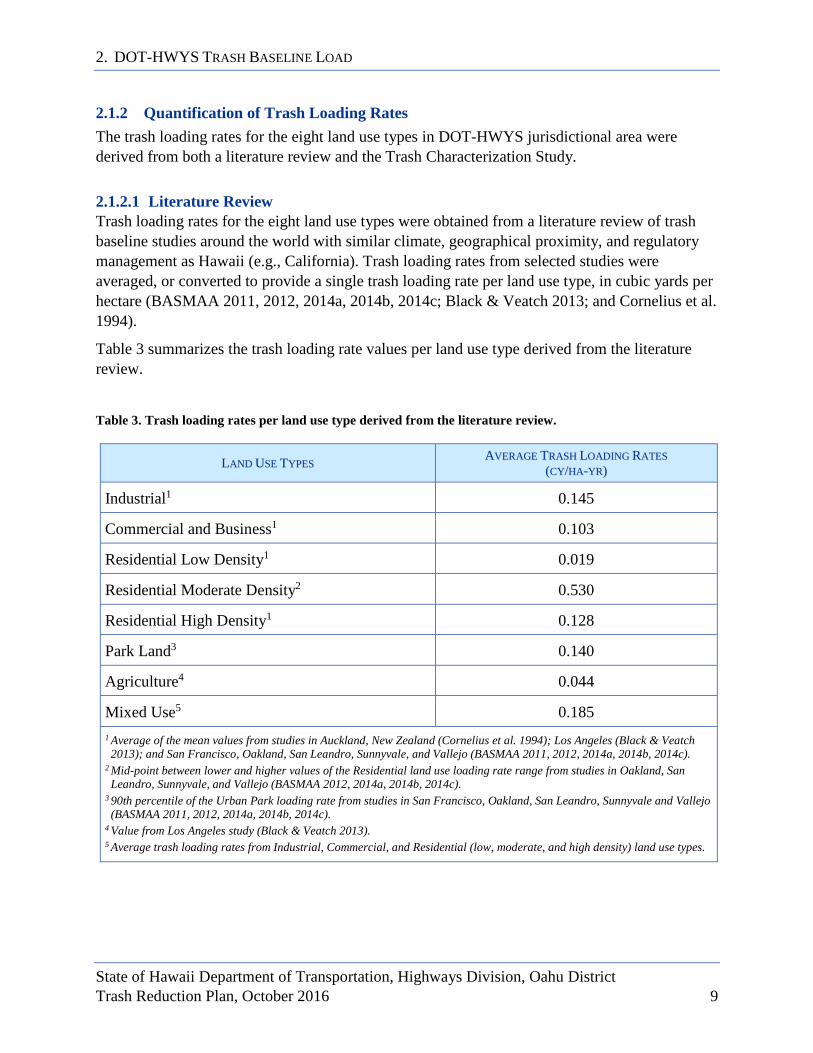
2.1.2 Quantification of Trash Loading Rates The trash loading rates for the eight land use types in DOT-HWYS jurisdictional area were derived from both a literature review and the Trash Characterization Study.
2.1.2.1 Literature Review Trash loading rates for the eight land use types were obtained from a literature review of trash baseline studies around the world with similar climate, geographical proximity, and regulatory management as Hawaii (e.g., California). Trash loading rates from selected studies were averaged, or converted to provide a single trash loading rate per land use type, in cubic yards per hectare (BASMAA 2011, 2012, 2014a, 2014b, 2014c; Black & Veatch 2013; and Cornelius et al. 1994).
Table 3 summarizes the trash loading rate values per land use type derived from the literature review.
Table 3. Trash loading rates per land use type derived from the literature review.
LLAANNDD UUSSEE TTYYPPEESS AAVVEERRAAGGEE TTRRAASSHH LLOOAADDIINNGG RRAATTEESS ((CCYY//HHAA--YYRR))
Industrial1 0.145
Commercial and Business1 0.103
Residential Low Density1 0.019
Residential Moderate Density2 0.530
Residential High Density1 0.128
Park Land3 0.140
Agriculture4 0.044
Mixed Use5 0.185 1 Average of the mean values from studies in Auckland, New Zealand (Cornelius et al. 1994); Los Angeles (Black & Veatch 2013); and San Francisco, Oakland, San Leandro, Sunnyvale, and Vallejo (BASMAA 2011, 2012, 2014a, 2014b, 2014c).
2 Mid-point between lower and higher values of the Residential land use loading rate range from studies in Oakland, San Leandro, Sunnyvale, and Vallejo (BASMAA 2012, 2014a, 2014b, 2014c).
3 90th percentile of the Urban Park loading rate from studies in San Francisco, Oakland, San Leandro, Sunnyvale and Vallejo (BASMAA 2011, 2012, 2014a, 2014b, 2014c).
4 Value from Los Angeles study (Black & Veatch 2013). 5 Average trash loading rates from Industrial, Commercial, and Residential (low, moderate, and high density) land use types.

2. DOT-HWYS TRASH BASELINE LOAD
State of Hawaii Department of Transportation, Highways Division, Oahu District Trash Reduction Plan, October 2016 10
2.1.2.2 Trash Characterization Study The Trash Characterization Study focused on the three land use types (residential high density, park land, and agriculture) that constitute the majority (> 85%) of DOT-HWYS jurisdictional area. The methodology to evaluate whether the trash loading rates from the literature review were applicable to Hawaii required the following process: Site Selection; Data Collection; Trash Characterization; and Calculation of Trash Loading Rates.
A. Site Selection Ten sampling sites were selected according to land use type, average daily traffic (ADT) volume, drainage area, and accessibility criteria.
Land Use. The land use types of residential high density, park land, and agriculture were selected for the Trash Characterization Study as these land use types constituted the majority (> 85%) of DOT-HWYS jurisdictional area.
Average Daily Traffic Volume. Sampling sites were selected in varying traffic volume areas as literature studies show a high correlation between levels of trash along highway segments and ADT volumes (CalTrans 2003).
Drainage Area. Sampling sites were specifically selected in areas of DOT-HWYS ROW which had a contributing drainage area of at least one acre. The drainage area for each sampling site was delineated using a Geographic Information System (GIS). The drainage area of each sampling site was assumed to consist of homogeneous land use to calculate the trash loading rate for each land use type (i.e., composed of a single land use type).
Accessibility. Sampling sites were placed at outfall locations that allowed for safe accessibility for weekly inspections and maintenance. By placing the sample sites at outfall locations, DOT-HWYS measured trash loading rates that account for existing control measures.

2. DOT-HWYS TRASH BASELINE LOAD
State of Hawaii Department of Transportation, Highways Division, Oahu District Trash Reduction Plan, October 2016 11
Figure 3 shows the location of the ten sample sites of Trash Characterization Study
Figure 3. Trash Characterization Study sampling sites location. Table 4 describes the 10 Trash Characterization Study sampling site locations, land use types, the annual ADT volumes, and the contributing drainage areas.
Table 4. Description of Trash Characterization Study sampling sites.
SSIITTEE ## RROOUUTTEE ## DDEESSCCRRIIPPTTIIOONN MMIILLEE PPOOSSTT LLAANNDD UUSSEE TTYYPPEE AANNNNUUAALL
AADDTT DDRRAAIINNAAGGEE AARREEAA ((HHAA))
1 H2 Eastbound (left) 8.45 Agriculture 62,463 28.72
2 H2 Inbound (right) 7.85 Park Land 45,148 2.86
3 76 South (right) 6.30 Agriculture 29,408 9.15
4 H1/78 Westbound (right) 3.35 Residential High Density 81,261 5.51

2. DOT-HWYS TRASH BASELINE LOAD
State of Hawaii Department of Transportation, Highways Division, Oahu District Trash Reduction Plan, October 2016 12
SSIITTEE ## RROOUUTTEE ## DDEESSCCRRIIPPTTIIOONN MMIILLEE PPOOSSTT LLAANNDD UUSSEE TTYYPPEE AANNNNUUAALL
AADDTT DDRRAAIINNAAGGEE AARREEAA ((HHAA))
5 H1/750 Southbound (right) 5.90 Park Land 47,254 17.14
6 H1 Eastbound (right) 4.60 Agriculture 107,800 9.79
7 H2 Outbound (median) 7.85 Agriculture 91,547 1.45
8 H1 Eastbound (right) 0.55 Agriculture 49,254 4.02
9 H2 Outbound (right) 0.90 Agriculture 98,952 1.52
10 63 Inbound (right) 2.70 Residential High Density 30,000 0.55
Figure 4 provides an example of a typical trash trap.
Figure 4. Trash trap located at Site #3. B. Data Collection The Trash Characterization Study collected organic debris and trash samples from the 10 sites between May 2015 and May 2016 to account for any seasonal variability. The sampling sites were inspected on a weekly basis or within 24 hours of any rainfall event greater than 1 inch. Inspected traps less than 50% full received cleaning within 90 calendar days. Inspected traps more than 50% full received cleaning within a week of the inspection.
2. DOT-HWYS TRASH BASELINE LOAD
State of Hawaii Department of Transportation, Highways Division, Oahu District Trash Reduction Plan, October 2016 13
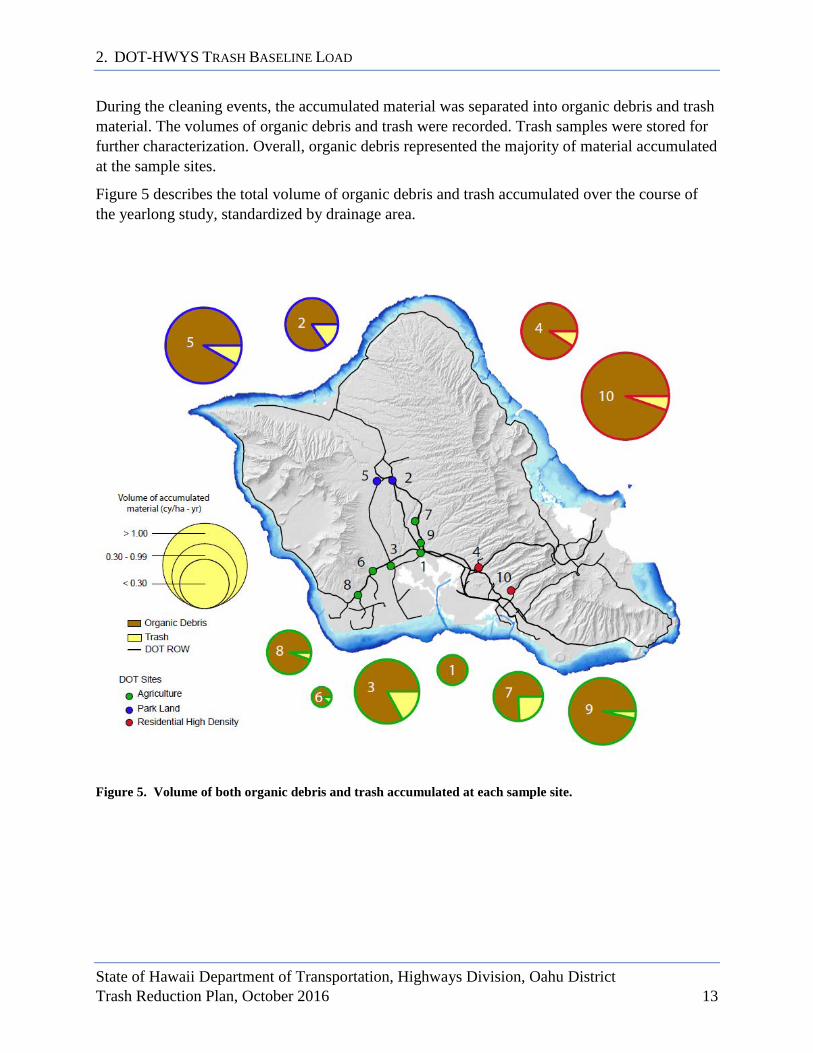
During the cleaning events, the accumulated material was separated into organic debris and trash material. The volumes of organic debris and trash were recorded. Trash samples were stored for further characterization. Overall, organic debris represented the majority of material accumulated at the sample sites.
Figure 5 describes the total volume of organic debris and trash accumulated over the course of the yearlong study, standardized by drainage area.
Figure 5. Volume of both organic debris and trash accumulated at each sample site.

2. DOT-HWYS TRASH BASELINE LOAD
State of Hawaii Department of Transportation, Highways Division, Oahu District Trash Reduction Plan, October 2016 14
C. Trash Characterization Over the course of this yearlong study (May 2015 and May 2016), a total of 67 trash samples were collected, sorted, and characterized according to the following 7 categories:
• Single-use plastic bags and packaging • Polystyrene foam (Styrofoam) • Cigarette butts • Metal • Paper • Recyclable beverage containers • Miscellaneous
After sorting the trash samples into appropriate categories, the weight and volume of the materials were recorded.
Table 5 describes the trash composition for each site in terms annual volume standardized by drainage area.
Table 5. Trash composition in volume (x 10-3 cy/ha-yr) per sample site.
SSIITTEE ##
PPLLAASSTTIICC BBAAGGSS AANNDD
PPAACCKKAAGGIINNGG
PPOOLLYYSSTTYYRREENNEE FFOOAAMM
CCIIGGAARREETTTTEE BBUUTTTTSS MMEETTAALL PPAAPPEERR
RREECCYYCCLLAABBLLEE BBEEVVEERRAAGGEE
CCOONNTTAAIINNEERRSS MMIISSCCEELLLLAANNEEOOUUSS
1 0.19 0.00 0.00 0.00 0.00 0.00 0.00
2 31.15 0.90 0.55 0.39 5.98 0.99 12.92
3 63.28 4.64 0.01 10.53 39.32 7.86 30.33
4 29.97 1.37 1.66 0.47 7.23 1.27 0.29
5 43.67 1.17 0.03 2.72 37.06 1.87 85.04
6 0.23 0.04 0.00 0.30 0.00 0.00 0.00
7 43.68 0.81 0.00 0.00 2.39 2.50 12.75
8 4.80 1.40 0.00 0.41 1.69 0.00 0.00
9 18.01 0.10 0.00 1.35 3.27 8.81 8.00
10 146.99 0.48 0.09 0.00 34.82 25.26 7.20
2. DOT-HWYS TRASH BASELINE LOAD
State of Hawaii Department of Transportation, Highways Division, Oahu District Trash Reduction Plan, October 2016 15
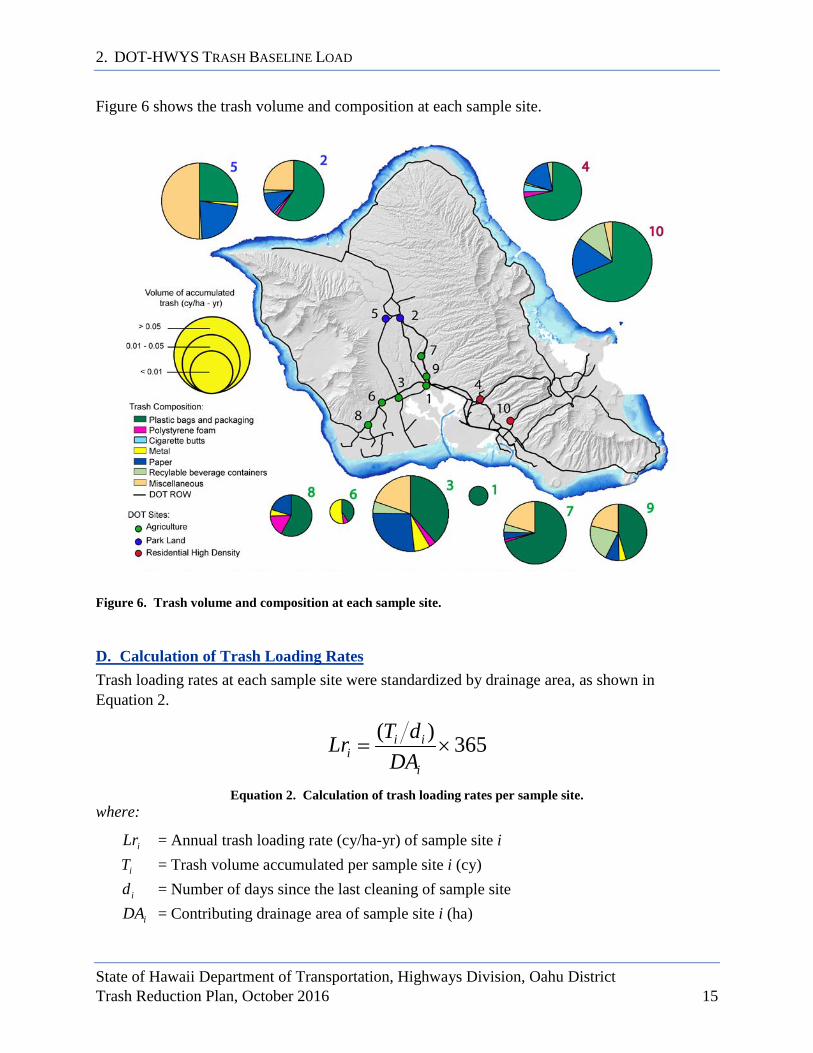
Figure 6 shows the trash volume and composition at each sample site.
Figure 6. Trash volume and composition at each sample site. D. Calculation of Trash Loading Rates Trash loading rates at each sample site were standardized by drainage area, as shown in Equation 2.
365)(×=
i
iii DA
dTLr
Equation 2. Calculation of trash loading rates per sample site. where:
iLr = Annual trash loading rate (cy/ha-yr) of sample site i
iT = Trash volume accumulated per sample site i (cy)
id = Number of days since the last cleaning of sample site
iDA = Contributing drainage area of sample site i (ha)

2. DOT-HWYS TRASH BASELINE LOAD
State of Hawaii Department of Transportation, Highways Division, Oahu District Trash Reduction Plan, October 2016 16
Annual trash loading rates per sample site were averaged by land use type, as shown below:
• Residential high density trash loading rate: 0.187 cubic yards per hectare • Park land trash loading rate: 0.194 cubic yards per hectare • Agriculture trash loading rate: 0.044 cubic yards per hectare
The Trash Characterization Study yielded trash loading rates for residential high density, park land, and agriculture land use types, within the range of the values identified in the literature review. For this reason, DOT-HWYS adopted these locally derived values and used the literature values for the remaining five land use types to calculate the trash baseline load for the ROW. Due to the variability observed in the data, the trash loading rates presented in this plan should be considered preliminary estimates.
2.2 DOT-HWYS Trash Baseline Load DOT-HWYS utilized the eight land use types and their respective trash loading rates, derived from the literature review and the Trash Characterization Study, to calculate the DOT-HWYS trash baseline load. DOT-HWYS utilized Equation 1 to obtain the annual trash load of each land use type. The annual trash loads of the eight key land use types were summed to provide a trash baseline load for DOT-HWYS of 297 cubic yards per year (rounded to the nearest integer).
Table 6 summarizes DOT-HWYS key land use types, areas, associated trash loading rates and resulting trash loads.
Table 6. DOT-HWYS ROW land use types, areas, associated trash loading rates, and trash baseline loads.
LLAANNDD UUSSEE TTYYPPEESS AARREEAASS
((HHAA)) TTRRAASSHH LLOOAADDIINNGG RRAATTEESS
((CCYY//HHAA--YYRR)) AANNNNUUAALL TTRRAASSHH LLOOAADD
((CCYY//YYRR))
Industrial 46.93a 0.145b 6.81 Commercial and Business 56.18a 0.103b 5.79 Residential Low Density 81.43a 0.019b 1.55 Residential Moderate Density 64.04a 0.530b 33.94 Residential High Density 602.60a 0.187c 112.69
Park Land 552.40a 0.194c 107.17
Agriculture 617.00a 0.044c 27.15
Mixed Use 10.89a 0.197d 2.15 TOTAL DOT-HWYS TRASH BASELINE LOAD 297.25
a Values derived from Table 2. b Values derived from literature review (refer to Table 3). c Values derived from DOT-HWYS Trash Characterization Study. d Average trash loading rates of Industrial, Commercial, and Residential (low, moderate, and high density) land use types.
3. EXISTING TRASH CONTROL MEASURES
State of Hawaii Department of Transportation, Highways Division, Oahu District Trash Reduction Plan, October 2016 17
33.. EEXXIISSTTIINNGG TTRRAASSHH CCOONNTTRROOLL MMEEAASSUURREESS This section describes the control measures that DOT-HWYS implemented prior to the baseline year (2013) to manage storm water runoff, and therefore current levels of BMP implementation are considered part of the baseline. DOT-HWYS currently utilizes the following control measures:
• Institutional control measures that include legislative actions and public education and outreach.
• Land-based interception control measures that include HWY-OM Litter Removal and Disposal Program, Adopt-A-Highway cleanups, and street sweeping.
• MS4 interception control measures that include MS4 cleaning and Permanent BMPs. These BMP programs are implemented to reduce trash discharges from the DOT-HWYS MS4 to receiving State waterbodies. Due to the inherent variability in monitoring and measuring trash generation and accumulation in the environment, DOT-HWYS used a three-year running average to estimate current trash removal from existing control measures. These control measures are also discussed in more detail in the comprehensive State of Hawaii Department of Transportation, Highways Division, Oahu District Storm Water Management Program Plan (SWMPP).
3.1 Institutional Control Measures Institutional control measures prevent or reduce the potential of trash to be deposited into the environment. DOT-HWYS utilizes two types of institutional control measures:
• Corrective measures, such as legislative actions. • Preventive measures, such as public education.
3.1.1 Legislative Actions Legislative actions correct societal behavior through the creation of new laws, improved enforcement, and compliance with existing laws. DOT-HWYS trash reduction efforts benefit from several existing laws aimed at reducing the amount of trash entering the environment.
Anti‐Littering and Illegal Dumping Enforcement. The HRS § 291C-131 addresses spilling loads on highways, HRS § 291C-132 addresses littering from vehicles, and HRS § 339 addresses littering in public and private areas. Penalties for violation of any of these provisions may include fines, community service, and suspension of license and registration.
The criminal littering law HRS § 708-829 addresses illegal littering in any public or private property or waterbody, except in places designated by the Department of Health or the CCH for
3. EXISTING TRASH CONTROL MEASURES
State of Hawaii Department of Transportation, Highways Division, Oahu District Trash Reduction Plan, October 2016 18
the disposal of garbage and refuse. This law is cross-referenced in HRS § 291C-131 and HRS § 291C-132 for Highways, and Litter Control HRS § 339-1 to 11.
The ROH Chapter 29, Article 4 on Litter Control is an enforcement authority for litter control; and states that any person who witnesses the disposal of litter in violation of this ordinance, may report the date, time of day, license number, and location of the littering from the vehicle, which shall constitute prima facie evidence.
3.1.2 Public Education and Outreach Program The Public Education and Outreach Program (Public Education Program) increases the general public’s awareness about how daily activities affect storm water runoff quality and prevent trash from entering the environment.
3.1.2.1 School and Youth Outreach DOT-HWYS has a long-standing partnership with the Department of Education which continues to be mutually beneficial. Elementary school-aged children are the best target audience to influence long-term change because they are able to take home the lessons learned, and share them with their family.
Currently, as a part of the Public Education Program, DOT-HWYS actively engages these students through school presentations, and provides an average of five events per year. The school presentations include a PowerPoint presentation, a “Find the Storm Water Pollutants” worksheet, and a hands-on demonstration with a storm water inlet model.
3.1.2.2 Community Outreach Community outreach activities provide opportunities for hands-on learning and fun educational experiences for a variety of target groups. Communities actively involved at events are more likely to commit to sustainable activities at their workplace and at home.
Events are regularly held in partnership with various organizations throughout the year, and DOT-HWYS provides an average of 10 events per year. Participation at past events proved to be an effective way to deliver the Program’s message, and increase storm water awareness and education. Typical event activities include an interactive storm water model, prize wheel, photo booth, survey, and the distribution of education material.
In general, events are targeted in waste load allocation (WLA) watersheds, to engage audiences likely to have a direct impact on DOT-HWYS ability to meet its WLA reduction requirements.
3.1.2.3 Advertising Campaigns Advertising is an effective means to generate awareness through placement of advertisements in mediums to reach a broader audience. Public Services Announcements (PSAs) are a constructive way to use television or radio airtime to raise public awareness about storm water.
3. EXISTING TRASH CONTROL MEASURES
State of Hawaii Department of Transportation, Highways Division, Oahu District Trash Reduction Plan, October 2016 19
DOT-HWYS has both television and radio Public Services Announcements in stock, and continues to explore both paid and free options to air the PSAs on a biannual basis.
3.1.2.4 Media Relations Mass media formats are cost-effective and efficient alternatives to deliver DOT-HWYS message. Opportunities for media coverage include informational news stories, human interest stories, guest commentaries, and social media. Expansion of media coverage through a planned, proactive approach can help build and support new attitudes and changes in behavior.
In general, DOT-HWYS actively promotes creative story angles to obtain editorial coverage in local print, broadcast, and online media. The news media has focused on reaching both targeted and broad audiences, and communicating about watershed messages to support meeting the WLA reduction requirements.
3.2 Land-Based Interception Control Measures Once trash enters the environment, it may be intercepted and removed through land-based interception control measures prior to reaching the MS4 network. Land-based trash cleanups include those conducted by DOT-HWYS Oahu District Maintenance Section (HWY-OM) or volunteer-based programs, and street sweeping control measures.
3.2.1 Land-Based Trash Cleanup Programs Land-based cleanups are currently conducted by HWY-OM or volunteer-based programs.
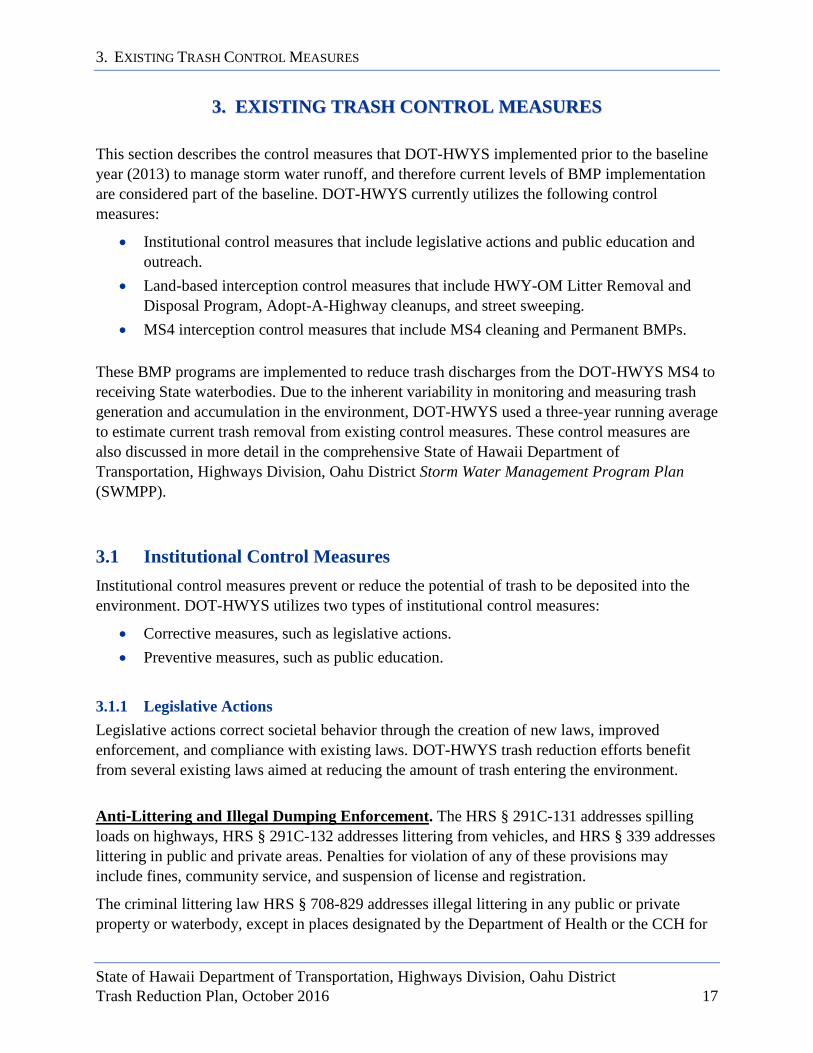
HWY-OM Litter Removal & Disposal Program. HWY-OM implements a Litter Removal and Disposal Program that maintains and cleans the State highways.
The HWY-OM Litter Removal and Disposal Program removes an average of 11,300 cubic yards of trash, based on data from 2013 to 2015 (see Figure 7). Higher levels of trash removal occur along the south shore and west side of Oahu.
Figure 7. Total volume of trash removed by HWY-OM Litter Removal and Disposal Program on Oahu, 2013-2015.
3. EXISTING TRASH CONTROL MEASURES
State of Hawaii Department of Transportation, Highways Division, Oahu District Trash Reduction Plan, October 2016 20
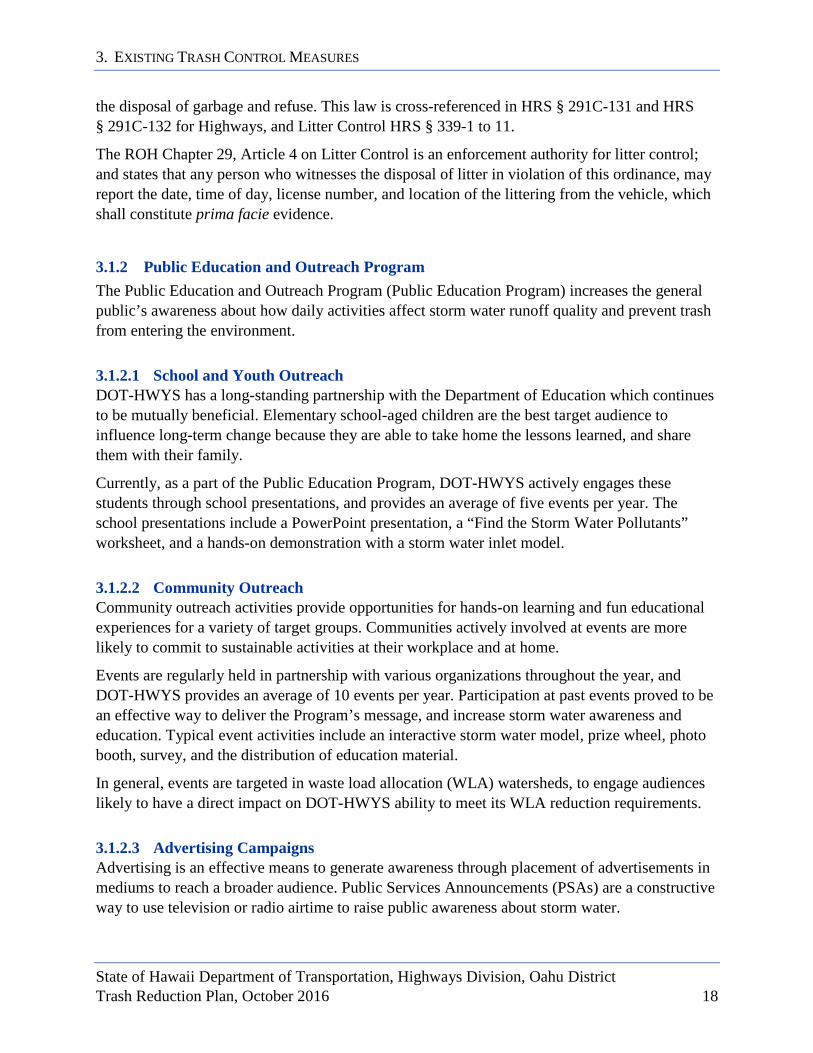
Adopt-A-Highway Program.
DOT-HWYS sponsors an Adopt-A-Highway Program for volunteers from organizations to remove trash along State highways. Adopt-A-Highway groups agree to adopt a two-mile portion of a State highway for a minimum of two years, and remove trash at least four times a year. DOT-HWYS provides all safety materials and trash bags, schedules trash pickups, and erects highway signs to recognize the organizations cleaning efforts.
The Adopt-A-Highway Program removes on average 233 cubic yards of trash, based on data from 2013 to 2015 (see Figure 8). In general, higher levels of trash removal occur near densely populated areas such as Haleiwa, Waianae, Laie, Kapolei, Honolulu, Waimanalo, and Kaneohe.
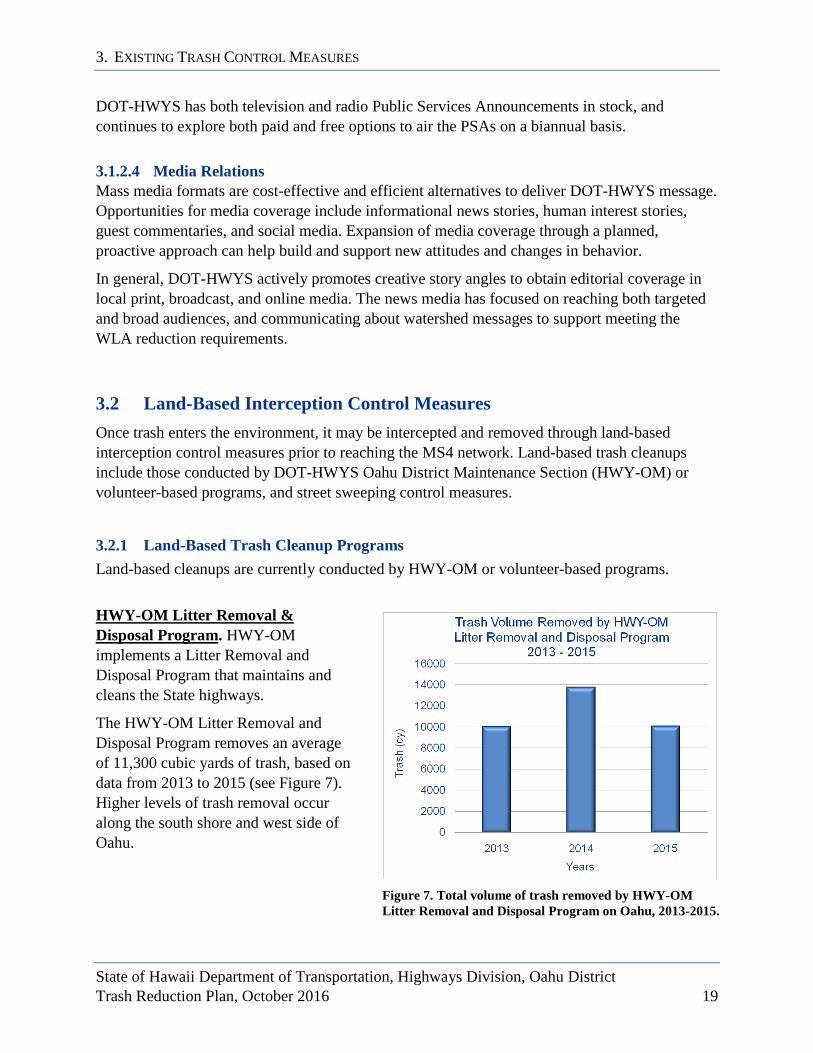
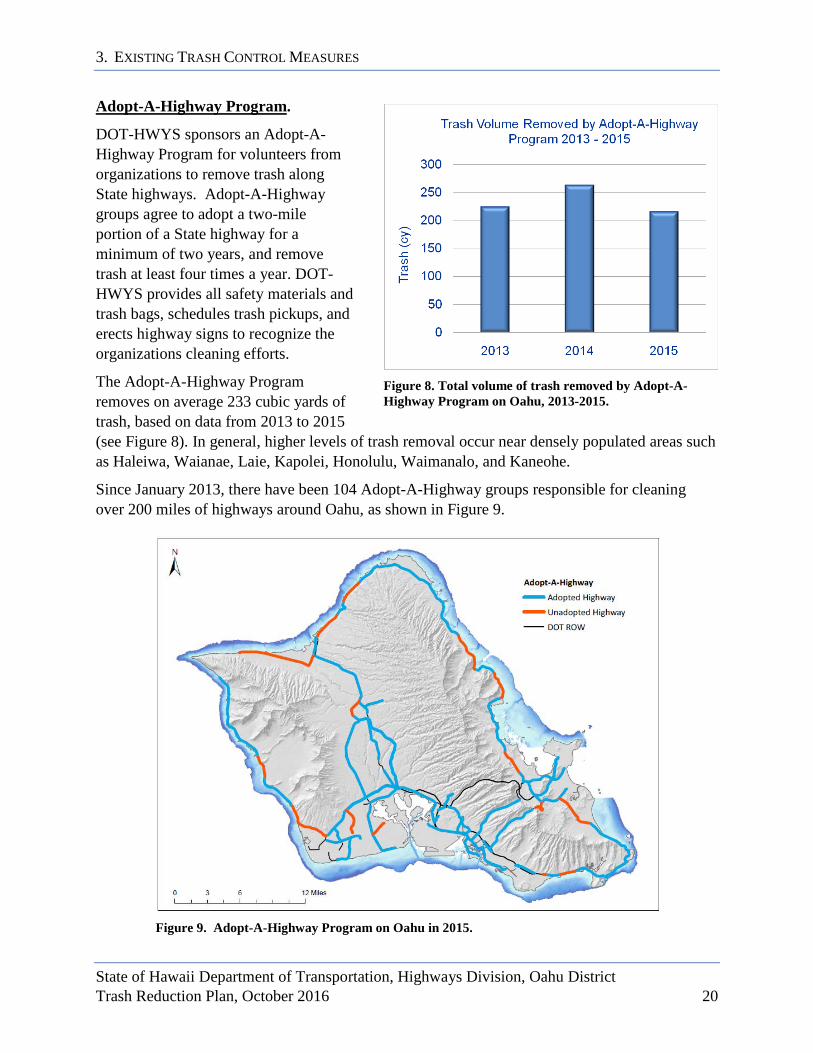
Since January 2013, there have been 104 Adopt-A-Highway groups responsible for cleaning over 200 miles of highways around Oahu, as shown in Figure 9.
Figure 9. Adopt-A-Highway Program on Oahu in 2015.
Figure 8. Total volume of trash removed by Adopt-A-Highway Program on Oahu, 2013-2015.

3. EXISTING TRASH CONTROL MEASURES
State of Hawaii Department of Transportation, Highways Division, Oahu District Trash Reduction Plan, October 2016 21
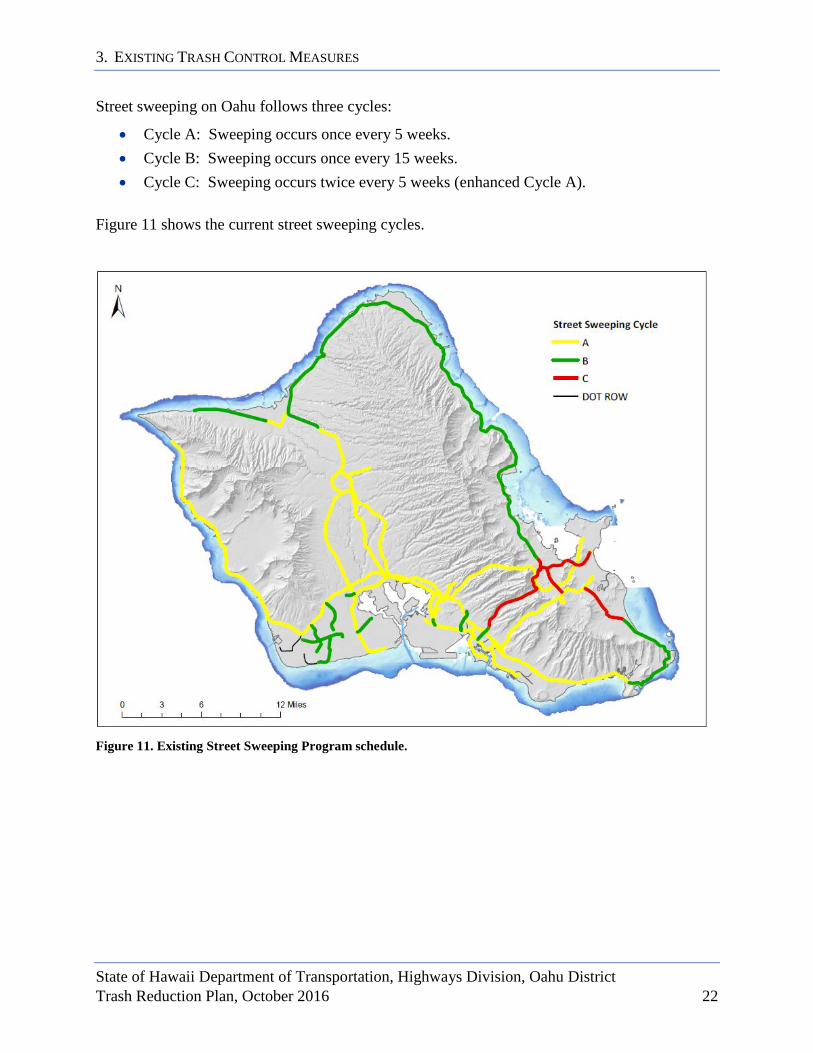
3.2.2 Street Sweeping Program Street sweeping is a cost-effective method to remove particulate debris from streets and roadways. Street sweeping focuses on the removal of trash, leaves, and other large debris, thereby reducing the potential to enter the MS4 by storm water runoff events.
DOT-HWYS tracks debris removed through street sweeping operations and estimates the volume of sediment, organic matter, and trash removed.
The Street Sweeping Program removes on average 332 cubic yards of trash, based on data from 2013 to 2015 (see Figure 10). Higher levels of trash were removed along the south shore.
Figure 10. Total volume of trash collected by Street Sweeping Program on Oahu, 2013-2015.
3. EXISTING TRASH CONTROL MEASURES
State of Hawaii Department of Transportation, Highways Division, Oahu District Trash Reduction Plan, October 2016 22
Street sweeping on Oahu follows three cycles:
• Cycle A: Sweeping occurs once every 5 weeks. • Cycle B: Sweeping occurs once every 15 weeks. • Cycle C: Sweeping occurs twice every 5 weeks (enhanced Cycle A).
Figure 11 shows the current street sweeping cycles.
Figure 11. Existing Street Sweeping Program schedule.

3. EXISTING TRASH CONTROL MEASURES
State of Hawaii Department of Transportation, Highways Division, Oahu District Trash Reduction Plan, October 2016 23
3.3 MS4 Interception Control Measures Once trash enters the MS4, it may be intercepted and removed through MS4 structure cleaning and Permanent BMPs.
3.3.1 MS4 Inspection and Cleaning Program The cleaning of MS4 structures is a proven cost-effective method to capture and remove gross pollutants from storm water runoff. Portions of selected State routes are classified as high priority due to relatively high traffic volume and their location in a High Priority Watershed (designated by the Consent Decree Civil Action No. CV 05-00636-HG- KSC, and terminated on April 14, 2016). Hence, these high priority inlets are inspected at least once every six months.
Portions of selected State routes are classified as low priority due to relatively low traffic volume and their location in a Non-High Priority Watershed (designated by the Consent Decree Civil Action No. CV 05-00636-HG-KSC, and terminated on April 14, 2016). Hence, these low priority drains are inspected once per year and cleaned, if necessary.
Figure 12 displays the inlets and manholes with their respective inspection schedule.
Figure 12. Existing MS4 Inspection and Cleaning Program schedule.

3. EXISTING TRASH CONTROL MEASURES
State of Hawaii Department of Transportation, Highways Division, Oahu District Trash Reduction Plan, October 2016 24
DOT-HWYS tracks debris removed through MS4 cleaning operations and estimates the volume of sediment, organic matter, and trash removed. The MS4 Inspection and cleaning Program removes on average 42 cubic yards of trash, based on the data from 2013 to 2015 (see Figure 13). Higher levels of trash were removed along the south shore, west side, and near other densely populated areas, such as Wahiawa and Kaneohe.
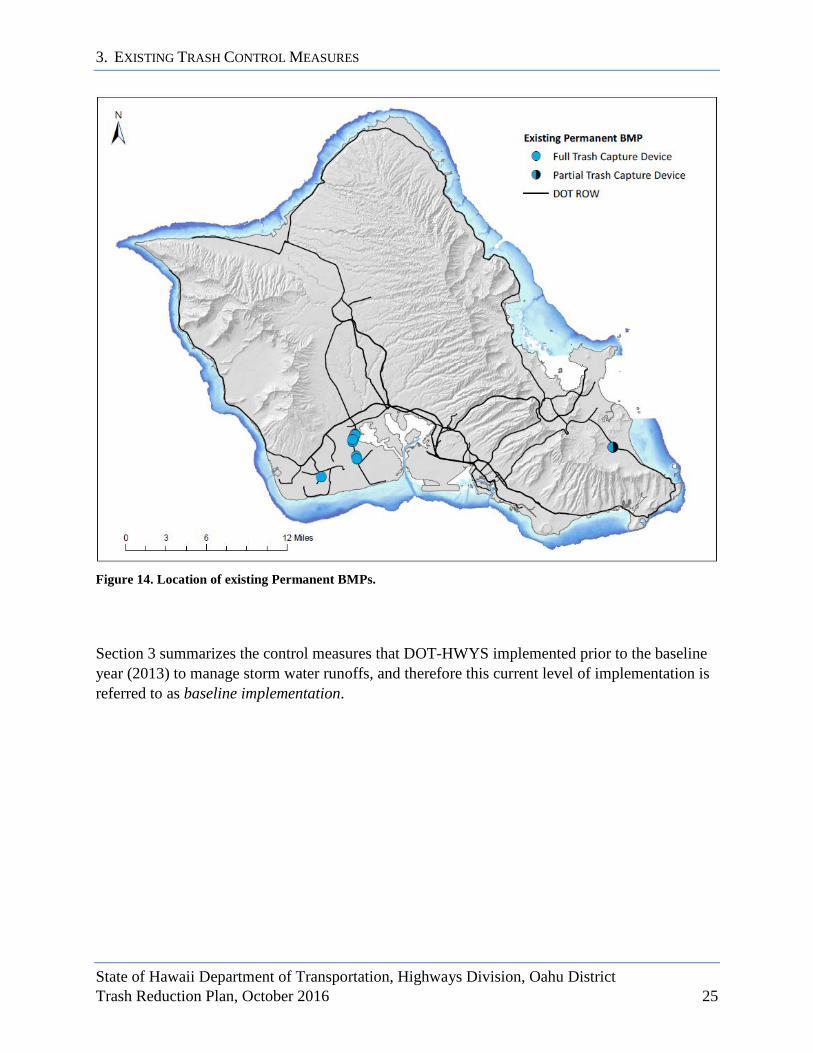
3.3.2 Permanent BMP Program DOT-HWYS implements a Permanent BMP Program to fulfill the MS4 Permit requirements, and to address storm water pollution associated with highway runoff. DOT-HWYS utilizes both partial and full trash capture devices in the MS4 to reduce trash and other land-based source pollutant runoffs, as shown in Figure 14.
Partial Trash Capture Devices. Partial trash capture devices have removal efficiencies that are less than 100%. There is currently one partial trash capture devices in DOT-HWYS MS4 with a grated-inlet skimmer box.
Full Trash Capture Devices. Full trash capture devices have removal efficiencies of 100% up to their intended design flow. There are currently 10 full trash capture devices in DOT-HWYS MS4: 9 hydrodynamic separators and 1 catch basin insert filter.
Figure 13. Total volume of trash removed from inlets and manholes cleaning on Oahu, 2013-2015.
3. EXISTING TRASH CONTROL MEASURES
State of Hawaii Department of Transportation, Highways Division, Oahu District Trash Reduction Plan, October 2016 25
Figure 14. Location of existing Permanent BMPs.
Section 3 summarizes the control measures that DOT-HWYS implemented prior to the baseline year (2013) to manage storm water runoffs, and therefore this current level of implementation is referred to as baseline implementation.
3. EXISTING TRASH CONTROL MEASURES
State of Hawaii Department of Transportation, Highways Division, Oahu District Trash Reduction Plan, October 2016 26
This page intentionally left blank.

4. DOT-HWYS FIVE STEP METHOD TO TRACK FUTURE TRASH REDUCTIONS
State of Hawaii Department of Transportation, Highways Division, Oahu District Trash Reduction Plan, October 2016 27
44.. DDOOTT--HHWWYYSS FFIIVVEE SSTTEEPP MMEETTHHOODD TTOO TTRRAACCKK FFUUTTUURREE TTRRAASSHH RREEDDUUCCTTIIOONNSS
This section describes the quantitative tracking methods to document compliance with the required trash load reductions. A literature review was conducted to evaluate quantification methods used by other agencies, which guided the development of DOT-HWYS trash reduction calculation method.
Consistent with the MS4 Permit requirements, DOT-HWYS has established 2013 as the baseline year for the DOT-HWYS TRP. Progress towards load reduction goals will be demonstrated by applying the DOT-HWYS Five Step Method. This Five Step Method applies a combination of two trash load reduction methods to the trash baseline load, and demonstrates trash load reductions attributable to specific control measures: 1) trash load reduction credits; and 2) trash load reduction formulas. This methodology should be considered preliminary and are subject to revision based on additional information and implementation experiences.
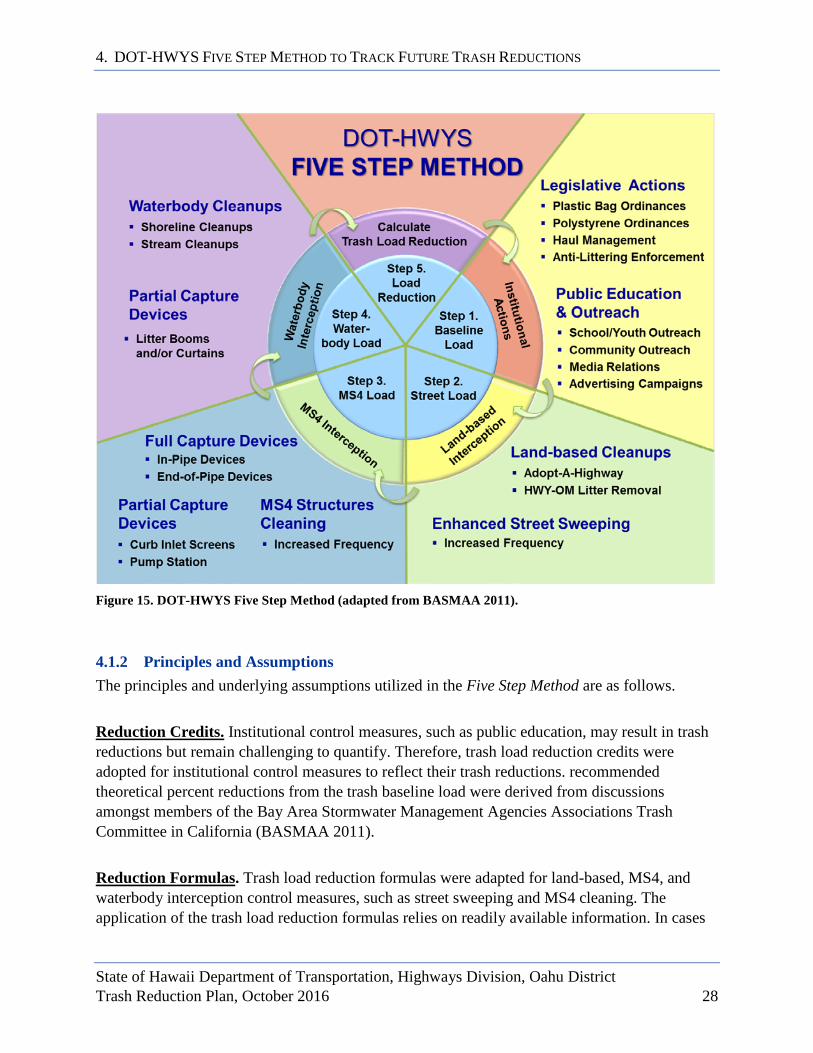
4.1 DOT-HWYS Five Step Method 4.1.1 Overview DOT-HWYS utilizes the Five Step Method to calculate trash load reductions and account for the trash generation and transport process, as follows:
Step 1 – Institutional Control Measures
Step 2 – Land-Based Interception Control Measures
Step 3 – MS4 Interception Control Measures
Step 4 – Waterbody Interception Control Measures
Step 5 – Calculate Trash Load Reduction Step 1 utilizes trash load reduction credit implemented on an “area-wide” basis and therefore load reductions are applied to the entire DOT-HWYS jurisdictional area.
In contrast, Steps 2 through 4 utilize trash load reduction formulas on an “area‐specific” basis.
Reductions are generally applied in the sequence presented in Figure 15, although some reductions may be applied “in‐parallel” and are calculated during the same substep of the method.
4. DOT-HWYS FIVE STEP METHOD TO TRACK FUTURE TRASH REDUCTIONS
State of Hawaii Department of Transportation, Highways Division, Oahu District Trash Reduction Plan, October 2016 28
Figure 15. DOT-HWYS Five Step Method (adapted from BASMAA 2011).
4.1.2 Principles and Assumptions The principles and underlying assumptions utilized in the Five Step Method are as follows.
Reduction Credits. Institutional control measures, such as public education, may result in trash reductions but remain challenging to quantify. Therefore, trash load reduction credits were adopted for institutional control measures to reflect their trash reductions. recommended theoretical percent reductions from the trash baseline load were derived from discussions amongst members of the Bay Area Stormwater Management Agencies Associations Trash Committee in California (BASMAA 2011).
Reduction Formulas. Trash load reduction formulas were adapted for land-based, MS4, and waterbody interception control measures, such as street sweeping and MS4 cleaning. The application of the trash load reduction formulas relies on readily available information. In cases

4. DOT-HWYS FIVE STEP METHOD TO TRACK FUTURE TRASH REDUCTIONS
State of Hawaii Department of Transportation, Highways Division, Oahu District Trash Reduction Plan, October 2016 29
where information is very limited, assumptions are made and may be tested and revised accordingly as methods evolve.
Data Availability. The application of the trash load reduction formulas requires DOT-HWYS to track inputs to formulas using data that DOT-HWYS collects and submits as part of the Annual Reports. To provide a holistic picture of loads reduced from DOT-HWYS storm water runoff during a given year, additional information tracked by other public agencies or private entities (e.g., volunteer groups) may needed.
Baseline vs Enhanced Control Measures. DOT-HWYS may only count trash load reductions associated with the implementation of new or enhanced control measures after the baseline year 2013 or EDOP. Control measures level of implementation prior to 2013 is considered baseline implementation.
Jurisdictional Area. DOT-HWYS jurisdictional area is defined as the ROW. DOT-HWYS will receive “area-wide” trash load reductions credit for institutional control measures implemented after the EDOP.
Double Counting. DOT-HWYS may implement multiple control measures within the same geographical area. In these instances, trash load reductions from one control measure must be accounted for in the reduction formula applied to subsequent control measures. The Five Step Method addresses this issue.
Geographical Uniformity. A practical assumption is that studies conducted at specific locations may be extrapolated to the island, drainage area, land use type, or other defining factors. Data collected by DOT-HWYS will be considered spatially representative, and will be disaggregated or aggregated, as applicable.
4.2 Step 1 – Institutional Control Measures Trash load reduction credits (RC) can be obtained from the implementation of institutional control measures as they reduce the likelihood of trash being deposited into the environment. Reduction credits include the following examples of area‐wide control measures:
RC-1 Single‐Use Carryout Plastic Bag Ordinances
RC‐2 Polystyrene Foam Food Service Ware Ordinances
RC‐3 Uncovered Loads Enforcement
RC‐4 Anti‐Littering and Illegal Dumping Enforcement
RC‐5 Public Education and Outreach Programs
4. DOT-HWYS FIVE STEP METHOD TO TRACK FUTURE TRASH REDUCTIONS
State of Hawaii Department of Transportation, Highways Division, Oahu District Trash Reduction Plan, October 2016 30
Load reductions associated with institutional control measures are applied on an area-wide basis and in parallel. Therefore, the trash baseline load is adjusted islandwide based on the implementation of selected institutional control measures and their associated trash load reduction credits.
The trash baseline load will be reduced by the implementation of enhanced institutional control measures, and the remaining trash may contribute to the street load. The street load is the volume of trash estimated to enter the environment and is available for transport into the MS4, if not intercepted via the land-based control measures described in Section 4.3 (Step 2).
4.2.1 Legislative Actions Trash load reduction credits are available for existing or potentially introduced legislative actions, which includes single-use carryout bag ordinances, polystyrene foam food service ware ordinances, uncovered loads enforcement, and anti-littering and illegal dumping enforcement.
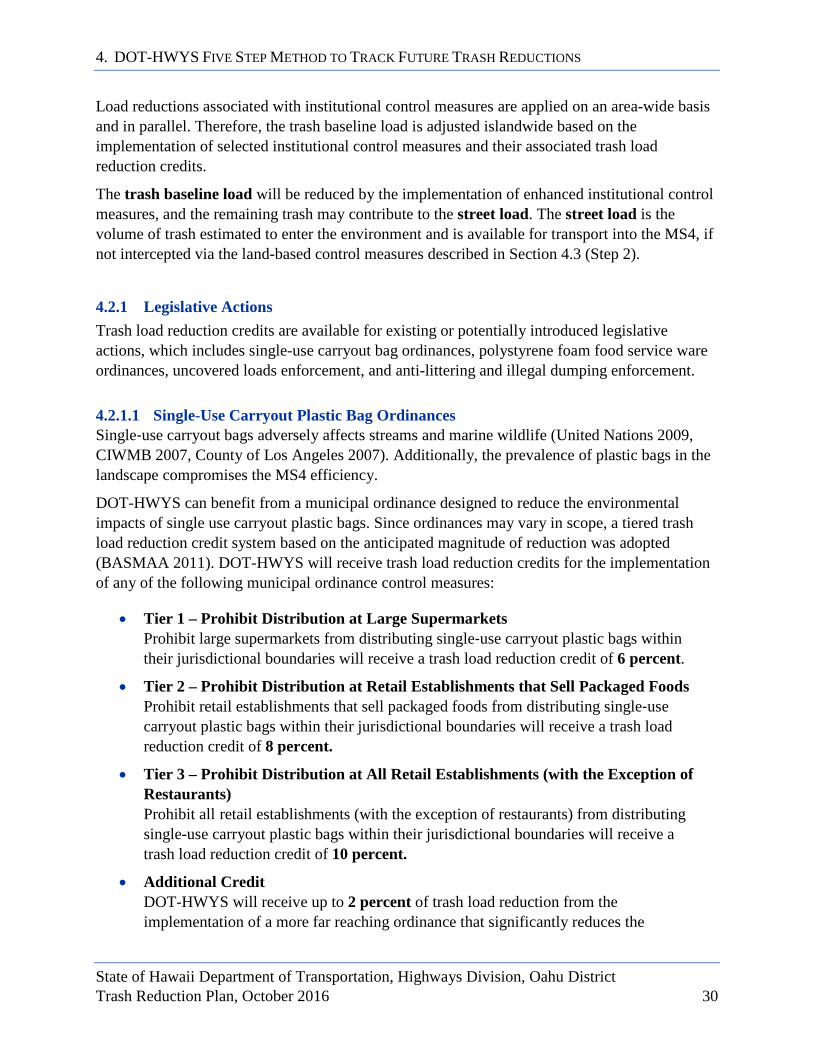
4.2.1.1 Single-Use Carryout Plastic Bag Ordinances Single‐use carryout bags adversely affects streams and marine wildlife (United Nations 2009, CIWMB 2007, County of Los Angeles 2007). Additionally, the prevalence of plastic bags in the landscape compromises the MS4 efficiency.
DOT-HWYS can benefit from a municipal ordinance designed to reduce the environmental impacts of single use carryout plastic bags. Since ordinances may vary in scope, a tiered trash load reduction credit system based on the anticipated magnitude of reduction was adopted (BASMAA 2011). DOT-HWYS will receive trash load reduction credits for the implementation of any of the following municipal ordinance control measures:
• Tier 1 – Prohibit Distribution at Large Supermarkets Prohibit large supermarkets from distributing single‐use carryout plastic bags within their jurisdictional boundaries will receive a trash load reduction credit of 6 percent.
• Tier 2 – Prohibit Distribution at Retail Establishments that Sell Packaged Foods Prohibit retail establishments that sell packaged foods from distributing single‐use carryout plastic bags within their jurisdictional boundaries will receive a trash load reduction credit of 8 percent.
• Tier 3 – Prohibit Distribution at All Retail Establishments (with the Exception of Restaurants) Prohibit all retail establishments (with the exception of restaurants) from distributing single-use carryout plastic bags within their jurisdictional boundaries will receive a trash load reduction credit of 10 percent.
• Additional Credit DOT-HWYS will receive up to 2 percent of trash load reduction from the implementation of a more far reaching ordinance that significantly reduces the
4. DOT-HWYS FIVE STEP METHOD TO TRACK FUTURE TRASH REDUCTIONS
State of Hawaii Department of Transportation, Highways Division, Oahu District Trash Reduction Plan, October 2016 31
distribution and usage of all types of single-use carryout bags. Actions may include banning the distribution of, or charging a fee for, single-use paper bags in retail establishments.
To receive the trash load reduction credits described above, DOT-HWYS needs to implement in parallel with the ordinance/action, public education and outreach that focus on reducing the distribution of single‐use plastic bags.
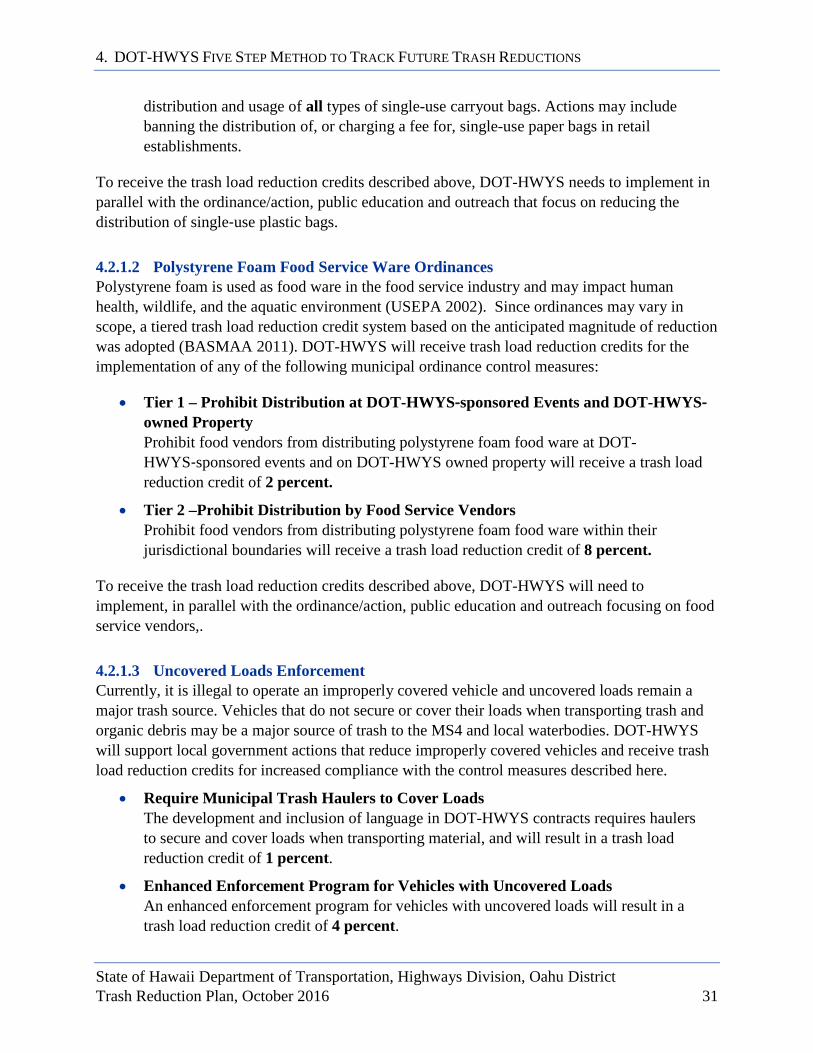
4.2.1.2 Polystyrene Foam Food Service Ware Ordinances Polystyrene foam is used as food ware in the food service industry and may impact human health, wildlife, and the aquatic environment (USEPA 2002). Since ordinances may vary in scope, a tiered trash load reduction credit system based on the anticipated magnitude of reduction was adopted (BASMAA 2011). DOT-HWYS will receive trash load reduction credits for the implementation of any of the following municipal ordinance control measures:
• Tier 1 – Prohibit Distribution at DOT-HWYS‐sponsored Events and DOT-HWYS‐ owned Property Prohibit food vendors from distributing polystyrene foam food ware at DOT-HWYS‐sponsored events and on DOT-HWYS owned property will receive a trash load reduction credit of 2 percent.
• Tier 2 –Prohibit Distribution by Food Service Vendors Prohibit food vendors from distributing polystyrene foam food ware within their jurisdictional boundaries will receive a trash load reduction credit of 8 percent.
To receive the trash load reduction credits described above, DOT-HWYS will need to implement, in parallel with the ordinance/action, public education and outreach focusing on food service vendors,.
4.2.1.3 Uncovered Loads Enforcement Currently, it is illegal to operate an improperly covered vehicle and uncovered loads remain a major trash source. Vehicles that do not secure or cover their loads when transporting trash and organic debris may be a major source of trash to the MS4 and local waterbodies. DOT-HWYS will support local government actions that reduce improperly covered vehicles and receive trash load reduction credits for increased compliance with the control measures described here.
• Require Municipal Trash Haulers to Cover Loads The development and inclusion of language in DOT-HWYS contracts requires haulers to secure and cover loads when transporting material, and will result in a trash load reduction credit of 1 percent.
• Enhanced Enforcement Program for Vehicles with Uncovered Loads An enhanced enforcement program for vehicles with uncovered loads will result in a trash load reduction credit of 4 percent.
4. DOT-HWYS FIVE STEP METHOD TO TRACK FUTURE TRASH REDUCTIONS
State of Hawaii Department of Transportation, Highways Division, Oahu District Trash Reduction Plan, October 2016 32
4.2.1.4 Anti-Littering and Illegal Dumping Enforcement Successful anti‐littering and illegal dumping enforcement activities include laws and ordinances which prohibit littering or dumping. Laws are enforced by various municipal agency staff (e.g., police and public works department staff) who issue citations in response to citizen complaints or other enforcement methods (e.g., surveillance cameras, signage and/or physical barriers installed at illegal dumping hotspots). DOT-HWYS will support local government actions that reduce illegal littering, and will receive trash load reduction credits for increased compliance with the control measures described here.
• Anti‐Littering and Illegal Dumping Enforcement Program Municipal implementation of an active anti-littering and illegal dumping enforcement program will result in a trash load reduction credit of 2 percent.
• Use of Surveillance Use of surveillance techniques to deter and prosecute illegal dumping will result in a trash load reduction credit of up to 2 percent (based on the tiers described in Table 7).
• Use of Physical Barriers or Improvements Installation and use of physical barriers (e.g., fences, walls) or physical improvements (e.g., maintenance) which eliminate or deter illegal dumping will result in a trash load reduction credit of up to 2 percent (based on the tiers described in Table 7).
4.2.2 Public Education and Outreach DOT-HWYS will continue to evaluate potential partnerships with agencies and other stakeholders to more effectively promote anti-littering and affect behavioral change islandwide. Public education and outreach efforts include developing and distributing brochures and other print media, posting messages on websites and social networking media (e.g., Facebook, Twitter, etc.), attending community events, and conducting media advertising.
Trash load reduction credits are available for the following new or enhanced public education and outreach activities implemented by DOT-HWYS.
School and Youth Outreach. Enhanced implementation of outreach programs designed to promote anti‐littering behavior in school‐age children (K through 12) will result in a trash load reduction credit of 2 percent.
Community Outreach. Enhanced community outreach in high priority communities where trash is prevalent will result in a trash load reduction credit of 2 percent.
Advertising Campaigns. Participation in advertising campaigns (e.g., print advertising and PSAs) on trash issues will result in trash load reduction credit of 3 percent.
Media Relations. Participation in a media relations campaign (e.g., social media) which focuses on trash issues will result in a trash load reduction credit of 1 percent.
All public education and outreach control measures may include an evaluation assessment (e.g., teacher or student survey) to determine the trash reduction effectiveness.
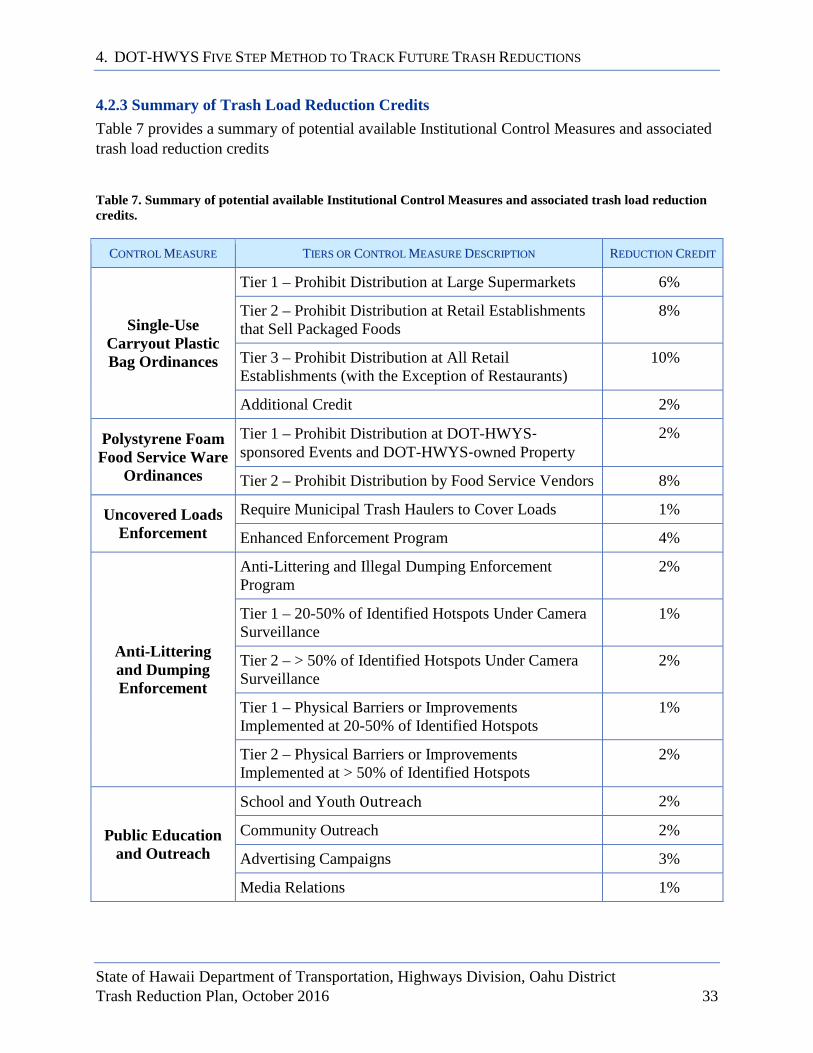
4. DOT-HWYS FIVE STEP METHOD TO TRACK FUTURE TRASH REDUCTIONS
State of Hawaii Department of Transportation, Highways Division, Oahu District Trash Reduction Plan, October 2016 33
4.2.3 Summary of Trash Load Reduction Credits Table 7 provides a summary of potential available Institutional Control Measures and associated trash load reduction credits
Table 7. Summary of potential available Institutional Control Measures and associated trash load reduction credits.
CCOONNTTRROOLL MMEEAASSUURREE TTIIEERRSS OORR CCOONNTTRROOLL MMEEAASSUURREE DDEESSCCRRIIPPTTIIOONN RREEDDUUCCTTIIOONN CCRREEDDIITT
Single-Use Carryout Plastic Bag Ordinances
Tier 1 – Prohibit Distribution at Large Supermarkets 6%
Tier 2 – Prohibit Distribution at Retail Establishments that Sell Packaged Foods
8%
Tier 3 – Prohibit Distribution at All Retail Establishments (with the Exception of Restaurants)
10%
Additional Credit 2%
Polystyrene Foam Food Service Ware
Ordinances
Tier 1 – Prohibit Distribution at DOT-HWYS‐ sponsored Events and DOT-HWYS‐owned Property
2%
Tier 2 – Prohibit Distribution by Food Service Vendors 8%
Uncovered Loads Enforcement
Require Municipal Trash Haulers to Cover Loads 1%
Enhanced Enforcement Program 4%
Anti-Littering and Dumping Enforcement
Anti-Littering and Illegal Dumping Enforcement Program
2%
Tier 1 – 20-50% of Identified Hotspots Under Camera Surveillance
1%
Tier 2 – > 50% of Identified Hotspots Under Camera Surveillance
2%
Tier 1 – Physical Barriers or Improvements Implemented at 20-50% of Identified Hotspots
1%
Tier 2 – Physical Barriers or Improvements Implemented at > 50% of Identified Hotspots
2%
Public Education and Outreach
School and Youth Outreach 2%
Community Outreach 2%
Advertising Campaigns 3%
Media Relations 1%
4. DOT-HWYS FIVE STEP METHOD TO TRACK FUTURE TRASH REDUCTIONS
State of Hawaii Department of Transportation, Highways Division, Oahu District Trash Reduction Plan, October 2016 34
4.3 Step 2 – Land-Based Interception Control Measures Once trash enters the environment, it may be intercepted and removed through area-specific, land-based control measures prior to reaching the MS4. Trash load reduction formulas (RF) were adapted for the following land-based control measures:
RF‐1 Land-Based Trash Cleanups RF‐2 Enhanced Street Sweeping Since land-based trash cleanups effect the amount of trash available to street sweepers, load reductions associated with their implementation will be quantified first, followed by street sweeping enhancements.
The street load will be reduced by the implementation of enhanced land-based control measures, and remaining trash may contribute to the MS4 load. The MS4 load is the volume of trash estimated to enter the MS4, if not intercepted via the MS4 control measures described in Section 4.4 (Step 3).
4.3.1 Land-Based Trash Cleanups DOT-HWYS may benefit from the following land-based trash cleanup programs:
• Enhanced DOT-HWYS Land-Based Cleanups DOT-HWYS may enhance land-based cleanup activities through the implementation of the proposed Trash Removal and Prevention Program (TRAPP), or enhance existing programs. The proposed TRAPP would remove trash that accumulates along highways and areas where street sweeping is not feasible.
• Enhanced Volunteer Land-Based Cleanups DOT-HWYS may enhance the Adopt-A-Highway Program through the adoption of new highway segments and/or increasing the frequency of volunteer trash removal activities.
Ongoing land-based cleanup activities conducted prior to the baseline year 2013 and continued through current Permit’s term are assumed to be accounted for in the trash baseline load, and cannot be used to demonstrate progress towards trash load reduction goals.
The trash load reduction formulas used to calculate trash load reductions that result from the implementation or enhancement of the land-based control measures are described below.
4.3.1.1 Land-Based Cleanups Trash Load Reduction Formula Based on a review of available data and information gained through literature reviews, the trash load reduction formulas (RF) will provide DOT-HWYS with a method to estimate the volume of trash annually removed from all applicable land-based cleanup activities conducted in a given year. The trash removed from these land-based cleanups are tracked as a volume, as opposed to mass; and only trash with the potential to enter the MS4 should be counted towards load reductions.

4. DOT-HWYS FIVE STEP METHOD TO TRACK FUTURE TRASH REDUCTIONS
State of Hawaii Department of Transportation, Highways Division, Oahu District Trash Reduction Plan, October 2016 35
The load reduction variable is signified as ReductionCleanups in the following RF-1 formulas:
ReductionCleanups = EnhancedCleanups – BaselineCleanups
where: EnhancedCleanups = Volume of trash removed (cy) from all applicable land-based
cleanup activities in year of interest. BaselineCleanups = Annual average volume of trash removed (cy) from all applicable
land-based cleanup activities in years prior to the baseline year 2013.
and
EnhancedCleanups = StateEnhancedVol + VolunteerEnhancedVol
BaselineCleanups = StateBaselineVol + VolunteerBaselineVol where:
StateEnhancedVol = Total volume of trash removed (cy) by DOT-HWYS land-based cleanups in year of interest.
VolunteerEnhancedVol = Total volume of trash removed (cy) by volunteer land-based cleanups in year of interest.
StateBaselineVol = Total volume of trash removed (cy) by DOT-HWYS land-based cleanups in years prior to the baseline year 2013.
VolunteerBaselineVol = Total volume of trash removed (cy) by volunteer land-based cleanups in years prior to the baseline year 2013.
4.3.2 Street Sweeping Street sweeping is implemented by DOT-HWYS to remove trash and debris collected on the highway, which may contribute to unsafe conditions and/or reductions in the capacity of the MS4.
Trash removal effectiveness of street sweeping may be directly affected by sweeper operation (e.g., speed of operation), and sweeping frequency. Additionally, rainfall storm events can reduce the effectiveness of a street sweeper’s ability to capture trash (Sartor et al. 1974, Sartor and Gaboury 1984, Walker and Wong 1999, Armitage 2001). Literature review concludes that the street sweeper type (e.g., mechanical broom or vacuum assisted) does not influence trash removal efficiency (BASMAA 2011). Therefore, changes in sweeper type are not considered as an applicable trash control measure enhancement.
• Enhanced Street Sweeping DOT-HWYS may enhance the street sweeping program through an increase in street sweeping frequency.
The trash load reduction formulas used to calculate trash load reductions that results from the increased frequency of street sweeping activities are described as follows.
(RF-1)
(RF-1)
(RF-1)

4. DOT-HWYS FIVE STEP METHOD TO TRACK FUTURE TRASH REDUCTIONS
State of Hawaii Department of Transportation, Highways Division, Oahu District Trash Reduction Plan, October 2016 36
4.3.2.1 Street Sweeping Trash Load Reduction Formula Based on a review of available data and information gained through literature reviews, the trash load reduction formulas (RF) will allow DOT-HWYS to estimate the volume of trash annually removed from street sweeping conducted in a given year. The trash removed from street sweeping is tracked as a volume, as opposed to mass.
The load reduction variable is signified as ReductionSweep in the following RF-2 formulas:
ReductionSweep = EnhancedSweep – BaselineSweep
where: EnhancedSweep = Volume of trash removed (cy) due to enhanced street sweeping in
a year of interest. BaselineSweep = Annual average volume of trash removed (cy) from all applicable
street sweeping activities in years prior to the baseline year 2013. and
EnhancedSweep = HWYSSweep • ηSweepEnhanced
BaselineSweep = HWYSSweep • ηSweepBaseline
where: HWYSSweep = Total miles swept by DOT-HWYS.
ηSweepEnhanced = Trash removal efficiency of enhanced street sweeping (cy/mi) during the year of interest.
ηSweepBaseline = Trash removal efficiency of street sweeping (cy/mi) in years prior to the baseline year 2013.
4.4 Step 3 – MS4 Interception Control Measures Once trash enters the MS4, it may be intercepted and removed through the area-specific control measures prior to entering State waterbodies. Trash load reduction formulas (RF) were adapted for the following MS4 interception control measures:
RF‐3 Enhanced MS4 Inspection and Cleaning RF‐4a Partial Trash Capture Device Installation RF‐4b Storm Water Pump Station Enhancements RF‐5 Full Trash Capture Device Installation
The MS4 load will be reduced by the implementation of enhanced MS4 control measures, and the remaining trash may contribute to the waterbody load. The waterbody load is the volume of trash estimated to enter the waterbody, if not intercepted via waterbody interception control measures described in Section 4.5 (Step 4).
(RF-2)
(RF-2)
(RF-2)
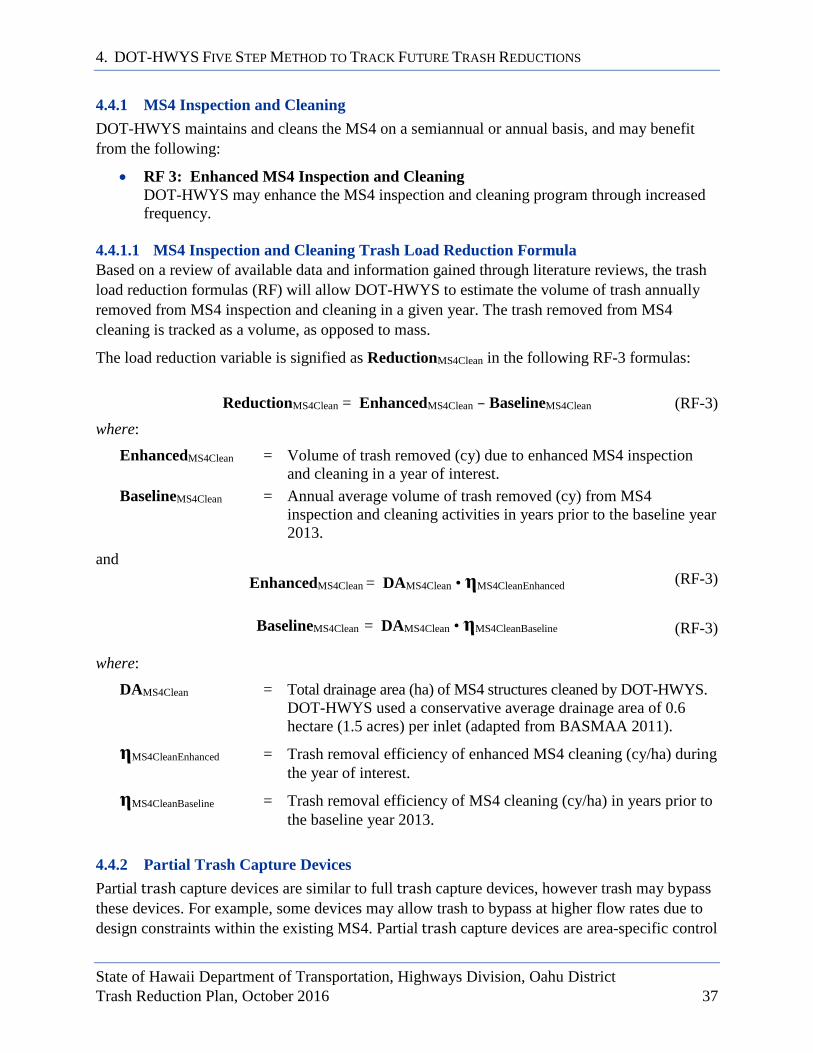
4. DOT-HWYS FIVE STEP METHOD TO TRACK FUTURE TRASH REDUCTIONS
State of Hawaii Department of Transportation, Highways Division, Oahu District Trash Reduction Plan, October 2016 37
4.4.1 MS4 Inspection and Cleaning DOT-HWYS maintains and cleans the MS4 on a semiannual or annual basis, and may benefit from the following:
• RF 3: Enhanced MS4 Inspection and Cleaning DOT-HWYS may enhance the MS4 inspection and cleaning program through increased frequency.
4.4.1.1 MS4 Inspection and Cleaning Trash Load Reduction Formula Based on a review of available data and information gained through literature reviews, the trash load reduction formulas (RF) will allow DOT-HWYS to estimate the volume of trash annually removed from MS4 inspection and cleaning in a given year. The trash removed from MS4 cleaning is tracked as a volume, as opposed to mass.
The load reduction variable is signified as ReductionMS4Clean in the following RF-3 formulas:
ReductionMS4Clean = EnhancedMS4Clean – BaselineMS4Clean
where:
EnhancedMS4Clean = Volume of trash removed (cy) due to enhanced MS4 inspection and cleaning in a year of interest.
BaselineMS4Clean = Annual average volume of trash removed (cy) from MS4 inspection and cleaning activities in years prior to the baseline year 2013.
and EnhancedMS4Clean = DAMS4Clean • ηMS4CleanEnhanced
BaselineMS4Clean = DAMS4Clean • ηMS4CleanBaseline
where:
DAMS4Clean = Total drainage area (ha) of MS4 structures cleaned by DOT-HWYS. DOT-HWYS used a conservative average drainage area of 0.6 hectare (1.5 acres) per inlet (adapted from BASMAA 2011).
ηMS4CleanEnhanced = Trash removal efficiency of enhanced MS4 cleaning (cy/ha) during the year of interest.
ηMS4CleanBaseline = Trash removal efficiency of MS4 cleaning (cy/ha) in years prior to the baseline year 2013.
4.4.2 Partial Trash Capture Devices Partial trash capture devices are similar to full trash capture devices, however trash may bypass these devices. For example, some devices may allow trash to bypass at higher flow rates due to design constraints within the existing MS4. Partial trash capture devices are area-specific control
(RF-3)
(RF-3)
(RF-3)

4. DOT-HWYS FIVE STEP METHOD TO TRACK FUTURE TRASH REDUCTIONS
State of Hawaii Department of Transportation, Highways Division, Oahu District Trash Reduction Plan, October 2016 38
measures, and may include curb inlet screens (e.g., automated retractable screens) and enhancements to the pump station. DOT-HWYS may benefit from the following:
• RF‐4a: Partial Trash Capture Device Installation
DOT-HWYS may install additional partial trash capture devices that capture trash moving through the MS4.
• RF‐4b: Storm Water Pump Station Enhancements Enhancements to existing pump station structure may increase the effectiveness of trash removal.
4.4.2.1 Partial Trash Capture Devices Trash Load Reduction Formula Based on a review of available data and information gained through literature reviews, the trash reduction formulas (RF) will allow DOT-HWYS to estimate the volume of trash annually removed from all partial trash capture devices in a given year. The trash removed from all partial trash capture devices is tracked as a volume, as opposed to mass
This load reduction variable is signified as ReductionPTCDevices in the following RF-4a formulas:
ReductionPTCDevices = EnhancedPTCDevices
where:
EnhancedPTCDevices = Volume of trash (cy) removed by all partial trash capture devices implemented in a year of interest.
and EnhancedPTCDevices = TAPTCDevices • ηPTCDevicesEnhanced
where:
TAPTCDevices = Total treated area (ha) by all partial trash capture devices in DOT-HWYS jurisdictional area.
ηPTCDevicesEnhanced = Trash removal efficiency (cy/ha) by all partial trash capture devices in year of interest.
4.4.2.2 Punahou Pump Station Trash Load Reduction Formula
ReductionPump= EnhancedPump – BaselinePump
where: EnhancedPump = Volume of trash (cy) removed by pump station in year of interest.
BaselinePump = Annual average volume of trash removed (cy) by pump station in
years prior to the baseline year 2013. and
(RF-4a)
(RF-4a)
(RF-4b)

4. DOT-HWYS FIVE STEP METHOD TO TRACK FUTURE TRASH REDUCTIONS
State of Hawaii Department of Transportation, Highways Division, Oahu District Trash Reduction Plan, October 2016 39
EnhancedPump = TAPump • ηPumpEnhanced
BaselinePump = TAPump • ηPumpBaseline where:
TAPump = Total treated area (ha) by Punahou Station. ηPumpEnhanced = Trash removal efficiency (cy/ha) by Punahou Station in a year of
interest. ηPumpBaseline = Trash removal efficiency (cy/ha) by Punahou Station in years prior
to the baseline year 2013.
4.4.3 Full Trash Capture Devices Full trash capture devices are designed to retain all trash up to their intended design flow. Full trash capture devices are area-specific control measures and may include baffle boxes. DOT-HWYS may benefit from the following:
• RF-5: Full Trash Capture Device Installation DOT-HWYS may install additional full trash capture devices that capture trash moving through the MS4.
4.4.3.1 Full Trash Capture Devices Trash Load Reduction Formula Based on a review of available data and information gained through literature reviews, the trash load reduction formulas (RF) will allow DOT-HWYS to estimate the volume of trash annually removed from all full trash capture devices in a given year. The trash removed from all full trash capture devices is tracked as a volume, as opposed to mass.
This load reduction variable is signified as ReductionFTCDevices in the following RF-5 formulas:
ReductionFTCDevices = EnhancedFTCDevices
where:
EnhancedFTCDevices = Volume of trash (cy) removed by all full trash capture devices implemented in a year of interest
and
EnhancedFTCDevices = TAFTCDevices • ηFTCDevicesEnhanced
where:
TAFTCDevices = Total treated area (ha) by all full trash capture devices in DOT-HWYS jurisdictional area.
ηFTCDevicesEnhanced = Trash removal efficiency (cy/ha) by all full trash capture devices in year of interest.
(RF-4b)
(RF-4b)
(RF-5)
(RF-5)
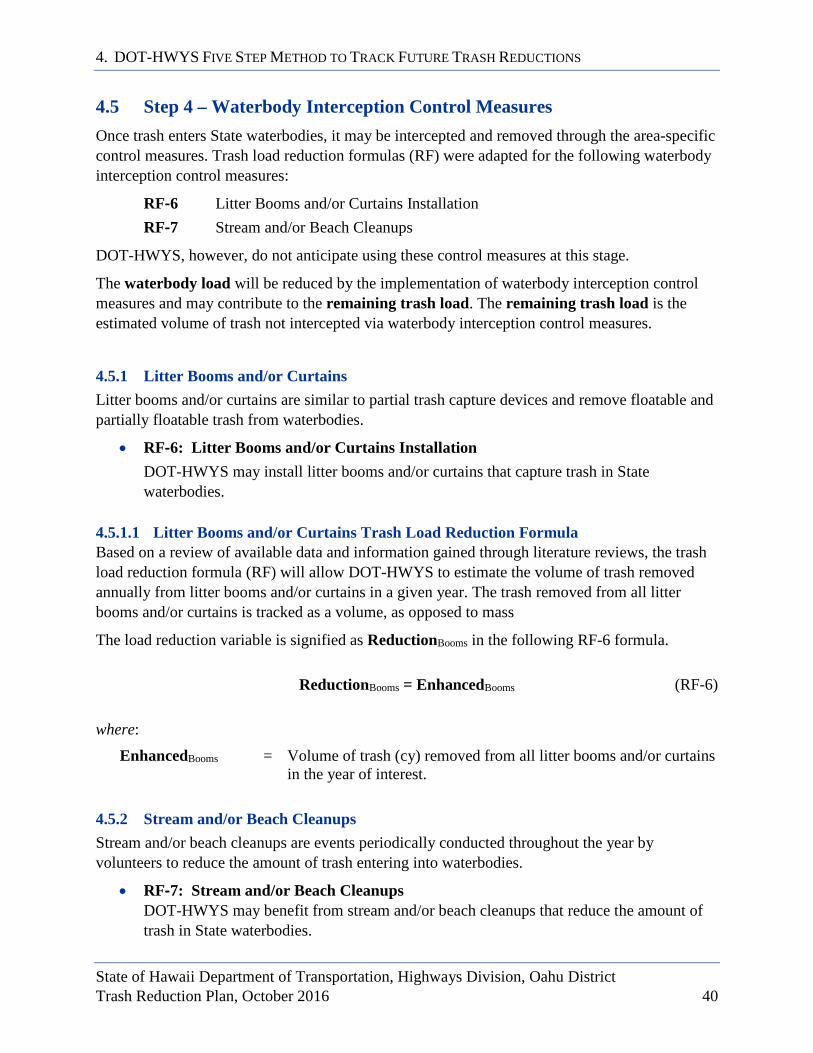
4. DOT-HWYS FIVE STEP METHOD TO TRACK FUTURE TRASH REDUCTIONS
State of Hawaii Department of Transportation, Highways Division, Oahu District Trash Reduction Plan, October 2016 40
4.5 Step 4 – Waterbody Interception Control Measures Once trash enters State waterbodies, it may be intercepted and removed through the area-specific control measures. Trash load reduction formulas (RF) were adapted for the following waterbody interception control measures:
RF‐6 Litter Booms and/or Curtains Installation RF‐7 Stream and/or Beach Cleanups
DOT-HWYS, however, do not anticipate using these control measures at this stage.
The waterbody load will be reduced by the implementation of waterbody interception control measures and may contribute to the remaining trash load. The remaining trash load is the estimated volume of trash not intercepted via waterbody interception control measures.
4.5.1 Litter Booms and/or Curtains Litter booms and/or curtains are similar to partial trash capture devices and remove floatable and partially floatable trash from waterbodies.
• RF‐6: Litter Booms and/or Curtains Installation
DOT-HWYS may install litter booms and/or curtains that capture trash in State waterbodies.
4.5.1.1 Litter Booms and/or Curtains Trash Load Reduction Formula Based on a review of available data and information gained through literature reviews, the trash load reduction formula (RF) will allow DOT-HWYS to estimate the volume of trash removed annually from litter booms and/or curtains in a given year. The trash removed from all litter booms and/or curtains is tracked as a volume, as opposed to mass
The load reduction variable is signified as ReductionBooms in the following RF-6 formula.
ReductionBooms = EnhancedBooms
where:
EnhancedBooms = Volume of trash (cy) removed from all litter booms and/or curtains in the year of interest.
4.5.2 Stream and/or Beach Cleanups Stream and/or beach cleanups are events periodically conducted throughout the year by volunteers to reduce the amount of trash entering into waterbodies.
• RF‐7: Stream and/or Beach Cleanups
DOT-HWYS may benefit from stream and/or beach cleanups that reduce the amount of trash in State waterbodies.
(RF-6)
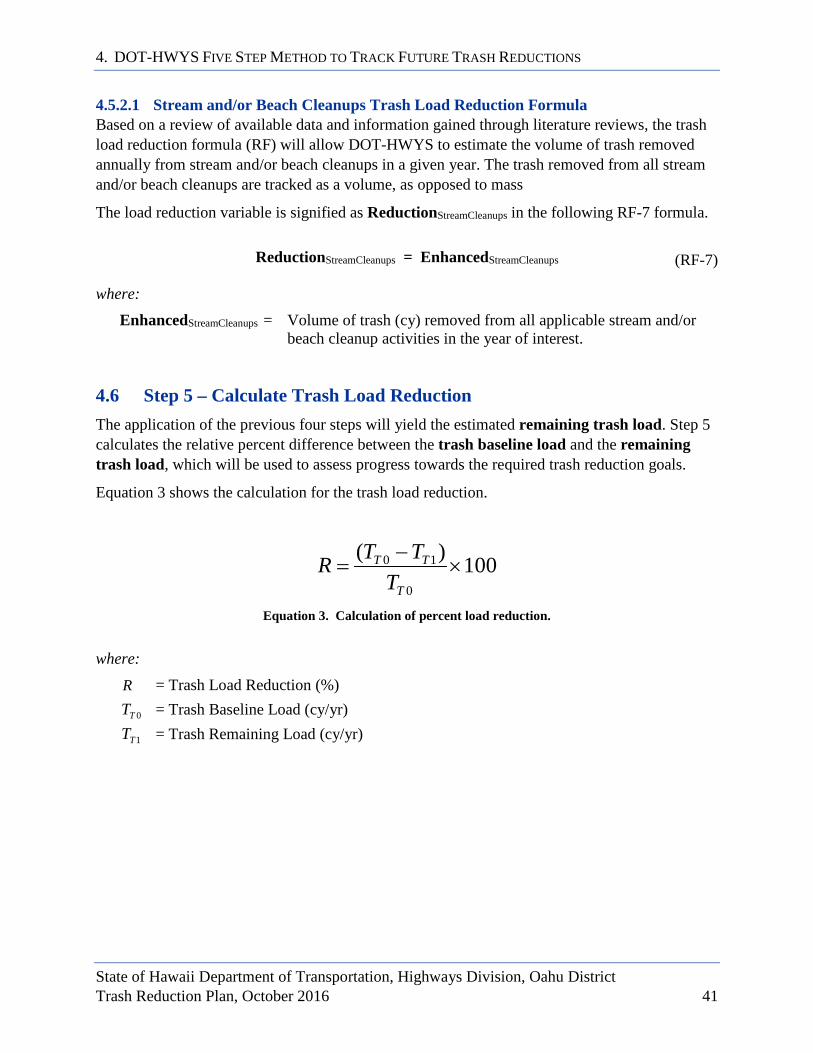
4. DOT-HWYS FIVE STEP METHOD TO TRACK FUTURE TRASH REDUCTIONS
State of Hawaii Department of Transportation, Highways Division, Oahu District Trash Reduction Plan, October 2016 41
4.5.2.1 Stream and/or Beach Cleanups Trash Load Reduction Formula Based on a review of available data and information gained through literature reviews, the trash load reduction formula (RF) will allow DOT-HWYS to estimate the volume of trash removed annually from stream and/or beach cleanups in a given year. The trash removed from all stream and/or beach cleanups are tracked as a volume, as opposed to mass
The load reduction variable is signified as ReductionStreamCleanups in the following RF-7 formula.
ReductionStreamCleanups = EnhancedStreamCleanups
where:
EnhancedStreamCleanups = Volume of trash (cy) removed from all applicable stream and/or beach cleanup activities in the year of interest.
4.6 Step 5 – Calculate Trash Load Reduction The application of the previous four steps will yield the estimated remaining trash load. Step 5 calculates the relative percent difference between the trash baseline load and the remaining trash load, which will be used to assess progress towards the required trash reduction goals.
Equation 3 shows the calculation for the trash load reduction.
100)(
0
10 ×−
=T
TT
TTTR
Equation 3. Calculation of percent load reduction. where:
R = Trash Load Reduction (%)
0TT = Trash Baseline Load (cy/yr)
1TT = Trash Remaining Load (cy/yr)
(RF-7)
4. DOT-HWYS FIVE STEP METHOD TO TRACK FUTURE TRASH REDUCTIONS
State of Hawaii Department of Transportation, Highways Division, Oahu District Trash Reduction Plan, October 2016 42
This page intentionally left blank.
5. GEOGRAPHICAL TARGETS
State of Hawaii Department of Transportation, Highways Division, Oahu District Trash Reduction Plan, October 2016 43
55.. GGEEOOGGRRAAPPHHIICCAALL TTAARRGGEETTSS DOT-HWYS ROW consists of approximately 250 miles of highways covering 2,031 hectares. The ROW crosses 90 watersheds on Oahu, including all the listed impaired trash waterbodies on the State’s Clean Water Act (CWA) Section 303(d) list (hereinafter EPA Trash Impaired Watersheds). Given the geographical extent of DOT-HWYS ROW and the complexity of the MS4 network, DOT-HWYS conducted a Geographical Targets Analysis to inform the implementation of future control measures and reach the 50% and 100% trash reduction targets in the shortest practicable timeframe.
This section describes the methods used to define and prioritize DOT-HWYS geographical targets. This Geographical Targets Analysis resulted in the following two maps:
• A map with trash management areas representing varying levels of trash accumulation and interception in DOT-HWYS ROW (see Figure 16).
• A map highlighting potential trash accumulation hotspots in DOT-HWYS MS4 network (see Figure 17).
DOT-HWYS will use these maps to visualize trash hotspot areas, and identify locations in the ROW and MS4 network to prioritize and target future control measures.
5.1 Delineation and Prioritization of Trash Management Areas To delineate the trash management areas, DOT-HWYS subdivided the islandwide ROW into six smaller management units, in accordance with the existing moku land subdivision of Oahu. Then, DOT-HWYS quantified the total volume of trash generated in each management area. The volume of trash generated by a trash management area is the sum of trash loads plus trash intercepted by existing control measures within DOT-HWYS jurisdictional area, as shown in Equation 4.
Equation 4. Calculation of trash generated by trash management area. where:
jTG = Trash volume generated (cy/yr) by trash management area j
jTL = Trash load (cy/yr) discharged from the MS4 by trash management area j
jTI = Trash volume intercepted (cy/yr) by trash management area j
jjj TITLTG +=

5. GEOGRAPHICAL TARGETS
State of Hawaii Department of Transportation, Highways Division, Oahu District Trash Reduction Plan, October 2016 44
DOT-HWYS utilized two sources of information to estimate the total volume of both trash loads and trash intercepted by trash management area, as follows:
• Trash loads were calculated by multiplying the total area of each land use type by the trash loading rate using an adaption of Equation 1 (see Section 2.1).
• Historical data collected on trash intercepted over the past three years by existing control measures (see Section 3).
Equation 5 calculates the trash load for each trash management area.
∑=n
iiij ALrTL )(
Equation 5. Calculation of trash baseline load for trash management area. where:
jTL = Trash load discharged from MS4 (cy/yr) in trash management area j i = Total number of land use types in trash management area j
iLr = Average annual trash loading rate (cy/ha-yr) for land use type i Ai = Total area of land use type i (ha) in trash management area j
Equation 6 calculates the volume of trash intercepted by existing control measures for each trash management area.
Equation 6. Calculation of trash intercepted by trash management area. where:
jTI = Trash volume intercepted by trash management area j
OMR = Trash volume intercepted by HWY-OM Litter Removal and Disposal Program
AAHR = Trash volume intercepted by Adopt-A-Highway Program
SSR = Trash volume intercepted by Street Sweeping Program
4MSR = Trash volume intercepted by MS4 Inspection and Cleaning Program
Table 8 summarizes the trash loads and trash intercepted by trash management area.
4MSSSAAHOMj RRRRTI +++=

5. GEOGRAPHICAL TARGETS
State of Hawaii Department of Transportation, Highways Division, Oahu District Trash Reduction Plan, October 2016 45
Table 8. Trash generated in terms of trash loads and trash intercepted by trash management area.
TTRRAASSHH MMAANNAAGGEEMMEENNTT
AARREEAA
TTRRAASSHH LLOOAADD ((CC//YYRR))
TTRRAASSHH IINNTTEERRCCEEPPTTEEDD –– TTII ((CCYY//YYRR))
TTRRAASSHH GGEENNEERRAATTEEDD ((CCYY//YYRR))
TTLL RROOMM RRAAAAHH RRSSSS RRMMSS44 TTGG
Ewa 125 2,496 75 165 18 2,879
Kona 71 6,755 57 112 20 7,015
Koolauloa 8 232 14 4 0 258
Koolaupoko 75 321 40 41 2 479
Waialua 9 224 27 7 0 267
Waianae 9 1,272 20 3 2 1,306
TOTAL 297 11,300 233 332 42 12,204 The trash generated in each trash management area were ranked and assigned a trash level of low, moderate, high, or very as high symbolized by four different colors, to derive the geographical target map shown in Figure 16.
Figure 16. DOT-HWYS total trash generated by trash management area.
5. GEOGRAPHICAL TARGETS
State of Hawaii Department of Transportation, Highways Division, Oahu District Trash Reduction Plan, October 2016 46
Based on total trash volume, this map identifies Ewa, Kona and Waianae trash management areas as geographical targets to focus future institutional and land-based interception control measures.
5.2 MS4 Trash Hotspots Once trash enters the MS4, it may be intercepted with control measures that target trash in the MS4. DOT-HWYS created a map that highlights potential trash hotspots in the MS4 network to inform the allocation of future MS4 interception control measures. DOT-HWYS used historical cleaning data from the MS4 Inspection and Cleaning Program, and the locations of the EPA Trash Impaired Watersheds (CWA Section 303(d) list), to identify areas to prioritize and target with Permanent BMPs or MS4 cleaning.
The MS4 trash cleaning records were standardized into annual trash accumulation rates per inlet. These annual trash accumulation rates by inlet were then interpolated in GIS to generate values for the entire MS4 network. These annual trash accumulation rates were assigned a level of low, moderate, high, or very high and symbolized by four different colors as illustrated in Figure 17.
5.3 Findings The trash management area and MS4 hotspot maps will guide DOT-HWYS selection and implementation of future control measures to most effectively intercept and reduce trash in the ROW. This Geographical Target Analysis reveals that Ewa, Kona, and Koolaupoko trash management areas, which also include most EPA Trash Impaired Watersheds, are priority targets for future trash control measures. These areas correspond to central, south, and southeast Oahu and are the most densely populated areas on Oahu.

5. GEOGRAPHICAL TARGETS
State of Hawaii Department of Transportation, Highways Division, Oahu District Trash Reduction Plan, October 2016 47
Figure 17. MS4 trash hotspots.
5. GEOGRAPHICAL TARGETS
State of Hawaii Department of Transportation, Highways Division, Oahu District Trash Reduction Plan, October 2016 48
This page intentionally left blank.
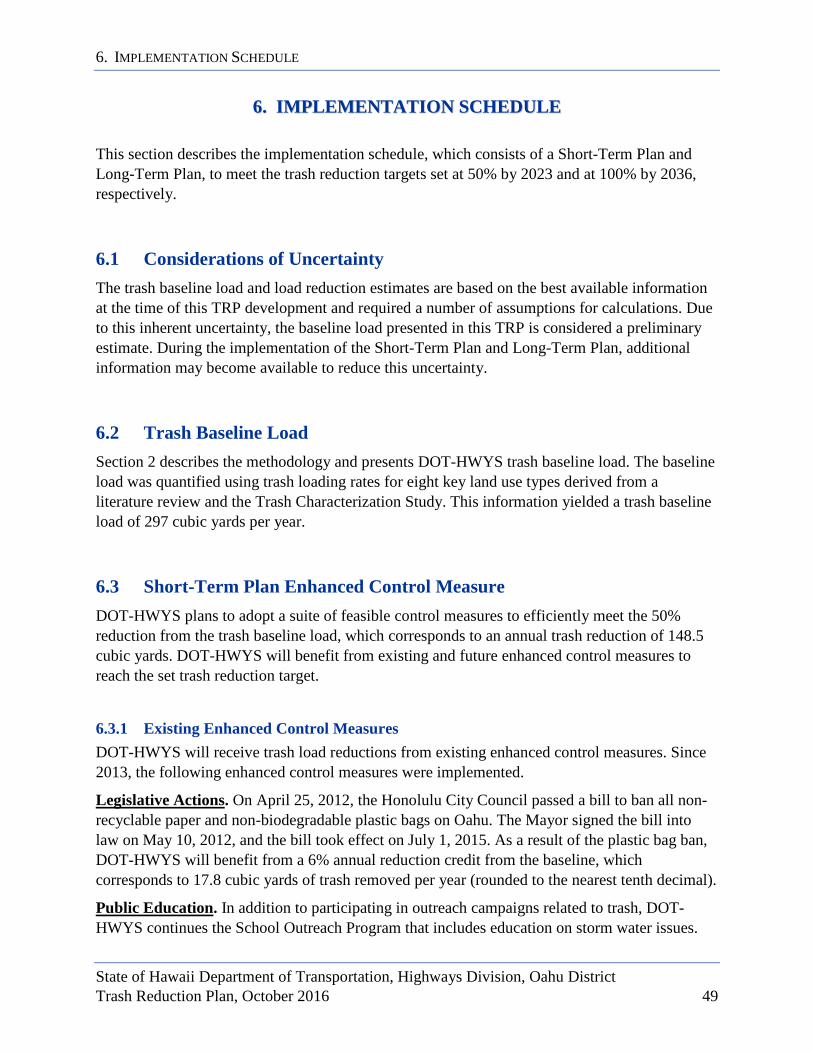
6. IMPLEMENTATION SCHEDULE
State of Hawaii Department of Transportation, Highways Division, Oahu District Trash Reduction Plan, October 2016 49
66.. IIMMPPLLEEMMEENNTTAATTIIOONN SSCCHHEEDDUULLEE This section describes the implementation schedule, which consists of a Short-Term Plan and Long-Term Plan, to meet the trash reduction targets set at 50% by 2023 and at 100% by 2036, respectively.
6.1 Considerations of Uncertainty The trash baseline load and load reduction estimates are based on the best available information at the time of this TRP development and required a number of assumptions for calculations. Due to this inherent uncertainty, the baseline load presented in this TRP is considered a preliminary estimate. During the implementation of the Short-Term Plan and Long-Term Plan, additional information may become available to reduce this uncertainty.
6.2 Trash Baseline Load Section 2 describes the methodology and presents DOT-HWYS trash baseline load. The baseline load was quantified using trash loading rates for eight key land use types derived from a literature review and the Trash Characterization Study. This information yielded a trash baseline load of 297 cubic yards per year.
6.3 Short-Term Plan Enhanced Control Measure DOT-HWYS plans to adopt a suite of feasible control measures to efficiently meet the 50% reduction from the trash baseline load, which corresponds to an annual trash reduction of 148.5 cubic yards. DOT-HWYS will benefit from existing and future enhanced control measures to reach the set trash reduction target.
6.3.1 Existing Enhanced Control Measures DOT-HWYS will receive trash load reductions from existing enhanced control measures. Since 2013, the following enhanced control measures were implemented.
Legislative Actions. On April 25, 2012, the Honolulu City Council passed a bill to ban all non-recyclable paper and non-biodegradable plastic bags on Oahu. The Mayor signed the bill into law on May 10, 2012, and the bill took effect on July 1, 2015. As a result of the plastic bag ban, DOT-HWYS will benefit from a 6% annual reduction credit from the baseline, which corresponds to 17.8 cubic yards of trash removed per year (rounded to the nearest tenth decimal).
Public Education. In addition to participating in outreach campaigns related to trash, DOT-HWYS continues the School Outreach Program that includes education on storm water issues.
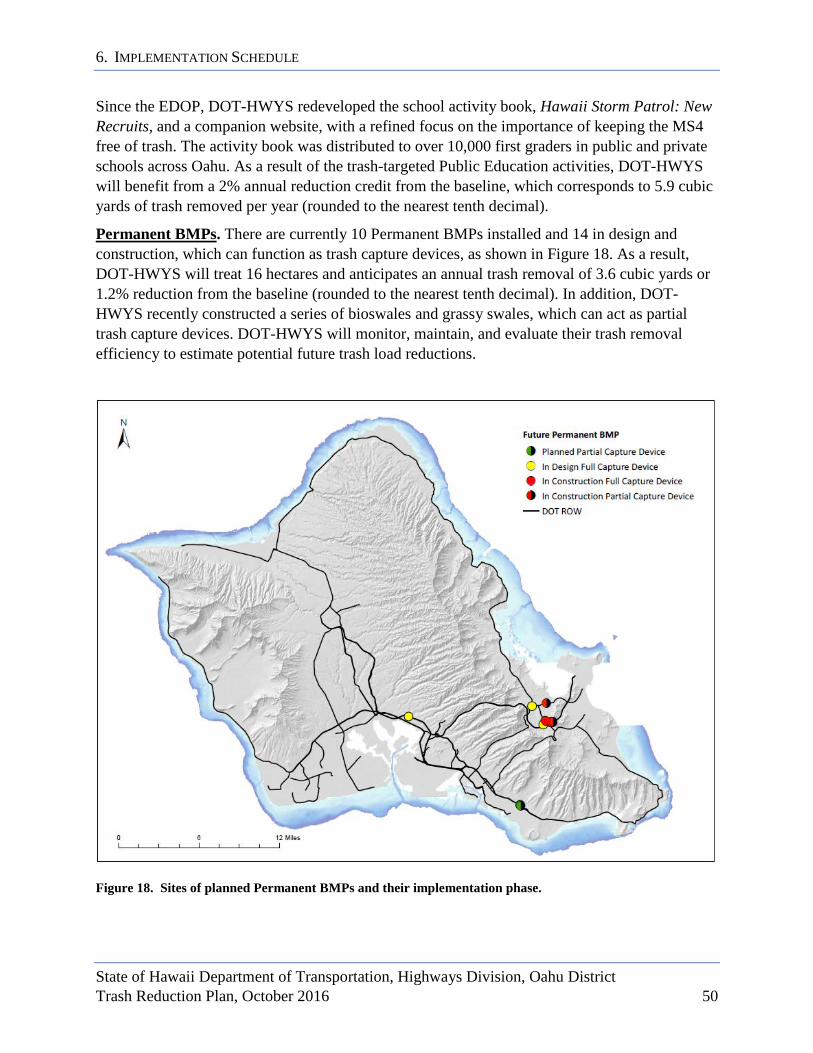
6. IMPLEMENTATION SCHEDULE
State of Hawaii Department of Transportation, Highways Division, Oahu District Trash Reduction Plan, October 2016 50
Since the EDOP, DOT-HWYS redeveloped the school activity book, Hawaii Storm Patrol: New Recruits, and a companion website, with a refined focus on the importance of keeping the MS4 free of trash. The activity book was distributed to over 10,000 first graders in public and private schools across Oahu. As a result of the trash-targeted Public Education activities, DOT-HWYS will benefit from a 2% annual reduction credit from the baseline, which corresponds to 5.9 cubic yards of trash removed per year (rounded to the nearest tenth decimal).
Permanent BMPs. There are currently 10 Permanent BMPs installed and 14 in design and construction, which can function as trash capture devices, as shown in Figure 18. As a result, DOT-HWYS will treat 16 hectares and anticipates an annual trash removal of 3.6 cubic yards or 1.2% reduction from the baseline (rounded to the nearest tenth decimal). In addition, DOT-HWYS recently constructed a series of bioswales and grassy swales, which can act as partial trash capture devices. DOT-HWYS will monitor, maintain, and evaluate their trash removal efficiency to estimate potential future trash load reductions.
Figure 18. Sites of planned Permanent BMPs and their implementation phase.

6. IMPLEMENTATION SCHEDULE
State of Hawaii Department of Transportation, Highways Division, Oahu District Trash Reduction Plan, October 2016 51
Table 9 summarizes trash removed by these existing enhanced control measures, in terms of volume (rounded to the tenth decimal) and percent reduction (rounded to the nearest hundredth decimal).
Table 9. Anticipated annual trash reductions based on existing enhanced control measures.
EEXXIISSTTIINNGG BBMMPP PPRROOGGRRAAMM EENNHHAANNCCEEMMEENNTT TTOOTTAALL AANNTTIICCIIPPAATTEEDD TTRRAASSHH RREEDDUUCCTTIIOONN
CCYY//YYRR PPEERRCCEENNTTAAGGEE
Legislative Action* Plastic Bag Ban 17.8 6.0%
Existing Public Education* Targeted Outreach 5.9 2.0%
Existing Permanent BMPs 16 ha 3.6 1.2%
TOTAL EXISTING ENHANCED REDUCTION 27.3 9.2% * These programs may result in trash load reductions on Oahu; however, reductions are not quantified at this time and therefore considered as a theoretical percent reduction in this TRP (refer to Section 4.2 on Institutional Control Measures).
6.3.2 Future Enhanced Control Measures Enhancement of several control measures are needed for DOT-HWYS to meet a 50% trash load reduction from the baseline. At this stage, several BMPs options are available to meet the stated 50% trash reduction targets.
Public Education. In addition to continuing the existing outreach campaigns related to trash, DOT-HWYS plans to launch a PSA targeting trash reduction islandwide. As a result of the trash targeted advertising campaign, DOT-HWYS will benefit from a 3% annual reduction credit from the baseline, which corresponds to 8.9 cubic yards of trash removed per year (rounded to the nearest tenth decimal).
Land-Based Cleanups. DOT-HWYS will initiate a new program TRAPP to perform extensive land-based cleanups as described in Section 4.3.1. The proposed TRAPP will enhance existing trash removal programs, such as HWY-OM Litter Disposal and Removal Program and the volunteer-based Adopt-A-Highway Program.
The anticipated trash removal by TRAPP was simulated using data-driven models in GIS to guide the Implementation Schedule; and the models utilize assumptions from similar existing programs (i.e., Adopt-A-Highway). TRAPP will target trash reduction along highways and grassy areas in DOT-HWYS jurisdictional area. With TRAPP, DOT-HWYS anticipates a trash removal of 91 cubic yards per year, equivalent to a 30.64% annual reduction from the baseline (rounded to the nearest hundredth decimal). The allocation of Land-Based Cleanups will be determined by the priority trash management areas shown in Figure 16.
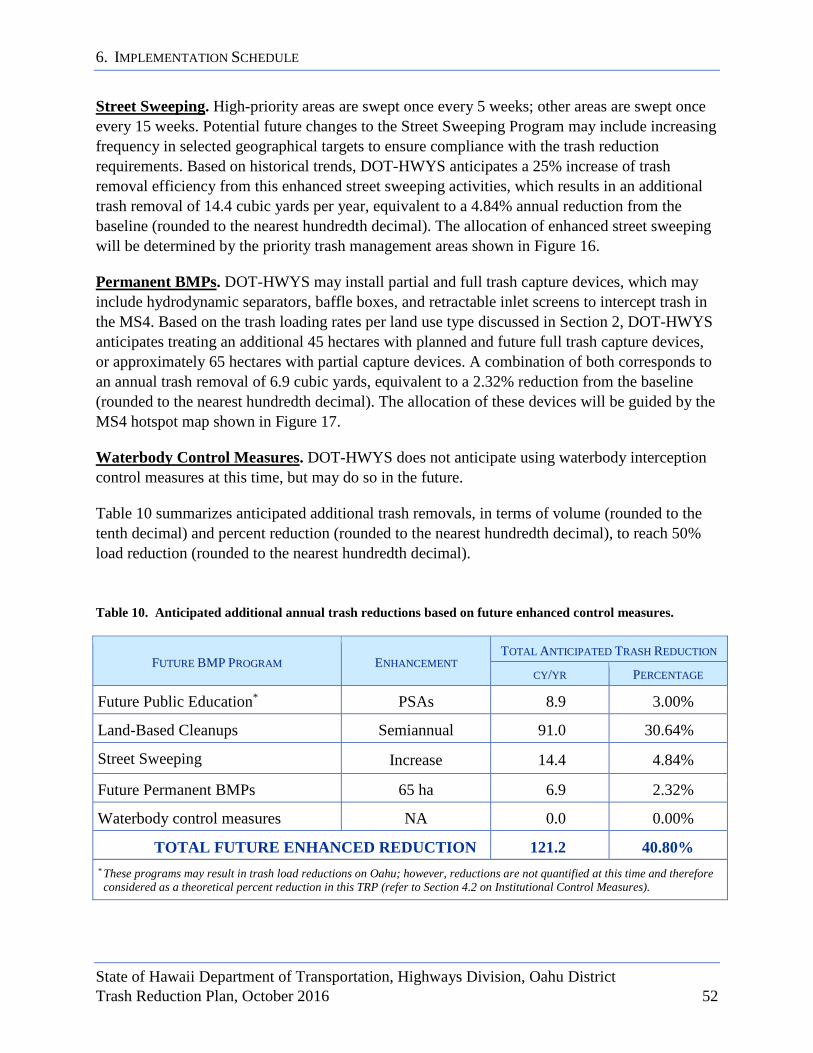
6. IMPLEMENTATION SCHEDULE
State of Hawaii Department of Transportation, Highways Division, Oahu District Trash Reduction Plan, October 2016 52
Street Sweeping. High-priority areas are swept once every 5 weeks; other areas are swept once every 15 weeks. Potential future changes to the Street Sweeping Program may include increasing frequency in selected geographical targets to ensure compliance with the trash reduction requirements. Based on historical trends, DOT-HWYS anticipates a 25% increase of trash removal efficiency from this enhanced street sweeping activities, which results in an additional trash removal of 14.4 cubic yards per year, equivalent to a 4.84% annual reduction from the baseline (rounded to the nearest hundredth decimal). The allocation of enhanced street sweeping will be determined by the priority trash management areas shown in Figure 16.
Permanent BMPs. DOT-HWYS may install partial and full trash capture devices, which may include hydrodynamic separators, baffle boxes, and retractable inlet screens to intercept trash in the MS4. Based on the trash loading rates per land use type discussed in Section 2, DOT-HWYS anticipates treating an additional 45 hectares with planned and future full trash capture devices, or approximately 65 hectares with partial capture devices. A combination of both corresponds to an annual trash removal of 6.9 cubic yards, equivalent to a 2.32% reduction from the baseline (rounded to the nearest hundredth decimal). The allocation of these devices will be guided by the MS4 hotspot map shown in Figure 17.
Waterbody Control Measures. DOT-HWYS does not anticipate using waterbody interception control measures at this time, but may do so in the future.
Table 10 summarizes anticipated additional trash removals, in terms of volume (rounded to the tenth decimal) and percent reduction (rounded to the nearest hundredth decimal), to reach 50% load reduction (rounded to the nearest hundredth decimal).
Table 10. Anticipated additional annual trash reductions based on future enhanced control measures.
FFUUTTUURREE BBMMPP PPRROOGGRRAAMM EENNHHAANNCCEEMMEENNTT TTOOTTAALL AANNTTIICCIIPPAATTEEDD TTRRAASSHH RREEDDUUCCTTIIOONN
CCYY//YYRR PPEERRCCEENNTTAAGGEE
Future Public Education* PSAs 8.9 3.00%
Land-Based Cleanups Semiannual 91.0 30.64%
Street Sweeping Increase 14.4 4.84%
Future Permanent BMPs 65 ha 6.9 2.32%
Waterbody control measures NA 0.0 0.00%
TOTAL FUTURE ENHANCED REDUCTION 121.2 40.80% * These programs may result in trash load reductions on Oahu; however, reductions are not quantified at this time and therefore considered as a theoretical percent reduction in this TRP (refer to Section 4.2 on Institutional Control Measures).
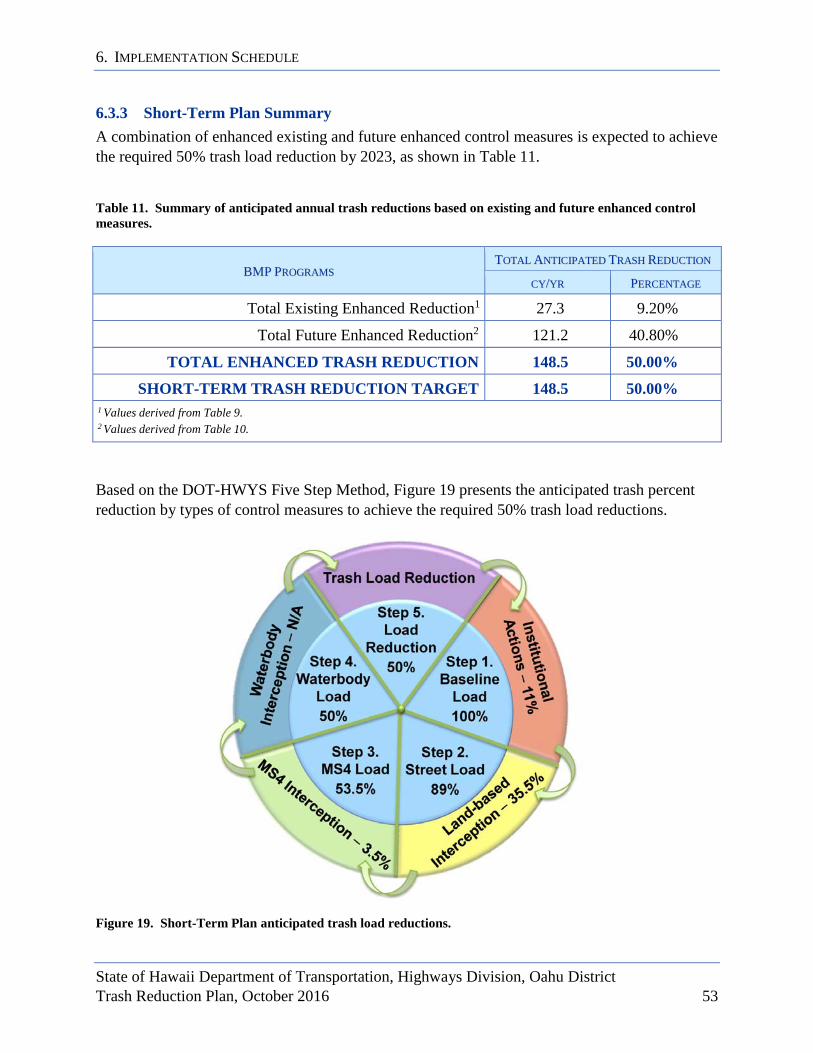
6. IMPLEMENTATION SCHEDULE
State of Hawaii Department of Transportation, Highways Division, Oahu District Trash Reduction Plan, October 2016 53
6.3.3 Short-Term Plan Summary A combination of enhanced existing and future enhanced control measures is expected to achieve the required 50% trash load reduction by 2023, as shown in Table 11.
Table 11. Summary of anticipated annual trash reductions based on existing and future enhanced control measures.
BBMMPP PPRROOGGRRAAMMSS TTOOTTAALL AANNTTIICCIIPPAATTEEDD TTRRAASSHH RREEDDUUCCTTIIOONN
CCYY//YYRR PPEERRCCEENNTTAAGGEE
Total Existing Enhanced Reduction1 27.3 9.20%
Total Future Enhanced Reduction2 121.2 40.80%
TOTAL ENHANCED TRASH REDUCTION 148.5 50.00%
SHORT-TERM TRASH REDUCTION TARGET 148.5 50.00% 1 Values derived from Table 9. 2 Values derived from Table 10.
Based on the DOT-HWYS Five Step Method, Figure 19 presents the anticipated trash percent reduction by types of control measures to achieve the required 50% trash load reductions.
Figure 19. Short-Term Plan anticipated trash load reductions.

6. IMPLEMENTATION SCHEDULE
State of Hawaii Department of Transportation, Highways Division, Oahu District Trash Reduction Plan, October 2016 54
Table 12 combines the existing and future enhanced control measures, and their associated trash removal, in terms of both volume (rounded to the tenth decimal) and percent reduction (rounded to the nearest hundredth decimal), to efficiently reduce the trash baseline load by 50%.
Table 12. Short-Term Plan anticipated trash reductions by BMP Programs.
FFIIVVEE SSTTEEPP MMEETTHHOODD EEXXIISSTTIINNGG AANNDD FFUUTTUURREE BBMMPP PPRROOGGRRAAMM EENNHHAANNCCEEMMEENNTT
AANNTTIICCIIPPAATTEEDD TTRRAASSHH RREEDDUUCCTTIIOONN
CCYY//YYRR PPEERRCCEENNTTAAGGEE
Step 1 Institutional
Actions1
Legislative Action Plastic Bag Ban 17.8 6.00%
Existing Public Education Targeted Outreach 5.9 2.00%
Future Public Education PSAs 8.9 3.00%
Step 2 Land-Based Interception
Land-Based Cleanups Semiannual 91.0 30.64%
Street Sweeping Increase 14.4 4.84%
Step 3 MS4
Interception
Existing Permanent BMPs 16 ha 3.6 1.20%
Future Permanent BMPs 65 ha 6.9 2.32%
Step 4 Waterbody
Interception2 Not Applicable (N/A) N/A 0.0 0.00%
Step 5 Load Reduction TOTAL ANTICIPATED REDUCTION 148.5 50.00%
REDUCTION REQUIRED 148.5 50.00% 1 These programs may result in trash load reductions on Oahu; however, reductions are not quantified at this time and therefore considered as percent reduction in this TRP (refer to Section 4.2 on Institutional Control Measures).
2DOT-HWYS does not anticipate using waterbody interception control measures at this time .
DOT-HWYS may amend or revise the level of enhancement for each BMP as new information becomes available during implementation of the Short-Term Plan (e.g., reduction credits and formulas). If revisions or amendments occur, a revised Short-Term Plan and implementation schedule will be submitted to DOH in the Annual Reports.
6. IMPLEMENTATION SCHEDULE
State of Hawaii Department of Transportation, Highways Division, Oahu District Trash Reduction Plan, October 2016 55
6.4 Long-Term Plan Enhanced Control Measures The Long-Term Plan development will be based on an assessment of data collected during implementation of the Short-Term Plan, to verify the efficiency of enhanced trash control measures and revise key geographical targets. During the Long-Term Plan, DOT-HWYS plans to enhance the successful control measures to meet the 100% trash load reduction from the baseline, which corresponds to an annual trash reduction of 297 cubic yards.
The Long-Term Plan may include these enhanced control measures:
• Consider an ordinance to ban Styrofoam. • Expand the Plastic Bag Ordinance. • Increase school and community outreach related to trash. • Conduct additional outreach and/or inspections of businesses that may exacerbate trash
issues (e.g., fast food restaurants). • Review the street sweeping schedule to enhance the effectiveness of street sweeping. • Install additional full trash capture devices, such as trash skimmers
6.5 Implementation Schedule The TRP provides an implementation schedule to meet the 50% and 100% trash reduction targets in the shortest practicable timeframe.
6.5.1 Short-Term Plan Schedule (2013 – 2023) DOT-HWYS will implement the Short-Term Plan to meet the trash load reduction requirement of 50% from the baseline by 2023, which will allow 7 years to create new programs and significantly alter existing ones.
Implementation of the TRAPP will require approximately three years to mobilize funds and design the pilot program. Upon completion of the pilot program, the TRAPP will be revised and scaled islandwide. Due to the natural variability, a three-year average will be necessary to establish the actual trash removal efficiency of this program.
Concurrently, street sweeping frequency will be increased in selected geographical targets. DOT-HWYS current contract for street sweeping ends in 2018, therefore enhanced street sweeping will not take effect at the islandwide scale until 2019. Similar to the TRAPP, it will require three years to evaluate the actual trash removal efficiency of the enhanced street sweeping program, and whether additional enhancements may be needed.
Lastly, the remaining reduction gap will be addressed by Permanent BMPs. DOT-HWYS anticipates that the design and construction of Permanent BMPs will be completed by the end of
6. IMPLEMENTATION SCHEDULE
State of Hawaii Department of Transportation, Highways Division, Oahu District Trash Reduction Plan, October 2016 56
2023. It will require three years to evaluate the actual trash removal efficiency of the installed Permanent BMPs, and whether additional enhancements may be needed.
6.5.2 Long-Term Plan Schedule (2013 – 2036) DOT-HWYS will implement the Long-Term Plan to meet the trash load reduction requirement of 100% from the baseline by 2036, which will allow an additional 13 years after completion of the Short-Term Plan to create new programs and significantly alter existing ones.
The Long-Term Plan will be developed based on an assessment of data collected during implementation of the Short-Term Plan. For instance, TRAPP implementation frequency may be increased based on the actual trash removal efficiency of this new program, as more data becomes available. In addition to TRAPP, the remaining reduction gap may be addressed by treating more areas with Permanent BMPs.
Due to the natural variability, a three-year average will be necessary to establish the trash removal efficiency of these programs after additional enhancements.
Figure 20 presents the proposed implementation schedule.
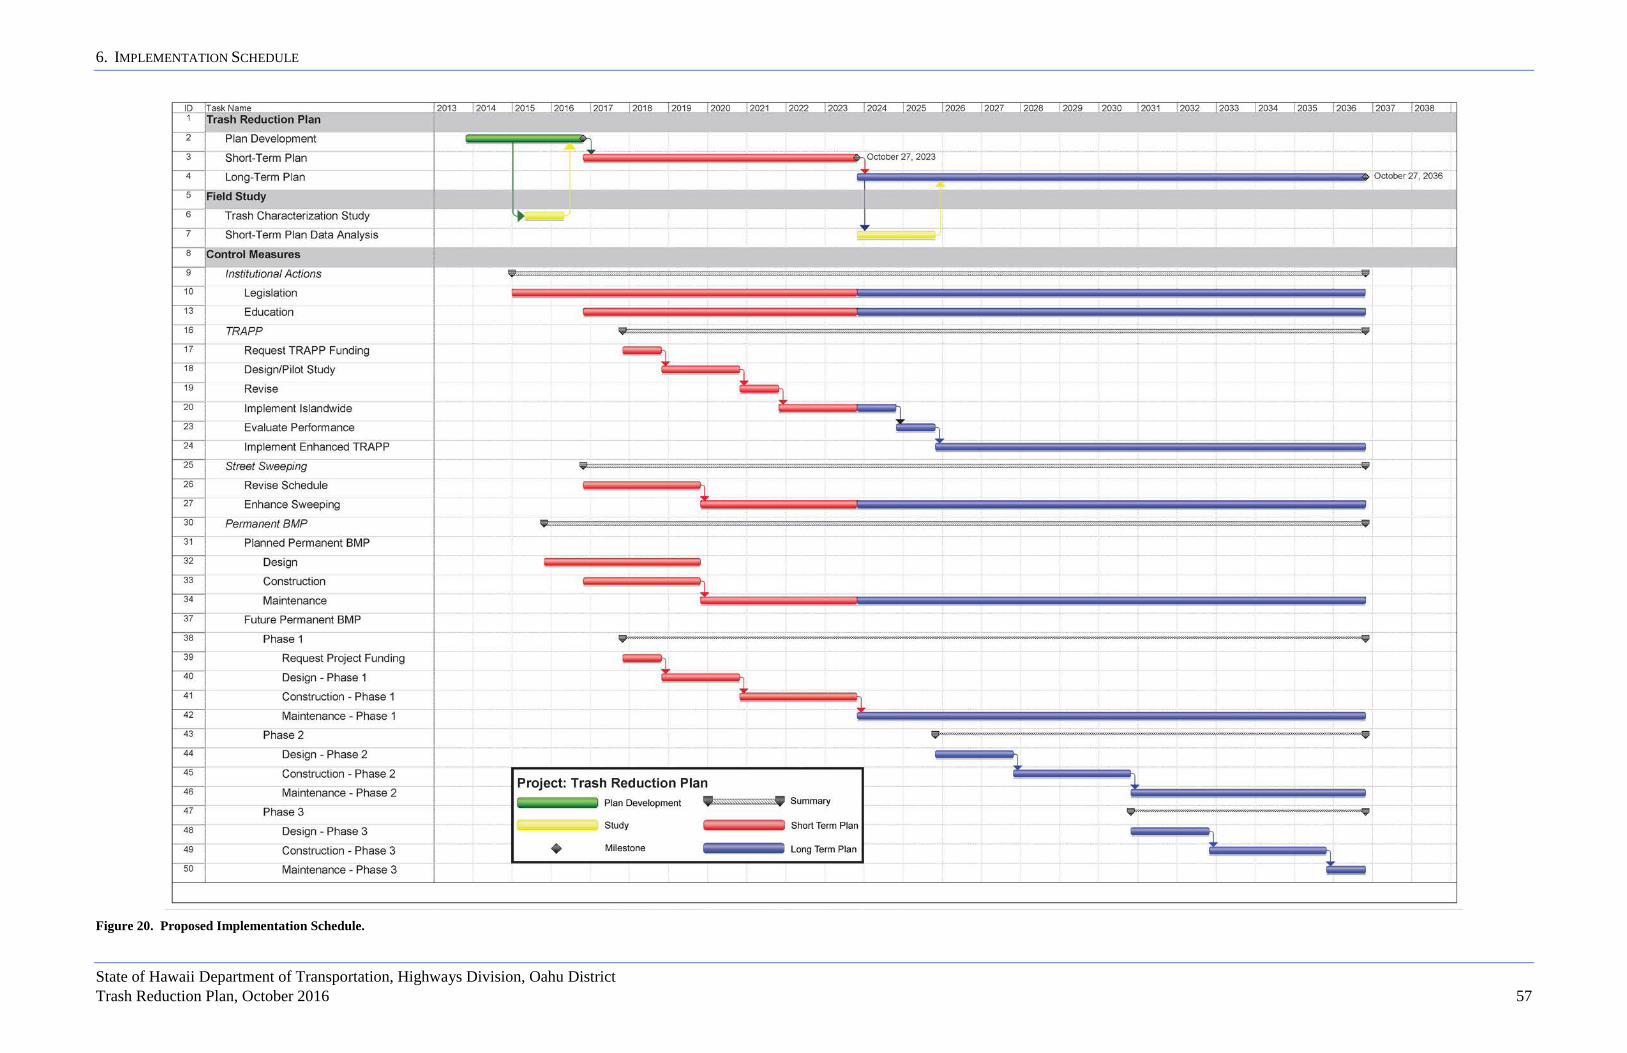
6. IMPLEMENTATION SCHEDULE
State of Hawaii Department of Transportation, Highways Division, Oahu District Trash Reduction Plan, October 2016 57
Figure 20. Proposed Implementation Schedule.

6. IMPLEMENTATION SCHEDULE
State of Hawaii Department of Transportation, Highways Division, Oahu District Trash Reduction Plan, October 2016 58
This page intentionally left blank.
7. TRASH LOAD REDUCTION MONITORING AND REPORTING
State of Hawaii Department of Transportation, Highways Division, Oahu District Trash Reduction Plan, October 2016 59
77.. TTRRAASSHH LLOOAADD RREEDDUUCCTTIIOONN MMOONNIITTOORRIINNGG AANNDD RREEPPOORRTTIINNGG This section describes how DOT-HWYS will monitor and report compliance with required trash reduction goals.
Monitoring trash generation and accumulation in the environment is challenging due to natural variability in sources, transport processes, and deposition in waterbodies. Previous studies showed that the volume of trash discharged from the MS4 is influenced by land use type, population density, existing control measures, and climatic conditions (Marais et al. 2004, BASMAA 2012). For example, there is strong evidence that rainfall in Hawaii is affected by the occurrence of El Niño and La Niña events, which can result in high year-to-year variability (Giambelluca et al. 2012). Due to these inherent challenges, DOT-HWYS intends to demonstrate compliance with trash load reductions based on a three-year running average of trash reduction data.
The TRP tracking and monitoring tools utilize a combination of existing monitoring procedures, as described in the current Storm Water Management Program Plan (SWMPP), and a Visual Trash Rapid Assessment to provide an evaluation of trash conditions and effectiveness of control measures.
7.1 Trash Load Reduction Monitoring Plan DOT-HWYS will monitor trash removal from selected enhanced trash control measures, as described in the proposed Implementation Schedule, to demonstrate compliance with required trash reduction goals, as follows:
• Institutional Actions - Legislative Actions - Public Education and Outreach
• Land-Based Interception Control Measures - Land-Based Cleanups - Street Sweeping
• MS4 Interception Control Measures - Planned Permanent BMPs - Future Permanent BMPs
7. TRASH LOAD REDUCTION MONITORING AND REPORTING
State of Hawaii Department of Transportation, Highways Division, Oahu District Trash Reduction Plan, October 2016 60
7.1.1 Monitoring Institutional Control Measures DOT-HWYS will monitor enhanced institutional control measures that benefit the TRP. For instance, DOT-HWYS will monitor and report on the effectiveness of the existing and enhanced Public Education and Outreach Program, as described in the current SWMPP Appendix B.1 Public Education and Outreach Plan.
7.1.2 Monitoring Land-Based Interception Control Measures DOT-HWYS will track the volume and composition of trash removed by TRAPP. Data will be maintained in a database for future analysis.
DOT-HWYS will monitor trash removal from both existing and enhanced street sweeping, as described in the current SWMPP Chapter 6 Pollution Prevention/Good House Keeping Debris Control BMP Program.
7.1.3 Monitoring MS4 Interception Control Measures DOT-HWYS will monitor trash removal from both planned and future Permanent BMPs as described in the current SWMPP Chapter 6: Pollution Prevention/Good House Keeping Debris Control BMP Program. 7.2 Visual Trash Rapid Assessment In addition to the proposed monitoring plan that quantitatively tracks trash removal from enhanced control measures, DOT-HWYS will adopt a Visual Trash Rapid Assessment (EOA Inc., 2013; Keep America Beautiful, 2013).
This assessment provides qualitative estimates of trash conditions on selected routes and adjacent land areas. This assessment serves the following two purposes:
• Confirmation of trash geographical targets to confirm or redesignate priority geographical targets assigned to specific areas via trash hotspots modeling (see Section 5).
• Assessment of changes in land-based trash conditions to provide a qualitative tool that evaluates changes in trash levels in the environment.
The Visual Trash Rapid Assessment protocol involves the following actions:
1. Identify assessment areas to monitor. The assessment areas should include DOT-HWYS jurisdictional area and adjacent areas where trash has the potential to enter the MS4.
2. Identify trash levels in the assessment area and in the MS4.
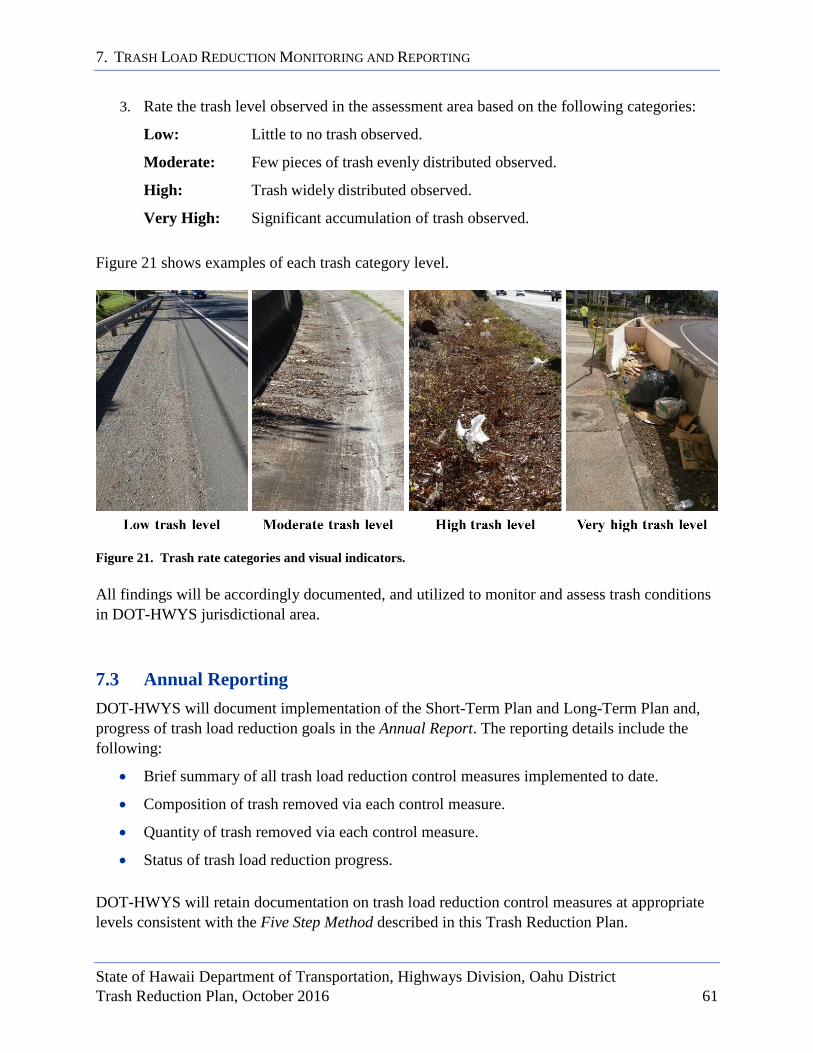
7. TRASH LOAD REDUCTION MONITORING AND REPORTING
State of Hawaii Department of Transportation, Highways Division, Oahu District Trash Reduction Plan, October 2016 61
3. Rate the trash level observed in the assessment area based on the following categories:
Low: Little to no trash observed.
Moderate: Few pieces of trash evenly distributed observed.
High: Trash widely distributed observed.
Very High: Significant accumulation of trash observed.
Figure 21 shows examples of each trash category level.
Figure 21. Trash rate categories and visual indicators. All findings will be accordingly documented, and utilized to monitor and assess trash conditions in DOT-HWYS jurisdictional area.
7.3 Annual Reporting DOT-HWYS will document implementation of the Short-Term Plan and Long-Term Plan and, progress of trash load reduction goals in the Annual Report. The reporting details include the following:
• Brief summary of all trash load reduction control measures implemented to date.
• Composition of trash removed via each control measure.
• Quantity of trash removed via each control measure.
• Status of trash load reduction progress. DOT-HWYS will retain documentation on trash load reduction control measures at appropriate levels consistent with the Five Step Method described in this Trash Reduction Plan.

7. TRASH LOAD REDUCTION MONITORING AND REPORTING
State of Hawaii Department of Transportation, Highways Division, Oahu District Trash Reduction Plan, October 2016 62
This page intentionally left blank.
REFERENCES
State of Hawaii Department of Transportation, Highways Division, Oahu District Trash Reduction Plan, October 2016 63
RREEFFEERREENNCCEESS Armitage, Neil. 2001. The Removal of Urban Litter from Stormwater Drainage Systems. Chapter
19. In L.W. Mays (Ed.) Stormwater Collection Systems Design Handbook. McGraw‐Hill Companies, Inc. ISBN 0‐07‐135471‐9, New York, USA.
Armitage, N. and Rooseboom, A. 1999. The Removal of Urban Litter from Stormwater Conduits and Streams. The quantities involved and catchment litter management options. URL: http://www.wrc.org.za/Knowledge%20Hub%20Documents/Water%20SA%20Journals/Manuscripts/2000/02/WaterSA_2000_02_1283a.pdf.
BASMAA (Bay Area Stormwater Management Agencies Association). 2011. Trash Load Reduction Tracking Method: Technical Memorandum #1 – Literature Review. Prepared by Eisenberg, Olivieri and Associates (EOA). Oakland. URL: http://www.swrcb.ca.gov/rwqcb2/ water_issues/programs/stormwater/MRP/02-2012/BASMAA/TL_ReductionTracking_ Method.pdf
BASMAA. 2012. Preliminary Trash Generation Rates – Technical Memorandum. Prepared by Eisenberg, Olivieri and Associates (EOA). Oakland. URL: http://www.swrcb.ca.gov/rwqcb2/ water_issues/programs/stormwater/MRP/02-2012/BASMAA/Baseline_Trash_Loads.pdf
BASMAA. 2014a. City of San Leandro Trash Long-Term Reduction Plan and Progress Assessment Strategy. URL: http://www.swrcb.ca.gov.
BASMAA. 2014b. City of Sunnyvale Long-Term Trash Load Reduction Plan and Assessment Strategy. URL: http://sunnyvale.ca.gov.
BASMAA. 2014c. Vallejo Sanitation and Flood Control District, Trash Long-Term Reduction Plan and Progress Assessment Strategy.
Berretta, C., S. Saurabh, and J.J. Sansalone. 2011. Quantifying Nutrient Loads Associated With Urban Particulate Matter (PM) and Biogenic/Litter Recovery Through Current MS4 Source Control and Maintenance Practices. Final Report to Florida Stormwater Association Educational Foundation.
Black & Veatch. 2013. Quantification Study of Institutional Measures for Trash TMDL Compliance [PowerPoint]. URL: https://www.casqa.org/asca/demonstrating-trash-tmdl-compliance-using-combination-structural-and-institutional-measures
California Integrated Waste Management Board (CIWMB). 2007. Board Meeting Agenda, Resolution: Agenda Item 14. Sacramento, California. June 12, 2007.
REFERENCES
State of Hawaii Department of Transportation, Highways Division, Oahu District Trash Reduction Plan, October 2016 64
Caltrans. 2003. Drain Inlet Cleaning Efficacy Study, CTSW-RT-03-057.36.1. California Department of Transportation. URL: http://www.dot.ca.gov/hq/env/stormwater/pdf/CTSW-RT-03-057.pdf
Cornelius M., T. Clayton, G. Lewis, G. Arnold, and J. Craig. 1994. Litter Associated with Stormwater Discharge in Auckland City New Zealand. Island Care New Zealand Trust.
County of Los Angeles, Department of Public Works, Watershed Management Division. 2004. Trash Baseline Monitoring Results Los Angeles River and Ballona Creek Watershed. URL: http://dpw.lacounty.gov/wmd/T rashBaseline/Trash%20Monitoring%20rpt.pdf.
County of Los Angeles, Department of Public Works, Environmental Programs Division. 2007. An Overview of Carryout Bags in Los Angeles County: A Staff Report to the Los Angeles County Board of Supervisors. Alhambra, California. URL: http://dpw.lacounty.gov/epd/ PlasticBags/PDF/PlasticBagReport_08‐2007.pdf.
EOA (Eisenberg, Olivieri and Associates), Inc. 2013. Visual On-Land Trash Assessment Protocol for Stormwater. Draft Version 1.0. Oakland, California. URL: http://www.scvurppp-w2k.com/pdfs/1213/Visual_Trash_Assessment_Methodology-DRAFT_050213.pdf.
Giambelluca, T.W., Q. Chen, A.G. Frazier, J.P. Price, Y.-L. Chen, P.-S. Chu, J.K. Eischeid, D.M. Delparte. 2012. Online Rainfall Atlas of Hawaii. Bulletin of the American Meteorological Society, doi: 10.1175/BAMS-D-11-00228.1.
Keep America Beautiful. 2013. Community Appearance Index – Litter Index, KAB Community Training Method.
Marais M., N. Armitage, and Wise C. 2004.The measurements and reduction of urban litter entering stormwater drainage systems: Paper 1 – Quantifying the problem using the City of Cape Town as a case study. Water South Africa, 30(4): 469-482
Sartor, J.D., G. B. Boyd, and F.J. Argardy. 1974. Water pollution aspects of street surface contaminants. Journal Water Pollution Control Federation, 46: 458-467. March 1974.
Sartor, J.D and D.R. Gaboury. 1984. Street sweeping as a water pollution control measure: lessons learned over the past ten years. The Science of the Total Environment, 33: 171-183.
State of Hawaii Department of Transportation, Highways Division, Oahu District. 2013. National Pollutant Discharge Elimination System (NPDES) Municipal Separate Storm Sewer System (MS4) Permit No. HI S000001, effective October 28, 2013, modified April 1, 2016.
REFERENCES
State of Hawaii Department of Transportation, Highways Division, Oahu District Trash Reduction Plan, October 2016 65
State of Hawaii, Department of Transportation, Highways Division, Oahu District. 2015. Storm Water Management Program Plan (April 2015), NPDES MS4 Permit No. HI S000001. Storm Water Management Program, Honolulu, Hawaii.
Hawaii State Department of Transportation, Highways Division, Oahu District. 2015. Storm Water Permanent Best Management Practices Manual (April 2015), NPDES MS4 Permit No. HI S000001. Storm Water Management Program, Honolulu, Hawaii.
Walker, T.A. and T.H.F. Wong. 1999. Effectiveness of Street Sweeping for Stormwater Pollution Control. Technical Report 99/8. Cooperative Research Centre for Catchment Hydrology, Victoria, Australia. December 1999.
USEPA (United States Environmental Protection Agency). 2002. Assessing and Monitoring Floatable Debris. August 2002. URL: http://water.epa.gov/type/oceb/ marinedebris/upload/2006_10_6_oceans_debris_floatingdebris_debris‐final.pdf.