top-down, intelligent reservoir...
TRANSCRIPT
TOP-DOWN, INTELLIGENT
RESERVOIR MODELS
ANALTERNATIVE TO TRADITIONAL
NUMERICAL RESERVOIR SIMULATION AND
MODELING
I N T E L L I G E N T S O L U T I O N S , I N C .
5 5 T A R A P L A C E
M O R G A N T O W N , W V 2 6 0 5 0 U S A
2
T O P - D OW N, I N T E L L I G E N T R E S E RVO I R M O D E L S
AN ALTERNATIVE TO TRADITIONAL RESEROVIR SIMULATION
If the spatio-temporal database that is used for the development of the AI-Based Reservoir Model is constructed from actual field data such as historical production and injection data, well logs, core analysis, well tests and seismic attributes, then the AI-Based Reservoir Model that results from this field-based historical database is called a Top-Down, Intelligent Reservoir Model or Top-Down Model (TDM) for short. The interesting aspect of the Top-Down Model is its complete dependence to the actual field data or minimal impact of interpretation. In TDM the physics of the fluid flow in the reservoir is not modeled using first principal physics, rather it is deduced from the actual field data and production history.
Of course during the development of the spatio-temporal database traditional reservoir engineering are extensively used in order to generate the type of data that would assist the training and history matching of the TDM. Reservoir engineering practices such as calculation of volumetric reserves (on a per well basis), decline curve analysis, well test interpretation, calculation of porosity and water saturation from density and resistivity logs, etc. are to populate the spatio-temporal database.
In this document we discuss a new and completely different approach to modeling, history matching, forecasting and analyzing oil and gas production reservoirs. In this new approach instead of imposing our understanding of the flow mechanism and the production process on the reservoir model, we allow the production history, well log, core analysis, well tests and seismic data to enforce their will on our model and determine its behavior. In other words, by carefully listening to the data from wells and the reservoir we developed a data driven model and history match the production process. The history matched model is used to forecast future production from the field and to assist in planning field development strategies. We use the last several months of production history as blind data to validate the model that is developed.
This is a unique and innovative use of pattern recognition capabilities of artificial intelligence and data mining as a workflow to build a full field reservoir model for forecasting and analysis of oil and gas production from shale formations. Top-Down Modeling technology is an elegant integration of traditional reservoir engineering methods with pattern recognition capabilities of artificial intelligence and data mining. Advantages of this new modeling technology include its flexible data requirement, short development time and ease of development and analysis. Its shortcoming is that it can only be applies to brown fields where reasonable amount of data from the field is accessible. The data requirements for the Top-Down Modeling necessitate a field with about 35 to 40 wells and about 5 years of production history. As number of wells increases, the amount of required production history may be reduced.
Traditional reservoir simulation and modeling is a bottom-up approach. It starts with building a geological model of the reservoir followed by adding engineering fluid flow principles (Diffusivity equation, Darcy’s law, Fick’s law of diffusion …) to arrive at a dynamic reservoir model. The dynamic reservoir model is calibrated using the production history of multiple wells and the history matched model is used to strategize field development in order to improve recovery.
3
Copyright© 2011, Intelligent Solutions, Inc.
Top-Down Modeling approaches the reservoir simulation and modeling from an opposite angle by attempting to build a realization of the reservoir starting with well production behavior (history). The production history is augmented with core, log, well test and seismic data (upon availability of each) in order to increase the accuracy and fine tune the Top-Down Model. The model is then calibrated (history matched) using the most recent wells as blind dataset. Although not intended as a substitute for the traditional reservoir simulation of large, complex fields, this novel approach can be used as an alternative (at a fraction of the cost and time) to traditional numerical reservoir simulation in cases where performing traditional modeling is cost (and man-power) prohibitive. In cases where a conventional model of a reservoir already exists, Top-Down Modeling should be considered a complement to, rather than a competition for the traditional technique. It provides an independent look at the data coming from the reservoir/wells for optimum development strategy and recovery enhancement.
Top-Down Modeling provides a unique perspective of the field and the reservoir using actual measurements. It provides qualitatively accurate reservoir characteristics maps that can play a key role in making important and strategic field development decisions.
TOP-DOWN, INTELLIGENT RE SERVOIR MODELS (TDM)
Traditional reservoir simulation is the industry standard for reservoir management. It is used in all phases of field development in the oil and gas industry. The routine of simulation studies calls for integration of static and dynamic measurements into the reservoir model. It is a bottom-up approach that starts with building a geological (geo-cellular or static) model of the reservoir. Using modeling and geo-statistical manipulation of the data the geo-cellular model is populated with the best available geological, petrophysical and geophysical information. Engineering fluid flow principles are added and solved numerically to arrive at a dynamic reservoir model. The dynamic reservoir model is calibrated using the production history of multiple wells in a process called history matching and the final history matched model is used to strategize the field development in order to improve recovery. Characteristics of the traditional reservoir simulation and modeling include:
It takes a significant investment (time and money) to develop a geological (geo-cellular, static) model to serve as the foundation of the reservoir simulation model.
Development and history matching of a reservoir simulation model is not a trivial process and requires modelers and geoscientists with significant amount of experience.
It is an expensive and time consuming endeavor.
A prolific asset is required in order to justify a significant initial investment that is required for a reservoir simulation model.
Top-Down Intelligent Reservoir Modeling can serve as an alternative or a complement to traditional reservoir simulation and modeling. It starts with well-known reservoir engineering techniques such as Decline Curve Analysis, Type Curve Matching, History Matching using single well numerical reservoir simulation, Volumetric Reserve Estimation and calculation of Recovery Factors for all the wells (individually) in the field.

4
Using statistical techniques multiple Production Indicators (3, 6, and 9 months cumulative production as well as 1, 3, 5, and 10 year cumulative production) are calculated. The reservoir engineering analyses along with the statistical data form the basis for a comprehensive spatio-temporal database. This database represents an extensive set of snap shots of fluid flow in the formation. It is expected that all the characteristics that governs the complexity of fluid flow in the reservoir to be captured in this extensive spatio-temporal database. This large volume of data is processed using the state-of-the-art in artificial intelligence and data mining (neural modeling, genetic optimization and fuzzy pattern recognition) in order to generate a complete and cohesive model of the entire reservoir. This is accomplished by using a set of discrete modeling techniques to generate production related predictive models of well behavior, followed by intelligent models that integrate the discrete models into a cohesive model of the reservoir as a whole, using a continuous fuzzy pattern recognition algorithms.
The Top-Down, Intelligent Reservoir Model is calibrated using the most recent set of wells that have been drilled in the field. The calibrated model is then used for field development strategies to improve and enhance hydrocarbon recovery. Top-Down Models are used in reservoir management workflows using the flowchart that is shown in Figure 1.
Figure 1. Reservoir management workflow using Top-Down Modeling.
Upon completion of the spatio-temporal database, which proves to be one of the most important steps in development of a Top-Down Model (TDM), the process of training and history matching of the TDM is performed simultaneously. It must be noted that a rigorous blind history matching is required in this step of the process to ensure the robustness of the Top-Down Model. Using the design tool that is part of the TDM process, field development strategies are planned and then using the history matched model (in predictive mode) the plans are tested to see if they fulfill the objectives of
5
Copyright© 2011, Intelligent Solutions, Inc.
reservoir management. This process is repeated, iteratively (by planning new wells to be drilled and predicting their performance), until the reservoir management objectives are met. Once the objective is accomplished, the plan is forwarded to operation for implementation. The Top-Down Model, like any other reservoir model, needs to be updated regularly, as shown in the flow chart in Figure 1.
TOP-DOWN MODELS (TDM) – CASE STUDIES
Many papers have been published in recent years that demonstrate the applicability of Top-Down Modeling in building reservoir simulation models for many different types of reservoirs from tight gas formations, to shale plays to sandstone and finally naturally fractured prolific carbonate reservoirs of Gulf of Mexico and the Middle East (Grujic, 2010 – Zargari, 2010 – Khazaeni, 2010 – Kalantari, 2010 and Mohaghegh, 2010).
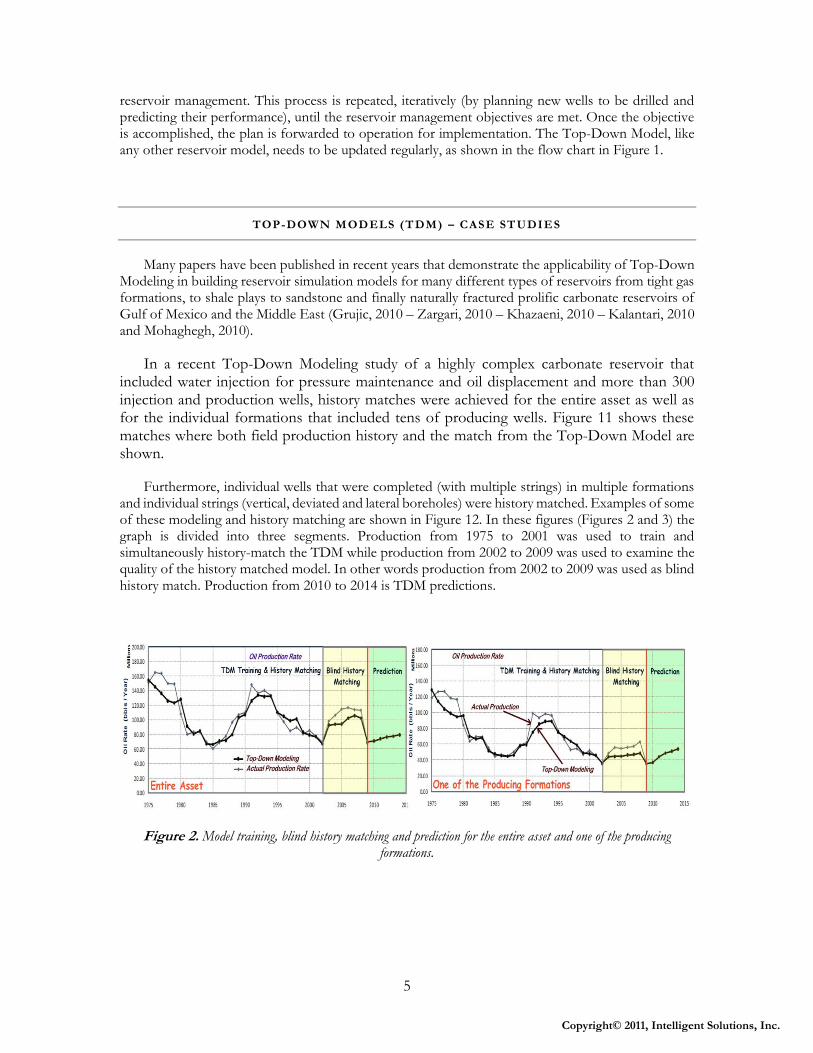
In a recent Top-Down Modeling study of a highly complex carbonate reservoir that included water injection for pressure maintenance and oil displacement and more than 300 injection and production wells, history matches were achieved for the entire asset as well as for the individual formations that included tens of producing wells. Figure 11 shows these matches where both field production history and the match from the Top-Down Model are shown.
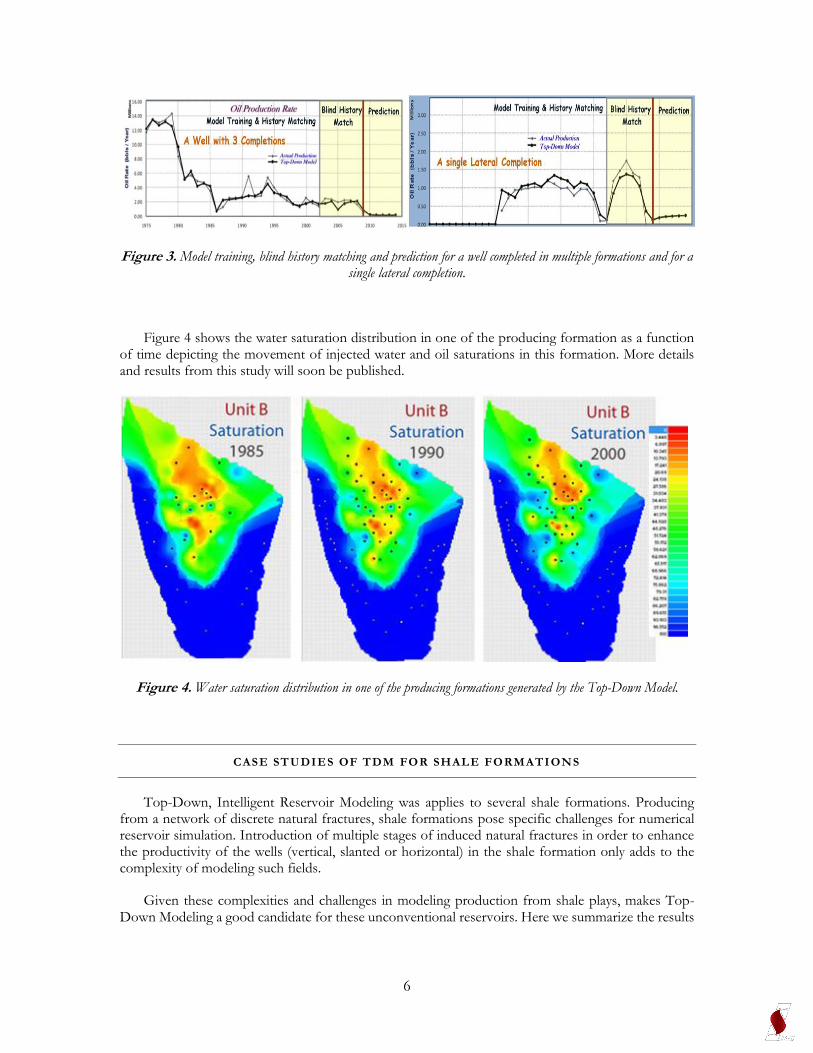
Furthermore, individual wells that were completed (with multiple strings) in multiple formations and individual strings (vertical, deviated and lateral boreholes) were history matched. Examples of some of these modeling and history matching are shown in Figure 12. In these figures (Figures 2 and 3) the graph is divided into three segments. Production from 1975 to 2001 was used to train and simultaneously history-match the TDM while production from 2002 to 2009 was used to examine the quality of the history matched model. In other words production from 2002 to 2009 was used as blind history match. Production from 2010 to 2014 is TDM predictions.
Figure 2. Model training, blind history matching and prediction for the entire asset and one of the producing formations.
6
Figure 3. Model training, blind history matching and prediction for a well completed in multiple formations and for a single lateral completion.
Figure 4 shows the water saturation distribution in one of the producing formation as a function of time depicting the movement of injected water and oil saturations in this formation. More details and results from this study will soon be published.
Figure 4. Water saturation distribution in one of the producing formations generated by the Top-Down Model.
CASE STUDIES OF TDM FOR SHALE FORMATIONS
Top-Down, Intelligent Reservoir Modeling was applies to several shale formations. Producing from a network of discrete natural fractures, shale formations pose specific challenges for numerical reservoir simulation. Introduction of multiple stages of induced natural fractures in order to enhance the productivity of the wells (vertical, slanted or horizontal) in the shale formation only adds to the complexity of modeling such fields.
Given these complexities and challenges in modeling production from shale plays, makes Top-Down Modeling a good candidate for these unconventional reservoirs. Here we summarize the results
7
Copyright© 2011, Intelligent Solutions, Inc.
of Top-Down modeling to two shale formations. Lower Huron is a gas producing while Bakken is oil producing shale reservoir.
APPLICATION OF TOP-DOWN MODELING TO LOWER HURON SHALE
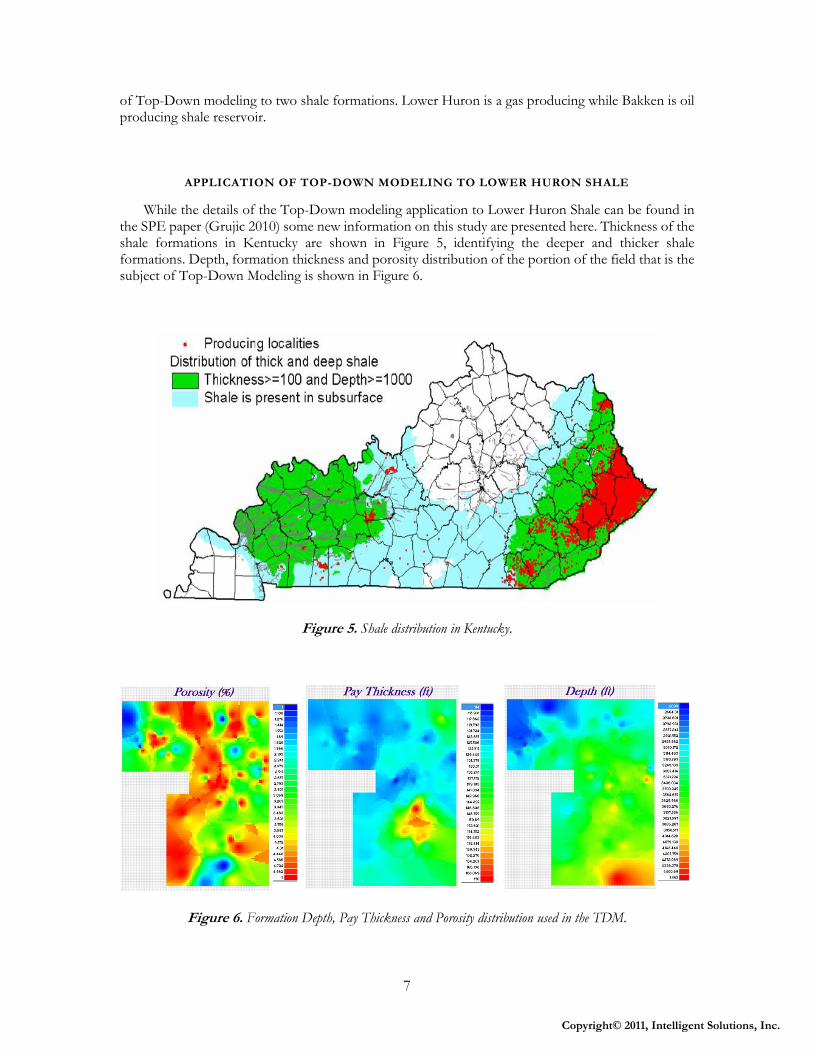
While the details of the Top-Down modeling application to Lower Huron Shale can be found in the SPE paper (Grujic 2010) some new information on this study are presented here. Thickness of the shale formations in Kentucky are shown in Figure 5, identifying the deeper and thicker shale formations. Depth, formation thickness and porosity distribution of the portion of the field that is the subject of Top-Down Modeling is shown in Figure 6.
Figure 5. Shale distribution in Kentucky.
Figure 6. Formation Depth, Pay Thickness and Porosity distribution used in the TDM.

8
Following the flow chart that was presented in Figure 1, the TDM for the Lower Huron is trained and history matched. During the TDM training and history matching part of the production history (usually the tail-end of the production) is removed from the model building process and is used as blind test in order to check the validity of the reservoir model. The quality of the TDM is usually judged based on its capability to predict the part of the production history that has not been used during the reservoir model training.
Figure 7 shows the strategy that was incorporated during the Top-Down Model training, history matching and blind history matching for the Lower Huron Shale. Production history was available for this field from 1982 to 2008. The Top-Down Model was trained and history matched with data from 1982 to 2004 and production history from 2005 to 2008 was left out to be used as validation of the model in the form of blind history matching.
Figure 7. Strategy used during the training and history matching of the Top-Down Model for the Lower Huron Shale.
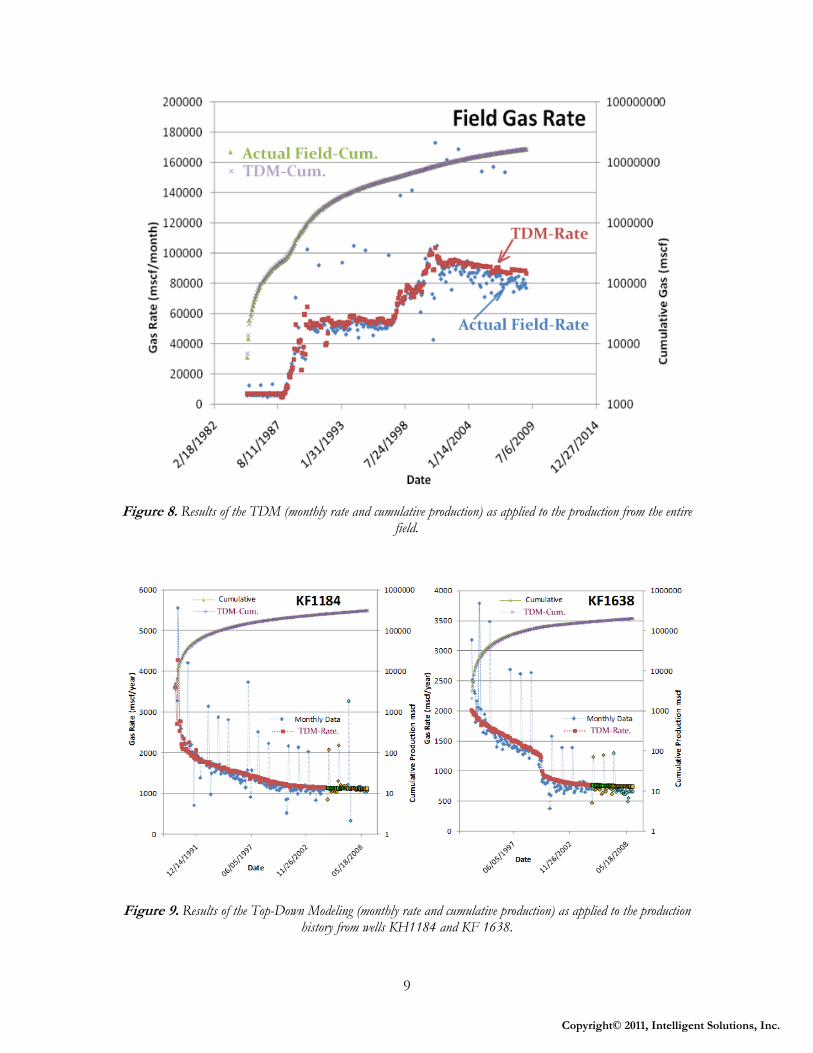
Figure 8 shows the result of training and history matching of the Top-Down Model for Lower Huron shale when applied to the production history of the entire field (this study included a portion of a field with 75 wells). Top-Down Model is built (trained and history matched) on a well by well basis and in order to generate the plot in Figure 8, both production history and TDM results had to be combined for all the wells in the study. In this figure result of TDM is compared with the actual production history from the field in monthly production rate versus time and cumulative field production versus time. To demonstrate the results of TDM on single wells two examples are presented in Figure 9.
This figure shows the results of TDM model training and history matching (blind portion of history matching is shown in different color) for two wells, namely well KF1184 and KF1638. These figures demonstrate the predictive capability of TDM in Lower Huron shale.
9
Copyright© 2011, Intelligent Solutions, Inc.
Figure 8. Results of the TDM (monthly rate and cumulative production) as applied to the production from the entire field.
Figure 9. Results of the Top-Down Modeling (monthly rate and cumulative production) as applied to the production history from wells KH1184 and KF 1638.
10
As demonstrated in the flow chart of Figure 1, TDM includes a design module. The objective of the design module is to assist in performing reservoir management tasks such as identifying which portion of the reservoir has been depleted. By identifying reservoir depletion as a function of time (which is a reflection of pressure draw down in the field) and by cross referencing that with the original hydrocarbon in place, an indication of remaining reserves in the field (as a function of time and well placement) will emerge.
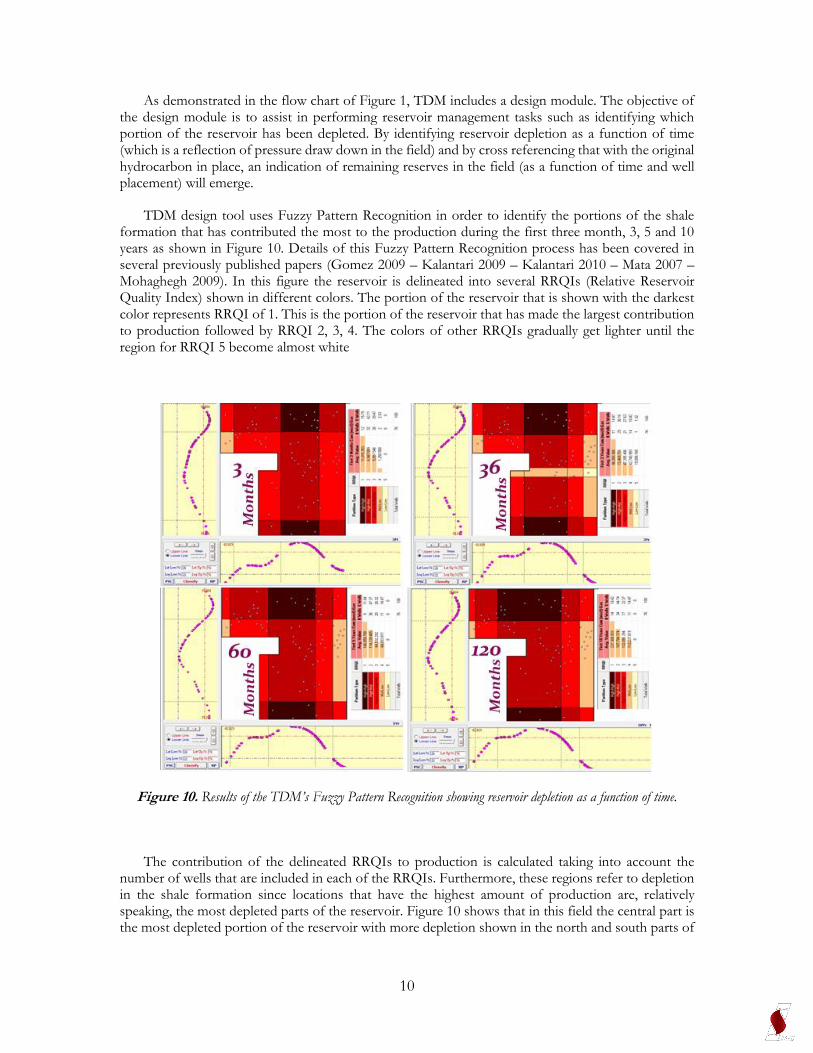
TDM design tool uses Fuzzy Pattern Recognition in order to identify the portions of the shale formation that has contributed the most to the production during the first three month, 3, 5 and 10 years as shown in Figure 10. Details of this Fuzzy Pattern Recognition process has been covered in several previously published papers (Gomez 2009 – Kalantari 2009 – Kalantari 2010 – Mata 2007 – Mohaghegh 2009). In this figure the reservoir is delineated into several RRQIs (Relative Reservoir Quality Index) shown in different colors. The portion of the reservoir that is shown with the darkest color represents RRQI of 1. This is the portion of the reservoir that has made the largest contribution to production followed by RRQI 2, 3, 4. The colors of other RRQIs gradually get lighter until the region for RRQI 5 become almost white
Figure 10. Results of the TDM’s Fuzzy Pattern Recognition showing reservoir depletion as a function of time.
The contribution of the delineated RRQIs to production is calculated taking into account the number of wells that are included in each of the RRQIs. Furthermore, these regions refer to depletion in the shale formation since locations that have the highest amount of production are, relatively speaking, the most depleted parts of the reservoir. Figure 10 shows that in this field the central part is the most depleted portion of the reservoir with more depletion shown in the north and south parts of

11
Copyright© 2011, Intelligent Solutions, Inc.
the field. Furthermore, it shows that as time progresses the most depleted central portion of the reservoir expands toward east and west.
The design tool in the Top-Down Modeling that is powered by Fuzzy Pattern Recognition technology is used to support reservoir management decisions such as identifying infill locations in the field. For instance, in order to calibrate the location of the reservoir quality separator lines in Figure 10 the latest drilled wells in the field (wells drilled in 2008) are removed from the analysis and the reservoir delineations is performed using wells prior to 2008. Then the production indicator for the wells that are drilled in 2008 are compared with the RRQI that they are located in, to find out if the pattern recognition analysis (reservoir delineation into different RRQIs) is valid.
Figure 11. Testing the validity of identified RRQIs in Lower Huron Shale.
This exercise is performed on the first year cumulative production of wells completed in the Lower Huron Shale. Figure 11 shows that the first year cumulative production of wells drilled in RRQI(2) should be between 27.3 and 39.9 MMSCF and the first year cumulative production of wells drilled in RRQI(3) should be between 18.7 and 27.3 MMSCF . The averaged first year cumulative productions of wells drilled in RRQI (2) in 2008 were 33.9 MMSCF while the averaged first year cumulative production of wells drilled in RRQI (3) in 2008 were 22.0 MMSCF, both within the predicted range.
APPLICATION OF TOP-DOWN MODELING TO BAKKEN SHALE
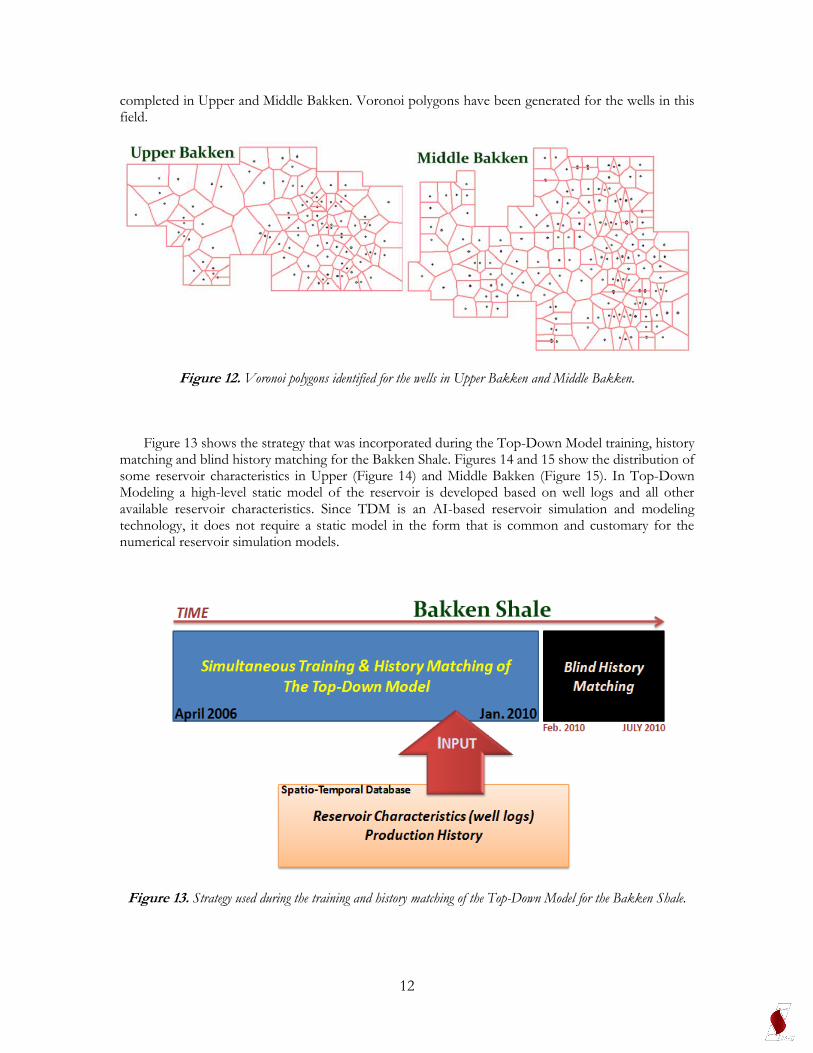
While the details of Top-Down modeling application to Bakken Shale can be found in a recently published SPE paper (Zargari 2010) some new information about this study is presented here. Similar modeling and analyses were performed for both Upper and Middle Bakken. A combination of both of these studies is presented here. Figure 12 shows the portion of the field with wells that have been
12
completed in Upper and Middle Bakken. Voronoi polygons have been generated for the wells in this field.
Figure 12. Voronoi polygons identified for the wells in Upper Bakken and Middle Bakken.
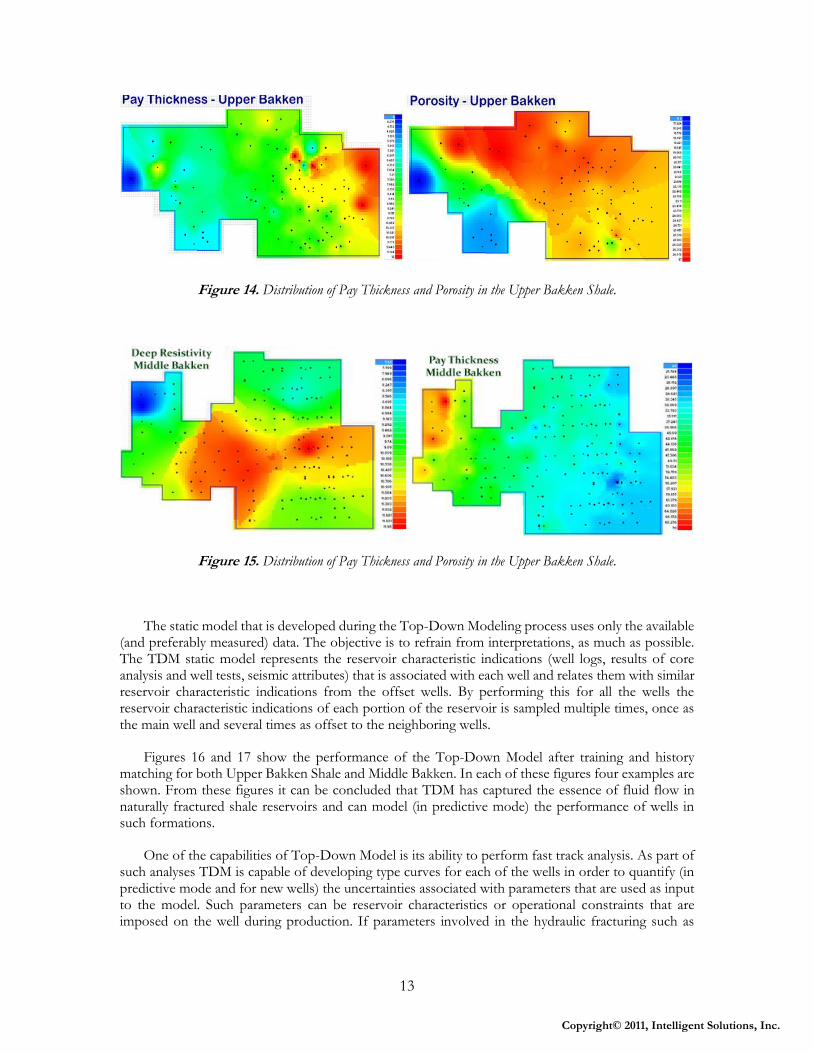
Figure 13 shows the strategy that was incorporated during the Top-Down Model training, history matching and blind history matching for the Bakken Shale. Figures 14 and 15 show the distribution of some reservoir characteristics in Upper (Figure 14) and Middle Bakken (Figure 15). In Top-Down Modeling a high-level static model of the reservoir is developed based on well logs and all other available reservoir characteristics. Since TDM is an AI-based reservoir simulation and modeling technology, it does not require a static model in the form that is common and customary for the numerical reservoir simulation models.
Figure 13. Strategy used during the training and history matching of the Top-Down Model for the Bakken Shale.
13
Copyright© 2011, Intelligent Solutions, Inc.
Figure 14. Distribution of Pay Thickness and Porosity in the Upper Bakken Shale.
Figure 15. Distribution of Pay Thickness and Porosity in the Upper Bakken Shale.
The static model that is developed during the Top-Down Modeling process uses only the available (and preferably measured) data. The objective is to refrain from interpretations, as much as possible. The TDM static model represents the reservoir characteristic indications (well logs, results of core analysis and well tests, seismic attributes) that is associated with each well and relates them with similar reservoir characteristic indications from the offset wells. By performing this for all the wells the reservoir characteristic indications of each portion of the reservoir is sampled multiple times, once as the main well and several times as offset to the neighboring wells.
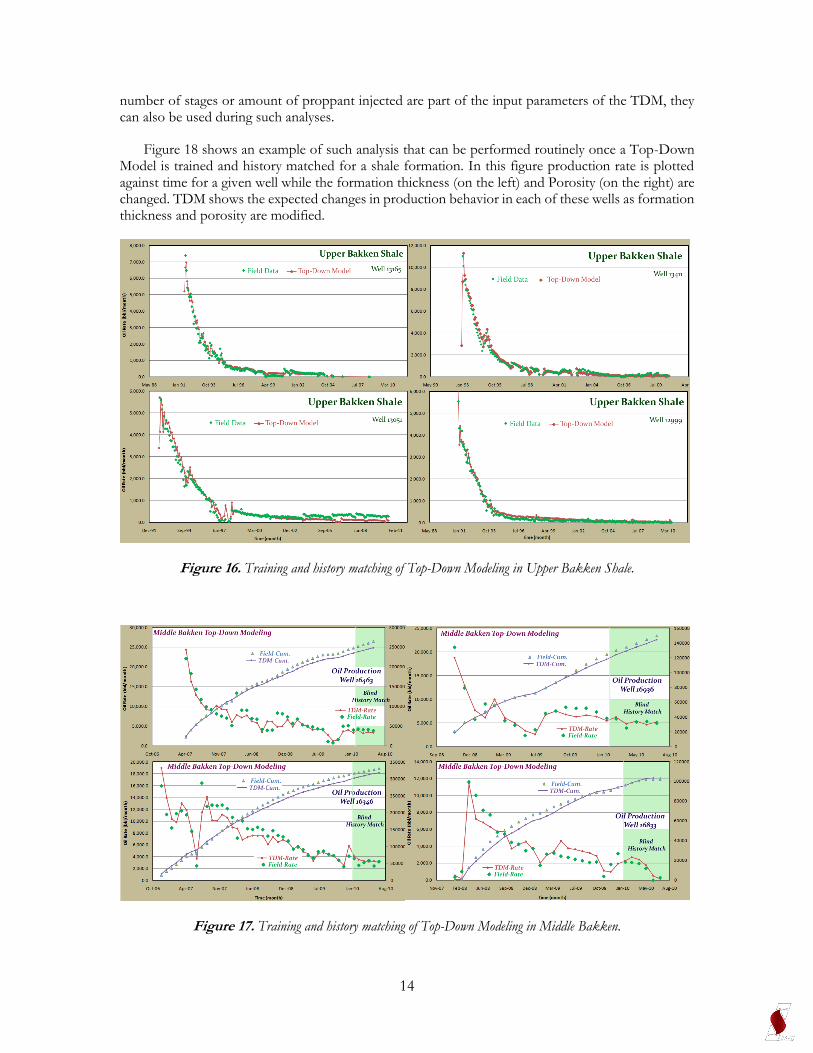
Figures 16 and 17 show the performance of the Top-Down Model after training and history matching for both Upper Bakken Shale and Middle Bakken. In each of these figures four examples are shown. From these figures it can be concluded that TDM has captured the essence of fluid flow in naturally fractured shale reservoirs and can model (in predictive mode) the performance of wells in such formations.
One of the capabilities of Top-Down Model is its ability to perform fast track analysis. As part of such analyses TDM is capable of developing type curves for each of the wells in order to quantify (in predictive mode and for new wells) the uncertainties associated with parameters that are used as input to the model. Such parameters can be reservoir characteristics or operational constraints that are imposed on the well during production. If parameters involved in the hydraulic fracturing such as
14
number of stages or amount of proppant injected are part of the input parameters of the TDM, they can also be used during such analyses.
Figure 18 shows an example of such analysis that can be performed routinely once a Top-Down Model is trained and history matched for a shale formation. In this figure production rate is plotted against time for a given well while the formation thickness (on the left) and Porosity (on the right) are changed. TDM shows the expected changes in production behavior in each of these wells as formation thickness and porosity are modified.
Figure 16. Training and history matching of Top-Down Modeling in Upper Bakken Shale.
Figure 17. Training and history matching of Top-Down Modeling in Middle Bakken.

15
Copyright© 2011, Intelligent Solutions, Inc.
Figure 18. Results of the Top-Down Modeling (monthly rate and cumulative production) as applied to the production history.
Similar to the analysis that was presented for the Lower Huron shale, the TDM design tool can be used in order to analyze the depletion in the shale reservoir and identify the remaining reserves. Figure 19 shows the contribution of different part of Upper Bakken shale to production as a function of time. It can be seen that during the first 3 years of production contribution to production is concentrated on the south-eastern part of the field while as times goes on the south-western and western part of the field starts to contribute more and more until it becomes the dominant contributor to the production by the end of the tenth year of production. As these contributions to the production (depletion) are cross referenced with the original oil in place, a qualitative picture of remaining reserves in the field starts to emerge. Figure 20 shows the remaining reserves in this part of the Upper Bakken Shale as of January of 2010. Maps such as the one shown in Figure 20 can play an important role in reservoir management decisions that are made in Bakken Shale.
Figure 19. Depletion in the Upper Bakken Shale as a function of time using the Fuzzy Pattern Recognition of Top-Down Modeling.

16
Figure 20. Remaining Reserves as of January 2010 in the Upper Bakken Shale.
ADVANTAGES & DISADVA NTAGES OF TOP-DOWN MODELS
Advantages of Top-Down, Intelligent Reservoir Models include relatively short development time, since the complete development cycle of a Top-Down Model is measured in weeks and not years. Needless to say, the complexity of the field being model may increase the development time to several months. Consequently, the resources that are required for the development of an Top-Down Model will be much less than those required for a numerical reservoir simulation model. Another advantage of Top-Down Models is their minimal computational overhead. A Top-Down Model will run on a laptop (or even a handheld) computer (and if the need arises on a smart phone) providing results in seconds and minutes rather than hours and days. This high speed calculation allows for fast track analyses and decision making.
Top-Down Models are organic in nature since they are data dependent. As more data becomes available, the model can be re-trained in order to learn from the new data and to enhance its performance. The field development design tool (that was not discussed in this article) provides a quick view of overall field performance (depletion, remaining reserves …) as a function of time and puts the overall performance of the reservoir in perspective for effective decision making.

17
Copyright© 2011, Intelligent Solutions, Inc.
CONCLUSIONS
Top-Down, Intelligent Reservoir Models use pattern recognition capabilities of Artificial Intelligence & Data Mining (AI&DM) in order to build relationships between fluid production, reservoir characteristics and operational constraints. This is indeed a new way of looking at a reservoir and its fluid flow behavior. This is a technology at its infancy. It requires input from major players including scientists, engineers, academicians, service companies, IOCs, NOCs and independents to grow and mature. This technology has the potential to contribute to the art and science of reservoir simulation and modeling and add to the existing set of tools that are currently used in our industry for reservoir management.
REFERENCES
Gomez, Y., Khazaeni, Y., Mohaghegh, S.D., and Gaskari, R. 2009 "Top-Down Intelligent Reservoir Modeling (TDIRM)". SPE 124204, Proceedings, 2009 SPE Annual Conference & Exhibition. New Orleans, Louisiana.
Grujic, O., Mohaghegh, S.D., Bromhal, G.; 2010 “Fast Track Reservoir Modeling of Shale Formations in the Appalachian Basin. Application to Lower Huron Shale in Eastern Kentucky”. SPE 139101, Proceedings, 2010 SPE Eastern Regional Conference & Exhibition. Morgantown, West Virginia. 12-14 October 2010.
Kalantari-Dahaghi, A.M., Mohaghegh, S.D. 2009 "Top-Down Intelligent Reservoir Modeling of New Albany Shale". SPE 125859, Proceedings, 2009 SPE Eastern Regional Conference & Exhibition. Charleston, West Virginia.
Kalantari-Dahaghi, A.M., Mohaghegh, S.D. and Khazaeni, Y. 2010 "New Insight into Integrated Reservoir Management using Top-Down, Intelligent Reservoir Modeling Technique; Application to a Giant and Complex Oil Field in the Middle East". SPE 132621, Proceedings, 2010 SPE Western Regional Conference & Exhibition. 27-29 May 2010. Anaheim, California.
Khazaeni, Y. and Mohaghegh, S.D.; 2010 “Intelligent Time Successive Production Modeling”. SPE 132643, Proceedings, SPE Western Regional Conference & Exhibition. Anaheim, California. 27-29 May 2010.
Mata, D., Gaskari, R., Mohaghegh, S.D., 2007 "Field-Wide Reservoir Characterization Based on a New Technique of Production Data Analysis". SPE 111205, Proceedings, 2007 SPE Eastern Regional Conference & Exhibition. 17-19 October 2007. Lexington, Kentucky.
Mohaghegh, S.D. 2009 "Top-Down Intelligent Reservoir Modeling (TDIRM); A New Approach In Reservoir Modeling By Integrating Classic Reservoir Engineering With Artificial Intelligence & Data Mining Techniques". AAPG 2009 Annual Convention and Exhibition. June 7-10, 2009. Denver, Colorado
Mohaghegh S.D.; 2010 “Top-Down, Intelligent Reservoir Model”. European Geological Union General Assembly (Vol. 12, EGU2010-233, 2010). Vienna, Austria. May 2010.

18
Zargari, S. and Mohaghegh, S.D.; 2010 “Field Development Strategies for Bakken Shale Formation”. SPE 139032, Proceedings, SPE Eastern Regional Conference & Exhibition. Morgantown, West Virginia. 12-14 October 2010.