table of contents administration report statistical tables guide table of contents administration...
TRANSCRIPT
Annual Report Statistical Tables Guide
Table of Contents Administration Table 1 – Summary of Expenditures of the State Board of Equalization
This table shows BOE expenditures by function for the two most recent fiscal years.
Table 2 – Summary of Revenues from Taxes Administered by the State Board of Equalization, by Fiscal Year
This table provides a 10-year historical summary of revenues by source of revenue.
Table 3 – Summary of Total Costs of Performing State Board of Equalization (BOE) Functions
Starting in 2014-15, this table shows expenditures and ratios of costs to revenues by program for the most recent fiscal year. It replaces tables 3A and 3B.
Table 3A – Summary of Total Costs of Performing Board Functions – DISCONTINUED
Until 2014-15, this table showed expenditures by program for the two most recent fiscal years.
Table 3B – Revenues and Ratios of State Board of Equalization Expenditures and Total Costs to Revenues from Assessments Made by the BOE – DISCONTINUED
Until 2014-15, this table showed revenues and the ratio of BOE expenditures to revenues and the ratio of total costs to revenue by source of revenue for the two most recent fiscal years.
Property Taxes Table 4 – Summary of Assessed Values of Property Subject to Local General Property Taxes, and Average Tax Rates
This table provides a 10-year historical statewide summary of assessed values, the amount of property tax levies, the average property tax rate, and the amount of property tax relief.
Table 5 – Assessed Value of State- and County-Assessed Property Subject to General Property Taxes, Inclusive of the Homeowners’ Exemption, by Class of Property and by County
This table shows the total assessed value for each county. It breaks down value by class of property: land, improvements (buildings and structures, and fixtures), and other personal property.
Table 6 – Assessed Value of State-Assessed Property Subject to General Property Taxes, by Class of Property and by County
This table shows the state-assessed value for each county. It breaks down value by class of property: land, improvements (buildings and structures, and fixtures), and other personal property.
Table 7 – Assessed Value of County-Assessed Property Subject to General Property Taxes, Inclusive of the Homeowners’ Exemption, by Class of Property and by County
This table shows the locally assessed value for each county. It breaks down value by class of property: land, improvements (buildings and structures, and fixtures), and other personal property.
Table 8 – Number of Veterans’ Exemptions and Exempt Value of Veterans’, College, Church, Religious, and Welfare Exemptions
This table lists exemptions provided to veterans, colleges, churches, schools, and properties used for religious or other charitable purposes, and all other enrolled exemptions.
Table 9 – Gross Assessed Value of State- and County-Assessed Property, Number of Homeowners’ Exemptions, Exempt Value by Type of Exemption, and Net Assessed Value Subject to General Property Taxes
This table provides a breakdown of gross assessed value, the value of the homeowners’ exemption, the value of other enrolled exemptions, and taxable assessed value (net of all exemptions), by county.

Annual Report Statistical Tables Guide
Table 10 – Net State- and County-Assessed Value of Property Subject to General Property Taxes on the Secured and Unsecured Rolls, by County
This table shows the breakdown of assessed value by the secured roll (property subject to lien) and the unsecured roll, by county. The value of the homeowners’ exemption is included in the assessed values because tax rates are set on values that include it; all other exemptions are excluded.
Table 11 – Assessed Value of County-Assessed Property Subject to General Property Taxes, Inclusive of the Homeowners’ Exemption, by Incorporated Cities
This table lists assessed values, inclusive of the homeowners’ exemption, for each California city.
Table 12 – Assessed Value of Property Assessed by the State Board of Equalization, by Type of Company
This table summarizes state-assessed values by company type.
Table 13 – Assessed Value of Property Assessed by the State Board of Equalization and Subject to Local Taxation, by Company
This table lists state-assessed values of the major companies within each company type.
Table 14 – General Property Tax Levies as Compiled for Computation of the Average Tax Rate
This tables shows the taxable assessed value (net of all exemptions), the breakdown of ad valorem property tax levies allocated to cities, county, schools, and other districts, and the average property tax rate, by county.
Table 15 – General Property Tax Dollar, by County
This table breaks down, by county, how much of the property tax dollar is allocated to cities, county, schools, and other districts.
Table 16A – Timber Yield Tax and Timber Reserve Fund Tax Statistics
This historical table shows the market value of timber harvested, the timber tax rate, and net revenue, by assessment year.
Table 16B – Timber Production Statistics, by County
This table breaks down the net volume and the market value of timber harvested by county.
Table 17A – Assessed Value of Private Railroad Cars Assessed by the State Board of Equalization and Subject to Exclusive State Taxation, by Company
This table lists the assessed value and amount of tax of the private railroad car companies.
Table 17B – Private Railroad Car Tax Assessments, Tax Rates, and Tax Levies
This historical table shows private railroad car tax statistics by assessment year.

Annual Report Statistical Tables Guide
Sales and Use Taxes Table 18 – State Sales and Use Tax Collections and Number of Permits
This historical table shows state sales and use tax collections from the General Fund tax rate by fiscal year and the number of outstanding permits as of December 31.
Table 19 – State Sales and Use Tax Statistics, by Type of Business – DISCONTINUED
This table showed fiscal year taxable transactions and number of permits by type of business.
Table 20 – State Sales and Use Tax Statistics, by County – DISCONTINUED
This table showed fiscal year taxable sales and number of permits by county.
Table 21A – Revenues Distributed to Cities and Counties from Local Sales and Use Taxes
This table shows the Bradley-Burns local sales and use tax revenue collected and allocated to California cities and counties during a fiscal year.
Table 21B – Revenues Distributed to Counties from County Transportation Tax
This table shows the county transportation tax revenue collected and allocated to each California county during a fiscal year.
Table 21C – Revenues Distributed to Special Districts from Transactions and Use Tax
This table shows the tax rate, the effective dates, and the transactions and use tax revenue collected and allocated to each special district during a fiscal year.
Table 22A – Local Sales Tax Distributions and Administrative Charges to Cities and Counties
This historical table shows the Bradley-Burns local sales and use tax revenues allocated to California cities and counties and the associated administrative charges by fiscal year.
Table 22B – Special District Tax Distributions and Administrative Charges
This historical table shows the transactions and use tax revenues allocated to special districts and the associated administrative charges by fiscal year.
Table 23[A] – Local Sales and Use Tax Rates Imposed by California Cities
This table shows the city-imposed Bradley-Burns local sales tax rates on July 1.
Table 23B – Sales and Use Tax Rates, by County – DISCONTINUED
This table showed the total combined state, local, and special district tax rates for each county, and the cities within a county that impose a special district tax.
Annual Report Statistical Tables Guide
Fuel (Excise) Taxes Table 24A – Gasoline Tax Statistics
Starting in 2014-15, this historical table shows taxable distributions, tax rates, and revenues for gasoline by fiscal year.
Table 24B – Jet Fuel Tax Statistics D
Starting in 2014-15, this historical table shows revenues and taxable distributions for aircraft jet fuel by fiscal year.
Table 24 – Gasoline and Jet Fuel Tax Statistics – DISCONTINUED
Until 2014-15, this historical table showed revenues and taxable distributions for gasoline and aircraft jet fuel by fiscal year, and gasoline tax rates. See Table 24A for gasoline data and Table 24B for aircraft jet fuel information.
Table 25A – Taxable Distributions of Diesel Fuel and Alternative Fuels
This historical table shows taxable distributions for diesel fuel by fiscal year.
Table 25B – Diesel Fuel and Alternative Fuels Tax Revenue
This historical table displays use fuel tax revenues by fiscal year.
Table 26 – Underground Storage Tank Maintenance Fee, Childhood Lead Poisoning Prevention Fee, and Oil Spill Response, Prevention, and Administration Fees Revenue
Revenue statistics by fiscal year from the Underground Storage Tank Maintenance Fee, Childhood Lead Poisoning Prevention Fee, and Oil Spill Response, Prevention, and Administration Fees can be found in this historical table.
Alcoholic Beverage Tax Table 27 – Beer, Wine, and Distilled Spirits Excise Tax Collections
This historical table details the excise tax collections by type of alcoholic beverage by fiscal year.
Table 28 – Apparent Consumption of Beer, Wines, and Distilled Spirits, by Fiscal Year
This historical table shows the taxable volume by type of alcoholic beverage by fiscal year.
Table 29 – Per Capita Consumption of Beer, Wines, and Distilled Spirits, by Fiscal Year
This historical table shows the per capita consumption of beer, wines, and distilled spirits by fiscal year.
Cigarette Tax Table 30A – Cigarette Taxes and Other Tobacco Products Surtax Revenue
This historical table shows cigarette tax and tobacco products surtax revenue by fiscal year.
Table 30B – Cigarette Distributions and Per Capita Consumption
This historical table shows California cigarette distributions and apparent per capita consumption by fiscal year.
Insurance Tax Table 31 – Taxable Insurance Premiums and Total Taxes Assessed, by Company
This table displays taxable insurance premiums and total taxes assessed by company for fire and casualty insurers and for life insurers.
Table 32 – Summary of Insurance Taxes Assessed Against Companies Authorized to Do Business in California, by Type of Insurer
This table is a two-year comparison summarizing insurance taxes assessed by insurer type.
Table 33 – Insurance Tax Assessments Against Licensed Insurers, Tax Rate, Taxes on Premiums, Local Property Tax Credits Allowed, Taxes on Ocean Marine Business, and Total Taxes Assessed
This historical table shows insurance tax assessment information by assessment year.

Annual Report Statistical Tables Guide
Resources Surcharges Table 34 – Energy Resources Surcharge and Natural Gas Surcharge Revenue
This historical table shows revenues from the (electrical) energy resources surcharge and the (natural) gas consumption surcharge by fiscal year.
Telephone Taxes Table 35 – Emergency Telephone Users (911) Surcharge and (Moore) Universal Telephone Service Tax Revenue
This historical table shows revenues from the Emergency Telephone Users (911) Surcharge and (Moore) Universal Telephone Service Tax Revenue by fiscal year.
Other Taxes and Fees Table 36A – Hazardous Substances Tax, Integrated Waste Management Fee, California Tire Fee, Occupational Lead Poisoning Prevention Fee, and Marine Invasive Species Fee Revenue
This historical table shows revenues from the Hazardous Substances Tax, Integrated Waste Management Fee, California Tire Fee, Occupational Lead Poisoning Prevention Fee, and Marine Invasive Species Fee by fiscal year.
Table 36B – Water Rights Fee, Electronic Waste Recycling Fee, State Responsibility Area Fire Prevention, and Timber Regulation and Forest Restoration Revenue
This historical table shows revenues from the Water Rights Fee, Electronic Waste Recycling Fee, State Responsibility Area Fire Prevention (Fire) Fee, and Timber Regulation and Forest Restoration (Lumber) Fee by fiscal year.
Table 37A –eWaste Fee Collections
This historical table details electronic waste recycling fee revenues by video display size by fiscal year.
Table 37B – Reported Consumption of Covered Electronic Devices
This historical table details the taxable sales and leases of covered electronic devices by video display size by fiscal year.
Annual Report Statistical Tables Guide
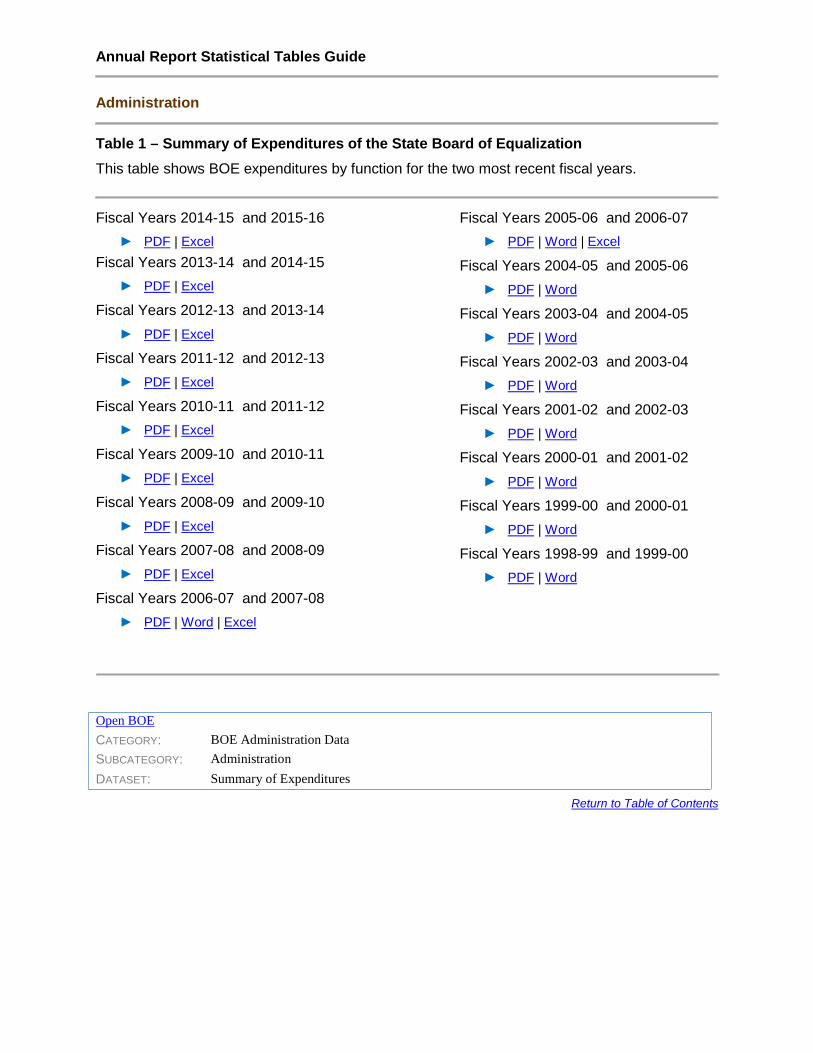
Administration
Table 1 – Summary of Expenditures of the State Board of Equalization This table shows BOE expenditures by function for the two most recent fiscal years.
Fiscal Years 2014-15 and 2015-16 Fiscal Years 2005-06 and 2006-07 ► PDF | Excel ► PDF | Word | Excel
Fiscal Years 2013-14 and 2014-15 Fiscal Years 2004-05 and 2005-06 ► PDF | Excel ► PDF | Word
Fiscal Years 2012-13 and 2013-14 Fiscal Years 2003-04 and 2004-05 ► PDF | Excel ► PDF | Word
Fiscal Years 2011-12 and 2012-13 Fiscal Years 2002-03 and 2003-04 ► PDF | Excel ► PDF | Word
Fiscal Years 2010-11 and 2011-12 Fiscal Years 2001-02 and 2002-03 ► PDF | Excel ► PDF | Word
Fiscal Years 2009-10 and 2010-11 Fiscal Years 2000-01 and 2001-02 ► PDF | Excel ► PDF | Word
Fiscal Years 2008-09 and 2009-10 Fiscal Years 1999-00 and 2000-01 ► PDF | Excel ► PDF | Word
Fiscal Years 2007-08 and 2008-09 Fiscal Years 1998-99 and 1999-00 ► PDF | Excel ► PDF | Word
Fiscal Years 2006-07 and 2007-08 ► PDF | Word | Excel
Open BOE CATEGORY: BOE Administration Data SUBCATEGORY: Administration DATASET: Summary of Expenditures
Return to Table of Contents
Annual Report Statistical Tables Guide Administration
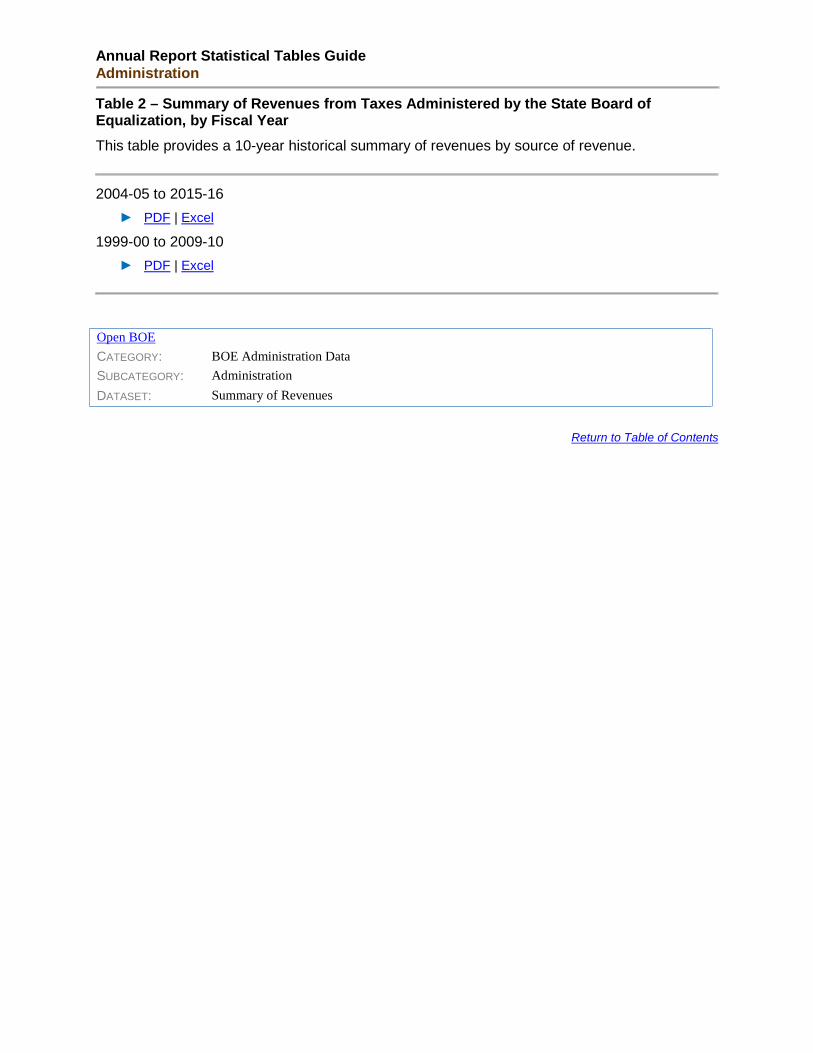
Table 2 – Summary of Revenues from Taxes Administered by the State Board of Equalization, by Fiscal Year This table provides a 10-year historical summary of revenues by source of revenue.
2004-05 to 2015-16 ► PDF | Excel
1999-00 to 2009-10 ► PDF | Excel
Open BOE CATEGORY: BOE Administration Data SUBCATEGORY: Administration DATASET: Summary of Revenues
Return to Table of Contents

Annual Report Statistical Tables Guide Administration
Table 3 – Summary of Total Costs of Performing State Board of Equalization (BOE) Functions Starting in 2014-15, this table shows expenditures and ratios of costs to revenues by program for the most recent fiscal year. It replaces tables 3A and 3B.
Fiscal Year 2015-16 ► PDF | Excel
Open BOE CATEGORY: BOE Administration Data SUBCATEGORY: Administration DATASET: Ratios of Expenditures to Revenue
Return to Table of Contents

Annual Report Statistical Tables Guide Administration
Table 3A – Summary of Total Costs of Performing Board Functions – DISCONTINUED Until 2014-15, this table showed expenditures by program for the two most recent fiscal years. See Table 3.
Fiscal Years 2012-13 and 2013-14 ► PDF | Excel
Fiscal Years 2011-12 and 2012-13 ► PDF | Excel
Fiscal Years 2010-11 and 2011-12 ► PDF | Excel
Fiscal Years 2009-10 and 2010-11 ► PDF | Excel
Fiscal Years 2008-09 and 2009-10 ► PDF | Excel
Fiscal Years 2007-08 and 2008-09 ► PDF | Excel
Fiscal Years 2006-07 and 2007-08 ► PDF | Word | Excel
Fiscal Years 2005-06 and 2006-07 ► PDF | Word
Fiscal Years 2004-05 and 2005-06 ► PDF | Word
Fiscal Years 2003-04 and 2004-05 ► PDF | Word
Fiscal Years 2002-03 and 2003-04 ► PDF | Word
Fiscal Years 2001-02 and 2002-03 ► PDF | Word
Fiscal Years 2000-01 and 2001-02 ► PDF | Word
Fiscal Years 1999-00 and 2000-01 ► PDF | Word
Fiscal Years 1998-99 and 1999-00 ► PDF | Word
Return to Table of Contents

Annual Report Statistical Tables Guide Administration
Table 3B – Revenues and Ratios of State Board of Equalization Expenditures and Total Costs to Revenues from Assessments Made by the BOE – DISCONTINUED Until 2014-15, this table shows revenues and the ratio of BOE expenditures to revenues and the ratio of total costs to revenue by source of revenue for the two most recent fiscal years. See Table 3.
Fiscal Years 2012-13 and 2013-14 Fiscal Years 2004-05 and 2005-06 ► PDF | Excel ► PDF | Word
Fiscal Years 2011-12 and 2012-13 Fiscal Years 2003-04 and 2004-05 ► PDF | Excel ► PDF | Word
Fiscal Years 2010-11 and 2011-12 Fiscal Years 2002-03 and 2003-04 ► PDF | Excel ► PDF | Word
Fiscal Years 2009-10 and 2010-11 Fiscal Years 2001-02 and 2002-03 ► PDF | Excel ► PDF | Word
Fiscal Years 2008-09 and 2009-10 Fiscal Years 2000-01 and 2001-02 ► PDF | Excel ► PDF | Word
Fiscal Years 2007-08 and 2008-09 Fiscal Years 1999-00 and 2000-01 ► PDF | Excel ► PDF | Word
Fiscal Years 2006-07 and 2007-08 Fiscal Years 1998-99 and 1999-00 ► PDF | Word | Excel ► PDF | Word
Fiscal Years 2005-06 and 2006-07 ► PDF | Word | Excel
Return to Table of Contents

Annual Report Statistical Tables Guide
Property Taxes
Table 4 – Summary of Assessed Values of Property Subject to Local General Property Taxes, and Average Tax Rates This table provides a 10-year historical statewide summary of assessed values, the amount of property tax levies, the average property tax rate, and the amount of property tax relief.
2005-2006 to 2015-2016 ► PDF | Excel
2000-2001 to 2010-2011 ► PDF | Excel
Open BOE CATEGORY: Property Taxes SUBCATEGORY: State and County-Assessed Property Taxes DATASET: Summaries of Assessed Values, by Property Class
Return to Table of Contents
Annual Report Statistical Tables Guide Property Taxes
Table 5 – Assessed Value of State- and County-Assessed Property Subject to General Property Taxes, Inclusive of the Homeowners’ Exemption, by Class of Property and by County This table shows the total assessed value for each county. It breaks down value by class of property: land, improvements (buildings and structures, and fixtures), and other personal property.
2016-2017 ► PDF | Excel 2015-2016
► PDF | Excel
2014-2015 ► PDF | Excel
2013-2014 ► PDF | Excel
2012-2013 ► PDF | Excel
2011-2012 ► PDF | Excel
2010-2011 ► PDF | Excel
2009-2010 ► PDF | Excel
2008-2009 ► PDF | Word | Excel
2007-2008 ► PDF | Word | Excel
2006-2007 ► PDF | Word
2005-2006 ► PDF | Word
2004-2005 ► PDF | Word
2003-2004 ► PDF | Word
2002-2003 ► PDF | Word
2001-2002 ► PDF | Word
2000-2001 ► PDF | Word
Open BOE CATEGORY: Property Taxes SUBCATEGORY: State and County-Assessed Property Taxes DATASET: Assessed Property Values
Return to Table of Contents

Annual Report Statistical Tables Guide Property Taxes
Table 6 – Assessed Value of State-Assessed Property Subject to General Property Taxes, by Class of Property and by County BOE administers the State-Assessed property program and sets market values for public utilities and railroads as defined by the State Constitution. These values are allocated to local jurisdictions for levy and collection of local property taxes.
This table shows the state-assessed value for each county. It breaks down value by class of property: land, improvements (buildings and structures, and fixtures), and other personal property.
2016-2017 ► PDF | Excel
2015-2016 ► PDF | Excel
2014-2015 ► PDF | Excel
2013-2014 ► PDF | Excel
2012-2013 ► PDF | Excel
2011-2012 ► PDF | Excel
2010-2011 ► PDF | Excel
2009-2010 ► PDF | Excel
2008-2009 ► PDF | Word | Excel
2007-2008 ► PDF | Word | Excel
2006-2007 ► PDF | Word
2005-2006 ► PDF | Word
2004-2005 ► PDF | Word
2003-2004 ► PDF | Word
2002-2003 ► PDF | Word
2001-2002 ► PDF | Word
2000-2001 ► PDF | Word
Open BOE CATEGORY: Property Taxes SUBCATEGORY: State and County-Assessed Property Taxes DATASET: State-Assessed_Property Values by Property Class
Return to Table of Contents
Annual Report Statistical Tables Guide Property Taxes
Table 7 – Assessed Value of County-Assessed Property Subject to General Property Taxes, Inclusive of the Homeowners’ Exemption, by Class of Property and by County This table shows the locally assessed value for each county. It breaks down value by class of property: land, improvements (buildings and structures, and fixtures), and other personal property.
2016-2017 ► PDF | Excel
2015-2016 ► PDF | Excel
2014-2015 ► PDF | Excel
2013-2014 ► PDF | Excel
2012-2013 ► PDF | Excel
2011-2012 ► PDF | Excel
2010-2011 ► PDF | Excel
2009-2010 ► PDF | Excel
2008-2009 ► PDF | Word | Excel
2007-2008 ► PDF | Word | Excel
2006-2007 ► PDF | Word
2005-2006 ► PDF | Word
2004-2005 ► PDF | Word
2003-2004 ► PDF | Word
2002-2003 ► PDF | Word
2001-2002 ► PDF | Word
2000-2001 ► PDF | Word
Open BOE CATEGORY: Property Taxes SUBCATEGORY: State and County-Assessed Property Taxes DATASET: County Assessed Property Values, by Property Class and County
Return to Table of Contents
Annual Report Statistical Tables Guide Property Taxes
Table 8 – Number of Veterans’ Exemptions and Exempt Value of Veterans’, College, Church, Religious, and Welfare Exemptions This table lists exemptions provided to veterans, colleges, churches, schools, and properties used for religious or other charitable purposes, and all other enrolled exemptions.
2016-2017 ► PDF | Excel
2015-2016 ► PDF | Excel
2014-2015 ► PDF | Excel
2013-2014 ► PDF | Excel
2012-2013 ► PDF | Excel
2011-2012 ► PDF | Excel
2010-2011 ► PDF | Excel
2009-2010 ► PDF | Excel
2008-2009 ► PDF | Word | Excel
2007-2008 ► PDF | Word | Excel
2006-2007 ► PDF | Word
2005-2006 ► PDF | Word
2004-2005 ► PDF | Word
2003-2004 ► PDF | Word
2002-2003 ► PDF | Word
2001-2002 ► PDF | Word
2000-2001 ► PDF | Word
Open BOE CATEGORY: Property Taxes SUBCATEGORY: State and County-Assessed Property Taxes DATASET: Property Tax Exemptions
Return to Table of Contents
Annual Report Statistical Tables Guide Property Taxes
Table 9 – Gross Assessed Value of State- and County-Assessed Property, Number of Homeowners’ Exemptions, Exempt Value by Type of Exemption, and Net Assessed Value Subject to General Property Taxes This table provides a breakdown of gross assessed value, the value of the homeowners’ exemption, the value of other enrolled exemptions, and taxable assessed value (net of all exemptions), by county.
2016-2017 ► PDF | Excel
2015-2016 ► PDF | Excel
2014-2015 ► PDF | Excel
2013-2014 Revised August 2015
► PDF | Excel
2012-2013 ► PDF | Excel
2011-2012 Revised August 2015
► PDF | Excel
2010-2011 ► PDF | Excel
2009-2010 ► PDF | Excel
2008-2009 ► PDF | Word | Excel
2007-2008 ► PDF | Word | Excel
2006-2007 ► PDF | Word
2005-2006 ► PDF | Word
2004-2005 ► PDF | Word
2003-2004 ► PDF | Word
2002-2003 ► PDF | Word
2001-2002 ► PDF | Word
2000-2001 ► PDF | Word
Open BOE CATEGORY: Property Taxes SUBCATEGORY: State and County-Assessed Property Taxes DATASET: Gross Assessed Values and Homeowners' Exemptions
Return to Table of Contents
Annual Report Statistical Tables Guide Property Taxes
Table 10 – Net State- and County-Assessed Value of Property Subject to General Property Taxes on the Secured and Unsecured Rolls, by County This table shows the breakdown of assessed value by the secured roll (property subject to lien) and the unsecured roll, by county. The value of the homeowners’ exemption is included in the assessed values because tax rates are set on values that include it; all other exemptions are excluded.
2016-2017 ► PDF | Excel
2015-2016 ► PDF | Excel
2014-2015 ► PDF | Excel
2013-2014 ► PDF | Excel
2012-2013 ► PDF | Excel
2011-2012 ► PDF | Excel
2010-2011 ► PDF | Excel
2009-2010 ► PDF | Excel
2008-2009 ► PDF | Word | Excel
2007-2008 ► PDF | Word | Excel
2006-2007 ► PDF | Word
2005-2006 ► PDF | Word
2004-2005 ► PDF | Word
2003-2004 ► PDF | Word
2002-2003 ► PDF | Word
2001-2002 ► PDF | Word
2000-2001 ► PDF | Word
Open BOE CATEGORY: Property Taxes SUBCATEGORY: State and County-Assessed Property Taxes DATASET: Net Assessed Values, by County
Return to Table of Contents

Annual Report Statistical Tables Guide Property Taxes
Table 11 – Assessed Value of State- and County-Assessed Property Subject to General Property Taxes, Inclusive of the Homeowners’ Exemption, by Incorporated Cities This table lists assessed values, inclusive of the homeowners’ exemption, for each California city.
2016-2017 ► PDF | Excel 2015-2016
► PDF | Excel
2014-2015 ► PDF | Excel
2013-2014 ► PDF | Excel
2012-2013 ► PDF | Excel
2011-2012 ► PDF | Excel
2010-2011 ► PDF | Excel
2009-2010 ► PDF | Excel
2008-2009 ► PDF | Word | Excel
2007-2008 ► PDF | Word | Excel
2006-2007 ► PDF | Word
2005-2006 ► PDF | Word
2004-2005 ► PDF | Word
2003-2004 ► PDF | Word
2002-2003 ► PDF | Word
2001-2002 ► PDF | Word
2000-2001 ► PDF | Word
Open BOE CATEGORY: Property Taxes SUBCATEGORY: State and County-Assessed Property Taxes: DATASET: Assessed Property Values, by City
Return to Table of Contents
Annual Report Statistical Tables Guide Property Taxes
Table 12 – Assessed Value of Property Assessed by the State Board of Equalization, by Type of Company This table summarizes state-assessed values by company type.
2016-2017 ► PDF | Excel 2015-2016
► PDF | Excel
2014-2015 ► PDF | Excel
2013-2014 ► PDF | Excel
2012-2013 ► PDF | Excel
2011-2012 ► PDF | Excel
2010-2011 ► PDF | Excel
2009-2010 ► PDF | Excel
2008-2009 ► PDF | Word | Excel
2007-2008 ► PDF | Word | Excel
2006-2007 ► PDF | Word
2005-2006 ► PDF | Word
2004-2005 ► PDF | Word
2003-2004 ► PDF | Word
2002-2003 ► PDF | Word
2001-2002 ► PDF | Word
2000-2001 ► PDF | Word
Open BOE CATEGORY: Property Taxes SUBCATEGORY: State and County-Assessed Property Taxes DATASET: State-Assessed Property Values, by Type of Company
Return to Table of Contents

Annual Report Statistical Tables Guide Property Taxes
Table 13 – Assessed Value of Property Assessed by the State Board of Equalization and Subject to Local Taxation, by Company This table lists state-assessed values of the major companies within each company type.
2016-2017 ► PDF | Excel 2015-2016
► PDF | Excel
2014-2015 ► PDF | Excel
2013-2014 Revised March 2014
► PDF | Excel
2012-2013 ► PDF | Excel
2011-2012 ► PDF | Excel
2010-2011 ► PDF | Excel
2009-2010 ► PDF | Excel
2008-2009 ► PDF | Word | Excel
2007-2008 ► PDF | Word | Excel
2006-2007 ► PDF | Word
2005-2006 ► PDF | Word
2004-2005 ► PDF | Word
2003-2004 ► PDF | Word
2002-2003 (Table 12B) ► PDF | Word
2001-2002 (Table 12B) ► PDF | Word
2000-2001 (Table 12B) ► PDF | Word
Open BOE CATEGORY: Property Taxes SUBCATEGORY: State and County-Assessed Property Taxes: DATASET: State-Assessed Property Values, by Company, Unitary and Non-Unitary
Lists every company.
Return to Table of Contents

Annual Report Statistical Tables Guide Property Taxes
Table 14 – General Property Tax Levies as Compiled for Computation of the Average Tax Rate This tables shows the taxable assessed value (net of all exemptions), the breakdown of ad valorem property tax levies allocated to cities, county, schools, and other districts, and the average property tax rate, by county.
2015-2016 ► PDF | Excel
2014-2015 ► PDF | Excel
2013-2014 ► PDF | Excel
2012-2013 ► PDF | Excel
2011-2012 ► PDF | Excel
2010-2011 ► PDF | Excel
2009-2010 ► PDF | Excel
2008-2009 ► PDF | Excel
2007-2008 ► PDF | Word | Excel
2006-2007 ► PDF | Word | Excel
2005-2006 ► PDF | Word
2004-2005 ► PDF | Word
2003-2004 ► PDF | Word
2002-2003 ► PDF | Word
2001-2002 ► PDF | Word
2000-2001 ► PDF | Word
1999-2000 ► PDF | Word
Open BOE CATEGORY: Property Taxes SUBCATEGORY: State and County-Assessed Property Taxes DATASET: Property Tax Allocations
Return to Table of Contents

Annual Report Statistical Tables Guide Property Taxes
Table 15 – General Property Tax Dollar, by County This table breaks down, by county, how much of the property tax dollar is allocated to cities, county, schools, and other districts.
2015-2016 ► PDF | Excel 2014-2015
► PDF | Excel
2013-2014 ► PDF | Excel
2012-2013 ► PDF | Excel
2011-2012 ► PDF | Excel
2010-2011 ► PDF | Excel
2009-2010 ► PDF | Excel
2008-2009 ► PDF | Excel
2007-2008 ► PDF | Word | Excel
2006-2007 ► PDF | Word | Excel
2005-2006 ► PDF | Word
2004-2005 ► PDF | Word
2003-2004 ► PDF | Word
2002-2003 ► PDF | Word
2001-2002 ► PDF | Word
2000-2001 ► PDF | Word
1999-2000 ► PDF | Word
Open BOE CATEGORY: Property Taxes SUBCATEGORY: State and County-Assessed Property Taxes DATASET: Property Tax Allocations
Return to Table of Contents

Annual Report Statistical Tables Guide Property Taxes
Table 16A – Timber Yield Tax and Timber Reserve Fund Tax Statistics This historical table shows the market value of timber harvested, the timber tax rate, and net revenue, by assessment year.
1977 to 2015 ► PDF | Excel
Open BOE CATEGORY: Property Taxes SUBCATEGORY: Timber Yield Tax DATASET: Harvest Values and Revenues
Return to Table of Contents

Annual Report Statistical Tables Guide Property Taxes
Table 16B – Timber Production Statistics, by County This table breaks down the net volume and the market value of timber harvested by county.
2015 ► PDF | Excel
2014 ► PDF | Excel
2013 ► PDF | Excel 2012 Revised June 2014 ► PDF | Excel
2011 ► PDF | Excel
2010 ► PDF | Excel
2009 ► PDF | Excel
2008 ► PDF | Excel 2007 ► PDF | Word | Excel
2006 ► PDF | Word | Excel
2005 ► PDF | Word
2004 ► PDF | Word
2003
► PDF | Word
2002
► PDF | Word
2001
► PDF | Word
2000
► PDF | Word
1999
► PDF | Word
Open BOE CATEGORY: Property Taxes SUBCATEGORY: Timber Yield Tax DATASET: Timber Production Statistics by County
Return to Table of Contents

Annual Report Statistical Tables Guide Property Taxes
Table 17A – Assessed Value of Private Railroad Cars Assessed by the State Board of Equalization and Subject to Exclusive State Taxation, by Company This table lists the assessed value and amount of tax of the private railroad car companies.
2016-2017 ► PDF | Excel 2015-2016
► PDF | Excel
2014-2015 ► PDF | Excel
2013-2014 ► PDF | Excel
2012-2013 ► PDF | Excel
2011-2012 ► PDF | Excel
2010-2011 ► PDF | Excel
2009-2010 ► PDF | Excel
2008-2009 ► PDF | Word | Excel
2007-2008 ► PDF | Word | Excel
2006-2007 ► PDF | Word
2005-2006 ► PDF | Word
2004-2005 ► PDF | Word
2003-2004 ► PDF | Word
2002-2003 ► PDF | Word
2001-2002 ► PDF | Word
2000-2001 ► PDF | Word
Open BOE CATEGORY: Property Taxes SUBCATEGORY: Private Railroad Car Tax DATASET: Values, Taxes, and Penalties
Return to Table of Contents

Annual Report Statistical Tables Guide Property Taxes
Table 17B – Private Railroad Car Tax Assessments, Tax Rates, and Tax Levies This historical table shows private railroad car tax statistics by assessment year.
1938-1940 to 2016-2017 ► PDF | Excel
Open BOE CATEGORY: Property Taxes SUBCATEGORY: Private Railroad Car Tax DATASET: Assessments, Rates, and Levies
Return to Table of Contents
Annual Report Statistical Tables Guide
Sales and Use Taxes
Table 18 – State Sales and Use Tax Collections and Number of Permits This historical table shows state sales and use tax collections from the General Fund tax rate by fiscal year and the number of outstanding permits as of December 31.
1933-34 to 2015-16 ► PDF | Excel
Open BOE CATEGORY: Sales and Use Taxes SUBCATEGORY: Sales and Use Taxes DATASET: State Sales & Use Tax Collections and Number of Permits
Return to Table of Contents

Annual Report Statistical Tables Guide Sales and Use Taxes
Table 19 – State Sales and Use Tax Statistics, by Type of Business – DISCONTINUED To find state sales and use tax statistics by type of business, please visit the Taxable Sales in California page.
This table showed fiscal year taxable transactions and number of permits by type of business.
2011-12 ► PDF | Excel
2010-11 ► PDF | Excel
2009-10 ► PDF | Excel
2008-09 ► PDF | Excel
2007-08 ► PDF | Word | Excel
2006-07 ► PDF | Word | Excel
2005-06 ► PDF | Word
2004-05 ► PDF | Word
2003-04 ► PDF | Word
2002-03 ► PDF | Word
2001-02 ► PDF | Word
2000-01 ► PDF | Word
1999-00 ► PDF | Word
Return to Table of Contents

Annual Report Statistical Tables Guide Sales and Use Taxes
Table 20 – State Sales and Use Tax Statistics, by County – DISCONTINUED To find state sales and use tax statistics by county, please visit the Taxable Sales in California page.
This table showed fiscal year taxable sales and number of permits by county.
2011-12 ► PDF | Excel
2010-11 ► PDF | Excel
2009-10 ► PDF | Excel
2008-09 ► PDF | Excel
2007-08 ► PDF | Word | Excel
2006-07 ► PDF | Word | Excel
2005-06 ► PDF | Word
2004-05 ► PDF | Word
2003-04 ► PDF | Word
2002-03 ► PDF | Word
2001-02 ► PDF | Word
2000-01 ► PDF | Word
1999-00 ► PDF | Word
Return to Table of Contents

Annual Report Statistical Tables Guide Sales and Use Taxes
Table 21A – Revenues Distributed to Cities and Counties from Local Sales and Use Taxes This table shows the Bradley-Burns local sales and use tax revenue collected and allocated to California cities and counties during a fiscal year.
2015-16 ► PDF | Excel 2014-15
► PDF | Excel
2013-14 ► PDF | Excel
2012-13 ► PDF | Excel
2011-12 ► PDF | Excel
2010-11 ► PDF | Excel
2009-10 ► PDF | Excel
2008-09 ► PDF | Excel
2007-08 ► PDF | Word | Excel
2006-07 ► PDF | Word | Excel
2005-06 ► PDF | Word
2004-05 ► PDF | Word
2003-04 ► PDF | Word
2002-03 ► PDF | Word
2001-02 ► PDF | Word
2000-01 ► PDF | Word
1999-00 ► PDF | Word
Open BOE CATEGORY: Sales and Use Taxes SUBCATEGORY: Sales and Use Taxes DATASET: Local Tax Distributions, by City and County
Return to Table of Contents
Annual Report Statistical Tables Guide Sales and Use Taxes
Table 21B – Revenues Distributed to Counties from County Transportation Tax This table shows the county transportation tax revenue collected and allocated to each California county during a fiscal year.
2015-16 ► PDF | Excel 2014-15
► PDF | Excel
2013-14 ► PDF | Excel
2012-13 ► PDF | Excel
2011-12 ► PDF | Excel
2010-11 ► PDF | Excel
2009-10 ► PDF | Excel
2008-09 ► PDF | Excel
2007-08 ► PDF | Word | Excel
2006-07 ► PDF | Word | Excel
2005-06 ► PDF | Word
2004-05 ► PDF | Word
2003-04 ► PDF | Word
2002-03 ► PDF | Word
2001-02 ► PDF | Word
2000-01 ► PDF | Word
1999-00 ► PDF | Word
Open BOE CATEGORY: Sales and Use Taxes SUBCATEGORY: Sales and Use Taxes DATASET County Transportation Tax Distributions
Return to Table of Contents
Annual Report Statistical Tables Guide Sales and Use Taxes
Table 21C – Revenues Distributed to Special Districts from Transactions and Use Tax This table shows the tax rate, the effective dates, and the transactions and use tax revenue collected and allocated to each special district during a fiscal year.
2015-16 ► PDF | Excel 2014-15
► PDF | Excel
2013-14 ► PDF | Excel
2012-13 ► PDF | Excel
2011-12 ► PDF | Excel
2010-11 ► PDF | Excel
2009-10 ► PDF | Excel
2008-09 ► PDF | Excel
2007-08 ► PDF | Word | Excel
2006-07 ► PDF | Word | Excel
2005-06 ► PDF | Word
2004-05 ► PDF | Word
2003-04 ► PDF | Word
2002-03 ► PDF | Word
2001-02 ► PDF | Word
2000-01 ► PDF | Word
1999-00 ► PDF | Word
Open BOE CATEGORY: Sales and Use Taxes SUBCATEGORY: Sales and Use Taxes DATASET: District Tax Distributions, by District
Return to Table of Contents

Annual Report Statistical Tables Guide Sales and Use Taxes
Table 22A – Local Sales Tax Distributions and Administrative Charges to Cities and Counties This historical table shows the Bradley-Burns local sales and use tax revenues allocated to California cities and counties and the associated administrative charges by fiscal year.
1956-57 to 2015-16 ► PDF | Excel
Open BOE CATEGORY: Sales and Use Taxes SUBCATEGORY: Sales and Use Taxes DATASET: Local Tax Distributions
Return to Table of Contents

Annual Report Statistical Tables Guide Sales and Use Taxes
Table 22B – Special District Tax Distributions and Administrative Charges This historical table shows the transactions and use tax revenues allocated to special districts and the associated administrative charges by fiscal year.
1969-70 to 2014-15 ► PDF | Excel
Open BOE CATEGORY: Sales and Use Taxes SUBCATEGORY: Sales and Use Taxes DATASET: District Tax Distributions, by Fiscal Year
Return to Table of Contents

Annual Report Statistical Tables Guide Sales and Use Taxes
Table 23[A] – Local Sales and Use Tax Rates Imposed by California Cities Under the Bradley-Burns Uniform Local Sales and Use Tax Law, a city’s local tax may be imposed up to one percent; the city's tax rate is credited against the county's one percent tax.
This table shows the city-imposed Bradley-Burns local sales tax rates on July 1.
July 1, 2016 ► PDF | Excel
July 1, 2015 ► PDF | Excel
July 1, 2014 ► PDF | Excel
July 1, 2013 ► PDF | Excel
July 1, 2012 ► PDF | Excel
July 1, 2011 ► PDF | Excel
July 1, 2010 ► PDF | Excel
July 1, 2009 ► PDF | Excel
July 1, 2008 ► PDF | Excel
July 1, 2007 ► PDF | Word | Excel
July 1, 2006 ► PDF | Word
July 1, 2005 ► PDF | Word
July 1, 2004 ► PDF | Word
July 1, 2003 ► PDF | Word
July 1, 2002 ► PDF | Word
July 1, 2001 ► PDF | Word
July 1, 2000 ► PDF | Word
Open BOE CATEGORY: Sales and Use Taxes SUBCATEGORY: Sales and Use Taxes DATASET: Sales Tax Rates
Lists every California city.
Return to Table of Contents

Annual Report Statistical Tables Guide Sales and Use Taxes
Table 23B – Sales and Use Tax Rates, by County – DISCONTINUED To find information about the latest sales tax rates, see California City & County Sales & Use Tax Rates.
This table showed the total combined state, local, and special district tax rates for each county, and the cities within a county that impose a special district tax.
July 1, 2012 ► PDF | Excel
July 1, 2011 ► PDF | Excel
July 1, 2010 ► PDF | Excel
July 1, 2009 ► PDF | Excel
July 1, 2008 ► PDF | Excel
July 1, 2007 ► PDF | Word | Excel
July 1, 2006 ► PDF | Word
July 1, 2005 ► PDF | Word
July 1, 2004 ► PDF | Word
July 1, 2003 ► PDF | Word
July 1, 2002 ► PDF | Word
July 1, 2001 ► PDF | Word
July 1, 2000 ► PDF | Word
Return to Table of Contents

Annual Report Statistical Tables Guide
Fuel (Excise) Taxes
Table 24A – Gasoline Tax Statistics Starting in 2014-15, this historical table shows taxable distributions, tax rates, and revenues for gasoline by fiscal year.
1923-24 to 2015-16 ► PDF | Excel
Open BOE CATEGORY: Fuel Taxes SUBCATEGORY: Motor Vehicle Fuel Tax DATASET: Gasoline Tax Data
Return to Table of Contents
Annual Report Statistical Tables Guide Fuel (Excise) Taxes
Table 24B – Jet Fuel Tax Statistics Starting in 2014-15, this historical table shows revenues and taxable distributions for aircraft jet fuel by fiscal year.
1969-70 to 2015-16 ► PDF | Excel
Open BOE CATEGORY: Fuel Taxes SUBCATEGORY: Jet Fuel Tax
DATASET: Jet Fuel Tax Data Return to Table of Contents
Annual Report Statistical Tables Guide Fuel (Excise) Taxes
Table 24 – Gasoline and Jet Fuel Tax Statistics – DISCONTINUED Until 2014-15, this historical table showed revenues and taxable distributions for gasoline and aircraft jet fuel by fiscal year, and gasoline tax rates. See Table 24A for gasoline data and Table 24B for aircraft jet fuel information.
1923-24 to 2013-14 ► PDF | Excel
Return to Table of Contents
Annual Report Statistical Tables Guide Fuel (Excise) Taxes
Table 25A – Taxable Distributions of Diesel Fuel and Alternative Fuels This historical table shows taxable distributions for diesel fuel by fiscal year.
1937-38 to 2014-15 ► PDF | Excel
Open BOE CATEGORY: Fuel Taxes SUBCATEGORY: Diesel Fuel Tax DATASET: Diesel, Alternative Fuels Distributions
Return to Table of Contents
Annual Report Statistical Tables Guide Fuel (Excise) Taxes
Table 25B – Diesel Fuel and Alternative Fuels Statistics This historical table displays use fuel tax revenues by fiscal year.
1937-38 to 2015-16 ► PDF | Excel
Open BOE CATEGORY: Fuel Taxes SUBCATEGORY: Diesel Fuel Tax DATASET: Diesel, IFTA, Alternative Fuels Data
Return to Table of Contents
Annual Report Statistical Tables Guide Fuel (Excise) Taxes
Table 26 – Underground Storage Tank Maintenance Fee, Childhood Lead Poisoning Prevention Fee, and Oil Spill Response, Prevention, and Administration Fees Revenue Revenue statistics by fiscal year from the Underground Storage Tank Maintenance Fee, Childhood Lead Poisoning Prevention Fee, and Oil Spill Response, Prevention, and Administration Fees can be found in this historical table.
1989-90 to 2015-16 ► PDF | Excel
Open BOE CATEGORY: BOE Administration Data SUBCATEGORY: Administration DATASET: Summary of Revenues
Return to Table of Contents
Annual Report Statistical Tables Guide
Alcoholic Beverage Tax
Table 27 – Beer, Wine, and Distilled Spirits Excise Tax Collections This historical table details the excise tax collections by type of alcoholic beverage by fiscal year.
1932-35 to 2015-16 ► PDF | Excel
Open BOE CATEGORY: Alcoholic Beverage Tax SUBCATEGORY: Alcoholic Beverage Tax DATASET: Alcohol Tax Collected
Return to Table of Contents

Annual Report Statistical Tables Guide Alcoholic Beverage Tax
Table 28 – Apparent Consumption of Beer, Wines, and Distilled Spirits, by Fiscal Year This historical table shows the taxable volume by type of alcoholic beverage by fiscal year.
1935-40 to 2015-16 ► PDF | Excel
Open BOE CATEGORY: Alcoholic Beverage Tax SUBCATEGORY: Alcoholic Beverage Tax DATASET: Alcohol Consumption, by Fiscal Year
Return to Table of Contents
Annual Report Statistical Tables Guide Alcoholic Beverage Tax
Table 29 – Per Capita Consumption of Beer, Wines, and Distilled Spirits, by Fiscal Year This historical table shows the per capita consumption of beer, wines, and distilled spirits by fiscal year.
1935-36 to 2015-16 ► PDF | Excel
Open BOE CATEGORY: Alcoholic Beverage Tax SUBCATEGORY: Alcoholic Beverage Tax DATASET: Alcohol Consumption Per Capita
Return to Table of Contents

Annual Report Statistical Tables Guide
Cigarette Tax
Table 30A – Cigarette Taxes and Other Tobacco Products Surtax Revenue This historical table shows cigarette tax and tobacco products surtax revenue by fiscal year.
1959-60 to 2015-16 ► PDF | Excel
Open BOE CATEGORY: Cigarette and Tobacco Products Tax SUBCATEGORY: Cigarette and Tobacco Products Tax DATASET: Cigarette and Tobacco Revenue
Return to Table of Contents
Annual Report Statistical Tables Guide Cigarette Tax
Table 30B – Cigarette Distributions and Per Capita Consumption This historical table shows California cigarette distributions and apparent per capita consumption by fiscal year.
1959-60 to 2015-16 ► PDF | Excel
Open BOE CATEGORY: Cigarette and Tobacco Products Tax SUBCATEGORY: Cigarette and Tobacco Products Tax DATASET: Cigarette and Tobacco Distribution and Consumption
Return to Table of Contents

Annual Report Statistical Tables Guide
Insurance Tax
Table 31 – Taxable Insurance Premiums and Total Taxes Assessed, by Company This table displays taxable insurance premiums and total taxes assessed by company for fire and casualty insurers and for life insurers.
2016 ► PDF | Excel
2015 ► PDF | Excel
2014 ► PDF | Excel
2013 ► PDF | Excel
2012 ► PDF | Excel
2011 ► PDF | Excel
2010 ► PDF | Excel
2009 ► PDF | Excel
2008 ► PDF | Word | Excel
2007 ► PDF | Word | Excel
2006 ► PDF | Word
2005 ► PDF | Word
2004 ► PDF | Word
2003 ► PDF | Word
2002 ► PDF | Word
2001 ► PDF | Word
2000 ► PDF | Word
Open BOE CATEGORY: Miscellaneous Fees, Taxes, and Surcharges SUBCATEGORY: Insurance Tax
DATASET: Insurance Tax Assessed, by Company
Lists every company including title insurance companies.
Return to Table of Contents

Annual Report Statistical Tables Guide Insurance Tax
Table 32 – Summary of Insurance Taxes Assessed Against Companies Authorized to Do Business in California, by Type of Insurer This table is a two-year comparison summarizing insurance taxes assessed by insurer type.
2015 and 2016 ► PDF | Excel
2014 and 2015 ► PDF | Excel
2013 and 2014 ► PDF | Excel
2012 and 2013 ► PDF | Excel
2011 and 2012 ► PDF | Excel
2010 and 2011 ► PDF | Excel
2009 and 2010 ► PDF | Excel
2008 and 2009 ► PDF | Excel
2007 and 2008 ► PDF | Word | Excel
2006 and 2007 ► PDF | Word | Excel
2005 and 2006 ► PDF | Word
2004 and 2005 ► PDF | Word
2003 and 2004 ► PDF | Word
2002 and 2003 ► PDF | Word
2001 and 2002 ► PDF | Word
2000 and 2001 ► PDF | Word
1999 and 2000 ► PDF | Word
Open BOE CATEGORY: Miscellaneous Fees, Taxes, and Surcharges SUBCATEGORY: Insurance Tax
DATASET: Insurance Tax Assessed, by Insurer Type
Return to Table of Contents

Annual Report Statistical Tables Guide Insurance Tax
Table 33 – Insurance Tax Assessments Against Licensed Insurers, Tax Rate, Taxes on Premiums, Local Property Tax Credits Allowed, Taxes on Ocean Marine Business, and Total Taxes Assessed This historical table shows insurance tax assessment information by assessment year.
1911 to 2016 ► PDF | Excel
Open BOE CATEGORY: Miscellaneous Fees, Taxes, and Surcharges SUBCATEGORY: Insurance Tax
DATASET: Insurance Tax Total Assessments
Return to Table of Contents
Annual Report Statistical Tables Guide
Resources Surcharges
Table 34 – Energy Resources Surcharge and Gas Consumption Surcharge Revenue This historical table shows revenues from the (electrical) energy resources surcharge and the (natural) gas consumption surcharge by fiscal year.
1974-75 to 2015-16 ► PDF | Excel
Open BOE CATEGORY: BOE Administration Data SUBCATEGORY: Administration DATASET: Summary of Revenues
Return to Table of Contents

Annual Report Statistical Tables Guide
Telephone Taxes
Table 35 – Emergency Telephone Users (911) Surcharge and (Moore) Universal Telephone Service Tax Revenue This historical table shows revenues from the Emergency Telephone Users (911) Surcharge and (Moore) Universal Telephone Service Tax Revenue by fiscal year.
1977-78 to 2014-16 ► PDF | Excel
Open BOE CATEGORY: BOE Administration Data SUBCATEGORY: Administration DATASET: Summary of Revenues
Return to Table of Contents

Annual Report Statistical Tables Guide
Other Taxes and Fees
Table 36A – Hazardous Substances Tax, Integrated Waste Management Fee, California Tire Fee, Occupational Lead Poisoning Prevention Fee, and Marine Invasive Species Fee Revenue This historical table shows revenues from the Hazardous Substances Tax, Integrated Waste Management Fee, California Tire Fee, Occupational Lead Poisoning Prevention Fee, and Marine Invasive Species Fee by fiscal year.
1981-82 to 2015-16 ► PDF | Excel
Open BOE CATEGORY: BOE Administration Data SUBCATEGORY: Administration DATASET: Summary of Revenues
Return to Table of Contents
Annual Report Statistical Tables Guide Other Taxes and Fees
Table 36B – Water Rights Fee, Electronic Waste Recycling Fee, Fire Prevention Fee, and Lumber Products Assessment Revenue This historical table shows revenues from the Water Rights Fee, Electronic Waste Recycling Fee, State Responsibility Area Fire Prevention (Fire) Fee, and Timber Regulation and Forest Restoration (Lumber) Fee by fiscal year.
2003-04 to 2014-15 ► PDF | Excel
Open BOE CATEGORY: BOE Administration Data SUBCATEGORY: Administration DATASET: Summary of Revenues
Return to Table of Contents

Annual Report Statistical Tables Guide Other Taxes and Fees
Table 37A – eWaste Fee Collections This historical table details electronic waste recycling fee revenues by video display size by fiscal year.
2005–06 to 2015-16 ► PDF | Excel
Open BOE CATEGORY: Environmental Fees SUBCATEGORY: Covered Electronic Waste Recycling Fee DATASET: eWaste Fee Collections
Return to Table of Contents
Annual Report Statistical Tables Guide Other Taxes and Fees
Table 37B – Reported Consumption of Covered Electronic Devices This historical table details the taxable sales and leases of covered electronic devices by video display size by fiscal year.
2005–06 to 2015–16
► PDF | Excel
Open BOE CATEGORY: Environmental Fees SUBCATEGORY: Covered Electronic Waste Recycling Fee DATASET: eWaste Fee Collections
Return to Table of Contents