some redox indicators. - the journal of biological ... some redox indicators far as they contained...
TRANSCRIPT
SOME REDOX INDICATORS.
BY L. MICHAELIS AND H. EAGLE.
(From the Johns Hopkins Hospital, Baltimore, and the Laboratories of The Rockefeller Institute for Medical Research, New York.)
(Received for publication, April 23, 1930.)
The calorimetric determination of oxidation-reduction potentials by means of dyestuff indicators has been placed on a sound theore- tical foundation by Clark and his associates (1). Some more indi- cators have been recently measured by Rapkine, Struyk, and Wurmser (2), furthermore by Vellinger (3). The practical appli- cation of this principle can be improved upon only by finding new indicators, in the first place to enlarge the range of redox potential accessible to a calorimetric determination especially towards the negative (hydrogen) side of the potential scale, and secondly to duplicate the dyes now available with others covering the same potential range, but of different chemical constitution. The agreement of a potential determined by several indicators of different chemical constitution is the best evidence for the reli- ability of the indicator method.
In the present paper three dyestuffs are to be described which may be useful for the indicator method. All three have been known for a long time but were never used for any scientific pur- pose. They form entirely reversible redox systems and give true homogeneous non-colloidal solutions in the ordinary buffers in a concentration sufficient for any calorimetric use.’ These dyes turned out to be practically pure as delivered from the factory in so
1 The authors are indebted to the I. G. Aktiengesellschaft Farbenin- dustrie, Germany, for these dyes. They were selected from a large collec- tion of dyes placed at our disposal according to our suggestions from the stock of the scientific laboratories of this company. We are especially indebted to the liberality of Dr. H. Benda and Dr. I. Peiser. The dyestuffs will be distributed by the Winthrop Chemical Company, Incorporated, 170 Varick Street, New York, N. Y. These will be in accurate agreement with the formulas shown in this paper.
713
by guest on May 10, 2018
http://ww
w.jbc.org/
Dow
nloaded from

714 Some Redox Indicators
far as they contained no other reducible substance, at least none which would cause an overlapping of the titration curve or show a confusing color effect. As the course of the titration curves is strictly that of simple reversible systems we may also exclude the possibility that any of these dyes might be a mixture of different chemical individuals with overlapping curves. These three dyes are the following.
1. Gallocyanine2 (Kiichlin, 1881).
OH @H&N 0
This is an oxazine and is of amphoteric nature. It is easily soluble at alkaline and at strongly acid reaction, but very slightly soluble between pH 5.5 and 3.5. The solutions have a red-violet color at pH < 4, blue from pH 5.5 to about 8, and red-violet at pH > 8. The insoluble form is obviously that of the isoelectric compound. The red form at strongly acid reaction is the positive ion, ionized at the dimethylamino group, the blue state is the monovalent ion due to the carboxyl group, and the red form at pH > 8 is a bivalent anion due to the hydroxyl group. The reduced form contains an additional hydroxyl group, and, being a polyphenol, it reacts with boric acid to give a complex acid. This prevents the use of the borate buffer in calibrating the constants of the dye. That range of pH (around 8) which is covered only by the borate buffer hap- pens to be a very important range for the characterization of the dye, as can be seen from the curve in Fig. 3. In order to fill the gap due to this deficiency of the borate buffer we used successfully the Verona1 buffer recently described (6).
From the properties mentioned above it is easily understood that gallocyanine is very slightly soluble in pure water. The dye can be easily dissolved, however, in any buffer outside the range of pH 4 to 5. For the measurements presently to be described the dye was directly dissolved in the buffer used for the particular experiment.
The potential range of gallocyanine is rather close to that of
2 See Schultz (4) No. 626, or (5) No. 883.
by guest on May 10, 2018
http://ww
w.jbc.org/
Dow
nloaded from
L. Michaelis and H. Eagle 715
methylene blue, a desirable property in view of the known inade- quacies of the latter and the importance of the range it covers (1, 7). Moreover, such a duplication is desirable because of the fact that methylene blue, and the similar Lauth’s violet and toluyl- ene blue, are basic dyes, whereas gallocyanine at the pH range of biological importance acts as an acid dye. This dye may there- fore be very useful in biology.
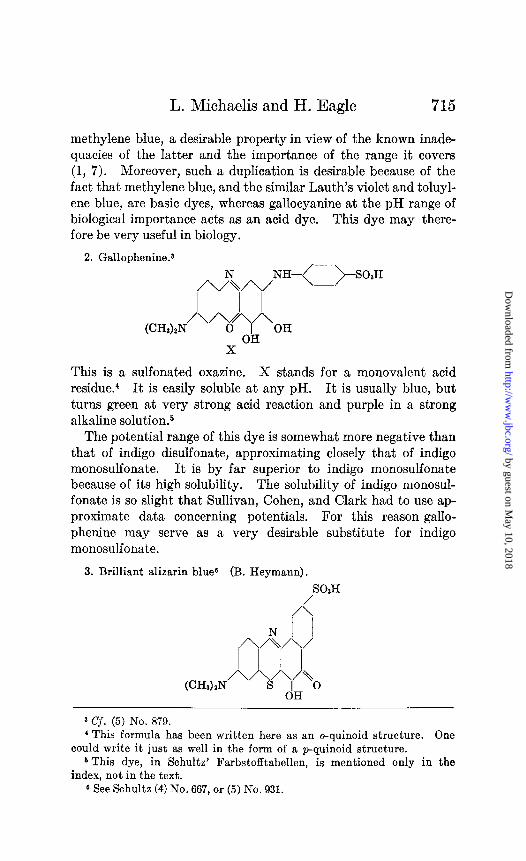
2. Gallophenine.3
(CH) N”“b//\ 32 f ‘OH OH
X
This is a sulfonated oxazine. X stands for a monovalent acid residue.4 It is easily soluble at any pH. It is usually blue, but turns green at very strong acid reaction and purple in a strong alkaline solution.5
The potential range of this dye is somewhat more negative than that of indigo disulfonate, approximating closely that of indigo monosulfonate. It is by far superior to indigo monosulfonate because of its high solubility. The solubility of indigo monosul- fonate is so slight that Sullivan, Cohen, and Clark had to use ap- proximate data concerning potentials. For this reason gallo- phenine may serve as a very desirable substitute for indigo monosulfonate.
3. Brilliant alizarin blues (B. Heymann).
SO,H / A j I i,x,,
(CH&N /\/y\,Ao
OH
3 Cf. (5) No. 879. 4 This formula has been written here as an o-quinoid structure. One
could write it just as well in the form of a p-quinoid structure. 6 This dye, in Schultz’ Farbstofftabellen, is mentioned only in the
index, not in the text. 6 See Schultz (4) No. 667, or (5) No. 931.
by guest on May 10, 2018
http://ww
w.jbc.org/
Dow
nloaded from

716 Some Redox Indicators
This is a sulfonated thiazine. Its solubility in pure water is, though not high, entirely sufficient. When the dye is added to pure cold water, there is an undissolved residue; but when the fil- trate is mixed with a buffer of pH around 7 it remains clear and behaves as a true homogeneous solution. Especially the titration curve, as described in the following, precisely fits the course ex- pected for a truly dissolved and completely reversible dye, if the concentration of the dye is small enough. The filtered pure aqueous solution is the adequate form of a stock solution and should be mixed with the buffer solution desired immediately before use.
The dye has a potential range more negative than any of the indigo sulfonates and therefore represents a valuable extension of the series of really reversible redox indicators, though there may be cases where the peculiarity of this dye with regard to its solu- bility may cause difficulties.
The solution of the dye is blue-violet in water. At very low pH (approximately 1) it changes a little towards blue. The violet becomes more pronouncedly blue at pH 7, and remains so down to very alkaline ranges.
Methods Used for Titrations.
The methods of tritration have been so carefully described by Clark that only little need be said in this respect. We wish, how- ever, to add two items, one of perhaps only theoretical, the other of practical significance.
1. Use of Mercury Electrode in Presence of Hydrogen Gas.-When the oxidized form of the dye is reduced by a reductant such as sodium hydrosulfite, in many cases the mercury electrode can be used as an indifferent electrode even in an atmosphere of hydrogen gas. Mercury shows no inclination to work as a hydrogen elec- trode in the presence of hydrogen gas, and the potential of the reversible redox system can therefore be measured at the mercury electrode provided this potential is negative enough to reduce or per- haps eliminate by complex formation those traces of mercury ions which may be formed in the beginning of the experiment, and, on the other hand, is not too negative, the limit in this respect being set by the fact that even pure hydrosulfite shifts the potential of the mercury electrode no further than a poorly defined value 100
by guest on May 10, 2018
http://ww
w.jbc.org/
Dow
nloaded from
L. Michaelis and H. Eagle 717
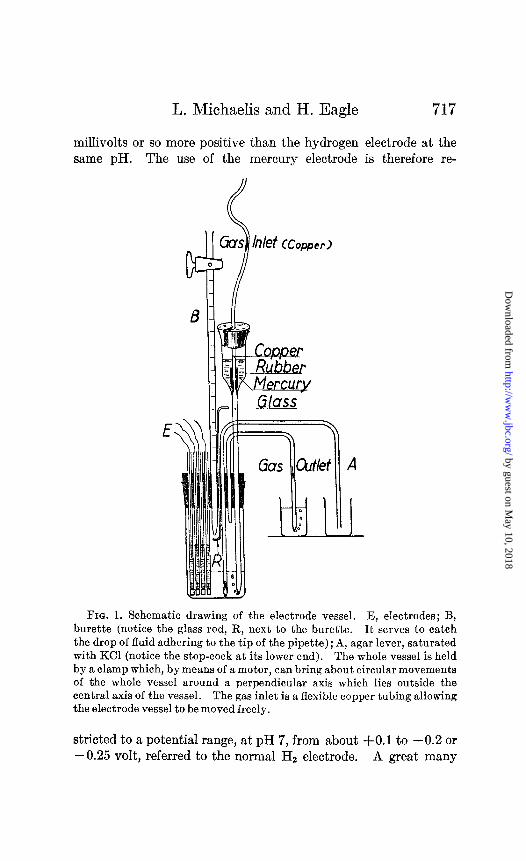
millivolts or so more positive than the hydrogen electrode at the same pH. The use of the mercury electrode is therefore re-
FIQ. 1. Schematic drawing of the electrode vessel. E, electrodes; B, burette (notice the glass rod, R, next to the burette. It serves to catch the drop of fluid adhering to the tip of the pipette); A, agar lever, saturated with KC1 (notice the stop-cock at its lower end). The whole vessel is held by a clamp which, by means of a motor, can bring about circular movements of the whole vessel around a perpendicular axis which lies outside the central axis of the vessel. The gas inlet is a flexible copper tubing allowing the electrode vessel to be moved freely.
stricted to a potential range, at pH 7, from about +O.l to -0.2 or -0.25 volt, referred to the normal Hz electrode. A great many
by guest on May 10, 2018
http://ww
w.jbc.org/
Dow
nloaded from

718 Some Redox Indicators
of the preliminary measurements for orientation were made by this method.
W. Use of Colloidal Palladium for Titration.-Most of the meas- urements were performed in the following way. The electrode vessel (Fig. 1) was a cylindrical bottle, of such dimensions that the solution to be titrated (25-30 cc.) occupied a depth of only about 3 to 4 cm., to allow stirring. The bottle was closed by a rubber stopper through which were fixed :
A glass tube as a gas inlet. The gases were purified over heated copper, as described by Michaelis and Flexner (ES), and conducted through copper tubing. As the description of the connection of the gas inlet in the paper just mentioned seems a little too brief, it may be given in more detail here. The copper tubing coming from the furnace is fixed as shown in Fig. 1. The opening is mounted with a short rubber tubing (Fig. 1). This is stripped over glass tubing and the glass calix is filled with mercury. A loosely fitting rubber stopper with a slit holds the copper tubing in place and prevents the mercury from splashing when the whole apparatus is being stirred.
A glass tube as gas outlet. An agar tube saturated with KC1 as bridge. The most suitable
form, which at the same time leaves a minimum of contact surface for diffusion, was this. The glass lever (A, Fig. 1) is open at the end but carries a not too well ground stopper at the other end. The handle of the stopper should not have a larger diameter than the glass tube, so that it can be pushed through the hole of the rubber stopper of the electrode vessel. This glass stopper has on its upper end a hook and the glass tube contains inside a small thickened spot which serves as a support for the hook. The stop- per is turned into the fitting position. The whole lever is filled with agar saturated with KCl, and the glass stopper fitted in, not too tightly, so as to leave a capillary agar connection. This stopper, after use, may be regenerated by keeping it under satu- rated KC1 solution, without its being necessary to refill the whole tube each time.
A platinized platinum electrode, by which the pH of the solution after complete reduction is measured directly. On measuring the pH directly one need not rely on the pH as calculated from the composition of the buffer. One may work then even with buffers
by guest on May 10, 2018
http://ww
w.jbc.org/
Dow
nloaded from
L. Michaelis and H. Eagle 719
which are not standardized; e. g., with phosphates of a concentra- tion other than that of the standard solution. This is especially important when a dye has to be dissolved in pure water and a buffer is added later.
Three blank electrodes, say two of blank platinum and a gold- plated one.
A burette (B) calibrated in hundredths of a cc., the glass cock being located close to the upper end, above the zero point of the graduation.
It is very useful to have a glass rod (R) with small spoon-like hook. This rod should fit tightly, but be movable. It serves to catch an adhering drop of the oxidant from the tip of the burette during the titration.
In the beginning of the experiment 0.1 to 0.3 cc. of a solution of colloidal palladium according to Nacht-Pahl (1 gm. to a liter of water) is added and the reduction is carried out by means of a stream of hydrogen. After complete reduction the pH is measured with the platinized electrode. Now the gas lead is shifted to nitro- gen, and the hydrogen is expelled from the solution and from the palladium. The potential of the platinized electrode is watched during this period. The removal of the hydrogen gas may safely be considered as complete for any practical purpose when the poten- tial of the platinized electrode has become more positive by 80 to 100 millivolts. The crucial test for the complete removal of hydrogen is the observation that the very first drop of the oxidant added to the solution brings about not only an immediate colora- tion, but a coloration which persists indefinitely. A trace of hydrogen that may have remained will reduce the dye over again.
One may be surprized that the removal of hydrogen from palla- dium can be brought about so completely in a relatively short period of time (30 to 60 minutes). One may, however, take into consideration the fact that the total amount of palladium con- tained in the solution is a small fraction of 1 mg. and that the ultramicroscopic particles of palladium are brought to absorption equilibrium with the surrounding gas much more quickly than a macroscopic particle of the metal.
As this electrode vessel is attached to the gas inlet in an elastic, flexible manner, the stirring can be produced by shaking, and there is no need for a stirring rod with all its inconveniences. The
by guest on May 10, 2018
http://ww
w.jbc.org/
Dow
nloaded from
720 Some Redox Indicators
stirring, after each addition of the content of the burette, may be done by hand, or better, by a shaking apparatus which executes circular movements of the vessel around a perpendicular axis. This arrangement allows one to read the potential either at rest or during the shaking and to study the influence of shaking. In well poised systems, there is a very small but distinct difference, notice- able even in the case of a hydrogen electrode with platinized platinum. Usually the potential is more negative by some tenths of a millivolt at rest than while being shaken. The poten- tial at rest is to be considered as the desired value, because the thermodynamic theory on which the establishment of the potential is based does not take into account a mechanical movement of the electrode relative to the liquid in contact with it, which may inter- fere mechanically with the establishment of the electric double layer responsible for the potential difference. On the other hand without a thorough previous shaking there is no guarantee of a definite state of equilibrium throughout the whole system including the surface layer of the liquid immediately adjacent to the elec- trode.
The whole apparatus, consisting of the electrode vessel, a great part of the copper leads for the gases, the shaking apparatus, and the calomel electrodes, was kept in a compartment of constant temperature large enough to work in conveniently. The tempera- ture was controlled by a toluene-mercury regulator, the heat being furnished from freely suspended heating wires of nichrome, the heat of which was blown off by an electric fan. The temperature of a bottle with water of the heat capacity of the electrode vessel was constant within much less than O.l”, the constant temperatures being reached within 20 to 30 minutes. Almost all these experi- ments were made at 25”. Some experiments at 35” show that the temperature coefficients of the dye potentials are very small.
In most cases quinone was used as oxidant, sometimes also phenol indophenol or ferricyanide. The solution should be deaer- ated before pouring it into the burette. The air may be removed simply from the quinone solution by briefly boiling and immedi- ately sucking it into the burette.
Result of Titration Experiments.
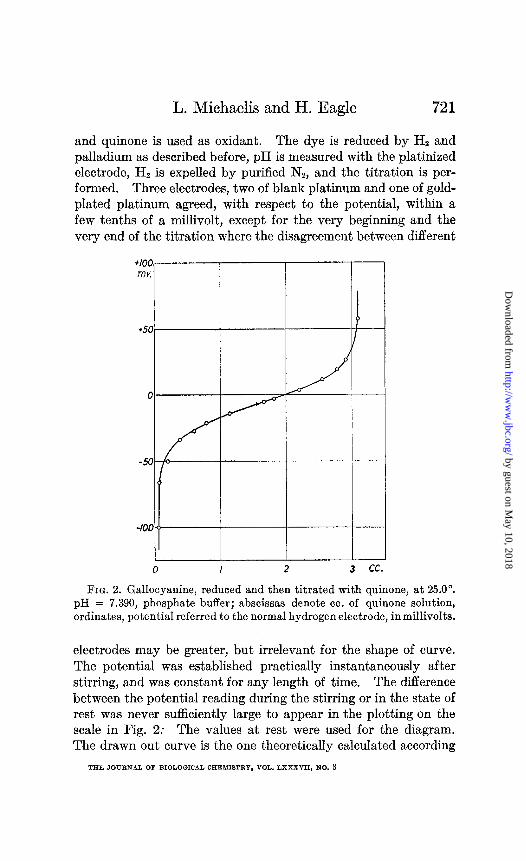
1. Gallocyanine.-Fig. 2 shows one example of a titration experi- ment at constant pH. The dye is dissolved in a phosphate buffer,
by guest on May 10, 2018
http://ww
w.jbc.org/
Dow
nloaded from
L. Michaelis and H. Eagle 721
and quinone is used as oxidant. The dye is reduced by Hz and palladium as described before, pH is measured with the platinised electrode, Hz is expelled by purified N,, and the titration is per- formed. Three electrodes, two of blank platinum and one of gold- plated platinum agreed, with respect to the potential, within a few tenths of a millivolt, except for the very beginning and the very end of the titration where the disagreement between different
+ioo my.
+50
0
-50
0 I 2 3 cc.
FIG. 2. Gallocyanine, reduced and then titrated with quinone, at 25.0”. pH = 7.390, phosphate buffer; abscissas denote cc. of quinone solution, ordinates, potential referred to the normal hydrogen electrode, in millivolts.
electrodes may be greater, but irrelevant for the shape of curve. The potential was established practically instantaneously after stirring, and was constant for any length of time. The difference between the potential reading during the stirring or in the state of rest was never sufficiently large to appear in the plotting on the scale in Fig. 2: The values at rest were used for the diagram. The drawn out curve is the one theoretically calculated according
by guest on May 10, 2018
http://ww
w.jbc.org/
Dow
nloaded from

722 Some Redox Indicators
to the principles set forth by Clark. From this curve E,‘, or the potential of the dye in the half reduced state referred to the normal hydrogen electrode, is best evaluated graphically. The assump- tion underlying the calculation of pH is that the pH of standard acetate is 4.62. From this assumption the potential of the calomel electrode used referred to the normal hydrogen electrode, was calculated, and this standardization of the calomel electrode was frequently repeated during the course of the series of individual
400 my. \
+50
0
-50,
-100
-I50
k 6 65 7 75 8 pH & B 95 IO I05 /I.
FIG. 3. Potential of gallocyanine in the half reduced state at varied pH, at 25.0”.
The abscissas denote pH; ordinates, potential, referred to the normal hydrogen electrode, in millivolts. Buffers, o phosphate, q veronal, A glycocoll. The curve as interpolated from the experiments is dotted. The tangents of 0.06 slope respectively 0.03 slope are drawn out. pK,, pK,, dissociation constants of the reduced form and the oxidized form respectively.
titration experiments. Only one titration experiment is shown in detail, but all the others were used similarly to calculate the Eo’ at various pH graphically shown in Fig. 3. Borate buffer could not be used because the reduced form of the dye has two phenolic hydroxyl groups. Experiments with borate as buffer gave a curve deviating markedly from that expected for an undisturbed system of reversible dye, the curve being much too flat in the beginning. When, by fitting best values to such an unsatisfactory curve, a trial calculation of Eo’ was made, a value quite outside that of the theo-
by guest on May 10, 2018
http://ww
w.jbc.org/
Dow
nloaded from

L. Michaelis and H. Eagle 723
retical curve was found. None of the following buffers showed this specific effect: Sorensen’s phosphate buffers, mixtures of second- ary phosphate and NaOH, acetate buffer, Verona1 buffer (recently recommended (6)), and glycocoll buffer.
The diagram, Fig. 3, shows that the slope of 0.0591 volt shift per unit of pH holds between pH about 6 to 9. There is a deviation from this slope towards the acid side from 5.5. This part of the curve could not be investigated in more detail because at pH < 5.5
5 R “U 7 R 0 , “ ”
FIG. 4. Potential of gallophenine in the half reduced state, at varied pH, and at 25.0”. The abscissas denote pH; ordinates, potentials referred to the normal hydrogen electrode, in millivolts. Buffers, A acetate, o phos- phate, EI veronal, * glycocoll.
we approach that range of pH in which the solubility of the dyes becomes too slight to allow accurate titration experiments, and the figures obtained in this range are omitted in the diagram. A second deviation is encountered between pH 9 and 10. This range of deviation of the slope coincides with the range of color change of dye from blue to red-violet, indicating that it is due to the effect of an acid or basic dissociation constant of the dye, as Clark has shown in many instances. On applying his principles one may calculate graphically a dissociation constant for the oxidized form
by guest on May 10, 2018
http://ww
w.jbc.org/
Dow
nloaded from

724 Some Redox Indicators
of the dye, pK,, and another for the reduced form, pK7. This is performed by drawing the best fitting tangent with the slope of 0.0591
2 volt per unit of PH. The two points of intersection of such
0 83 cc. h7 FIQ. 5. Titration of reduced brilliant aliaarin blue with quinone.
5.918. Abscissas denote cc. of quinone solution, pH =
ordinates, millivolts referred to the normal hydrogen electrode.
potential in
tangents give the two dissociation constants at the abscissa. The first of these, pK, = 9.1 owing to the fact that the curve is flattened at this region, according to the theory beIongs to the reduced form, the second, pK, = 10.1, to the oxidized form, because the curve becomes steeper.
by guest on May 10, 2018
http://ww
w.jbc.org/
Dow
nloaded from

L. Michaelis and H. Eagle 725
2. GaZZophenine.-The data for Ed at various pH are plotted in Fig. 4. The curve has a slope of 0.0591 volt per pH unit, and the observed points fit into this straight line throughout the whole range of pH investigated, except for pH < 6, where a dissociation constant of the dye obviously interferes.
3. Brilliant Alizarin Blue G.-Here one individual titration experiment is shown in detail (Fig. 5), and the result of all experi-
rncl I 1
-1s I I I\1 I I
I I I Ill I -,5L I \ I I I \nl I
-20
-350
-400 L 3 4 5 6 7pH 8 9 IO II 12
FIG. 6. Potential of brilliant alizarin blue, in the half reduced state at varied pH, at 25.0”. The abscissas denote pH, ordinates, potential in millivolts, referred to the normal hydrogen electrode. The left-hand curve is an extension of the right-hand curve to the left, with respectively shifted ordinates, to save space. The drawn out lines are the tangents with the slope 0.0591 respectively 0.02905. p& pK, are dissociation constants of the reduced form and the oxidized form respectively. Puffers, o phos- phate, 0 veronal, A acetate.
ments is plotted in Fig. 6. The slope is regular between at least pH 5.5 and 7.8 within the limits of error, then flattens and regains the normal slope from about 8.6 into the most alkaline range inves- tigated. The intermediary part of the curve, around pH 9, could be studied only by means of the Verona1 buffer. The points around pH 7.5, where the phosphate and the Verona1 buffers overlap, were studied with either buffer, and a perfect agreement was obtained.
by guest on May 10, 2018
http://ww
w.jbc.org/
Dow
nloaded from

726 Some Redox Indicators
On applying the graphic construction mentioned above one obtains as a dissociation constant for the reduced dye pK, = 7.8, and for the oxidized dye pLI, = 8.2. The deviation from the straight line throughout the pH range 6 to 11 is small indeed. The straight line between pH 6 and 8, and the one between 9 and 11, are only 0.1 unit of pH apart. Yet we do not believe this separation to
TABLE I.
Potentials of the Half Reduced Dyes Referred to the Normal Hydrogen Electrode at 25”.
PH Brilliant
alirarin blue.
5 -0.040 5.25 -0.062 5.5 -0.080 5.75 -0.097 6 -0.112 6.25 -0.127 6.5 -0.143 6.75 -0.157 7 -0.173 7.25 -0.188 7.5 -0.203 7.75 -0.216 8 -0.226 3.25 -0.237 8.5 -0.250 3.75 -0.265 9 -0.279 9.25 -0.293 9.50 -0.309 9.75 -0.323
10 -0.337
-
-
Gallophenine.
-0.003 -0.023 -0.042 -0.060 -0.077 -0.094 -0.110 -0.127 -0.142 -0.157 -0.172 -0.187 -0.202 -0.217 -0.232 -0.247 -0.262 -0.276 -0.291
-
-.
-
Indigo disulfonate.
-0.10
-0.069
-0.125
-0.167
-0.199
hllocyanine.
f0.110 +0.095 +o.oso +0.065 +o .051 +0.46 +o .021 +o .007 -0.008 -0.023 -0.037 -0.042 -0.067 -0.082 -0.095 -0.107 -0.118 -0.128 -0.140
The values for indigo disulfonate and methylene blue are shown for comparison and have been taken from the measurements of Clark and his associates, at 30”.
be within the errors of the experiments; even when we allow for errors within reasonable limits it is impossible to connect all ob- served points from pH 6 to 11 by one straight line of the slope 0.0591 per unit of pH.
In using these dyes as redox indicators the following suggestions
by guest on May 10, 2018
http://ww
w.jbc.org/
Dow
nloaded from

L. Michaelis and H. Eagle 727
with regard to solubility may be made. Gallocyanine is best dis- solved directly in the buffer to be used. Gallophenine is so easily soluble under any condition that no special precautions are necessary. Brilliant alizarin blue is best dissolved in pure water, filtered, and this filtrate may be used as a stock solution and added to the buffer to be used. If prepared in this way the solution of the dye in the buffer behaves as a true homogeneous, non-colloidal solution, as can be inferred from the titration curves.
All these experiments were made at 25’ =t 0.05”. A few experiments were made at 35”, and the temperature coeffi-
cient turned out to be very small. Not enough data are available as yet to give accurate figures. Table I gives the E,‘; i.e., the potential of the half reduced dye, at 25” and at various pH, and some comparative data at 30” for the dyes of Clark’s series.
SUMMARY.
Three new redox indicators are characterized, and their poten- tials summarized in Table I.
Technical details for general measurement of reversible redox systems and their titration are described.
BIBLIOGRAPHY.
1. Clark, W. M., Cohen, B., Sullivan, M. X., Gibbs, H. D., and Cannan, R. K., Bull. Hyg. Lab., U.S. P. H. S., No. 151 (1928).
2. Rapkine, L., Struyk, A. P., and Wurmser, R., J. chim. physique, 26, 340 (1929).
3. Vellinger, E., Arch. physique biol., 7,113 (1929). 4. Schultz, G., Farbstofftabellen, Berlin (1914). 5. Rowe, F. M., Colour index, Bradford (1924). 6. Michaelis, L., J. Bid. Chem., 87,33 (1930). 7. Clark, W. M., Cohen, B., and Gibbs, H. D., Pub. Health Rep.,
U. S. P. H. S., 40,113l (1925), reprinted also in (1). 8. Michaelis, L., and Flexner, L. B., J. Bid. Chem., 79,689 (1928).
by guest on May 10, 2018
http://ww
w.jbc.org/
Dow
nloaded from

L. Michaelis and H. EagleSOME REDOX INDICATORS
1930, 87:713-727.J. Biol. Chem.
http://www.jbc.org/content/87/3/713.citation
Access the most updated version of this article at
Alerts:
When a correction for this article is posted•
When this article is cited•
alerts to choose from all of JBC's e-mailClick here
ml#ref-list-1
http://www.jbc.org/content/87/3/713.citation.full.htaccessed free atThis article cites 0 references, 0 of which can be
by guest on May 10, 2018
http://ww
w.jbc.org/
Dow
nloaded from