resource optimization in device-to-device cellular … optimization in device-to-device cellular...
TRANSCRIPT

1
Resource Optimization in Device-to-Device CellularSystems Using Time-Frequency Hopping
Qiaoyang Ye, Mazin Al-Shalash, Constantine Caramanis and Jeffrey G. Andrews
Abstract—We develop a flexible and accurate frameworkfor device-to-device (D2D) communication in the context of aconventional cellular network, which allows for time-frequencyresources to be either shared or orthogonally partitioned betweenthe two networks. Using stochastic geometry, we provide accurateexpressions for SINR distributions and average rates, underan assumption of interference randomization via time and/orfrequency hopping, for both dedicated and shared spectrumapproaches. We obtain analytical results in closed or semi-closed form in high SNR regime, that allow us to easily explorethe impact of key parameters (e.g., the load and hoppingprobabilities) on the network performance. In particular, unlikeother models, the expressions we obtain are tractable, i.e., theycan be efficiently optimized without extensive simulation. Usingthese, we optimize the hopping probabilities for the D2D links,i.e., how often they should request a time or frequency slot.This can be viewed as an optimized lower bound to other moresophisticated scheduling schemes. We also investigate the optimalresource partitions between D2D and cellular networks when theyuse orthogonal resources.
I. INTRODUCTION
By allowing direct communication between physically prox-imal devices, device-to-device (D2D) communication canreduce energy consumption, efficiently utilize the networkresources, reduce end-to-end latency, and increase the networkcapacity and flexibility. Consequently, D2D communicationis emerging as a potentially important technology componentfor LTE-Advanced, aiming to meet the growing demand forlocal wireless services [2–5]. Unlike general ad hoc networks,D2D can benefit from cellular infrastructure (e.g., networkcoordinated device discovery, synchronization and enhancedsecurity), and can operate on licensed bands, which makesresource allocation more tractable and reliable.
In the D2D-enabled cellular network, D2D links can eitheruse orthogonal resources or share resources with the cellularnetwork. In a network with orthogonal allocation – called adedicated network – the interference management is simpli-fied, but the resource utilization may be less efficient. On theother hand, if D2D transmissions reuse cellular resources –called a shared network – network resources can be usedmore efficiently, at the cost of a denser interference envi-ronment, which complicates interference management. Whichis preferable? Potential D2D data can either be transmitteddirectly (D2D), or via a base station (BS) – termed modeselection. When should a potential D2D link transmit directly,
Q. Ye, C. Caramanis and J. G. Andrews are with WNCG, The Univer-sity of Texas at Austin, USA, M. Shalash is with Huawei Technologies.Email: [email protected], [email protected], [email protected],[email protected]. A part of this paper will be presented at IEEEICC 2014 [1]. Manuscript last revised: May 8, 2014.
versus relaying via the BS? As we explain in detail below,we develop a flexible model to answer these questions byproviding accurate analytical results and simple semi-closedform expressions for performance bounds, which in turn areamenable to efficient optimization.
A. Related Work
Paper [6] investigates both the dedicated and shared ap-proaches for uplink resources and shows that in general, thededicated approach is more efficient in terms of transmissioncapacity – i.e., it allows more successful transmissions perunit area. On the other hand, in terms of total rate, [7] showsthe shared approach is better in a single cell scenario witha maximal rate cap, taking into account both the uplink anddownlink transmissions. For a shared network, careful resourceallocation can control the mutual interference between cellularand D2D transmissions. For example, an intelligent frequencyallocation where orthogonal resources are assigned to nearbycellular and D2D links [8], exclusive D2D transmission zones[9], mixed integer nonlinear programming problems [10, 11],auction based mechanisms in a downlink single cell [12, 13],a Stackelberg game framework in an uplink single cell [14],and interference randomization through time hopping [15] areviable approaches for controlling interference. Besides, perfor-mance analysis considering interference among D2D links isconducted in [16]. For mode selection, simple distance-basedand received signal-based mode selections are proposed in [17]and [18], respectively. More sophisticated mode selection in-volving other user equipments (UEs) are proposed in [19–21].Nevertheless, the majority of earlier studies consider a singlecell scenario and propose heuristic algorithms to improvenetwork performance. In this paper, we leverage tools fromstochastic geometry to study a more general D2D-enabledcellular network.
In a pure ad hoc network, there has been significantsuccess over the past decade in proposing tractable modelsfor performance analysis and system design via stochasticgeometry [22]. For example, [23] investigates an Aloha-typeaccess mechanism for a large ad hoc network, while [24]analyzes a carrier sense multiple access (CSMA)-type mech-anism. The outage probability and transmission capacity ofad hoc networks are studied and summarized in [25, 26].There have been some analogous more recent results forcellular networks [27, 28], where the BSs are modeled as aPoisson point process (PPP). D2D-enabled cellular networksare essentially a combination of cellular and ad hoc networks,but combining these models into a more general frameworkis nontrivial. D2D communication can either utilize uplink or
arX
iv:1
309.
4062
v3 [
cs.I
T]
7 M
ay 2
014

2
downlink resources, and it is not a priori clear which resourceutilization is better. There has been at least one very recent(parallel) work attempting this for the uplink system [29].For comparison and the completeness of study, we insteadinvestigate a D2D-enabled cellular network, where downlinkresources are either partitioned or shared between D2D anddownlink cellular transmissions.B. Contributions
The objective of this paper is to propose a general frame-work for the analysis of system performance (e.g., the signal-to-interference-plus-noise ratio (SINR) distribution and totalrate) in D2D-enabled cellular networks. We apply this frame-work to both dedicated and shared downlink networks, whichare easy to analyze and optimize, and can be adopted asflexible baseline models for further study. Our key contri-butions are enabled by simultaneously leveraging techniquesfrom stochastic geometry and optimization theory.
Tractable model for both dedicated and shared cellularnetworks. We propose a tractable model for a large D2D-enabled cellular network, where the locations of BSs andUEs are modeled as spatial point processes, particularly PPPs.We propose to adopt a time-frequency hopping scheme forpotential D2D links to randomize the interference, where eachpotential D2D link chooses its operation mode (i.e., D2Dor cellular mode) at each time slot independently accordingto a predefined time hopping probability, and accesses eachsubband independently with a predefined frequency hoppingprobability. In this model, the derived SINR distributions haveremarkably simple forms, which provide an efficient systemperformance evaluation without time-consuming simulations.It is not always possible to get the expected rate in closedform. We provide a general expression for the average rateand then derive its lower bound, which is in a semi-closedform in interference-limited networks.
Optimization of network performance and designinsights. Based on the derived SINR distributions and thelower bounds on average rates, we investigate the optimalD2D hopping probabilities (i.e., how often potential D2D linksshould request a time or frequency slot) using optimizationtheory. The optimal network performance can serve as alower bound for D2D-enable cellular networks with moresophisticated scheduling scheme. We find that in many cases,we can either derive the optimal solution in a simple closed-form, or reduce the problem to lower dimension (e.g., oneof the hopping probabilities is found in closed-form). Theobserved design principles are now summarized.
Dedicated vs. shared. Unsurprisingly, the dedicated networkhas better SINRs since resources allocated to D2D and cellularlinks are orthogonal. With an optimal spectrum partitionbetween D2D and cellular users, the dedicated network alsoprovides larger average rate, but should be interpreted cau-tiously. For example, the optimal spectrum partition may bevery hard to determine, or it may vary significantly in time orspace over a non-homogeneous network (recall we model allBSs and UEs as homogenous PPPs). In such cases, the sharedapproach may be able to perform significantly better, as it ismore flexible. For cases with small amount of local traffic, theshared approach may also have a better performance.
Optimal hopping scheme. In the dedicated network withany general non-decreasing utility function, the optimal D2Dfrequency hopping depends on the service demands of D2Dusers (i.e., the traffic arrival rate). D2D links with more trafficto transmit should be more aggressive in their spectrum access,despite the interference that this generates to the rest of thenetwork. The same observation can be done from simulationresults of the shared network.
As for time hopping, in most considered interference limitedcases with heavy load, all potential D2D links should operatein D2D mode (bypassing the BS), assuming the objective isto maximize the total average rate. This result is independentof the average distance between a D2D transmitter and itsreceiver, which is perhaps surprising, and largely due to the useof total average rate as the utility function. We demonstrate thisby giving an example in Section V-A, showing that the optimalmode selection for different utility functions may be verydifferent. In principle, any utility function can be investigatedbased on the proposed framework, but we use total average ratein a heavily loaded network, and leave other utility functionsto future work.
The paper is organized as follows. We present the systemmodel in Section II. In Sections III and IV, we analyzethe SINR distributions and average rates in dedicated andshared networks, respectively. We investigate the optimizationin terms of hopping probabilities in Section V. The numericalresults are given in Section VI. Finally, we conclude andsuggest possible extensions in Section VII.
II. SYSTEM MODEL
We focus on a downlink model, where D2D communicationuses downlink cellular resources. The key aspects of the modelare described in the following subsections.A. Deployment of D2D and cellular networks
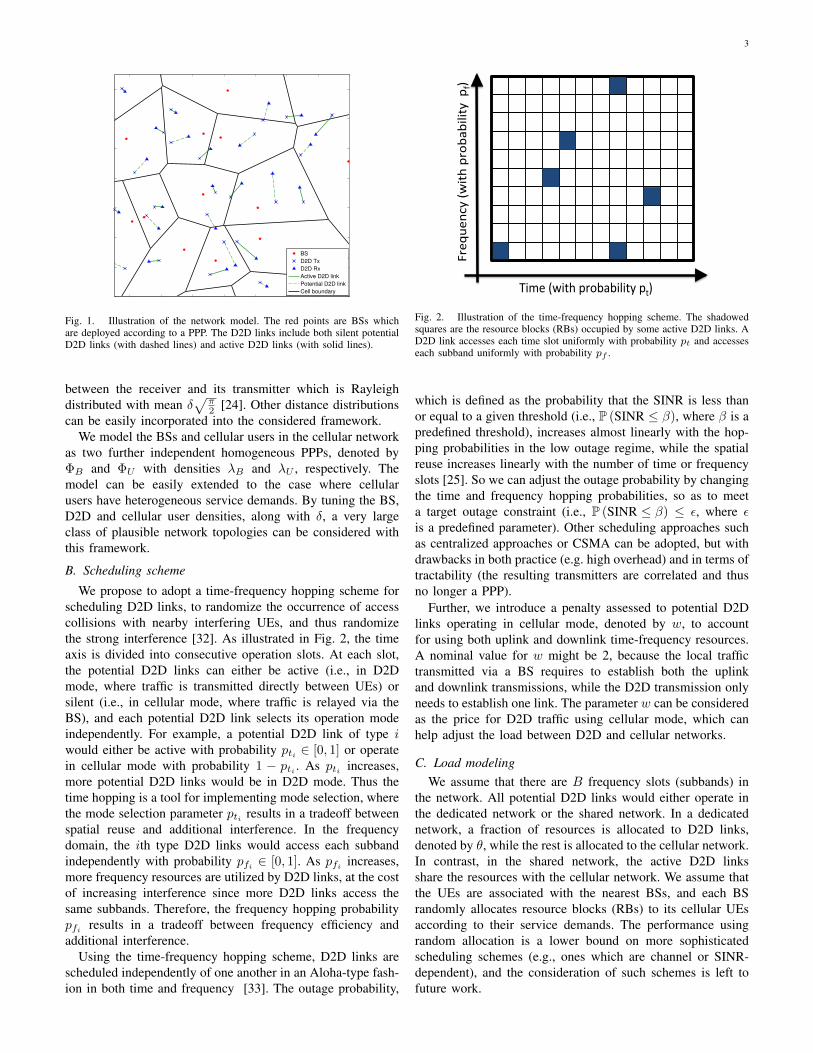
We consider a large D2D-enabled downlink cellular net-work, illustrated in Fig. 1. We classify the potential D2Dtransmitters into M types which may differ in terms of theirservice demands and/or the MAC protocol. Note that similar tothe current wireless traffic growth driven by the smartphonesproliferating around the world, more local traffic will possiblybe generated once the D2D features are available in future.Therefore, at this stage, the D2D traffic demand as wellas its growth is not clear. Though any general distributionscan be used to model the location of D2D users, random(uniform) dropping is one of the most popular models inboth academia and industry (e.g., [24, 29–31]). In this paper,we propose to use the following random dropping modelas a first-cut study, and leave other models (e.g., clusteredUEs in hotspot) to future work. We assume that the D2Dtransmitters of the ith type are randomly distributed accordingto a homogeneous PPP ΦDi with density λDi . The M PPPsare assumed to be independent of each other. Note that theperformance of the PPP model can serve as a benchmarkfor more general settings. Each receiver is assumed to berandomly located around its transmitter according to a two-dimensional Gaussian distribution N(0, δ2), with the phaseuniformly distributed in [0, 2π], so δ parameterizes the distance
3
BS
D2D Tx
D2D Rx
Active D2D link
Potential D2D link
Cell boundary
Fig. 1. Illustration of the network model. The red points are BSs whichare deployed according to a PPP. The D2D links include both silent potentialD2D links (with dashed lines) and active D2D links (with solid lines).
between the receiver and its transmitter which is Rayleighdistributed with mean δ
√π2 [24]. Other distance distributions
can be easily incorporated into the considered framework.We model the BSs and cellular users in the cellular network
as two further independent homogeneous PPPs, denoted byΦB and ΦU with densities λB and λU , respectively. Themodel can be easily extended to the case where cellularusers have heterogeneous service demands. By tuning the BS,D2D and cellular user densities, along with δ, a very largeclass of plausible network topologies can be considered withthis framework.
B. Scheduling scheme
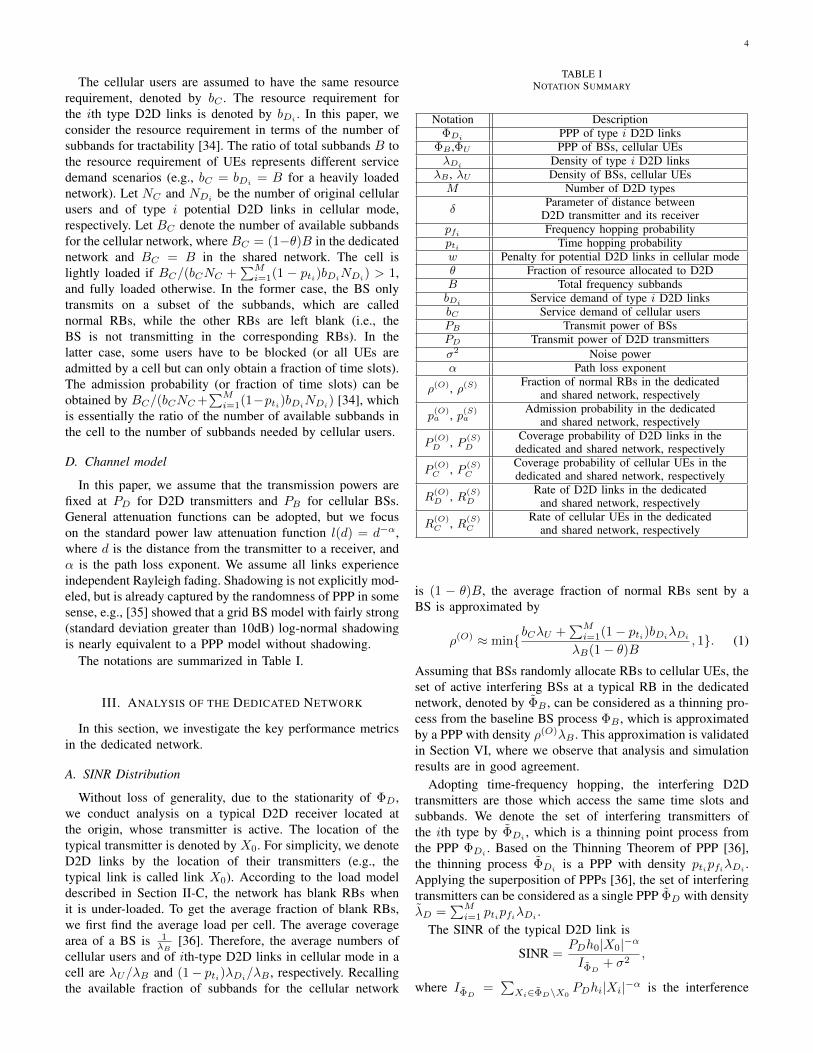
We propose to adopt a time-frequency hopping scheme forscheduling D2D links, to randomize the occurrence of accesscollisions with nearby interfering UEs, and thus randomizethe strong interference [32]. As illustrated in Fig. 2, the timeaxis is divided into consecutive operation slots. At each slot,the potential D2D links can either be active (i.e., in D2Dmode, where traffic is transmitted directly between UEs) orsilent (i.e., in cellular mode, where traffic is relayed via theBS), and each potential D2D link selects its operation modeindependently. For example, a potential D2D link of type iwould either be active with probability pti ∈ [0, 1] or operatein cellular mode with probability 1 − pti . As pti increases,more potential D2D links would be in D2D mode. Thus thetime hopping is a tool for implementing mode selection, wherethe mode selection parameter pti results in a tradeoff betweenspatial reuse and additional interference. In the frequencydomain, the ith type D2D links would access each subbandindependently with probability pfi ∈ [0, 1]. As pfi increases,more frequency resources are utilized by D2D links, at the costof increasing interference since more D2D links access thesame subbands. Therefore, the frequency hopping probabilitypfi results in a tradeoff between frequency efficiency andadditional interference.
Using the time-frequency hopping scheme, D2D links arescheduled independently of one another in an Aloha-type fash-ion in both time and frequency [33]. The outage probability,
Freq
uency (w
ith probability p
f)
Time (with probability pt)
Fig. 2. Illustration of the time-frequency hopping scheme. The shadowedsquares are the resource blocks (RBs) occupied by some active D2D links. AD2D link accesses each time slot uniformly with probability pt and accesseseach subband uniformly with probability pf .
which is defined as the probability that the SINR is less thanor equal to a given threshold (i.e., P (SINR ≤ β), where β is apredefined threshold), increases almost linearly with the hop-ping probabilities in the low outage regime, while the spatialreuse increases linearly with the number of time or frequencyslots [25]. So we can adjust the outage probability by changingthe time and frequency hopping probabilities, so as to meeta target outage constraint (i.e., P (SINR ≤ β) ≤ ε, where εis a predefined parameter). Other scheduling approaches suchas centralized approaches or CSMA can be adopted, but withdrawbacks in both practice (e.g. high overhead) and in terms oftractability (the resulting transmitters are correlated and thusno longer a PPP).
Further, we introduce a penalty assessed to potential D2Dlinks operating in cellular mode, denoted by w, to accountfor using both uplink and downlink time-frequency resources.A nominal value for w might be 2, because the local traffictransmitted via a BS requires to establish both the uplinkand downlink transmissions, while the D2D transmission onlyneeds to establish one link. The parameter w can be consideredas the price for D2D traffic using cellular mode, which canhelp adjust the load between D2D and cellular networks.
C. Load modelingWe assume that there are B frequency slots (subbands) in
the network. All potential D2D links would either operate inthe dedicated network or the shared network. In a dedicatednetwork, a fraction of resources is allocated to D2D links,denoted by θ, while the rest is allocated to the cellular network.In contrast, in the shared network, the active D2D linksshare the resources with the cellular network. We assume thatthe UEs are associated with the nearest BSs, and each BSrandomly allocates resource blocks (RBs) to its cellular UEsaccording to their service demands. The performance usingrandom allocation is a lower bound on more sophisticatedscheduling schemes (e.g., ones which are channel or SINR-dependent), and the consideration of such schemes is left tofuture work.
4
The cellular users are assumed to have the same resourcerequirement, denoted by bC . The resource requirement forthe ith type D2D links is denoted by bDi . In this paper, weconsider the resource requirement in terms of the number ofsubbands for tractability [34]. The ratio of total subbands B tothe resource requirement of UEs represents different servicedemand scenarios (e.g., bC = bDi = B for a heavily loadednetwork). Let NC and NDi be the number of original cellularusers and of type i potential D2D links in cellular mode,respectively. Let BC denote the number of available subbandsfor the cellular network, where BC = (1−θ)B in the dedicatednetwork and BC = B in the shared network. The cell islightly loaded if BC/(bCNC +
∑Mi=1(1 − pti)bDiNDi) > 1,
and fully loaded otherwise. In the former case, the BS onlytransmits on a subset of the subbands, which are callednormal RBs, while the other RBs are left blank (i.e., theBS is not transmitting in the corresponding RBs). In thelatter case, some users have to be blocked (or all UEs areadmitted by a cell but can only obtain a fraction of time slots).The admission probability (or fraction of time slots) can beobtained by BC/(bCNC+
∑Mi=1(1−pti)bDiNDi) [34], which
is essentially the ratio of the number of available subbands inthe cell to the number of subbands needed by cellular users.
D. Channel model
In this paper, we assume that the transmission powers arefixed at PD for D2D transmitters and PB for cellular BSs.General attenuation functions can be adopted, but we focuson the standard power law attenuation function l(d) = d−α,where d is the distance from the transmitter to a receiver, andα is the path loss exponent. We assume all links experienceindependent Rayleigh fading. Shadowing is not explicitly mod-eled, but is already captured by the randomness of PPP in somesense, e.g., [35] showed that a grid BS model with fairly strong(standard deviation greater than 10dB) log-normal shadowingis nearly equivalent to a PPP model without shadowing.
The notations are summarized in Table I.
III. ANALYSIS OF THE DEDICATED NETWORK
In this section, we investigate the key performance metricsin the dedicated network.
A. SINR Distribution
Without loss of generality, due to the stationarity of ΦD,we conduct analysis on a typical D2D receiver located atthe origin, whose transmitter is active. The location of thetypical transmitter is denoted by X0. For simplicity, we denoteD2D links by the location of their transmitters (e.g., thetypical link is called link X0). According to the load modeldescribed in Section II-C, the network has blank RBs whenit is under-loaded. To get the average fraction of blank RBs,we first find the average load per cell. The average coveragearea of a BS is 1
λB[36]. Therefore, the average numbers of
cellular users and of ith-type D2D links in cellular mode in acell are λU/λB and (1− pti)λDi/λB , respectively. Recallingthe available fraction of subbands for the cellular network
TABLE INOTATION SUMMARY
Notation DescriptionΦDi PPP of type i D2D links
ΦB ,ΦU PPP of BSs, cellular UEsλDi Density of type i D2D links
λB , λU Density of BSs, cellular UEsM Number of D2D types
δParameter of distance between
D2D transmitter and its receiverpfi Frequency hopping probabilitypti Time hopping probabilityw Penalty for potential D2D links in cellular modeθ Fraction of resource allocated to D2DB Total frequency subbandsbDi Service demand of type i D2D linksbC Service demand of cellular usersPB Transmit power of BSsPD Transmit power of D2D transmittersσ2 Noise powerα Path loss exponent
ρ(O), ρ(S) Fraction of normal RBs in the dedicatedand shared network, respectively
p(O)a , p(S)a
Admission probability in the dedicatedand shared network, respectively
P(O)D , P (S)
D
Coverage probability of D2D links in thededicated and shared network, respectively
P(O)C , P (S)
C
Coverage probability of cellular UEs in thededicated and shared network, respectively
R(O)D , R(S)
D
Rate of D2D links in the dedicatedand shared network, respectively
R(O)C , R(S)
C
Rate of cellular UEs in the dedicatedand shared network, respectively
is (1 − θ)B, the average fraction of normal RBs sent by aBS is approximated by
ρ(O) ≈ min{bCλU +
∑Mi=1(1− pti)bDiλDi
λB(1− θ)B, 1}. (1)
Assuming that BSs randomly allocate RBs to cellular UEs, theset of active interfering BSs at a typical RB in the dedicatednetwork, denoted by ΦB , can be considered as a thinning pro-cess from the baseline BS process ΦB , which is approximatedby a PPP with density ρ(O)λB . This approximation is validatedin Section VI, where we observe that analysis and simulationresults are in good agreement.
Adopting time-frequency hopping, the interfering D2Dtransmitters are those which access the same time slots andsubbands. We denote the set of interfering transmitters ofthe ith type by ΦDi , which is a thinning point process fromthe PPP ΦDi . Based on the Thinning Theorem of PPP [36],the thinning process ΦDi is a PPP with density ptipfiλDi .Applying the superposition of PPPs [36], the set of interferingtransmitters can be considered as a single PPP ΦD with densityλD =
∑Mi=1 ptipfiλDi .
The SINR of the typical D2D link is
SINR =PDh0|X0|−α
IΦD + σ2,
where IΦD =∑Xi∈ΦD\X0
PDhi|Xi|−α is the interference
5
from other D2D users, and σ2 is the noise power. The SINRcomplementary cumulative distribution function (CCDF) ofthe D2D links, also known as the coverage probability, is givenby Proposition 1.
Proposition 1. The SINR distribution of D2D links in thededicated network is
P(O)D (β)
4= P (SINR > β)
=
∫ ∞0
e−βP−1D σ2vαLIΦD (βP−1
D vα)ve−
v2
2δ2
δ2dv.
(2)
where the Laplace transform of the interference from D2Dtransmitters is
LIΦD (s) = exp
(−λD
2π2/α
sin (2π/α)(sPD)
2α
), (3)
Proof: See Appendix A.
The derived SINR distribution indicates that the time andfrequency hopping impact the SINR of D2D links in a productterm ptipfi in λD. That is, as long as the product ptipfi isa constant, no matter how the time hopping or the frequencyhopping is changed, the network performance will be the same.There is a tradeoff between the density and the performanceof the links in D2D mode: as more and more potential D2Dtransmitters attempt to transmit, though the density of activelinks increases, the interference increases and thus the SINRof active D2D links decreases.
With the assumption of nearest-BS association, the distri-bution of the distance between a user and its associated BS,denoted by r, is fr(r) = e−λBπr
2
2λBπr [37]. In the dedicatednetwork, there is no D2D-cellular interference. Therefore, wecan leverage the analytical results of the cellular networkin [27] to evaluate the cellular network performance, wherethe SINR CCDF of cellular users is given by Proposition 2.
Proposition 2. The SINR distribution of a typical cellular userin the dedicated network is
P(O)C (β)
4= P(SINR > β)
=
∫ ∞0
e−βP−1B σ2rαLIΦB (βP−1
B rα)e−λBπr2
2λBπrdr.(4)
where the Laplace transform of interference from the cellularUEs is
LIΦB (βP−1B rα) = exp
(−2πρ(O)λBr
2H1(β, α)), (5)
and H1(β, α) =∫∞
1x
1+β−1xα dx.
Proof: The proposition is shown in [27]. For com-pleteness, we provide the details as follows. Denoting s =βP−1
B rα, given the distance between user and its closest BS r,the conditional coverage probability is P(SINR(r) > β | r) =exp(−sσ2)LIΦB (s). Denoting the BS serving the typical userby B0, the Laplace transform of interference from other BSs
IΦB is
LIΦB (s) =E
exp
−s ∑Bi∈ΦB\B0
PBhir−α
(a)= exp
(−2πρ(O)λB
∫ ∞r
u
1 + s−1P−1B uα
du
)= exp
(−2πρ(O)λBr
2H1(β, α)),
where the lower limit of integral r in (a) follows from theassumption that the user is associated with its closest BS, andthe last equality is obtained by letting x = u/r.
Considering the special case where the network isinterference-limited (i.e., the thermal noise is ignored), theabove results can be further simplified:
Corollary 1. When σ2 → 0, the SINR distributions of D2Dlinks and cellular users, respectively, are
P(O)D (β) =
1
1 + 2δ2λD2π2/α
sin(2π/α)β2α
, (6)
P(O)C (β) =
1
2ρ(O)H1(β, α) + 1. (7)
B. Rate Analysis in the Dedicated Network
In this section, we analyze the average achievable rates ofcellular users and D2D links in the dedicated network. Bytreating the interference as noise, we use Shannon’s capacityformula to approximate the rate, i.e., W log2(1+SINR), whereW is the available bandwidth. Assuming the fraction of timeslots is T , the long-term rate becomes R = TW log2(1 +SINR), where TW can be considered as the total availablefraction of RBs.
Recall that the admission probability (i.e. available fractionof time slots) of cellular UEs is
p(O)a = min
{(1− θ)B
bCNC +∑Mi=1 bDiNDi
, 1
}, (8)
where NC and NDi are the expected number of cellular usersand of type i D2D links in cellular mode in the typical userassociated cell, respectively. Note that a random UE is morelikely to be associated with a cell which has a larger coveragearea. Denoting the BS serving the typical UE by B0, theexpected coverage area of BS B0 is larger than 1/λB , knownas Feller’s paradox [38]. The average coverage area of BSB0 is instead given by 9/(7λB) [39, 40]. Therefore, similarto [34], the admission probability can be approximated to
p(O)a ≈ min
7(1− θ)BλB9(bCλU +
∑Mi=1 bDi(1− pti)λDi
) , 1
.
(9)Recalling that w is the price for a D2D link operating in
cellular mode, the average rates of cellular users and D2Dlinks are given in Theorem 1.
Theorem 1. The average achievable rates of a typical cellular

6
user and a D2D link of the ith type, respectively, are
R(O)Ci
= bCip(O)a
∫ ∞0
log2(e)
(β + 1)P(O)C (β) dβ, (10)
R(O)Dj
= min{pfjθB, bDj}ptj∫ ∞
0
log2(e)
(β + 1)P(O)D (β) dβ
+bDjw
(1− ptj )p(O)a
∫ ∞0
log2(e)
(β + 1)P(O)C (β) dβ,
(11)
where P(O)C (β) and P(O)
D (β) are given in (4) and (2), respec-tively. Further, we can get the average rate of a typical D2Dlink by
R(O)D =
M∑j=1
λDiλD
R(O)Dj
. (12)
Proof: According to Shannon’s capacity formula, the longterm rate of a typical cellular user is
R(O)Ci
=bCip(O)a E [log2 (1 + SINR)]
=bCip(O)a
∫ ∞0
P(SINR > 2t − 1
)dt
=bCip(O)a
∫ ∞0
log2(e)
(β + 1)P (SINR > β) dβ,
where we let 2t − 1 = β in the last equality.A typical D2D link can be either in D2D mode or cellular
mode, and thus the average rate of a typical D2D link can becalculated according to
R(O)Dj
= P(D2D mode)E[R
(O)D2D mode
]+ P(cellular mode)
1
wE[R
(O)cellular mode
],
where we approximate the rate obtained in cellular mode bythe rate obtained in the downlink system for tractability:
E[R
(O)cellular mode
]= min
{E[R
(O)cellular mode in DL
],E[R
(O)cellular mode in UL
]}≈E
[R
(O)cellular mode in DL
].
Then the D2D rates in D2D mode and in cellular mode are,respectively,
E[R
(O)D2D mode
]= min{pfjθB, bDj}
∫ ∞0
log2(e)
(β + 1)P(O)D (β) dβ,
(13)and
E[R
(O)cellular mode
]= bDjp
(O)a
∫ ∞0
log2(e)
(β + 1)P(O)C (β) dβ.
(14)Note that in rate derivation in this paper, we assume that thenumber of users associated with the BS serving the typical linkand the SINR distribution of the typical link are independent,and thus plugging (2) and (4) into (13) and (14), respectively,the proof is complete.
IV. ANALYSIS OF THE SHARED NETWORK
In this section, we turn our attention to the shared network,where the time and frequency slots are reused between D2D
and cellular networks, and thus there is D2D-cellular interfer-ence.A. SINR Distribution of D2D links
As in Section III, let ΦD be the set of interfering D2Dlinks, which is a PPP with density λD. The average fractionof normal RBs in the shared network is approximated by
ρ(S) ≈ min{bCλU +
∑Mi=1 bDi(1− pti)λDiλBB
, 1}. (15)
We again consider a typical active D2D receiver located atthe origin. Taking into account now the interference from bothcellular and D2D networks, the SINR of a typical active D2Dlink is
SINRD =PDh0|X0|−α
IΦD + IΦB + σ2,
where X0 is the location of the typical transmit-ter, the interference from D2D transmitters is IΦD =∑Xi∈ΦD\X0
PDhi|Xi|−α, and the interference from BSs isIΦB =
∑Bi∈ΦB
PBhi|Bi|−α.
Theorem 2. The SINR distribution of an active D2D link inthe shared network is
P(S)D (β)
4= P (SINRD > β)
=
∫ ∞0
e−sσ2
LIΦD (s)LIΦB (s)v
δ2exp (− v2
2δ2)dv,
(16)
where s = βP−1D vα, LIΦD (s) can be calculated according
to (3), and
LIΦB (s) = exp(−2πρ(S)λBv
2H0(β, α)), (17)
where H0(β, α) =∫∞
0x
1+β−1PD/PBxαdx.
Proof: Given the distance between D2D transmitter andits receiver, denoted by v, the conditional coverage probabilityis P(SINR(v) > β | v)
(a)= exp(−sσ2)LIΦD (s)LIΦB (s),
where (a) follows from the fact that h0 is Rayleigh fadingand IΦD is independent of IΦB . The Laplace transform ofIΦD can be calculated according to (3). Similarly, we have
LIΦB (s) =E
∏Zi∈ΦB
1
1 + sPB |Bi|−α
= exp
(∫ ∞0
−2πρ(S)λBr
1 + β−1PD/PB(r/v)αdr
)= exp
(∫ ∞0
−2πρ(S)λBv2x
1 + β−1PD/PBxαdx
),
where the last equality is obtained by letting x = r/v. LettingH0(β, α) =
∫∞0
x1+β−1PD/PBxα
dx, the proof is complete.Theorem 2 shows that for any given SINR threshold, the
coverage probability of D2D links is monotonically decreasingas the access probabilities pti and/or pfi increase, due to theincreasing interference from the D2D network. On the otherhand, the relationship between the MAC protocol and averagerate is more subtle, and is discussed in Section IV-C.B. SINR Distribution of Cellular Users
In this section, we conduct analysis on a typical cellular UEin the shared network, which is assumed to be located at the

7
origin.
Theorem 3. The SINR distribution of a typical cellular userin the shared network is
P(S)C (β)
4= P (SINR > β)
=
∫ ∞0
e−sσ2
LIΦD (s)LIΦB (s)e−λBπr2
2λBπrdr,(18)
where s = βP−1B rα, and the Laplace transform of interference
from D2D links LIΦD (s) can be calculated according to (3).The Laplace transform of interference from the cellular net-work LIΦB (s) can be obtained by (5), where ρ(O) should bereplaced by ρ(S).
Proof: We omit the proof as it is similar to the proof ofTheorem 2.
Ignoring thermal noise, the results can be again significantlysimplified.
Corollary 2. When σ2 → 0, the SINR distributions of D2Dlinks and of cellular users are, respectively,
P(S)D (β) =
1
2δ2λDκπβ2α + 4δ2πρ(S)λBH0(β, α) + 1
, (19)
and
P(S)C (β) =
1λDλBκ(β PDPB )
2α + 2ρ(S)H1(β, α) + 1
, (20)
where κ = 2π/αsin(2π/α) .
Proof: See Appendix B.According to the above analysis, we can see that the
coverage probabilities of D2D links and of cellular UEs areboth monotonically decreasing functions of pti and pfi , dueto the increasing interference as more D2D links access to thesame resource block.
C. Rate Analysis in the Shared Network
Similar to the dedicated system, the admission probabilityof cellular users is
p(S)a ≈ min
7BλB
9(bCλU +
∑Mi=1 bDi(1− pti)λDi
) , 1
.
(21)The average rates of cellular users and D2D links in the
shared network are given in Proposition 3.
Proposition 3. The average achievable rate of a cellular useris
R(S)C = bCp
(S)a
∫ ∞0
log2(e)
(β + 1)P(S)C (β) dβ, (22)
where P(S)C (β) is given by (18). The average achievable rate
of a type i D2D link is
R(S)Di
= pti min{pfiB, bDi}∫ ∞
0
log2(e)
(β + 1)P(S)D (β) dβ
+bDibCw
(1− pti)R(S)C ,
(23)
where w is the penalty for the potential D2D links transmittingby BSs, and P(S)
D (β) is given by (16).
Then we can get the average rate of a typical D2D link asR
(S)D =
∑Mi=1
λDiλD
R(S)Di
.
Corollary 3. We further have lower bounds on the rates
R(S)C ≥ R(S)
Cl = supβ
bCp(S)a log2(1 + β)P(S)
C (β) , (24)
and R(S)Di≥ R(S)
Dli, where
R(S)Dli
= supβ
(pti min{pfiB, bDi} log2(β + 1)P(S)
D (β))
+bDjbCw
(1− pti)R(S)Cl ,
(25)where P(S)
C (β) and P(S)D (β) can be calculated according to
(18) and (16), respectively.
Proof: Denoting Γ = SINR, we have the followinginequality for any β.
E [log2(1 + Γ)] =P(Γ > β)E [log2(1 + Γ) | Γ > β]
+ P(Γ ≤ β)E [log2(1 + Γ) | Γ ≤ β]
≥P(Γ > β)E [log2(1 + Γ) | Γ > β]
≥P(Γ > β) log2(1 + β).
Therefore, we have E [log2(1 + SINR)] ≥ supβ P(SINR >β) log2(1 + β).
The above lower bounds can also be extended to thededicated network.
According to the above analysis, when the frequency hop-ping probability pfi increases, the rate of a typical cellular userdecreases, because the interference from D2D links increases.Thus the cellular rate is a monotonic function of pfi . As for thetime hopping, when the time hopping probability pti increases,more potential D2D links would operate in D2D mode. Onthe one hand, the interference from D2D links increases astime hopping probability increases, which leads to a lowerSINR for the cellular links; on the other hand, the cellularlinks benefit from D2D offloading, since more resources wouldbe available for the remaining cellular links. Therefore, it isdifficult to determine the impact of time hopping on the rateof cellular users. As for the rate of a typical D2D link, it iseven more difficult to explore the impact of the MAC protocol,because both time and frequency hopping result in the tradeoffbetween resource efficiency and additional interference. It isnot a priori clear whether larger time and frequency hoppingprobabilities would be beneficial or not. However, by changingvariables, we can get the optimal solution of at least onevariable and thus reduce the dimensions of the optimizationproblem. We explore these issues in detail in the next section.
V. OPTIMIZATION OF THE D2D-ENABLED CELLULARNETWORK
Based on the derived analytical results, we now turn ourattention to the optimization of network performance. As in [6,25, 36], we study the utility maximization in terms of averagelong-term rates in the interference limited network (i.e., σ2 →0) for simplicity.

8
A. Optimization of the Dedicated Network
The utility functions of a cellular user and of a type iD2D link are denoted by UC(RC) and UD(RDi), respectively,where UD(·) and UC(·) are continuously differentiable, non-decreasing, and concave functions [41]. The optimizationproblem can be formulated as
maxpt,pf
M∑i=1
λDiUD(R(O)Di
) + λUUC(R(O)C )
s.t. 0 ≤ pti ≤ 1, 0 ≤ pfi ≤ 1, ∀i ∈ ΦD,
(26)
where R(O)Di
and R(O)C are obtained by Theorem 1.
The next result shows that the optimal frequency hoppingprobability can be obtained in closed form, and is independentof the choice of utility functions.
Proposition 4. For any non-decreasing utility function, theoptimal frequency hopping probability for rate is p∗fi =min{1, bDi/(θB)}.
Proof: The objective function is a non-decreasing func-tion of pfi when pfiθB ≤ bDi , and becomes monotonicallydecreasing when pfiθB > bDi . Therefore, the optimal fre-quency hopping probability is p∗fi = min{1, bDi/(θB)}.
The above proposition shows that the D2D network is re-source limited. The larger the service demand is, the more ag-gressive the D2D link should be to access the frequency bands.
Though maximization of total rate may not be a goodperformance metric in the sense that it has not consideredfairness among UEs, it is a reasonable objective function fora first-cut investigation of the complicated hybrid network.Therefore, in the following, we focus on the linear utilityfunction U(x) = x. A single tier cellular network is heavilyloaded in most cases (e.g., in a typical LTE network withBC = 10MHz, bC ≈ 1MHz, and λU
λB> 10, we have
BCλB < bCλU ). Therefore, we consider a congested networkwhere 7BCλB < 9bCλU , and thus ρ(O) = 1 (i.e., BSs alwayssend normal RBs) and p(O)
a = 7BCλB9(bCλU+
∑Mi=1 bDi (1−pti )λDi)
.
Definition 1. The rate density is defined as the expected totalrate of D2D links and cellular users per surface unit.
For tractability, we investigate the hopping scheme tomaximize the rate lower bounds given by Corollary 3. Wecompare the results of exact rates and their lower bounds bysimulations in Section VI. Note that the following results canbe easily extended to the cases where the Modulation andCoding Scheme (MCS) is not adaptive by setting a fixed β.Using the rate lower bounds, the rate density of dedicated andshared networks can be calculated by
d(O)rate
4=
M∑j=1
λDjR(O)Dlj
+ λUR(O)Cl , (27)
and
d(S)rate =
M∑j=1
λDjR(S)Dlj
+ λUR(S)Cl , (28)
where R(O)Dlj
, R(O)Cl , R(S)
Dljand R(S)
Cl are given by Corollary 3.
Proposition 5. To maximize the rate density in the dedicatednetwork with w ≥ 1, we have p∗ti = 1. On the other hand,when w → 0, we have p∗ti → 0.
Proof: See Appendix C.Propositions 4 and 5 imply that both D2D and cellular
networks are resource limited when the network is fullyloaded. In order to utilize resources efficiently, all potentialD2D links would be in D2D mode when w ≥ 1. On the otherhand, by setting w small enough, the potential D2D links canbe pushed to cellular mode (i.e., p∗ti → 0).
Note that analytically it is true that all potential D2D linksare in D2D mode to maximize the total average rate. However,traffic channels in real cellular systems are typically notdesigned to operate at very low SINR (e.g., SINR < −6dB)[42]. If the average distance is very large such that the SINRsof many D2D links are smaller than −6dB, the optimalmode selection would be different. Also, maximization ofdifferent utility functions would lead to different optimalmode selections. For example, when we consider the max-min utility, the optimal time hopping would depend on theaverage distance between a D2D transmitter and its receiver(which is characterized by δ). As δ increases, the rates ofpotential D2D links operating in D2D mode decrease, andmay be smaller than the rate obtained in cellular mode. Thuswith an increasing probability, the potential D2D links in D2Dmode would have the minimal rates in the system. Therefore,we would push some potential D2D links to cellular mode inthis example, in order to increase their rates and maximize theminimal rate (i.e., optimal time hopping probability p∗t < 1).
Given the optimal time hopping and frequency hopping, weinvestigate the optimal resource partition between D2D andcellular networks (i.e., θ). Plugging p∗fi = min{1, bDiθB } andp∗ti = 1 to (27), the objective function is a non-differentiablefunction of θ. We denote bi = bDi/B for i = 1, · · · ,Mand b0 = 0 for simplicity. Without loss of generality, weassume the sequence {bi}Mi=0 is in ascending order (i.e.,b0 is the smallest and bM is the largest). Let bL be thelargest bi that is smaller than 1. We partition the domainof θ into
[bi,min
{bi+1, 1
}], i = 0, · · · , L. On the ith
region[bi,min
{bi+1, 1
}], the types of D2D links can be
separated into two sets, where Si = {0, · · · , i} and Gi =
{i + 1, · · · ,M}. We have p∗fj =bjθ for j ∈ Si, and p∗fj = 1
for j ∈ Gi. Thus, the objective function becomes a differen-tiable function on each partition. Denote Ai = B log2(βD +
1)∑j∈Si λDj bj , Ci = 2δ2 2π2/α
sin(2π/α)β2α
∑j∈Si λDj bj , D =
7BλB9
log2(βC+1)2H1(βC ,α)+1 , Ei = B log2(βD + 1)
∑j∈Gi λDj , and
Fi = 2δ2∑j∈Gi λDj
2π2/αsin(2π/α)β
2α + 1. Letting
b′i =
1, if Ei > DFi,√Ci(AiFi − EiCi)F 2i (DFi − Ei
)− CiFi, otherwise,
(29)
we can express the optimal solution θ∗ in terms of b′i, whichis given in Proposition 6.
Proposition 6. The optimal θ to maximize (27) belongs to the
9
following set:
O =
{[b′i
]min{1,bi+1}
bi: i = 0, · · · , L
}, (30)
where b′i is defined as (29) and [x]ba denotesmin{max{x, a}, b}. In other words, θ∗ = arg maxθ∈O d
(O)rate .
Proof: See Appendix D.The parameters Ai, Ci, Ei and Fi can be calculated through
partial sum, which leads to a computational complexity ofO(M) to get the set O. Recalling that L is the number ofD2D types with bi < 1, the cardinality of set O is at mostL + 1, where L ≤ M . Note that M is generally a smallnumber, which implies that L+ 1 is small, and thus the resultin Proposition 6 significantly reduces the complexity comparedto the brute force search. Note that Ei − FiD decreases as θincreases. We have shown in Appendix D that the objectivefunction is non-decreasing when Ei − FiD ≥ 0. Therefore,we only need to search over the domains where Ei < FiD,and thus the cardinality of the set O can be further reduced.
B. Optimization of the Shared Network
In this section, we turn our attention to the optimizationof the performance in the shared network. Similarly to thededicated network, the objective is to maximize the utilityfunction in terms of the rate lower bounds given by Corol-lary 3. We again consider a heavily loaded network withρ(S) = 1 and p
(S)a = 7BλB
9(bCλU+∑Mi=1 bDi (1−pti )λDi)
. Underthese assumptions, we have the following conclusion.
Proposition 7. Given w ≥ 1, the optimal time hopping tomaximize the rate density (28) is p∗ti = 1, ∀i ∈ {1, · · · ,M},i.e., all potential D2D links are in D2D mode. In contrast,when w → 0, we have p∗ti → 0.
Proof: See Appendix E.Similarly to the dedicated network, w can be adopted as a
parameter to balance load between cellular and D2D networks,by decreasing which we can push D2D links to cellular mode.Though it is difficult to obtain the optimal frequency hoppingin closed form in a general shared network, the maximizationhas been reduced to a lower-dimensional problem by findingthe optimal time hopping probability, and the complexity tosearch the optimal scheme becomes much less. Denoting thenumber of possible values of pti and pfi by |pt| and |pf |,respectively, the complexity of brute force can be reducedfrom O((|pt| × |pf |)M ) to O(|pf |M ) (e.g., for the case with|pt| = |pf | = 100 and M = 2, the complexity is reduced fromO(108) to O(104)).
VI. PERFORMANCE EVALUATION
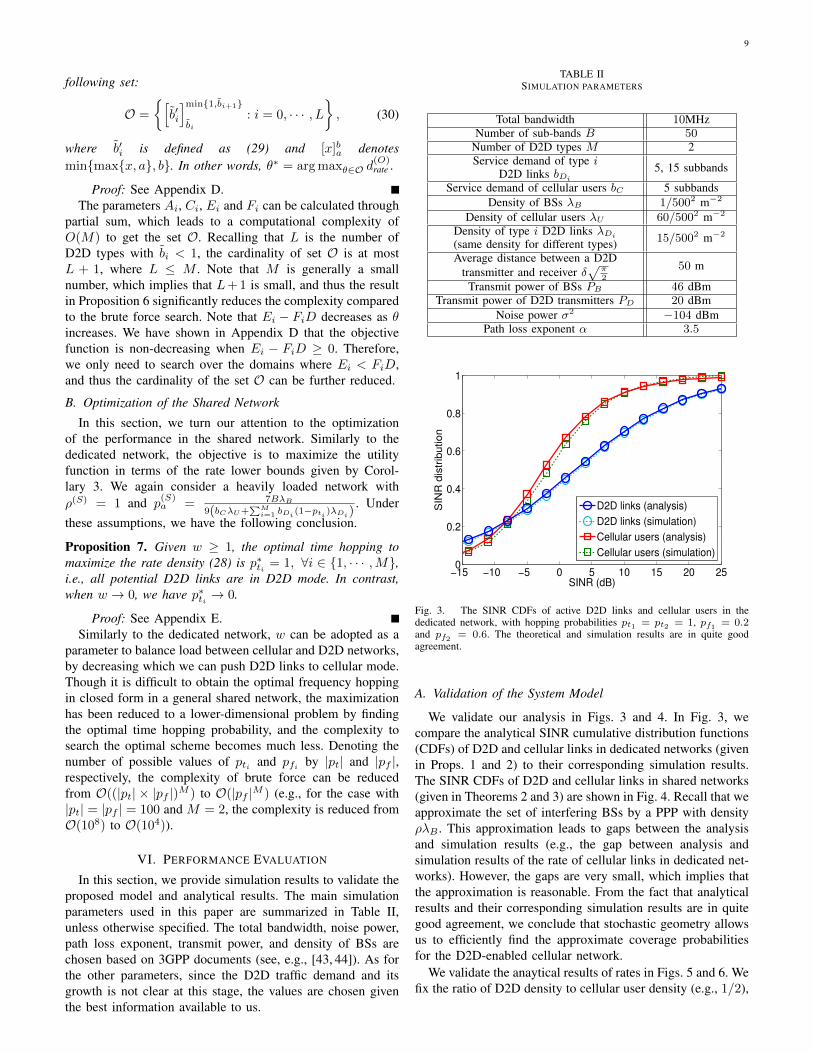
In this section, we provide simulation results to validate theproposed model and analytical results. The main simulationparameters used in this paper are summarized in Table II,unless otherwise specified. The total bandwidth, noise power,path loss exponent, transmit power, and density of BSs arechosen based on 3GPP documents (see, e.g., [43, 44]). As forthe other parameters, since the D2D traffic demand and itsgrowth is not clear at this stage, the values are chosen giventhe best information available to us.
TABLE IISIMULATION PARAMETERS
Total bandwidth 10MHzNumber of sub-bands B 50
Number of D2D types M 2Service demand of type i
D2D links bDi5, 15 subbands
Service demand of cellular users bC 5 subbandsDensity of BSs λB 1/5002 m−2
Density of cellular users λU 60/5002 m−2
Density of type i D2D links λDi(same density for different types) 15/5002 m−2
Average distance between a D2Dtransmitter and receiver δ
√π2
50 m
Transmit power of BSs PB 46 dBmTransmit power of D2D transmitters PD 20 dBm
Noise power σ2 −104 dBmPath loss exponent α 3.5
−15 −10 −5 0 5 10 15 20 250
0.2
0.4
0.6
0.8
1
SINR (dB)
SIN
R d
istr
ibu
tio
n
D2D links (analysis)
D2D links (simulation)
Cellular users (analysis)
Cellular users (simulation)
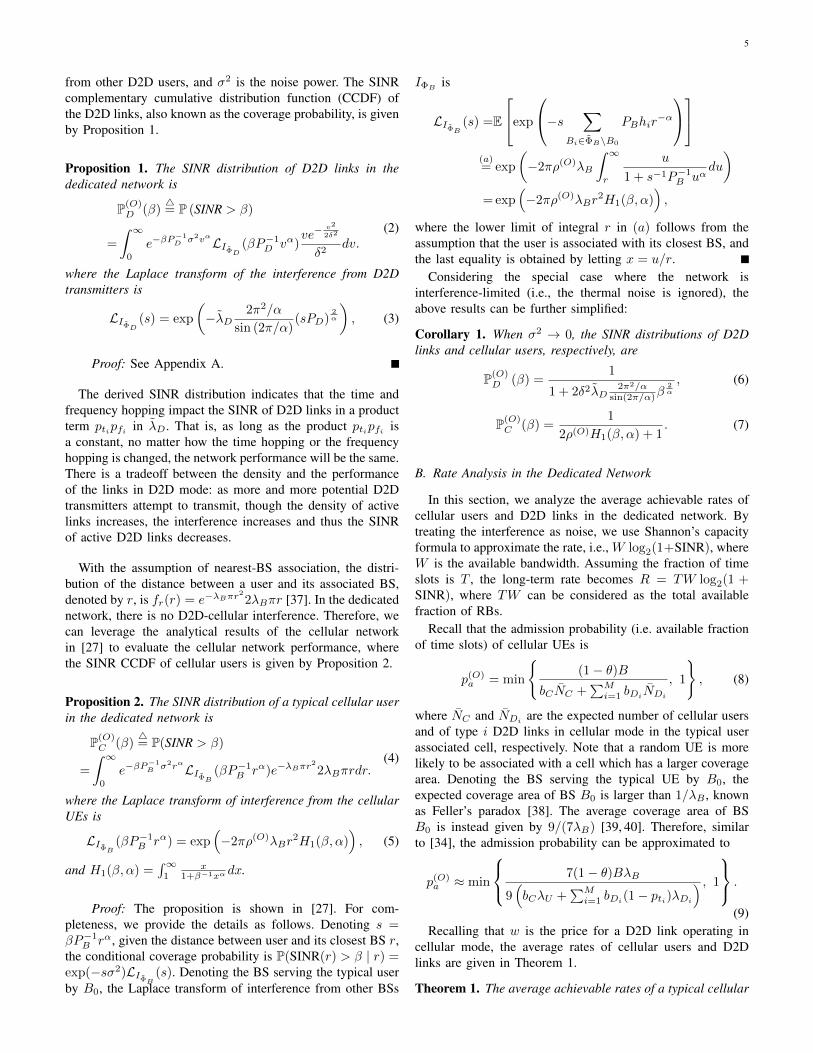
Fig. 3. The SINR CDFs of active D2D links and cellular users in thededicated network, with hopping probabilities pt1 = pt2 = 1, pf1 = 0.2and pf2 = 0.6. The theoretical and simulation results are in quite goodagreement.
A. Validation of the System Model
We validate our analysis in Figs. 3 and 4. In Fig. 3, wecompare the analytical SINR cumulative distribution functions(CDFs) of D2D and cellular links in dedicated networks (givenin Props. 1 and 2) to their corresponding simulation results.The SINR CDFs of D2D and cellular links in shared networks(given in Theorems 2 and 3) are shown in Fig. 4. Recall that weapproximate the set of interfering BSs by a PPP with densityρλB . This approximation leads to gaps between the analysisand simulation results (e.g., the gap between analysis andsimulation results of the rate of cellular links in dedicated net-works). However, the gaps are very small, which implies thatthe approximation is reasonable. From the fact that analyticalresults and their corresponding simulation results are in quitegood agreement, we conclude that stochastic geometry allowsus to efficiently find the approximate coverage probabilitiesfor the D2D-enabled cellular network.
We validate the anaytical results of rates in Figs. 5 and 6. Wefix the ratio of D2D density to cellular user density (e.g., 1/2),
10
−20 −15 −10 −5 0 5 10 15 200
0.2
0.4
0.6
0.8
1
SINR (dB)
SIN
R d
istr
ibu
tio
n
D2D links (analysis)
D2D links (simulation)
Cellular users (analysis)
Cellular users (simulation)
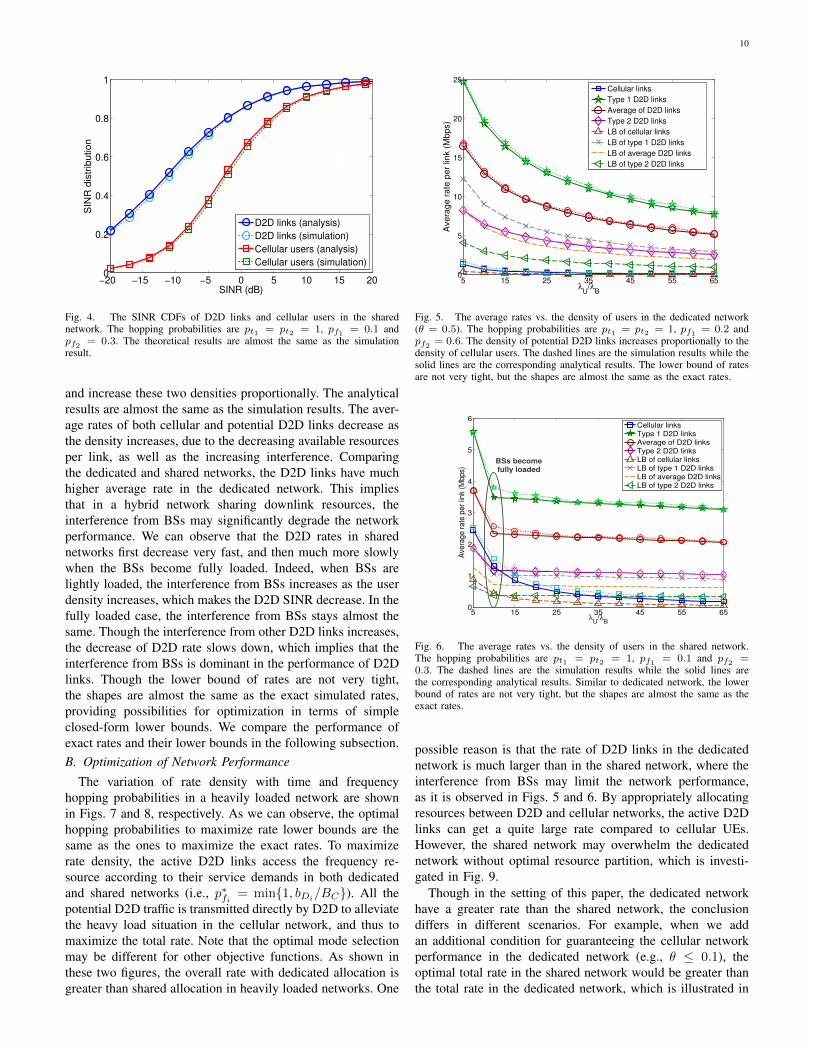
Fig. 4. The SINR CDFs of D2D links and cellular users in the sharednetwork. The hopping probabilities are pt1 = pt2 = 1, pf1 = 0.1 andpf2 = 0.3. The theoretical results are almost the same as the simulationresult.
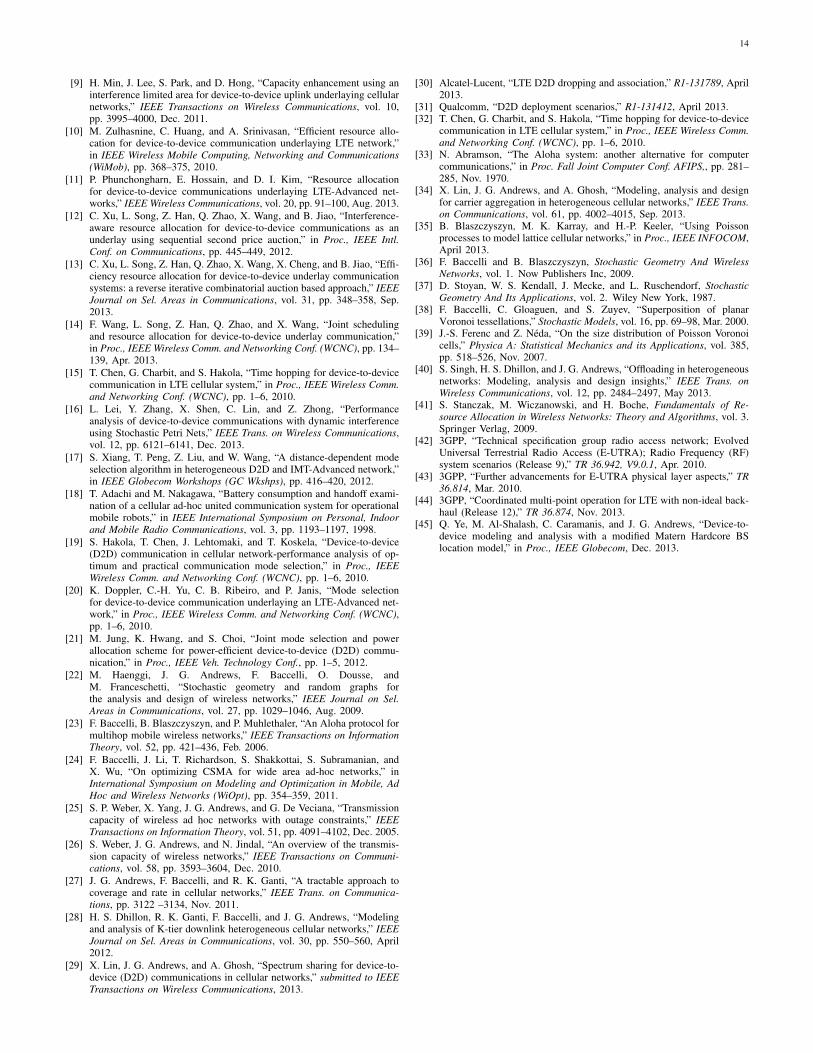
and increase these two densities proportionally. The analyticalresults are almost the same as the simulation results. The aver-age rates of both cellular and potential D2D links decrease asthe density increases, due to the decreasing available resourcesper link, as well as the increasing interference. Comparingthe dedicated and shared networks, the D2D links have muchhigher average rate in the dedicated network. This impliesthat in a hybrid network sharing downlink resources, theinterference from BSs may significantly degrade the networkperformance. We can observe that the D2D rates in sharednetworks first decrease very fast, and then much more slowlywhen the BSs become fully loaded. Indeed, when BSs arelightly loaded, the interference from BSs increases as the userdensity increases, which makes the D2D SINR decrease. In thefully loaded case, the interference from BSs stays almost thesame. Though the interference from other D2D links increases,the decrease of D2D rate slows down, which implies that theinterference from BSs is dominant in the performance of D2Dlinks. Though the lower bound of rates are not very tight,the shapes are almost the same as the exact simulated rates,providing possibilities for optimization in terms of simpleclosed-form lower bounds. We compare the performance ofexact rates and their lower bounds in the following subsection.B. Optimization of Network Performance
The variation of rate density with time and frequencyhopping probabilities in a heavily loaded network are shownin Figs. 7 and 8, respectively. As we can observe, the optimalhopping probabilities to maximize rate lower bounds are thesame as the ones to maximize the exact rates. To maximizerate density, the active D2D links access the frequency re-source according to their service demands in both dedicatedand shared networks (i.e., p∗fi = min{1, bDi/BC}). All thepotential D2D traffic is transmitted directly by D2D to alleviatethe heavy load situation in the cellular network, and thus tomaximize the total rate. Note that the optimal mode selectionmay be different for other objective functions. As shown inthese two figures, the overall rate with dedicated allocation isgreater than shared allocation in heavily loaded networks. One
5 15 25 35 45 55 650
5
10
15
20
25
λU
/λB
Ave
rag
e r
ate
pe
r lin
k (
Mb
ps)
Cellular links
Type 1 D2D links
Average of D2D links
Type 2 D2D links
LB of cellular links
LB of type 1 D2D links
LB of average D2D links
LB of type 2 D2D links
Fig. 5. The average rates vs. the density of users in the dedicated network(θ = 0.5). The hopping probabilities are pt1 = pt2 = 1, pf1 = 0.2 andpf2 = 0.6. The density of potential D2D links increases proportionally to thedensity of cellular users. The dashed lines are the simulation results while thesolid lines are the corresponding analytical results. The lower bound of ratesare not very tight, but the shapes are almost the same as the exact rates.
5 15 25 35 45 55 650
1
2
3
4
5
6
λU
/λB
Ave
rag
e r
ate
pe
r lin
k (M
bp
s)
Cellular linksType 1 D2D linksAverage of D2D linksType 2 D2D linksLB of cellular linksLB of type 1 D2D linksLB of average D2D linksLB of type 2 D2D links
BSs becomefully loaded
Fig. 6. The average rates vs. the density of users in the shared network.The hopping probabilities are pt1 = pt2 = 1, pf1 = 0.1 and pf2 =0.3. The dashed lines are the simulation results while the solid lines arethe corresponding analytical results. Similar to dedicated network, the lowerbound of rates are not very tight, but the shapes are almost the same as theexact rates.
possible reason is that the rate of D2D links in the dedicatednetwork is much larger than in the shared network, where theinterference from BSs may limit the network performance,as it is observed in Figs. 5 and 6. By appropriately allocatingresources between D2D and cellular networks, the active D2Dlinks can get a quite large rate compared to cellular UEs.However, the shared network may overwhelm the dedicatednetwork without optimal resource partition, which is investi-gated in Fig. 9.
Though in the setting of this paper, the dedicated networkhave a greater rate than the shared network, the conclusiondiffers in different scenarios. For example, when we addan additional condition for guaranteeing the cellular networkperformance in the dedicated network (e.g., θ ≤ 0.1), theoptimal total rate in the shared network would be greater thanthe total rate in the dedicated network, which is illustrated in

11
0 0.2 0.4 0.6 0.8 10
20
40
60
80
100
120
140
Pt
Ave
rag
e t
ota
l ra
te p
er
cell
(Mb
ps)
Dedicated, pt1
Shared, pt1
Dedicated, pt2
Shared, pt2
Optimal timehopping
Fig. 7. Effect of time hopping probabilities on the total rate density inheavily loaded networks (θ = 0.5). The solid curves and dashed curves showthe performance of exact rates and their lower bounds, respectively. We letfrequency hopping probabilities be pfi = min{1, BC/bDi}. The optimaltime hopping probabilities to maximize the total average rate are the same asour analytical solutions (i.e. p∗t1 = p∗t2 = 1). Though the rate lower boundsare not very tight, the time hopping probabilities to maximize the rate lowerbounds and the exact rate are the same.
0 0.2 0.4 0.6 0.8 10
30
60
90
120
150
Pf
Ave
rag
e t
ota
l ra
te p
er
cell
(Mb
ps)
Dedicated, pt1
Shared, pt1
Dedicated, pt2
Shared, pt2Optimal freq.
hopping pf1 Optimal freq.
hopping pf2
Fig. 8. Effect of frequency hopping probabilities on the total rate densityin heavily loaded networks (θ = 0.5). The solid curves and dashed curvesshow the performance of exact rates and their lower bounds, respectively.We let the time hopping probabilities be pti = 1. The optimal frequencyhopping probabilities are the same as our analytical solutions (i.e. p∗fi =
min{1, BC/bDi}).
Fig. 9. Another example is the network with a small λD, whichmay have a better performance using the shared approach(e.g., with λD = 0.1λB , the total rates per cell of dedicatedand shared networks are 9.6 and 13.6 Mbps, receptively).Therefore, there is no absolute advantage for the spectrumallocation approaches in general settings.
Fig. 9 also shows that the optimal resource partition in oursimulation setup to maximize the total rate is θ∗ = 1. Wecan have different θ∗ if the system parameters change. Forexample, Fig. 10 shows that θ∗ =
bD2
B when the averagedistance between the D2D transmitter and its receiver increasesto 280m. This is consistent with the conclusion made inProposition 6, where we claim that θ∗ depends on variousnetwork parameters (e.g., δ) and belongs to the set O. Note
0 0.2 0.4 0.6 0.8 10
20
40
60
80
100
120
140
160
180
200
θ
Ra
te (
Mb
ps)
Total rate in dedicated network
Total rate in shared network
Rate LB in dedicated network
Rate LB in shared network
Maximal rate in
shared network>
Maximal rate in
dedicated network
Fig. 9. Total rate versus θ. The solid curves and dashed curves showthe performance of exact rates and their lower bounds, respectively. We letfrequency hopping probabilities be pfi = min{1, BC/bDi} and the timehopping probabilities be pti = 1. The total average rate of the shared networkis greater than the dedicated network when θ is small.
0 0.2 0.4 0.6 0.8 14.3
4.35
4.4
4.45
θ
Tota
l ra
te L
B (
Mbps)
Dedicated network
Shared network
θ∗= bD2
/B
Fig. 10. Rate versus θ in a network with the average distance betweena D2D transmitter and its receiver being 280m. We let frequency hoppingprobabilities be pfi = min{1, BC/bDi} and the time hopping probabilitiesbe pti = 1. The optimal θ∗ depends on the network parameters. Thesimulation result is consistent with the conclusion in Proposition 6.
that we get the solution θ∗ = 0 or 1, which is unfair, due to thatwe consider total rate maximization as our objective functionfor the first-cut study. The optimal value of θ would be verydifferent if other utility functions are considered. For example,for maximization of log-rate, we will never get θ∗ = 0 or 1(techniques similar to [29] can be used for this analysis). Weleave the investigation of other utility functions to future work.
Though in most cases, we have w ≥ 1, we investigatethe impact of w (w > 0 for more general cases) on themode selection in Fig. 11. As w increases, which can beinterpreted as the increasing price of cellular resource, thecellular communication becomes more and more unattractivefor potential D2D traffic, and thus the load is shifted fromcellular networks to D2D networks, in order to maximize thetotal rate. Therefore, it is possible to extend current frameworkto a system, which can dynamically control w so as to adjustthe load in D2D and cellular systems to achieve other more

12
0.1 0.2 0.3 0.4 0.5 0.60
0.1
0.2
0.3
0.4
0.5
0.6
0.7
0.8
0.9
1
w
Fra
ctio
n o
f D
2D
lin
ks in
D2
D m
od
e
dedicated
shared
Fig. 11. Effect of parameter w on the optimal mode selection to maximizethe total rate. As w increases, the number of links in D2D mode increases.All potential D2D links would be in D2D mode when w ≥ 1.
general utilities (e.g., utilities involving fairness). We leave theanalysis to future work.
VII. CONCLUSION
This paper has presented tractable frameworks for bothdedicated and shared networks, which provide accurate ex-pressions for important performance metrics (i.e., the coverageprobability and average rate). With an appropriate resourcepartitioning, we observe that the dedicated network has alarger overall rate than shared network in downlink scenario. Indedicated network, the D2D links would access the frequencybands as many as needed (i.e., p∗fi = min{1, bDi/(θB)}) tomaximize any non-decreasing utility function. To maximizethe total rate, the potential D2D links are all in D2D mode inboth fully loaded dedicated and shared networks, when w ≥ 1.
There are numerous extensions of the proposed flexiblemodel, like multiple antennas, power control, interference can-cellation or interference alignment, more intelligent schedulingschemes and study of other utility functions. For example,one possible extension is to use the SIR-based CSMA pro-tocol [24]. Though the set of active D2D links is no longera homogeneous PPP, we can approximate it to a PPP withappropriate density, at little cost of accuracy. Then we canuse the proposed model in this paper to analyze the networkperformance. Another possible extension of the proposedframework is to model BSs as other point processes, e.g.,Matern hard core process (MHC), which characterizes therepulsiveness of BSs [45]. Analysis on the effect of w onload balancing is also of interest.
APPENDIX APROOF OF PROPOSITION 1
Conditioning on the distance between a typical transmitterand its receiver, we have
P (SINR > β | v) = P(h0 > s(IΦD + σ2) | v
)(a)= EIΦD
[exp
(−s(IΦD + σ2)
)]= e−sσ
2
LIΦD (s),
where s = βP−1D vα, and LIΦD (s) is the Laplace transform
of random variable IΦD . The equality (a) follows from h0 ∼exp(1), and the last equality follows from the independenceof noise and interference.
The Laplace transform can be further derived as follows:
LIΦD (s) = E
exp
−s ∑Zi∈ΦD\0
PDhi|Zi|−α
(a)= exp
(−2λD
∫ ∞0
∫ ∞0
(1− e−sPDh/u
α)F (dh)udu
)= exp
(−2πλDEh
[∫ ∞0
(1− e−sPDh/u
α)udu
])(b)= exp
(−πλDEh
[Γ
(1− 2
α
)(shPD)
2α
])= exp
(−λD
2π2/α
sin (2π/α)(sPD)
2α
),
where F (dh) is the law of channel fading (e.g., F (dh) =e−hdh in Rayleigh fading), and Γ(x) =
∫∞0tx−1e−tdt. The
equality (a) follows from the Slivnyak’s Theorem of a PPPand the Laplace functional of a PPP [36, 37], (b) is obtainedby changing x = shPD
rα , and the last equality follows from theRayleigh fading assumption. Then we complete the proof bydeconditioning on v.
APPENDIX BPROOF OF COROLLARY 2
In this special case, for D2D links, we have
PD(β) =
∫ ∞0
exp
(−βP−1
D σ2vα − λD2π2/αβ
2α v2
sin (2π/α)
−2πλBH0(β, α)v2 − v2
2δ2
)v
δ2dv
=1
2δ2λD2π2/α
sin(2π/α)β2α + 4δ2πλBH0(β, α) + 1
,
where the last equality is obtained by letting x = v2 andcalculating the integral over x.
As for the cellular users, according to (18), we have
PC(β) =
∫ ∞0
exp
(−λD
2π2/α
sin (2π/α)(βPDPB
)2α r2
−2πλBH1(β, α)r2 − λBπr2)
2λBπrdr
=1
λDλB
2π/αsin(2π/α) (β PDPB )
2α + 2H1(β, α) + 1
.
APPENDIX CPROOF OF PROPOSITION 5
Plugging p∗fi to (27), the average rate of active D2D linksin (27) is non-decreasing with respect to pti . Denoting theaverage rate of cellular users by g(pti), we have
g =7(1− θ)BλB
9w
log2(1 + βC)
2H1(βC , α) + 1
×
(∑Mi=1 λDibDj (1− ptj ) + wλUbC
)(∑M
i=1 λDibDi(1− pti) + λUbC
) ,

13
whose first derivative with respect to ptk is
∂g
∂ptk=
7(1− θ)BλB9w
log2(1 + βC)
2H1(βC , α) + 1
× λDkbDkλUbC(w − 1)(∑Mi=1 λDibDi(1− pti) + λUbC
)2 ≥ 0,
where the last inequality follows from the assumption thatw ≥ 1 for congested networks. Therefore, the rate density isa non-decreasing function of pti and thus p∗ti = 1.
As for a lightly loaded network, with w being very small,the second term dominates the rate density, which is non-increasing with respect to pti when w → 0. Therefore, p∗ti = 0.
APPENDIX DPROOF OF PROPOSITION 6
Denote βC = arg maxβ R(O)Cl and βD = arg maxβ R
(O)Dl .
Plugging p∗ti = 1 to (27), the objective function becomes
maxθ
∑i λDip
∗fiθB log2(βD + 1)
1 + 2δ2∑i λDip
∗fi
2π2/αsin(2π/α)β
2α
−7BλB log2(βC + 1)
9 (2H1(βC , α) + 1)θ.
(31)Recall that we denote Ai =
∑j∈Si λDj bjB log2(βD + 1),
Ci = 2δ2∑j∈Si λDj bj
2π2/αsin(2π/α)β
2α , D = 7BλB
9log2(βC+1)
2H1(βC ,α)+1 ,Ei =
∑j∈Gi λDjB log2(βD + 1), and Fi =
2δ2∑j∈Gi λDj
2π2/αsin(2π/α)β
2α + 1. On the ith region, the
first term of (31) can be written as
maxθ
Eiθ2 +Aiθ
Fiθ + Ci.
The objective function is thus Eiθ2+Aiθ
Fiθ+Ci− Dθ. The first
derivative of (31) is EiFiθ2+2CiEiθ+AiCi(Ci+Fiθ)2 −D and the second
derivative is 2Ci(EiCi−AiFi)(Ci+Fiθ)3 . Note that CiEi = Ai(Fi − 1),
i.e., CiEi < AiFi. We consider the following two cases.(1) For partitions with Ei ≥ FiD, the first derivativeof (31) is non-negative, and thus the objective function isnon-decreasing. In this case, we have θ∗ = bi+1. Note thatEi − FiD decreases as i increases. Denoting the index ofthe last domain that satisfies Ei ≥ FiD by k, the objectivefunction keeps increasing over the first k partitions, and thusθ∗ = bk+1 for the first k partitions.(2) For the partitions with Ei < FiD, we have a posi-tive second derivative, implying that the objective functionis concave. Thus, the optimal solution in the latter case
is[
1Fi
(√Ci(AiFi−EiCi)
DFi−Ei − Ci)]min{1,bi+1}
bi
, where [x]ba de-
notes min{max{x, a}, b}.Combining the above two cases, the proof is complete.
APPENDIX EPROOF OF PROPOSITION 7
When pfiB > bDi , the objective function is non-increasingwith respect to pfi , and thus we have p∗fi ≤ bDi/B. Observingthat pfi only appears in terms of ptipfi , we change variable to
xi = ptipfi . The rate density maximization problem becomes
maxpt,x
d(S)rate (xi, pti)
s.t. xi ≤ bDi/B,xi ≤ pti ≤ 1,∀i ∈ ΦD.
(32)
The objective function (28) is
d(S)rate (xi, pti)
=
∑Mj=1 xjλDjB log2(1 + βD)
2π2/α2δ2β2αD
sin(2π/α)
∑Mi=1 xiλDi + 4δ2πλBH0(βD, α) + 1
+ p(S)a
(∑Mj=1
bDjw (1− ptj )λDj + bCλU
)log2(1 + βC)∑M
i=1 xiλDiλB
2π/αsin(2π/α) (βC
PDPB
)2α + 2H1(βC , α) + 1
,
where the first term is independent of pti , and the second termcan be written as
A
(∑Mj=1 bDj (1− ptj )λDj + wbCλU
)(bCλU +
∑Mi=1 bDiλDi(1− pti)
) , (33)
where A =7BλB
9w∑Mi=1
xiλDiλB
2π/αsin(2π/α)
(βCPDPB
)2α+2H1(βC ,α)+1
> 0.
The first derivative of (33) with respect to pti is
AbCλUbDiλDi(w − 1)(
bCλU +∑Mi=1 bDiλDi(1− pti)
)2 ,
which is non-negative when w ≥ 1. Therefore, given w ≥ 1,the objective function (28) is a non-decreasing function of pti ,and we have p∗ti = 1.
In a lightly loaded network with small w, similar to theproof in Appendix C, we have p∗ti = 0.
REFERENCES
[1] Q. Ye, M. Al-Shalash, C. Caramanis, and J. G. Andrews, “A tractablemodel for optimizing device-to-device communications in downlinkcellular networks,” in accepted by Proc., IEEE Intl. Conf. on Commu-nications (ICC), 2014.
[2] K. Doppler, M. Rinne, C. Wijting, C. Ribeiro, and K. Hugl, “Device-to-device communication as an underlay to LTE-Advanced networks,”IEEE Communications Magazine, vol. 47, pp. 42–49, Dec. 2009.
[3] M. S. Corson, R. Laroia, J. Li, V. Park, T. Richardson, and G. Tsirtsis,“Toward proximity-aware internetworking,” IEEE Wireless Communica-tions, vol. 17, pp. 26–33, Dec. 2010.
[4] X. Wu, S. Tavildar, S. Shakkottai, T. Richardson, J. Li, R. Laroia, andA. Jovicic, “FlashlinQ: A synchronous distributed scheduler for peer-to-peer ad hoc networks,” in Allerton Conference on Communication,Control, and Computing, pp. 514–521, 2010.
[5] G. Fodor, E. Dahlman, G. Mildh, S. Parkvall, N. Reider, G. Miklos,and Z. Turanyi, “Design aspects of network assisted device-to-devicecommunications,” IEEE Communications Magazine, vol. 50, pp. 170–177, March 2012.
[6] K. Huang, V. K. Lau, and Y. Chen, “Spectrum sharing between cellularand mobile ad hoc networks: transmission-capacity trade-off,” IEEEJournal on Sel. Areas in Communications, vol. 27, pp. 1256–1267, Sep.2009.
[7] C.-H. Yu, K. Doppler, C. B. Ribeiro, and O. Tirkkonen, “Resourcesharing optimization for device-to-device communication underlayingcellular networks,” IEEE Transactions on Wireless Communications,vol. 10, pp. 2752–2763, Aug. 2011.
[8] S. Xu, H. Wang, T. Chen, Q. Huang, and T. Peng, “Effective interferencecancellation scheme for device-to-device communication underlayingcellular networks,” in Proc., IEEE Veh. Technology Conf., pp. 1–5, 2010.
14
[9] H. Min, J. Lee, S. Park, and D. Hong, “Capacity enhancement using aninterference limited area for device-to-device uplink underlaying cellularnetworks,” IEEE Transactions on Wireless Communications, vol. 10,pp. 3995–4000, Dec. 2011.
[10] M. Zulhasnine, C. Huang, and A. Srinivasan, “Efficient resource allo-cation for device-to-device communication underlaying LTE network,”in IEEE Wireless Mobile Computing, Networking and Communications(WiMob), pp. 368–375, 2010.
[11] P. Phunchongharn, E. Hossain, and D. I. Kim, “Resource allocationfor device-to-device communications underlaying LTE-Advanced net-works,” IEEE Wireless Communications, vol. 20, pp. 91–100, Aug. 2013.
[12] C. Xu, L. Song, Z. Han, Q. Zhao, X. Wang, and B. Jiao, “Interference-aware resource allocation for device-to-device communications as anunderlay using sequential second price auction,” in Proc., IEEE Intl.Conf. on Communications, pp. 445–449, 2012.
[13] C. Xu, L. Song, Z. Han, Q. Zhao, X. Wang, X. Cheng, and B. Jiao, “Effi-ciency resource allocation for device-to-device underlay communicationsystems: a reverse iterative combinatorial auction based approach,” IEEEJournal on Sel. Areas in Communications, vol. 31, pp. 348–358, Sep.2013.
[14] F. Wang, L. Song, Z. Han, Q. Zhao, and X. Wang, “Joint schedulingand resource allocation for device-to-device underlay communication,”in Proc., IEEE Wireless Comm. and Networking Conf. (WCNC), pp. 134–139, Apr. 2013.
[15] T. Chen, G. Charbit, and S. Hakola, “Time hopping for device-to-devicecommunication in LTE cellular system,” in Proc., IEEE Wireless Comm.and Networking Conf. (WCNC), pp. 1–6, 2010.
[16] L. Lei, Y. Zhang, X. Shen, C. Lin, and Z. Zhong, “Performanceanalysis of device-to-device communications with dynamic interferenceusing Stochastic Petri Nets,” IEEE Trans. on Wireless Communications,vol. 12, pp. 6121–6141, Dec. 2013.
[17] S. Xiang, T. Peng, Z. Liu, and W. Wang, “A distance-dependent modeselection algorithm in heterogeneous D2D and IMT-Advanced network,”in IEEE Globecom Workshops (GC Wkshps), pp. 416–420, 2012.
[18] T. Adachi and M. Nakagawa, “Battery consumption and handoff exami-nation of a cellular ad-hoc united communication system for operationalmobile robots,” in IEEE International Symposium on Personal, Indoorand Mobile Radio Communications, vol. 3, pp. 1193–1197, 1998.
[19] S. Hakola, T. Chen, J. Lehtomaki, and T. Koskela, “Device-to-device(D2D) communication in cellular network-performance analysis of op-timum and practical communication mode selection,” in Proc., IEEEWireless Comm. and Networking Conf. (WCNC), pp. 1–6, 2010.
[20] K. Doppler, C.-H. Yu, C. B. Ribeiro, and P. Janis, “Mode selectionfor device-to-device communication underlaying an LTE-Advanced net-work,” in Proc., IEEE Wireless Comm. and Networking Conf. (WCNC),pp. 1–6, 2010.
[21] M. Jung, K. Hwang, and S. Choi, “Joint mode selection and powerallocation scheme for power-efficient device-to-device (D2D) commu-nication,” in Proc., IEEE Veh. Technology Conf., pp. 1–5, 2012.
[22] M. Haenggi, J. G. Andrews, F. Baccelli, O. Dousse, andM. Franceschetti, “Stochastic geometry and random graphs forthe analysis and design of wireless networks,” IEEE Journal on Sel.Areas in Communications, vol. 27, pp. 1029–1046, Aug. 2009.
[23] F. Baccelli, B. Blaszczyszyn, and P. Muhlethaler, “An Aloha protocol formultihop mobile wireless networks,” IEEE Transactions on InformationTheory, vol. 52, pp. 421–436, Feb. 2006.
[24] F. Baccelli, J. Li, T. Richardson, S. Shakkottai, S. Subramanian, andX. Wu, “On optimizing CSMA for wide area ad-hoc networks,” inInternational Symposium on Modeling and Optimization in Mobile, AdHoc and Wireless Networks (WiOpt), pp. 354–359, 2011.
[25] S. P. Weber, X. Yang, J. G. Andrews, and G. De Veciana, “Transmissioncapacity of wireless ad hoc networks with outage constraints,” IEEETransactions on Information Theory, vol. 51, pp. 4091–4102, Dec. 2005.
[26] S. Weber, J. G. Andrews, and N. Jindal, “An overview of the transmis-sion capacity of wireless networks,” IEEE Transactions on Communi-cations, vol. 58, pp. 3593–3604, Dec. 2010.
[27] J. G. Andrews, F. Baccelli, and R. K. Ganti, “A tractable approach tocoverage and rate in cellular networks,” IEEE Trans. on Communica-tions, pp. 3122 –3134, Nov. 2011.
[28] H. S. Dhillon, R. K. Ganti, F. Baccelli, and J. G. Andrews, “Modelingand analysis of K-tier downlink heterogeneous cellular networks,” IEEEJournal on Sel. Areas in Communications, vol. 30, pp. 550–560, April2012.
[29] X. Lin, J. G. Andrews, and A. Ghosh, “Spectrum sharing for device-to-device (D2D) communications in cellular networks,” submitted to IEEETransactions on Wireless Communications, 2013.
[30] Alcatel-Lucent, “LTE D2D dropping and association,” R1-131789, April2013.
[31] Qualcomm, “D2D deployment scenarios,” R1-131412, April 2013.[32] T. Chen, G. Charbit, and S. Hakola, “Time hopping for device-to-device
communication in LTE cellular system,” in Proc., IEEE Wireless Comm.and Networking Conf. (WCNC), pp. 1–6, 2010.
[33] N. Abramson, “The Aloha system: another alternative for computercommunications,” in Proc. Fall Joint Computer Conf. AFIPS,, pp. 281–285, Nov. 1970.
[34] X. Lin, J. G. Andrews, and A. Ghosh, “Modeling, analysis and designfor carrier aggregation in heterogeneous cellular networks,” IEEE Trans.on Communications, vol. 61, pp. 4002–4015, Sep. 2013.
[35] B. Blaszczyszyn, M. K. Karray, and H.-P. Keeler, “Using Poissonprocesses to model lattice cellular networks,” in Proc., IEEE INFOCOM,April 2013.
[36] F. Baccelli and B. Blaszczyszyn, Stochastic Geometry And WirelessNetworks, vol. 1. Now Publishers Inc, 2009.
[37] D. Stoyan, W. S. Kendall, J. Mecke, and L. Ruschendorf, StochasticGeometry And Its Applications, vol. 2. Wiley New York, 1987.
[38] F. Baccelli, C. Gloaguen, and S. Zuyev, “Superposition of planarVoronoi tessellations,” Stochastic Models, vol. 16, pp. 69–98, Mar. 2000.
[39] J.-S. Ferenc and Z. Neda, “On the size distribution of Poisson Voronoicells,” Physica A: Statistical Mechanics and its Applications, vol. 385,pp. 518–526, Nov. 2007.
[40] S. Singh, H. S. Dhillon, and J. G. Andrews, “Offloading in heterogeneousnetworks: Modeling, analysis and design insights,” IEEE Trans. onWireless Communications, vol. 12, pp. 2484–2497, May 2013.
[41] S. Stanczak, M. Wiczanowski, and H. Boche, Fundamentals of Re-source Allocation in Wireless Networks: Theory and Algorithms, vol. 3.Springer Verlag, 2009.
[42] 3GPP, “Technical specification group radio access network; EvolvedUniversal Terrestrial Radio Access (E-UTRA); Radio Frequency (RF)system scenarios (Release 9),” TR 36.942, V9.0.1, Apr. 2010.
[43] 3GPP, “Further advancements for E-UTRA physical layer aspects,” TR36.814, Mar. 2010.
[44] 3GPP, “Coordinated multi-point operation for LTE with non-ideal back-haul (Release 12),” TR 36.874, Nov. 2013.
[45] Q. Ye, M. Al-Shalash, C. Caramanis, and J. G. Andrews, “Device-to-device modeling and analysis with a modified Matern Hardcore BSlocation model,” in Proc., IEEE Globecom, Dec. 2013.