opacity analysis and estimation of co exhausted by a ... the tested diesel type vehicle, skoda...
TRANSCRIPT

Opacity Analysis and Estimation of CO2 Exhausted by a Diesel EngineVehicle Running under Urban Traffic Conditions
NEGOITESCU ARINA, TOKAR ADRIANAMechanical Machines, Technology and Transportation Department
University Politehnica of Timisoara1 Mihai Viteazu Blv., 300222 Timisoara
ROMANIAFaculty of Civil Engineering
University „Politehnica” of Timişoara2 Traian Lalescu Street, 300223 Timisoara
[email protected], [email protected]
Abstract: - The study includes both the estimation of the total emission of CO2 exhausted by a vehicleequipped with spark ignition engine and the opacity control during testing on the chassis dynamometer in theRoad Vehicles Lab of Politehnica University of Timişoara. The total CO2 estimations were accomplished byDEKRA software assuming that the vehicle is used 60% in urban traffic and 40% in the extra urban. Vehicletesting on the chassis dynamometer LPS 3000 has been achieved in different operating modes, in order tosurvey the gas opacity with AVL Dicom 4000 analyzer.
.Key-Words: - pollutant emissions, internal combustion engine, chassis dynamometer, traffic, gases analyzer
1 IntroductionAir pollution with particulate and gases
leads to important changes in concentration, locallyand worldwide. Climate changes due to the actionof airborne pollutants can have very seriousconsequences. Most dangerous effects are producedby carbon dioxide of which increasing rate becomesmore significant as time goes on. Engines pollutingaction manifests prominently in major urbancenters which are characterized by a high vehiclesdensity.
The smoke and gas smell are still outstandingissues for compression-ignition engines that keepmany unknown data related to noxious origin dueto the mixture formation processes complexity aswell of combustion process [8].
Pollutant called visible smoke, which wasregarded for years as a measure of the degree ofpollution produced by compression engines provedto be a pollutant which not sufficiently characterizethe combusted gases toxicity. In addition to sootparticles that create an optical effect detectable byusing opacimeters, exhaust gases containin ultrafineparticles which cannot be detected only bycollecting and weighing.
The most important factors which influenceemissions level are:
- Operating mode (speed, load, enginetemperature);
- Injection characteristics (injection advance,the injection law);- Engine constructive features (turbulence inthe combustion chamber, the waste gasquantity, heat transfer characteristic of thecombustion chamber, supercharging, inletintermediate cooling air, distribution phases,exhaust gas recirculation degree, variable airflow);- Fuel characteristics (fuel physical andchemical properties);- The engine technical condition (parts wear,the injection equipment status).
Diesel and petrol engines are constrained to verystrict pollution standards. These engines pollutantemissions mainly consist of: nitrogen oxide (NOx),carbon monoxide (CO), solid particles. During thecombustion process carbon particles are generatedin exhaust gases. Due to their presence in smokeopacity varies with their number: the opacity andimplicitly the pollution increase as their number ishigher. Smoke opacity is an indirect soot indicatorin exhaust gases and can be correlated with the fueltendency to form suspended powders during theengine operation (Fig. 1) [6].
WSEAS TRANSACTIONS on HEAT and MASS TRANSFER Negoitescu Arina, Tokar Adriana
E-ISSN: 2224-3461 27 Issue 2, Volume 7, April 2012

Fig. 1 Schematic of Diesel Particulates and vapor phase compounds
Opacity is a material related value defined by therelation: N = 100-T where T is the environmentglobal transmittance of which opacity is measured,calculated for a IEC Type A lighting and a receiverwith the relative spectral responsiveness identical tothe IEC standard observer one in %. The definedmeasured term value is the linear absorptioncoefficient (an independent value related to themeasurement column length).
Recent studies show that CO2 has a crucial rolebecause on the one hand, it exists as a naturalatmosphere component (around 0.04% volume) andon the other hand the rest, in large quantities, is thecombustion processes result. A high rate of totalCO2 emissions is caused by road traffic. Theseemissions have been significant reduced as a resultof restrictive measures despite the traffic significantincrease in recent years [9].
Independent of the fuel type used, gasoline,diesel, natural gas, LPG or biofuel, in all cases, the
air-fuel mixture is burned into the engine. Carbon isan essential component of all fuels, the carbonamount causing the CO2 level resulted fromcombustion. Thus, by burning a liter of gasoline willresult 2370 grams of CO2 and by burning the sameamount of diesel will result 2650 grams of CO2. Inconclusion, burning one liter of fuel will dischargeinto the atmosphere more than 2 kilograms of CO2[1].
There is a close relation between vehicle CO2emission and fuel consumption, which allowssetting the consumption limits. European and worldanti-pollution legislative measures have establishedEURO 1 - EURO 6 standards concerning lightvehicles pollutant emissions.
In Fig. 2 are presented the upper limits allowedby EU rules: EU1-EU6 [4], [5].
Even that EURO 1 - EURO 4 regulations canalso be achieved by vehicles without DPF,environmental legislations will no longer allow thesell of cars without DPF on the EU market.
Fig. 2 EURO 1 - EURO 6 regulations concerning light vehicles emission limits.
WSEAS TRANSACTIONS on HEAT and MASS TRANSFER Negoitescu Arina, Tokar Adriana
E-ISSN: 2224-3461 28 Issue 2, Volume 7, April 2012
2 The CO2 Emissions Calculationwith DEKRA Software
Emissions of CO2 can be determined with theuse of DEKRA software by taking into account thefuel consumption and number of kilometerstraveled.
The EU objective is to limit CO2 emissions fornew vehicles to 120g/km in the medium termalthough the European Automobile ManufacturersAssociation established in 2008 a value of 140g/km. Vehicle CO2 emissions significantly dependon the vehicle using conditions, traffic conditionsand driving style [1]. The software allows the fueleconomy estimation by taking into account severalconditions during the vehicle operation.
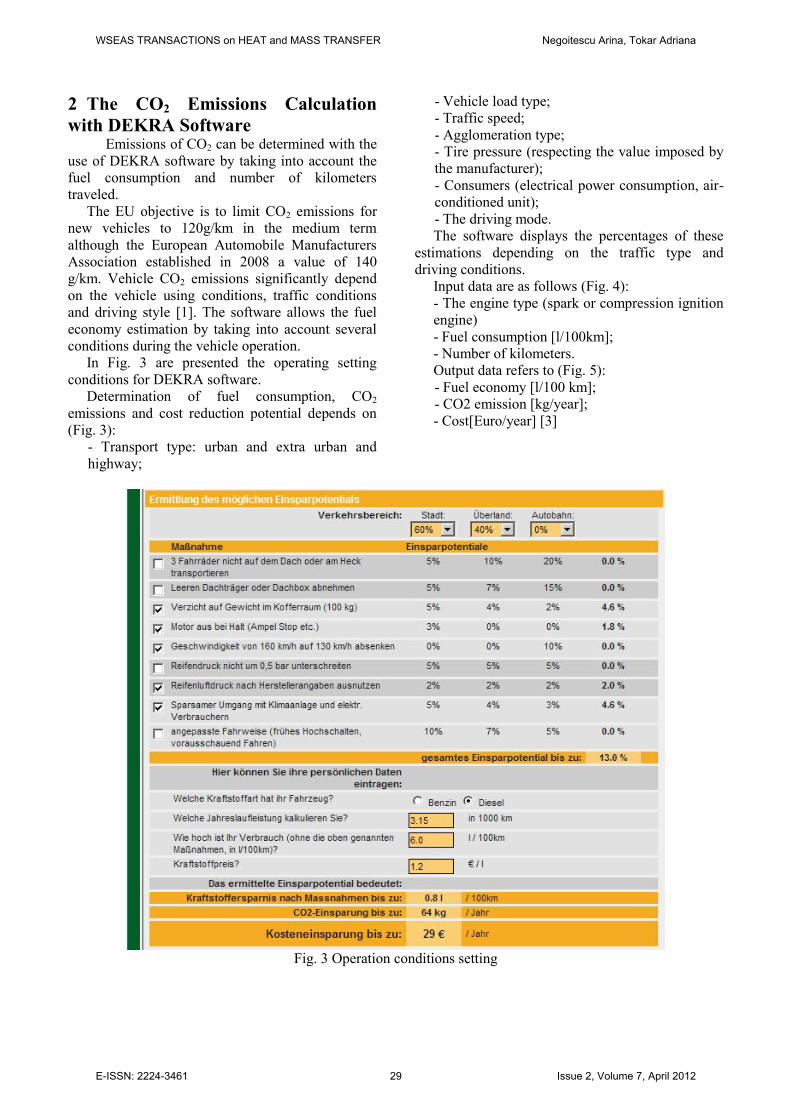
In Fig. 3 are presented the operating settingconditions for DEKRA software.
Determination of fuel consumption, CO2emissions and cost reduction potential depends on(Fig. 3):
- Transport type: urban and extra urban andhighway;
- Vehicle load type;- Traffic speed;- Agglomeration type;- Tire pressure (respecting the value imposed bythe manufacturer);- Consumers (electrical power consumption, air-conditioned unit);- The driving mode.The software displays the percentages of these
estimations depending on the traffic type anddriving conditions.
Input data are as follows (Fig. 4):- The engine type (spark or compression ignitionengine)- Fuel consumption [l/100km];- Number of kilometers.Output data refers to (Fig. 5):- Fuel economy [l/100 km];- CO2 emission [kg/year];- Cost[Euro/year] [3]
Fig. 3 Operation conditions setting
WSEAS TRANSACTIONS on HEAT and MASS TRANSFER Negoitescu Arina, Tokar Adriana
E-ISSN: 2224-3461 29 Issue 2, Volume 7, April 2012
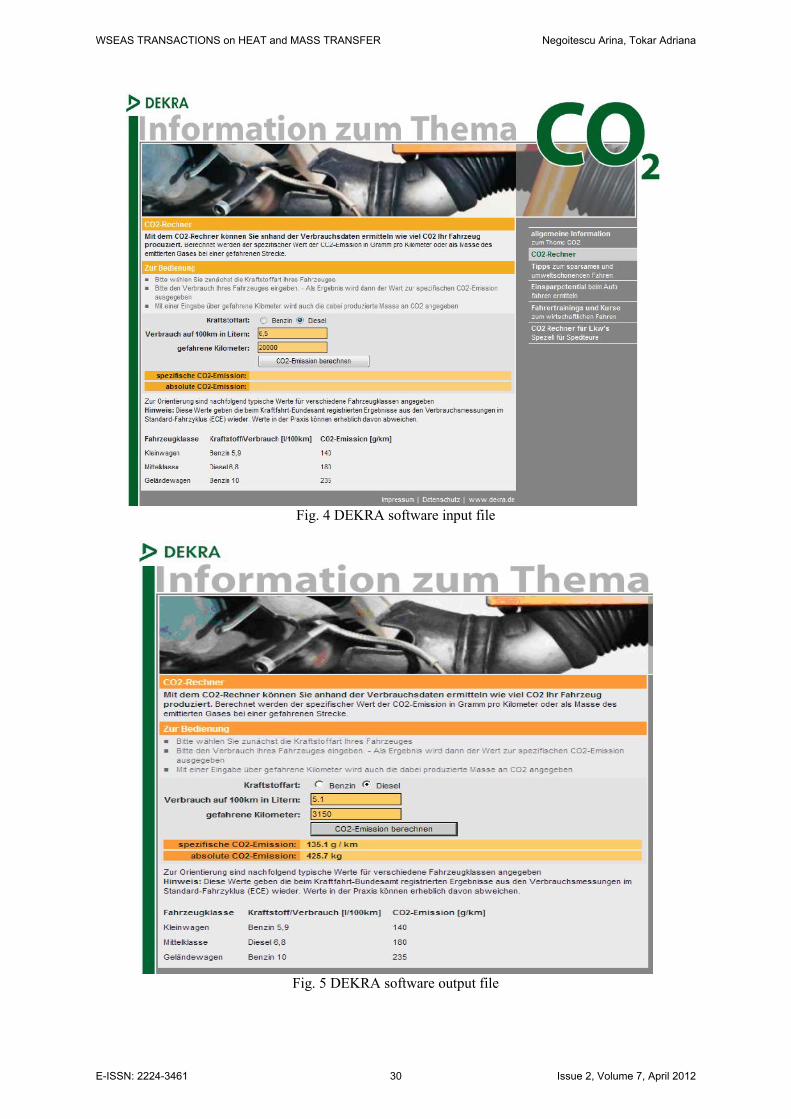
Fig. 4 DEKRA software input file
Fig. 5 DEKRA software output file
WSEAS TRANSACTIONS on HEAT and MASS TRANSFER Negoitescu Arina, Tokar Adriana
E-ISSN: 2224-3461 30 Issue 2, Volume 7, April 2012
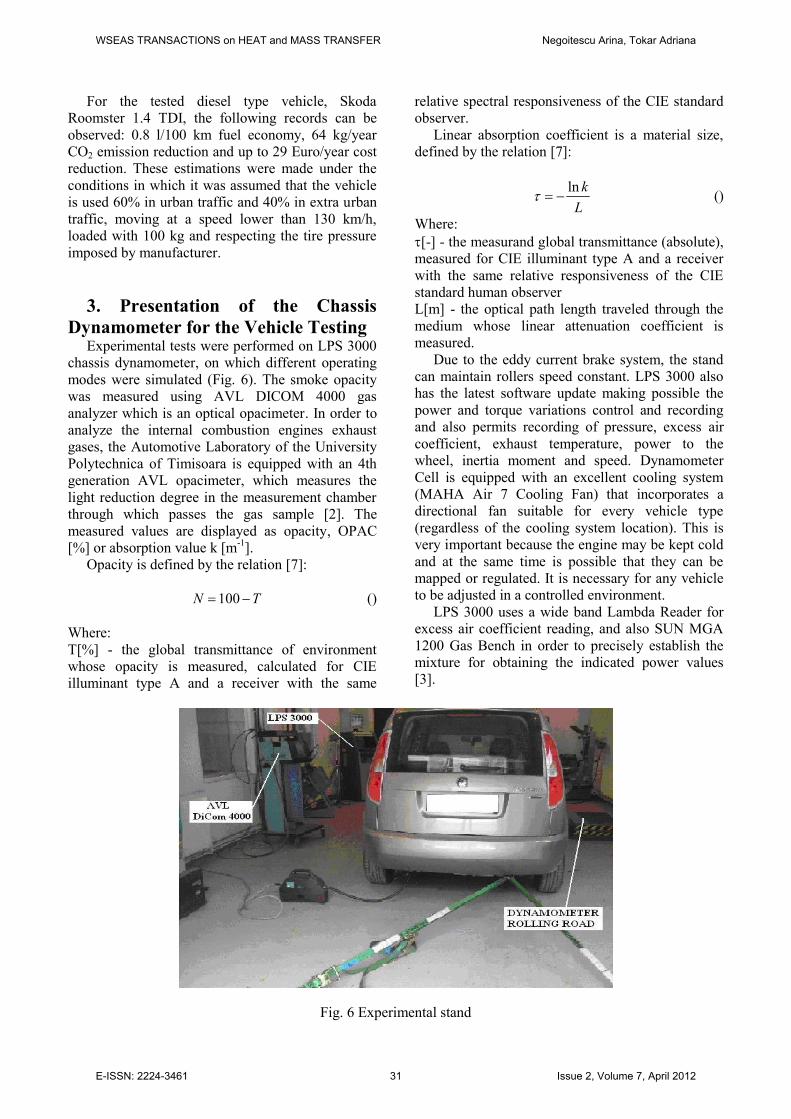
For the tested diesel type vehicle, SkodaRoomster 1.4 TDI, the following records can beobserved: 0.8 l/100 km fuel economy, 64 kg/yearCO2 emission reduction and up to 29 Euro/year costreduction. These estimations were made under theconditions in which it was assumed that the vehicleis used 60% in urban traffic and 40% in extra urbantraffic, moving at a speed lower than 130 km/h,loaded with 100 kg and respecting the tire pressureimposed by manufacturer.
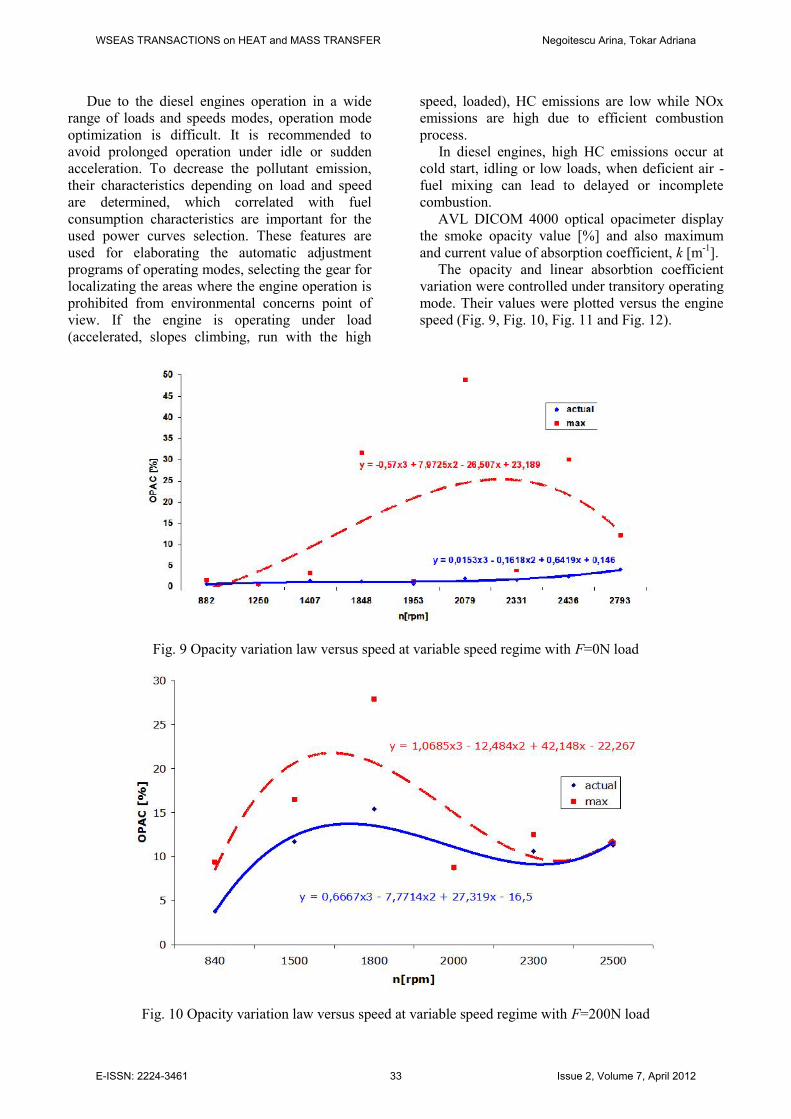
3. Presentation of the ChassisDynamometer for the Vehicle Testing
Experimental tests were performed on LPS 3000chassis dynamometer, on which different operatingmodes were simulated (Fig. 6). The smoke opacitywas measured using AVL DICOM 4000 gasanalyzer which is an optical opacimeter. In order toanalyze the internal combustion engines exhaustgases, the Automotive Laboratory of the UniversityPolytechnica of Timisoara is equipped with an 4thgeneration AVL opacimeter, which measures thelight reduction degree in the measurement chamberthrough which passes the gas sample [2]. Themeasured values are displayed as opacity, OPAC[%] or absorption value k [m-1].
Opacity is defined by the relation [7]:
TN 100 ()
Where:T[%] - the global transmittance of environmentwhose opacity is measured, calculated for CIEilluminant type A and a receiver with the same
relative spectral responsiveness of the CIE standardobserver.
Linear absorption coefficient is a material size,defined by the relation [7]:
Lkln
()
Where:[-] - the measurand global transmittance (absolute),measured for CIE illuminant type A and a receiverwith the same relative responsiveness of the CIEstandard human observerL[m] - the optical path length traveled through themedium whose linear attenuation coefficient ismeasured.
Due to the eddy current brake system, the standcan maintain rollers speed constant. LPS 3000 alsohas the latest software update making possible thepower and torque variations control and recordingand also permits recording of pressure, excess aircoefficient, exhaust temperature, power to thewheel, inertia moment and speed. DynamometerCell is equipped with an excellent cooling system(MAHA Air 7 Cooling Fan) that incorporates adirectional fan suitable for every vehicle type(regardless of the cooling system location). This isvery important because the engine may be kept coldand at the same time is possible that they can bemapped or regulated. It is necessary for any vehicleto be adjusted in a controlled environment.
LPS 3000 uses a wide band Lambda Reader forexcess air coefficient reading, and also SUN MGA1200 Gas Bench in order to precisely establish themixture for obtaining the indicated power values[3].
Fig. 6 Experimental stand
WSEAS TRANSACTIONS on HEAT and MASS TRANSFER Negoitescu Arina, Tokar Adriana
E-ISSN: 2224-3461 31 Issue 2, Volume 7, April 2012

4. Experimental Results on opacityvariation versus speed
Experimental simulation was performed in termsof the stand charged with F=200N and F=0N, for avariable speed mode and with air conditioned unitturned off.
The tested car Skoda Roomster 1.4 TDI -EUROIV presents the following characteristics:
- Engine Diesel- Cylinder capacity 1422 cm3
- Cylinder number 3L- Maximum power 51 kW- Manufacturing year 2008- Maximum weight 1750 kg
- Maximum torque 195 Nm- Traveled km 3150- ITP number 0- Urban consumption 6.1 l/100km- Extra urban consumption 4.5 l/100km- Mixt consumption 5.1 l/100kmFor the tested car, during the emission recordings
the maximum values and environment ones are alsodiplayed (Fig.7).
There were recorded in Road Load Simulationmode the following parameters: driving speed,power, engine speed and force, versus the recordingtime. The tests results are presented in Fig. 8.
Fig. 7 Power measurements
Fig. 8 The parameters recording in Road-load Simulation
WSEAS TRANSACTIONS on HEAT and MASS TRANSFER Negoitescu Arina, Tokar Adriana
E-ISSN: 2224-3461 32 Issue 2, Volume 7, April 2012
Due to the diesel engines operation in a widerange of loads and speeds modes, operation modeoptimization is difficult. It is recommended toavoid prolonged operation under idle or suddenacceleration. To decrease the pollutant emission,their characteristics depending on load and speedare determined, which correlated with fuelconsumption characteristics are important for theused power curves selection. These features areused for elaborating the automatic adjustmentprograms of operating modes, selecting the gear forlocalizating the areas where the engine operation isprohibited from environmental concerns point ofview. If the engine is operating under load(accelerated, slopes climbing, run with the high
speed, loaded), HC emissions are low while NOxemissions are high due to efficient combustionprocess.
In diesel engines, high HC emissions occur atcold start, idling or low loads, when deficient air -fuel mixing can lead to delayed or incompletecombustion.
AVL DICOM 4000 optical opacimeter displaythe smoke opacity value [%] and also maximumand current value of absorption coefficient, k [m-1].
The opacity and linear absorbtion coefficientvariation were controlled under transitory operatingmode. Their values were plotted versus the enginespeed (Fig. 9, Fig. 10, Fig. 11 and Fig. 12).
Fig. 9 Opacity variation law versus speed at variable speed regime with F=0N load
Fig. 10 Opacity variation law versus speed at variable speed regime with F=200N load
WSEAS TRANSACTIONS on HEAT and MASS TRANSFER Negoitescu Arina, Tokar Adriana
E-ISSN: 2224-3461 33 Issue 2, Volume 7, April 2012

Fig. 11 Linear absorbtion coefficient variation law versus speed under transitory operating mode, F=0N
Fig. 12 Linear absorbtion coefficient variation law versus speed under transitory operating mode, F=200N
The tests were achieved with the air-conditioningunit turned off both for the stand loaded with 0Nand 200N.
For the transitory operating mode, when thestand was loaded with F=200N, the opacity recordssmaller values comparing to F=0N (Fig. 9 and Fig.10) [4].
For the two analyzed cases, it can be observedthat that the linear absorbtion coefficient maximumvalue obtained for F=0N is 0.8m-1 at around
2200rpm, while for F=200N the linear absorbtioncoefficient maximum value is equal to 0.55 m-1 foran engine speed of 1600rpm. Comparing the linearabsorbtion coefficient values at the same enginespeed, it results that for F=200N this value is aboutfour times smaller than for F=0N.
As a result of this analyze it is obvious thatopacity and linear absorbtion coefficient valuesshow an increasing trend up to the reach of the
WSEAS TRANSACTIONS on HEAT and MASS TRANSFER Negoitescu Arina, Tokar Adriana
E-ISSN: 2224-3461 34 Issue 2, Volume 7, April 2012

thermal operating mode and afterwards their valuesdecrease.
During measurement it was observed that if theair conditioning unit is turned on, for the same
engine operating mode and F=0N, different opacityand linear absorbtion coefficient values are recorded(Fig.13 and Fig. 14).
Fig. 13 Opacity variation law versus speed at transitory speed mode, F=0N
Fig. 14 Linear absorbtion coefficient variation law versus speed under transitory operating mode, F=0N
WSEAS TRANSACTIONS on HEAT and MASS TRANSFER Negoitescu Arina, Tokar Adriana
E-ISSN: 2224-3461 35 Issue 2, Volume 7, April 2012
By analysing Fig. 13 and Fig. 14, both opacityand linear absorbtion coefficient variation have anincreasing trend up to about 1800rpm and than theirvalues show an abrupt reduction.
The values of those two recorded parameters arehigher when the air conditioning unit is turned on.In summer the vehicles runn with this unit turned onmost of the time, meaning a higher smoke quantityexhausted into the atmosphere. Therefor, in order toreduce this emissions, the nonconventional fuels arerecommended for the vehicle operation.
5 ConclusionFollowing the vehicle test on the chassis
dynamometer under traffic conditions, passingthrough all operation modes, DEKRA software usedto determine CO2 exhausted into the atmosphere bythe studied vehicle, allows the fuel economyestimation by taking into consideration certainconditions during vehicle operation.
Smoke opacity represents an indirect indicator ofsoot contained in exhaust gases and therefore can becorrelated with the fuel tendency to form suspendedpowders during the engine operation.
Most studies agree that emission of suspendedpowders is due to a significant reduction in itsconcentration as insoluble fraction (mainly soot), asa consequence of oxygen presence and aromatichydrocarbons absence when biodiesel fuels areused. The ester molecule oxygen content ensure,with the same amount of intake air, a more completecombustion, even in areas with rich mixture of thecombustion chamber, and in addition helps to thealready formed soot oxidation. When biodiesel isused, due to the lack of aromatic hydrocarbons, areduction of the soot concentration in thecombustion chamber will result.
Considerations concerning the emissionreduction degree have imposed the developmentdirection of the biofuels range. For this reason allEuropean countries and the major fuel companiesare making outstanding research efforts to developnew technologies for producing biofuels
References:[1] ***, Information zum Thema CO2-DEKRASoftware, Version1.0, 2007[2] ***, AVL DiCom4000 User Manual version1.01, AVL LIST GMBH, Graz, Austria, 1998.[3] ***, Chassis Dynamometer LPS3000 - StandardOperating Instructions and User Manual, MAHAMaschinenbau Haldenwang GmbH&Co.KG, 87490Haldenwang, Germany, 2003.
[4] Tokar, A., Researches Regarding the InteractionBetween Internal Combustion Engines andEnvironment, PhD Thesis, Politehnica University ofTimişoara, Romania, 2009[5] Negrea, V.D., Processes in Internal CombustionEngines. Economicity. Pollution Reduction., VolumeII, Politehnica Publishing House, Timişoara, 2003.[6] Linke, M., Particulate Measurement (SAE-Paper 940233), AVL Graz, March, 2009.[7] ***, Legal Metrology Regulation, NML 029-05"Opacimeters", Monitorul Oficial 1181 bis,28.12.2005[8] C. Arapatsakos, D. Christoforidis, S. Gkavaki,The Attitude of CO, HC, NO and Smoke Emissionson Different Temperatures, Recent Advances inUrban Planning &Transportation, Proceedings ofthe 2nd WSEAS International Conference onURBAN PLANNING and TRANSPORTATION,ISSN 1790-2769, ISBN 978-960-474-102-1, pp. 45-50, Rhodos, July 22-25, Greece, 2009[9] Tokar A., Negoitescu A., Evaluation ofEmissions Exhausted by Diesel Vehicles on UrbanRoutes, International Journal of Energy andEnvironment, Issue 2, Volume 4, pp 35-44, 2010
WSEAS TRANSACTIONS on HEAT and MASS TRANSFER Negoitescu Arina, Tokar Adriana
E-ISSN: 2224-3461 36 Issue 2, Volume 7, April 2012