onsite data acquisition using low cost … data acquisition using low cost open source...
TRANSCRIPT

ONSITE DATA ACQUISITION USING LOW COST OPEN SOURCE MICROCONTROLLER
* Magdy Ibrahim & Osama Moselhi Concordia University
1515 St. Catherine W, Montreal Quebec, Canada H3G 2W1
(*Corresponding author: [email protected])

ONSITE DATA ACQUISITION USING LOW COST OPEN SOURCE MICROCONTROLLER
ABSTRACT
This paper presents experimental design and development of a low-cost remote sensing hardware designed to support automated site data acquisition for near real-time progress reporting of construction operations. The developed hardware utilizes open source microcontroller equipped with multiple sensors that include 3D accelerometer, GPS, Data logger and Bluetooth. The use of open source microcontroller makes the developed design cost effective; freeing it from the need for costly license fees. Its platform configuration is flexible; enabling the addition of temperature, weight and other sensors, Wi-Fi and Xbee capabilities to suit individual field applications. Pilot tests have been carried out in laboratory and outdoor environments. The results prove effectiveness and robustness of the developed configuration. The paper provides description of the individual components used in the development of this prototype hardware. It also describes the technical characteristics, capabilities and limitations of the developed hardware. The findings of comparison with alternative technologies used for outdoor tracking of construction operations are presented. The comparison is carried out with respect to range, cost and suitability for outdoor environment. The developed hardware is expected to support a wide range of applications including tracking of earthmoving operations, highway construction and onsite resources. As well, it is expected to enhance safety on construction jobsites.
KEYWORDS On-site data acquisition, Microcontroller, Wireless sensor network.
INTRODUCTION
Field data capturing in construction operations depends largely upon the nature of activity, which
involves tracking of resources (e.g. equipment, materials, and labor) and physical measurements (e.g. Volume, Area, Quantity, etc). Also it is important to capture the contextual features of a project (e.g., temperature, humidity, precipitation) that can affect the performance of construction projects for assisting construction managers to understand the performance of these projects (Taneja et al, 2011). While most of the current data acquisition tools provide huge amounts of raw data, tremendous amount of time is required to process and extract meaningful information. In this paper, we present an undergoing research on sensor networks hardware development using open source Microcontroller.
LITERATURE REVIEW
Various research efforts had integrated a variety of sensing technologies at worksites in major
construction activities including resource management (CII 2001; Proverbs et al. 1995; Saidi 2003; Tommelein 1997), productivity analysis (El-Omari and Moselhi 2009; Kannan 1999; Oloufa et al. 2003), and quality management (Cheok et al. 2001; Gordon et al. 2007). These technologies include barcode, RFID, Global positioning system (GPS), Wireless local area networks (WLAN), 3D laser scanning (LIDAR) and digital imaging.
Barcodes are the most commonly used automated identification technology in retail and
manufacturing industries (Baldwin et al. 1994). Barcodes suffer from the limitation of the need for line-of-sight between the component and the reader, and the reading range of the reader (Jang and Skibniewski 2007). Radio Frequency Identification (RFID) is another automated identification technology. Moselhi and El-Omari (2006) integrated RFID and bar coding technology to track project cost and schedule information.

Razavi et al. (2012) introduced a wide range of protocols for RFID deployment for indoor construction. Montaser and Moselhi (2012) presented an automated methodology for tracking earthmoving operations in near real time utilizing RFID technology to capture data during construction. RFID technology does not suffer from the limitations of barcodes, RFID does not require line-of-sight, and some types of RFID have long communication range, which enables easy automated identification in harsh environments, but this technology have performance problems if metals and water are present in the environment. For outdoor localization and tracking of outdoor operations, the most common solution is the Global Positioning System (GPS). Moselhi and Alshibani (2007) presented a model designed for planning, tracking and control of earthmoving operations using spatial technologies including Global Positioning System (GPS) and Geographic Information System (GIS).
Although using Commercial Off-The-Shelf (COTS) technologies provided valuable solutions for
tracking and monitoring of construction operations, they require manual or semi-automated data post-processing. Hence, there is a need for a fully automated tracking and monitoring tool, capable of reporting project status in a timely manner with minimal user intervention. Full automation can be achieved by special customization and development of these technologies with the help of microcontrollers and embedded applications. This paper presents an under-development fully automated tool that utilizes the new advancement in automation site data acquisition technology, and has different potential applications in construction projects management.
DATA COLLECTION AND MANAGEMENT SCHEMES
In existing deployments of data acquisition equipment in construction sites, data collection
schemes commonly use sensors or readers to relay raw data to a mobile computer. The aggregated data is raw data that has little value in itself. Hence the data is synced to centralized database or sink node to perform further processing, and to extract meaningful information. This data collection scheme suffers from high volume of data traffic towards the sink node, and, hence, long processing time.
SN SN SN
DBSN
PN
GW
DB
Sensor
Node
Processor
Node
Gateway
Node
Database
Typical
SN SN SN
PN PN
GW
DB
Proposed
Figure 1 – Data Collection Schemes
The proposed scheme will support localized cooperation of sensor nodes to perform complicated tasks and in network data processing to transform raw data into high level domain-dependent information. Towards this direction, data aggregation and processing have to be done in a way that renders it valuable to applications that receive stored or real time data. Sensory data has to be collected, aggregated and interpreted at the sensor node according to information that is relevant to the deployed applications. This will decrease the post-processing time and user intervention required to provide contextual information

essential for situational project management. The proposed sensor network is built using a gateway node and one or more sensor nodes. The gateway node has sufficient computing power and no energy or memory restrictions. The gateway acts as the interface to the system. The sensor nodes are resource constrained devices, running on batteries. The sensors perform the actual data acquisition. The sensor nodes are organized into a tree that routes data towards the root, where the gateway node is located as shown in
Figure 1. Such tree configuration facilitates in-network aggregation and reduces the amount of
routing data a node has to keep.
Microcontroller System A microcontroller can be considered a self-contained system with a processor, memory and
peripherals and can be used as an embedded system. The majority of microcontrollers in use today are embedded in other machinery, such as automobiles, telephones, appliances, and peripherals for computer systems. Embedded systems are computer systems designed to do one or a few dedicated and/or specific functions often with real-time computing constraints. Design engineers optimize the product size and cost and in turn increase its reliability and performance as embedded systems to do specific tasks. Some embedded systems are mass produced, benefiting from economies of scale (
Figure 2).
Figure 2 – Arduino Uno Microcontroller (http://www.arduino.cc)
The main difference between the embedded controller and a PC is that the embedded controller is dedicated to one specific task or set of tasks but a PC is designed to run many different programs and to connect many different external devices. An embedded controller has a single program and as a result, can be made with low cost to include just enough computing power and hardware to perform that dedicated task which it was designed to perform. As stated earlier, customization of the technologies is required to achieve full automation of the site data acquisition. Microcontrollers can add this customization and development layer, where development of embedded applications can take place to provide on-location sensor data processing layer.
HARDWARE DESCRIPTION
The proposed system consists of microcontroller with data logging capabilities, wireless
communication module, positioning module, diverse types of sensors and a power supply. Block diagram of the proposed system is shown in
Figure 3. The microcontroller is Arduino Uno 16 bit, 32 Kb Flash Memory, 16 MHz and 14 digital
input/output. The wireless communication module is a WiFi module with the option of adding a GSM module for mobility communication. The positioning module has two options, GPS sensor for outdoor positioning and RF localization (Bluetooth, Zigbee or RFID) for indoor localization. A variety of sensors can be connected to the microcontroller based on the application at hand. The sensors can be categorized based on the type of the measurements: physical, proximity and environmental. For Physical measurements, weight measurements by load cell; quantities and volume by flash LIDAR; distance by ultrasonic sensors;

and acceleration by 3D accelerometer. For proximity detection, Bluetooth and Xbee can be used. For environmental measurements, several sensors can be used such as temperature, pressure and wind speed sensors.
Positioning Module Sensors
Communication Module
Data Logger ModuleMicrocontroller
Figure 3 – Hardware Block Diagram
IMPLEMENTATION AND TESTING There are wide varieties of possible hardware configurations based on the applications. For the
purpose of the present research, tests were performed on the following hardware configuration: an Arduino Uno microcontroller, 32 Kb Flash Memory, 16 MHz and 14 digital input/output with a GPS sensor, class 1 Bluetooth module, 2 Gigabyte data logger and 3D accelerometer (
Figure 4). This configuration is used as a primary testing prototype, to investigate the effectiveness and robustness of the development made.
Figure 4 – Hardware Configuration Hardware Testing

The developed hardware had undergone different testing. The GPS module is tested for the logging and reporting capabilities of accurate location for the outdoor environment (Figure 5).
Figure 5 – GPS tracking and logging field test
The 3D accelerometer had been tested for the detection of aggressive driver behavior by detection of sudden acceleration change during accelerating and breaking of a vehicle (
Figure 6).
-5
0
5
10
15
20
0 50 100 150 200 250 300
Speed (m/s)
Acceleration (m/s2)
-5
0
5
10
15
20
400 450 500 550 600
Speed (m/s)
Acceleration (m/s2)
Normal
BrakeHarsh
Brake
Normal
Acceleration
Harsh
Acceleration
Figure 6 – Driving behavior monitoring field test
The Bluetooth module had also been tested for the average proximity detection time and the range of detection in indoor laboratory environment (
Figure 7).
0
50
100
150
200
250
300
Frequency
Time (Seconds)
Bluetooth Detection Time
-90
-80
-70
-60
-50
-40
-30
-20
-10
0
0 2 4 6 8 10 12 14 16
Sig
na
l Str
en
gth
(d
Bm
)
Distance (m)
Rssi dBm
Estimate (Regression)

Figure 7 – Bluetooth laboratory test
The field tests results show that the system is functioning accurately, the microcontroller perform
the programmed tasks with acceptable performance without any user intervention and the system is showing good potential for many applications as described in the following section. Capabilities and Limitations
Tracking of building components within a site may require an accuracy of a few meters (i.e., 5–10
m), whereas tracking of transportation vehicles may only require accuracy from 25–50 m (Taneja et al, 2011). The tested hardware has capabilities of outdoor location tracking and logging with 20 meters accuracy which is suitable for tracking earth moving equipment; outdoor proximity detection with 100 meters range; abusive driving behaviour detection; and good potential for indoor localization.
The main limitation of the system is that a preset hardware configuration had to be chosen based
on the application requirements, while it is easy to customize this configuration and add or remove from it some features, it requires some knowledge of hardware assembly and software programming. It is also important to note that, special characteristics of sensor nodes, such as their resource constraints (low battery power, limited signal processing, limited computation and communication capabilities as well as small amount of memory) have to be considered while designing data management schemes.
Technologies Comparison
Each technology has some inherent limitations or disadvantages that make it practical or
economical for only a limited range of applications. The capability of each technology for tracking of construction operations are highlighted in the following table:
Table 1 – Technology comparison
Technology User Intervention Level
Range Application Cost
GPS Tags Semi Automated - Outdoor tracking
Each tag: $500 + $12.50 / month
RFID Semi Automated Active: < 30 m Passive: 1- 4 m
Outdoor and Indoor Tracking
Active Tag $10 Passive Tag $ 0.50 Reader $1500.00
UWB Semi Automated Up to 100 m Outdoor and Indoor Tracking
System consist of: 4 receivers + 1 hub + cables + tags Receiver $2195 Hub $5195 Tag $40 (Khoury & Kamat 2009)
Microcontroller Based WSN
Fully Automated Up to 100 m Outdoor and Indoor
Each Unit $150
When WSN compared to other technologies, WSN is the only technology that supports a fully
automated applications while having an acceptable cost.
POTENTIAL APPLICATIONS
Automated Earthmoving Operations Monitoring and Tracking

Large earthmoving operations require automated site data acquisition and progress tracking systems. Large and expensive equipment involved in these operations. Trucks are one of the major equipment used in earthmoving and mining operations. Trucks are used to haul soil, overburden and ore from the cut site or pit to a dump site, stockpile or to the next stage of a mining process. Their use is scheduled in conjunction with other equipment, such as excavators, loaders and diggers, according to the site layout and production capacity.
Trucks operation involves different modes within a single payload cycle, namely:
• Idle while empty (queuing). • Loading. • Travelling Loaded (Hauling). • Stopped Loaded (Stop in congestion, or traffic sign). • Dumping. • Travelling empty (Return). • Stopped empty (Stop in congestion, or traffic sign).
An automated data acquisition must detect the different truck operating modes and the time spent
in each mode of operation. This information, provide the management with a deeper understanding of the site operations and the productivity.
Figure 8: Automated Earth Moving Operations Monitoring and Tracking
The proposed tracking system consists of a mobile station and a stationary station. The mobile station is an on-board monitoring system consists of (
Figure 8): • Passive global positioning system (GPS) where the truck driver’s involvement in the data
collection effort is minimal. The collected GPS data is used to determine travel times, distances, routes, vehicle speeds and driver behavior Reporting (speeding).
• Tri-axis digital accelerometer for motion detection, engine idle time and driver behavior reporting (rapid acceleration, harsh braking) using configurable thresholds
• Wireless communications module with Bluetooth technology, which simplifies data transfer the data to the base station on site after each trip.
• Micro SD memory card. • Micro Processor controller running the data collection and transfer algorithms. • Housing configured for placement in a vehicle and supporting the display.

The stationary station is software based Bluetooth scanners, which can run on any device with Bluetooth dongle such as desktop pc, laptop, tablet PC, PDA or smart phone. The Bluetooth dongle can be modified to extend the rage (
Figure 9).
Figure 9: Modified Linksys USBBT100 Dongle
This software scans the nearby area for arriving trucks, and sends the request for the trip data to be transmitted by the Bluetooth. The algorithm processes the raw GPS data into meaningful trip tour information. Bluetooth proximity is used to detect the arrival and departure times of the hauling trucks (
Figure 10). Also the loading and the queuing time is detected through Bluetooth proximity.
Figure 10: Bluetooth Proximity Detection
The system is able to monitor equipment, processes and activities through Bluetooth wireless technology, providing information on actual productivity, project progress, equipment performance, if equipment has been stressed or in some way compromised, etc. The payload weight can be estimated as the maximum capacity of the truck, or additional weight sensor can be incorporated in the system to give exact measurement of the payload.
Enhanced Construction Site Management
Site management refers to the administration of areas, which can contain valuable vehicles or
machinery. It allows for enhanced supervision of site workers and equipment as well as control over safety factors. Two systems are based on Bluetooth technology will be introduced: (1) Site Geo-fencing system; and (2) Automated labor and equipment proximity alert system.
Site Geo-Fencing System:
Job site security is a major concern for construction companies to minimize financial losses
arising from theft of valuable materials and equipment. Many companies are turning to wireless technology to create cost-effective innovative mobile surveillance and alarm systems. Geo-fencing, is the process of tracking software to create a virtual boundary around a specific geographical location to be tracked tracking hardware (
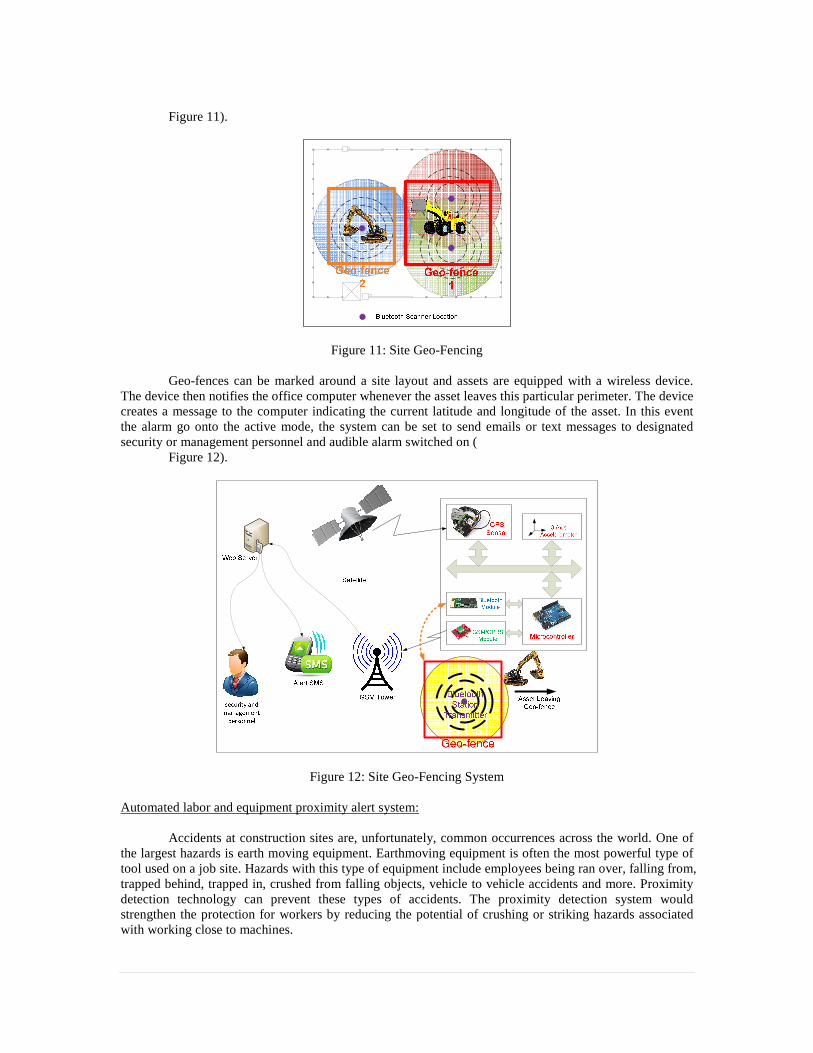
Figure 11).
Figure 11: Site Geo-Fencing
Geo-fences can be marked around a site layout and assets are equipped with a wireless device. The device then notifies the office computer whenever the asset leaves this particular perimeter. The device creates a message to the computer indicating the current latitude and longitude of the asset. In this event the alarm go onto the active mode, the system can be set to send emails or text messages to designated security or management personnel and audible alarm switched on (
Figure 12).
Figure 12: Site Geo-Fencing System
Automated labor and equipment proximity alert system: Accidents at construction sites are, unfortunately, common occurrences across the world. One of
the largest hazards is earth moving equipment. Earthmoving equipment is often the most powerful type of tool used on a job site. Hazards with this type of equipment include employees being ran over, falling from, trapped behind, trapped in, crushed from falling objects, vehicle to vehicle accidents and more. Proximity detection technology can prevent these types of accidents. The proximity detection system would strengthen the protection for workers by reducing the potential of crushing or striking hazards associated with working close to machines.
Proximity detection is a protection system that can detect the presence of a worker in the
hazardous area around heavy equipment (commonly referred to as the “red zone”) and cause a warning signal to be activated.
Red zones include (but are not limited to):
• Blind spots and/or areas of limited visibility • Rotating machinery • Swing radius • Travel path • Under suspended or overhead loads • Overhead hazards (i.e. overhead utility lines, and overhead piping/cable trays, etc.) • Working over or around existing underground facilities • Close proximity of moving equipment
Proximity detection technology has the potential to dramatically improve the safety of
construction sites. Furthermore, this technology could be applied to dump points to warn the machine operator when he or she approaches the stopping point.
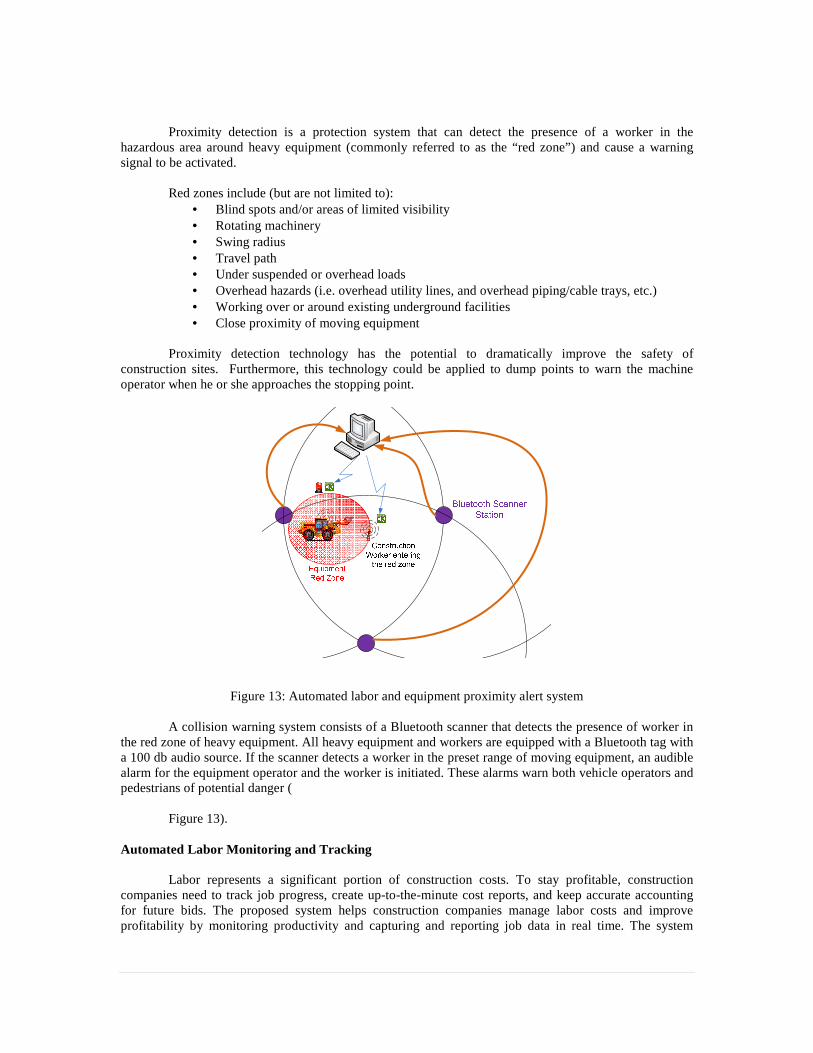
Figure 13: Automated labor and equipment proximity alert system
A collision warning system consists of a Bluetooth scanner that detects the presence of worker in the red zone of heavy equipment. All heavy equipment and workers are equipped with a Bluetooth tag with a 100 db audio source. If the scanner detects a worker in the preset range of moving equipment, an audible alarm for the equipment operator and the worker is initiated. These alarms warn both vehicle operators and pedestrians of potential danger (
Figure 13).
Automated Labor Monitoring and Tracking Labor represents a significant portion of construction costs. To stay profitable, construction
companies need to track job progress, create up-to-the-minute cost reports, and keep accurate accounting for future bids. The proposed system helps construction companies manage labor costs and improve profitability by monitoring productivity and capturing and reporting job data in real time. The system

allows supervisors to assign jobs, tasks, and cost codes, and to review, approve, and submit time sheets remotely. It also tracks the past and present location of equipment and personnel, provides location information when workers clock in and out, displays their position when they start or complete an assigned job, creates an audit trail to validate the project sequence, and generates step by step progress updates.
Figure 14: Automated Labor Monitoring and Tracking
The system consists of Bluetooth scanner stations evenly placed across the construction area to have full coverage and the labor helmets equipped with Bluetooth transmitter module. As the Crew formation is predefined in the database, the system is able to identify which crew it is, and the triangulation only need to be calculated on only one member of the crew to identify the location of the work being executed. The system identifies the activity related to this crew from the activity tracking database, then tracks the amount of time spent on this activity. The schedule is automatically with the information in the database, and the progress can be generated accordingly (
Figure 14).
CONCLUSION On-site Microcontroller data acquisition systems can provide an ideal solution for the
development of fully automated construction site data collection and processing systems which are capable of extracting abstracted measurements from diverse sets of sensor network nodes. A microcontroller-based, data acquisition system was developed and tested for possible use on construction projects. This study demonstrates that principles of proper data acquisition are applicable not only in laboratories, but also in real-world applications. Several field and laboratory experiments had been done to test the capabilities of the developed system, including tracking capabilities and measurement and detection of proximity. The results show a potential for using this development in automated data acquisition from construction sites. Different potential application of the developed hardware in the construction management domain had been presented.
REFERENCES
Bahl, P., and Padmanabhan, V. N. (2000). “RADAR: An in-building RF-based user location and tracking
system.” Proc., IEEE INFOCOM 2000, Vol. 2, IEEE, New York, 775–784. Baldwin, A. N., Thorpe, A., and Alkaabi, J. A. (1994). “Improved materials management through bar-
coding: Results and implications from a feasibility study.” Proc., ICE, 102(4), 156–162.

Cheok, G. S., Stone, W. C., Lipman, R. R., Witzgall, C., and Bernal, J. (2001). “Laser scanning for construction metrology.” American Nuclear Society 9th Int. Topical Meeting on Robotics and Remote Systems, LaGrange Park, IL.
Construction Industry Institute (CII).(2001). “Radio frequency identifica- tion tagging: Applications for the construction industry.” Implementa- tion resource 151-2, Univ. of Texas at Austin, TX.
Deasy, T. P., and Scanlon, W. G. (2004). “Stepwise algorithms for improv- ing the accuracy of both deterministic and probabilistic methods in WLAN-based indoor user localization.” Int. J. Wireless Inform. Network., 11(4), 207–16.
Elnahrawy, E., Xiaoyan, L., and Martin, R. P. (2004). “The limits of locali- zation using signal strength: A comparative study.” 1st Annual IEEE Communications Society Conf. on Sensor and Ad Hoc Communications and Networks, New York, 406–414.
El-Omari, S., and Moselhi, O. (2009). “Data acquisition from construction sites for tracking purposes.” Eng., Constr., Archit. Manage., 16(5), 490–503.
Gordon, C., Akinci, B., and Garrett, J. H. (2007). “Formalism for construc- tion inspection planning: Requirements and process concept.” J. Com- put. Civ. Eng., 21(1), 29–38.
Hightower, J., Want, R., and Borriello, G. (2000). “SpotON: An indoor 3D location sensing technology based on RF signal strength.” Tech. Rep. UW CSE 2000-02-02, Univ. of Washington, Seattle, WA.
Kannan, G. (1999). “A methodology for the development of a production experience database for earthmoving operations using automated data collection.” Ph.D. thesis, Dept. of Civil Engineering, Virginia Polytech- nic Institute and State University, Blacksburg, VA.
Montaser, A., and O. Moselhi (2012). “RFID+ for Tracking Earthmoving Operations.” Construction Research Congress @ sConstruction Challenges in a Flat World: 1011–1020.
Moselhi, Osama, and Samir El-Omari. (2006). "Integrating bar coding and RFID to automate data collection from construction sites." Joint International Conference on Computing and Decision Making in Civil and Building Engineering. Montréal, Canada. 1734 - 1741.
Moselhi, O., and A. Alshibani. (2007). “Crew optimization in planning and control of earthmoving operations using spatial technologies.” J. Inf. Tech. Constr 12: 121–137.
Ni, L. M., Liu, Y., Lau, Y. C., and Patil, A. P. (2004). “LANDMARC: Indoor location sensing using active RFID.” Wireless Networks, 10(6), 701–710.
Oloufa, A. A., Ikeda, M., and Oda, H. (2003). “Situational awareness of construction equipment using GPS, wireless and web technologies.” Autom. Constr., 12(6), 737–748.
Pradhan, A., Ergen, E., and Akinci, B. (2009b). “Technological assessment of radio frequency identification technology for indoor localization.” J. Comput. Civ. Eng., 23(4), 230–238.
Proverbs, D., Olomolaiye, P., and Harris, F. C. (1995). “Organizational pro- ductivity—A case study of materials management in UK construction firms.” Construction Papers 44, Chartered Institute of Building, Ascot, Berkshire, U.K.
Saidi, K. S. (2003). “Report of the NISTworkshop on data exchange stan- dards at the construction job site.” Proc., 20th Int. Symp. on Automation and Robotics in Construction (ISARC), Eindhoven, Netherlands.
Skibniewski, M. J., and Jang, W. S. (2009). “Simulation of accuracy performance for wireless sensor-based construction asset tracking.” Comput. Aided Civ. Infrastruct. Eng., 24(5), 335–345.
Taneja, S., B. Akinci, J. H. Garrett, L. Soibelman, E. Ergen, A. Pradhan, P. Tang, et al. 2011. “Sensing and Field Data Capture for Construction and Facility Operations.” Journal of construction engineering and management 137 (10): 870–881.
Tommelein, I. D. (1997). “Using palm-top computers in teaching materials management.” Construction Congress V: Managing Engineered Con- struction in Expanding Global Markets, ASCE, Reston, VA, 405–413.