new information on lending to small businesses and … information on lending to small businesses...
TRANSCRIPT

New Information on Lending to Small Businessesand Small Farms: The 1996 CRA Data
Raphael W. Bostic and Glenn B. Canner, of theBoard’s Division of Research and Statistics, preparedthis article. Sheryl L. Hudson and John E. Matsonprovided research assistance.
The Community Reinvestment Act (CRA) of 1977 isintended to encourage commercial banks and savingsassociations to help meet the credit needs of theirlocal communities in a manner consistent with safeand sound banking practices. As a consequence ofrecent revisions to the regulations that implement theCRA, new information is now publicly available onthe geographic distribution of small loans to busi-nesses and farms and on community developmentlending. Because small businesses and small farmsare more likely than larger ones to borrow smallamounts, the CRA data on small loans are likely toprovide a reasonable measure of the extension ofcredit to such businesses (and hence, in this article,inferences about lending to small businesses andsmall farms are based on data on small loans).
The new CRA data, combined with informationreported by institutions about the geographic areasthat constitute their local communities, enable lend-ers, supervisory agencies, and members of the publicto better assess the performance of these institutionsin meeting their CRA obligations. Just as the avail-ability of credit to purchase, refinance, and improvehomes is critical to the well-being of local communi-ties, so is the availability of credit for small busi-nesses and small farms. The new CRA data thuscomplement information made available pursuant tothe Home Mortgage Disclosure Act (HMDA) aboutthe flow of housing-related credit to communitiesnationwide.1 The CRA data also provide newopportunities to gauge the flow of credit to com-
munities with differing economic and demographiccharacteristics.
Although intended primarily to facilitate assess-ments of performance under the CRA, the data onsmall business and small farm lending are likely to beused in other ways as well. For example, lendinginstitutions may use the data to help evaluate theeffectiveness of products and services and to calcu-late their share of the small business loan market in agiven geographic area. Similarly, the federal agenciescharged with enforcing the nation’s antitrust lawsmay use the CRA data in assessing the competitiveeffects of bank mergers and acquisitions.
This article presents an initial assessment of thenew CRA data on originations and purchases of smallbusiness and small farm loans during 1996. It ismainly intended to provide a description of the depthand breadth of the data and to place the informationin the context in which it will be used for CRA andother regulatory enforcement activities. The focus ofthe analysis is on the broad patterns that emergewhen the data are reviewed from a national perspec-tive rather than on the lending activities of any indi-vidual institution. The article also discusses some ofthe important limitations of the data and challengesthat arise in using this new information.
For 1996, we find that nearly 2,100 large commer-cial banks and savings associations (savings banksand savings and loan associations) reported data ontheir small business, small farm, and communitydevelopment lending and on the geographic areasthat constitute their local communities.2 While theyaccount for only 18 percent of all commercial banksand savings associations, the CRA reporters extendabout two-thirds of all small business loans and aboutone-fifth of all small farm loans granted by suchinstitutions. Of the CRA reporters that extendedloans, the most active 1 percent granted a large pro-portion (nearly half) of the small business loans and13 percent of the small farm loans.
Like the number of businesses and farms, the dis-tribution of lending to small businesses and small
1. HMDA data have been available for many years and have beenwidely analyzed. Research based on HMDA data has found that theflow of mortgage credit varies with characteristics of borrowers andlocal neighborhoods. See Glenn B. Canner and Dolores S. Smith,‘‘Home Mortgage Disclosure Act: Expanded Data on ResidentialLending,’’ Federal Reserve Bulletin, vol. 77 (November 1991),pp. 859–81; and Glenn B. Canner and Wayne Passmore, ‘‘HomePurchase Lending in Low-Income Neighborhoods and to Low-IncomeBorrowers,’’ Federal Reserve Bulletin, vol. 81 (February 1995),pp. 71–103.
2. The regulation implementing the CRA requires only large com-mercial banks and savings associations to report their lending activity.

farms varies geographically. Most small businessloans are extended in central city and suburban areas;most small farm loans, not surprisingly, are in ruralareas. Overall, the distribution of small business lend-ing across census tracts categorized by their incomegenerally follows the distribution of the populationand businesses across these areas. Within central cityareas, the data show that most small business loansare extended in areas with low home-ownershiprates—areas that tend to have high concentrations ofbusinesses. About half of the CRA reporters extendedcommunity development loans, which tended to bemuch larger in size than the average small business orsmall farm loan.
ORIGINS OF THENEW DATA REPORTINGREQUIREMENTS ONSMALL BUSINESS ANDSMALL FARM LENDING
The CRA was enacted two decades ago in responseto the concern that many commercial banks andsavings associations were thought to be acceptingdeposits from households and firms in inner citieswhile lending and investing them primarily else-where. These ‘‘disinvestment’’ activities, it was main-tained, were contributing to the decline of manyurban areas as evidenced by a deterioration in thequality of housing in these areas and a shift of jobsto surrounding areas. In adopting the CRA, the Con-gress reaffirmed the principle that commercial banksand savings associations have an obligation undertheir charters to serve the ‘‘convenience and needs’’of their local communities by providing credit ser-vices to all segments of those communities. For pur-poses of enforcement, the supervisory agencies aredirected to periodically assess the performance ofinstitutions in this regard, to make available to thepublic written evaluations, including CRA perfor-mance ratings, and to consider the institution’s recordin acting on applications for deposit facilities, merg-ers, and acquisitions.3
Evolution of CRA Regulation
Historically, CRA performance evaluations focusedon the processes used and efforts made by institutionsto serve their local communities as well as on the
results of those efforts. This approach to CRA assess-ments was heavily criticized, both by communityorganizations and lending institutions. Communityorganizations argued that the examination processfailed to make meaningful distinctions between insti-tutions that performed well and those that performedpoorly. Lenders contended that CRA enforcementwas too focused on process and paperwork and thatthe examination standards were unclear and inconsis-tently applied. In response to these concerns, Presi-dent Clinton in July 1993 asked the supervisory agen-cies to reform the regulations that implement theCRA.4
The agencies subsequently adopted revised regula-tions in May 1995 that were intended to make CRAassessments more performance-based, more objec-tive, and less burdensome for covered institutions.The new regulations substitute three performancetests—lending, investment, and service—for thetwelve assessment factors contained in the originalregulation.5 (See the box ‘‘The Three CRA Perfor-mance Tests.’’)
In assessing compliance with the CRA, the threeperformance tests are evaluated in the context ofinformation about the institution and its community,competitors, and peers. For example, CRA assess-ments consider the economic and demographic char-acteristics of the local service areas; lending,investment, and service opportunities in the localcommunity; the institution’s product offerings andbusiness strategy; and its capacity and constraints.6
Lending to Small Businesses and Small Farms
Although data collection efforts in support of CRAenforcement have traditionally focused on homemortgage lending, a consensus has evolved in recentyears that lending to small businesses and smallfarms is also critical for a vital and viable commu-nity. Responding to this recognition, one of the moresignificant changes to the regulation requires com-mercial banks and savings associations defined as
3. The supervisory agencies are the Board of Governors of theFederal Reserve System, the Federal Deposit Insurance Corporation,the Office of the Comptroller of the Currency, and the Office of ThriftSupervision.
4. For a discussion of the original regulation and concerns thatled to the revised regulation, see Griffith L. Garwood and Dolores S.Smith, ‘‘The Community Reinvestment Act: Evolution and CurrentIssues,’’Federal Reserve Bulletin,vol. 79 (April 1993), pp. 251–67.For a discussion of the new regulation and the regulatory alternativesconsidered before its adoption, see the Federal Reserve’s press releaseon the new CRA regulations, April 24, 1995.
5. For a description of the original twelve assessment factors, seeGarwood and Smith, ‘‘The Community Reinvestment Act,’’ p. 253.
6. For further details, see the Federal Reserve press release,April 24, 1995, and Kevin T. Kane, ‘‘CRA’s More Flexible Yard-stick,’’ Mortgage Banking(September 1997), pp. 54–60.
2 Federal Reserve Bulletin January 1998
‘‘large’’ under the regulation to collect and reportdata annually on the number and dollar amount oftheir originations and purchases of small loans tobusinesses and farms and any community develop-ment loans. Only independent institutions with totalassets of $250 million or more and institutions of anysize if owned by a holding company that has assets of$1 billion or more are subject to the new data report-ing requirements.
For purposes of reporting, small loans to busi-nesses and farms are grouped in two ways. First,loans are reported in three loan size categories basedon the original amount of the loan: $100,000 or less,$100,001 to $250,000, and more than $250,000.7
For businesses, the maximum loan size reported is$1 million; for farms, the maximum is $500,000.Second, these loans are categorized according to the
geographic location (census tract or block numberingarea) of the firms and farms receiving them. Unlikethe business and farm loans, no geographic informa-tion is provided for community development loans;only the aggregate amount of lending by each institu-tion is reported.
The data also include information on how many ofthe reported loans were extended to businesses andfarms with annual revenues of $1 million or less.Such firms fall within generally accepted definitionsof a small business, although somewhat larger firmsare also often categorized as being a small businessor small farm.8 Finally, each reporting institutionincludes a list of the areas that constitute its localCRA assessment community. For a small institution,the assessment area may be a single, relatively smallgeographic area; a large institution may have manyassessment areas, some small and some large, whichin some cases span the country.
The data on business and farm lending reportedunder the CRA regulations are more limited in scopethan data reported on home lending under HMDA. Inparticular, the CRA data include information only onloans originated or purchased, not on applicationsthat are turned down or withdrawn by the customer.Also, unlike HMDA data, the CRA data do notinclude the income, sex, or racial or ethnic back-ground of applicants. Finally, the CRA data are notreported and disclosed application by application asHMDA data are; rather the data are aggregated intothe three loan size categories and then reported at thecensus tract level.
From the information submitted by reporting insti-tutions, the Federal Financial Institutions Examina-tion Council (FFIEC) prepares a disclosure state-ment for each institution, in electronic form, as wellas an aggregate statement for each of the 332 metro-politan statistical areas (MSAs) and each of the non-metropolitan counties in the United States and PuertoRico. Before public release of the CRA data, theFFIEC and the supervisory agencies review it to helpensure its accuracy (see the box ‘‘Data Quality’’).The FFIEC made the CRA data on 1996 lendingactivity available to the public in October 1997.9 Formore information on the content of these disclosuresand how to obtain the new CRA data, see the box‘‘CRA Disclosures.’’
7. For lines of credit, the reported amount is the size of the line atthe time of origination.
8. According to the 1993 National Survey of Small BusinessFinances, sponsored by the Federal Reserve Board and the U.S. SmallBusiness Administration, about 84 percent of all small businesses(defined as having fewer than 500 full-time employees) have annualrevenues of less than $1 million.
9. See the FFIEC press release, September 30, 1997.
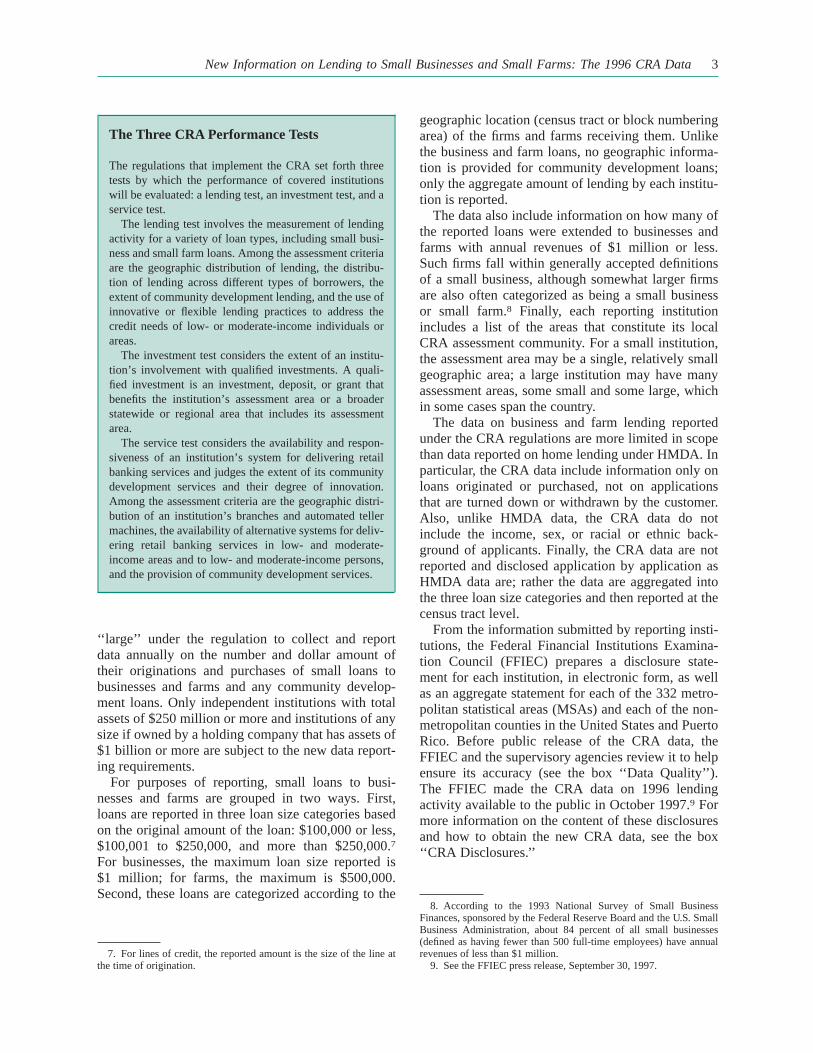
The Three CRA Performance Tests
The regulations that implement the CRA set forth threetests by which the performance of covered institutionswill be evaluated: a lending test, an investment test, and aservice test.
The lending test involves the measurement of lendingactivity for a variety of loan types, including small busi-ness and small farm loans. Among the assessment criteriaare the geographic distribution of lending, the distribu-tion of lending across different types of borrowers, theextent of community development lending, and the use ofinnovative or flexible lending practices to address thecredit needs of low- or moderate-income individuals orareas.
The investment test considers the extent of an institu-tion’s involvement with qualified investments. A quali-fied investment is an investment, deposit, or grant thatbenefits the institution’s assessment area or a broaderstatewide or regional area that includes its assessmentarea.
The service test considers the availability and respon-siveness of an institution’s system for delivering retailbanking services and judges the extent of its communitydevelopment services and their degree of innovation.Among the assessment criteria are the geographic distri-bution of an institution’s branches and automated tellermachines, the availability of alternative systems for deliv-ering retail banking services in low- and moderate-income areas and to low- and moderate-income persons,and the provision of community development services.
New Information on Lending to Small Businesses and Small Farms: The 1996 CRA Data3

CHALLENGES ANDLIMITATIONS
Whether the new CRA data are used to help gauge aninstitution’s record with respect to the CRA or forother purposes, the nature of the information andlimits on information that can be used in conjunctionwith the new data pose many challenges for analysts.Challenges arise because reporting rules and limitson information available to the reporting institutionscreate the potential for incorrect interpretations.Analysts also face challenges because the census dataused to characterize neighborhoods and to assess thedistribution of lending are collected only every tenyears. Finally, an appropriate interpretation of theCRA data requires an understanding of the differentdemand and supply conditions that prevail acrosslocal markets.
Reporting Rules and Geocoding
Under the CRA, lending institutions are asked toreport the geographic location of the business or farmreceiving the loan. According to the rules for such‘‘geocoding,’’ institutions may designate the locationof the loan as being either the location of the businessheadquarters or the primary area where the loanproceeds are applied. For firms with operations inmultiple locations, the potential for incorrect interpre-tations of data arises because some or all of the fundsmay be used to support activities in locations notreported by the lender. Thus, assessments of the datamay characterize a loan by the economic and demo-graphic characteristics of a reported location (thecensus tract of the headquarters) even though thefunds are used to support the activities of the businessor farm in a location with different characteristics.Unfortunately, it is not possible to identify the extentto which the geographic locations reported in the datareflect where loan funds are actually used.10
The potential for this type of census tract mis-categorization does not appear to be large, however.Information from the 1993 National Survey of SmallBusiness Finances indicates that most small busi-nesses have few offices. According to the survey,84 percent of small businesses have only one officeand 95 percent have two or fewer offices. In addition,the effects of such miscategorization are likely to besmall, as the data are not considered in isolation forCRA performance evaluations. Other information,such as documentation in loan files, may be availableto help examiners determine whether the census tractcategorization provided by the lender is appropriate.
Post Office Boxes and Rural Routes
Another issue, also related to the proper geographiccategorization of small business and small farm lend-ing, arises when the street address of a business orfarm is not used by a lender to identify the location ofthe firm or farm. This situation occurs when a streetaddress is not available to the lender because the firmor farm provided only a post office box number or arural route or box number.
10. The same issue arises in assessing HMDA data on homelending. For home refinancing and, in some cases, home improvementloans, the funds may be used to support activity in a location that isnot the same as that of the property. For home purchase lending,however, the HMDA data include the location of the property to bepurchased (with some minor exceptions), and consequently the appro-priateness of the census tract categorization is generally not an issue.
Data Quality
To maximize the usefulness of the CRA data, the infor-mation must be accurate and made available to the publicon a timely basis. To achieve these objectives, the report-ing institutions and their supervisory agencies have madea substantial commitment of resources.
The supervisory agencies seek to ensure that thecommercial banks and savings associations they super-vise provide complete and accurate information. Tofacilitate accurate reporting, the FFIEC makes availabletools and information to assist covered institutionsthrough the CRA site on its World Wide Web home page(http://www.ffiec.gov) and in various hard copy forms.The FFIEC Web site for the CRA, for example, includesthe regulation, instructions on how to file data reports, adescription of which institutions are covered by the datareporting requirements, the text of interagency interpre-tive letters pertaining to the regulation and interagencyquestions, and answers to the most frequently askedquestions about compliance. The CRA site also includesa geocoding system that allows anyone to identify thecensus tract that corresponds to a specific street address.
Beyond informational tools, the FFIEC makes avail-able an electronic data entry and reporting system thatincorporates a series of edit routines to detect and correcterrors in the data. In addition, the FFIEC reviews eachreporting institution’s CRA data before public releaseand subjects the data to further quality checks. Finally,the supervisory agencies conduct on-site examinationsand periodically review the covered institutions’ compli-ance with the geographic reporting requirements of theregulation. Such reviews consider, for example, the accu-racy of the geocoding done by reporters and the com-pleteness of their filings.
4 Federal Reserve Bulletin January 1998

For post office box addresses, loans were coded bythe lender according to the census tract of the postoffice rather than the census tract location of thebusiness.11 This procedure creates two potential prob-lems. First, the characteristics of the census tractwhere the post office is located may be different fromthose of the census tract where the firm is located.12
Second, the data may show inordinately high num-bers of loans in some census tracts with post officesbecause many businesses or farms outside the censustract containing the post office may use that office’sboxes to receive correspondence.
The extent of difficulties created by coding basedon post office boxes is unclear. However, because afirm is likely to select a convenient post office toreceive correspondence, it is reasonably likely that, in
most circumstances, the firm and the post office willbe in close proximity. In many cases, the census tractapplicable to the firm may be the same one applicableto the post office.
To better understand the possible influence of thereporting of post office box locations on the lendingdata, information was obtained on the census tractlocations of those post offices that offer post officeboxes.13 These post office box census tracts were thenmatched to the data on the census tract locations ofsmall business and small farm lending reported byCRA-covered institutions.
The matching revealed that of the roughly 60,000census tracts nationwide for which small businessloans were reported, 31 percent contained a postalservice office with post boxes (table 1). Of theroughly 17,000 census tracts for which small farmloans were reported, 58 percent contained an officewith post box services.11. In some cases, the census tract reported for a post office
location was determined from the ZIP code of the post office bymapping the post office location to the census tract at the center of theZIP code area.
12. For the future, the agencies have attempted to minimize the useof post office addresses when coding by clarifying the instructions toreporting institutions. The instructions emphasize that, except inunusual circumstances, the street address of the business or farm, not apost office, should be the basis for coding.
13. Information on the census tract numbers of postal servicelocations with post office boxes was obtained from CENTRAX Ser-vices, Dallas, Texas. Census tract numbers were determined from thestreet addresses of post offices offering post office boxes.
CRA Disclosures
The CRA data on small business, small farm, and commu-nity development lending are made available to the publicvia the financial institutions covered by the act, central datadepositories (usually a public library, regional planningagency, or other public entity), and the FFIEC. Under theregulation, each financial institution submits its lending datato the Federal Reserve Board, which processes the informa-tion on behalf of the FFIEC.
From the reported information, the FFIEC prepares adisclosure statement for each institution and an aggregatereport for each MSA and nonmetropolitan county in theUnited States and Puerto Rico. The aggregate reports dis-play lending activity by census tract. To better protect theconfidentiality of the business relationships underlying thedata, disclosure statements for individual lenders group anddisplay the lending information in a limited number ofincome categories. For lending activity in counties thathave 500,000 or fewer residents, the data are shown infour income categories—low, moderate, middle, and upper(see the box ‘‘Categorization of Neighborhoods by RelativeMedian Family Income’’). For larger counties, the data aredisplayed in income categories arrayed in intervals of10 percentage points up to a final group, 120 percent ormore of the median family income for the county.
Individual institutions make their disclosure statementsavailable at their home office. Organizations with offices in
more than one state must make the statements availableat one office in each of those states. Central depositoriesthroughout the nation have the aggregate disclosure state-ments for inspection by the public. In addition, the FFIECprovides disclosure statements and aggregate reports inpaper form and on CD-ROM. A single CD-ROM containsall of the 1996 CRA data together with an audio-visualtutorial to help users access, view, and print disclosurestatements of individual institutions and aggregate state-ments. The CD-ROM also includes a comprehensive on-line help system and a function that allows users to copy theCRA data for use in other applications software. The FFIECbelieves that public access to the CRA data will be greatlyenhanced by electronic disclosure and that the costs associ-ated with distribution of the data will be substantially low-ered by reducing the traditional reliance on paper copies.
The CRA data order form, which may be used to orderthe CD-ROM for $10, and the location of each centraldepository for an MSA are available on the FFIEC’s Inter-net site at http://www.ffiec.gov. The order form may alsobe obtained by calling the CRA Assistance Line at(202) 872-7584. A copy of the September 30, 1997, pressrelease announcing the availability of the new CRA data isavailable from the Federal Reserve Board’s PublicationsSection at (202) 452-3245 and on the FFIEC’s Web site.
New Information on Lending to Small Businesses and Small Farms: The 1996 CRA Data5

The matched data file indicated that census tractswith post office box locations received, on average,forty-seven small business loans, nearly ten morethan the average census tract without post officeboxes. At the same time, the typical census tract witha post office box location had virtually the samenumber of businesses on average as census tractswith no post office box locations—139 and 136respectively (data not shown in table). This resultsuggests that some fraction of businesses use postoffices outside their census tracts as their primarymailing address and that this may affect the loandistributions observed in the data.14
Differences in lending between census tracts withand without a post office box location are moresignificant for farm lending. Census tracts with postoffice boxes received, on average, eighteen smallfarm loans while those without a post office boxlocation had only six. Further, of the 100 censustracts with the largest numbers of small farm loans,all but 2 included a post office that offered post officebox services. On balance, the analysis suggests that,particularly for small farm lending, coding loan loca-tion by using the post office box location may influ-ence the interpretation of the data related to the geo-graphic distribution of loans.
Timeliness of Census Data
The 1997 CRA disclosure statements portray 1996small business and small farm lending by census tract
and census tract income grouping. Census tractboundaries and associated sociodemographic infor-mation are based on the 1990 decennial census,which is the most recent information available aboutthe characteristics of these geographic areas. Thepopulation characteristics of some census tracts mayhave changed substantially since the 1990 census andthe income categorization for any given census tractmay no longer be the most appropriate. The super-visory agencies recognize this limitation, and examin-ers consider additional information that may helpthem better assess current conditions in a lender’sCRA service area.
Contextual Framework
The most significant challenge facing those using thenew CRA data will be to place the information in theproper context. Variations in demand for creditamong small businesses and farms across localities aswell as differences in underwriting standards and inthe credit quality of local firms will greatly influencethe level and distribution of lending. Analysts mustconsider these issues in interpreting patterns in thedata.
Measurement of Demand
Nationwide there are more than 22 million busi-nesses, most of which are small businesses or smallfarms. They vary considerably with respect to manycharacteristics, including age, location, industry,product markets, and financial condition.15 Thisdiversity, along with differences in local economicconditions, means that the demand for small businessand small farm lending will vary greatly across neigh-borhoods and regions. Although the new CRA dataprovide information on extensions of credit, theydo not provide any indication of these local creditdemands. Therefore, conclusions drawn from analy-ses using only the loan data should be made withcaution, as differences in local loan volumes mayreflect differences in local demands, among otherthings. Indeed, CRA performance assessments by thesupervising agencies focus on evaluating the volumeand distribution of lending in the context of local
14. An alternative explanation for this pattern is that businesseslocated in census tracts with post office box locations have a greaterborrowing propensity than businesses located elsewhere. We lack datato assess this hypothesis.
15. See ‘‘Report to the Congress on the Availability of Credit toSmall Businesses,’’ Board of Governors of the Federal Reserve Sys-tem (October 1997).
1. Post office box locations and small loans to businessesand farms, 1996
Census tracts and lendingBusiness Farm
Number Percent Number Percent
Census tracts in all areas . . 62,186 100 62,186 100Census tracts with loans . 59,631 95.9 16,959 27.3
Census tracts withloans andP.O. boxes. . . . . . . 18,644 . . . 9,755 . . .
As a share ofall tractswith loans . . . . . . . . 31.3 . . . 57.5
Memo: Number of loansin census tracts
With P.O. boxes. . . . . . . . . . . 876,978 . . . 175,927 . . .As a share of each
loan type . . . . . . . . . . . . . 36.3 . . . 81.2
AverageWithout P.O. boxes. . . . . 37.5 . . . 5.6 . . .With P.O. boxes . . . . . . . . 47.0 . . . 18.0 . . .
Source. FFIEC and CENTRAX Services.
6 Federal Reserve Bulletin January 1998

credit needs and the capabilities and capacities of thelending institutions. For instance, examiners will con-sider the size and characteristics of the population ina lender’s community, the number and types of smallbusinesses and small farms, and many other factors.
Supply Effects
The volume of local lending will also reflect theinfluence of a number of supply-related factors,including the underwriting standards applied in agiven community, the credit quality of local busi-nesses and farms, and the expected rate of return onsuch lending. Variation in lending activity acrosscommunities may arise from local differencesin any of these factors. For example, in areas withweak economic conditions, as often happens duringregional recessions, local firms may have more uncer-tain prospects and hence pose more credit risks.Lenders may respond by limiting the amount andterms of credit they are willing to offer in suchcommunities.
Data Features
In many ways, the new CRA data are quite similar tothe type of data available under the original pro-visions of HMDA. Each institution’s lending activityis aggregated at the census tract level and pertainsonly to originations and purchases. Further, no infor-mation is available about the characteristics of indi-vidual borrowers. While these features limit the usesof the CRA data, much as they did the originalHMDA data, the new data still provide importantinsights into the nature and distribution of lending inlocal markets.
Also, the CRA data include information only aboutnew originations and purchases of loans during 1996.The data contain no information about the totalamount of small business and small farm creditoutstanding or about the duration or other terms oforiginated or purchased loans. Therefore, conclusionsdrawn about an institution’s lending presence in acommunity that rely exclusively on the CRA datamay be misleading. For example, two institutions thatextend comparable lending services to a communitymay have very different patterns of loan originationsover a year depending on loan terms and productsoffered.
The following sections describe in some detail the1996 CRA data. To help place this lending activity in
context, we provide information on population andthe number of businesses and farms in differentgeographic areas when possible.
OVERVIEW OF THE1996 CRA DATA
Because the 1996 CRA data have been available forreview for only a short time, relatively little is knownabout what the new data may reveal after thoroughanalysis. Also, because there are no data from pre-vious years with which to make comparisons, timetrend analysis using the 1996 data is not possible.
The focus of the present analysis is on nationwidetotals rather than on the activity of any individualinstitution. When appropriate, comparisons are madewith data on small business and small farm lendingfrom the Report of Condition and Income (CallReport) submitted by commercial banks and somesavings associations and the Thrift Financial Reportsubmitted by savings and loan associations. Inreviewing the nationwide totals, it should be notedthat the lending activity of individual institutions mayvary greatly, both in comparison with other institu-tions and with patterns for the nation as a whole,depending on their location, the types of businessesthey serve, the types of products they offer, the creditstandards they employ, and the nature of their localcompetition.
The Lending Institutions
For 1996, 2,078 institutions, consisting of 1,564 com-mercial banks and 514 savings associations, reporteddata under CRA requirements (table 2, memo item).16
Roughly 9 percent of the reporting institutions didnot extend any small business or small farm loans;44 percent did not report any community develop-ment lending (derived from table 10, memo item).Overall, 133 institutions (6 percent) extended nosmall business, small farm, or community develop-ment loans and reported only the census tracts orblock number areas that constituted each of theirCRA assessment areas. Most of the reporting institu-tions (75 percent) had assets of less than $1 billion(table 2, memo item). About one-third of the com-
16. The count of commercial banks and savings associations pre-sented here differs somewhat from the totals provided in the FFIEC’sSeptember 30, 1997, press release because, as a result of a differentgrouping procedure used for the press release, some savings associa-tions were placed in the commercial bank category.
New Information on Lending to Small Businesses and Small Farms: The 1996 CRA Data7

mercial banks but few of the savings associations(5 percent) had assets of less than $250 million.
A total of 2,414,805 small business loans, for$147 billion, and 216,629 small farm loans, totaling$10 billion, were reported for 1996. Unlike the casefor mortgage lending, a well-developed secondarymarket for small business loans does not exist, andthe new CRA data reflect this market reality.17 Mostof the small business and small farm loans reportedwere originations; only about 2 percent of smallbusiness loans and less than 1 percent of small farmloans were reported as purchases from anotherinstitution.
The vast majority of the reported small businessloans (about 97 percent measured by the number ofloans) were either originated or purchased by com-mercial banks or their affiliates. The large role ofcommercial banks relative to savings associations insmall business lending is consistent with informationfrom other data sources, including the 1987 and 1993National Survey of Small Business Finances, whichshow that commercial banks are the predominantsource of credit for small businesses.18 The CRA dataindicate that affiliates of commercial banks and sav-ings associations account for only a small proportion(1.1 percent) of the reported loans (table 3).
17. The one exception is for small business loans guaranteed bythe Small Business Administration. See ‘‘Report to the Congress onMarkets for Small Business- and Commercial Mortgage-RelatedSecurities,’’ Board of Governors of the Federal Reserve System andthe U.S. Securities and Exchange Commission (September 1996).
18. See Rebel A. Cole, John D. Wolken, and R. Louise Woodburn,‘‘Bank and Nonbank Competition for Small Business Credit: Evi-dence from the 1987 and 1993 National Surveys of Small BusinessFinances,’’ Federal Reserve Bulletin, vol. 82 (November 1996),pp. 983–95.
2. Originations and purchases of small loans to businesses and farms, grouped by type of borrower and loanand distributed by type and size of lending institution, 1996
Type of borrowerand loan
Commercial banks, by asset size(millions of dollars)
All commercial banks All institutions
Less than 100 100 to 249 250 to 999 1,000 or more
Total Percent Total Percent Total Percent Total Percent Total Percent Total Percent
Number of loans
BusinessOriginations. . . . . 89,569 3.8 476,028 20.2 354,972 15.1 1,379,301 58.5 2,299,870 97.5 2,358,256 100Purchases. . . . . . . 160 .3 197 0.3 4,025 7.1 48,022 84.9 52,404 92.7 56,549 100
Total . . . . . . . . . 89,729 3.7 476,225 19.7 358,997 14.9 1,427,323 59.1 2,352,274 97.4 2,414,805 100
FarmOriginations. . . . . 20,928 9.7 30,485 14.2 71,903 33.5 87,371 40.7 210,687 98.1 214,771 100Purchases. . . . . . . 197 10.6 240 12.9 585 31.5 531 28.6 1,553 83.6 1,858 100
Total . . . . . . . . . 21,125 9.8 30,725 14.2 72,488 33.5 87,902 40.6 212,240 98.0 216,629 100
AllOriginations. . . . . 110,497 4.3 506,513 19.7 426,875 16.6 1,466,672 57.0 2,510,557 97.6 2,573,027 100Purchases. . . . . . . 357 .6 437 .7 4,610 7.9 48,553 83.1 53,957 92.4 58,407 100
Total . . . . . . . . . . . 110,854 4.2 506,950 19.3 431,485 16.4 1,515,225 57.6 2,564,514 97.5 2,631,434 100
Amount of loans (thousands of dollars)
BusinessOriginations. . . . . 2,276,073 1.6 8,446,694 5.8 28,703,666 19.9 99,072,089 68.5 138,498,522 95.8 144,588,665 100Purchases. . . . . . . 25,316 1.1 46,420 1.9 398,622 16.7 1,549,036 64.8 2,019,394 84.4 2,391,819 100
Total . . . . . . . . . 2,301,389 1.6 8,493,114 5.8 29,102,288 19.8 100,621,125 68.5 140,517,916 95.6 146,980,484 100
FarmOriginations. . . . . 656,122 6.4 1,181,149 11.5 3,147,226 30.7 5,070,868 49.4 10,055,365 97.9 10,266,808 100Purchases. . . . . . . 7,839 4.8 11,833 7.3 46,533 28.5 56,372 34.5 122,597 75.1 163,191 100
Total . . . . . . . . . 663,961 6.4 1,192,982 11.4 3,193,779 30.6 5,127,240 49.2 10,177,962 97.6 10,429,999 100
AllOriginations. . . . . 2,932,195 1.9 9,627,843 6.2 31,850,892 20.6 104,142,957 67.3 148,553,887 95.9 154,855,473 100Purchases. . . . . . . 33,155 1.3 58,253 2.3 445,175 17.4 1,605,408 62.8 2,141,991 83.8 2,555,010 100
Total . . . . . . . . . . . 2,965,350 1.9 9,686,096 6.2 32,296,067 20.5 105,748,365 67.2 150,695,878 95.7 157,410,483 100
MemoNumber of
institutionsreporting . . . 208 293 690 373 1,564 2,078
Number ofinstitutionsextendingloans. . . . . . . 198 289 668 346 1,501 1,887
8 Federal Reserve Bulletin January 1998

Concentration of Lending Activity
Although a minority in number, larger commercialbanks and savings associations (those with assets of$1 billion or more) originated or purchased the major-ity (60.5 percent) of the reported small businessloans. No significant differences between commercialbanks and savings associations were observed in thisregard, as larger institutions did the majority of smallbusiness lending within each institutional category.For small farm loans the overall pattern is less strik-ing, as larger institutions accounted for 42 percent.
As suggested, wide variation exists across insti-tutions in the number and dollar amount of theirreported lending. A ranking of reporting institutions
by type of loan—first by number of loans and thenby dollar amount—further illustrates this variation(table 4).19 A ranking of reporters by number of loansshows that the top 1 percent of the lenders originatedor purchased 46 percent of the small business loans,13 percent of the small farm loans, and 26 percent ofthe community development loans. When the dollaramount of lending is considered using this rankingscheme, however, the distributions are less skewed.For example, while the top 1 percent of the reportersextended 46 percent of the number of small businessloans, these institutions extended only 18.6 percent of
19. For ranking purposes, small business loans, small farm loans,and community development lending were each ranked separately.
2.—Continued
Type of borrowerand loan
Savings associations, by asset size(millions of dollars) All savings
associations All institutions
Under 100 100 to 249 250 to 999 1,000 or more
Total Percent Total Percent Total Percent Total Percent Total Percent Total Percent
Number of loans
BusinessOriginations. . . . . 635 * 597 * 26,638 1.1 30,516 1.3 58,386 2.5 2,358,256 100Purchases. . . . . . . 4 * 0 * 1,391 2.5 2,750 4.9 4,145 7.3 56,549 100
Total . . . . . . . . . 639 * 597 * 28,029 1.2 33,266 1.4 62,531 2.6 2,414,805 100
FarmOriginations. . . . . 81 * 124 .1 1,789 .8 2,090 1.0 4,084 1.9 214,771 100Purchases. . . . . . . 0 .0 0 .0 80 4.3 225 12.1 305 16.4 1,858 100
Total . . . . . . . . . 81 * 124 .1 1,869 .9 2,315 1.1 4,389 2.0 216,629 100
AllOriginations. . . . . 716 * 721 * 28,427 1.1 32,606 1.3 62,470 2.4 2,573,027 100Purchases. . . . . . . 4 * 0 .0 1,417 2.5 2,975 5.1 4,450 7.6 58,407 100
Total . . . . . . . . . . . 720 * 721 * 29,898 1.1 35,581 1.4 66,920 2.5 2,631,434 100
Amount of loans (thousands of dollars)
BusinessOriginations. . . . . 63,787 * 61,718 * 2,796,333 1.9 3,168,305 2.2 6,090,143 4.2 144,588,665 100Purchases. . . . . . . 2,119 * 0 .0 157,720 6.6 212,586 8.9 372,425 15.6 2,391,819 100
Total . . . . . . . . . 65,906 * 61,718 * 2,954,053 2.0 3,380,891 2.3 6,462,568 4.4 146,980,484 100
FarmOriginations. . . . . 4,294 * 8,289 .1 84,850 .8 114,010 1.1 211,443 4.1 10,266,808 100Purchases. . . . . . . 0 .0 0 .0 7,066 4.3 33,528 20.5 40,594 16.2 163,191 100
Total . . . . . . . . . 4,294 * 8,289 .1 91,916 .9 147,538 1.4 252,037 2.4 10,429,999 100
AllOriginations. . . . . 68,081 * 70,007 * 2,881,183 1.9 3,282,315 2.1 6,301,586 2.4 154,855,473 100Purchases. . . . . . . 2,119 * 0 .0 164,786 6.4 246,114 9.6 413,019 13.4 2,555,010 100
Total . . . . . . . . . . . 70,200 * 70,007 * 3,045,969 1.9 3,528,429 2.2 6,714,605 4.3 157,410,483 100
MemoNumber of
institutionsreporting . . . 9 16 346 143 514 2,078
Number ofinstitutionsextendingloans. . . . . . . 7 12 260 107 386 1,887
Note. In this and subsequent tables, percentages may not sum to 100because of rounding. Institutions reporting are independent institutions withtotal assets of $250 million or more and institutions of any size if owned by aholding company that has assets of $1 billion or more. Savings associations
consist of savings banks and savings and loan associations. The maximum sizeof loan reported is $1 million for businesses and $500,000 for farms.
* Less than 0.05 percent.Source. FFIEC.
New Information on Lending to Small Businesses and Small Farms: The 1996 CRA Data9

the small business loan dollars. In other words, theaverage small business loan extended by these activelenders was relatively small.
The highly concentrated nature of the reportedlending that is apparent when institutions are rankedby number of loans also holds when institutions areranked by the dollar amount of their lending (table 4).By this ranking, the top 1 percent of lenders extended22 percent of small business loan dollars, 17 percent
of small farm loan dollars, and 32 percent of commu-nity development loan dollars.
Specialized Banks
The CRA data include lending information frominstitutions that differ considerably in their productofferings and market specializations. Although most
3. Small loans to firms by affiliated lenders, as a share of all small loans to businesses and farms by commercial banksand savings associations, 1996
Type of borrower
Lending by commercial bank affiliates Lending by savings association affiliates Lending by all affiliates
TotalShare of
commercialbank loans
Total Share of savingsassociation loans Total Share of all loans
Number of loans
Business. . . . . . . . . . . . . . . . . . . . 27,533 1.2 835 1.3 28,368 1.2Farm . . . . . . . . . . . . . . . . . . . . . . . 624 .3 14 .3 638 .3All . . . . . . . . . . . . . . . . . . . . . . . . . 28,157 1.1 849 1.3 29,006 1.1
Amount of loans (thousands of dollars)
Business. . . . . . . . . . . . . . . . . . . . 1,046,673 .7 128,753 2.0 1,175,426 .8Farm . . . . . . . . . . . . . . . . . . . . . . . 52,063 .5 105 * 52,168 .5All . . . . . . . . . . . . . . . . . . . . . . . . . 1,098,736 .7 128,858 1.9 1,227,594 .8
MemoNumber of institutions
extending loans. . . . . . . . . 118 9 127
Note. See note to table 2.* Less than 0.05 percent.
Source. FFIEC.
4. Small loans to businesses and farms and loans for community development, grouped by type of loanand distributed by institution ranked by amount of lending, 1996Percent
Institutions byamount of lending
(percent)
Business loans1 Farm loans1 Communitydevelopment loans1
By number By dollars By number By dollars By number By dollars
Institutions rankedby number of loansTop 1 . . . . . . . . . . . . . . . . . . . . . . . . . . . . . . . 46.1 18.6 13.3 13.6 26.0 7.82–5 . . . . . . . . . . . . . . . . . . . . . . . . . . . . . . . . . 18.6 28.2 26.1 26.2 27.3 36.76–9 . . . . . . . . . . . . . . . . . . . . . . . . . . . . . . . . . 9.6 14.5 17.8 17.1 11.9 14.510–19 . . . . . . . . . . . . . . . . . . . . . . . . . . . . . . 9.2 13.5 19.7 20.2 13.4 14.820–49 . . . . . . . . . . . . . . . . . . . . . . . . . . . . . . 11.8 17.8 20.03 19.1 15.8 20.350–74 . . . . . . . . . . . . . . . . . . . . . . . . . . . . . . 3.7 5.5 2.7 3.1 4.3 4.575–100 . . . . . . . . . . . . . . . . . . . . . . . . . . . . . .9 1.8 .4 .7 1.4 1.3
All . . . . . . . . . . . . . . . . . . . . . . . . . . . . . . . 100 100 100 100 100 100
Institutions rankedby dollar amount of loansTop 1 . . . . . . . . . . . . . . . . . . . . . . . . . . . . . . . 30.7 21.8 11.7 17.4 8.6 31.92–5 . . . . . . . . . . . . . . . . . . . . . . . . . . . . . . . . . 31.1 27.6 24.4 26.5 23.3 29.76–9 . . . . . . . . . . . . . . . . . . . . . . . . . . . . . . . . . 10.5 14.3 17.7 18.2 17.5 14.110–19 . . . . . . . . . . . . . . . . . . . . . . . . . . . . . . 8.9 13.7 20.1 18.0 18.6 12.720–49 . . . . . . . . . . . . . . . . . . . . . . . . . . . . . . 13.0 16.6 21.9 16.9 21.2 9.850–74 . . . . . . . . . . . . . . . . . . . . . . . . . . . . . . 4.5 4.8 3.5 2.6 7.5 1.575–100 . . . . . . . . . . . . . . . . . . . . . . . . . . . . . 1.3 1.2 .7 .4 3.4 .3
All. . . . . . . . . . . . . . . . . . . . . . . . . . . . . . . . 100 100 100 100 100 100
MemoNumber of loans. . . . . . . . . . . . . . . . . . . . 2,414,805 . . . 216,629 . . . 32,677 . . .Amount (in thousands). . . . . . . . . . . . . . . . . 146,980,484 . . . 10,429,999 . . . 17,708,161Number of lenders with data2 . . . . . . . . 1,886 . . . 1,150 . . . 1,156 . . .
Note. See note to table 2.1. For ranking purposes, small business loans, small farm loans, and com-
munity development lending were each ranked separately.
2. Includes only lenders reporting the relevant type of loan.Source. FFIEC.
10 Federal Reserve Bulletin January 1998
of the CRA reporters offer a wide range of products,some do not. Among these ‘‘specialized’’ banks, thegroup most involved in small business lending arethose institutions that specialize in credit card lending(referred to as credit card banks). In total, the CRAdata include information from thirty-nine credit cardbanks, of which twelve reported some amount ofsmall business lending in 1996. These twelve creditcard banks accounted for a substantial proportionof all the small business lending reported by CRA-covered institutions when measured by number ofloans, but a much smaller proportion when measuredin dollars. In 1996, credit card banks accounted for30 percent of the number of reported small businessloans but only 2.9 percent of the dollar amount ofsuch loans.20 Although credit card banks reportingCRA data were relatively active small business lend-ers, they did little small farm lending: In 1996, theyextended fewer than 100 small farm loans.
Size of Loans and Size of Borrowers
The new CRA data include information about thesize of small business and small farm loans. For1996, the average small business loan was about$61,000 and the average small farm loan was about$48,000 at institutions reporting under CRA, and87 percent of the small business loans and 88 percentof the small farm loans (measured by number ofloans) were for $100,000 or less (table 5). Measuredby dollar volume, the distribution differs: 29 percentof small business loan dollars and 44 percent of smallfarm loan dollars were for $100,000 or less.
The new CRA data also provide information onhow many of the reported loans were extended tobusinesses or farms with revenues of $1 millionor less. For 1996, 56 percent of the reported smallbusiness loans and 88 percent of the small farm loans(measured by number of loans) were extended tofirms and farms with revenues of $1 million or less(table 5).21 The data show that, on average, loans tosmall businesses with revenues of $1 million or lessare smaller than those to larger firms. For example,
the average loan to these small businesses was about$46,000, while the average loan amount for largerfirms was $79,000 (derived from table 5). Similarly,the average size of the loan to farms with revenues of$1 million or less was about $44,000, and that tolarger farms was about $77,000.
How Comprehensive Are the CRA Data?
As of December 31, 1996, there were 9,446 insuredcommercial banks and 1,980 savings associations.22
The new CRA data on small business and small farmlending include the lending activity of only the larg-est commercial banks and savings associations, whichrepresent just 18 percent of all commercial banks andsavings associations.
To assess the extent that the CRA covers smallbusiness and small farm lending activity, a compari-son was made between the small business and smallfarm lending activity of CRA-covered institutionsand that of all commercial banks and savings associa-tions as reported on the Call Report and the ThriftFinancial Report.23 Call Reports and Thrift Finan-cial Reports include the outstanding amount of smallloans to businesses and farms for all commercialbanks and savings associations. This analysis thuscompares the outstanding amounts for CRA reporterswith the outstanding amounts for all commercialbanks and savings associations as of June 1996.
The comparison shows that the CRA reportersaccounted for 64.6 percent of the number of smallbusiness loans and 65.9 percent of the dollar amountof such loans outstanding in June 1996. Similarly, theCRA reporters extended 21.6 percent of the numberof small farm loans and 27.5 percent of the dollaramount of such loans. Thus, despite the limited insti-tutional coverage of the CRA data reporting require-ments, CRA reporters accounted for a sizable fractionof the small business loans reported by all commer-cial banks and savings associations. However, theyaccounted for a much smaller fraction of small farmlending.
20. The CRA regulations direct institutions that issue credit cardsto the employees of a small business to report all of the credit cardlines opened on a particular day as a single business loan with the‘‘amount of the loan’’ equivalent to the sum of the available creditlines of those credit card accounts opened on that day.
21. Patterns among credit card banks are quite similar—51 percentof their small business loans were extended to firms with revenues of$1 million or less.
22. See ‘‘Financial Structure Information,’’ Financial Structure Sec-tion, Division of Research and Statistics, Board of Governors of theFederal Reserve System, March 25, 1997. Savings associationsincluded in the structure data are state-chartered savings banks, fed-eral savings banks, savings and loan associations, industrial banks,and cooperative banks.
23. We use the Call Report and Thrift Financial Report becausethey include comparable data regardingboth CRA reporters andinstitutions not required to report under the CRA.
New Information on Lending to Small Businesses and Small Farms: The 1996 CRA Data11

Analysis of Lending by Location and AreaIncome
The availability of information about the geographiclocation of businesses and farms receiving creditprovides an opportunity to examine regional creditflows and the distribution of small business and smallfarm lending across areas grouped by their socio-demographic and economic characteristics. Becausethe new CRA data do not include the lending of allcommercial banks and savings associations, the datado not fully represent all small business and smallfarm lending by these types of institutions. Nonethe-less, as noted, covered institutions represent a signifi-cant portion of such lending.
Distribution of Lending by Census Tract
Like the number of businesses and farms, the distri-bution of small business and small farm lendingvaries geographically. The 1996 CRA data reveal that
CRA-reporting institutions extended small businessloans in the vast majority (96 percent) of censustracts nationwide (derived from table 6, memo items).Reflecting the rural location of most farm lending,the proportion of all census tracts receiving farmloans is much smaller (27 percent) than the propor-tion of census tracts receiving small business loans.
Although at least some small business loans aremade in most geographic areas, small business lend-ing by CRA-reporting institutions tends to be ratherconcentrated geographically. When census tractsreceiving at least one loan are ranked by number ofsmall business loans in 1996 (table 6, top panel), thetop 5 percent received 26 percent of all small busi-ness loans. Ranking census tracts by the dollaramount of small business lending (bottom panel oftable 6) indicates that in 1996 the top 5 percentreceived 33 percent of the small business loan dol-lars. Small farm lending is even more concentratedthan small business lending; for example, the 5 per-cent of census tracts with the highest levels of farmlending (measured by number of loans) received41 percent of the small farm loans.
5. Originations and purchases of small loans to businesses and farms, by size of loan, 1996
Type of borrowerand loan
Size of loan (dollars)
All loans
MemoLoans to firmswith revenuesof $1 million
or less100,000 or less 100,001 to 250,000 More than 250,000
Total Percent Total Percent Total Percent Total Percent Total Percent
Number of loans
BusinessOriginations. . . . . . . . . . . . . 2,046,056 86.8 171,712 7.3 140,488 6.0 2,358,256 100 n.a. n.a.Purchases. . . . . . . . . . . . . . . 52,660 93.1 1,901 3.4 1,988 3.5 56,549 100 n.a. n.a.
Total . . . . . . . . . . . . . . . . . 2,098,716 86.9 173,613 7.2 142,476 5.9 2,414,805 100 1,349,824 55.9
FarmOriginations. . . . . . . . . . . . . 188,252 87.7 19,604 9.1 6,915 3.2 214,771 100 n.a. n.a.Purchases. . . . . . . . . . . . . . . 1,367 73.6 334 18.0 157 8.4 1,858 100 n.a. n.a.
Total . . . . . . . . . . . . . . . . . 189,619 87.5 19,938 9.2 7,072 3.3 216,629 100 191,027 88.2
AllOriginations. . . . . . . . . . . . . 2,234,308 86.8 191,316 7.4 147,403 5.7 2,573,027 100 n.a. n.a.Purchases. . . . . . . . . . . . . . . 54,027 92.5 2,235 3.8 2,145 3.7 58,407 100 n.a. n.a.
Total . . . . . . . . . . . . . . . . . . . 2,288,335 87.0 193,551 7.4 149,548 5.7 2,631,434 100 1,540,851 58.6
Amount of loans (thousands of dollars)
BusinessOriginations. . . . . . . . . . . . . 42,021,720 29.1 29,574,408 20.5 72,992,537 50.5 144,588,665 100 n.a. n.a.Purchases. . . . . . . . . . . . . . . 1,018,717 42.6 308,657 12.9 1,064,445 44.5 2,391,819 100 n.a. n.a.
Total . . . . . . . . . . . . . . . . . 43,040,437 29.3 29,883,065 20.3 74,056,982 50.4 146,980,484 100 62,583,338 42.6
FarmOriginations. . . . . . . . . . . . . 4,556,028 44.4 3,208,692 31.3 2,502,088 24.4 10,266,808 100 n.a. n.a.Purchases. . . . . . . . . . . . . . . 48,277 29.6 55,673 34.1 59,241 36.3 163,191 100 n.a. n.a.
Total . . . . . . . . . . . . . . . . . 4,604,305 44.1 3,264,365 31.3 2,561,329 24.6 10,429,999 100 8,469,677 81.2
AllOriginations. . . . . . . . . . . . . 46,577,748 30.0 32,783,100 21.2 75,494,625 48.8 154,855,473 100 n.a. n.a.Purchases. . . . . . . . . . . . . . . 1,066,994 41.8 364,330 14.3 1,123,686 44.0 2,555,010 100 n.a. n.a.
Total . . . . . . . . . . . . . . . . . . . 47,644,742 30.3 33,147,430 21.1 76,618,311 48.7 157,410,483 100 71,053,015 45.1
Note. See note to table 2. The maximum size of loan reported is $1 mil-lion for businesses and $500,000 for farms.
n.a. Not available.Source. FFIEC.
12 Federal Reserve Bulletin January 1998

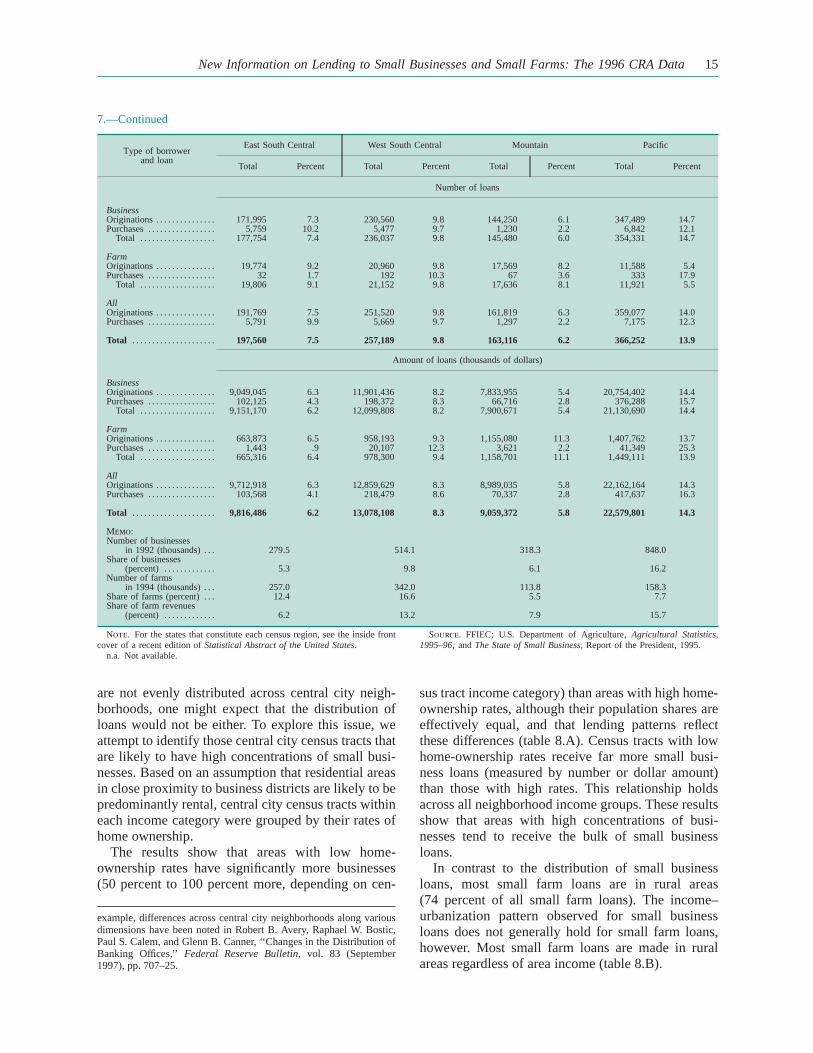
Credit Flows by Region of the Country
To examine regional credit flows, reported loans weregrouped by census region. Small business lendingvaries by region of the country roughly in proportionto the distribution of businesses. For example, NewEngland had 5 percent of the small business loans(table 7) and 5.9 percent of the businesses (table 7,memo item). The South Atlantic region had 20.4 per-cent of the small business loans and 17.8 percent ofthe businesses.
The regional variation in small farm lending ismore pronounced than in small business lending. TheNew England region had the smallest share (lessthan 1 percent) of all small farm lending by CRA-reporting institutions (measured either by number ordollar amount of loans) and the West North Centralregion had the largest share (more than 30 percent).As with small business loans, this regional variationfairly closely tracks differences in the share of farmsand the share of farm revenues by region. For exam-ple, although New England had the smallest share ofthe small farm lending, it also had the smallest shareof the nation’s farms (1.3 percent) and farm revenues(1.2 percent).
Credit Flows by Neighborhood Income
CRA performance assessments include an analysis ofthe distribution of small business and small farmloans across census tracts grouped into four neighbor-hood income categories: low, moderate, middle, andupper (see the box ‘‘Categorization of Neighbor-hoods by Relative Median Family Income’’). Con-cerns have been expressed that small business loansare not sufficiently available in lower-income neigh-borhoods, particularly those in central cities. The datasuggest that, at least from a national perspective, suchconcerns may be overstated, as the distribution of thenumber and the dollar amounts of small businessloans across the four income categories generallyfollows the distribution of population and businessesacross these groups (table 8.A). For example, low-income areas include about 4.9 percent of the popu-lation and 5.6 percent of all businesses; and theyreceived 4.7 percent of the number and 5.6 percent ofthe total dollar amount of new or purchased smallbusiness loans at CRA-reporting institutions.24 Somelarger differences are observed in areas with higherincomes. The total amount of lending to middle- andupper-income neighborhoods taken together onlyslightly exceeds their share of the population and ofbusinesses. These lending patterns stand in markedcontrast to the distribution of home purchase loans,
24. Data on population and lending activity include Puerto Rico.
6. Small loans to businesses and farms, groupedby type of loan and distributed by census tractranked by amount of lending, 1996Percent
Census tractsby amount of lending
Business loans Farm loans
By number By dollars By number By dollars
Census tracts rankedby number of loansTop 1 . . . . . . . . . . . . . . . . . . . 9.3 11.4 15.5 12.22–5 . . . . . . . . . . . . . . . . . . . . . 16.4 18.4 25.6 24.16–9 . . . . . . . . . . . . . . . . . . . . . 12.9 13.5 16.6 16.410–19 . . . . . . . . . . . . . . . . . . 17.6 17.8 18.0 19.220–49 . . . . . . . . . . . . . . . . . . 28.7 26.6 18.3 20.550–74 . . . . . . . . . . . . . . . . . . 11.2 9.4 4.1 5.475–100 . . . . . . . . . . . . . . . . . 3.9 2.9 2.0 2.4
Total . . . . . . . . . . . . . . . . . . . 100 100 100 100
Census tracts rankedby dollar amount of loansTop 1 . . . . . . . . . . . . . . . . . . . 8.3 13.1 12.1 15.82–5 . . . . . . . . . . . . . . . . . . . . . 14.8 20.2 23.2 25.96–9 . . . . . . . . . . . . . . . . . . . . . 12.1 14.4 16.7 16.910–19 . . . . . . . . . . . . . . . . . . 17.0 18.2 18.2 18.420–49 . . . . . . . . . . . . . . . . . . 29.6 25.4 20.6 18.950–74 . . . . . . . . . . . . . . . . . . 13.1 7.3 6.3 3.575–100 . . . . . . . . . . . . . . . . . 5.2 1.5 2.9 .6
Total . . . . . . . . . . . . . . . . . . . 100 100 100 100
MemoNumber of loans. . . . . . . . 2,414,805 . . . 216,629 . . .Amount of loans
(thousandsof dollars) . . . . . . . . . . . . . 146,980,484 . . . 10,429,999
Number of census tractswith loans . . . . . . . . . . 59,631 . . . 16,959 . . .
Total numberof census tracts. . . . . 62,186 . . . 62,186 . . .
Note. Includes only census tracts with the relevant type of loan.Source. FFIEC.
Categorization of Neighborhoodsby Relative Household Median Income
In counties with less than 500,000 residents, census tractsare grouped in broad categories. The categories aredefined by the median household income in the censustract as a percentage of the median household income inthe MSA or in the nonmetropolitan portion of the state (ifthe census tract is not located in an MSA). The categoriesare shown in the table below.
Income categoryof census tract
Percentage ofarea median
Share of census tractsin 1996 (percent)1
Low . . . . . . . . . . . . . . . . . Less than 50 6.5
Moderate. . . . . . . . . . . . . 50–80 19.2
Middle . . . . . . . . . . . . . . . 80–120 50.4
Upper . . . . . . . . . . . . . . . . More than 120 20.8
1. Shares do not sum to 100 percent because median income was notreported by the Bureau of the Census for 3.1 percent of the census tracts.
New Information on Lending to Small Businesses and Small Farms: The 1996 CRA Data13

of which low- and moderate-income neighborhoodsreceive a smaller relative proportion measured bynumber or by dollar amount.25
For small farm loans, about three-fourths of alllending, whether measured in number of loans orin dollars, was in middle-income census tracts(table 8.B). Only a small proportion (less than 1 per-cent) of reported farm lending was in low-incomeneighborhoods, which, as noted, have only a smallproportion of the U.S. population.
Credit Flows by Degree of Urbanization andNeighborhood Income
The distribution of small business lending by CRA-reporting institutions across census tracts grouped by
both income and degree of urbanization (central city,suburban, or rural location) generally parallels thedistribution of the U.S. population and businesses(table 8.A). Small business loans are heavily concen-trated in central city and suburban areas (about80 percent of all small business loans), as are the bulkof the U.S. population and most small businesses.26
In lower-income areas, most small business loans aremade in central city census tracts; in higher-incomeareas, suburban census tracts have the most smallbusiness loans.
The general observation that the number of loansparallels the distribution of the population may nothold for all central city areas.27 Because businesses
25. Canner and Passmore, ‘‘Home Purchase Lending in Low-Income Neighborhoods.’’
26. According to the 1993 National Survey of Small BusinessFinances, 79 percent of small businesses are located in central city andsuburban areas.
27. Previous research has identified significant differences in theeconomic experiences of different central city neighborhoods. For
7. Originations and purchases of small loans to businesses and farms, by region, 1996
Type of borrowerand loan
New England Middle Atlantic East North Central West North Central South Atlantic
Total Percent Total Percent Total Percent Total Percent Total Percent
Number of loans
BusinessOriginations. . . . . . . . . . . . . . . 117,469 5.0 322,205 13.7 366,551 15.5 180,875 7.7 476,862 20.2Purchases. . . . . . . . . . . . . . . . . 4,445 7.9 9,909 17.5 4,818 8.5 2,760 4.9 15,309 27.1
Total . . . . . . . . . . . . . . . . . . . 121,914 5.0 332,114 13.8 371,369 15.4 183,635 7.6 492,171 20.4
FarmOriginations. . . . . . . . . . . . . . . 620 .3 6,868 3.2 37,098 17.3 82,399 38.4 17,895 8.3Purchases. . . . . . . . . . . . . . . . . 1 .1 4 .2 35 1.9 1,157 62.3 37 2.0
Total . . . . . . . . . . . . . . . . . . . 621 .3 6,872 3.2 37,133 17.1 83,556 38.6 17,932 8.3
AllOriginations. . . . . . . . . . . . . . . 118,089 4.6 329,073 12.8 403,649 15.7 263,274 10.2 494,757 19.2Purchases. . . . . . . . . . . . . . . . . 4,446 7.6 9,913 17.0 4,853 8.3 3,917 6.7 15,346 26.3
Total . . . . . . . . . . . . . . . . . . . . . 122,535 4.7 338,986 12.9 408,502 15.5 267,191 10.2 510,103 19.4
Amount of loans (thousands of dollars)
BusinessOriginations. . . . . . . . . . . . . . . 7,507,367 5.2 22,338,690 15.4 26,628,373 18.4 12,233,773 8.5 26,341,624 18.2Purchases. . . . . . . . . . . . . . . . . 210,411 8.8 376,636 15.7 405,855 17.0 214,020 8.9 441,396 18.5
Total . . . . . . . . . . . . . . . . . . . 7,717,778 5.3 22,715,326 15.5 27,034,228 18.4 12,447,793 8.5 26,783,020 18.2
FarmOriginations. . . . . . . . . . . . . . . 38,250 .4 340,974 3.3 1,727,932 16.8 3,163,081 30.8 811,663 7.9Purchases. . . . . . . . . . . . . . . . . 270 .2 93 .1 3,224 2.0 89,052 54.6 4,032 2.5
Total . . . . . . . . . . . . . . . . . . . 38,520 .4 341,067 3.3 1,731,156 16.6 3,252,133 31.2 815,695 7.8
AllOriginations. . . . . . . . . . . . . . . 7,545,617 4.9 22,679,664 14.6 28,356,305 18.3 15,396,854 9.9 27,153,287 17.5Purchases. . . . . . . . . . . . . . . . . 210,681 8.2 376,729 14.7 409,079 16.0 303,072 11.9 445,428 17.4
Total . . . . . . . . . . . . . . . . . . . . . 7,756,298 4.9 23,056,393 14.6 28,765,384 18.3 15,699,926 10.0 27,598,715 17.5
MemoNumber of businesses
in 1992 (thousands) . . . 307.8 815.4 828.7 402.1 932.1Share of businesses
(percent) . . . . . . . . . . . . . 5.9 15.5 15.8 7.7 17.8Number of farms
in 1994 (thousands) . . . 26.7 95.9 346.0 477.0 248.0Share of farms (percent) . . . 1.3 4.6 16.8 23.1 12.0Share of farm revenues
(percent) . . . . . . . . . . . . . 1.2 4.1 14.7 24.3 12.8
14 Federal Reserve Bulletin January 1998
are not evenly distributed across central city neigh-borhoods, one might expect that the distribution ofloans would not be either. To explore this issue, weattempt to identify those central city census tracts thatare likely to have high concentrations of small busi-nesses. Based on an assumption that residential areasin close proximity to business districts are likely to bepredominantly rental, central city census tracts withineach income category were grouped by their rates ofhome ownership.
The results show that areas with low home-ownership rates have significantly more businesses(50 percent to 100 percent more, depending on cen-
sus tract income category) than areas with high home-ownership rates, although their population shares areeffectively equal, and that lending patterns reflectthese differences (table 8.A). Census tracts with lowhome-ownership rates receive far more small busi-ness loans (measured by number or dollar amount)than those with high rates. This relationship holdsacross all neighborhood income groups. These resultsshow that areas with high concentrations of busi-nesses tend to receive the bulk of small businessloans.
In contrast to the distribution of small businessloans, most small farm loans are in rural areas(74 percent of all small farm loans). The income–urbanization pattern observed for small businessloans does not generally hold for small farm loans,however. Most small farm loans are made in ruralareas regardless of area income (table 8.B).
example, differences across central city neighborhoods along variousdimensions have been noted in Robert B. Avery, Raphael W. Bostic,Paul S. Calem, and Glenn B. Canner, ‘‘Changes in the Distribution ofBanking Offices,’’ Federal Reserve Bulletin, vol. 83 (September1997), pp. 707–25.
7.—Continued
Type of borrowerand loan
East South Central West South Central Mountain Pacific
Total Percent Total Percent Total Percent Total Percent
Number of loans
BusinessOriginations. . . . . . . . . . . . . . . 171,995 7.3 230,560 9.8 144,250 6.1 347,489 14.7Purchases. . . . . . . . . . . . . . . . . 5,759 10.2 5,477 9.7 1,230 2.2 6,842 12.1
Total . . . . . . . . . . . . . . . . . . . 177,754 7.4 236,037 9.8 145,480 6.0 354,331 14.7
FarmOriginations. . . . . . . . . . . . . . . 19,774 9.2 20,960 9.8 17,569 8.2 11,588 5.4Purchases. . . . . . . . . . . . . . . . . 32 1.7 192 10.3 67 3.6 333 17.9
Total . . . . . . . . . . . . . . . . . . . 19,806 9.1 21,152 9.8 17,636 8.1 11,921 5.5
AllOriginations. . . . . . . . . . . . . . . 191,769 7.5 251,520 9.8 161,819 6.3 359,077 14.0Purchases. . . . . . . . . . . . . . . . . 5,791 9.9 5,669 9.7 1,297 2.2 7,175 12.3
Total . . . . . . . . . . . . . . . . . . . . . 197,560 7.5 257,189 9.8 163,116 6.2 366,252 13.9
Amount of loans (thousands of dollars)
BusinessOriginations. . . . . . . . . . . . . . . 9,049,045 6.3 11,901,436 8.2 7,833,955 5.4 20,754,402 14.4Purchases. . . . . . . . . . . . . . . . . 102,125 4.3 198,372 8.3 66,716 2.8 376,288 15.7
Total . . . . . . . . . . . . . . . . . . . 9,151,170 6.2 12,099,808 8.2 7,900,671 5.4 21,130,690 14.4
FarmOriginations. . . . . . . . . . . . . . . 663,873 6.5 958,193 9.3 1,155,080 11.3 1,407,762 13.7Purchases. . . . . . . . . . . . . . . . . 1,443 .9 20,107 12.3 3,621 2.2 41,349 25.3
Total . . . . . . . . . . . . . . . . . . . 665,316 6.4 978,300 9.4 1,158,701 11.1 1,449,111 13.9
AllOriginations. . . . . . . . . . . . . . . 9,712,918 6.3 12,859,629 8.3 8,989,035 5.8 22,162,164 14.3Purchases. . . . . . . . . . . . . . . . . 103,568 4.1 218,479 8.6 70,337 2.8 417,637 16.3
Total . . . . . . . . . . . . . . . . . . . . . 9,816,486 6.2 13,078,108 8.3 9,059,372 5.8 22,579,801 14.3
Memo:Number of businesses
in 1992 (thousands) . . . 279.5 514.1 318.3 848.0Share of businesses
(percent) . . . . . . . . . . . . . 5.3 9.8 6.1 16.2Number of farms
in 1994 (thousands) . . . 257.0 342.0 113.8 158.3Share of farms (percent) . . . 12.4 16.6 5.5 7.7Share of farm revenues
(percent) . . . . . . . . . . . . . 6.2 13.2 7.9 15.7
Note. For the states that constitute each census region, see the inside frontcover of a recent edition ofStatistical Abstract of the United States.
n.a. Not available.
Source. FFIEC; U.S. Department of Agriculture,Agricultural Statistics,1995–96;andThe State of Small Business,Report of the President, 1995.
New Information on Lending to Small Businesses and Small Farms: The 1996 CRA Data15

8. Small loans to businesses and farms, grouped by neighborhood characteristic and distributed by amount of lending, 1996A. Loans to businesses
Characteristic ofneighborhood1
MemoDistribution of U.S.
businesses andpopulation (percent)
Number of loans, by size category (dollars) MemoNumber of loans
to firmswith revenues of$1 million or less
Busi-nesses2 Population
100,000 or less 100,001 to 250,000 More than 250,000to 1 million All
Percent
MemoPercent of
smallbusiness
loans
Percent
MemoPercent of
smallbusiness
loans
Percent
MemoPercent of
smallbusiness
loans
Total Percent
MemoPercent of
smallbusiness
loans
Total
Percent ofsmall
businessloans
LocationCentral city, by rate of
home ownershipLow . . . . . . . . . . . . . . . . . . 25.5 18.4 85.5 23.4 7.6 25.1 6.9 27.6 572,951 100 23.8 290,096 50.6High . . . . . . . . . . . . . . . . . . 15.6 18.6 85.7 15.6 7.9 17.4 7.3 17.1 382,658 100 15.8 205,643 53.7
Suburban . . . . . . . . . . . . . . . . 41.0 42.7 87.0 41.1 7.0 40.2 6.0 41.6 991,943 100 41.1 527,682 53.2Rural . . . . . . . . . . . . . . . . . . . . 17.8 20.3 89.4 19.9 6.4 17.3 4.2 13.6 467,253 100 19.3 326,403 69.9
Total . . . . . . . . . . . . . . . . . . . . 100 100 86.9 100 7.2 100 5.9 100 2,414,805 100 100 1,349,824 55.9
Area Income(percent)3
Low (less than 50)Central city, by rate of
home ownershipLow . . . . . . . . . . . . . . . . . . 3.3 2.2 84.1 2.7 8.1 3.1 7.8 3.7 67,249 100 2.8 31,191 46.4High . . . . . . . . . . . . . . . . . . 1.8 2.2 83.3 1.4 9.0 1.8 7.8 1.9 35,315 100 1.5 16,073 45.5
Suburban . . . . . . . . . . . . . . . . .4 .4 87.2 .3 6.8 .3 5.9 .3 7,155 100 .3 3,382 47.3Rural . . . . . . . . . . . . . . . . . . . . .1 .2 90.0 .1 6.2 .1 3.8 .1 3,379 100 .1 2,311 68.4
Total . . . . . . . . . . . . . . . . . . 5.6 4.9 84.2 4.5 8.2 5.3 7.6 6.0 113,098 100 4.7 52,957 46.8
Moderate (50 to 79)Central city, by rate of
home ownershipLow . . . . . . . . . . . . . . . . . . 6.5 4.9 85.7 5.4 7.6 5.8 6.8 6.3 132,883 100 5.5 64,510 48.5High . . . . . . . . . . . . . . . . . . 4.2 4.9 85.4 3.5 8.0 3.9 6.6 3.9 84,996 100 3.5 42,265 49.7
Suburban . . . . . . . . . . . . . . . . 5.6 6.0 88.3 4.8 6.4 4.2 5.3 4.3 113,724 100 4.7 59,628 52.4Rural . . . . . . . . . . . . . . . . . . . . 2.5 2.8 90.2 2.3 5.8 1.8 4.0 1.5 53,346 100 2.2 36,835 69.0
Total . . . . . . . . . . . . . . . . . . 18.8 18.5 87.0 16.0 7.1 15.7 5.9 16.0 384,949 100 15.9 203,238 52.8
Middle (80 to 119)Central city, by rate of
home ownershipLow . . . . . . . . . . . . . . . . . . 8.9 7.2 86.2 8.0 7.4 8.3 6.4 8.8 194,717 100 8.1 101,970 52.4High . . . . . . . . . . . . . . . . . . 6.1 7.5 86.3 6.1 7.5 6.5 6.2 6.5 149,483 100 6.2 82,480 55.2
Suburban . . . . . . . . . . . . . . . . 22.2 24.4 87.3 22.3 6.9 21.4 5.8 21.6 535,520 100 22.2 290,376 54.2Rural . . . . . . . . . . . . . . . . . . . . 12.2 14.1 89.8 13.4 6.2 11.1 4.0 8.8 313,461 100 13.0 220,045 70.2
Total . . . . . . . . . . . . . . . . . . 49.4 53.2 87.7 49.8 6.9 47.3 5.5 45.7 1,193,181 100 49.4 694,871 58.2
Upper (120 or more)Central city, by rate of
home ownershipLow . . . . . . . . . . . . . . . . . . 6.4 4.0 85.5 6.9 7.6 7.4 6.9 8.1 168,220 100 7.0 88,954 52.9High . . . . . . . . . . . . . . . . . . 3.5 4.0 86.0 4.6 8.1 5.2 6.0 4.7 111,767 100 4.6 64,322 57.6
Suburban . . . . . . . . . . . . . . . . 12.8 12.0 86.0 13.7 7.4 14.3 6.5 15.4 334,552 100 13.9 173,831 52.0Rural . . . . . . . . . . . . . . . . . . . . 3.0 3.3 87.7 4.0 7.6 4.2 4.7 3.2 96,734 100 4.0 66,990 69.3
Total . . . . . . . . . . . . . . . . . . 25.7 23.3 86.1 29.2 7.6 31.1 6.3 31.4 711,273 100 29.5 394,097 55.4
Income not reportedCentral city, by rate of
home ownershipLow . . . . . . . . . . . . . . . . . . .4 .1 81.2 .4 8.4 .5 10.4 .7 9,882 100 .4 3,471 35.1High . . . . . . . . . . . . . . . . . . .0 .0 81.5 .0 8.7 .1 9.8 .1 1,097 100 .0 503 45.9
Suburban . . . . . . . . . . . . . . . . .0 .1 80.2 .0 9.9 .1 9.9 .1 992 100 .0 465 46.9Rural . . . . . . . . . . . . . . . . . . . . .0 .0 87.7 .0 7.8 .0 4.5 .0 333 100 .0 222 66.7
Total . . . . . . . . . . . . . . . . . . .4 .2 81.4 .5 8.5 .6 10.1 .9 12,304 100 .5 4,661 37.9
Total . . . . . . . . . . . . . . . . . . . . 100 100 86.9 100 7.2 100 5.9 100 2,414,805 100 100 1,349,824 55.9
MemoNumber of loans. . . . . . . . . . 2,098,716 173,613 142,476
Number of businesses(millions) . . . . . . . . . . . . 8.1
Population (millions). . . . . . 252.2
16 Federal Reserve Bulletin January 1998

8.—ContinuedA.—Continued
Characteristic ofneighborhood1
Amount of loans (thousands of dollars) MemoAmount of loans
to firmswith revenues of$1 million or less
100,000 or less 100,001 to 250,000 More than 250,000to 1 million All
Percent
MemoPercent of
smallbusiness
loans
Percent
MemoPercent of
smallbusiness
loans
Percent
MemoPercent of
smallbusiness
loans
Total Percent
MemoPercent of
smallbusiness
loans
Thousandsof dollars
Percentof smallbusiness
loans
LocationCentral city, by rate of
home ownershipLow . . . . . . . . . . . . . . . . . . 26.8 24.2 19.6 25.4 53.6 28.0 38,770,525 100 26.4 15,046,521 38.8High . . . . . . . . . . . . . . . . . 28.3 16.3 21.0 17.4 50.7 17.0 24,793,102 100 16.9 10,328,805 41.7
Suburban . . . . . . . . . . . . . . . 28.3 39.6 20.1 40.5 51.6 41.9 60,167,192 100 40.8 23,997,476 39.9Rural . . . . . . . . . . . . . . . . . . . 36.8 19.9 21.5 16.7 41.7 13.1 23,249,665 100 15.8 13,210,536 56.8
Total, by location . . . . . . . 29.3 100 20.3 100 50.4 100 146,980,484 100 100 62,583,338 42.6
Area Income(percent)3
Low (less than 50)Central city, by rate of
home ownershipLow . . . . . . . . . . . . . . . . . . 24.8 2.9 19.3 3.2 55.9 3.7 4,957,683 100 3.4 1,749,976 35.3High . . . . . . . . . . . . . . . . . 24.4 1.5 21.1 1.9 54.5 1.9 2,617,885 100 1.8 884,280 33.8
Suburban . . . . . . . . . . . . . . . 27.7 .3 20.3 .3 52.0 .3 429,503 100 .3 155,088 36.1Rural . . . . . . . . . . . . . . . . . . . 38.2 .1 21.6 .1 40.2 .1 158,946 100 .1 96,465 60.7
Total . . . . . . . . . . . . . . . . . 25.1 4.8 20.0 5.5 54.9 6.1 8,164,017 100 5.6 2,885,809 35.3
Moderate (50 to 79)Central city, by rate of
home ownershipLow . . . . . . . . . . . . . . . . . . 26.9 5.6 19.8 5.9 53.3 6.4 8,910,232 100 6.1 3,381,621 38.0High . . . . . . . . . . . . . . . . . 27.3 3.6 20.7 3.9 52.0 4.0 5,650,967 100 3.8 2,053,835 36.3
Suburban . . . . . . . . . . . . . . . 30.7 4.5 19.7 4.2 49.7 4.3 6,381,503 100 4.3 2,496,672 39.1Rural . . . . . . . . . . . . . . . . . . . 36.8 2.2 20.5 1.7 42.8 1.5 2,537,436 100 1.7 1,425,166 56.2
Total . . . . . . . . . . . . . . . . . 29.1 15.9 20.0 15.7 50.9 16.1 23,480,138 100 16.0 9,357,294 39.9
Middle (80 to 119)Central city, by rate of
home ownershipLow . . . . . . . . . . . . . . . . . . 27.7 8.1 19.9 8.3 52.4 8.9 12,526,947 100 8.5 5,088,239 40.6High . . . . . . . . . . . . . . . . . 28.8 6.3 20.5 6.4 50.8 6.4 9,385,430 100 6.4 4,026,121 42.9
Suburban . . . . . . . . . . . . . . . 29.1 21.3 20.3 21.4 50.7 21.7 31,631,288 100 21.5 12,734,763 40.3Rural . . . . . . . . . . . . . . . . . . . 37.6 13.3 21.1 10.8 41.3 8.5 15,215,257 100 10.4 8,578,759 56.4
Total . . . . . . . . . . . . . . . . . 30.7 49.0 20.4 47.0 48.9 45.4 68,758,922 100 46.8 30,427,882 44.3
Upper (120 or more)Central city, by rate of
home ownershipLow . . . . . . . . . . . . . . . . . . 27.2 7.3 19.5 7.5 53.3 8.3 11,484,547 100 7.8 4,614,103 40.2High . . . . . . . . . . . . . . . . . 30.2 4.9 21.9 5.2 47.9 4.6 7,045,946 100 4.8 3,336,311 47.4
Suburban . . . . . . . . . . . . . . . 26.7 13.4 20.0 14.5 53.3 15.6 21,633,230 100 14.7 8,588,377 39.7Rural . . . . . . . . . . . . . . . . . . . 34.5 4.3 22.9 4.1 42.6 3.1 5,318,300 100 3.6 3,099,475 58.3
Total . . . . . . . . . . . . . . . . . 28.3 29.9 20.5 31.2 51.2 31.5 45,482,023 100 30.9 19,638,266 43.2
Income not reportedCentral city, by rate of
home ownershipLow . . . . . . . . . . . . . . . . . . 19.7 .4 16.7 .5 63.6 .8 891,116 100 .6 212,582 23.9High . . . . . . . . . . . . . . . . . 21.4 .0 19.0 .1 59.5 .1 92,874 100 .1 28,258 30.4
Suburban . . . . . . . . . . . . . . . 18.2 .0 19.7 .1 62.1 .1 91,668 100 .0 22,576 24.6Rural . . . . . . . . . . . . . . . . . . . 40.1 .0 23.0 .0 36.9 .0 19,726 100 .0 10,671 54.1
Total . . . . . . . . . . . . . . . . . 18.0 .5 17.2 .6 62.7 .9 1,095,384 100 .7 274,087 25.0
Total . . . . . . . . . . . . . . . . . . . 29.3 100 20.3 100 50.4 100 146,980,484 100 100 62,583,338 42.6
MemoDollar amount of loans
(thousands). . . . . . . . . 43,040,437 29,883,065 74,056,982
New Information on Lending to Small Businesses and Small Farms: The 1996 CRA Data17
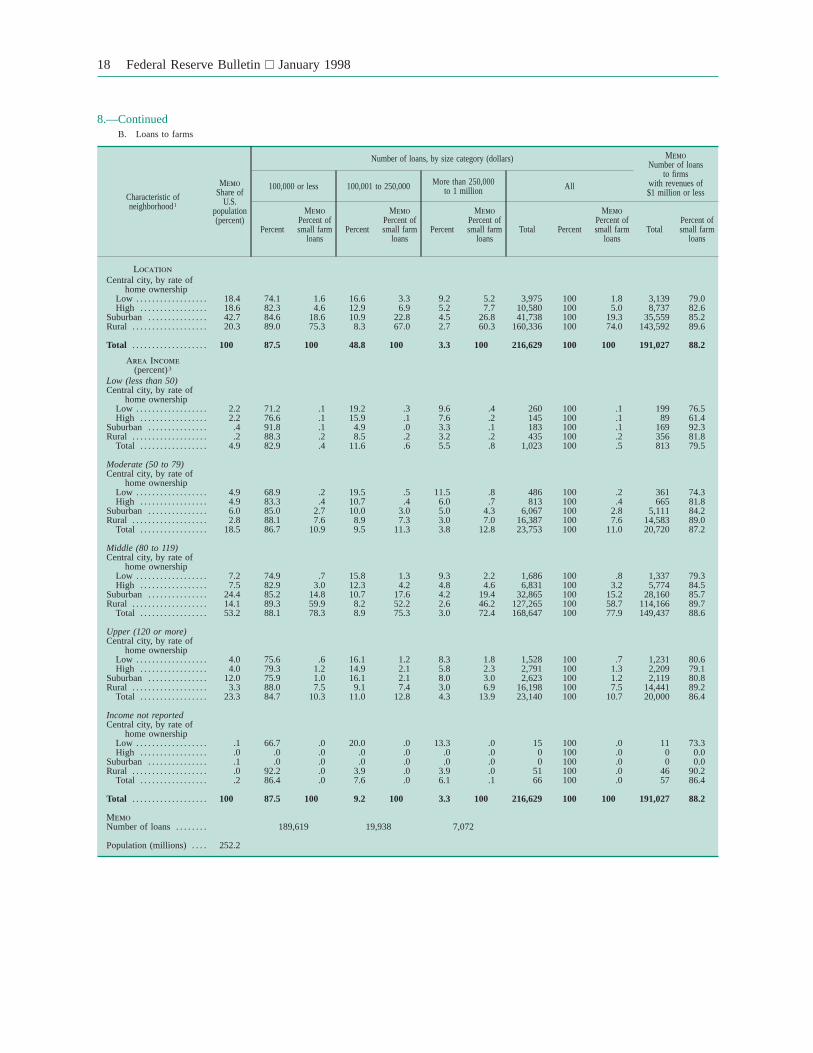
8.—ContinuedB. Loans to farms
Characteristic ofneighborhood1
MemoShare of
U.S.population(percent)
Number of loans, by size category (dollars) MemoNumber of loans
to firmswith revenues of$1 million or less
100,000 or less 100,001 to 250,000 More than 250,000to 1 million All
Percent
MemoPercent ofsmall farm
loansPercent
MemoPercent ofsmall farm
loansPercent
MemoPercent ofsmall farm
loansTotal Percent
MemoPercent ofsmall farm
loansTotal
Percent ofsmall farm
loans
LocationCentral city, by rate of
home ownershipLow . . . . . . . . . . . . . . . . . . 18.4 74.1 1.6 16.6 3.3 9.2 5.2 3,975 100 1.8 3,139 79.0High . . . . . . . . . . . . . . . . . 18.6 82.3 4.6 12.9 6.9 5.2 7.7 10,580 100 5.0 8,737 82.6
Suburban . . . . . . . . . . . . . . . 42.7 84.6 18.6 10.9 22.8 4.5 26.8 41,738 100 19.3 35,559 85.2Rural . . . . . . . . . . . . . . . . . . . 20.3 89.0 75.3 8.3 67.0 2.7 60.3 160,336 100 74.0 143,592 89.6
Total . . . . . . . . . . . . . . . . . . . 100 87.5 100 48.8 100 3.3 100 216,629 100 100 191,027 88.2
Area Income(percent)3
Low (less than 50)Central city, by rate of
home ownershipLow . . . . . . . . . . . . . . . . . . 2.2 71.2 .1 19.2 .3 9.6 .4 260 100 .1 199 76.5High . . . . . . . . . . . . . . . . . 2.2 76.6 .1 15.9 .1 7.6 .2 145 100 .1 89 61.4
Suburban . . . . . . . . . . . . . . . .4 91.8 .1 4.9 .0 3.3 .1 183 100 .1 169 92.3Rural . . . . . . . . . . . . . . . . . . . .2 88.3 .2 8.5 .2 3.2 .2 435 100 .2 356 81.8
Total . . . . . . . . . . . . . . . . . 4.9 82.9 .4 11.6 .6 5.5 .8 1,023 100 .5 813 79.5
Moderate (50 to 79)Central city, by rate of
home ownershipLow . . . . . . . . . . . . . . . . . . 4.9 68.9 .2 19.5 .5 11.5 .8 486 100 .2 361 74.3High . . . . . . . . . . . . . . . . . 4.9 83.3 .4 10.7 .4 6.0 .7 813 100 .4 665 81.8
Suburban . . . . . . . . . . . . . . . 6.0 85.0 2.7 10.0 3.0 5.0 4.3 6,067 100 2.8 5,111 84.2Rural . . . . . . . . . . . . . . . . . . . 2.8 88.1 7.6 8.9 7.3 3.0 7.0 16,387 100 7.6 14,583 89.0
Total . . . . . . . . . . . . . . . . . 18.5 86.7 10.9 9.5 11.3 3.8 12.8 23,753 100 11.0 20,720 87.2
Middle (80 to 119)Central city, by rate of
home ownershipLow . . . . . . . . . . . . . . . . . . 7.2 74.9 .7 15.8 1.3 9.3 2.2 1,686 100 .8 1,337 79.3High . . . . . . . . . . . . . . . . . 7.5 82.9 3.0 12.3 4.2 4.8 4.6 6,831 100 3.2 5,774 84.5
Suburban . . . . . . . . . . . . . . . 24.4 85.2 14.8 10.7 17.6 4.2 19.4 32,865 100 15.2 28,160 85.7Rural . . . . . . . . . . . . . . . . . . . 14.1 89.3 59.9 8.2 52.2 2.6 46.2 127,265 100 58.7 114,166 89.7
Total . . . . . . . . . . . . . . . . . 53.2 88.1 78.3 8.9 75.3 3.0 72.4 168,647 100 77.9 149,437 88.6
Upper (120 or more)Central city, by rate of
home ownershipLow . . . . . . . . . . . . . . . . . . 4.0 75.6 .6 16.1 1.2 8.3 1.8 1,528 100 .7 1,231 80.6High . . . . . . . . . . . . . . . . . 4.0 79.3 1.2 14.9 2.1 5.8 2.3 2,791 100 1.3 2,209 79.1
Suburban . . . . . . . . . . . . . . . 12.0 75.9 1.0 16.1 2.1 8.0 3.0 2,623 100 1.2 2,119 80.8Rural . . . . . . . . . . . . . . . . . . . 3.3 88.0 7.5 9.1 7.4 3.0 6.9 16,198 100 7.5 14,441 89.2
Total . . . . . . . . . . . . . . . . . 23.3 84.7 10.3 11.0 12.8 4.3 13.9 23,140 100 10.7 20,000 86.4
Income not reportedCentral city, by rate of
home ownershipLow . . . . . . . . . . . . . . . . . . .1 66.7 .0 20.0 .0 13.3 .0 15 100 .0 11 73.3High . . . . . . . . . . . . . . . . . .0 .0 .0 .0 .0 .0 .0 0 100 .0 0 0.0
Suburban . . . . . . . . . . . . . . . .1 .0 .0 .0 .0 .0 .0 0 100 .0 0 0.0Rural . . . . . . . . . . . . . . . . . . . .0 92.2 .0 3.9 .0 3.9 .0 51 100 .0 46 90.2
Total . . . . . . . . . . . . . . . . . .2 86.4 .0 7.6 .0 6.1 .1 66 100 .0 57 86.4
Total . . . . . . . . . . . . . . . . . . . 100 87.5 100 9.2 100 3.3 100 216,629 100 100 191,027 88.2
MemoNumber of loans. . . . . . . . 189,619 19,938 7,072
Population (millions) . . . . 252.2
18 Federal Reserve Bulletin January 1998

8.—ContinuedB—Continued
Characteristic ofneighborhood1
Amount of loans (thousands of dollars) MemoAmount of loans
to farmswith revenues of$1 million or less
100,000 or less 100,001 to 250,000 More than 250,000to 1 million All
Percent
MemoPercent ofsmall farm
loans
Percent
MemoPercent ofsmall farm
loans
Percent
MemoPercent ofsmall farm
loans
Thousandsof dollars Percent
MemoPercent ofsmall farm
loans
TotalPercent ofsmall farm
loans
LocationCentral city, by rate of
home ownershipLow . . . . . . . . . . . . . . . . . . 27.9 2.1 32.6 3.4 39.5 5.3 344,416 100 23.8 229,416 66.6High . . . . . . . . . . . . . . . . . 36.8 5.4 33.8 7.0 28.8 7.6 678,279 100 15.8 496,300 73.2
Suburban . . . . . . . . . . . . . . . 39.0 20.1 31.7 23.0 29.3 27.2 2,371,704 100 41.1 1,802,397 76.0Rural . . . . . . . . . . . . . . . . . . . 47.4 72.4 30.9 66.5 21.7 59.7 7,035,600 100 19.3 5,941,564 84.4
Total, by location . . . . . . . 44.1 100 31.3 100 24.6 100 10,429,999 100 100 8,469,677 81.2
Area Income(percent)3
Low (less than 50)Central city, by rate of
home ownershipLow . . . . . . . . . . . . . . . . . . 28.6 .2 35.2 .3 36.2 .4 24,749 100 2.8 16,596 46.4High . . . . . . . . . . . . . . . . . 31.3 .1 32.9 .1 35.8 .2 12,029 100 1.5 4,826 45.5
Suburban . . . . . . . . . . . . . . . 44.3 .1 24.3 .0 31.5 .1 6,343 100 .3 5,416 47.3Rural . . . . . . . . . . . . . . . . . . . 43.1 .2 32.7 .2 24.2 .2 20,277 100 .1 14,358 68.4
Total . . . . . . . . . . . . . . . . . 35.3 .5 32.9 .6 31.8 .8 63,398 100 .6 41,196 65.0
Moderate (50 to 79)Central city, by rate of
home ownershipLow . . . . . . . . . . . . . . . . . . 23.2 .2 33.4 .5 43.4 .8 48,663 100 5.5 27,677 48.5High . . . . . . . . . . . . . . . . . 37.6 .4 27.6 .4 34.8 .7 52,222 100 3.5 35,280 49.7
Suburban . . . . . . . . . . . . . . . 36.8 2.7 30.3 3.2 32.9 4.4 340,580 100 4.7 246,122 52.4Rural . . . . . . . . . . . . . . . . . . . 43.5 7.0 32.6 7.3 23.9 6.9 736,022 100 2.2 615,152 69.0
Total . . . . . . . . . . . . . . . . . 40.5 10.3 31.7 11.4 27.8 12.8 1,177,487 100 11.3 924,231 78.5
Middle (80 to 119)Central city, by rate of
home ownershipLow . . . . . . . . . . . . . . . . . . 28.0 .9 31.3 1.4 40.7 2.3 145,409 100 8.1 98,342 52.4High . . . . . . . . . . . . . . . . . 38.0 3.4 33.6 4.3 28.4 4.6 417,458 100 6.2 318,450 55.2
Suburban . . . . . . . . . . . . . . . 40.5 16.0 31.8 17.6 27.7 19.6 1,812,279 100 22.2 1,406,159 54.2Rural . . . . . . . . . . . . . . . . . . . 48.1 57.6 30.6 51.6 21.3 45.7 5,506,308 100 13.0 4,653,291 70.2
Total . . . . . . . . . . . . . . . . . 45.5 77.9 31.0 75.0 23.5 72.2 7,881,454 100 75.6 6,476,242 82.2
Upper (120 or more)Central city, by rate of
home ownershipLow . . . . . . . . . . . . . . . . . . 29.6 .8 33.3 1.3 37.1 1.8 123,977 100 7.0 85,497 52.9High . . . . . . . . . . . . . . . . . 34.3 1.5 35.9 2.2 29.8 2.3 196,570 100 4.6 137,744 57.6
Suburban . . . . . . . . . . . . . . . 29.1 1.3 33.3 2.2 37.6 3.1 212,502 100 13.9 144,700 52.0Rural . . . . . . . . . . . . . . . . . . . 45.9 7.7 31.1 7.3 23.0 6.9 770,962 100 4.0 656,889 69.3
Total . . . . . . . . . . . . . . . . . 39.9 11.3 32.4 12.9 27.8 14.1 1,304,011 100 12.5 1,024,830 78.6
Income not reportedCentral city, by rate of
home ownershipLow . . . . . . . . . . . . . . . . . . 19.5 .0 32.6 .0 47.9 .0 1,618 100 .4 1,304 35.1High . . . . . . . . . . . . . . . . . .0 .0 0.0 .0 .0 .0 0 100 .0 0 45.9
Suburban . . . . . . . . . . . . . . . .0 .0 0.0 .0 .0 .0 0 100 .0 0 46.9Rural . . . . . . . . . . . . . . . . . . . 41.4 .0 12.4 .0 46.3 .0 2,031 100 .0 1,874 66.7
Total . . . . . . . . . . . . . . . . . 31.7 .0 21.3 .0 47.0 .1 3,649 100 .0 3,178 87.1
Total . . . . . . . . . . . . . . . . . . . 44.1 100 31.3 100 24.6 100 10,429,999 100 100 8,469,677 81.2
MemoAmount of loans
in (thousandsof dollars) . . . . . . . . . . 4,604,305 3,264,365 2,561,329
1. Census tracts in central city locations are grouped by home-ownershiprate. A low rate of home ownership is defined as being less than or equal to themedian home-ownership rate for all central city census tracts; a high rate isdefined as being above the median.
2. Data on share of businesses derived from information provided by theOffice of the Comptroller of the Currency. The shares are calculated on aslightly smaller subset of the census tracts than those included in the CRA data.
3. For census tracts in central cities and suburbs, which together constitutemetropolitan statistical areas (MSAs), percentage is of MSA median. Forcensus tracts in rural areas, percentage is of nonmetropolitan areas of statemedian.
Source. FFIEC.
New Information on Lending to Small Businesses and Small Farms: The 1996 CRA Data19

Lending to Low- and Moderate-IncomeNeighborhoods by Institutions
On average, institutions covered by the CRA report-ing requirements extended about 5 percent of theirsmall business loans in low-income census tracts andabout 16 percent of their loans in moderate-incometracts (table 8.A). However, lending activity variesgreatly across lending institutions because of a num-ber of different factors, including the characteristicsof the local service areas and market conditions. Toprovide a sense of this diversity, we calculated theshare of each institution’s lending that occurred inlow- and moderate-income census tracts and rankedinstitutions by these shares. This procedure used allsmall business lending in 1996 for each institution asa reference point, which differs from analytical proce-dures used by CRA examiners that focus on activitywithin specific assessment areas. A large proportionof institutions (39.8 percent) report that their smallbusiness lending in low-income areas makes up avery small share (less than 1 percent) of their newlyoriginated or purchased loans. By contrast, only8.8 percent of these institutions report that their smallbusiness lending in moderate-income areas makes upsuch a small share of their small business lendingactivity (table 9).
Community Development Lending
Besides information about small business and smallfarm lending, institutions covered by the CRA datareporting requirements also disclose the number anddollar amount of their community development loans.Community development loans are defined in theregulation as loans whose primary purpose is commu-nity development and which have not been reportedelsewhere as a home purchase, small business,small farm, or consumer loan.28 Examples includeloans to local lending consortiums and local nonprofitorganizations.
For 1996, 32,677 community development loanstotaling $17.7 billion were reported (table 10). Theaverage community development loan, at $542,000,was far larger than the average small business loan of$61,000 reported in the CRA data.
Among CRA reporters, 58 percent of the commer-cial banks and 48 percent of the savings associationsextended community development loans in 1996(derived from table 10). Of the total number of
28. For more details see the Federal Reserve’s April 24, 1995,press release.
9. Institutions that lend to small businesses in low- or moderate-income neighborhoods, grouped by neighborhood incomeof the borrowers and distributed by the share of such loans in the institutions’s total lending to small businesses, 1996Percent
Share of small business lending(percent)1
By number of loans By amount of loans
Low income Moderateincome
Low andmoderate income Low income Moderate
incomeLow and
moderate income
Less than 1. . . . . . . . . . . . . . . . . . . . . . . . . 39.8 8.8 7.2 40.7 10.1 8.71 to 2 . . . . . . . . . . . . . . . . . . . . . . . . . . . . . . . 8.6 3.3 3.3 8.2 3.4 2.42 to 3 . . . . . . . . . . . . . . . . . . . . . . . . . . . . . . . 8.2 3.4 2.5 7.2 2.9 2.83 to 4 . . . . . . . . . . . . . . . . . . . . . . . . . . . . . . . 7.1 2.8 2.7 6.6 3.0 2.14 to 5 . . . . . . . . . . . . . . . . . . . . . . . . . . . . . . . 6.6 2.7 2.0 4.8 3.3 2.15 to 6 . . . . . . . . . . . . . . . . . . . . . . . . . . . . . . . 5.6 2.5 1.8 6.0 3.2 2.3
6 to 7 . . . . . . . . . . . . . . . . . . . . . . . . . . . . . . . 4.8 3.7 2.1 4.5 2.4 2.07 to 8 . . . . . . . . . . . . . . . . . . . . . . . . . . . . . . . 4.6 3.2 1.9 4.3 3.9 2.88 to 9 . . . . . . . . . . . . . . . . . . . . . . . . . . . . . . . 3.2 3.8 2.9 2.5 3.6 2.19 to 10 . . . . . . . . . . . . . . . . . . . . . . . . . . . . . 1.9 3.9 2.7 2.7 3.8 1.410 to 15 . . . . . . . . . . . . . . . . . . . . . . . . . . . . 5.8 21.5 14.0 8.0 19.4 14.5More than 15 . . . . . . . . . . . . . . . . . . . . . . . 3.8 40.5 56.8 4.5 40.9 56.7
Total . . . . . . . . . . . . . . . . . . . . . . . . . . . . . . . 100 100 100 100 100 100
Note. Excludes 151 lenders, about 8 percent of all lenders, that reportedfewer than 25 small business loans.
Low-income neighborhoods are defined as census tracts with a median fam-ily income of less than 50 percent of the median family income of the tract’smetropolitan statistical area (MSA) or, if the tract is not in an MSA, less than50 percent of the entire nonmetropolitan portion of the state. The medianincome of moderate-income neighborhoods is 50 percent to 79 percent of themedian income of the broader area.
1. Share is the percentage of a lender’s total small business originations andpurchases of loans to borrowers that are in the neighborhood income cate-gory. The share is based on all reported loans for which neighborhood incomedata were available.
Source. FFIEC.
20 Federal Reserve Bulletin January 1998
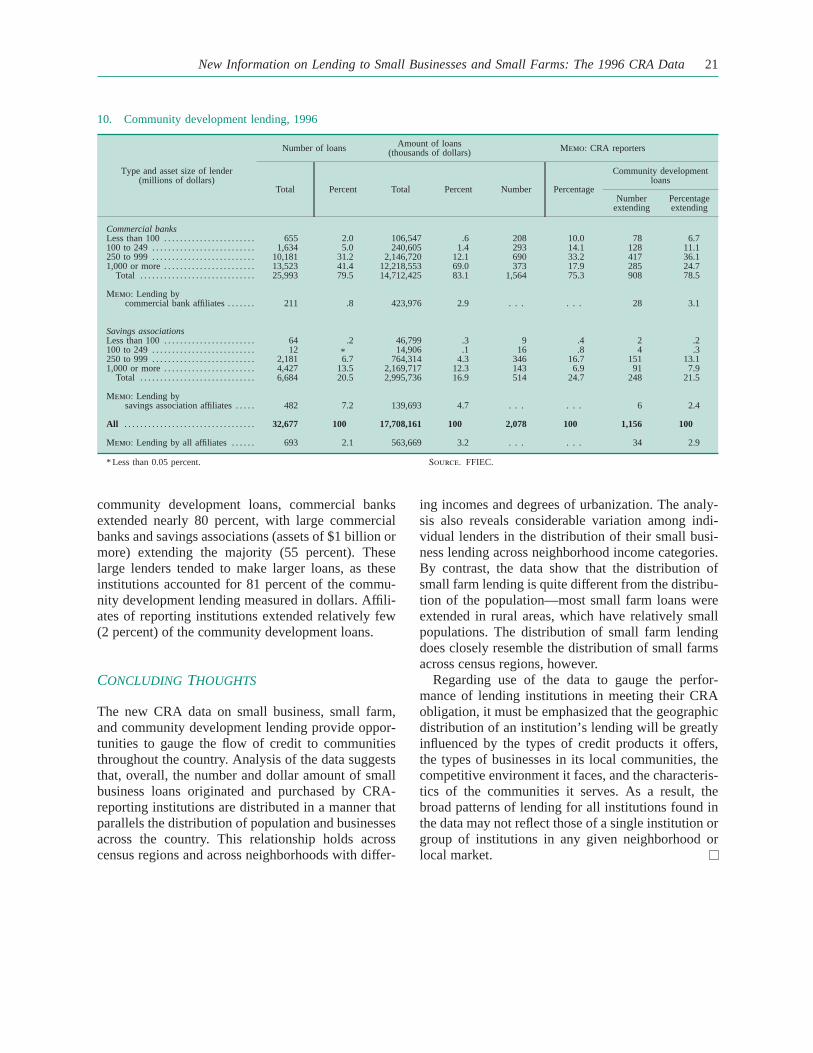
community development loans, commercial banksextended nearly 80 percent, with large commercialbanks and savings associations (assets of $1 billion ormore) extending the majority (55 percent). Theselarge lenders tended to make larger loans, as theseinstitutions accounted for 81 percent of the commu-nity development lending measured in dollars. Affili-ates of reporting institutions extended relatively few(2 percent) of the community development loans.
CONCLUDING THOUGHTS
The new CRA data on small business, small farm,and community development lending provide oppor-tunities to gauge the flow of credit to communitiesthroughout the country. Analysis of the data suggeststhat, overall, the number and dollar amount of smallbusiness loans originated and purchased by CRA-reporting institutions are distributed in a manner thatparallels the distribution of population and businessesacross the country. This relationship holds acrosscensus regions and across neighborhoods with differ-
ing incomes and degrees of urbanization. The analy-sis also reveals considerable variation among indi-vidual lenders in the distribution of their small busi-ness lending across neighborhood income categories.By contrast, the data show that the distribution ofsmall farm lending is quite different from the distribu-tion of the population—most small farm loans wereextended in rural areas, which have relatively smallpopulations. The distribution of small farm lendingdoes closely resemble the distribution of small farmsacross census regions, however.
Regarding use of the data to gauge the perfor-mance of lending institutions in meeting their CRAobligation, it must be emphasized that the geographicdistribution of an institution’s lending will be greatlyinfluenced by the types of credit products it offers,the types of businesses in its local communities, thecompetitive environment it faces, and the characteris-tics of the communities it serves. As a result, thebroad patterns of lending for all institutions found inthe data may not reflect those of a single institution orgroup of institutions in any given neighborhood orlocal market.
10. Community development lending, 1996
Type and asset size of lender(millions of dollars)
Number of loans Amount of loans(thousands of dollars) Memo: CRA reporters
Total Percent Total Percent Number Percentage
Community developmentloans
Numberextending
Percentageextending
Commercial banksLess than 100. . . . . . . . . . . . . . . . . . . . . . . 655 2.0 106,547 .6 208 10.0 78 6.7100 to 249 . . . . . . . . . . . . . . . . . . . . . . . . . . 1,634 5.0 240,605 1.4 293 14.1 128 11.1250 to 999 . . . . . . . . . . . . . . . . . . . . . . . . . . 10,181 31.2 2,146,720 12.1 690 33.2 417 36.11,000 or more. . . . . . . . . . . . . . . . . . . . . . . 13,523 41.4 12,218,553 69.0 373 17.9 285 24.7
Total . . . . . . . . . . . . . . . . . . . . . . . . . . . . . 25,993 79.5 14,712,425 83.1 1,564 75.3 908 78.5
Memo: Lending bycommercial bank affiliates. . . . . . . 211 .8 423,976 2.9 . . . . . . 28 3.1
Savings associationsLess than 100. . . . . . . . . . . . . . . . . . . . . . . 64 .2 46,799 .3 9 .4 2 .2100 to 249 . . . . . . . . . . . . . . . . . . . . . . . . . . 12 * 14,906 .1 16 .8 4 .3250 to 999 . . . . . . . . . . . . . . . . . . . . . . . . . . 2,181 6.7 764,314 4.3 346 16.7 151 13.11,000 or more. . . . . . . . . . . . . . . . . . . . . . . 4,427 13.5 2,169,717 12.3 143 6.9 91 7.9
Total . . . . . . . . . . . . . . . . . . . . . . . . . . . . . 6,684 20.5 2,995,736 16.9 514 24.7 248 21.5
Memo: Lending bysavings association affiliates. . . . . 482 7.2 139,693 4.7 . . . . . . 6 2.4
All . . . . . . . . . . . . . . . . . . . . . . . . . . . . . . . . . 32,677 100 17,708,161 100 2,078 100 1,156 100
Memo: Lending by all affiliates. . . . . . 693 2.1 563,669 3.2 . . . . . . 34 2.9
* Less than 0.05 percent. Source. FFIEC.
New Information on Lending to Small Businesses and Small Farms: The 1996 CRA Data21