marketing implications from the national...
TRANSCRIPT

MARKETING IMPLICATIONS FROM THE NATIONAL CONSUMER BEEF STUDY

MARKETING IMPLICATIONS FROM THE NATIONAL CONSUMER BEEF STUDy.
Robert E. Branson, H. Russell Cross, Jeff Savell, Gary C. Smith and Richard Edwards ••
JULy 1985
.Invited Paper. Western Agricultural Economics Association Annual Meeting. Saskatoon. Canada, July 7-9, 1985.
**Professor, Department of Agricultural Economics, Texas A&M University; Professor, Department of Animal Science, Texas A&M University; Associate Professor, Department of Animal Science. Texas A&M University; Professor. Department of Animal Science, Texas A&M University and Associate Professor. Department of Agricultural Economics, Texas A&M University; respectively

MARKETING IMPLICATIONS FROM THE NATIONAL CONSUMER BEEF STIIDY
This paper has four objectives. These are (1) to review the causes behind the
development of the National Consumer Beef Study. (2) to consider the agricultural
economist's role in such research. (3) to review research methodology and results. and
(4) to consider their possible implications for changes in the beef marketing structure.
The research. carried to its conclusion, will cost near one million dollars. It is not
unique in that regard. The dairy industry is presently making a comparable outlay to
analyze consumer markets. The Florida citrus industry has steadily invested in such
research. Coca Cola reportedly spent four million dollars researching a change in its
lead product - Coca Cola. Scanner panel market data from one small test market
costs approximately two hundred thousand dollars per year. 1 In these endeavors. product
evaluation and market organization and strategy are both targets.
Agricultural producer check-off programs are increasing. a precursor to funding
such national level research. Although such market information is costly. agricultural
economists increasingly need to be aware of. seek access to, and use such data. Leontief
recently castigated the economics profession in general for its preoccupation with model
building without regard to relevant data. Today relevant data very often means current
data.
ROLE OF AGRICULTURAL ECONOMISTS REGARDING CONSUMER MARKET RESEARCH AND ANALYSIS
The typical perceived roles of agricultural marketing economists are in the fields
of demand and price analysis. price determination. price discovery, and market structure
and performance. Reliance in such work has been primarily upon historical secondary
data inputs into econometric models. This has sufficed reasonably well for both
PAGE 2
agricultural and food policy analysis. Because of data and information limitations.
agricultural economists have had to take agricultural product demand largely as a
received phenomena, not one that is to be managed, or strategized, except between
domestic and export, or fresh versus processed markets, or time differentiated market
periods. Searching for market segments among consumers is not the target toward which
attention is often directed.. Therefore, the rational man, perfect information, normative
model generally suffices (Marshall. Hicks). The traditional time series or cross sectional
data analysis has an inherent trap. The problem is that by the time historical data
reveal market segments, the opportunity curve has usually long since passed.
Marketing research professionals, on the other hand, recognize other consumer
behavior models descriptive of market segment group behavior such as the Pavlovian.
Freudian, Veblenian, Hobbesian and several others. For example, the Yankelovich
national consumer study reveals groups that are either habit (Pavlovian) driven. price
(Marshallian) driven. or diet fears (Freudian) driven.
The research upon which this paper is based lies somewhat in between the two
foregoing parameters. It is concerned with consumer attitudes, tastes and preferences
which lie at the very fulcrum of the utility and demand for products (Branson and
Norvell). It concerns consumer utility bundles in the Lancasterian sense. Begun as a
search for delineation points in consumer preferences to guide demarcation points in
federal beef grade standards, it has also evolved additionally into a market segmentation
analysis carrying other possibly significant marketing implications.
WHY A NATIONAL CONSUMER BEEF STUDY
The U.S. beef industry has experienced six massive internal changes within the last
two decades. First, efforts to increase production efficiency led to the introduction of
Asian cattle breeds, especially Brahmas. Santa Gertrudis. Simmental and a number of

PAGE 3
other breeds have appeared that induced changes in beef carcass characteristics. Second
a move toward larger carcass-frame animals. Third, the introduction of large feedlots
caused geographic shifts in cattle feeding operations. Fourth , kill-and-ship packing
plants appeared. and fifth. a transition to boxed beef developed. Electrical stimulation
of beef carcasses, a sixth development. was adopted to enhance carcass muscle relaxation
and thereby meat tenderness. All activity, however, was not on the beef side.
The poultry industry has significantly reduced the feed conversion ratios for
chicken production. which permitted significant downward adjustments in chicken retail
prices relative to other meats. As a consequence, per capita chicken consumption gained
significantly compared with beef consumption, Table 1. Concern developed over whether
there has been a downward shift in the demand for beef (Haidacher, Wohlge~ant).
Meanwhile. human nutrition debates over cholesterol led the beef industry to be
concerned about consumers' interpretations and reactions in terms of purchase behavior
(Yankelovich). Also waste fat in carcasses, a major concern, is estimated to cost
processors and consumers over one billion dollars per year (West).
The latter factors. in particular, led animal scientists to seek means of producing
leaner. less costly beef (Schupp, et. al.) by forage feeding. reduced time on feed
concentrates. and feeding young bulls. Therefrom began new evaluations of beef eating
quality as related to animal maturity, breeds, marbling scores and quality grades (Adams,
Smith and Carpenter; Blumer).
The foregoing. to marketing professionals, has all of the characteristics associated
with new product development. In that domain. sensory evaluation of, as well as
consumer attitudes and behavior toward, a product is central to current market
information which is requisite to formulating new product development and marketing
strategies. Several recent beef research projects have been targeted toward such goals
PAGE 4
but unfortunately have been unable to provide clear marketing signals.
Examination of the research revealed that the designs may have been overly
influenced by production constraints rather than being guided by marketing criteria.
thereby causing the research experiments to be too small to be useful guides. Another
possible flaw is the usual inadequacy of· agricultural economists regarding consumer
market research.
OBJECfIVES OF THE NATIONAL CONSUMER BEEF sruDV
The research objectives for the Phase I study were:
1. At what leanness. or degrees of marbling differences, can consumers recognize
quality d~fferences. and thereby establish consumer preferences, regarding beef?
2. Which leanness level. if any. appears to be most preferred by consumers, and
is there. an orderly or a random preference order in terms of overall product
palatability?
3. Are geographic regional differences present within the U.S. market?
4. Given the findings of the foregoing objectives, what leanness levels should be
subjected to a final retail market test?
These objectives evoked a series of critical design and analysis questions regarding
sensory analyses research as noted by Erhardt
Previous recent research inad~uacies largely evolved from inadequate sensory
analysis designs, as well as undersized sample designs as encountered, for example, by
Schupp and Bidner. Consequently, it was concluded that consumers perceived. little or
no significant utility preference between U.S. Choice and U.S. Good beef. Key
attention in the present project was directed to avoidance of the foregOing design
errors. Prior research at the Texas Agricultural Experiment Station by meats scientists
and consumer researchers such as Smith and Degner was reviewed to evaluate likely

PAGE 5
data statistical variance that would be encountered. Research by others is equally
important, but access to raw data files was essential.
PRODUcr RATING SCALE DESIGN
Both a literature review. and a survey among directors of market research
departments of several major national food marketing firms. found a concensus favoring
a nine point, Likert-type. semantic differential scale for product evaluations. That scale
has proven to be a reliable predictor of consumer purchase behavior. Scale centering
was at five. Some analysts prefer a centering at three (if the top scale value is nine)
for technical reasons which are beyond the scope of this paper. Product satisfaction
ratings. which infer utility value differences. were sought on beef tenderness. tenderness
desirability. juiciness, juiciness desirability. flavor, and overall product desirability of the
beef marbling levels tested.
Product sensory (and preference) evaluations may be conducted at four different
levels: by expert laboratory panels. consumer laboratory panels, household panels. or by
purchasing consumers. Phase I of the National Consumer Beef Study was designed to
encompass the first three levels. Phase II is designed to encompass the fourth. or
retail market test level.
SAMPLE SIZE DESIGN
The final Phase I design comprised 10 expert laboratory taste panelists providing
2.700 product ratings; 200 consumer laboratory panelists making 4,000 observations; and
180 households per city that produced about 2.000 ratings per city, or a total of near
8,000. The expert panel was located at Texas A&M University. The consumer
laboratory panel excluded students and was a probability sample drawn from the Bryan
- College Station metropolitan area (population 110.000). The initial 180 household panel
PAGE 6
test was conducted in Houston in 1982. employing a probability cluster sample of 30
clusters and 6 households per cluster. All panel households were qualified as fresh beef
consumers at home, and their availability for the ten week test This household panel
was repeated in 1984 in San Francisco (Bay Area). Kansas City and Philadelphia.
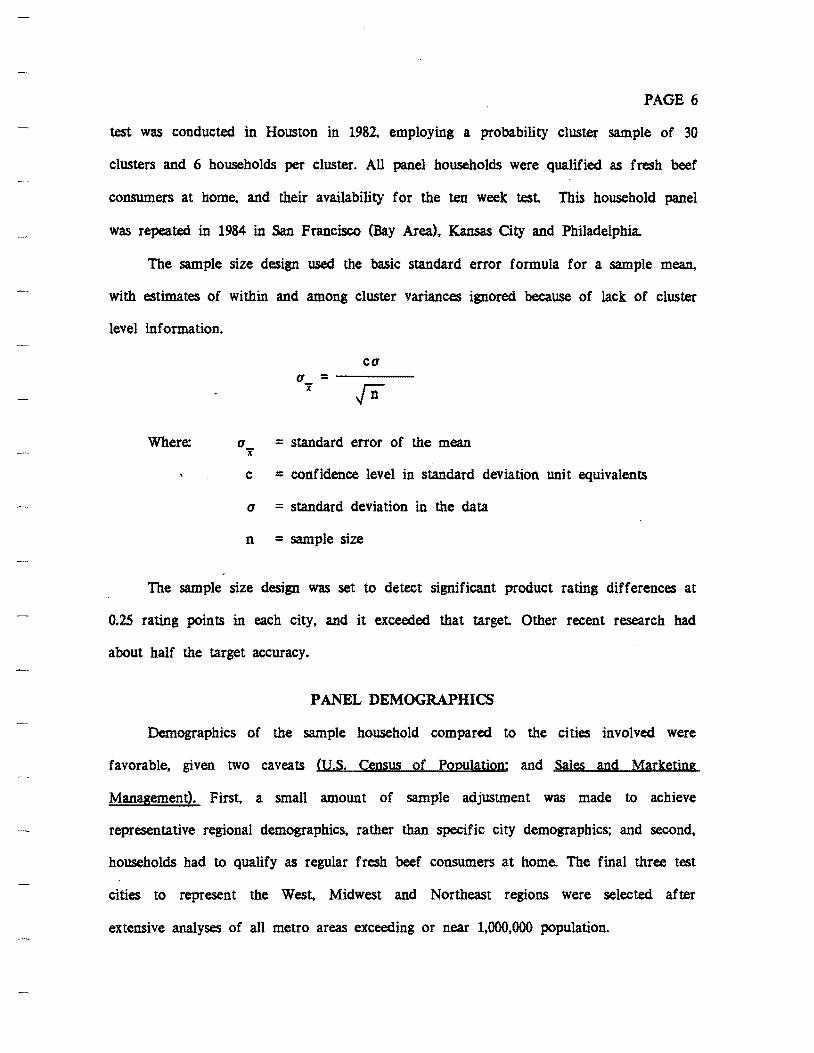
The sample size design used the basic standard error formula for a sample mean.
with estimates of within and among cluster variances ignored because of lack of cluster
level information.
ca a =---
x
Where: a_ = standard error of the mean x
c = confidence level in standard deviation unit equivalents
a = standard deviation in the data
n = sample size
The sample size design was set to detect significant product rating differences at
0.25 rating points in each city, and it exceeded that target Other recent research had
about half the target accuracy.
PANEL DEMOGRAPHICS
Demographics of the sample household compared to the cities involved were
favorable, given two caveats (U.S. Census of Population: and Sales and Marketing
Management). First, a small amount of sample adjustment was made to achieve
representative regional demographics. rather than specific city demographics; and second,
households had to qualify as regular fresh beef consumers at home. The final three test
cities to represent the West, Midwest and Northeast regions were selected after
extensive analyses of all metro areas exceeding or near 1.000,000 population.

PAGE 7
Education Sample -
Four Cities percent-
Grammar school High or tech school College Not reported
Total
3 43 52 2
100
8 54 38
100
The sample. as would be expected. was skewed upward in education and income because
of the elimination of non-beef eaters.
Viewed in another perspective. the average for the household panel versus the
estimated city deJ;llographics is noted below.
Mean age difference 2 yearsMean education difference 0.7 years Mean income difference S.2 thousands of dollars
PRODUcr SELECI'ION FOR THE TESf
The test be.ef represented almost the full range of marbling levels: Low Prime,
three levels of Choice, two levels of Good. plus Standard. In Houston, Short-Fed and
Bullocks were also added. Beef was selected, in cooperation with USDA graders. from
packing plants who are nationwide suppliers. in Colorado. Kansas. and Texas. Only «A«
maturity cattle were used. No animal breed control was involved except for exclusion
of dominant Brahma-characteristis carcasses. Top loin steaks were prepared for the test
and were uniformly trimmed. wrapped, coded. frozen and held at the Texas' A&M
Animal Science meats processing center until delivery to cold storage facilities at the
test sites.
Steaks were provided to the panel in a randomized order to cancel order bias.
One steak was delivered per week, and only after the preceding one was consumed. A
duplicate sample steak was used at the last week of the test to test the panel's rating
reliability.

PAGE 8
EXAMPLE OF RANDOMIZED STEAK ORDER
Household No. Week Number 1 2 34567 8 9 10
Steak Number
011 6 8 4 2 3 5 9 1 7 1
012 2 6 8 7 5 1 9 4 3 4
013 4 1 5 9 3 7 8 6 2 8
PRODUcr COOKING AND PREPARATION METHODS
For a product such as beef prepared at home, cooking method and the degree of
doneness are important.
All generally prevalent cooking methods were well represented in the combined
sample of 8.018 steak ratings.
Cooking Method Degree of Doneness
Outside grilling 19% Rare 19% Inside grilling 8% Medium rare 27% Oven broiling 46% Medium 32% Pan fry 26% Well done 22% Other 1% Very well done 10%
Total 100% Total 100%
Doneness levels pertain to the final three cities and are associated with 6.671
ratings. Standard error estimates at the 95% confidence level of accuracy obviously are
small, being ± 0.9%. Q.6%, and 0.2% for figures of 25%. 10%, and 5% respectively.
These are using the basic formula for calculating the standard error of percentages,
ignoring clustered sample effects (Ferber; Kinnear and Taylor).

PAGE 9
p - (l-p)
n
Where: a_ p
c
= 'standard error of the percentage
= confidence level in standard deviation units
p = percentage having the specified attribute
n = sample size
TESr OF PANEL RELIABILITY
Ability of the household panels to replicate their ratings was excellent, as judged
by covariance tests and Itt" tests for significant differences between means, Tables 2 and
3. The repeat steaks were from the same carcass, opposite rib position, of the original
steak received. thereby eliminating among carcasses variance.
Comparison of ratings from the laboratory expert panel. the consumer laboratory
panel, and the household panel are only possible with respect to the Houston test All
three panels received beef from the same supply to assure comparability. Product
ratings by the expert laboratory panel were better predictors of household panel ratings
(R2 = 0.79) than was the consumer laboratory panel (R2 = 0.52). In either case, a
high correlation would not be expected because cooking methods and doneness were
standardized in the laboratory tests, but purposely were not in the household panel.
Higher product satisfaction ratings were generally more consistently associated with
increases in beef marbling levels by the household panels than by the laboratory panels,
Table 4.

PAGE 10
NORMALIZATION OF RATINGS
Normalized scores were determined by expressing each panelist's steak ratings in
relation to their ratings average over all of the steaks in the test set
Normalized ratings are determined by the following equation for each product
rating.
R jkR =
jk i L (R )/n
1-n ik
i Z:R
1-n ik
R-Xik
= n
R = kth panelist's rating of product jjk
i L R = sum of kth panelist's rating of all products in the test
1-n ik
n = number of products tested
R- = mean of all product ratings by kth panelists Xik
In order to synchronize the individual steak normalized rating, the deviation of
the panelist's normalized rating of individual steaks was expressed as a deviation from
the mean of ratings for that panelist
i RD = z: R- - R
jk 1-n Xik jk
RD = the deviation of the rating for products j by panelist k jk
Finally, each individual panelist's normalized ratings are expressed in units of
deviation from the total panel's grand mean of ratings over all the product samples.

PAGE 11
i NR= I: R + RD
jk I-n i jk
NR = normalized rating for product j by panelist k jk
i I:R = grand mean of all product ratings by the total panel
I-n i
The objective of normalization is to eliminate variance among panelists' product
ratings arising solely from personal differences in the general level used within the
scale. Analysis emphasis thereby is directly on differences among steaks.
Though the combined 8,018 observations appear to be unnecessarily large, they are
roughly equivalent to one week's consumer purchases in four modem-size supermarkets,
a fraction of the weekly operating experience of most food chains.
PRODUcr RATINGS
There appeared to be evidence of ratings differences between Houston and San
Francisco as compared to Kansas City and Philadelphia. In the former, nonsignificant
differences were found between U.S. High Good and Low Choice grade steaks. This
could suggest regional differences and the possible emergence of new taste preferences.
However, covariance analysis indicated that the city data may properly be combined
because the city effect was not significant with household demographic and beef
preparation methods as variants, Tables 5 and 6, (Banks). The standard error estimate of
the ratings for the individual grade levels over the four cities was 0.04 rating points,
producing statistically significant differences among the sub-grade levels except Medium
Choice and Low Choice, Table 7. Tests of the standard error estimates accounting for
clustering effects by the following formula found inconsequential differences.

PAGE U
G(G - g) . ~ (T _ N X )2g(g - l)N 2 k w
Where: G = clusters in population
g = clusters in sample
N ::: IF people in population
~ ::: average II/cluster
Tk= sum of ratings/cluster
X =weighted mean w
INTERPRETATION OF PURCHASE INTENTIONS
Research design and analysis methods. to be useful. must be relevant to
interpreting actual market behavior. When panelists were asked to interpret their
ratings in terms of purchase. it was found that as ratings increased so did purchase
intentions. Table 8. Consultations with personnel of national food company marketing
research departments brought to a Houston conference to review the research confirmed
that product ratings of seven or above generally signify successful products when using
nine-point hedonic scales. Since the analyses suggest reliability of the research results.
the next question concerns interpretation of the findings.
SEARCH FOR MARKET SEGMENTATION
Generally, higher ratings of USDA Choice beef were clearly indicated. However.
because of the multiple attributes of beef. occasionally USDA Good steaks may equal
Choice in palatability. This study clearly implies. however. that the probabilities for
such an occurance are quite low. Ratings of USDA Good grade beef were generally
lower. with better acceptance indicated in the West (San Francisco) and Southwest

PAGE 13
(Houston). This concurs with long prevailing general industry market perceptions.
Therefore, an evaluation of the consumer market for leaner beef (less than Choice
grade) required further analysis. A decision was made to test a market segmentation
hypothesis. It was determined upon further analysis that about twenty-five percent of
the panelists rated the overall eating quality of U.S. Good grade beef as seven or
better. Despite this rating, this segment of the panelists gave still higher ratings, on the
average, to U.S. Choice and above grades. Only one panelist among over 800 in the
three city panel rated both Choice and Prime steaks lower than a U.S. Good steak.
That incidence suggests no more than a chance data abnormality. Nonetheless. suggested
is a possibly viable market segment that would be willing to make some product
palatability sacrifice in a trade-off to gain product leanness. The relevant marketing
question turns on the possibility of an improved product attribute bundle in the
Lancasterian Product preference sense (Lancaster). Would or does such a product fill
consumer demand space that is empty, or only partially filled, as suggested by Padberg
and Westgren?
Market segmentation. though not new. is becoming increasingly used in consumer
and industrial markets as noted by Doyle and Sanders. Despite that, it seldom has been
fully applied to the retail fresh beef market, except for ground beef. Marketing of calf
beef is not considered here as a multigrade marketing strategy. Almost without
exception. retail food supermarkets offer U.S. Choice or U.S. Good or so-called "No
Roll." The latter is ungraded beef which usually is below U. S. Choice grade, or if
Choice it may be from Yield Grade 4's and 5's, which means a high amount of carcass
waste fat. The obvious marketing problem with "No-Roll" beef is that it increases
product variability at a time when the dominant trend in the consumer market is
toward product reliability. Consumers do not generally respond well to a U.S. Good

PAGE 14
grade label. USDA grades were really intended for wholesale, not retail, application
according to A.M.S., U.S.D.A. Previous research suggests that consumers may not have
the affinity expected of them for USDA beef grades (Branson).
Whether or not a nationwide industry strategy of simultaneously retail marketing
two grades of beef in most supermarkets is a viable one must be proven by subjecting
the concept to a retail market test Phase II of the National Consumer Beef Study is
designed toward that purpose. A pilot test. already conducted, suggests that the concept
may have potential (Branson, Cross, Savell and Edwards). The perceived strategy is to
market simultaneously U.S. Choice beef and a private brand label of specification
controlled leaner beef that would be from U.S. Good grade Yield Grade 2 carcasses.
If further research supports such a strategy, a further question concerns the implications
it may hold for the future beef marketing structure.
MARKET STRUCfURE AND PERFORMANCE IMPLICATIONS
One can only hypothesize as. to what market structure and performance
implications could evolve from the National Consumer Beef Study findings. Several
scenarios may be postulated.
Scenario I is that the total marketing system would rapidly move to a dual-grade
retail marketing strategy assuming Phase II of the research supports the market
segmentation strategy. In that event. it is likely that no structural effects would
emerge. If that does not materialize, scenario II is the opportunity for one or more
major packers to aggressively pursue a marketing strategy of launching their own
national brand of lean beef. It might emulate, in part. the Holly Farms strategy for
poultry. It has been decades since packer brands were dominant in supporting beef
marketing.
Internal economies of new, independent. kill-and-ship packing plants led in part

PAGE 15
to the present national brand demise. If that is replaced by strong packer brand
marketing. interest would again arise regarding the total industry effects on market
entry. pricing. and availability of markets to producers and feedlots outside the system.
especially if a degree of vertical integration followed. Possible marketing efficiency
losses. if any. would have to be weighed against whether consumer beef demand gains
were evoked from filling the conceptual empty consumer demand space. Active brand
advertising could expedite the process. This second scenario could also expedite the
recent move toward boneless. fully-trimmed beef via a branded. tray-ready product
from packing plants. Product innovation potentials from new technology might be
expedited by such a reformation of the industry. In that event. competition may be
enhanced in the fuller sense of the word as interpreted within the IBM case rulings.
Economists have not been very effective in evaluating such competition. Renewed
efforts are sorely needed in this area.
Scenario III would be vigorous pursuit of the concept by national and regional
food chains. By means of specification buying. the impact could be dispersed over the
present array of packing firms and all share in its relative costs and benefits. It could.
however. provide an enhanced impetus for food chain backward integration into packing
plants and feedlots. The historical record of cyclical profitability of packing plants and
feedlots would seem to mitigate against such integration. However. a recent survey by
the Market Research Center at Texas A&M suggests that boneless. fully trimmed beef
is being used by a few food chains as a means of escaping intensive price competition
at the retail leveL That may enhance the incentive to adopt an integration program via
contract suppliers, if not by ownership.
Regional locational effects would probably not be appreciably affected since the
economies of location would remain active. However. Clary and Farris found in the

PAGE 16
case of boxed beef that the competitive position of the larger firms was improved at
the expense of local market purveyors.
The more likely prospect from general adoption of the dual-grade marketing
program would be to add impetus to the establishment of premiums and discounts
regarding carcass and yield grades. Premiums would be supported for Yield grade 1, 2
and 3 cattle while discounts may become more apparent for carcasses below U.S. Good,
Yield Grade 2 and 3 classifications. Changes are already in prospect and market price
effects are being seen as some food chain divisions presently are increasing their
demand for Yield grade 2, U.S. Good grade beef supplies.
Two possibilities could emerge at the cattle raiser level. A clear-cut, two-grades
strategy at retail could expand demand for lean beef as herein defined Good grade
prices, therefore, might rise until the productions system adjusts to the market demand
shift. Thereby production of a high quality lean beef would be stimulated if the
marketing system properly transmits signals.
A second phenomenon is a prospect. In theory. total product class demand in a
properly segmented market (assuming the segments exist) should exceed that in a non
segmented market because the postulated empty consumer demand spaces would be
filled. Therefore. total beef demand would expand. The pilot store test suggests that
this may be the case. These possibilities suggest why the future research under Phase II
of the National Consumer Beef Study can be an exceptionally challenging one.
CONCLUSIONS
The purpose of the National Consumer Beef Study- Phase I was to determine
consumer beef preferences among leanness levels in beef, since they can affect
consumer utility maps and product market demand Knowledge of these is necessary to
guide U.S. future beef production, grading and marketing practices. Reevaluation was

PAGE 17
necessary to properly assess effects of recent changes in beef production and processing,
and in national consumer dietary concerns with fat and cholesterol. Lead time from
market research is important because time is required to appreciably modify the product
characteristics of the beef supply output Results of the research suggest the possibility
of a segmented demand for beef: separate consumer demand spaces for U.S. Choice
grade beef. and for a branded "lean" beef. Final proof depends upon completion of
Phase II - Retail Market Test - of the research. Identification of consumer market
segmentation requires that economists obtain current market data based on meaningful.
relevant consumer behavior models. Traditional analyses of secondary market data have
limited potential for success.
Market structure implications of simultaneous marketing of two kinds of beef in
major supermarket food stores would vary with the course of the marketing strategy
adoption process. If broad early adoption occurs, little. if any, structure impact is
likely. If adoption is aggressively taken by selected packers or food chains, a further
motivation for market in'tegration might occur. Marketing and pricing efficiency is
likely to increase in relation to consumer preferences. Desirable quality lean beef
with high carcass yields may be more equally priced with U.S. Choice beef. That could
encourage beef production that is better aligned to total market needs. Theoretically,
total beef demand vis a vis other meats and foods would be positively affected and
would serve the long range interest of the beef indUstry.
Questions are posed as to the sufficiency of agricultural economists' knowledge of
consumer behavior. Agricultural marketing economists in this kind of marketing
problem need a full understanding of consumer demand formation. as well as
econometric methods and principles.

TabJe 1. U.s. Per Capita Civilian Consumption of Mea~ 1955-1983.
Year Beef Pork Chicken
- - - pounds - -
1955 82 67 21
1960 85 65 28
1965 100 59 33
1970 114 73 40
1975 119 55 40
1976 129 60 43
1977 126 62 45
1978 120 61 48
1979 108 70 52
1980 103 74 50
1981 104 70 52
19821.1 104 63 53
198¥i 107 66 54
1.1 Preliminary
Source: Agricultural Statisticnselected years, and Statistical Abstract of the United States, 1985, .S.D.A.
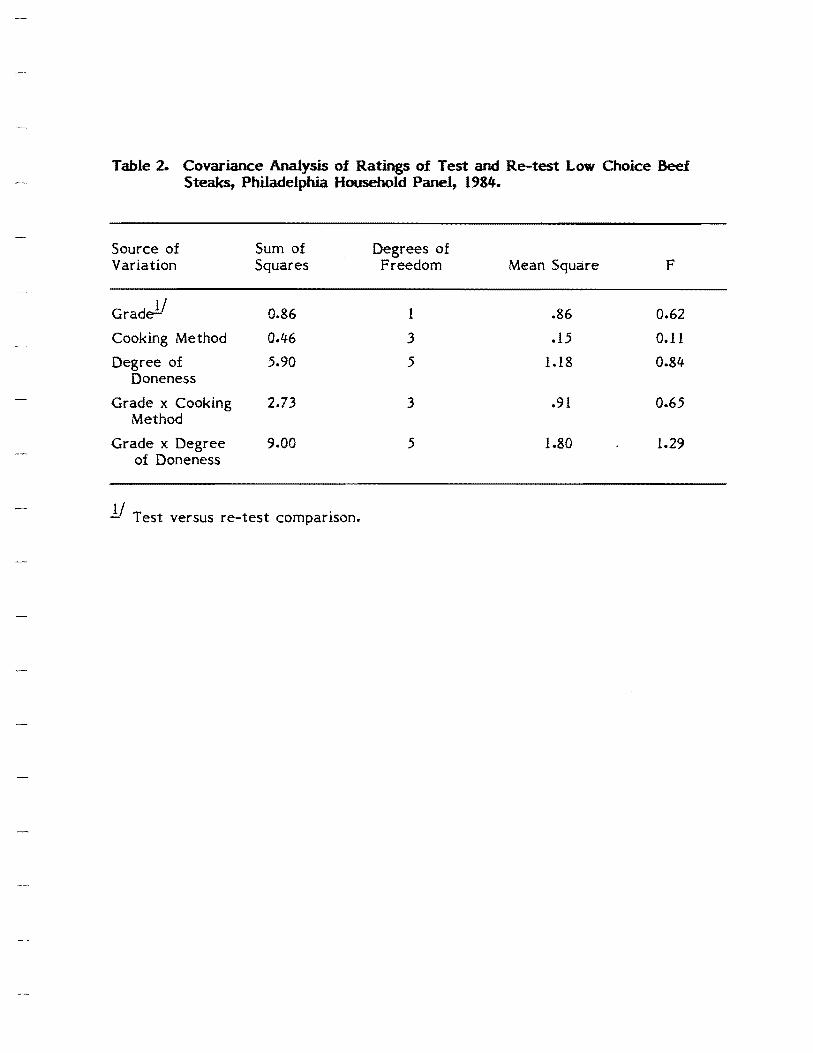
Table 2. Covariance Analysis of Ratings of Test and Re-test Low Choice Beef Steaks, Philadelphia Household Panel, 1984.
Source of Sum of Degrees of Variation Squares Freedom Mean Square F
Gradel! 0.86 1 .86 0.62
Cooking Method 0.46 3 .15 0.11
Degree of 5.90 5 1.18 0.84 Doneness
Grade x Cooking 2.73 3 .91 0.65 Method
Grade x Degree 9.00 5 1.80 1.29 of Doneness
JJ Test versus re-test comparison.

Table 3.. Mean Ratings of Repeat Panelists Who Ate All 8 Steaks, Three Cities Combined, National Consumer Beef Study, 1984 ..
Steak Designation N Mean Rating t
Low Choice -- Test 728 7.15 .09 n.s.
Low Choice -- Re-test 728 7.24

Table 4. Average Ratings of Beef Loin Steak Marbling Levels by Expert, Consumer Laboratory and Household Panels, 1982 - Houston.
USDA Consumer Marbling Quality Expert Laboratory Household
Level Grade Panel Panel Panel
Slightly abundant
Moderate
Modest
Small
Upper slight
Traces
Slight
Slight
Low prime
High Choice
Medium Choice
Low Choice
High good
High Standard
Bullock2
Short-fed2
6.96
6.54
6.28
5.89
5.53
5.64
5.47
5.32
. 1 -- - - ratmg
6.72
6.58
6.15
6.02
5.77
5.84
5.65
5.47
7.17a
7.l3a
6.87b
6.83b
6.81 b
6.78b
6.54c
6.51 c
Total Number of Observations 2,700 4,000 2,800
Source: Expert and laboratory panels at Texas A&::M University; household panel in Houston, Texas.
1 Based on nine-point, five centered, hedonic scale with 9 extremely desirable and 1 extremely undesirable.
2 Cattle type.

Table 5 .. Stepwise Regression of Consumer Beef Panel Ratings of Top Sirloin Steaks, 1984.
Variable
City
Grade of Beef
Income
Age
Education
Cooking Method
Degree of Done!;less
F Value
3.41
100.80
0.01
0.00
0.21
0.02
8.20
Probability
0.0650
0.0001 **
0.9409
0.9835
0.6431
0.8839
0.0042**
** Significant at confidence level of 99%

Table 6. Covariance Analysis of Beef Ratings, Three Cities Combined 11.
Source Degrees of Freedom F Value Probability
City 2 1.01 0.363
Grade of Beef 6 1.92 0.073 * Panelists
Income 9 2.28 0.015 ** Age 6 6.46 0.000 *** Education 3 2.62 0.048 **
Steak Preparation
Cooking Method 4 1.40 0.232
Degree of Doneness 3 6.28 0.0001 ***
Interactions of Ratings
City and Grade 12 1.31 0.203
Gr.ad~ and Cooking 24 1.07 0.374 Method
Grade and Degree 18 0.61 0.892 of Doneness
Total 4614 2.67 0.0001
* Significant at confidence level of 90%.
** Significant at confidence level of 95%.
*** Significant at confidence level of 99%.

TabJe 7. Mean overaU desirability rating of Join steaks by marbJing JeveJ, normalized data - four cities combined.
USDA Marbling Quality Standard
Level Grade Mean Error
Slightly abundant
Moderate
Modest
Small
Upper Slight
Lower Slight
Traces
Low Prime
High Choice
Medium Choice
Low Choice
High good
Low Good
High Standard
2 7.24a
7.l5b
7.00c
7.05c
d6.90
6.82e
6.76e
.04
.04
.04
.04
.04
.04
.04
Total Number of Observations 8,018
1 Based on nine-point, five centered, hedonic scale with 9.0 as highest rating.
2 Means followed by same letter superscript are not significantly different at the 95 percent confidence level.

Table 8. Purchase Intentions of Consumers as Related to Beef Loin Steak Ratings - Four Cities Combined.
Steak Rating
Would Probably Buy Only At Would Not Buy Numeric Semantic Buy Buy Reduced Pr ice At Any Price
1 - - - percent of food shoppers
9 Extremely 85.0 10.2 3.9 .2 Desirable
8 Very 65.8 27.5 3.3 .7 Desirable
7 Moderately 19.6 44.7 10.6 3.4 Desirable
6 Slightly 3.6 20.1 25.8 13.8 Desirable
5 Neither .7 5.9 35.0 29.3 Desirable Nor Undesirable
4 Slightly 2.1 2.9 35.0 52.4 Undesirable
3 Moderately 2.1 2.2 10.6 77.8 Undesirable
2 Very 2.3 2.1 4.2 88.7 Undesirable
1 Extremely 6.3 0.0 6.4 86.9 Undesirable
1 Row percentages which do not add to 100 are due to those food shoppers who were "undecided" being omitted.

FOOTNOTES
lBehavior Scan data from Information Resources. Inc. of Chicago. Illinois

REFERENCES .
Adams, N. J., G. C. Smith, and Z. L. Carpenter. "Performance, Carcass and Palatability Characteristics of Longhorn and Other Types of Cattle." MEAT SCIENCES 7(1982).
Albert, Robert H. (Editor). 1982 SURVEY OF BUYING POWER. New York, New York. Sales and Marketing Management, 1982
Banks. Seymour. EXPERIMENTATION IN MARKETING. McGraw-Hill, New York, N.Y., 1965.
Blumer, T. N. "Tenderness Measurements of Beef Carcasses and Meat from Nine State Agricultural Experiment Stations," Southern Cooperative Series Bulletin No. 229.
Branson, Robert E. and Douglass Norvell. INTRODUCTION TO AGRICULTURAL MARKETING. McGraw-Hill. New York, 1983, p. 16.
Branson, Robert E. "Consumer Dissonance and Federal Beef Grades," MRC 80-5, Texas Agricultural Experiment Station, 1980.
Oary, G. M. and D. E. Farris. "Meat Marketing Operations in Dallas-Fort Worth, Houston and Lubbock," Miscellaneous Publication, Texas Agricultural Experiment Station, Dec. 1981.
__-::---::- " Market Structure of the Food Industries Economic Research Service", USDA Market Research Report 971, Sept. 1972.
Degner, Robert L. "A Consumer Market Analysis for Textured Protein Meat Extender in Ground Beef." Doctorial Dissertation, August 1974.
Erhardt, Jacquelyn P. "The Role of the Sensory Analyst in Product Development." Food Technology, November 1978.
Ferber, Robert. STATISTICAL TECHNIQUES IN MARKET RESEARCH. McGraw-Hill, New York, N. Y., 1949.
Fisher. Franklin M., John McGowan and Joen Greenwood. FOLDED, SPINDLED, AND MUTILATED; MIT Press, Cambridge, Massachusetts, 1983.
Haidacher, Richard c., John Craven, Kuo Huang, David Smallwood and James Blaylock, "Consumer Demand for Red Meats, Poultry and Fish." ERS, USDA, AGES 820818. September, 1982.
Hicks, J. R., VALUE AND CAPITAL Oxford University Press, London, 1941.
Kinnear, Thomas C. and James R. Taylor. MARKETING RESEARCH: AN APPLIED APPROACH. McGraw-Hill, New York. N. Y., 1983.
Lancaster, Kelvin. CONSUMER DEMAND-A NEW APPROACH. Columbia University Press, New York, 1971.
Marshall, Alfred. PRINCIPLES OF ECONOMI~. MacMillan & Co., Ltd., London, 1938.
Schupp. Alvin~ Thomas Bidner, William McKnight., David Smith, John Carpenter. Jr .• and Fred Wiegman. "Acceptance of Beef Finished on Forages or with Limited Grain." Louisiana Agricultural Experiment Station. Bulletin No. 714. 1979.
Smith. G. C.• H. R. Cross, Z. L. Carpenter. C. E. Murphy. J. W. Savell. H. C. Abraham, and G. W. Davis. "Relationship of USDA Maturity Scores to Palatability of Cooked Beef." JOURNAL OF FOOD SCIENCE. Vol. 47. 1982. page 1100.
West, R. L. "The Waste Fat Problem." Twenty-Third Annual Beef Cattle Short Course, University of Florida, May 2. 3, 4, 1974.
Wohlgenant, Michael K. "Discussion: Assessing Structural Change in the Demand for Food Commodities." SOUTHERN JOURNAL OF AGRICULTURAL ECONOMICS. July 1983. pages 39-41.
__~~ • "Estimating Cross Elasticities of Demand for Beef." WABA Annual Meeting. July 1985.
U. S. Department of Commerce. Bureau of the Census. GENERAL SOCIAL AND ECONOMIC CHARACTERISTI~. UNITED STATES SUMMARY, 1980 CENSUS POPULATION. Washington, D.C., 1983.
Yankelovich, Skelly and White. THE CONSUMER CLIMATE FOR MEAT PRODUCTS. Consulting Report to Beef Industry Council. September 1983. REFERENCES