investment management committee - texas documents/board_meeting_investment...he presented the...
TRANSCRIPT

INVESTMENT MANAGEMENT COMMITTEE
APRIL 2013

Page Intentionally Left Blank

TEACHER RETIREMENT SYSTEM OF TEXAS MEETING BOARD OF TRUSTEES
AND INVESTMENT MANAGEMENT COMMITTEE
(Mr. Barth, Committee Chair; Mr. Colonnetta; Mr. Kelly; Mr. McDonald; & Ms.
Sissney, Committee Members)
AGENDA
April 18, 2013 – 9:00 a.m. TRS East Building, 5th Floor Boardroom
1. Consider the approval of the proposed minutes of the December 13, 2012 committee meeting – Todd Barth.
2. Receive a review of Internal Public Markets – Chi Chai, Janis Hydak, and Shayne McGuire.
3. Receive a review of the Trading Management Group – Bernie Bozzelli.
NOTE: The Board of Trustees (Board) of the Teacher Retirement System of Texas will not consider or act upon any item before the Investment Management Committee (Committee) at this meeting of the Committee. This meeting is not a regular meeting of the Board. However, because a quorum of the Board may attend the Committee meeting, the meeting of the Committee is also being posted as a meeting of the Board out of an abundance of caution.

Page Intentionally Left Blank

Minutes of the Investment Management Committee
December 13, 2012
The Investment Management Committee of the Board of Trustees of the Teacher Retirement System of Texas met on December 13, 2012 in the boardroom located on the Fifth Floor of the TRS East Building offices at 1000 Red River Street, Austin, Texas. The following committee members were present: Todd Barth, Chair Joe Colonnetta David Kelly by telephone conference Eric McDonald Nanette Sissney
A quorum of the committee was present. Others present: Karen Charleston, TRS Trustee Dennis Gold, TRS Charlotte Clifton, TRS Trustee Rebecca Merrill, TRS Chris Moss, TRS Trustee Mary Chang, TRS Anita Palmer, TRS Trustee Noel Sherman, TRS Brian Guthrie, TRS Hugh Ohn,TRS Britt Harris, TRS Brian Gomolski, TRS Ken Welch, TRS Lynn Lau, TRS Jerry Albright, TRS Kyle Weigum, TRS Amy Barrett, TRS Dan Herron, TRS Jase Auby, TRS Philip Mullins Curt Rogers, TRS Dr. Keith Brown, Investment Advisor Rusty Guinn, TRS Steven Huff, Fiduciary Counsel Dale West, TRS Brady O’Connell, Hewitt EnnisKnupp Janis Hydak, TRS Steve Voss, Hewitt EnnisKnupp Eric Lang, TRS Jim Bauer, Unite Here James Nield, TRS Tathata Lohachitkul, Albourne America Mike SImmons, TRS? Ann Fickel, Texas Classroom Teachers Association Mark Telschow, TRS Ted Melina Raab, Texas American Federation of Teachers Roxy Becker, TRS Leroy DeHaven, Texas Retired Teachers Association David Veal, TRS Craig teDuits, State Street Tommy Albright, TRS Jeff Lambert, State Street Courtney Villalta, TRS Owen Davies, Accenture Sharon Toalson, TRS Sanjay Menon, Accenture Scot Leith, TRS Josh Sanderson, Accenture Terry Harris, TRS
Mr. Todd Barth called the meeting to order at 8:17 a.m.
Mr. David Kelly participated in the committee meeting by telephone conference call pursuant to section 551.130 of the Texas Open Meetings Act (chapter 551 of the Texas Government Code), concerning participation by a TRS board member in a public meeting by telephone conference call.
Per Mr. Barth’s request, all committee members and staff sitting at the committee table identified themselves, in accordance with the protocol for telephone conferencing.

December 13, 2012 Investment Management Committee Minutes, Page 2 of 3
1. Consider the approval of the proposed minutes of the September 13, 2012 committee meeting – Todd Barth.
On a motion by Ms. Nanette Sissney, seconded by Mr. Eric McDonald, the committee approved the minutes of the September 13, 2012 meeting as presented.
2. Review Strategic Asset Allocation/Stable Value, Tactical Asset Allocation, Risk, and
Strategic Partnerships and Opportunistic Investments.
Mr. Britt Harris provided an overview of the following teams: Strategic Asset Allocation/Stable Value (SAA) led by Mohan Balachandran, Tactical Asset Allocation (TAA) by Curt Rogers, Risk Management by Jase Auby, and Strategic Partnerships and Opportunistic Investments (SPO) Group by Rusty Guinn. Mr. Rogers provided an overview of the SAA Group. He laid out the organizational structure and mandate of the group. Mr. Harris clarified for Dr. Keith Brown when the credit spread would be managed internally or externally. Mr. Rogers noted that the SAA/Stable Value Portfolio had a narrow tracking error range. He also presented the outlook of the portfolio over the intermediate and long terms. Mr. Kelly asked staff to conduct a study on the probability of realizing different return assumptions. Mr. Auby provided an update on the hedge fund replication strategy and the enhanced commodity alpha strategy. He also provided an overview of the 2013 priorities of the group.
Mr. Rogers profiled the TAA group, including its organization, mandate, process, and 2013 priorities. Mr. Rogers confirmed for Mr. Joe Colonnetta that staff always complied with the asset allocation before executing a tactical move. Responding to a question from Mr. Kelly regarding the monitoring of derivatives usage, Mr. Rogers stated that the TAA group, Investment Operations, the Investment Risk Group, and Internal Audit monitored it. Mr. Harris noted that TRS' custodian bank, State Street Bank and Trust Company, and TRS' Compliance Officer, Terry Harris, also monitored the use of derivatives. Mr. Auby noted that the Risk Group was independent of the TAA and SAA groups in its monitoring function. Mr. Auby provided an overview of the Risk Group. He laid out the group’s portfolio management and risk monitoring functions. He presented the group’s organizational structure and key risk signals. He explained for Mr. McDonald that the absolute return in the last seven years, the Z score, and the change of correlations would determine if there is a potential bubble. He further explained the bubble monitoring and the cumulative sum (CUSUM) processes. Responding to a question from Mr. Colonnetta on the discrepancy in the performance of the REITS before and after the CUSUM signals, Mr. Auby stated that the price movement would affect the accuracy of the signals. He presented the group’s 2012 accomplishments and 2013 priorities. Concerning the contingent hedging program, Dr. Brown and Mr. Kelly discussed whether the program should be considered as a self-insurance tool or an investment decision.
Mr. Guinn provided an update of the SPO Group. He presented the group’s organizational structure, mandate, and 2013 goals. He profiled the current strategic partners on the public side: Barclays, BlackRock, JP Morgan, Morgan Stanley, and Neuberger Berman. He also reviewed

December 13, 2012 Investment Management Committee Minutes, Page 3 of 3
their processes and performance. He explained for Dr. Brown the process of re-evaluating a partner's capabilities in different areas. Mr. Guinn also profiled the partnerships with KKR and Apollo on the private market side. Mr. Kelly and Mr. Guinn discussed the allocations and commitments to KKR and Apollo as strategic partners in contrast to their roles in managing individual private investment funds before the creation of the strategic partner network. Mr. Kelly asked staff to clarify up to what level of allocation staff needs to come to the board for approval. Mr. Guinn stated that he would deliver the answer to Mr. Kelly’s question after reviewing the data and policy requirements in detail.
Following up on an earlier question from Dr. Brown, Mr. Harris elaborated on Mr. Auby's presentation by reviewing the accomplishments of the Risk Group. The goal, he said, was to allow the Risk Group to be more involved in decision making by integrating their efforts with other investment groups. Mr. Harris also confirmed for Mr. Barth that the SAA, TAA, Risk, and SPO groups added about $450 million in total value in 2011 and an estimated $400 to $500 million in 2012.
The meeting adjourned at 10:37 a.m.

Page Intentionally Left Blank

Internal Active Equity Portfolio Management
Chi Kit Chai Senior Managing Director
April 2013
2
Overview
Overview • TRS IMD Internal Management
Internal Actively Managed Equity Portfolios • TRS Investment Division
• Internal Active Portfolios
• Active Equity Management Unit
Market Update • Regional Returns Update
• Sector Returns Update
• Correlation Update
GBI Flagship • Investment Results
• Competitive Landscape
• Performance Attribution
• Region and Sector Positioning
GBI Core • Fundamental Characteristics
• Investment Process
• Security Selection
• Top Holdings and Overweights
GBI Quant • Diversification Benefits
• Investment Results
• Investment Process
GBI US High Quality • Investment Results
• Rationale
GBI Gold • Investment Results
• Rationale
Accomplishments, Priorities and Collaboration
IPM 2017 and Trust-wide Initiatives • Internal Active Timeline
• IPM 2017
Summary
Appendix

3
TRS IMD Internal Management Overview
*Notional exposure **Co-managed with IPM
• $43 billion managed internally (38% of TRS Portfolio) • Experienced investment and trading teams• 4th largest actively managed global equity fund • Well developed investment processes with effective • $21 billion managed actively risk management • $22 billion managed passively • Annual implied cost savings: $120 million
ALPHA TrackingGlobal Best Ideas (GBI) AUM ($M) 1 Yr 3 Yrs 5 Yrs ITD ErrorCore 19,810$ 0.7% 0.3% 0.5% 0.6% 1.4% 0.39Quant 547$ 2.5% 0.9% - 2.1% 2.1% 1.01Flagship 20,358$ 0.7% 0.3% 0.5% 0.6% 1.4% 0.43
Gold 816$ 2.3% 1.9% - 1.8% 2.1% 0.86
US High Quality 99$ 1.2% - - 0.1% 4.6% 0.02Total Internal Active 21,273$
Characteristics Data Factor % of RiskPredicted Beta 1.0 Stock Specific 45Price/Earnings - Trailing 13.5x Region/Currency 24Price/Earnings - Forward 12.6x Volatility 13Price/Book 1.7x Sector 10Dividend Yield 2.7% Momentum 7ROE 18.0% Growth 1EPS Growth 11.3% Value 0Debt/Capital 31.5% Size 0Realized Tracking Error 140 bps Total Factor Exposures 100%
Benchmark: MSCI All-Country World Target Alpha: 50 basis pointsRegions BM Weight Risk RangesUnited States 46% - Tracking Error: 0 to 200 basis pointsEurope 24% - Regional Allocation: -3% to +3%Asia Ex Japan 10% - Sector Allocation: -3% to +3%Japan 7%Latin America & EMEA 5% Research Portfolios (Unfunded)Other 8% US REIT Long/Short
100%
Passive Portfolios AUM ($M) Research Portfolios (Funded) AUM ($M)Long-Term Treasury Bonds 12,869$ Qualitative Vector Fund (QVF)* 100$ Treasury Inflation-Protected Securities (TIPS 5,723$ Commodity Alpha Fund* 100$ Hedge Fund Replication 1,240$ Low Volatility with Overlay** 101$ Equity 2,593$ Total Research (Funded) 301$ Total Passive 22,423$
Research Portfolios (Unfunded)Other Internal Risk ParityClassic Tactical Allocation Total Trust Overlay
GBI Flagship Key Policies
Internal Management
Active Portfolios (managed by Internal Public Markets Team)
RatioInformation
Passive Portfolios (managed by Stable Value and Risk Teams)
GBI Flagship Portfolio Characteristics GBI Flagship Factor Exposures
APPENDIX INTERNAL ACTIVELY MANAGED EQUITY PORTFOLIOS

5
Britt Harris CIO
OPERATIONS Sylvia Bell
EXTERNAL PUBLIC
Dale West
PRIVATE EQUITY Rich Hall
INTERNAL PUBLIC Chi Chai
REAL ASSETS
Eric Lang
PASSIVE REPLICATION RISK PREMIUM
Mohan Balachandran
TRADING Bernie Bozzelli
Stable Value Global Equity Real Return
Jerry Albright Deputy CIO
STRATEGIC PARTNER NETWORK Public and Private
TBD
STABLE VALUE Mohan
Balachandran/ Bernie Bozzelli
RISK Jase Auby
NATURAL RESOURCES
Vaughn Brock
TAA Curt Rogers
TRS Investment Management Division

6
GBI Core, $19.8B, 17% GBI Gold, $0.8B, 1%
GBI Quant, $0.5B
GBI US High Quality, $0.1B
SPN, $5.8B, 5%
Passive, $25.2B, 22%
Real Assets, $13.0B, 11%
Private Equity, $12.3B, 11%
Hedge Funds, $8.6B, 8%
Other Absolute Return, $0.1B
External Equities, $25.6B, 22%
Emerging Managers, $0.7B, 1%
Energy & Natural Resources, $1.5B, 1% Risk, $0.1B
Internal Public Markets Investment Management Division as of December 31, 2012
Total Trust Value: $114 billion

7
Internal Public Markets IPM Management Committee
Shayne McGuire Head of Fundamental Research BA Fordham, MA & MBA UT Joined TRS in 2001
Patrick Cosgrove, CFA EAFE Portfolio Manager BA Texas A&M, MBA St. Mary’s Joined TRS in 1999
Janis Hydak, CFA Head of Quant Research BA Duke, MAT Wesleyan, MA Middlebury College, JD Alabama, MBA St. Edward’s Joined TRS in 1985 Mark Albert, CFA Quant Portfolio Manager BA Brandeis, MBA Michigan Joined TRS in 1999
Chi Kit Chai, CFA Head of Internal Public Markets BA Virginia Tech, MBA SMU, MA UT Joined TRS in 1996
David DeStefano, CFA Head of Portfolio Management BBA & MBA UT Joined TRS in 2001 Ralph Linn, CFA US Portfolio Manager BS, MBA & JD Tulane Joined TRS in 2002
8
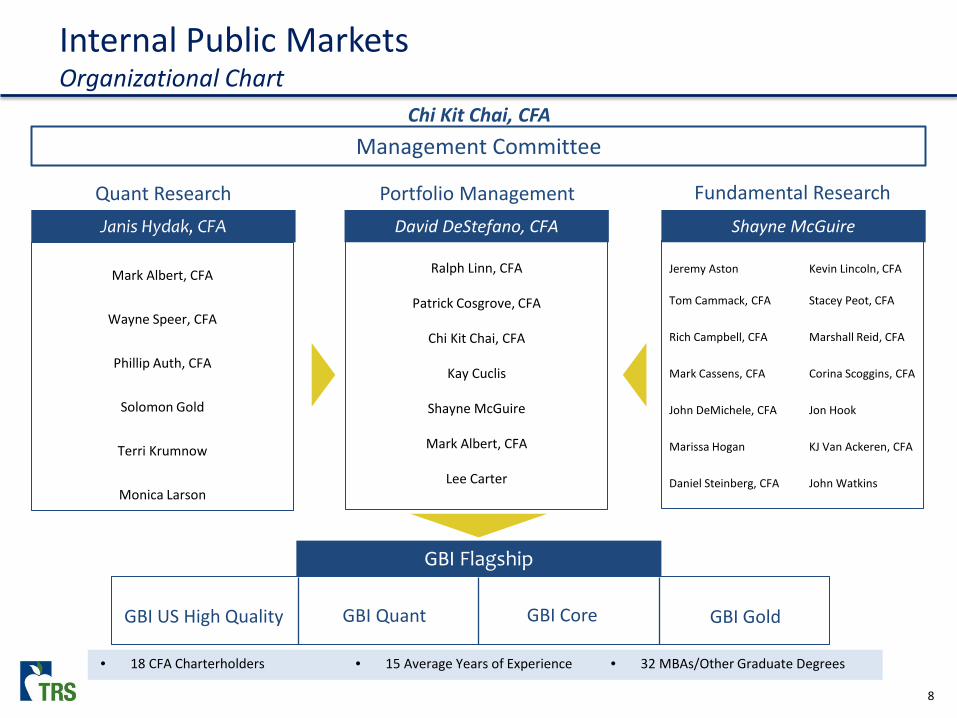
Internal Public Markets Organizational Chart
Chi Kit Chai, CFA Management Committee
Quant Research Portfolio Management Fundamental Research Janis Hydak, CFA David DeStefano, CFA Shayne McGuire
Mark Albert, CFA
Wayne Speer, CFA
Phillip Auth, CFA
Solomon Gold
Terri Krumnow
Monica Larson
Ralph Linn, CFA
Patrick Cosgrove, CFA
Chi Kit Chai, CFA
Kay Cuclis
Shayne McGuire
Mark Albert, CFA
Lee Carter
Jeremy Aston Kevin Lincoln, CFA
Tom Cammack, CFA Stacey Peot, CFA
Rich Campbell, CFA Marshall Reid, CFA
Mark Cassens, CFA Corina Scoggins, CFA
John DeMichele, CFA Jon Hook
Marissa Hogan KJ Van Ackeren, CFA
Daniel Steinberg, CFA John Watkins
GBI Flagship
GBI US High Quality GBI Gold GBI Quant GBI Core
• 18 CFA Charterholders
• 15 Average Years of Experience
• 32 MBAs/Other Graduate Degrees
9
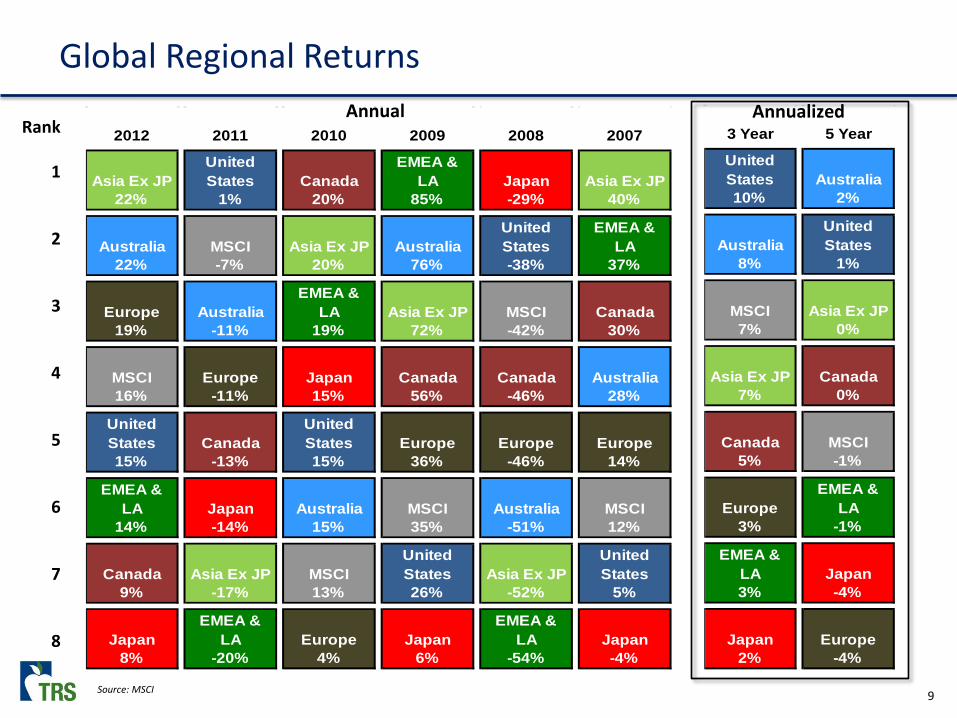
Global Regional Returns
Rank
1
2
3
4
5
6
7
8
Asia Ex JPUnited States Canada
EMEA & LA Japan Asia Ex JP
22% 1% 20% 85% -29% 40%
Australia MSCI Asia Ex JP AustraliaUnited States
EMEA & LA
22% -7% 20% 76% -38% 37%
Europe AustraliaEMEA &
LA Asia Ex JP MSCI Canada19% -11% 19% 72% -42% 30%
MSCI Europe Japan Canada Canada Australia16% -11% 15% 56% -46% 28%
United States Canada
United States Europe Europe Europe
15% -13% 15% 36% -46% 14%
EMEA & LA Japan Australia MSCI Australia MSCI
14% -14% 15% 35% -51% 12%
Canada Asia Ex JP MSCIUnited States Asia Ex JP
United States
9% -17% 13% 26% -52% 5%
JapanEMEA &
LA Europe JapanEMEA &
LA Japan8% -20% 4% 6% -54% -4%
2012 2011 2010 2009 2008 2007Annual
United States Australia10% 2%
AustraliaUnited States
8% 1%
MSCI Asia Ex JP7% 0%
Asia Ex JP Canada7% 0%
Canada MSCI5% -1%
EuropeEMEA &
LA3% -1%
EMEA & LA Japan3% -4%
Japan Europe2% -4%
3 Year 5 YearAnnualized
Source: MSCI
10
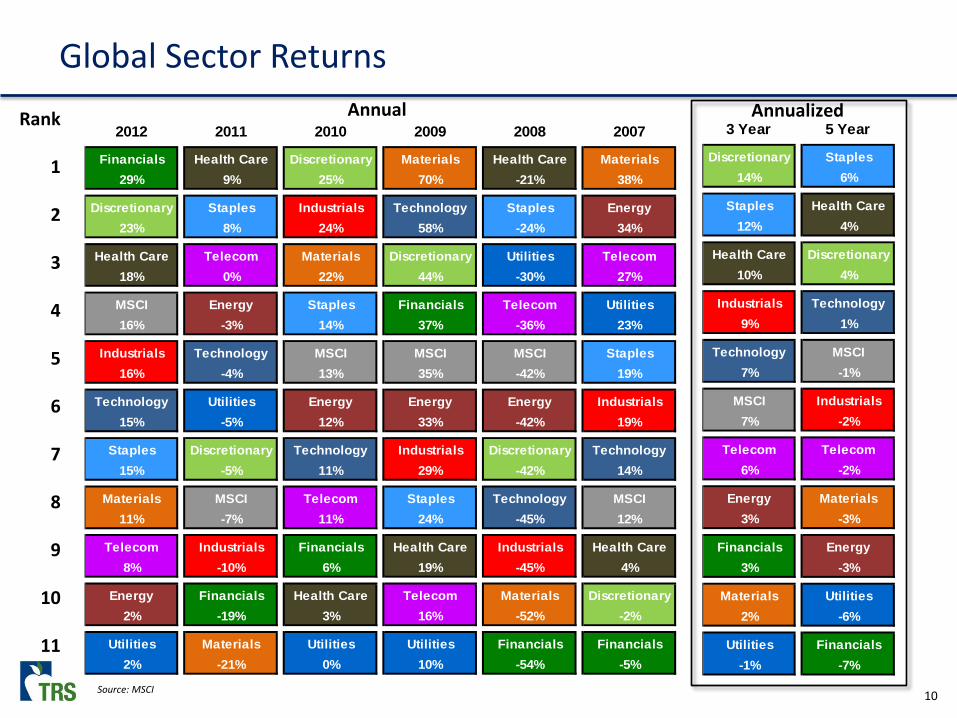
Global Sector Returns Rank
1
2
3
4
5
6
7
8
9
10
11
Annual
Financials Health Care Discretionary Materials Health Care Materials29% 9% 25% 70% -21% 38%
Discretionary Staples Industrials Technology Staples Energy23% 8% 24% 58% -24% 34%
Health Care Telecom Materials Discretionary Utilities Telecom18% 0% 22% 44% -30% 27%
MSCI Energy Staples Financials Telecom Utilities16% -3% 14% 37% -36% 23%
Industrials Technology MSCI MSCI MSCI Staples16% -4% 13% 35% -42% 19%
Technology Utilities Energy Energy Energy Industrials15% -5% 12% 33% -42% 19%
Staples Discretionary Technology Industrials Discretionary Technology15% -5% 11% 29% -42% 14%
Materials MSCI Telecom Staples Technology MSCI11% -7% 11% 24% -45% 12%
Telecom Industrials Financials Health Care Industrials Health Care8% -10% 6% 19% -45% 4%
Energy Financials Health Care Telecom Materials Discretionary2% -19% 3% 16% -52% -2%
Utilities Materials Utilities Utilities Financials Financials2% -21% 0% 10% -54% -5%
2012 2011 2010 2009 2008 2007Discretionary Staples
14% 6%
Staples Health Care12% 4%
Health Care Discretionary10% 4%
Industrials Technology9% 1%
Technology MSCI7% -1%
MSCI Industrials7% -2%
Telecom Telecom6% -2%
Energy Materials3% -3%
Financials Energy3% -3%
Materials Utilities2% -6%
Utilities Financials-1% -7%
3 Year 5 YearAnnualized
Source: MSCI
11
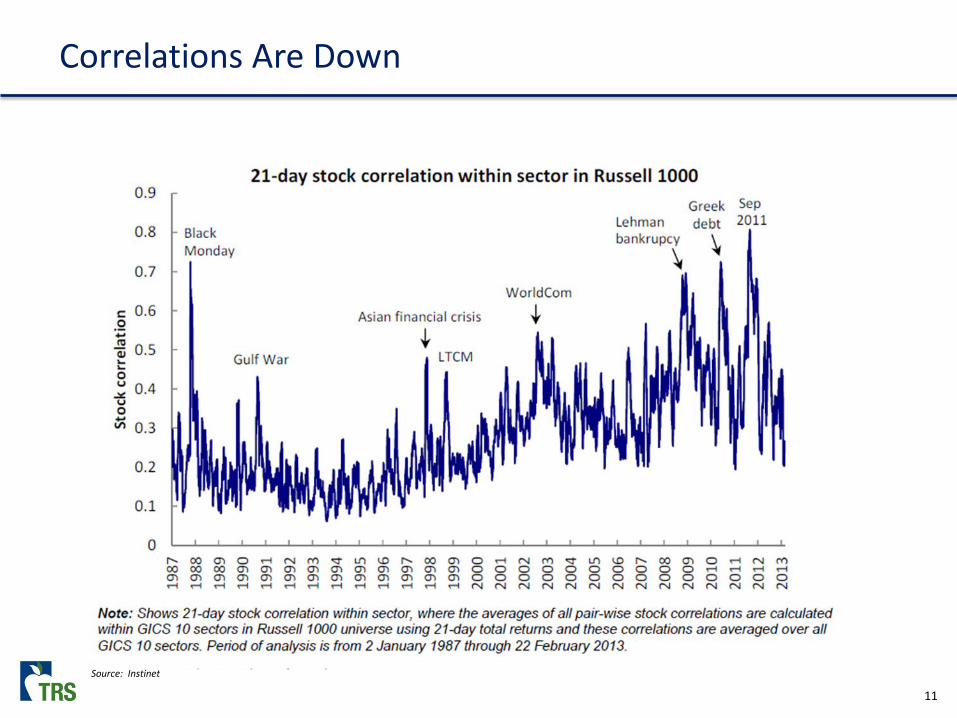
Correlations Are Down
Source: Instinet

APPENDIX GBI FLAGSHIP

13
GBI Flagship (Core Plus Quant) Performance as of December 31, 2012
Year AUM
($ in billions) Investment Return
(%) Alpha
(bps)
2012 $20.4 16.8 65
2011 $18.2 -7.3 7
2010 $19.4 12.8 16
2009 $16.7 35.4 77
2008 $12.1 -41.5 72
2007* $3.9 2.8 43
Risk Metrics Peer Quartile Rank
Annualized Investment Return
(%) Alpha
(bps) Tracking Error Information Ratio Information Ratio 1-Year 16.8 65 0.6% 1.1 1
3-Year 6.9 28 0.9% 0.3 2
5-Year -0.7 51 1.4% 0.4 2
Since Inception* -0.1 60 1.4% 0.4 2
Notes Benchmark is MSCI All Country World *Inception: GBI Flagship: December 2007 Peer universe is eVestments funds. EVestments peer performance is based on gross returns. Fees are not subtracted. Tracking Error: annualized standard deviation of monthly excess returns Information Ratio: annualized excess returns/tracking error
14
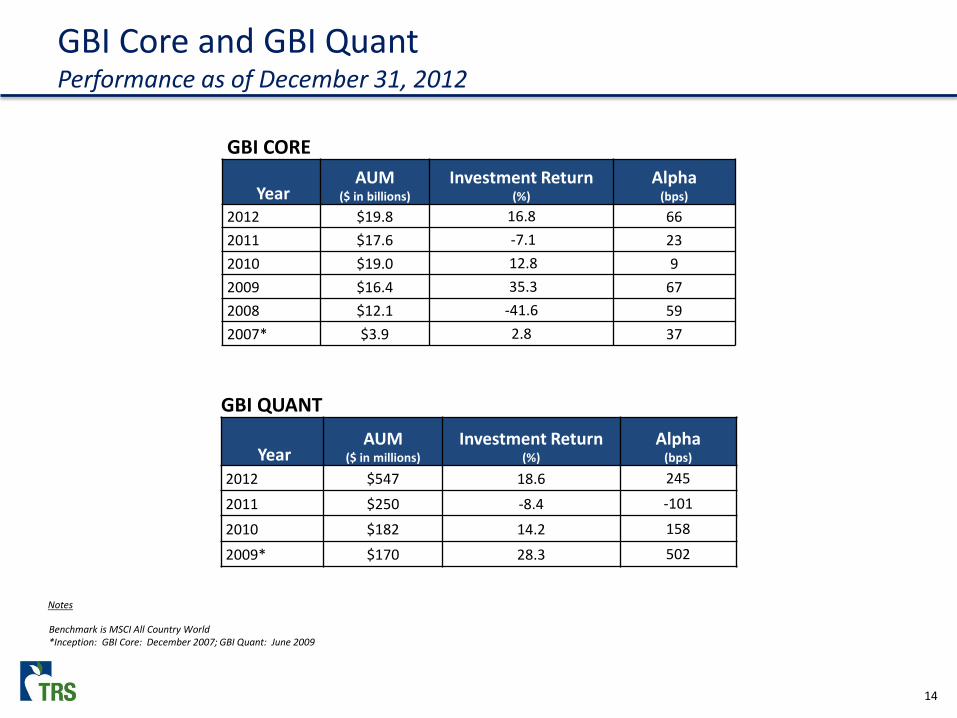
GBI Core and GBI Quant Performance as of December 31, 2012
GBI CORE
Year AUM
($ in billions) Investment Return
(%) Alpha
(bps)
2012 $19.8 16.8 66 2011 $17.6 -7.1 23 2010 $19.0 12.8 9 2009 $16.4 35.3 67 2008 $12.1 -41.6 59 2007* $3.9 2.8 37
Notes
Benchmark is MSCI All Country World *Inception: GBI Core: December 2007; GBI Quant: June 2009
GBI QUANT
Year AUM
($ in millions) Investment Return
(%) Alpha
(bps)
2012 $547 18.6 245
2011 $250 -8.4 -101
2010 $182 14.2 158
2009* $170 28.3 502
15
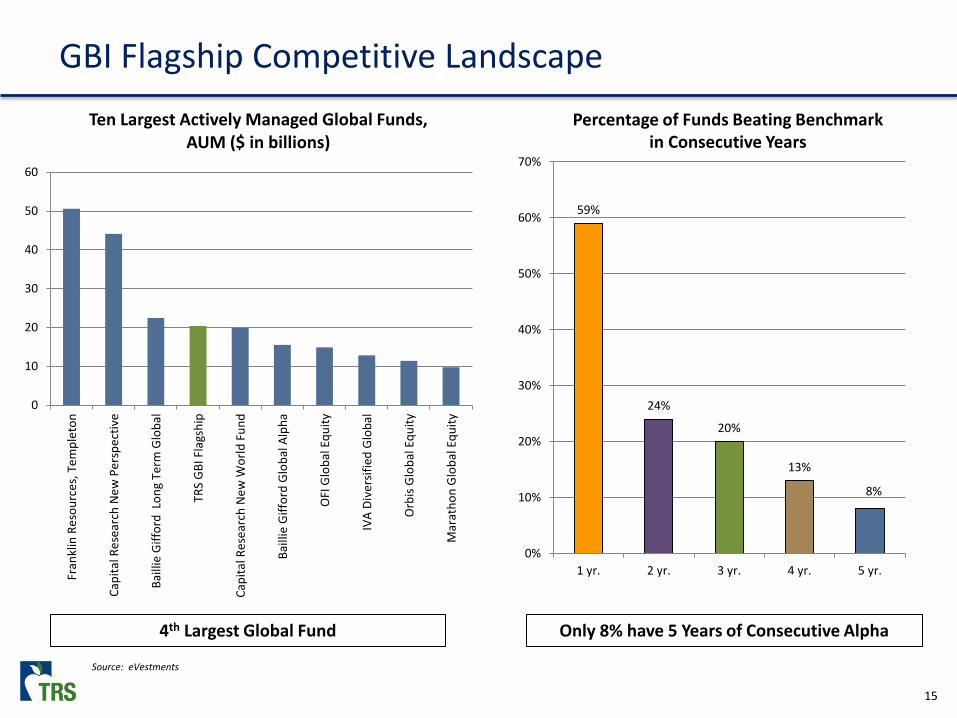
GBI Flagship Competitive Landscape
Launched Percentage of Funds Beating Benchmark
in Consecutive Years
Only 8% have 5 Years of Consecutive Alpha
Source: eVestments
59%
24%
20%
13%
8%
0%
10%
20%
30%
40%
50%
60%
70%
1 yr. 2 yr. 3 yr. 4 yr. 5 yr.
4th Largest Global Fund
0
10
20
30
40
50
60
Fran
klin
Res
ourc
es, T
empl
eton
Capi
tal R
esea
rch
New
Per
spec
tive
Baill
ie G
iffor
d L
ong
Term
Glo
bal
TRS
GBI
Fla
gshi
p
Capi
tal R
esea
rch
New
Wor
ld F
und
Baill
ie G
iffor
d G
loba
l Alp
ha
OFI
Glo
bal E
quity
IVA
Dive
rsifi
ed G
loba
l
Orb
is G
loba
l Equ
ity
Mar
atho
n G
loba
l Equ
ity
Ten Largest Actively Managed Global Funds, AUM ($ in billions)
16
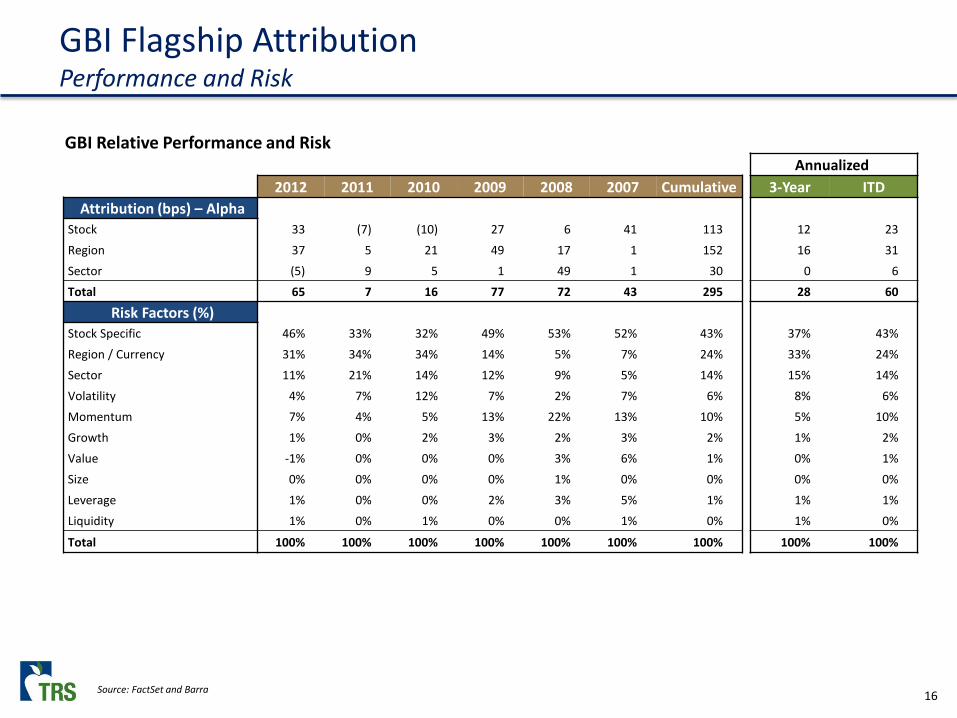
GBI Flagship Attribution Performance and Risk
Launched GBI Relative Performance and Risk
Annualized 2012 2011 2010 2009 2008 2007 Cumulative 3-Year ITD
Attribution (bps) – Alpha Stock 33 (7) (10) 27 6 41 113 12 23 Region 37 5 21 49 17 1 152 16 31 Sector (5) 9 5 1 49 1 30 0 6 Total 65 7 16 77 72 43 295 28 60
Risk Factors (%) Stock Specific 46% 33% 32% 49% 53% 52% 43% 37% 43% Region / Currency 31% 34% 34% 14% 5% 7% 24% 33% 24% Sector 11% 21% 14% 12% 9% 5% 14% 15% 14% Volatility 4% 7% 12% 7% 2% 7% 6% 8% 6% Momentum 7% 4% 5% 13% 22% 13% 10% 5% 10% Growth 1% 0% 2% 3% 2% 3% 2% 1% 2% Value -1% 0% 0% 0% 3% 6% 1% 0% 1% Size 0% 0% 0% 0% 1% 0% 0% 0% 0% Leverage 1% 0% 0% 2% 3% 5% 1% 1% 1% Liquidity 1% 0% 1% 0% 0% 1% 0% 1% 0%
Total 100% 100% 100% 100% 100% 100% 100% 100% 100%
Source: FactSet and Barra

17
GBI Flagship Positioning
-3% -2% -1% 0% 1% 2% 3%
Industrials
Telecommunication Services
Energy
Information Technology
Materials
Consumer Discretionary
Financials
Utilities
Health Care
Consumer Staples
GBI 2012 GBI 2011
-3% -2% -1% 0% 1% 2% 3%
Asia Ex Japan
EMEA & Lat Am
Europe
Japan
Canada
Australia/New Zealand
United States
GBI 2012 GBI 2011GBI Over/Under
Regions 2012 2011 2012 2011
Asia Ex Japan 12.6% 11.9% 2.8% 2.8% EMEA & Lat Am 5.7% 5.9% 0.3% 0.5% Europe 24.1% 22.0% -0.1% -1.8% Japan 7.0% 7.0% -0.4% -1.0% Canada 3.5% 4.1% -0.7% -0.4% Australia/New Zealand 2.5% 2.9% -0.9% -0.3% United States 44.7% 46.2% -0.9% 0.2%
GBI Over/Under
Sectors 2012 2011 2012 2011
Industrials 11.3% 11.0% 0.9% 0.5%
Telecommunication Svcs. 5.1% 5.4% 0.8% 0.5%
Energy 11.2% 12.7% 0.6% 0.6%
Information Technology 12.4% 12.3% 0.3% 0.1%
Materials 7.7% 8.3% 0.1% 0.3%
Consumer Discretionary 10.6% 8.0% -0.1% -2.0%
Financials 21.0% 17.9% -0.2% -0.6%
Utilities 3.2% 4.4% -0.3% 0.5%
Health Care 9.0% 10.2% -0.3% 0.9% Consumer Staples 8.3% 9.9% -2.1% -0.8%
Benchmark: MSCI ACWI

18
GBI Core Portfolio Characteristics as of December 31, 2012
GBI Core MSCI ACWI Portfolio Characteristics 2012 2011 2012 2011
Valuation Metrics
Market Capitalization $77.3B $68.6B $74.9B $64.8B
Price/Earnings – Trailing 13.5x 11.8x 13.9x 12.1x
Price/Earnings – Forward 12.6x 11.0x 13.1x 11.4x
Price/Book 1.7x 2.0x 1.7x 2.0x
Dividend Yield 2.7% 2.6% 2.8% 2.4%
Quality Metrics
Estimated 3-5 Year EPS Growth 11.3% 10.7% 10.6% 10.7%
Return on Equity 18.0% 18.8% 17.6% 18.6%
Long-Term Debt/Capital 31.5% 30.3% 32.6% 31.2%
Risk Metrics Beta 1.0 1.0 1.0 1.0

19
• Top-down allocation and bottom-up security selection
• Quantitative screen, fundamental analysis, and portfolio optimization
Portfolio Construction
Step 1
Risk Budget +
Portfolio Constraints +
Factor Outlook
Step 2 Step 3
Top-Down Allocation Bottom-Up Security Selection Portfolio Optimization
Optimization
Portfolio
Fundamental Inputs • Secular and Structural Theses
• Economic and Profit Cycle Analysis
• Valuation
• Investor Sentiment and Positioning
Quantitative Inputs • Internally Developed Models
• Externally Developed Models
Quantitative Inputs • Customized Quantitative Front- End Screen
Fundamental Inputs • Global Industry Expertise
• Company Financial Modeling
• Valuation
Portfolio Maintenance
Reporting Performance Attribution Risk Management
GBI Core Investment Process
20
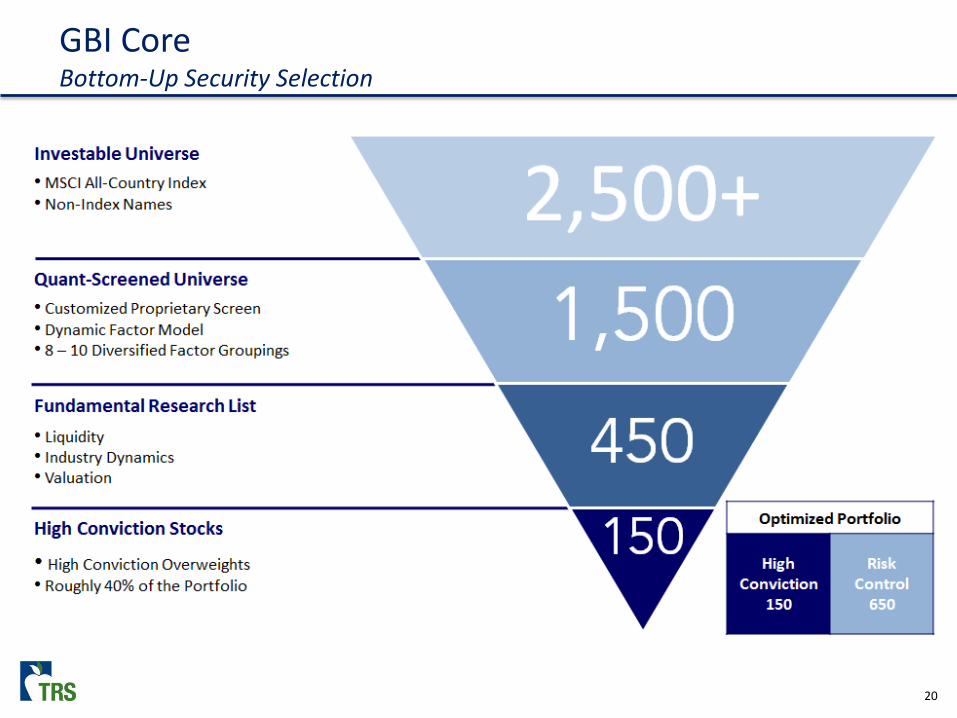
GBI Core Bottom-Up Security Selection
21
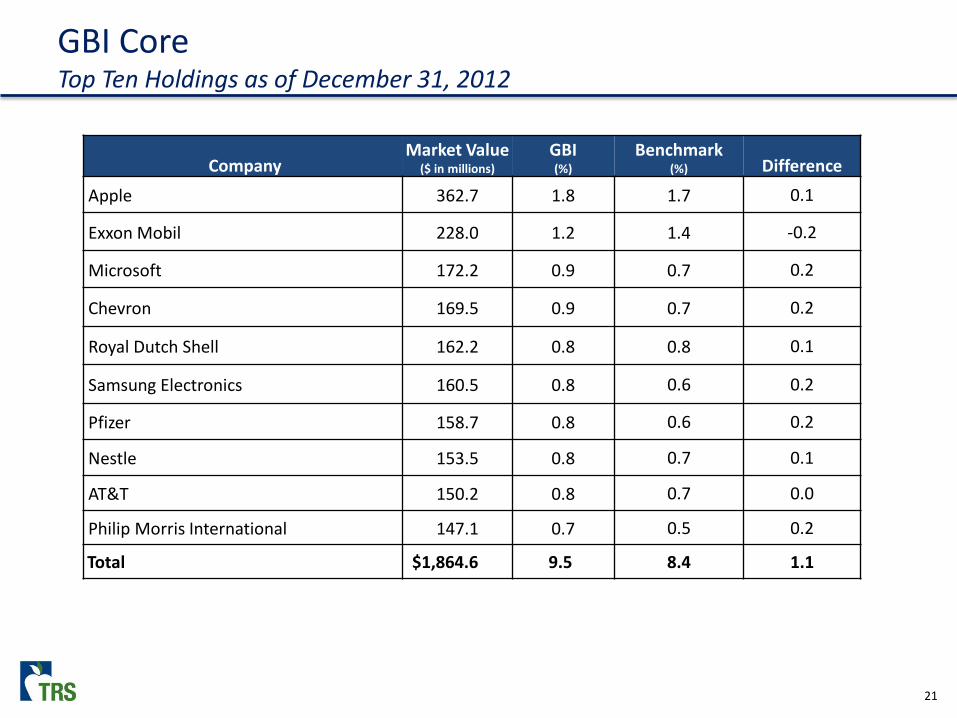
GBI Core Top Ten Holdings as of December 31, 2012
Company Market Value
($ in millions) GBI (%)
Benchmark (%) Difference
Apple 362.7 1.8 1.7 0.1
Exxon Mobil 228.0 1.2 1.4 -0.2
Microsoft 172.2 0.9 0.7 0.2
Chevron 169.5 0.9 0.7 0.2
Royal Dutch Shell 162.2 0.8 0.8 0.1
Samsung Electronics 160.5 0.8 0.6 0.2
Pfizer 158.7 0.8 0.6 0.2
Nestle 153.5 0.8 0.7 0.1
AT&T 150.2 0.8 0.7 0.0
Philip Morris International 147.1 0.7 0.5 0.2
Total $1,864.6 9.5 8.4 1.1

22
GBI Core Top Overweights and Underweights as of December 31, 2012
Overweights Underweights
Company Market Value
($ in millions) Overweight
(%) Company Market Value
($ in millions) Underweight
(%)
ACE 94.0 0.4 Siemens 0.0 -0.3
LyondellBasell Industries 80.7 0.3 Bank of America 35.7 -0.2
iShares FTSE A50 China Index ETF 66.6 0.3 ConocoPhillips 0.0 -0.2
China Construction Bank 105.4 0.3 U.S. Bancorp 0.0 -0.2
Valeo 59.4 0.3 ExxonMobil 228.0 -0.2
Ameriprise Financial 67.6 0.3 UBS 0.0 -0.2
Covanta 57.7 0.3 Bristol-Meyers Squibb 0.0 -0.2
CenturyLink 73.3 0.3 United Parcel Service 0.0 -0.2
American Express 96.1 0.3 Abbott Laboratories 33.6 -0.2
Altria Group 98.0 0.3 Eli Lilly 0.0 -0.2
Total $798.8 3.1 Total $297.3 -2.1

APPENDIX GBI QUANT
24
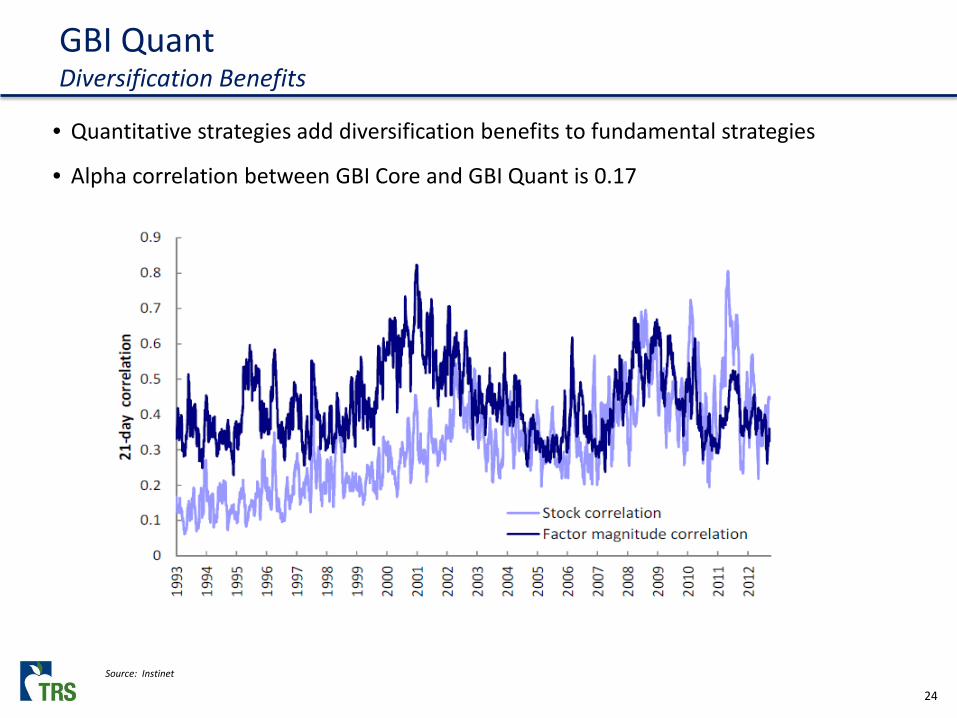
GBI Quant Diversification Benefits
Source: Instinet
• Quantitative strategies add diversification benefits to fundamental strategies
• Alpha correlation between GBI Core and GBI Quant is 0.17
25
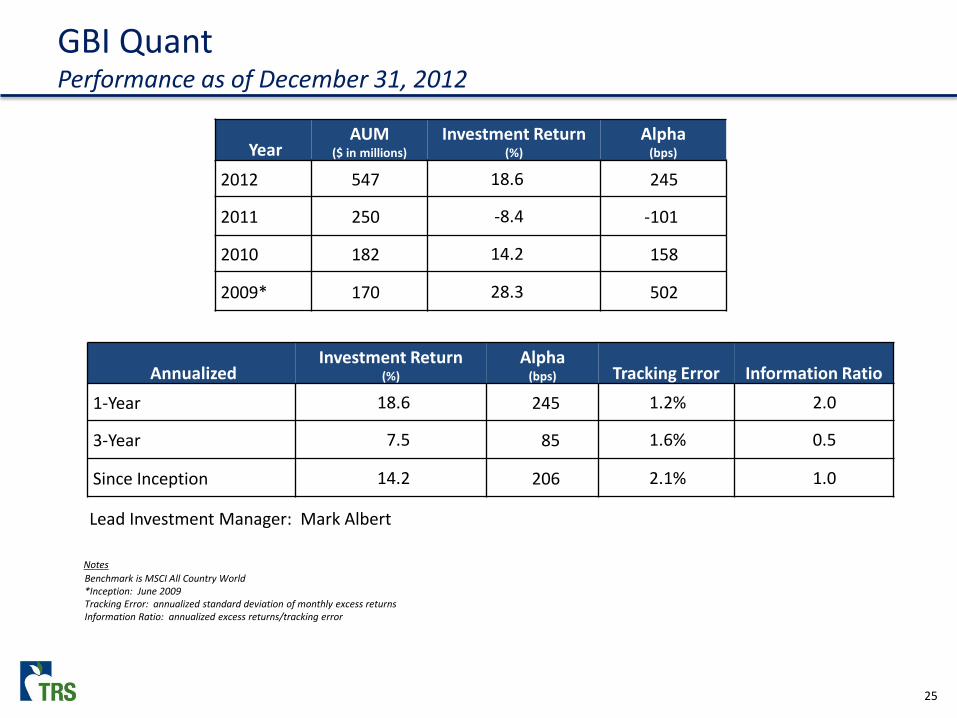
GBI Quant Performance as of December 31, 2012
Year AUM
($ in millions) Investment Return
(%) Alpha
(bps)
2012 547 18.6 245
2011 250 -8.4 -101
2010 182 14.2 158
2009* 170 28.3 502
Annualized Investment Return
(%) Alpha
(bps) Tracking Error Information Ratio
1-Year 18.6 245 1.2% 2.0
3-Year 7.5 85 1.6% 0.5
Since Inception 14.2 206 2.1% 1.0
Notes Benchmark is MSCI All Country World *Inception: June 2009 Tracking Error: annualized standard deviation of monthly excess returns Information Ratio: annualized excess returns/tracking error
Lead Investment Manager: Mark Albert
26
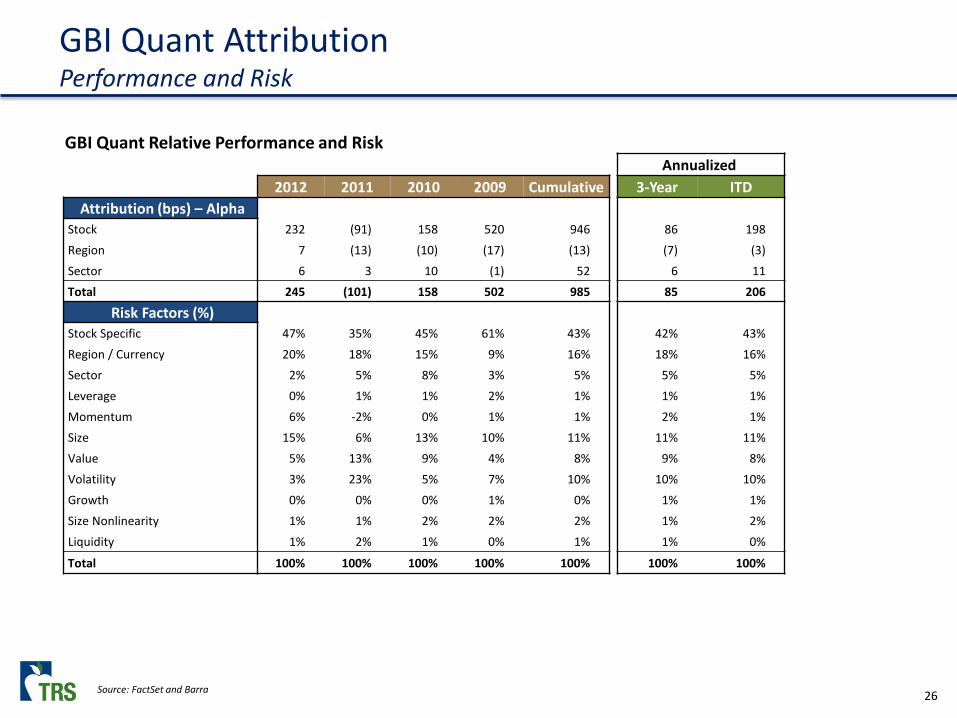
GBI Quant Attribution Performance and Risk
Launched GBI Quant Relative Performance and Risk
Annualized 2012 2011 2010 2009 Cumulative 3-Year ITD
Attribution (bps) – Alpha Stock 232 (91) 158 520 946 86 198 Region 7 (13) (10) (17) (13) (7) (3) Sector 6 3 10 (1) 52 6 11 Total 245 (101) 158 502 985 85 206
Risk Factors (%) Stock Specific 47% 35% 45% 61% 43% 42% 43% Region / Currency 20% 18% 15% 9% 16% 18% 16% Sector 2% 5% 8% 3% 5% 5% 5% Leverage 0% 1% 1% 2% 1% 1% 1% Momentum 6% -2% 0% 1% 1% 2% 1% Size 15% 6% 13% 10% 11% 11% 11% Value 5% 13% 9% 4% 8% 9% 8% Volatility 3% 23% 5% 7% 10% 10% 10% Growth 0% 0% 0% 1% 0% 1% 1% Size Nonlinearity 1% 1% 2% 2% 2% 1% 2% Liquidity 1% 2% 1% 0% 1% 1% 0%
Total 100% 100% 100% 100% 100% 100% 100%
Source: FactSet and Barra

27
GBI Quant Investment Process
Three Distinct Strategies
Strategic Dynamic Macro Distance $222 Million
41% $194 Million
35% $131 Million
24%
50 Models Long-term
Static Factors & Equal Weights
48 Models Dynamic
Flexible Factors & Weights
48 Models Macro Regimes
Flexible Factors & Weights
Developed Markets • Region / Sector Models
Emerging Markets • Country Models
Country Models Country Models
Launched June 2009
Launched September 2009
Launched March 2012
Quantitative Platform Alpha Correlation
2012
Quant Strategic Quant Dynamic Quant Macro Distance
Inception To-Date
Quant Strategic 1.00 0.57 -0.52
Quant Dynamic 0.43 1.00 -0.03
Quant Macro Distance -0.52 -0.03 1.00

APPENDIX GBI US HIGH QUALITY

29
The TRS Definition of Quality
• Return on Equity (ROE)
• Gross margin
• Intangible assets as a percent of total assets (proxy for franchise value)
• Beta to bond spread returns (Core – High Yield)
US High Quality MSCI USA
Average Z-Score Average Z-Score
ROE Factor 31.6 3.0 21.9 0.9
Gross Margin 59.3 2.9 44.0 0.9
Intangible Assets to Total Assets 34.5 2.6 23.8 0.8
Beta to Bond Spread -68.1 2.6 -115.8 0.8
30
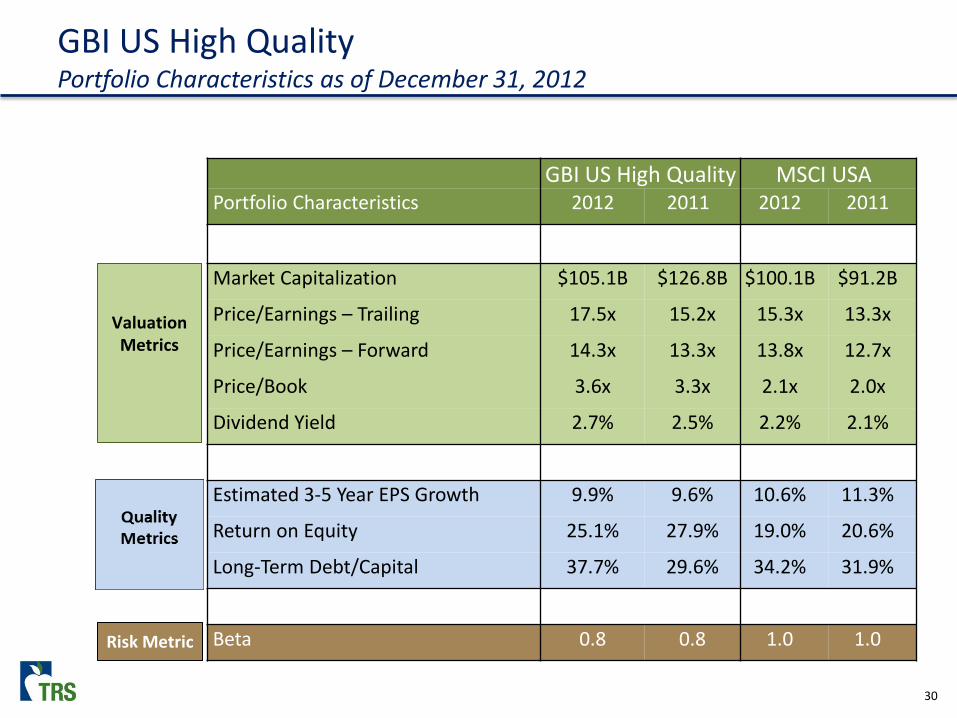
GBI US High Quality Portfolio Characteristics as of December 31, 2012
GBI US High Quality MSCI USA Portfolio Characteristics 2012 2011 2012 2011
Market Capitalization $105.1B $126.8B $100.1B $91.2B
Price/Earnings – Trailing 17.5x 15.2x 15.3x 13.3x
Price/Earnings – Forward 14.3x 13.3x 13.8x 12.7x
Price/Book 3.6x 3.3x 2.1x 2.0x
Dividend Yield 2.7% 2.5% 2.2% 2.1%
Estimated 3-5 Year EPS Growth 9.9% 9.6% 10.6% 11.3%
Return on Equity 25.1% 27.9% 19.0% 20.6%
Long-Term Debt/Capital 37.7% 29.6% 34.2% 31.9%
Beta 0.8 0.8 1.0 1.0
Valuation Metrics
Risk Metric
31
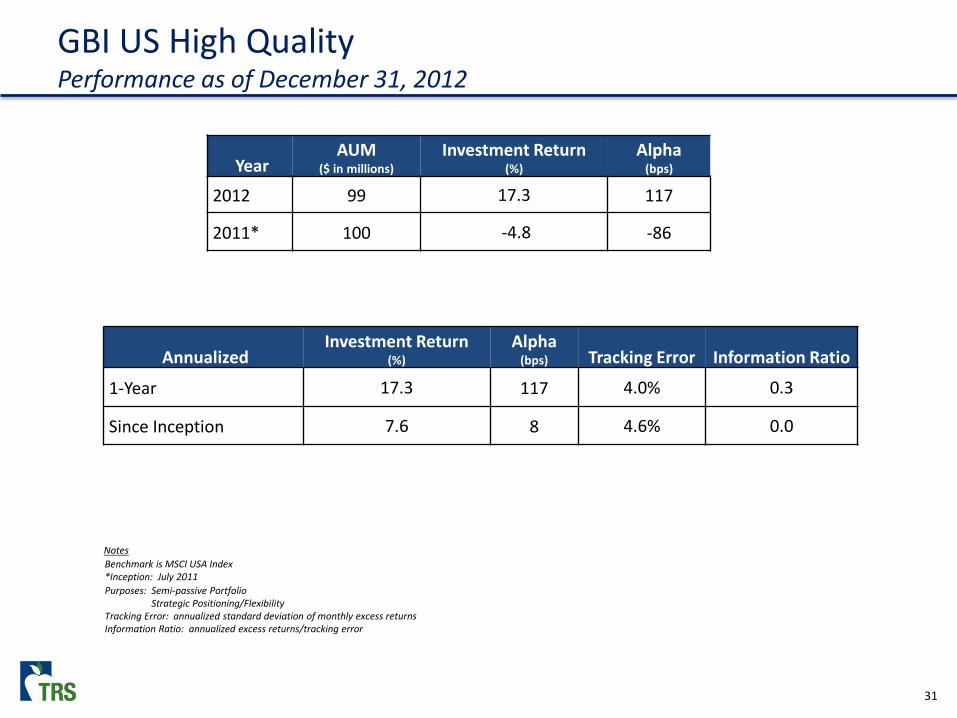
GBI US High Quality Performance as of December 31, 2012
Year AUM
($ in millions) Investment Return
(%) Alpha
(bps)
2012 99 17.3 117
2011* 100 -4.8 -86
Annualized Investment Return
(%) Alpha
(bps) Tracking Error Information Ratio
1-Year 17.3 117 4.0% 0.3
Since Inception 7.6 8 4.6% 0.0
Notes Benchmark is MSCI USA Index *Inception: July 2011 Purposes: Semi-passive Portfolio Strategic Positioning/Flexibility Tracking Error: annualized standard deviation of monthly excess returns Information Ratio: annualized excess returns/tracking error
32
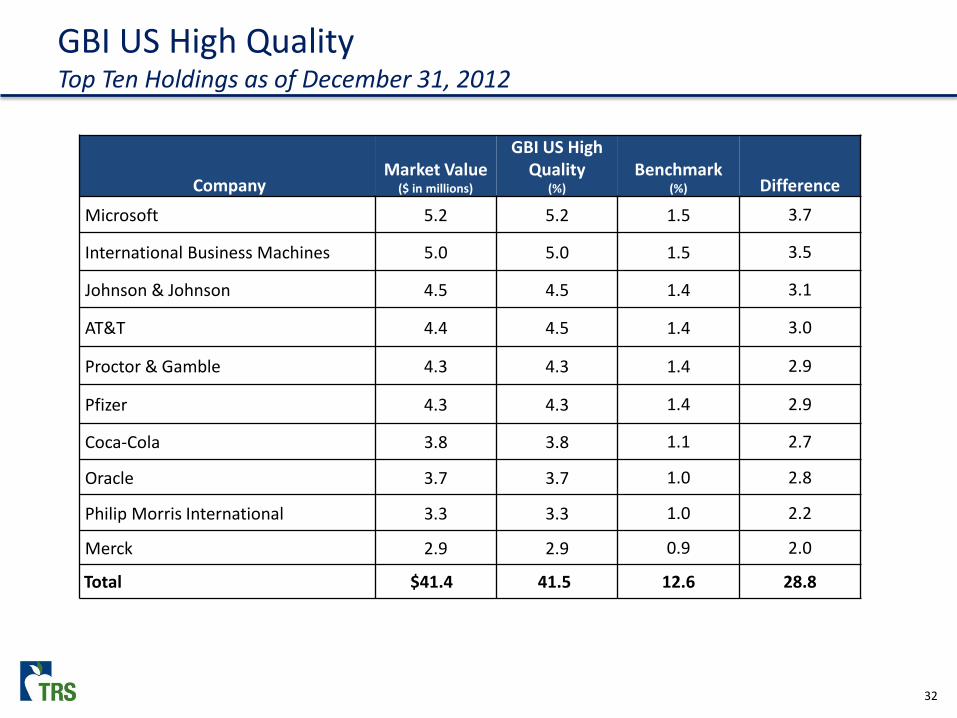
GBI US High Quality Top Ten Holdings as of December 31, 2012
Company Market Value
($ in millions)
GBI US High Quality
(%) Benchmark
(%) Difference
Microsoft 5.2 5.2 1.5 3.7
International Business Machines 5.0 5.0 1.5 3.5
Johnson & Johnson 4.5 4.5 1.4 3.1
AT&T 4.4 4.5 1.4 3.0
Proctor & Gamble 4.3 4.3 1.4 2.9
Pfizer 4.3 4.3 1.4 2.9
Coca-Cola 3.8 3.8 1.1 2.7
Oracle 3.7 3.7 1.0 2.8
Philip Morris International 3.3 3.3 1.0 2.2
Merck 2.9 2.9 0.9 2.0
Total $41.4 41.5 12.6 28.8
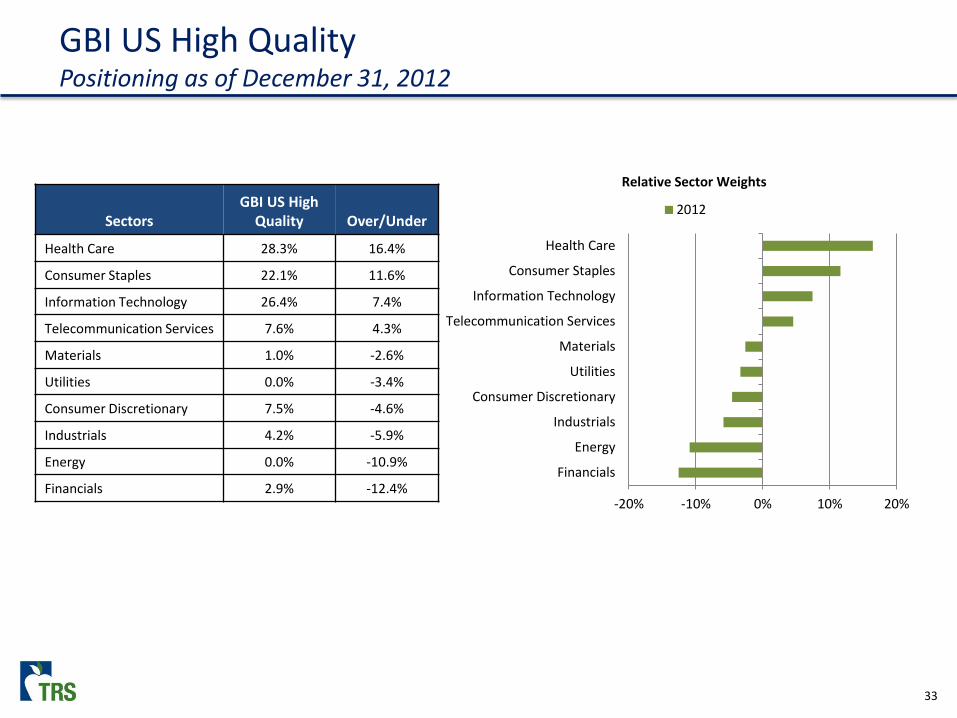
33
Sectors GBI US High
Quality Over/Under
Health Care 28.3% 16.4%
Consumer Staples 22.1% 11.6%
Information Technology 26.4% 7.4%
Telecommunication Services 7.6% 4.3%
Materials 1.0% -2.6%
Utilities 0.0% -3.4%
Consumer Discretionary 7.5% -4.6%
Industrials 4.2% -5.9%
Energy 0.0% -10.9%
Financials 2.9% -12.4%
GBI US High Quality Positioning as of December 31, 2012
Relative Sector Weights
-20% -10% 0% 10% 20%
Financials
Energy
Industrials
Consumer Discretionary
Utilities
Materials
Telecommunication Services
Information Technology
Consumer Staples
Health Care
2012

34
Relative Attractiveness of High vs. Low Quality
APPENDIX GBI GOLD

36
GBI Gold Performance as of December 31, 2012
Year AUM
($ in millions) Investment Return
(%) Alpha
(bps)
2012 816 2.0 233
2011 705 -5.8 248
2010 491 35.3 57
2009* 266 5.2 -3
Notes Benchmark: 35% Gold ETF (GLD), 15% Silver ETF (SLV), and 50% Precious Metals Equities Index (based on XAU Index) *Inception: October 2009
Annualized Investment Return
(%) Alpha
(bps) Tracking Error Information Ratio
1-Year 2.0 233 2.5% 0.9
3-Year 9.1 195 2.2% 0.9
Since Inception 10.1 181 2.1% 0.9
37
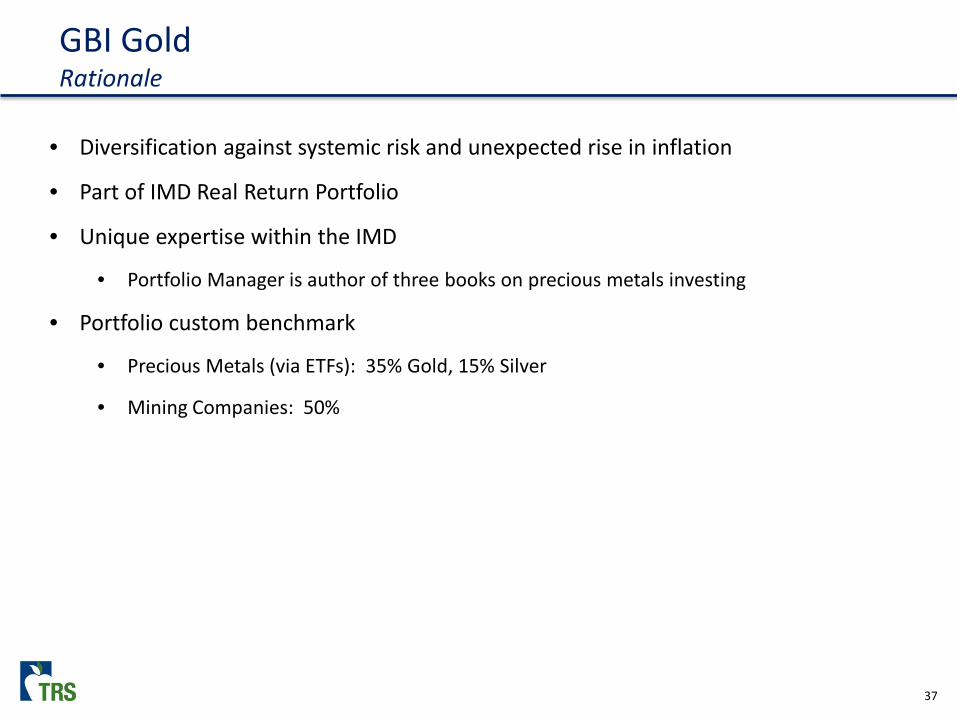
GBI Gold Rationale
• Diversification against systemic risk and unexpected rise in inflation
• Part of IMD Real Return Portfolio
• Unique expertise within the IMD
• Portfolio Manager is author of three books on precious metals investing
• Portfolio custom benchmark
• Precious Metals (via ETFs): 35% Gold, 15% Silver
• Mining Companies: 50%

38
GBI Gold Positioning as of December 31, 2012
Company Market Value
($ in millions) GBI Gold Fund
(%) Benchmark
(%) Difference
SPDR Gold Trust ETF 290.6 35.6 35.0 0.6
iShares Silver Trust ETF 121.2 14.9 15.0 -0.2
GoldCorp 46.8 5.7 3.9 1.9
New Gold 34.0 4.2 2.1 2.0
Silver Wheaton 33.9 4.2 2.0 2.1
Randgold Resources 25.1 3.1 1.9 1.2
Allied Nevada Gold 22.3 2.7 1.3 1.5
Detour Gold 21.6 2.6 0.0 2.6
Gold Fields 18.7 2.3 1.6 0.8
First Majestic Silver 16.9 2.1 0.0 2.1
Total $631.1 77.3 62.7 14.6
• TRS is the 14th largest institutional holder of GLD • TRS is the largest institutional holder of SLV

39
Debt to GDP Continues to Rise Globally
Source: Morgan Stanley
0
50
100
150
200
250
300
1917 1927 1937 1947 1957 1967 1977 1987 1997 2007
US DEBT/GDP
TOTAL GOVERNMENT
% of GDP
50
100
150
200
250
300
1999 2001 2003 2005 2007 2009 2011 2013
EUROPE DEBT/GDP
TOTAL GOVERNMENT
% of GDP
0
50
100
150
200
250
300
350
400
450
1981 1985 1989 1993 1997 2001 2005 2009 2013
JAPAN DEBT/GDP
TOTAL GOVERNMENT
% of GDP
0
50
100
150
200
250
300
1987 1991 1995 1999 2003 2007 2011
UK DEBT/GDP
TOTAL GOVERNMENT
% of GDP
253
92 98
270
390
221
277
96

APPENDIX ACCOMPLISHMENTS, PRIORITIES & COLLABORATION

41
IPM Accomplishments and Priorities
2012 Accomplishments
• Integrated Trust TAA models into GBI Process
• Communicated the GBI investment philosophy and framework to the IMD Management Committee
• Completed a factor exposure review for GBI relative exposure to high quality, value, small cap, and momentum
• Implemented an external manager signal report for US stocks
2013 Priorities
• Develop a road map for the GBI 2017 vision
• Expand the Quant platform
• Develop and implement the process for a GBI Alpha Opportunity platform
• Partner with State Street on the evaluation of flow indicators

42
Trust-Wide Collaboration
• Performed valuation and industry analysis for 19 investment opportunities with the Private Equity and Real Assets groups
• Provided global industry analysis for other areas of the Trust • Designed quantitative factor portfolios • Developed the European Crisis Monitor • Participated in investment task forces
• Europe • Hard assets • Residential housing
• Hosted IPM global industry investment symposia bringing in the best and the brightest to discuss
• US Financials • Global Energy
• Global Technology • Emerging Market Consumer
• Gold

APPENDIX IPM 2017 AND TRUST-WIDE INITIATIVES

44
IPM Timeline
2008 Global Best Ideas portfolio fully funded. The four equity portfolios were consolidated into GBI. Fixed income portfolios were moved to passive management. Five of the original six portfolios exceeded their benchmark returns.
2007 Internal Public Markets was established to manage four equity portfolios and two fixed income portfolios. Legacy domestic equity and international equity teams are consolidated into a single global equity platform.
2009 GBI Gold and GBI Quantitative Platform launched.
2011 US High Quality R&D portfolio.
2008 Global Best Ideas portfolio fully funded. The four equity portfolios were consolidated into GBI. Fixed income portfolios were moved to passive management. Five of the original six portfolios exceeded their benchmark returns.
IPM 2017 Expand GBI Quant and launch GBI Alpha Opportunity.
2007 Britt Harris joined TRS as Chief Investment Officer.

45
IPM 2017
• Expanding Quantitative Platform within GBI Flagship
• Positive Alpha Contribution
• Low Correlation
• Better Long-term Diversification
• Collaborate with other IMD Units
• Low Vol with Overlay (Risk Group)
• GBI Alpha Opportunity (Private Markets and External Public)

46
Trust-wide Portfolios and Initiatives Low Vol with Overlay
• Launched January 1, 2013 at $100 million
• Collaborative project with the Risk Group
• Benchmark: MSCI USA
• Combines Low Vol Factor Portfolio with Put Selling Risk Premium
-2.5%-2.0%-1.5%-1.0%-0.5%0.0%0.5%1.0%1.5%2.0%2.5%
Exce
ss M
onth
ly R
etur
n (L
VWO
)
MSCI USA Monthly Return
Expected Monthly Excess Return Profile of LVWO
65.4% frequency2.3% frequency 32.4% frequency
Live Performance
Assumptions: Equity beta of 0.70 (long-term beta assumption), option premium of 103bps, 4.2% strike (historical average since 2006), 2% annualized expected low volatility risk premium. Historical frequencies using S&P 500 monthly returns since 1928.

47
• Pre-IPO Commitments
• Investment in companies prior to their initial public offering
• Harvest illiquidity premium through negotiated discount
• PIPE Transactions
• Private investment in public equity
• Capture discount to current market price because company avoids costs of the public offering process
GBI Alpha Opportunity Representative Due Diligence
APPENDIX SUMMARY

49
Summary Internal Active Equity Portfolio Management
• GBI is performing above targets
• Fulfilling its role in the Trust’s overall strategy
• Expanding size of quantitative portfolios
• Other Internal Portfolios are meeting Trust goals
• Gold: Alpha and diversification
• US High Quality: Tactical and diversifying
• Collaboration across the IMD is effective and increasing
• 2017 plans are being developed
• Risk premium strategies, e.g., Low Vol with Overlay (jointly managed with Risk Group)
• GBI Alpha Opportunity (with External Public and Private Equity Teams)

APPENDIX

51
GBI Flagship STAR Report Monthly Data from 12/07 to 12/12
Cumulative Performance:
Annualized Performance:
Risk Summary:
Performance by Period (Inception: 12/19/07)
Performance by Year:
12/31/07
End Date:12/31/12
Period
N/A
0.74
Hit Rt Up
55.62%(46.77%)
0.94%1.41%
0.33%0.28%
0.320.30
0.04%0.65%
0.59%
N/A
1.10
-0.220.98
Statistical Tracking And Reporting (STAR) Report
SortinoHit Rt DnHit Rt Tot0.99
0.57%
(0.01)0.36
Up CaptureDown Capture
SkewKurtosis
Info. RatioM2 Premium
Best 12 MthsWorst 12 Mths
Start Date:
68.99%(46.92%)
58.12%(48.21%)
52%0.42-0.10%
Sharpe (0.03)Treynor
5-year10-year
Inception
64%57%
5% hVar (0.64%)
3-monthYTD
1-year2-year3-year
VFB T.E. I.R.
0.36N/A
1.05%
0.49%0.26%0.38%(0.01%)
(0.68%)21.44%11.80%(19.82%)
0.59%(0.27%)(0.71%)0.35%
(0.61)
69.00%(46.23%)
B'mark
16.78%
2.92%16.78%
2.88%16.13%16.13%3.73%6.63%
Portfolio
(0.65%)N/A
(0.09%)
Year2007
2011
34.63%12.67%
2012(7.35%)
0.77%0.16%0.07%0.65%
20092010
35.40%12.83%(7.27%)16.78% 16.13%
(0.09%)21.17%
0.52%1.41%0.95%(1.14%)
11.10%(19.47%)
2008
(0.68%)
(1.16%)
Portfolio2.82%
4.06%6.91%
0.65%
ReturnSt. Dev.Best MonthWorst Month
BetaJensen's alpha
0.70(0.62)
Valuation ModelOverall Performance (Since Inception 12/19/07)
PeriodsR-Squared
6199.6%
Diff Ex. Ret. Risk Free
(0.5%)(3.4%)2.9%
PortfolioBenchmark
1.4%Excess Return Tracking Error
B'markPortfolio
0.59% 1.41%
0.51%
0.42N/A
Excess
0.72%2.39%
(42.21%)0.43%
(41.49%)
B'mark
GBI Flagship vs. MS ACWI FREE (NET)
0%
10%
20%
30%
40%
50%
60%
70%
80%
90%
100%
-60%
-50%
-40%
-30%
-20%
-10%
0%
10%
1211100908
Drawdowns (Absolute)
Largest Drawdown: 50.80%, Peak to Trough
-15%
-10%
-5%
0%
5%
10%
15%
-15% -10% -5% 0% 5% 10% 15%
Monthly Returns vs. Benchmark
2012 2011 2010 Best Fit
-1.5%
-1.0%
-0.5%
0.0%
0.5%
1.0%
1.5%
1211100908
Monthly Excess Returns
Avg. Monthly Excess Return: 0.04%
0.0%
0.1%
0.2%
0.3%
0.4%
0.5%
0.6%
0.7%
0.8%
0.9%
07 08 09 10 11 12
Annual Excess Returns
-4%
-2%
0%
2%
4%
6%
8%
1211100908
Cumulative Excess Returns vs Expectations
Ann. Expected Ex. Ret: 0.5%, Ann. Expected T.E.: 1.0%
Monthly Data from 12/07 to 12/12
Hit Rate Analysis:
Hit Rate During Various Environments:
Statistical Tracking And Reporting (STAR) Report
Hit Rate
PeriodsHit RateAvg Ex Ret
33 51.5%Periods
0.10%All Periods
17
Value/ Growth
Periods
2861
64.3%57.4%
Benchmark UpBenchmark Down
Hit Rate
81.8%0.49%
Growth Outperf.
20
Small Outperf.
(0.02%)Neutral
29
56.8%37
0.04%
US Outperf.
Global Outperf.
Neutral
Periods
Avg Ex Ret
1693.8%0.40%
Growth Outperf.
11
US/ Intl Bonds
(0.00%)
33.3%(0.03%)
69.0%0.08%
Avg Ex Ret
Value Outperf.
28
Neutral
57.1%0.02%
Sm Value/ Sm Growt
23.5%(0.25%)
Hit Rate
Neutral
1338.5%
(0.15%)
12
Large Outperf.
Value Outperf.
Periods
Avg Ex RetEquity Size
High Yield
1963.2%0.04%
2853.6%
(0.01%)Hit RateAvg Ex Ret
Periods 14
Neutral
57.1%0.16%
Core Outperf.
Core/ High Yield
55.0%0.04%
Neutral
20 20
75.0% 58.3%
18
Avg Ex RetStocks/ Bonds
0.06% 0.03%55.6%0.05%
16 2755.6%
Neutral
US/ Intl Stocks
Periods
51.7%
21
Hit Rate 62.5%
29Periods
GBI Flagship vs. MS ACWI FREE (NET)
(0.03%)
Hit RateAvg Ex Ret
Hit RateAvg Ex Ret
Bonds Outperf.
Intl. Outperf.
Stocks Outperf.
US Outperf.
(0.02%) 0.05% 0.12%
52.4%(0.08%)
75.0%0.26%
45.0%
8 24
-8.0
-7.0
-6.0
-5.0
-4.0
-3.0
-2.0
-1.0
0.0
12111009
CUSUM Information Ratio Alarm
Current CUSUM Value: -2.46
0%
1%
1%
2%
2%
3%
3%
12111009
Annualized Tracking Error (12-Month Rolling)
-2%
-2%
-1%
-1%
0%
1%
1%
12111009
Annualized Excess Manager Volatility (12-Month Rolling)
-0.2
0.0
0.2
0.4
0.6
0.8
1.0Trend Deviation: 60 Month Rolling
No Active Signal
0 0 0 0 0 0 0 0 0 1
25
35
0 0 0 0 0 0 0 0 0 00
5
10
15
20
25
30
35
40
< -1
0-1
0 to
-9-9
to -8
-8 to
-7-7
to -6
-6 to
-5-5
to -4
-4 to
-3-3
to -2
-2 to
-1-1
to 0
0 to
11
to 2
2 to
33
to 4
4 to
55
to 6
6 to
77
to 8
8 to
99
to 1
0>=
10
Distribution of Excess Returns
-1.0
-0.5
0.0
0.5
1.0
1.5
2.0Trend Deviation: 12 Month Momentum
No Active Signal

52
GBI Gold Fund STAR Report Monthly Data from 10/09 to 12/12
Cumulative Performance:
Annualized Performance:
Risk Summary:
Performance by Period (Inception: 10/31/09)
Performance by Year:
10/31/09
End Date:12/31/12
Period
N/A
(0.54)
Hit Rt Up
42.51%(18.67%)
2.32%N/A
2.41%1.95%
0.860.84
(0.24%)2.33%
2.46%
N/A
0.94
0.521.20
Statistical Tracking And Reporting (STAR) Report
SortinoHit Rt DnHit Rt Tot1.05
1.41%
0.100.33
Up CaptureDown Capture
SkewKurtosis
Info. RatioM2 Premium
Best 12 MthsWorst 12 Mths
Start Date:
104.18%(52.33%)
38.08%(18.67%)
77%0.819.63%
Sharpe 0.38Treynor
5-year10-year
Inception
47%64%
5% hVar (0.92%)
3-monthYTD
1-year2-year3-year
VFB T.E. I.R.
N/AN/A
2.81%
0.09%0.02%0.02%(0.01%)
8.30%24.93%15.03%(15.71%)
1.81%1.26%(0.04%)(1.16%)
(0.22)
112.59%(53.00%)
B'mark
1.99%
(10.71%)1.99%
(10.47%)(0.33%)(0.33%)(4.38%)7.19%
Portfolio
N/AN/A
10.11%
Year2009
(8.27%)(0.33%)
2.48%2.33%
20112012
(5.79%)1.99%
10.11%26.19%
1.97%2.23%1.81%(1.21%)
15.00%(16.88%)
2010
8.30%
N/A
Portfolio5.19%
(1.97%)9.14%
2.33%
ReturnSt. Dev.Best MonthWorst Month
BetaJensen's alpha
(0.53)(0.21)
Valuation ModelOverall Performance (Since Inception 10/31/09)
PeriodsR-Squared
3999.5%
Diff Ex. Ret. Risk Free
36.8%29.6%7.2%
PortfolioBenchmark
2.2%Excess Return Tracking Error
B'markPortfolio
1.81% 2.23%
N/A
0.81N/A
Excess
0.57%5.21%
34.73%(0.03%)
35.30%
B'mark
Gold Fund vs. Gold Fund Benchmark
0%
10%
20%
30%
40%
50%
60%
70%
80%
90%
100%
-10%
0%
10%
20%
30%
40%
50%
60%
70%
80%
121110
Drawdowns (Absolute)
Largest Drawdown: 26.78%, Peak to Trough
-20%
-15%
-10%
-5%
0%
5%
10%
15%
20%
-20% -15% -10% -5% 0% 5% 10% 15%
Monthly Returns vs. Benchmark
2012 2011 2010 Best Fit
-1.5%
-1.0%
-0.5%
0.0%
0.5%
1.0%
1.5%
2.0%
121110
Monthly Excess Returns
Avg. Monthly Excess Return: 0.16%
-0.5%
0.0%
0.5%
1.0%
1.5%
2.0%
2.5%
3.0%
09 10 11 12
Annual Excess Returns
-3%
-2%
-1%
0%
1%
2%
3%
4%
5%
6%
7%
8%
121110
Cumulative Excess Returns vs Expectations
Ann. Expected Ex. Ret: 0.5%, Ann. Expected T.E.: 1.0%
Monthly Data from 10/09 to 12/12
Hit Rate Analysis:
Hit Rate During Various Environments:
Statistical Tracking And Reporting (STAR) Report
Hit Rate
PeriodsHit RateAvg Ex Ret
22 77.3%Periods
(0.10%)All Periods
8
Value/ Growth
Periods
1739
47.1%64.1%
Benchmark UpBenchmark Down
Hit Rate
80.0%0.28%
Growth Outperf.
11
Small Outperf.
0.16%Neutral
21
61.3%31
0.16%
US Outperf.
Global Outperf.
Neutral
Periods
Avg Ex Ret
1060.0%0.21%
Growth Outperf.
5
US/ Intl Bonds
0.37%
57.1%0.26%
52.4%0.04%
Avg Ex Ret
Value Outperf.
21
Neutral
66.7%0.24%
Sm Value/ Sm Growt
62.5%(0.09%)
Hit Rate
Neutral
366.7%0.04%
7
Large Outperf.
Value Outperf.
Periods
Avg Ex RetEquity Size
High Yield
1546.7%0.10%
1888.9%0.38%
Hit RateAvg Ex Ret
Periods 6
Neutral
33.3%(0.32%)
Core Outperf.
Core/ High Yield
90.9%0.34%
Neutral
13 12
80.0% 38.5%
10
Avg Ex RetStocks/ Bonds
(0.33%) 0.29%80.0%0.42%
10 1957.9%
Neutral
US/ Intl Stocks
Periods
76.2%
14
Hit Rate 60.0%
21Periods
Gold Fund vs. Gold Fund Benchmark
0.16%
Hit RateAvg Ex Ret
Hit RateAvg Ex Ret
Bonds Outperf.
Intl. Outperf.
Stocks Outperf.
US Outperf.
0.31% 0.31% (0.13%)
50.0%(0.14%)
76.9%0.50%
66.7%
5 13
-8.0
-7.0
-6.0
-5.0
-4.0
-3.0
-2.0
-1.0
0.0
1211
CUSUM Information Ratio Alarm
Current CUSUM Value: -1.02
0%
1%
1%
2%
2%
3%
3%
4%
1211
Annualized Tracking Error (12-Month Rolling)
-1%
0%
1%
1%
2%
2%
3%
3%
1211
Annualized Excess Manager Volatility (12-Month Rolling)
Trend Deviation: 60 Month Rolling
No Active Signal
0 0 0 0 0 0 0 0 0
2
12
21
4
0 0 0 0 0 0 0 0 00
5
10
15
20
25
< -1
0-1
0 to
-9-9
to -8
-8 to
-7-7
to -6
-6 to
-5-5
to -4
-4 to
-3-3
to -2
-2 to
-1-1
to 0
0 to
11
to 2
2 to
33
to 4
4 to
55
to 6
6 to
77
to 8
8 to
99
to 1
0>=
10
Distribution of Excess Returns
Trend Deviation: 12 Month Momentum
No Active Signal

Trading Annual Review
Bernie Bozzelli Senior Director for Trading

2
• Mandate
• Team Profile
• Who We Serve
• Trading Partner Network
• Broker Certification
• Equity Trading Performance
• Transition Management
• Foreign Exchange
• Passive Portfolio Management
• Strategic Beta
• 2012 Priorities Update
• 2013 Priorities
• Appendix

3
Trading Mandate
Implementation
• Global execution across multiple asset classes including equities, futures, forwards, options, treasuries, TIPS, and foreign exchange
• Manage a global network of 44 brokerage firms
• Monitor key variables that contribute to trading include volatility, liquidity, and market structure
• Multi-asset execution totaled $285 billion for 2012 (Futures and forwards monthly/quarterly roll process is biggest contributor)
• Outperformed the median equity trading desk by eight basis points in 2012, retaining $29.3 million of TRS alpha which placed TRS in the first quartile versus our peer universe. TRS trading has placed in the first quartile in four of the last five years
Index Management
• Passive Management
• Long Treasuries – $13.2 billion
• US TIPS – $5.7 billion
• Approximately $2 billion in LCV, LCG, SC, EAFE+Can, and Emerging Markets
• Benchmark indices are fully replicated in the portfolio in real-time to achieve tight tracking error and in-line performance
Market Intelligence
• Collaborate across the division to provide implementation solutions. Work with SAA, TAA, IPM and EPU to develop optimal implementation strategies
• Examples include assessing the market impact of a trade, transition management between external managers, short-term technical model to aid in the timing of execution, Foreign Exchange (FX) hedging analysis and Options Analysis

4
Trading Team Bernie Bozzelli, CFA Senior Director MPA, Accounting, UT Austin 18 years TRS
Jaime Llano US Equity, Futures and Currency BS, Finance, UT Austin MBA, Finance, St. Edwards 8 years TRS 14 years experience
Demetrius Pope Global Equity - Europe BBA, Sam Houston 6 years TRS 12 years experience
Pat Barker Trading Analyst 24 years TRS 36 years experience
Scott Moore Global Equity - Asia MBA, Thunderbird University 9 years TRS 35 years experience
Komson Silapachai, CFA US Equity, LATAM, Canada and Fixed Income BS, Finance, Texas A&M 6 years TRS 6 years experience
Babette Ruiz Team Support 2 years TRS 15 years experience
Steve Peterson US Equity and Fixed Income MBA, California Lutheran University 5 years TRS 18 years experience
Jared Morris, CFA US Equity and Futures BBA, Accounting, Texas A&M MS, Finance, Texas A&M 2 years TRS 7 years experience
3 MBA’s 3 CFA’s 1 Masters of Accounting 1 MS, Finance 16 Years Average Experience
5
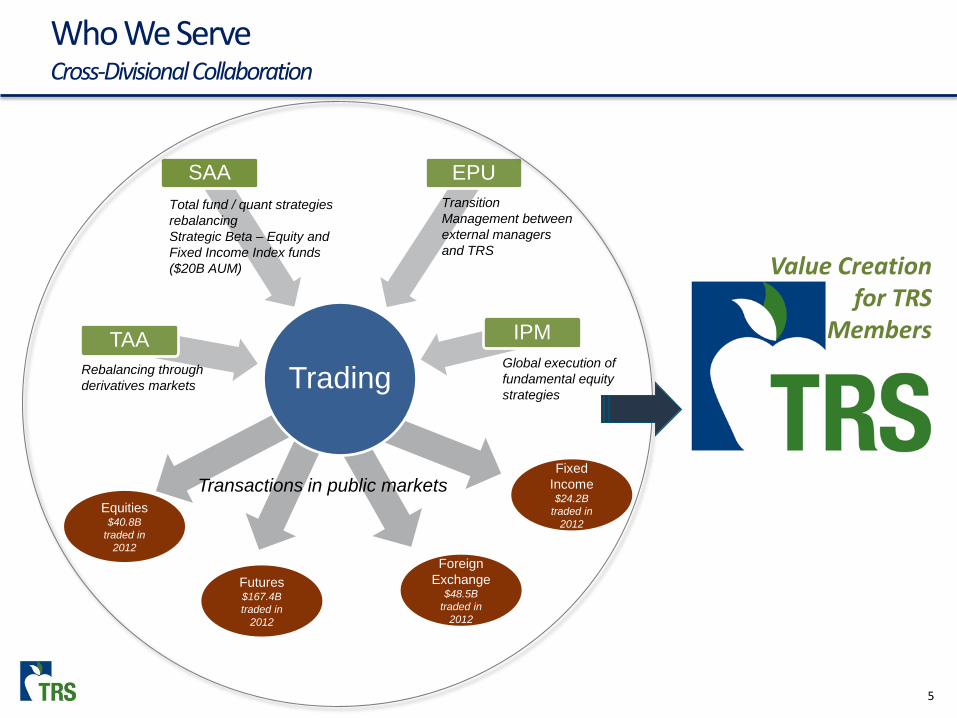
Who We Serve Cross-Divisional Collaboration
Trading TAA
SAA EPU
IPM
Total fund / quant strategies rebalancing Strategic Beta – Equity and Fixed Income Index funds ($20B AUM)
Transition Management between external managers and TRS
Global execution of fundamental equity strategies
Rebalancing through derivatives markets
Equities $40.8B
traded in 2012
Futures $167.4B traded in
2012
Fixed Income $24.2B
traded in 2012
Transactions in public markets
Foreign Exchange
$48.5B traded in
2012
Value Creation for TRS
Members

6
Trading Partner Network
4 Firms • Deliver focused and high capacity relationships globally and across all asset
classes • Highly integrated with TRS trading, risk management, administrative systems, etc. • Leading providers of investment services – TRS is a preferred client, receiving the
highest level of service available
6 Firms • Well established firms with overall world class global services capabilities • World renowned for research and technology • Best-of-breed product process development
27 Firms • Includes firms who have a specialty in finding liquidity for hard-to-trade names or
firms who have a niche in electronic trading • Firms who have a core competency of trading internationally in particular regions
are also included
7 Firms • All newly approved firms doing business with TRS

7
Broker Certification Process
Phase 1 - Certification Process for New Firms
Procedures for New Firms • Broker Qualifications Questionnaire • Minimum Standard Requirements • 6 to 12 Month Process
Evaluation Period • Identify Valued Services • TCA review • Recommendations • Category Fit
Annual Review • Adds/Deletions • Promotions/Demotions • Qualitative Review • On-Site Visit
Certification Process • Senior Management Review
If acceptable, then … Phase 2 - Broker added to Pilot Program
Pilot Program • Pilot brokers evaluated quarterly using same criteria as all TRS brokers
Quarterly Review Process • Trader vote • Transaction cost analysis • Guidelines established • Quarterly report card to each broker
Two Year Process • Pilot brokers have up to 2 year evaluation process to qualify for advancement to execution category
Completion of Pilot Program • Advance to execution /core category or remove from broker list • Broker has opportunity to advance based on performance after 1 year
8
Equity Trading Performance
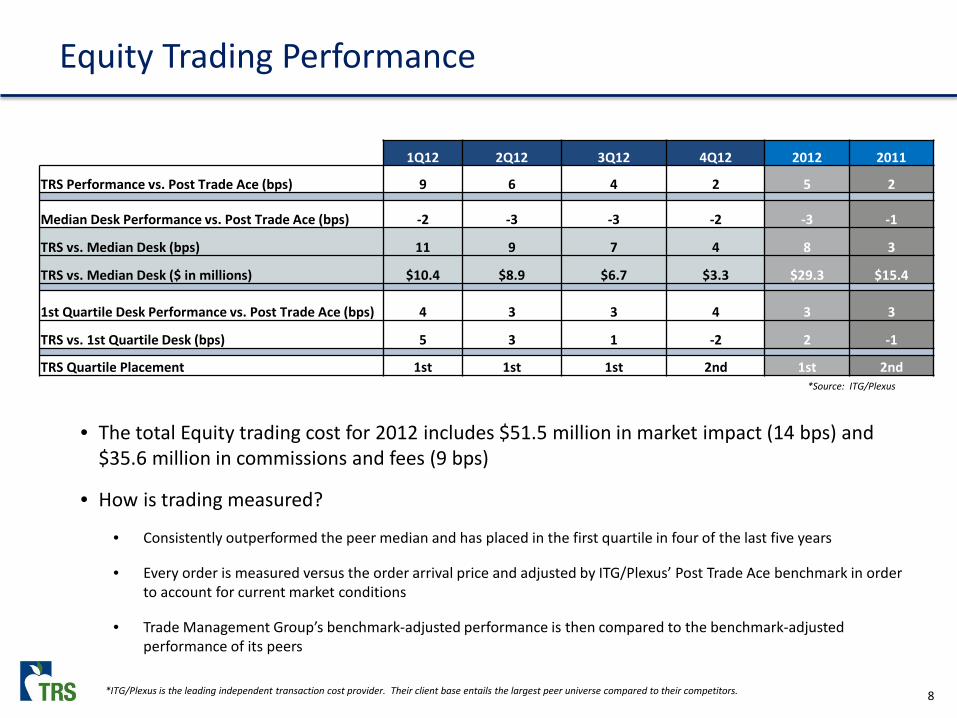
1Q12 2Q12 3Q12 4Q12 2012 2011
TRS Performance vs. Post Trade Ace (bps) 9 6 4 2 5 2
Median Desk Performance vs. Post Trade Ace (bps) -2 -3 -3 -2 -3 -1
TRS vs. Median Desk (bps) 11 9 7 4 8 3
TRS vs. Median Desk ($ in millions) $10.4 $8.9 $6.7 $3.3 $29.3 $15.4
1st Quartile Desk Performance vs. Post Trade Ace (bps) 4 3 3 4 3 3
TRS vs. 1st Quartile Desk (bps) 5 3 1 -2 2 -1
TRS Quartile Placement 1st 1st 1st 2nd 1st 2nd
• The total Equity trading cost for 2012 includes $51.5 million in market impact (14 bps) and $35.6 million in commissions and fees (9 bps)
• How is trading measured?
• Consistently outperformed the peer median and has placed in the first quartile in four of the last five years
• Every order is measured versus the order arrival price and adjusted by ITG/Plexus’ Post Trade Ace benchmark in order to account for current market conditions
• Trade Management Group’s benchmark-adjusted performance is then compared to the benchmark-adjusted performance of its peers
*Source: ITG/Plexus
*ITG/Plexus is the leading independent transaction cost provider. Their client base entails the largest peer universe compared to their competitors.

9
Transition Management Process
TRANSITION • Open New Accounts
• Certify Holdings
• Pre-Trade Cost Estimate
• Identify Internal Transfers
• Establish Trade Plan and Timeline
• Identify Non-Transferable Securities
• Execute the Trade
• Trade Settlement
• External Manager Wish List Versus Actual Funding List
• Post-Trade Analysis
• Discuss Realized Costs Versus Estimated Costs
External Manager D
$150M
Emerging Markets (300 Stocks)
External Manager C
$150M
Emerging Markets (75 Stocks)
External Manager B
$150M
Emerging Markets (125 Stocks)
Cash
$25M
Internal Passive
Portfolio
$175M Emerging Markets
(832 Stocks)
External Manager A
$250M
Emerging Markets (80 Stocks)
10
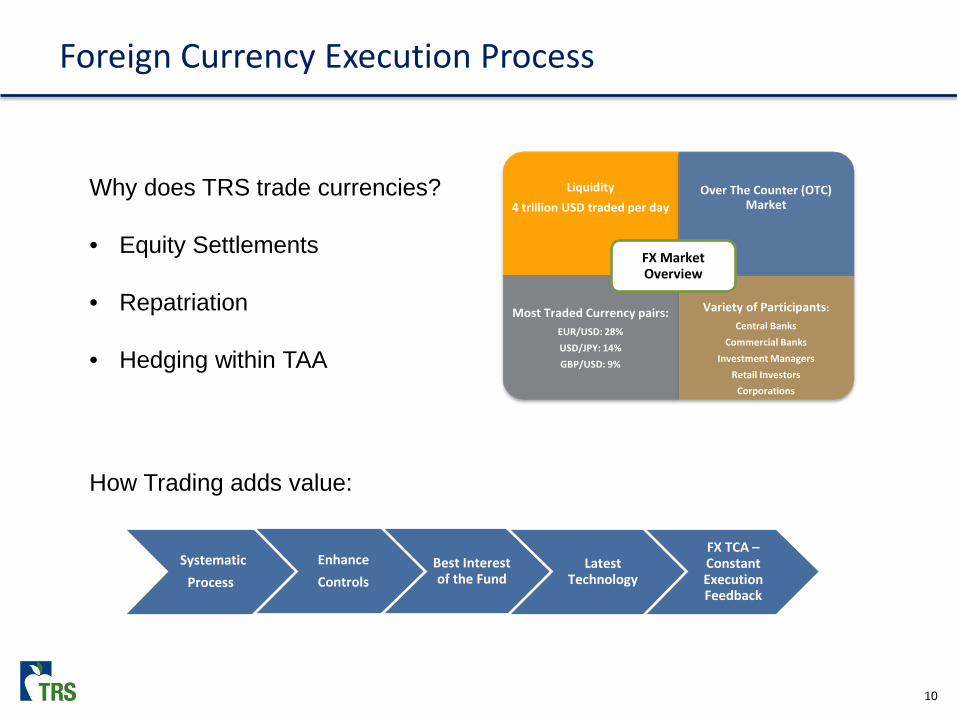
Systematic Process
Enhance Controls
Best Interest of the Fund
Latest Technology
FX TCA – Constant Execution Feedback
Foreign Currency Execution Process
Liquidity 4 trillion USD traded per day
Over The Counter (OTC) Market
Most Traded Currency pairs: EUR/USD: 28% USD/JPY: 14% GBP/USD: 9%
Variety of Participants:
Central Banks Commercial Banks
Investment Managers Retail Investors
Corporations
FX Market Overview
Why does TRS trade currencies? • Equity Settlements • Repatriation • Hedging within TAA
How Trading adds value:

11
Portfolio Management: Strategic Beta Treasuries and TIPS
• “Strategic Beta” mandate – Manage to a minimum tracking error/maximize information ratio objective
• Treasuries and TIPS portfolios are actively managed along with the Strategic Asset Allocation (SAA) team with low tracking error
Percent of Trust 2012 Return Value Added Tracking Error Information
Ratio
Long Treasuries 12% 4.2% 0.6% 0.2% 2.7 TIPS 5% 7.1% 0.2% 0.3% 0.8
High Information Ratio Opportunity Identified in US Yield Curve
Authorized Investment Professional Enters Fixed Income Trades
Access to the Largest Primary Dealers for Liquidity
Real-time Monitoring and Risk Management
World-Class Customized Fixed Income Analytics and Risk Management
Deep Relationships with Trading Partners
Cross-IMD Collaboration and Expertise
How Trading adds value:

12
2012 Priorities Update
# Priority Results
1 Enhanced Counterparty Communication
• Internally developed and implemented a TRS-specific quarterly evaluation template
• Features a combined review of Equities, Futures, Fixed Income and Foreign Exchange
• Improved communication with trading partners via web portal
2 Training & Best Practices
• Completed approximately 400 hours of comprehensive training with an emphasis on Futures and Foreign Exchange through courses held at TRS, external formal classes and meetings. Formal classes included:
• Advanced Initiatives in Fixed Income Trading
• Chicago Mercantile Exchange (CME) School of Futures
• Trade Tech in New York and Europe
• International Trader Forum
3 CSA on Futures • Investment policy approved to apply Commission Sharing Arrangement (CSA)
• Collaborated with Investment Operations to implement processes and technology
• Generated an estimated $3.5 million CSA
4 Trade Strategy Development
• Equities – Implemented equity trading strategies unique to manager style based on momentum, timeframe and order size
• Futures – Trading style customized for each account to minimize performance gaps that occur due to monthly rebalancing. In addition, we developed “queue position” and “flow analysis” strategies to achieve best execution
• Passive – Improved execution strategies for Market On Close “MOC” type orders. Enhanced relative index performance through increased monitoring of corporate actions

13
2013 Priorities
# Priority Objective
1 Commission Restructure • Enhance commission restructure throughout trading operation, focusing on futures and related products, Market On Close “MOC” orders, and algorithmic trading to lower cost
• Optimize commission schedule to reduce costs while generating appropriate levels of CSA to meet obligations
2 Advance Electronic Futures & FX Trading
• Implement Bloomberg Tradebook platform to enhance the level of direct market interaction over futures trades
• Execute at a lower overall commission rate
3 Enhance Management of Treasuries/TIPS Index Fund
• Develop a “Texas Way” analytic system for risk management, valuation and monitoring of Long Treasuries and TIPS
• Leverage TRS’ network of investors to enhance internal fixed income capabilities
4 Re-Branding • Expand understanding of the role and functions of the Trading group across the IMD through enhanced reporting and quarterly “Lunch & Learns”

APPENDIX
15
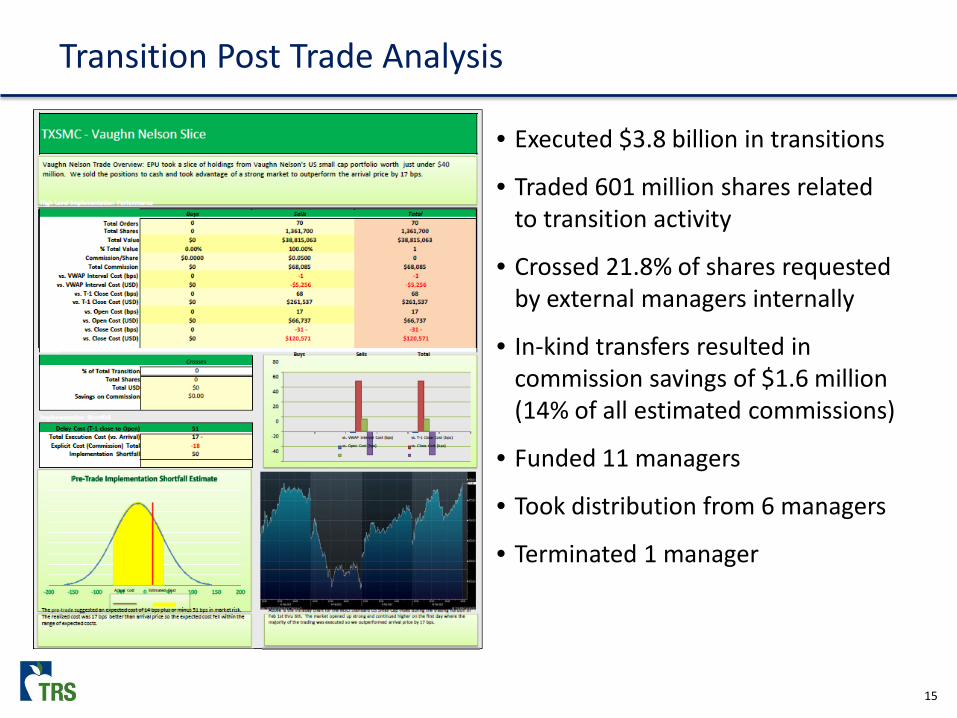
Transition Post Trade Analysis
• Executed $3.8 billion in transitions
• Traded 601 million shares related to transition activity
• Crossed 21.8% of shares requested by external managers internally
• In-kind transfers resulted in commission savings of $1.6 million (14% of all estimated commissions)
• Funded 11 managers
• Took distribution from 6 managers
• Terminated 1 manager

16
Market Intelligence Technical Analysis