international journal of scientific & … journal of scientific & technology research volume...
TRANSCRIPT

INTERNATIONAL JOURNAL OF SCIENTIFIC & TECHNOLOGY RESEARCH VOLUME 2, ISSUE 10, OCTOBER 2013 ISSN 2277-8616
253 IJSTR©2013 www.ijstr.org
Determinants Of Dividend Payout Policy Among Non-Financial Firms On Nairobi Securities
Exchange, Kenya.
Maniagi G. Musiega, Dr. Ondiek B. Alala, Dr. Musiega Douglas, Maokomba O. Christopher, Dr. Egessa Robert
ABSTRACT: The research paper examines determinants among dividend payout of non-financial firms listed on Nairobi Securities Exchange. The NSE has 50 listed non-financial companies as per NSE 2012 report. Purposive sampling technique was used anda sample of 30 non-financial companies for duration of five years from 2007 to 2011 was selected. Secondary data was collected from audited financial statements of companies from Nairobi Securities Exchange website and the websites of non-financial firms‘ .Dividend payout ratio was dependent variable while independent variables were profitability, Growth, current earnings, and liquidity. Size and business risk was taken as moderating variables. Descriptive statistics and multiple regressions were used. Return on equity current earnings and firms‘ growth activities were found to be positively correlated to dividend payout Business risk and size,both the two taken as moderating variables increase the precision of significant variables from 95% to 99% hence among major determinants of dividend payout. Key words; Dividend Policy, Homoscedasticity, Durbin Watson, Nairobi securities exchange,
————————————————————
1.1 Background to the study Earnings distributed to shareholders are called dividend (Pandey 2004). In Kenya shareholders cannot increase the amount of dividend as declared by directors but have power to reduce. Profits made by corporation can either be re-invested or be distributed as dividend to stockholders. Each company formulates its own policies as regards dividend. This mostly is determined by many factors and conditions prevailing during that period. Many corporations retain part of their earnings for capitalization purpose while pay the remainder as dividend Researchers have provided considerable attention and thought to solve dividend puzzle resulting in number of conflicting hypothesis theories and explanations (Alkuwari 2009). Most researchers have focused on developed markets eg. USA, Britain, Japan etc. with little or no attention placed on developing or less developed economies.
The findings of the developed economies may not be directly applied to developing economies like Kenya due to differences in regulations, culture environment and nature of investors Many dividend theories have been advanced and tend to explain how dividend decisions are arrived at and whether they have an impact on the value of a firm. Different approaches here include the conservative group which believes that increase in dividend or paying out dividend increases the value of a firm, the radical group which believe that it reduces the value of a firm while the ones in the middle believe that it has no effect on the value of a firm (Anupam 2012). This was founded by Modigliani and Miller in 1961 which opposed the idea that dividend payment affects the value of the firm thus in perfect market dividend payment does not affect the value of a firm hence dividend irrelevant theory. According to MM if a firm has excess funds i.e. excess of investments, it may decide to retain the funds hence price per share will not change thus valuation of the firm remains. If the firm decides to pay dividend, the value of the share price reduce by an amount equivalent to dividend paid. The shareholders do not loose or gain but the firm loose funds so the value of the firm will reduce. The value of the firm is determined by its investment and financing decisions within an optimal capital structure, and not by its dividend decision. Although this theory does not reflect reality this led to new theories emerging that tended to relax some of the assumptions of MM. Al-makawi (2007) asserted that dividend payment affects the value of the firm hence dividend relevant theory. This theory was proposed by Myron J. Gordon and John linter. It suggests that investors are generally risk averse and should rather have dividend today than possible share appreciation and future dividend. Market imperfection like differential tax exist, if dividend is highly taxed compared to capital gain then investors would prefer capital gain to dividend. In Kenya tax on dividend suffers a withholding tax of 5% while capital gains tax was abolished thus making for investors to prefer capital gains to dividend. Proponents of signaling hypothesis argue that dividend payment relays good information that the firm is a going concern and there are good prospects of growth of the investor‘s investments. As a firm pays dividend it makes long term commitment to future dividend. The maintenance of previous period
_______________________
Maniagi G. Musiega
School of Human Resource and Development,Jomo Kenyatta University of Agriculture and Technology,Kakamega campus, Kenya
Dr. Ondiek B. Alala
LecturerAccounting and Finance, School of Business and economics, university of Kabianga.Kericho, Kenya
Dr. Musiega Douglas
Director ,Jomo Kenyatta University of Agriculture and Technology,Kakamega Campus, Kenya
Maokomba O Christopher
Lecturer of economics Masaai Mara University Narok Kenya
Dr. Egessa Robert
Lecturer of strategic and Hr management MasindeMuliro university of science and technology kakamegakenya

INTERNATIONAL JOURNAL OF SCIENTIFIC & TECHNOLOGY RESEARCH VOLUME 2, ISSUE 10, OCTOBER 2013 ISSN 2277-8616
254 IJSTR©2013 www.ijstr.org
dividend or a fall in retained earnings signal management expectation of a reduction in firms earning activities which are temporal and it will increase latter in future. A reduction in dividend is interpreted as signaling bad news and that management foresees a poor future. If a firm has not been paying dividend and announces dividend it signals that the firm lacks investments projects with positive net present value. Linter (1962), Gordon and Shapiro (1956) supported a bird in the hand theory. In a world of uncertainty and imperfection in information asymmetry investors would prefer dividend to retained earnings thus making the firm to distribute dividend as per the preference of the shareholders. The logic underlying the effect of dividend on the shareholders‘ wealth was first described by Kirshman 1963 in his ―A bird in hand is worth two in the bush‖. He attempted to prove that investors would be willing to pay a premium in order to acquire stocks with higher dividend. Based on clientele hypothesis the firm will distribute dividend based on the type of investors e.g old age investors will prefer current dividend to retained earnings due to uncertainties in future. Thus investors will prefer companies that have best dividend policy that suits their investment objectives. Investors who need current income will be attracted to firms with high payout ratios. Investors who prefer to avoid taxes will be drawn to firms with lower payout ratios therefore; firms should avoid making drastic changes in their dividend policy as it will affect investment decisions as sighted in (Abdullahi 2011). Agency theory fronted by Jensen 1986, where the proponents argue that dividends payment reduce the amount of funds available to the manager. This reduces monitoring cost for the shareholders. For the managers to make prudent investments in projects with positive NPV then they have to source for funds from outside the firm, thus borrowing to increase the financing. This put management under strict scrutiny by lenders of funds hence reducing agency cost (Talat and Hammed 2010) From managerial perspective dividend is used as a tool to mitigate agency problem by digesting extra free cash flow or to signal the market as the only better performing companies pay dividends. This study is to identify factors that influence dividend policy of firms listed on NSE while focusing on Agency theory and signaling hypothesis. The Nairobi Stock Exchange (NSE) is currently a buyer‘s market which presents foreign and local investors with massive bargain opportunities. This situation is a result of various factors that have converged to push stock prices to levels that are out of influence with the fundamentals on the ground. The Nairobi Securities Exchange is an ideal frontier market. It offers foreign investors exposure to the Kenyan economy, and because many listed firms have expanded beyond Kenya‘s borders it also serves as an entry point to the regional economy. In the short term, foreign investors can capitalize by investing in the weak shilling and seek exit points as it strengthens against the US dollar The Nairobi Securities Exchange formerly Nairobi Stock was constituted as a voluntary association of stock brokers under the society act in 1954. In 1990, a trading floor and secretariat was set up at the IPS building, before moving to the Nation Centre in 1994. Over the past decade, the securities exchange has witnessed numerous changes, automating its trading in September 2006 and in 2007 making it possible for stockbrokers to trade remotely from their offices, doing
away with the need for dealers to be physically present on the trading floor. Trading hours were also increased from two to six. Moving to Westland‘s has symbolically marked the end of an era where the market was owned and run by stockbrokers. (Daily nation 19th Jan. 2013). Nairobi Securities Exchange aims at supporting trading clearing settlement of equities debt derivatives and other associated instruments. It is mandated to list companies. (NSE website). Trading of equities is conducted in sessions commencing at 9.00am to 3.00 pm each day. Trading has been facilitated with introduction of central depository accounts systems (CDS). Members on NSE are required by law to publish its financial statements, if the mid-year results to the directors‘ show that losses are anticipate then they are required to issue a notice to that effect. Dispute resolution mechanisms are in place on the trading floor headed by head of trading and any appeals are made to chief executive. A firm to be listed on NSE it should submit an information memorandum or prospectors for approval and a copy to the NSE for comments through a sponsoring stock broker. The Nairobi Securities Exchange companies are grouped in the following ten sectorsAgricultural Sector, Automobiles and Accessories, Banking, Commercial and Services, Construction and Allied Sector, Energy and Petroleum, Insurance, Investment Manufacturing and Allied, Telecommunication and Technology (NSE Hand Book 2012) Nairobi Securities Exchange aims at supporting trading clearing settlement of equities debt derivatives and other associated instruments. It is mandated to list companies. (NSE website). Trading of equities is conducted in sessions commencing at 9.00am to 3.00 pm each day. Trading has been facilitated with introduction of central depository accounts systems (CDS). Members on NSE are required by law to publish its financial statements, if the mid-year results to the directors‘ show that losses are anticipate then they are required to issue a notice to that effect. Dispute resolution mechanisms are in place on the trading floor headed by head of trading and any appeals are made to chief executive. A firm to be listed on NSE it should submit an information memorandum or prospectors for approval and a copy to the NSE for comments through a sponsoring stock broker. The Nairobi Securities Exchange companies are grouped in the following ten sectorsAgricultural Sector, Automobiles and Accessories, Banking, Commercial and Services, Construction and Allied Sector, Energy and Petroleum, Insurance, Investment Manufacturing and Allied, Telecommunication and Technology (NSE Hand Book 2012)
1.2 Statement of the problem Dividend policy has been analyzed for many decades, but no universally accepted explanation for companies observed dividend behavior has been established. Brealey& Myers (2005) described dividend policy as one of the top ten most difficult unsolved problems in financial economics. This description is consistent with Black 1976 who stated that the harder we look at the dividend picture, the more it seems like a puzzle, with pieces that don‘t fit together. It is noted that researchers have focused mainly on developed markets, while little or no attention has been paid to dividend policy in emerging markets. Thus this field is not well established in the financial literature. Chay and Suh (2008) stated that different countries have a unique
INTERNATIONAL JOURNAL OF SCIENTIFIC & TECHNOLOGY RESEARCH VOLUME 2, ISSUE 10, OCTOBER 2013 ISSN 2277-8616
255 IJSTR©2013 www.ijstr.org
regulatory environment, tax regime and rules on dividend policy. In Kenya few researches done focused on all firms listed on NSE but this research focus on non-financial firms only. Al-Malkawi (2007), observed that dividend payment patterns of firms are a cultural phenomenon, influenced by customs, beliefs, regulations, public opinions, perceptions and hysteria, general economic conditions and several other factors, all in perpetual change, impacting different firms differently, hence we can‘t have a uniform policy for all firms at all times. The important elements are not difficult to identify but the interactions between those elements are complex and no easy answer exists (Ross and Jaffe 2009). Investors need to know factors that affect dividend policy thus research needs to be conducted before managers and investors make prudent decisions on investment into particular ventures. This information is important in order for an investment to make sense long term.
1.3 Research Objectives: 1.3.1 General objective
The aim of this study is to determine the main factors that affect dividends policy decisions, 1.3.1 Specific objectives
i. To determine the impact of current earnings on non-financial firm‘s dividends policy decisions.
ii. To identify the relationship of Growth, profitability and liquidity on non-financial firm‘s dividends policy decisions.
iii. To establish the impact of firm‘s size and business risk on dividends policy decisions of non-financial firms listed onNairobi Securities exchange.
1.4 Research questions: i. Do current earnings have an impact on dividends
policy decisions for non-financial firms listed in Nairobi Securities exchange?
ii. Is a dividends policy decision for the non-financial firms listed in Nairobi Securities exchange affected by Growth, profitability and liquidity?
iii. Does firm‘s size and business risk have an impact on dividends policy decisions for non-financial firms listed in Nairobi Securities exchange?
2.0 Literature review
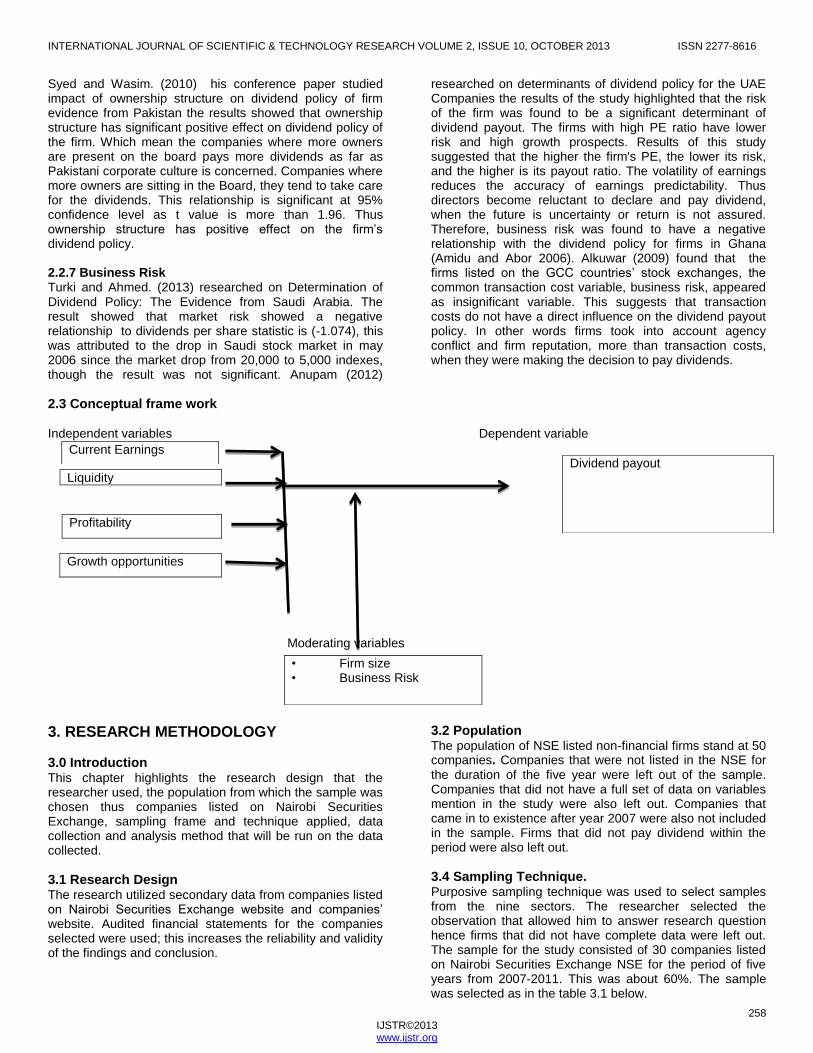
2.1. Introduction This chapter details or captures the dependent variable as dividend payout, independent variables which include current earnings, Growth, profitability, liquidity, and moderating variables include firm‘s size and business risk.
2.2. Theoretical review A number of factors have been identified in previous empirical studies to influence the dividend policy decisions of the firm. Profit is regarded as the major indicator of the firm‘s capacity to pay dividends. Lintner (1956) conducted a classic study on how U.S. managers make dividend decisions. He developed a model based on survey of 28 well established industrial U.S. firms which is considered to be a finance classic. According to him the current year earnings and previous year dividends influence the dividend
payment pattern of a firm. Fama and French (2001) studied the determinants of dividend payments by individual firms during 1946. The results showed that net income seems to provide a better measure of dividend than either cash flows or net income and depreciation included as separate variables in the model. Al-Malkawi (2007) in his research study used the panel data of publically traded firms of Amman Stock Exchange for examining determinants of dividend policy. Results recommended that payout ratio is significantly affected by the percentage of stocks held by insiders and state ownership while other factors like size of the firm and search for profitable stocks were found to be the major factors of dividend policy in Jordan. The results strongly supported the Agency Hypothesis and were broadly consistent with Pecking Order Hypothesis but inconsistent with Signaling Hypothesis. From a Pakistani context, (Ahmed and Javad 2009) conducted a research study comprising a sample of 320 firms listed on KSE. They also focused on determinants of dividend payout and found that firms with stable and positive earnings are paying more dividends, secondly they also pointed out that ownership concentration and liquidity is positively related to dividend payment ratio and opportunities for growth and investments and size of the firms have a negative impact on dividend payments Sajid (2012,) Found out that beta i.e., year to year variability in earnings and liquidity are the two determining factors of dividend payout in Indian information technology sector firms. Arnott and Asness (2012) based their study on American stock markets and found that higher aggregate dividend payout ratios were associated with higher future earnings growth. Some of the determinants highlighted in finance literature include; 2.2.1 Liquidity Ahmed and Javad (2009) asserts that liquidity position is an important determinant of dividend payouts. Firms with more liquidity are likely to pay dividends as compared to the firms that have liquidity problems. Payments of dividend depend more on cash flows which reflect the company‘s ability to pay dividends. A poor liquidity position means less dividend due to shortage of cash. Anupam (2012) in his study of UAE firms does not support the relevance of liquidity as a most important consideration of dividend policy, and finds that is insignificant in influencing the dividend payout decision. Hafeez and Attiya .(2008) In their study dynamics and determinants of dividend policy in Pakistan evidence from Karachi stock exchange for non-financial listed firms The market liquidity of the firms has a positive influence which confirms that firms with higher market liquidity pay more dividends. The size is the highly negative and significant which shows that the large-sized firms invest in their assets rather than paying dividends to its shareholder. 2.2.2 Profitability Previous researchers have found profitability as one of the most important determinants of dividend payout policy. The results on relationship of profitability and dividend payout have been mixed. As per the pecking order theory, the firms will prefer to rely more on internal funds or retained earnings as a result the firms will have a tendency of paying less dividend and having more retained earnings. Profitable firms will prefer lower dividends. Amidu and Abor (2006) have maintained that the profitability is highly negative and

INTERNATIONAL JOURNAL OF SCIENTIFIC & TECHNOLOGY RESEARCH VOLUME 2, ISSUE 10, OCTOBER 2013 ISSN 2277-8616
256 IJSTR©2013 www.ijstr.org
significantly associated with the dividend payout, which shows that the firms invest in their assets rather than paying dividends to shareholders. Baker and Gandi (2007) have found that the higher the return on equity, the greater is the firms retained earnings for reinvestment or the lower is the dividend payout. Contrary to it, there are many. Aivazian, and Cleary (2003) and (Kun Li and Chung-Hua 2012) have maintained that firms are more likely to raise their dividends if they are large and profitable. Their studies proved that the profitability is positively related to the dividend payout ratio. Profitable firms with more stable net earnings can afford larger free cash flows and therefore pay larger dividends. Alkuwar (2009) found out that the firm profitability ratio appeared to be a very strong and statistically significant determinant of the dividend payout ratio in GCC countries. The slope coefficient of this variable was 2.89, suggesting that a 1 unit increase in firm profitability would increase 2.89 units in dividend payout ratio (ceteris paribus). In addition, the elasticity of the dividend payout ratio, with respect to firm profitability found that 10% increase in firm profitability would lead to an increase of about 5.8% in the dividend payout ratio. This is consistent with the observation that firms normally pay a higher dividend ratio when there is a rise in firm profitability. Anupam (2012) studied UAE Companies for the years 2005 to 2009 and concluded that the profitability of the firms as measured by ROE has negative relationship with dividend payout, which indicates that the more profitable firms pay less dividends. Profitability measured by ROA and EPS are negatively associated with the dividend payout ratio but the results are not statistically significant. Turki and Ahmed (2013) studied firms on Saudi Arabia stock exchanges the findings showed that earnings per share was significant and had positive relationship with dividends per share. So when firms increase their profitability then dividends per share increase. Mohammed and Mohammed (2012) in there research on a worthy factors affecting dividends policy decisions An empirical study on industrial corporations listed in Amman Stock exchange found that profitability shown by earnings per share (EPS) has the highest effect on dividends and it was significant. Taher (2012) researched on determinants of dividend payout policy: Evidence from Bangladesh the results showed that EPS was negatively significant to dividend payout policy. While EPS is a great way to compare earnings across firms, but it did not provide anything about how the market values the stock. Thus, the fundamental analysis use the P/E ratio to figure out how much the market was willing to pay for a firm‘s earnings.it was assumed that firm‘s EPS is high will be lower dividend payout ratio and therefore, will have negative sign as determined from the estimation. Thus, the higher the payoutratio, the less confidence the company has that it would have been able to find better uses for the money it earned. 2.2.3 Size of the Firms Size of a firm has been considered to be a factor in determining dividend policy of a firm. Hafeez andAttiya (2008) studied on the determinants of dividend policy in Pakistan the results show that there is a negative and significant relationship between dividend Payout and size. This result shows that large-sized firms prefer to pay less dividend; therefore, we fail to reject the null hypothesis that
size has negative relationship with dividend payout AL- Shubiri (2011) researched on companies listed on Amman Stock Exchange for the period of 2005-2009. He found out that there is strong significant positive relationship between firm size and dividend payment decision. This means that large Jordanian firms tend to be more diversified than smaller firms and hence less likely to be susceptible to financial distress, and more able to pay dividends to the shareholders .This relation is supported by the transaction cost theory of dividend policy. Eriotis (2005) also studied the Greek firms set their dividend policies not only by net distributed earnings but also the changes in dividend and size of the firm where the empirical findings of the research suggested that size of the firms was included as a signal about the firm‘s dividend. Al-Twaijry (2007) in his study concludes that large firms are more likely to be mature and thus have an easier access to capital markets and should be able to pay more dividends. Anupam (2012) studied UAE Companies for the years 2005 to 2009 and concluded that the Size of the firm is significantly and positively related to the dividend payout of the firm in the UAE. Like earlier studies, this research also concludes that the larger size firms pay out more dividends as compared to firms with smaller size. Large companies have easier access to the capital market and hence are less dependent on the internal funds, leading to more capability to pay the dividends. Alkuwar (2009) Firm size was also found to be a statistically significant determinant of dividend policy. This result showed that firm size and dividend ratio have a positive association. It is noticeable that the value of this coefficient was relatively low. This is because the units of the firm size variable is large, being in US $1000. Nevertheless, this result suggests that the dividend ratio increases with firm size. Mahira (2012) studied factors affecting dividend payout for listed non-financial firms of Karachi Stock Exchange From the regression results it showed that out of the 6 explanatory variables under study firm‘s Size was found to have significant impact on dividend payout. The probability was within 5% benchmark probability level. Thus size plays a significant role in determining the dividend payout in Pakistan. The observed value of T-Statistics was also more than the tabulated t-statistics reinforcing the level of significance of probability. Thus if there is 1% change in firm size, it would determine up to approximately 5% change in dividend payout. Size was found to have positive relationship with the dependent variable of dividend payout. The results show that there is a negative and significant relationship between dividend payout and size. This result shows that large-sized firms prefer to pay less dividend; Hafeez and Attiya. (2008) in their study dynamics and determinants of dividend policy in Pakistan evidence from Karachi stock exchange for non-financial listed firms. The results show that there is a negative and significant relationship between dividend payout and size. This result shows that large-sized firms prefer to pay fewer dividends. 2.2.4. Current Earnings The empirical analysis by (Adaoglu 2000) shows that the firms listed on Istanbul Stock Exchange follow unstable cash dividend policy and the main factor for determining the amount of dividend is earning of the firms. Eriotis (2005) reported that the Greek firms distribute dividend each year
INTERNATIONAL JOURNAL OF SCIENTIFIC & TECHNOLOGY RESEARCH VOLUME 2, ISSUE 10, OCTOBER 2013 ISSN 2277-8616
257 IJSTR©2013 www.ijstr.org
according to their target payout ratio, which is determined by distributed earnings and size of these firms. In investigating the determinants of dividend policy of Tunisian stock Exchange Naceur and Goaied (2006) find that the high profitable firms with more stable earnings can manage the larger cash flows and because of this they pay larger dividends. Moreover, the firms with fast growth distribute the larger dividends so as attract to investors. Baker and Gandi (2007) also find that a major determinant of dividend payment was the anticipated level of future earnings. Ahmed (2009) reveal that dividend payments depend more on cash flows, which reflect the company‘s ability to pay dividends, than on current earnings, which are less heavily influenced by accounting practices. They claim current earnings do not really reflect the firm‘s ability to pay dividends. Hassan and Hosny (2012) studied Kuwait firms using questionnaire of Baker &Gandi (2007) in order to investigate the main determinants that control dividends policies in an emerging stock market 72.7% of respondent managers of Kuwaiti firms believe that the ―Level of expected future earnings‖ has the strongest influence on the stock price with 56.4 reliability and 7.8% extracted variance 2.2.5 Growth Opportunities The higher the growth opportunities, the more the need for funds to finance expansion, and the more likely the firm is to retain earnings than pay them as dividends (Chai-ying 2012). Sajid et al (2012) indicated a direct link between growth and financing needs: rapidly growing firms have external financing needs because working capital needs normally exceed the incremental cash flows from new sales. Turki and Ahmed (2013) researched on Determination of Dividend Policy: The Evidence from Saudi Arabia. The result showed that firms which experience more growth opportunity are more to reduce their dividends per share this could be attributed to the fact that the firms will channel the excess funds to profitable investments other than pay dividends and the relationship was not significant -.721 but negatively correlated Firms tend to use internal funding sources to finance investment projects if it had large growth opportunities and large investment projects. Such a firm chooses to cut, or pay fewer dividends, to reduce its dependence on costly external financing. Firms with slow growth and fewer investment opportunities pay higher dividends to prevent managers from over-investing company cash. As such, a dividend here would play an incentive role, by removing resources from the firm and decreasing the agency costs of free cash flows (Al-Malkawi, 2007) 2.2.6 Institutional Ownership Institutional investors play an effective role at monitoring management than the individual investors. Because of their investment size and the resources at their disposal, Institutional investors have better incentive and capabilities to collect and evaluate information pertaining to their investments. They also possess the clout to discipline management and even bring about the changes when management performs inadequately in (Stouraitis and Wu, 2004) as sighted in (Syed andWasim. 2011) Hamid and Asma .(2012) studied the Impact of Ownership Structure on Dividend Policy Evidence from Emerging Markets KSE-100
Index Pakistan The study used the data for seventy from randomly selected form the Karachi stock exchange 100-index for the period of eight years ranging from 2003 to 2010. The results showed that dividend payout ratio was negatively correlated to managerial share ownership and the coefficient was significant at 1% confidence interval. Thus, increase in percentage of the managerial share ownership in firms reduces dividend payout ratio. This could attributed to managerial share ownership being used as internal governance mechanism in aligning the interest of the shareholders with that of the managers Agency theory hypothesizes a positive relationship between the degree of institutional ownership and dividend payments. Where there is a large separation between ownership and management, conflicts of interest can arise between managers, inside owners and minority shareholders. La Porta et al. (2000) illustrated that managers may take advantage of their authority to benefit themselves by diverting firm assets to themselves through theft, excessive salaries or sales of assets at favorable prices to themselves. Anil and Kapoor (2008) studied the impact of firm specific factors on corporate dividend payments. He analyzed 180 companies listed at KSE Pakistan, during 1981 to 2002 and reported that only 23% of incremental profits are transformed in to dividend and remaining profits are utilized for additional investments and companies start paying dividend after a certain level of growth. Moreover, large number of shares held by directors lead to high dividend and low reserve funds. Khan (2006), analyzed the ownership structure of 330 large listed UK firms, her results indicated negative relationship between dividends and ownership concentration. She further analyzed ownership compositions and reported that ownership by insurance companies is positively but individual ownership is negatively related with dividend policy. Sharma (2006) investigated the relationship between corporate governance and dividend payout for a panel of Indian firms from 1994 to 2000 and explained the difference in dividend behavior with the help of firm‘s financial structure, investment opportunities, dividend history, earning trends, and the ownership structure. He found positive relationship of dividend with ownership by corporations and directors, but squared corporate ownership was negatively related with dividend but he found no evidence of relationship of foreign ownership and dividend payout In Al-Kuwari (2009) Government ownership appears to be a statistically significant determinant of dividend policy in the companies listed on the stock exchanges of GCC countries. In summary, government ownership was found to have a significant effect in promoting dividend payouts. The suggested reasons for this association are:
(i) One government ownership itself attracts external funds more easily,
(ii) Government shareholder, in countries where the legal protection is weak, becomes a powerful investor able to force the firm to disgorge cash , to avoid exploiting minority shareholders,
(iii) To reduce the doubled agency conflict, (iv) To attract investment in the private sector.
INTERNATIONAL JOURNAL OF SCIENTIFIC & TECHNOLOGY RESEARCH VOLUME 2, ISSUE 10, OCTOBER 2013 ISSN 2277-8616
258 IJSTR©2013 www.ijstr.org
Syed and Wasim. (2010) his conference paper studied impact of ownership structure on dividend policy of firm evidence from Pakistan the results showed that ownership structure has significant positive effect on dividend policy of the firm. Which mean the companies where more owners are present on the board pays more dividends as far as Pakistani corporate culture is concerned. Companies where more owners are sitting in the Board, they tend to take care for the dividends. This relationship is significant at 95% confidence level as t value is more than 1.96. Thus ownership structure has positive effect on the firm‘s dividend policy. 2.2.7 Business Risk Turki and Ahmed. (2013) researched on Determination of Dividend Policy: The Evidence from Saudi Arabia. The result showed that market risk showed a negative relationship to dividends per share statistic is (-1.074), this was attributed to the drop in Saudi stock market in may 2006 since the market drop from 20,000 to 5,000 indexes, though the result was not significant. Anupam (2012)
researched on determinants of dividend policy for the UAE Companies the results of the study highlighted that the risk of the firm was found to be a significant determinant of dividend payout. The firms with high PE ratio have lower risk and high growth prospects. Results of this study suggested that the higher the firm's PE, the lower its risk, and the higher is its payout ratio. The volatility of earnings reduces the accuracy of earnings predictability. Thus directors become reluctant to declare and pay dividend, when the future is uncertainty or return is not assured. Therefore, business risk was found to have a negative relationship with the dividend policy for firms in Ghana (Amidu and Abor 2006). Alkuwar (2009) found that the firms listed on the GCC countries‘ stock exchanges, the common transaction cost variable, business risk, appeared as insignificant variable. This suggests that transaction costs do not have a direct influence on the dividend payout policy. In other words firms took into account agency conflict and firm reputation, more than transaction costs, when they were making the decision to pay dividends.
2.3 Conceptual frame work Independent variables Dependent variable
Liquidity
Profitability
Growth opportunities
Moderating variables
3. RESEARCH METHODOLOGY
3.0 Introduction This chapter highlights the research design that the researcher used, the population from which the sample was chosen thus companies listed on Nairobi Securities Exchange, sampling frame and technique applied, data collection and analysis method that will be run on the data collected.
3.1 Research Design The research utilized secondary data from companies listed on Nairobi Securities Exchange website and companies‘ website. Audited financial statements for the companies selected were used; this increases the reliability and validity of the findings and conclusion.
3.2 Population The population of NSE listed non-financial firms stand at 50 companies. Companies that were not listed in the NSE for the duration of the five year were left out of the sample. Companies that did not have a full set of data on variables mention in the study were also left out. Companies that came in to existence after year 2007 were also not included in the sample. Firms that did not pay dividend within the period were also left out.
3.4 Sampling Technique. Purposive sampling technique was used to select samples from the nine sectors. The researcher selected the observation that allowed him to answer research question hence firms that did not have complete data were left out. The sample for the study consisted of 30 companies listed on Nairobi Securities Exchange NSE for the period of five years from 2007-2011. This was about 60%. The sample was selected as in the table 3.1 below.
Current Earnings Dividend payout
• Firm size • Business Risk
INTERNATIONAL JOURNAL OF SCIENTIFIC & TECHNOLOGY RESEARCH VOLUME 2, ISSUE 10, OCTOBER 2013 ISSN 2277-8616
259 IJSTR©2013 www.ijstr.org
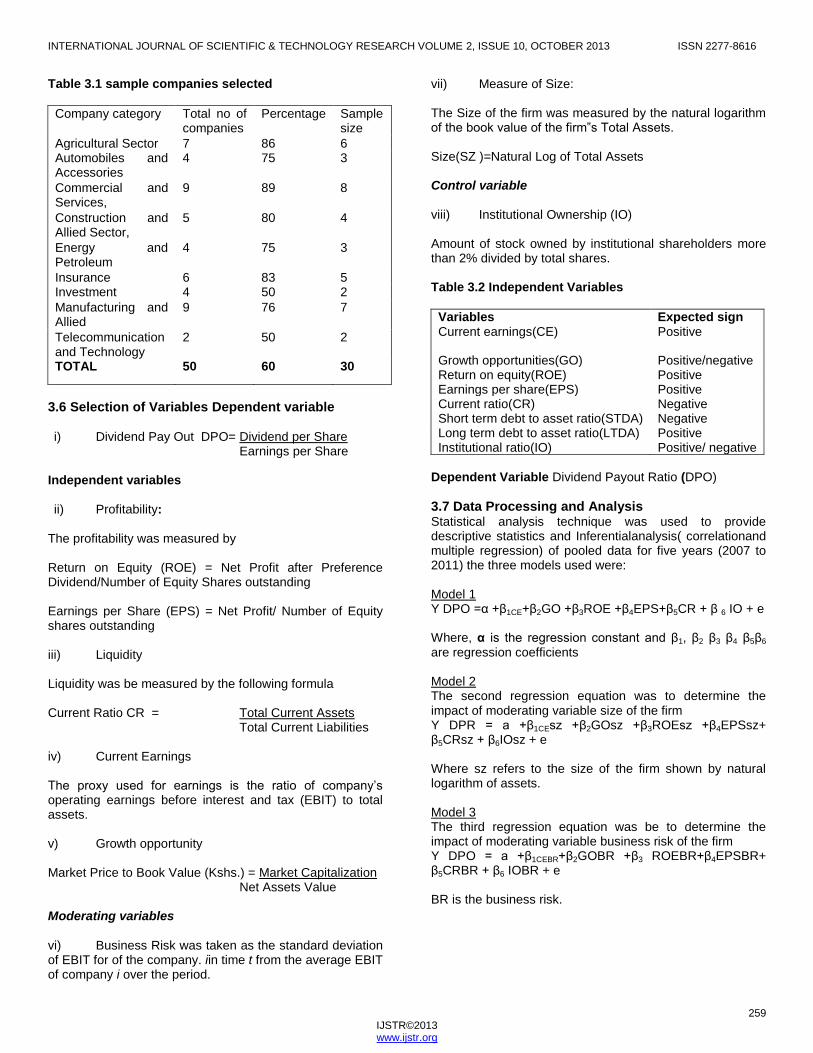
Table 3.1 sample companies selected
Company category Total no of companies
Percentage Sample size
Agricultural Sector 7 86 6 Automobiles and Accessories
4 75 3
Commercial and Services,
9 89 8
Construction and Allied Sector,
5 80 4
Energy and Petroleum
4 75 3
Insurance 6 83 5 Investment 4 50 2
Manufacturing and Allied
9 76 7
Telecommunication and Technology
2 50 2
TOTAL 50 60 30
3.6 Selection of Variables Dependent variable i) Dividend Pay Out DPO= Dividend per Share
Earnings per Share Independent variables
ii) Profitability:
The profitability was measured by Return on Equity (ROE) = Net Profit after Preference Dividend/Number of Equity Shares outstanding Earnings per Share (EPS) = Net Profit/ Number of Equity shares outstanding iii) Liquidity Liquidity was be measured by the following formula Current Ratio CR = Total Current Assets
Total Current Liabilities
iv) Current Earnings The proxy used for earnings is the ratio of company‘s operating earnings before interest and tax (EBIT) to total assets. v) Growth opportunity Market Price to Book Value (Kshs.) = Market Capitalization
Net Assets Value
Moderating variables vi) Business Risk was taken as the standard deviation of EBIT for of the company. iin time t from the average EBIT of company i over the period.
vii) Measure of Size: The Size of the firm was measured by the natural logarithm of the book value of the firm‟s Total Assets. Size(SZ )=Natural Log of Total Assets Control variable viii) Institutional Ownership (IO) Amount of stock owned by institutional shareholders more than 2% divided by total shares. Table 3.2 Independent Variables
Variables Expected sign Current earnings(CE) Positive
Growth opportunities(GO) Positive/negative Return on equity(ROE) Positive Earnings per share(EPS) Positive Current ratio(CR) Negative Short term debt to asset ratio(STDA) Negative Long term debt to asset ratio(LTDA) Positive Institutional ratio(IO) Positive/ negative
Dependent Variable Dividend Payout Ratio (DPO)
3.7 Data Processing and Analysis Statistical analysis technique was used to provide descriptive statistics and Inferentialanalysis( correlationand multiple regression) of pooled data for five years (2007 to 2011) the three models used were: Model 1 Y DPO =α +β1CE+β2GO +β3ROE +β4EPS+β5CR + β 6 IO + e Where, α is the regression constant and β1, β2 β3 β4 β5β6 are regression coefficients Model 2 The second regression equation was to determine the impact of moderating variable size of the firm Y DPR = a +β1CEsz +β2GOsz +β3ROEsz +β4EPSsz+ β5CRsz + β6IOsz + e Where sz refers to the size of the firm shown by natural logarithm of assets. Model 3 The third regression equation was be to determine the impact of moderating variable business risk of the firm Y DPO = a +β1CEBR+β2GOBR +β3 ROEBR+β4EPSBR+ β5CRBR + β6 IOBR + e BR is the business risk.
INTERNATIONAL JOURNAL OF SCIENTIFIC & TECHNOLOGY RESEARCH VOLUME 2, ISSUE 10, OCTOBER 2013 ISSN 2277-8616
260 IJSTR©2013 www.ijstr.org
DATA ANALYSIS AND DISCUSION
4.1 Descriptive analysis
Table 4.1 Analysis of the Descriptive statistics
Variable statistic
Min
Max
Mean
SD Skewnes Kurtosis
Return on equity
-73.00 96.30 17.759 17.6565 .3312 6.2452
Earnings per share
-46.76 100.5 7.8694 11.8849 .7226 3.2506
Current ratio CR
00 18.29 1.899 1.5391 2.353 7.9022
Current earnings
-.2900 2.950 .1399 .2171 2.4394 10.61
Growth Opportunity
.1500 7.79 1.6527 1.1536 1.5582 2.4106
Institutional Ownership
.0300 .9100 .5900 .9472 -.8570 1.051
Business Risk
35,979.58 19,230,934 1505371 3703647 4.179 19.201
Size 17.45 27.15 22.30 1.9456 .0956 .271
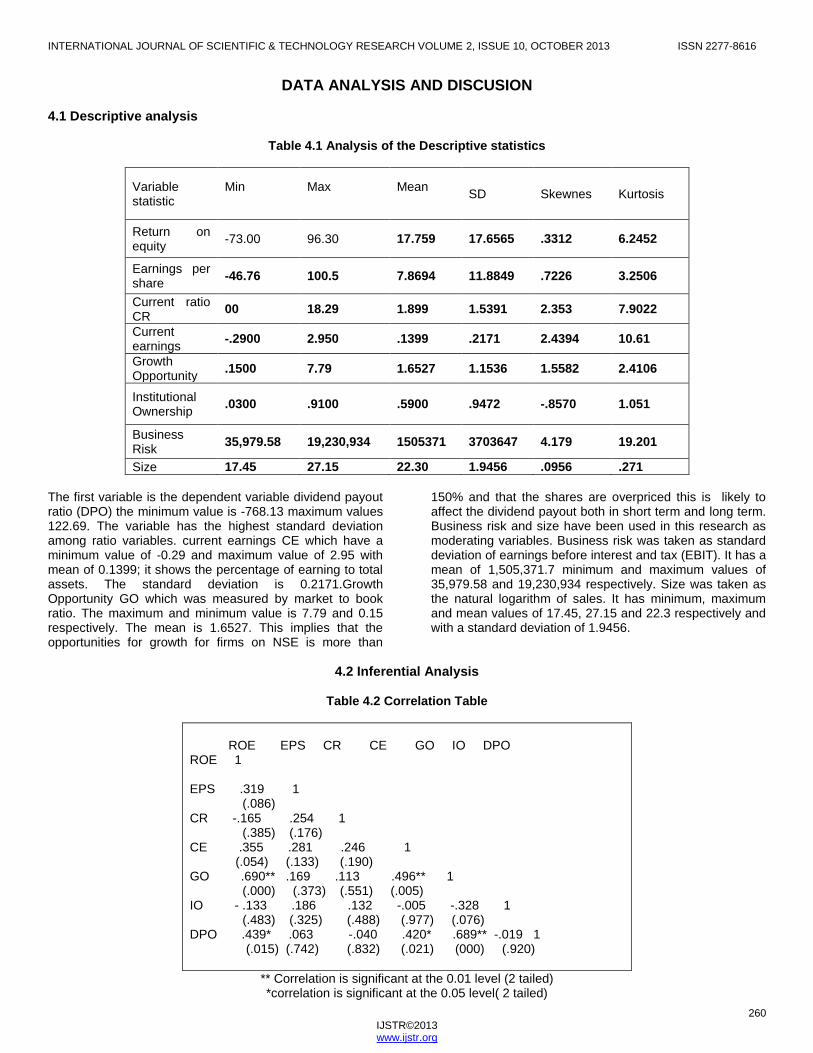
The first variable is the dependent variable dividend payout ratio (DPO) the minimum value is -768.13 maximum values 122.69. The variable has the highest standard deviation among ratio variables. current earnings CE which have a minimum value of -0.29 and maximum value of 2.95 with mean of 0.1399; it shows the percentage of earning to total assets. The standard deviation is 0.2171.Growth Opportunity GO which was measured by market to book ratio. The maximum and minimum value is 7.79 and 0.15 respectively. The mean is 1.6527. This implies that the opportunities for growth for firms on NSE is more than
150% and that the shares are overpriced this is likely to affect the dividend payout both in short term and long term. Business risk and size have been used in this research as moderating variables. Business risk was taken as standard deviation of earnings before interest and tax (EBIT). It has a mean of 1,505,371.7 minimum and maximum values of 35,979.58 and 19,230,934 respectively. Size was taken as the natural logarithm of sales. It has minimum, maximum and mean values of 17.45, 27.15 and 22.3 respectively and with a standard deviation of 1.9456.
4.2 Inferential Analysis
Table 4.2 Correlation Table
ROE EPS CR CE GO IO DPO ROE 1 EPS .319 1 (.086) CR -.165 .254 1 (.385) (.176) CE .355 .281 .246 1 (.054) (.133) (.190) GO .690** .169 .113 .496** 1 (.000) (.373) (.551) (.005) IO - .133 .186 .132 -.005 -.328 1 (.483) (.325) (.488) (.977) (.076) DPO .439* .063 -.040 .420* .689** -.019 1 (.015) (.742) (.832) (.021) (000) (.920)
** Correlation is significant at the 0.01 level (2 tailed) *correlation is significant at the 0.05 level( 2 tailed)
INTERNATIONAL JOURNAL OF SCIENTIFIC & TECHNOLOGY RESEARCH VOLUME 2, ISSUE 10, OCTOBER 2013 ISSN 2277-8616
261 IJSTR©2013 www.ijstr.org
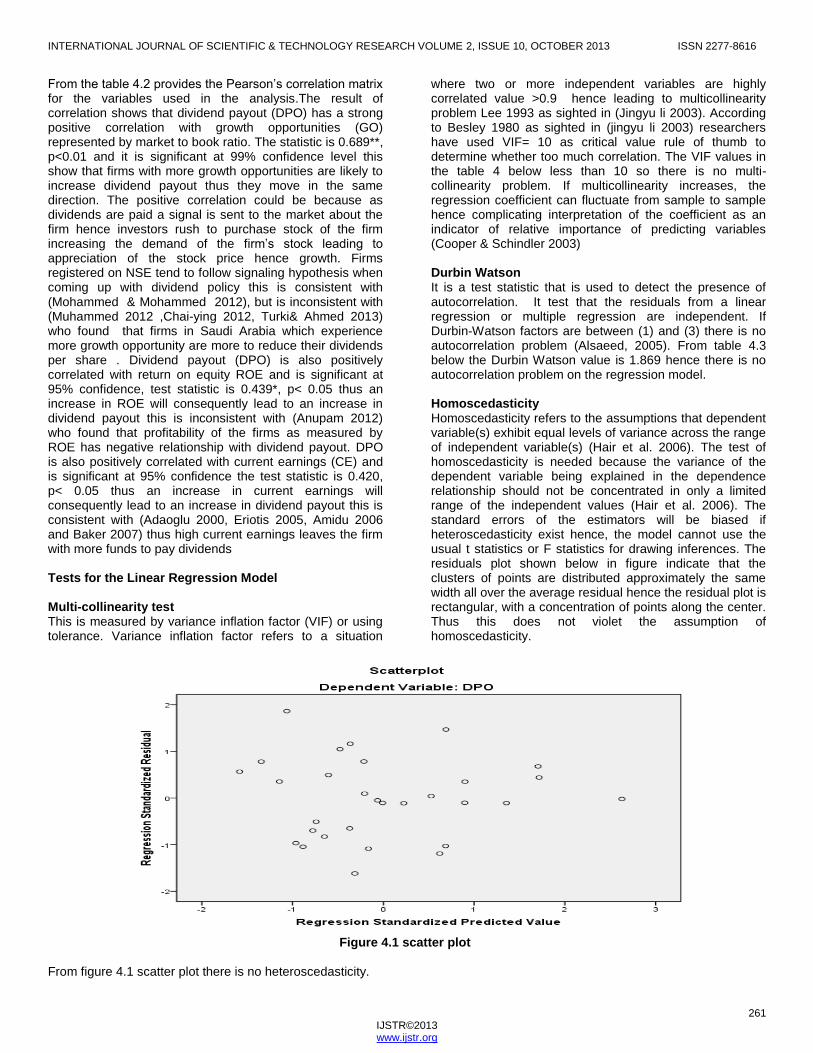
From the table 4.2 provides the Pearson‘s correlation matrix for the variables used in the analysis.The result of correlation shows that dividend payout (DPO) has a strong positive correlation with growth opportunities (GO) represented by market to book ratio. The statistic is 0.689**, p<0.01 and it is significant at 99% confidence level this show that firms with more growth opportunities are likely to increase dividend payout thus they move in the same direction. The positive correlation could be because as dividends are paid a signal is sent to the market about the firm hence investors rush to purchase stock of the firm increasing the demand of the firm‘s stock leading to appreciation of the stock price hence growth. Firms registered on NSE tend to follow signaling hypothesis when coming up with dividend policy this is consistent with (Mohammed & Mohammed 2012), but is inconsistent with (Muhammed 2012 ,Chai-ying 2012, Turki& Ahmed 2013) who found that firms in Saudi Arabia which experience more growth opportunity are more to reduce their dividends per share . Dividend payout (DPO) is also positively correlated with return on equity ROE and is significant at 95% confidence, test statistic is 0.439*, p< 0.05 thus an increase in ROE will consequently lead to an increase in dividend payout this is inconsistent with (Anupam 2012) who found that profitability of the firms as measured by ROE has negative relationship with dividend payout. DPO is also positively correlated with current earnings (CE) and is significant at 95% confidence the test statistic is 0.420, p< 0.05 thus an increase in current earnings will consequently lead to an increase in dividend payout this is consistent with (Adaoglu 2000, Eriotis 2005, Amidu 2006 and Baker 2007) thus high current earnings leaves the firm with more funds to pay dividends Tests for the Linear Regression Model Multi-collinearity test This is measured by variance inflation factor (VIF) or using tolerance. Variance inflation factor refers to a situation
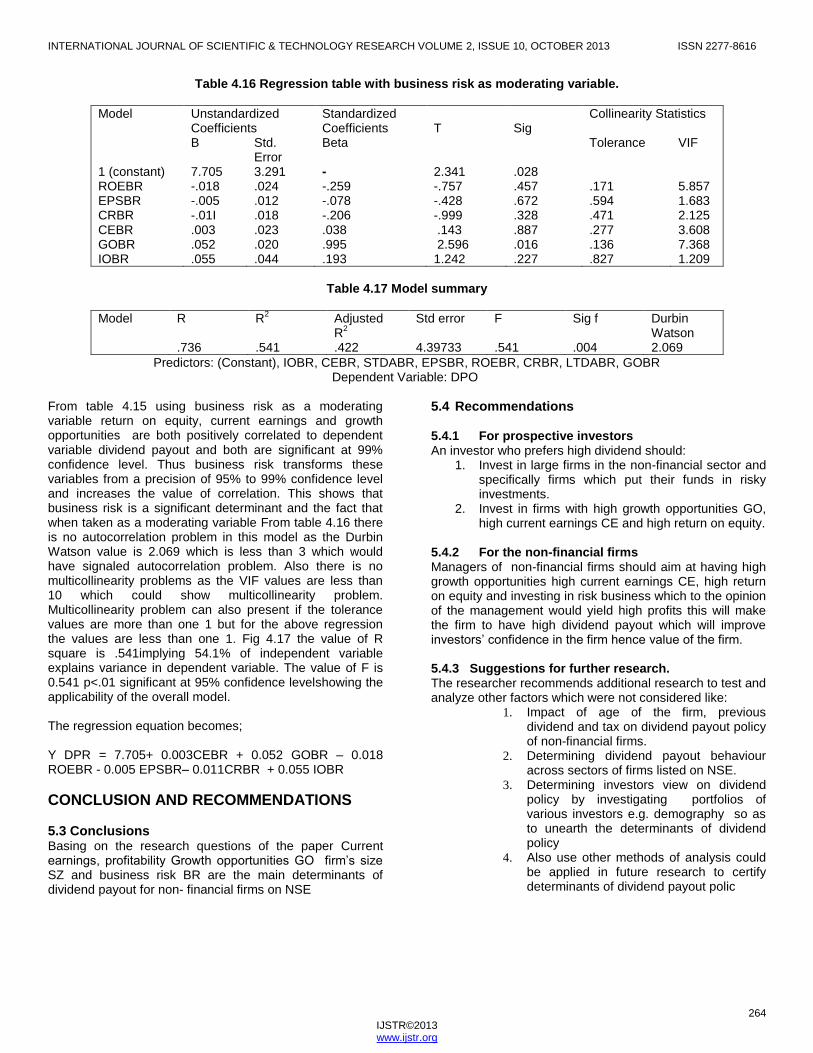
where two or more independent variables are highly correlated value >0.9 hence leading to multicollinearity problem Lee 1993 as sighted in (Jingyu li 2003). According to Besley 1980 as sighted in (jingyu li 2003) researchers have used VIF= 10 as critical value rule of thumb to determine whether too much correlation. The VIF values in the table 4 below less than 10 so there is no multi-collinearity problem. If multicollinearity increases, the regression coefficient can fluctuate from sample to sample hence complicating interpretation of the coefficient as an indicator of relative importance of predicting variables (Cooper & Schindler 2003) Durbin Watson It is a test statistic that is used to detect the presence of autocorrelation. It test that the residuals from a linear regression or multiple regression are independent. If Durbin-Watson factors are between (1) and (3) there is no autocorrelation problem (Alsaeed, 2005). From table 4.3 below the Durbin Watson value is 1.869 hence there is no autocorrelation problem on the regression model. Homoscedasticity Homoscedasticity refers to the assumptions that dependent variable(s) exhibit equal levels of variance across the range of independent variable(s) (Hair et al. 2006). The test of homoscedasticity is needed because the variance of the dependent variable being explained in the dependence relationship should not be concentrated in only a limited range of the independent values (Hair et al. 2006). The standard errors of the estimators will be biased if heteroscedasticity exist hence, the model cannot use the usual t statistics or F statistics for drawing inferences. The residuals plot shown below in figure indicate that the clusters of points are distributed approximately the same width all over the average residual hence the residual plot is rectangular, with a concentration of points along the center. Thus this does not violet the assumption of homoscedasticity.
Figure 4.1 scatter plot
From figure 4.1 scatter plot there is no heteroscedasticity.

INTERNATIONAL JOURNAL OF SCIENTIFIC & TECHNOLOGY RESEARCH VOLUME 2, ISSUE 10, OCTOBER 2013 ISSN 2277-8616
262 IJSTR©2013 www.ijstr.org
Table 4.3 Model summary
R R2
Adjusted R
2
Std error
F Sig f
Durbin Watson
1 .763
.582
.4723 4.1994
5.329
.001
1.868
Predictors: (Constant), IO, CE, EPS, ROE, CR, GO Dependent Variable: DPO
From table 4.3 model summary the value of R square is 0.582 this implies that 58.2% of variance in the independent variables can be accounted in the dependent variable DPO. The regression result indicates that all the independent variables are significant in determining dividend policy of firms listed on NSE. The F value is significant at 1 per cent level (F = 5.329, p < 0.001) showing the applicability of the overall model.
Table 4.5 regression results
Model Unstandardized Coefficients
Standardized Coefficients
T
Sig
Collinearity Statistics
B Std. Error
Beta Tolerance VIF
1 (constant) 1.368 4.33 - .316 .755
ROE -.306 .316 -.211 -.968 .343 .384 2.607
EPS -.055 .166 -.052 -.328 .746 .736 1.358
CR -.288 .198 -.232 -1.457 .159 .715 1.398
CE .226 .309 .120 .733 .471 .682 1.466
GO 1.066 .269 .905 3.911 .001 .384 2.872
IO 1.348 .702 .291 1.92 .067 .792 1.262
The regression for model 1 becomes Y DPO = 1.368 + 0.226CE +1.066GO – 0.306ROE – 0.055EPS- 0.288CR+ 1.348IO
Table 4.11 Correlation table with size as moderating variable
ROESZ EPSSZ CRSZ CESZ GOSZ IOSZ DPO ROESZ 1 EPSSZ 528** 1 (.003) CRSZ .247 .390* 1 (.188) (.033) CESZ .539** .469** .428* 1 (.001) (.009) (.018) GOSZ .851** .411* .382* .725 1 (000) (.024) (.034) (000) IOSZ .398* .421* .411* .237 . 273 1 (.029) (.021) (.024) (.208) (.144) DPO .478** .154 .168 .582** .682** .153 1 (.008) (.416) (.376) (.001) (000) (.419
** Correlation is significant at the 0.01 level (2 tailed) *correlation is significant at the 0.05 level( 2 tailed)

INTERNATIONAL JOURNAL OF SCIENTIFIC & TECHNOLOGY RESEARCH VOLUME 2, ISSUE 10, OCTOBER 2013 ISSN 2277-8616
263 IJSTR©2013 www.ijstr.org
Table 4.12 Regression table with size as a moderating variable
Model Unstandardized Coefficients
Standardized Coefficients
T
Sig
Collinearity Statistics
B Std. Error
Beta Tolerance VIF
1 (constant) ROEsz EPSsz CRsz CEsz GOsz IOsz
7.645 -.025 -.006 -.018 .025 .052 .028
2.858 .019 .010 .015 .021 .018 .036
- -.42 -.105 -.212 .258 .94 .133
2.675 -1.324 -.570 -1.197 1.205 2.788 .785
.014
.199
.574
.244
.240
.010
.440
.190 .566 .611 .416 .168 .664
5.257 1.766 1.636 2.403 5.938 1.505
Table 4.13 Model summary
Mdl R R2
Adjusted R
2 Std error F Sig f Durbin
Watson
2 .748 .560 .445 4.30758 4.875 .002 1.98
Predictors: (Constant), IO, CE, STDA, EPS, ROE, CR, LTDA, GO Dependent Variable: DPO
From table 4.11 Size as a moderating variable has influence on return on equity and current earnings the level of significance changes from 95% to 99% significance level test statistic.478**, p <0.05 and .582**,p value <0.05meaning size has an impact as the level of precision increases making the correlation more strong compared to when size is not used. From table 4.12 above there is no multicollinearity problems as the VIF values in the are less than 10 which could show multicollinearity problem The Durbin Watson value from table 4.13 is less than 3 this shows there is no autocorrelation problem. The value of R
square is 0.560 which implies that 56.0% of the variance in the independent variables can be accounted in the dependent variable DPO. The F value = 4.875,P<0.05 this suggest that the model is capable of explaining the variance in dividend payout DPO that is showing the applicability of the overall model. From the table 4.12 the regression equation becomes Y DPR = 7.645 + 0.025CEsz + 0.052 GOsz – 0.025 ROEsz – 0.006EPSsz– 0.018CRsz + 0.028s IOsz
Table 4.15 Correlation table with business risk as moderating variable
ROEBR EPSBR CRBR CEBR GOBR IOBR DPO ROEBR 1 EPSBR 547** 1 (.002) CRBR .289 .385* 1 (.122) (036) CEBR .702** ..540** .605** 1 (.000) (.002) (000) GOBR .864** .481** .526** - .811* 1 (000) (.007) (000) (000) IOBR .292 .307 .266 .289 . 226 1 (.118) (.099) (.155) (.121) (.231) DPO .582** .260 .287 .552** .700** .274 1 (.001) (.166) (.124) (.002) (.000) (.143)
** Correlation is significant at the 0.01 level (2 tailed) *correlation is significant at the 0.05 level ( 2 tailed)
INTERNATIONAL JOURNAL OF SCIENTIFIC & TECHNOLOGY RESEARCH VOLUME 2, ISSUE 10, OCTOBER 2013 ISSN 2277-8616
264 IJSTR©2013 www.ijstr.org
Table 4.16 Regression table with business risk as moderating variable.
Model Unstandardized Coefficients
Standardized Coefficients
T
Sig
Collinearity Statistics
B Std. Error
Beta Tolerance VIF
1 (constant) ROEBR EPSBR CRBR CEBR GOBR IOBR
7.705 -.018 -.005 -.01I .003 .052 .055
3.291 .024 .012 .018 .023 .020 .044
- -.259 -.078 -.206 .038 .995 .193
2.341 -.757 -.428 -.999 .143 2.596 1.242
.028
.457
.672
.328
.887
.016
.227
.171 .594 .471 .277 .136 .827
5.857 1.683 2.125 3.608 7.368 1.209
Table 4.17 Model summary
Model R R2
Adjusted R
2 Std error F Sig f Durbin
Watson .736 .541 .422 4.39733 .541 .004 2.069
Predictors: (Constant), IOBR, CEBR, STDABR, EPSBR, ROEBR, CRBR, LTDABR, GOBR Dependent Variable: DPO
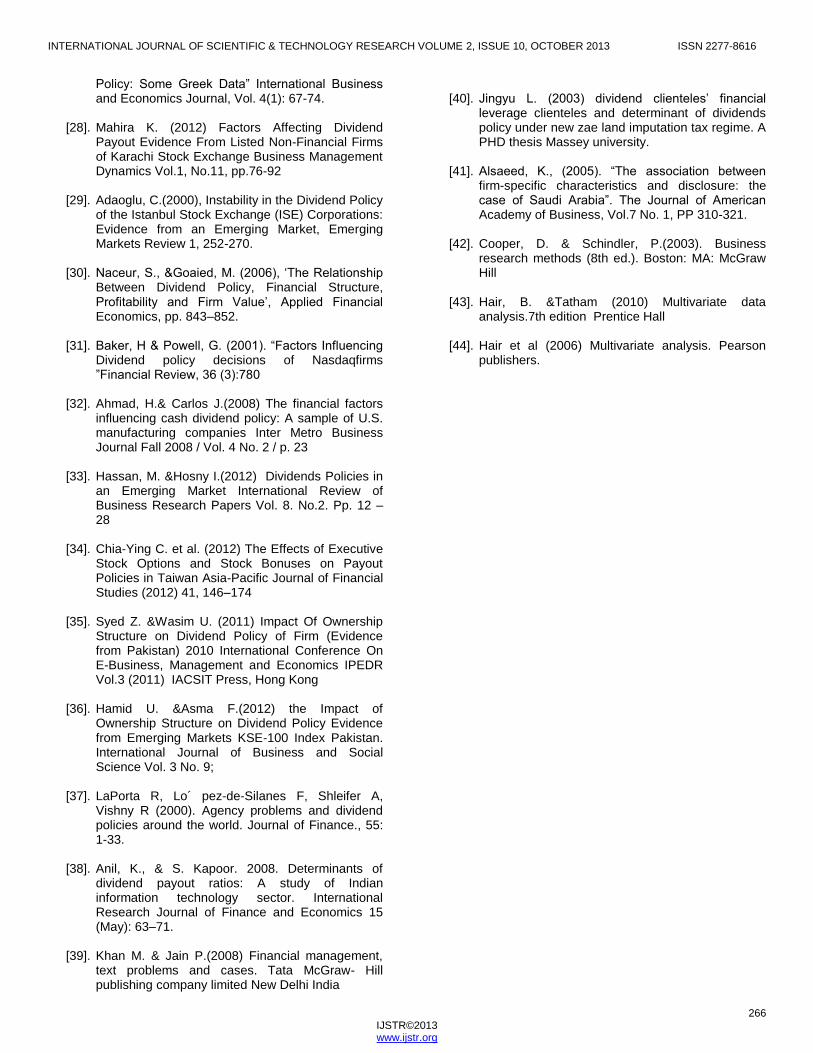
From table 4.15 using business risk as a moderating variable return on equity, current earnings and growth opportunities are both positively correlated to dependent variable dividend payout and both are significant at 99% confidence level. Thus business risk transforms these variables from a precision of 95% to 99% confidence level and increases the value of correlation. This shows that business risk is a significant determinant and the fact that when taken as a moderating variable From table 4.16 there is no autocorrelation problem in this model as the Durbin Watson value is 2.069 which is less than 3 which would have signaled autocorrelation problem. Also there is no multicollinearity problems as the VIF values are less than 10 which could show multicollinearity problem. Multicollinearity problem can also present if the tolerance values are more than one 1 but for the above regression the values are less than one 1. Fig 4.17 the value of R square is .541implying 54.1% of independent variable explains variance in dependent variable. The value of F is 0.541 p<.01 significant at 95% confidence levelshowing the applicability of the overall model. The regression equation becomes; Y DPR = 7.705+ 0.003CEBR + 0.052 GOBR – 0.018 ROEBR - 0.005 EPSBR– 0.011CRBR + 0.055 IOBR
CONCLUSION AND RECOMMENDATIONS
5.3 Conclusions Basing on the research questions of the paper Current earnings, profitability Growth opportunities GO firm‘s size SZ and business risk BR are the main determinants of dividend payout for non- financial firms on NSE
5.4 Recommendations 5.4.1 For prospective investors An investor who prefers high dividend should:
1. Invest in large firms in the non-financial sector and specifically firms which put their funds in risky investments.
2. Invest in firms with high growth opportunities GO, high current earnings CE and high return on equity.
5.4.2 For the non-financial firms Managers of non-financial firms should aim at having high growth opportunities high current earnings CE, high return on equity and investing in risk business which to the opinion of the management would yield high profits this will make the firm to have high dividend payout which will improve investors‘ confidence in the firm hence value of the firm.
5.4.3 Suggestions for further research. The researcher recommends additional research to test and analyze other factors which were not considered like:
1. Impact of age of the firm, previous dividend and tax on dividend payout policy of non-financial firms.
2. Determining dividend payout behaviour across sectors of firms listed on NSE.
3. Determining investors view on dividend policy by investigating portfolios of various investors e.g. demography so as to unearth the determinants of dividend policy
4. Also use other methods of analysis could be applied in future research to certify determinants of dividend payout polic

INTERNATIONAL JOURNAL OF SCIENTIFIC & TECHNOLOGY RESEARCH VOLUME 2, ISSUE 10, OCTOBER 2013 ISSN 2277-8616
265 IJSTR©2013 www.ijstr.org
References [1]. Pandey M.(2004) Financial management . vikas
publishing house PVT limited.
[2]. Al-Kuwari, D. (2009), Determinants of the Dividend Payout Ratio of Companies Listed on Emerging Stock Exchanges: The Case of the Gulf Cooperation Council (GCC) Countries. Global Economy & Finance Journal Vol. 2 No. 2 . Pp. 38-63
[3]. Anupam. M. (2012) An Empirical Analysis of
Determinants of Dividend Policy - Evidence from the UAE Companies. Global Review of Accounting and Finance Vol. 3.No. 1. 18 – 31
[4]. Abdullahi, R. (2011) Determinants of Dividend
Growth Pattern of the Deposit Money Banks in Nigeria (A Study Of Selected Banks) A Thesis Submitted for the Degree of Masters of Science (M.Sc) in Accounting and Finance Of Ahmadu Bello University, Zaria.
[5]. Al-Malkawi, H. (2007). Determinants of Corporate
Dividend Policy in Jordan: An Application of the Tobit Model. Journal of Economics and Administrative Sciences, 23 (2): 44-70.
[6]. Gordon J. Myron J. & Eli Shapiro, (1956), Capital
Equipment Analysis: The Required Rate of Profit, Management Science 3, 102-110.
[7]. Talat A. &Hammad H. (2011) Do Mature
Companies Pay More Dividends? Evidence from Pakistani Stock Market. Mediterranean Journal of Social Sciences Vol.2, No.2,
[8]. Daily nation 19th Jan. 2013
[9]. Nairobi securities exchange hand book 2012.
[10]. Brealey, R., & Myers, S. 2005, Principles of
Corporate Finance. London: McGraw-Hill, pp. 155–167.
[11]. Chay J. &Suh.J. (2008). Payout policy and cash-
flow uncertainty. Journal of Financial Economics 93:1, 88–107.
[12]. Fama, E., & French, K.,( 2001), ‗Changing Firm
Characteristics or Lower Propensity‘, Journal of Financial Economics, pp. 3–43.
[13]. Ahmed, H.&Javid, A.(2009) ―The Determinants of
Dividend Policy in Pakistan‖, International Research Journal of Finance and Economics, Issue 29, p. 110-125
[14]. Ahmed, H., &Javad, A. (2009), ‗Dynamics and
Determinants of Dividend Policy in Pakistan‘, International Research Journal of Finance and Economics, Vol.28, pp. 56–61.
[15]. Sajid et al (2012) The Relationship between Dividend Policy and Shareholder‘s Wealth‖ (Evidence from Pakistan) journal of Economics and Finance Review Vol. 2(2) pp. 55 – 59,
[16]. Arnott, D. &Asness, S. (2012) Does Dividend
Policy Foretell Earnings Growth? Social Science Electronic Publishing, Inc
[17]. Hafeez, A. and Attiya Y.(2008) Dynamics and
determinants of dividend policy in Pakistan evidence from Karachi stock exchange for non-financial listed firms. MPRA paper 37342
[18]. Hafeez. A. &Attiya Y (2008) Determinants of
dividend policy in Pakistan .Munich Personal RePEc Archive
[19]. Amidu, M. &Abor, J. (2006). Determinants of the
Dividend payout ratio in Ghana, The Journal of Risk Finance Vol. 7, N o. 2, 136-145.
[20]. Baker, K. & Gandhi, D. 2007, ‗The Perception of
Dividends by Canadian Managers: New Survey evidence‘, International Journal of Managerial Finance, Vol. 13 No. 1, pp. 70–91A
[21]. Aivazian, V.& S. Cleary, (2003), Do Emerging
Market Firms Follow Different Dividend Policies From U.S. Firms? The Journal of Financial Research 26, 371-387.
[22]. Kun-Li L. &Chung-Hua S. (2012) The Impact of
Corporate Governance on the Relationship between Investment Opportunities and Dividend Policy: An Endogenous Switching Model Approach Asia-Pacific Journal of Financial Studies (2012) 41, 125–145
[23]. Turki S. & Ahmed A (2013) Determination of
Dividend Policy: The Evidence from Saudi Arabia. International Journal of Business and Social Science Vol. 4 No. 1;
[24]. Mohammed S.& Mohammed M (2012) A Worthy
Factors Affecting Dividends Policy Decisions An Empirical Study on Industrial Corporations Listed in Amman Stock Exchange Interdisciplinary Journal of Contemporary Research in Business Vol 4, No 5
[25]. Taher A. (2012) Determinants of dividend payout
policy: Evidence from Bangladesh. International Journal of Economic Practices and Theories, Vol. 2,
[26]. AL- Shubiri F. 2011. Determinants of Changes
Dividend Behavior Policy: Evidence from the Amman Stock Exchange Amman Arab University Jordan College of Business, Department of Finance and Banking Groppelli and Nikbakht.
[27]. Eriotis, N. (2005) ―The Effect of Distributed
Earnings and Size of the Firm to Its Dividend
INTERNATIONAL JOURNAL OF SCIENTIFIC & TECHNOLOGY RESEARCH VOLUME 2, ISSUE 10, OCTOBER 2013 ISSN 2277-8616
266 IJSTR©2013 www.ijstr.org
Policy: Some Greek Data‖ International Business and Economics Journal, Vol. 4(1): 67-74.
[28]. Mahira K. (2012) Factors Affecting Dividend
Payout Evidence From Listed Non-Financial Firms of Karachi Stock Exchange Business Management Dynamics Vol.1, No.11, pp.76-92
[29]. Adaoglu, C.(2000), Instability in the Dividend Policy
of the Istanbul Stock Exchange (ISE) Corporations: Evidence from an Emerging Market, Emerging Markets Review 1, 252-270.
[30]. Naceur, S., &Goaied, M. (2006), ‗The Relationship
Between Dividend Policy, Financial Structure, Profitability and Firm Value‘, Applied Financial Economics, pp. 843–852.
[31]. Baker, H & Powell, G. (2001). ―Factors Influencing
Dividend policy decisions of Nasdaqfirms ‖Financial Review, 36 (3):780
[32]. Ahmad, H.& Carlos J.(2008) The financial factors
influencing cash dividend policy: A sample of U.S. manufacturing companies Inter Metro Business Journal Fall 2008 / Vol. 4 No. 2 / p. 23
[33]. Hassan, M. &Hosny I.(2012) Dividends Policies in
an Emerging Market International Review of Business Research Papers Vol. 8. No.2. Pp. 12 – 28
[34]. Chia-Ying C. et al. (2012) The Effects of Executive
Stock Options and Stock Bonuses on Payout Policies in Taiwan Asia-Pacific Journal of Financial Studies (2012) 41, 146–174
[35]. Syed Z. &Wasim U. (2011) Impact Of Ownership
Structure on Dividend Policy of Firm (Evidence from Pakistan) 2010 International Conference On E-Business, Management and Economics IPEDR Vol.3 (2011) IACSIT Press, Hong Kong
[36]. Hamid U. &Asma F.(2012) the Impact of
Ownership Structure on Dividend Policy Evidence from Emerging Markets KSE-100 Index Pakistan. International Journal of Business and Social Science Vol. 3 No. 9;
[37]. LaPorta R, Lo´ pez-de-Silanes F, Shleifer A,
Vishny R (2000). Agency problems and dividend policies around the world. Journal of Finance., 55: 1-33.
[38]. Anil, K., & S. Kapoor. 2008. Determinants of
dividend payout ratios: A study of Indian information technology sector. International Research Journal of Finance and Economics 15 (May): 63–71.
[39]. Khan M. & Jain P.(2008) Financial management,
text problems and cases. Tata McGraw- Hill publishing company limited New Delhi India
[40]. Jingyu L. (2003) dividend clienteles‘ financial
leverage clienteles and determinant of dividends policy under new zae land imputation tax regime. A PHD thesis Massey university.
[41]. Alsaeed, K., (2005). ―The association between
firm-specific characteristics and disclosure: the case of Saudi Arabia‖. The Journal of American Academy of Business, Vol.7 No. 1, PP 310-321.
[42]. Cooper, D. & Schindler, P.(2003). Business
research methods (8th ed.). Boston: MA: McGraw Hill
[43]. Hair, B. &Tatham (2010) Multivariate data
analysis.7th edition Prentice Hall
[44]. Hair et al (2006) Multivariate analysis. Pearson publishers.