insert title here - schedschd.ws/hosted_files/livingfuture2015/a3/thurs_1030_achieving net...owens...
TRANSCRIPT

#LF15

Making the World a Better Place
Living Future 2015
Gale Tedhams Director, Product and Supply Chain Sustainability
Owens Corning THE PINK PANTHER™ & © 1964–2015 Metro-Goldwyn-Mayer Studios Inc. All Rights Reserved. The color PINK is a registered trademark of Owens Corning Copyright © 2015 Owens Corning

Owens Corning at a Glance
• Founded in 1938, inventor of glass fibers
• 2014 sales: $5.3 billion
• 14,000 employees in 25 countries
• Fortune 500 ® company for 60 consecutive years
• An industry leader in glass fiber insulation, roofing and glass fiber reinforcements Insulation
Roofing
Composites
3

Recent Accomplishments
• Owens Corning received the National Safety Council’s
Green Cross for Safety on April 10, 2014 with 11 consecutive yr-over-yr safety improvements
• Listed on Dow Jones Sustainability World Index (5th year) and named Building Products Industry Leader for 2014
• One of 336 companies listed as "Best Places to Work for LGBT Equality,“ in Human Rights Campaign 2015 survey, perfect score for 10 years.


Sustainability Business Strategy
Driving to be a net-positive Company…
• Operations Sustainability
• Product and Supply Chain Sustainability
• Innovation and collaboration to deliver energy efficiency and durable material solutions at scale
• Safety, health, employee engagement and community vitality
Revised 4/8/2015

6.4
6.0 5.9 5.6 5.5
5.1
4.6
3.9 4.0
3.9 3.9
5.74
3.96
3.18
2.18
1.89
1.37
0.88 0.84
0.66 0.5
0.46 0.47 0.56
0
1
2
3
4
5
6
7
Industry
Owens Corning
RIR
It All Starts with Safety…
RIR = Number of employees injured per 200,000
hours worked. Injured is defined by OSHA
recordability guidelines *Bureau of Labor Statistics http://www.bls.gov/iif/oshsum.htm
NAICS - Goods Producing
Goal: Zero

Operations Sustainability

Handprints are the positive impacts we cause or enable to happen, relative to
“business as usual.”
• Footprint reduction, while essential, faces diminishing returns, is not enough and has a negative or limiting frame
Taking it to conclusion, better that the company go away to achieve zero impact
• Handprint creation is unlimited, aligns with business growth, has a positive/creative frame and can be exponential
The world is better off having Owens Corning operating
• Huge synergy potential when companies holistically address well-being and Handprinting in concert: engagement, positive inner work life,
creativity, teamwork
Collaboration with Sustainability and Health Initiative for NetPositive Enterprise
(SHINE ) with Co-Director, Dr. Greg Norris

The Wide Spectrum of Handprinting: A Scope of Scopes
2012 Effect on EnergyFootprint vs Handprint
-100,000,000
-50,000,000
0
50,000,000
100,000,000
150,000,000
200,000,000
Footprint Handprint
GJ
Energy (GJ)
Energy saved due to insulation products GRI EN6
Energy saved due to conservation and efficiency improvements (Scope 1&2) GRI EN5
Scope 3 Non-renewable energy use from OPEN IO
Scope 2 Indirect non-renewable primary energy consumption, GJ (GRI EN4)
Scope 1 Direct non-renewable primary energy consumption, GJ (GRI EN3)
GHG Protocol Scope 3 Standard, Source WRI

Handprint Dimensions
1. Energy Consumption
2. GHG Emissions
3. Waste to Landfill
4. Water Use
5. BioDiversity Impacts
6. Human Health Impacts
7. Economic Development and Community
8. Work Experience
2012 &
2013 data
Add with
2014 data

Growing our Handprint
Positive Impact Initiatives:
Insulation energy efficiency improvements in buildings
Composites vehicle light-weighting via steel replacement
Roofing: end-of-life shingle recycling for road paving
Transportation: carrier fuel switch from diesel to natural gas
12
Continuously Shrinking our Environmental Footprint and… Exponentially Growing our Positive Handprint

Effect on Energy (Consumed & Saved)
Scope 3
Energy saved from insulation sold
Scope 1 & 2
Energy saved from conservation & efficiency improvements
-48 -45
-40 -40
173 157
-100
-50
0
50
100
150
200
2013 2012
MM
Gig
ajo
ule
s
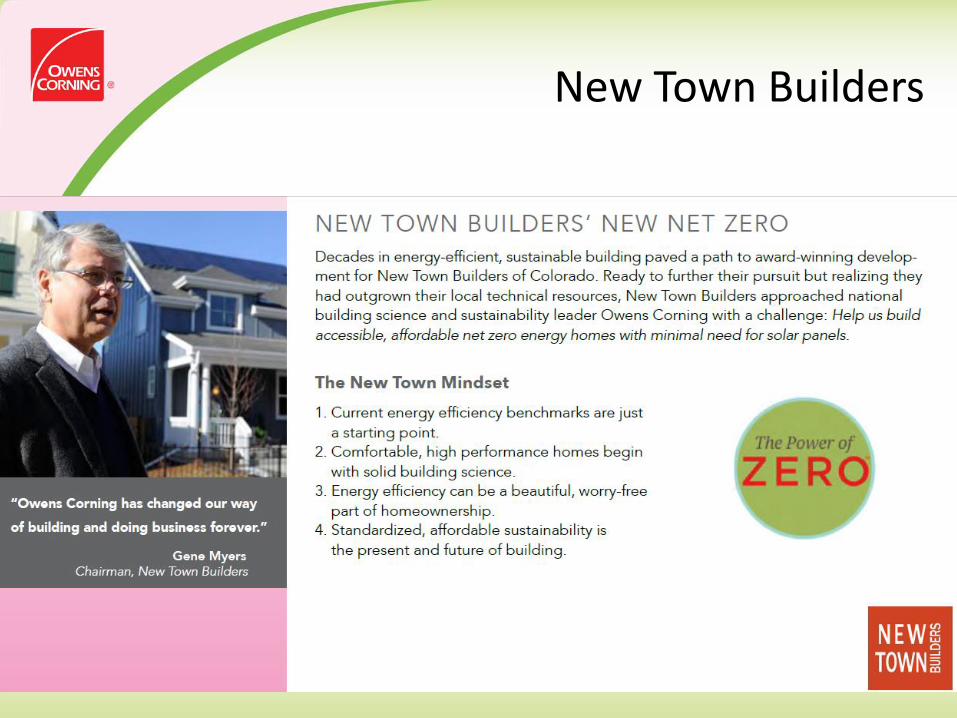
New Town Builders

New Town Case Study

Greenhouse Gas (GHG) Emissions
Avoided energy use from insulation sold Switch to fuel cell
Scope 1 & 2 Scope 3
Elimination of high GWP BA in XPS foam
-4 -4
-3 -3
9 8
-8
-4
0
4
8
12
2013 2012
MM
Met
ric
ton
ne
CO
2 e
q

Shingle Recycling
Owens Corning Roofing and Asphalt makes shingle
recycling differentiating, easy, and cost-competitive by
connecting contractors with eligible recycling services
Results1
– Over 100 open markets
– Over 60% population coverage
– Over 10% waste stream recycled in 2013 …1,000,000 tons
– Contractors save over 30% compared to landfill fees
1 Owens Corning Roofing and Asphalt results and estimates, March 2013.
HOT MIX ASPHALT
GRIND
DROP
TEAR-OFF
ROAD PAVING
R.A.S.
Connecting the Dots Through the Value Chain

Waste Type & Disposal Method
-595 -565
1,079 1,022
1,806
1,194
-1,000
-500
0
500
1,000
1,500
2,000
2,500
3,000
2013 2012
MM
Po
un
ds
Waste to landfill
Recycled shingles
Recycled glass usage

-10 -10
-83 -85
8 8
-120
-100
-80
-60
-40
-20
0
20
2013 2012
MM
Cu
bic
met
er
(m3)
Water use
Water use
Water use avoided by energy savings
Scope 3

Flourishing
Well-being
Growing
Happy Creativity
Volunteer
Relationships
Support
Pleasant
Workplace
Involvement
Longevity
+ +
+ +
+
+

Owens Corning Path to Flourishing
• Employee fitness employee nourishment
• Disease prevention/ numbers
• Safety stand/ program
• Environment for human performance
• Sustainability strong code of conduct
• Corporate giving
• Support to our communities
• Respected brand/ image
• Leading through our values
• Inclusive workplace and diverse workforce
• Competitive and caring
• Training & development
• Retirement and financial well being
• Health and social benefits
• Work/life balance support
• Broad based incentive programs
• 100% leadership development
• Communication/ engagement
• Meaningful and shared goals
• Skill development for job complexity
• Optimal work flow and design
• Supportive environment
• Job-level, collaborative decision making
• Personal and professional development

Reinforcing Cycle - Net Positive Impact
Workforce well-being
Population well-being Productivity
Worker Enterprise Nation
Host and Demographic Factors Health
Occupational Hazards
Environmental Factors
Workplace Factors
Socioeconomic Status
Relationship between workforce well being, productivity and population well being: A Heuristic Model
Overarching Goal: Employees First When a company actively chooses to contribute to the thriving of its workers, the company “gives more than it takes”, enabling the success and sustainability of the larger community.
Adapted from Schulte and Cainio, 2010 Collaboration with SHINE Co-Director, Dr. Eileen McNeely

WE ASPIRE TO BUILD MARKET-LEADING BUSINESSES; GLOBAL IN SCOPE – HUMAN IN SCALE
Our people and products make the world a better place.

#LF15