infrastructure 2020 – can the domestic supply chain … 2020 – can the domestic supply chain...
TRANSCRIPT

26 May 2008
Infrastructure 2020 – Can the domestic
supply chain match global demand?
EMBARGOED TO:
9:30am, Wednesday 28 May, 2008
Report by Access Economics Pty Limited for
Minerals Council of Australia

Infrastructure 2020
Disclaimer
While every effort has been made to ensure the accuracy of this document, the uncertain nature of economic data, forecasting and analysis means that Access Economics Pty Limited is unable to make any warranties in relation to the information contained herein. Access Economics Pty Limited, its employees and agents disclaim liability for any loss or damage which may arise as a consequence of any person relying on the information contained in this document. The views expressed in this report do not necessarily reflect the views of the Minerals Council of Australia.
TABLE OF CONTENTS
EXECUTIVE SUMMARY.........................................................................................................i
1. Despite strong investment, Australia has lost market share in key commodities .1
2. Global demand and supply.........................................................................................3
2.1 Global demand has jumped, with further gains ahead ........................................................3
2.2 Global supply has also grown solidly, but has been unable to match the gains in demand ................................................................................................................................5
3. Australian supply is set to increase solidly ..............................................................9
3.1 Australian supply side scenarios: Holding the Line ...........................................................13
4. The ‘advance’ and ‘decline’ scenarios.....................................................................25
4.1 Australian supply side scenarios: Decline .........................................................................25
4.2 Australian supply side scenarios: Advance .......................................................................26
4.3 The implications for Australian production.........................................................................27
5. A look back at previous expansion cycles..............................................................33
6. Is comparative advantage and a multi billion dollar prize enough?......................35
7. A shared role – private and government .................................................................38
7.1 Federal Treasury’s views on infrastructure........................................................................39
Appendix A .........................................................................................................................43

Infrastructure 2020
CHARTS
Chart 1: Change in Australia’s global market share, 2007 versus 2002 1
Chart 2: Mining output as a share of Australia’s GDP 2
Chart 3: Australian production – share of global consumption 2
Chart 4: Global demand growth, 2002 to 2007 3
Chart 5: Global industry scale increase required by 2020 4
Chart 6: Copper – global supply and demand growth 5
Chart 7: Nickel – global supply and demand growth 6
Chart 8: Aluminium – global supply and demand growth 7
Chart 9: Gold – global supply and demand growth 7
Chart 10: Zinc – global supply and demand growth 8
Chart 11: Change in Australia’s global market share, 2013 versus 2007 9
Chart 12: Business investment/GDP and the unemployment rate 10
Chart 13: Mining and metals projects listed as ‘definite’ in Investment Monitor 10
Chart 14: Industry scale increase required by 2020 11
Chart 15: Industry scale increase required by 2020 11
Chart 16: Capacity utilisation in the Australian mining sector 12
Chart 17: Increase in Australian industry scale increase required by 2020 14
Chart 18: Australian coal production 15
Chart 19: Australian production share, coal 16
Chart 20: Australian iron ore production 17
Chart 21: Australian production share, iron ore 17
Chart 22: Australian aluminium production 18
Chart 23: Australian production share, aluminium 18
Chart 24: Australian copper production 19
Chart 25: Australian production share, copper 20
Chart 26: Australian gold production 20
Chart 27: Australian production share, gold 21
Chart 28: Australian nickel production 22
Chart 29: Australian production share, nickel 22
Chart 30: Australian lead production 23
Chart 31: Australian production share, lead 23
Chart 32: Australian zinc production 24
Chart 33: Australian production share, zinc 24
Chart 34: The change in Australia’s global market share, 2007 versus 2002 25
Infrastructure 2020
Chart 35: The change in Australia’s global market share, 2013 versus 2007 26
Chart 36: Australian coal production under different supply scenarios 27
Chart 37: Australian iron ore production under different supply scenarios 28
Chart 38: Australian aluminium production under different supply scenarios 29
Chart 39: Australian copper production under different supply scenarios 29
Chart 40: Australian gold production under different supply scenarios 30
Chart 41: Australian nickel production under different supply scenarios 30
Chart 42: Australian lead production under different supply scenarios 31
Chart 43: Australian zinc production under different supply scenarios 31
Chart 44: Australia’s two mining booms 33
Chart 45: Five year annual average gains in Australian mining output 34
Chart 46 : Goonyella coal chain planned expansion 36
Chart 47 : There continues to be a mismatch between planned rail and port capacity 37
Chart 48 : The average age of Australia’s infrastructure 41
Chart 49: Index of the ability of infrastructure to support economic activity 41
Infrastructure 2020
i
EXECUTIVE SUMMARY
The Minerals Council of Australia commissioned Access Economics to consider potential supply scenarios for Australian mineral production. This paper presents those scenarios. It should be read in conjunction with an accompanying paper on global industrial commodity demand.
Australia is the world’s best supplier of industrial inputs to the developing world, and the developing world is having a boom of unparalleled size and length.
That conjunction of ability and opportunity might therefore suggest that Australia is sitting pretty, able to leverage off our existing comparative advantage in resources to sell into today’s boom.
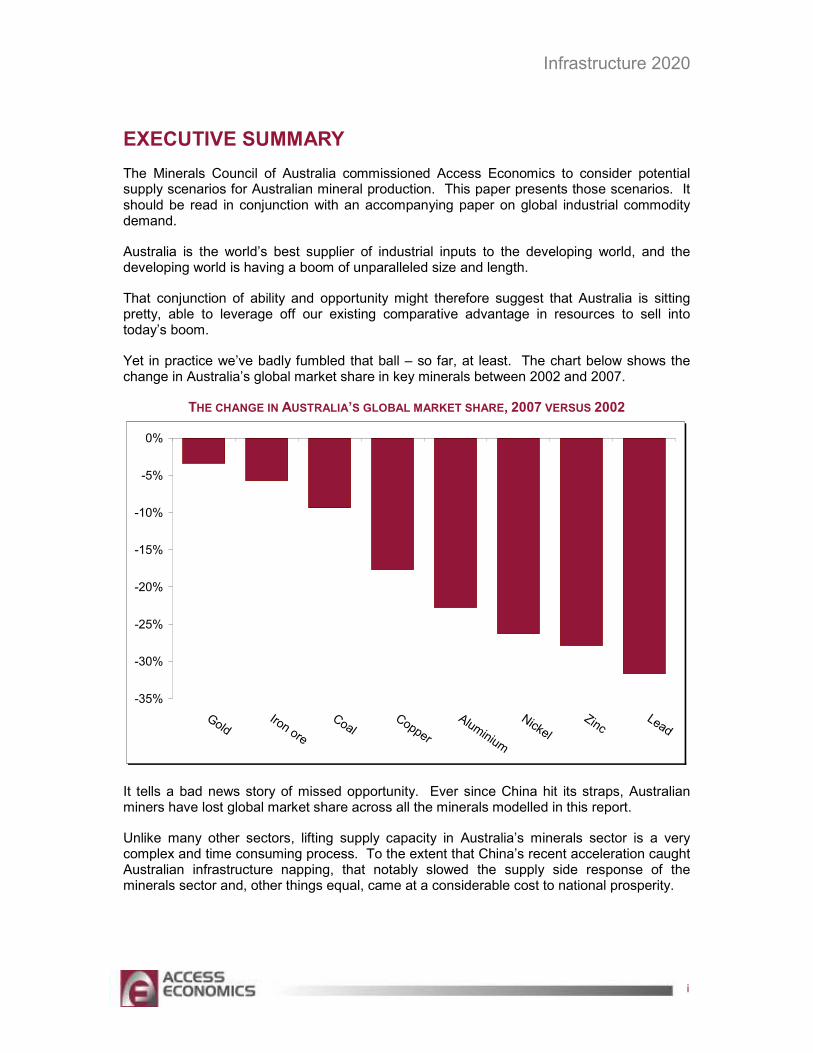
Yet in practice we’ve badly fumbled that ball – so far, at least. The chart below shows the change in Australia’s global market share in key minerals between 2002 and 2007.
THE CHANGE IN AUSTRALIA’S GLOBAL MARKET SHARE, 2007 VERSUS 2002
-35%
-30%
-25%
-20%
-15%
-10%
-5%
0%
GoldIron ore
CoalCopper
Aluminium
Nickel
ZincLead
It tells a bad news story of missed opportunity. Ever since China hit its straps, Australian miners have lost global market share across all the minerals modelled in this report.
Unlike many other sectors, lifting supply capacity in Australia’s minerals sector is a very complex and time consuming process. To the extent that China’s recent acceleration caught Australian infrastructure napping, that notably slowed the supply side response of the minerals sector and, other things equal, came at a considerable cost to national prosperity.

Infrastructure 2020
ii
Had we maintained our global market share between 2002 and 2007, then – at today’s prices – Australia’s miners would have earned another $17 billion, the equivalent of 1.6% of nominal national income in 2007.
But those opportunity costs could rise further yet, because the challenges arising from the continuing industrial revolution in half the world are huge.
As the companion paper to this report has noted, developing Asia (and elsewhere) will drive considerable further increase in global demand for minerals over time – even after allowing for the adoption of carbon taxes.
The chart below outlines the calculations (based on the AE-GLOBAL model) of the increase in global industry size required to meet projected commodity demand in 2020:
� For example, by 2020 global coal production needs to grow to be 45% more than 2006 production levels, while iron ore has to grow 54% above its 2006 scale, and aluminium to 58% above its 2006 production scale.
� This is a question of scale – very large increases in supply are required.
INCREASE IN GLOBAL INDUSTRY SCALE INCREASE REQUIRED BY 2020
0%
20%
40%
60%
80%
100%
120%
Gold Lead Coal Copper Iron ore Aluminium Zinc Nickel
And what will Australia’s role be in that continuing global commodity demand boom?
Although China has been booming for several years now, the supply side response in mining output in Australia is only now becoming apparent.
The good news is that there has been a sharp lift in investment in mining and metals in recent years, leading the Australian Bureau of Agricultural and Resource Economics – ABARE, the Federal Government’s commodity forecaster – to project good gains in Australian minerals output by 2013.
Infrastructure 2020
iii
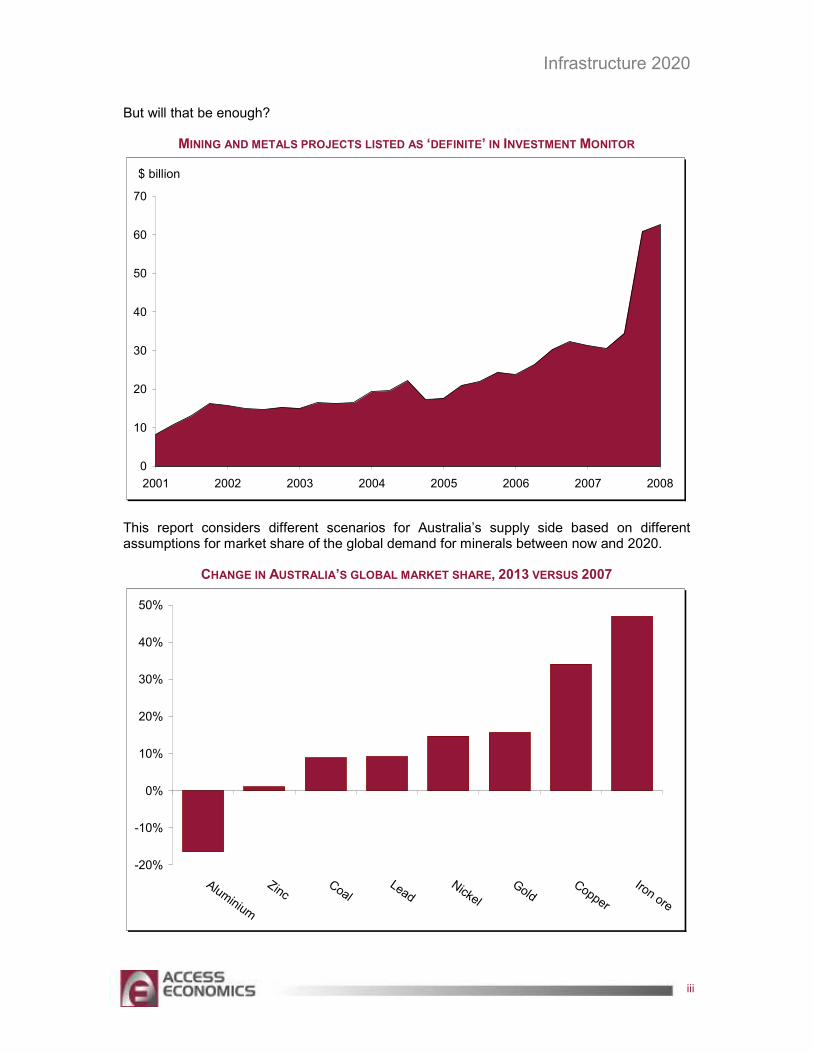
But will that be enough?
MINING AND METALS PROJECTS LISTED AS ‘DEFINITE’ IN INVESTMENT MONITOR
0
10
20
30
40
50
60
70
2001 2002 2003 2004 2005 2006 2007 2008
$ billion
This report considers different scenarios for Australia’s supply side based on different assumptions for market share of the global demand for minerals between now and 2020.
CHANGE IN AUSTRALIA’S GLOBAL MARKET SHARE, 2013 VERSUS 2007
-20%
-10%
0%
10%
20%
30%
40%
50%
Aluminium
ZincCoal
LeadNickel
GoldCopper
Iron ore

Infrastructure 2020
iv
These scenarios are termed Decline, Holding the Line, and Advance. Each of them builds off the ABARE production forecasts for Australia through to 2013. On that basis, the chart above suggests that, relative to the forecasts from the AE-GLOBAL model of world consumption of industrial commodities, Australia’s minerals sector is expected to turn the corner in its global market share of all the minerals modelled here except aluminium.
The scenarios then trace different paths between 2013 (the last year of the ABARE forecasts) and 2020 (the last year modelled here).
The Holding the Line scenario assumes that, beyond 2013, Australia maintains its global market share by mineral at its 2013 levels.
The conclusions from the Holding the Line scenario are clear – that the increases in Australian production of a number of minerals will have to jump well above 2007 levels by 2020. The chart below shows the requisite production task ahead of the Australian mining sector if it is to (a) hit ABARE production forecasts as at 2013 and then (b) maintain global market share through to 2020.
INCREASE IN AUSTRALIAN INDUSTRY SCALE INCREASE REQUIRED BY 2020
0%
20%
40%
60%
80%
100%
120%
140%
GoldAlum
inium
LeadCoal
Copper
ZincIron ore
Nickel
THE POLICY IMPLICATIONS
Make no mistake – even just holding the line is a huge task.
For example, it suggests the need to lift annual coal and iron ore volumes by 211 million tonnes and 328 million tonnes respectively over and above their 2007 levels. That is more than three times the matching lift in tonnages achieved across the period 2002 to 2007. For aluminium, the matching jump is almost five times that achieved from 2002 to 2007.
Infrastructure 2020
v
The corollary is equally clear. Australia has a tremendous comparative advantage in minerals, but taking full advantage of that – maximising the income of Australia and Australians – means being prepared for the physical infrastructure, workforce and regulatory implications of that further surge in commodity production in coming years.
Economic commentator John Edwards (2007, p. 37) has concluded that:
“The lesson of the new decade is that failures of supply can be as damaging as failures of demand. … Policies that influence supply … include the removal of infrastructure bottlenecks, the provision of additional infrastructure to meet expected demand, programs in education, and training and retraining that increase the supply of skilled workers.”
That means the Australian minerals sector needs public policymakers to set policy with an eye to the horizon, lest the continuing growth in global commodity demand catches us by surprise and limits our ability to pursue an area of strong comparative advantage as a nation.
We have already fumbled this ball once, but the surge in global commodity demand is continuing, and the risk of repeating our mistakes is rising. Future prosperity requires policies to start adjusting now to help ensure that the supply chains and regulatory frameworks will be in place for Australia to pursue its comparative advantage in minerals production.
Australia is the world's largest exporter of black coal, iron ore and gold. It is the leading producer of bauxite and alumina; the second largest producer of uranium, lead and zinc; the third largest producer of iron ore, nickel, manganese and gold; the fourth largest producer of black coal, silver and copper; and the fifth largest producer of aluminium.
Simply put, Australia is good at mining. Mining is a rich field of comparative advantage for the Australian economy relative to the rest of world – in part due to the quality and quantity of the natural resources on the continent, but also reflecting the high levels of productivity in the industry. Indeed mining is one of the few industries where Australia is a global productivity leader. This has led to Australia becoming a key part of the supply chain delivering resources into the emerging economies of Asia.
National productivity drives national living standards. Ensuring that resources can smoothly flow into the industry to meet global demand for more Australian exports is critical to maximise incomes in Australia.
The opportunity cost of not fully exploiting Australia’s comparative advantage in resources is becoming ever clearer. It means lower living standards if the minerals expansion is inhibited by avoidable capacity constraints in any part of the supply chain.
Decisions made today will significantly affect the relative position of Australia’s future living standards. If we fail to maximise the growth potential in industries where our comparative advantages lie, then our living standards (Australia’s average level of productivity per worker) will be lower than its potential by the extent of our failure to maximise our future incomes.
If Australia fails to expand its production base at optimal pace, then we are foregoing that income to another region or country. And if that happens, the production gap, once opened, will not be easily closed. History tells us that as global supply starts to make inroads on demand it quickly becomes far more difficult to find the capital from global markets to expand.

Infrastructure 2020
vi
Is Australia’s considerable comparative advantage in resources and a multi billion dollar prize for pursuing that comparative advantage enough to ensure it actually occurs?
Apparently not. Australia lost market share and billions in potential revenue and profits in the five years to 2007 as we failed to surf a structural shift up in commodity demand growth emanating from emerging market economies.
That means we can do better. We can pursue our considerable comparative advantage in minerals, to our considerable benefit.
The scale here is enormous. Australia’s Goonyella Coal Chain (GCC, our largest coal supply chain) loaded around 89 million tonnes in 2007. Access Economics estimates that global coal consumption will increase by around 1908 million tonnes between 2007 and 2020. That is an increase in global consumption of around 21 times Australia’s current output from the GCC.
A key message from this report is that Australia has to get the supply chain management right. This means resolving issues around infrastructure development, regulation and ongoing management to allow the minerals industry to expand and get as many commodities to market as is possible.
The question for Australian industry, policy makers and regulators is whether they are able to expand the supply chain in a timely fashion that will see Australian incomes maximised.
OUR ALTERNATIVE FUTURES
The Decline scenario assumes that, beyond 2013, Australia loses global market share at the same rate that it did from 2002 to 2007.
The Advance scenario assumes that, beyond 2013, Australia gains global market share at the same rate that it is projected to do (using a combination of ABARE production forecasts and Access Economics forecasts for global demand) from 2007 to 2013.
Note that these Australian supply side scenarios interact with the equivalent global demand side scenarios discussed in the companion demand paper to this report – for example, Australia might have rising market share in a slow growth world, or vice versa. These interactions are not pursued further here, but may be assessed directly by changing the assumptions fed into the AE-GLOBAL model.
Both the Decline and Advance scenarios would have a significant effect on national income. Using the latest minerals prices from April and May 2008 (and assuming an exchange rate of US 95 cents), the total value of output in 2020 can be calculated under each scenario in today’s dollars.
The implied dollar differences are vast.
The cost of ‘getting it wrong’ is striking. The Decline scenario implies that, in today’s dollars, Australia would be more than $91 billion worse off in 2020 alone compared to the Holding the Line scenario – 8½% of today’s national income.

Infrastructure 2020
vii
In contrast, the benefits of getting it right are even more massive. Australia’s national income would be almost $129 billion higher in 2020 under the Advance scenario than under the Holding the Line scenario – some 12% of today’s national income.
In both cases these are gross amounts – not the net benefit to Australia. To invest relatively more in minerals and the associated hard and soft infrastructure required to get them to market means that we would have less resources available to be invested in the ‘next best option’ (and vice versa).
However, Australia’s comparative advantage in resources suggests that this is a once in a lifetime opportunity to surf an incredible wave of global development.
As Treasury Secretary Ken Henry has noted (2006, p. 6):
“To date, we have responded well to the challenges of the ICT revolution, population ageing, the re-emergence of China and India and the discipline of a full capacity economy. ... Yet the risks of policy error are considerable. In our present economic circumstances, the premium on high quality policy decisions is unusually high.”
You bet.
ACCESS ECONOMICS 23 MAY 2008

Infrastructure 2020
1
1. DESPITE STRONG INVESTMENT, AUSTRALIA HAS LOST MARKET SHARE IN KEY COMMODITIES
We’re good at this:
� Australia is the world’s best supplier of industrial inputs to the developing world.
� And the developing world is having a boom of unparalleled size.
That conjunction of ability and opportunity therefore suggests Australia is sitting pretty, able to leverage off our existing comparative advantage in resources to sell into today’s boom.
Yet in practice we’ve badly fumbled that ball – so far, at least. Chart 1 shows the change in Australia’s global market share for key minerals between 2002 and 2007.
CHART 1: CHANGE IN AUSTRALIA’S GLOBAL MARKET SHARE, 2007 VERSUS 2002
-35%
-30%
-25%
-20%
-15%
-10%
-5%
0%
GoldIron ore
CoalCopper
Aluminium
Nickel
ZincLead
It tells a bad news story of missed opportunity. Australian miners have lost global market share across all the minerals modelled in the AE-GLOBAL model ever since China hit its straps.
That has already cost Australia’s economy dearly. Had we maintained our global market share between 2002 and 2007, then – at today’s prices – Australia’s miners would have earned another $17 billion, the equivalent of 1.6% of nominal national income in 2007.
Indeed, as Chart 2 shows, Australia’s mining sector has also lost market share within Australia’s economy as a whole across that same period.

Infrastructure 2020
2
CHART 2: MINING OUTPUT AS A SHARE OF AUSTRALIA’S GDP
4%
5%
6%
7%
8%
1980 1983 1986 1989 1992 1995 1998 2001 2004 2007
Share of GDP
That is not to say that Australia is unimportant in world markets. Even if we have been losing market share, we remain a major player – as Chart 3 shows.
CHART 3: AUSTRALIAN PRODUCTION – SHARE OF GLOBAL CONSUMPTION
0%
2%
4%
6%
8%
10%
12%
14%
16%
18%
Copper
Aluminium
LeadGold
CoalZinc
Nickel
Iron ore
Rather, the message here is a simple one: We can do better.

Infrastructure 2020
3
2. GLOBAL DEMAND AND SUPPLY
2.1 GLOBAL DEMAND HAS JUMPED, WITH FURTHER GAINS AHEAD
Half the world is having an industrial revolution. That is raising not merely global growth, but doing so in a particularly commodity hungry manner, as demand for industrial commodities grows fastest in the income range of $US 3-15,000 per head.
The rapid evolution from farm- to factory-based economies has generated the most sustained burst of global growth since the 1950s, with China and India leading the charge.
By the time that process is complete we will look back on the strongest period of sustained global growth since the industrialisation of the West. Moreover, that boom will have completely transformed the global demand for industrial commodities.
A jump in productivity in the likes of China is occurring as workers move from farms and into factories. That is important, because the demand most relevant to mineral commodity prices tends to be that in the ‘smokestack’ nations of the world.
In turn, this strong industrial production growth among the globe’s emerging economies leads to increasing demand for base metals such as aluminium, copper, nickel, zinc, lead and steel (and hence iron ore and coal) because they are key inputs into manufactured goods and large scale infrastructure projects (such as railway tracks, telephone lines, buildings and the like).
CHART 4: GLOBAL DEMAND GROWTH, 2002 TO 2007
-10%
0%
10%
20%
30%
40%
50%
60%
70%
GoldCopper
ZincNickel
LeadCoal
Aluminium
Iron ore

Infrastructure 2020
4
Recent decades have mostly been characterised by, on average, steady growth for industrial commodities at rates that lagged behind overall global growth. But that characterisation changed earlier this decade and, as Chart 4 shows, global commodity demand has leapt sharply over the past five years. That chart shows total global demand growth for these commodities in the five years to 2007. Put differently, the annual average demand increases for everything other than gold have swamped the longer term experience, ranging from rates a little below global growth (copper), to being in line with global growth (zinc and nickel), to being well above it (the rest).
The gains in iron ore demand have perhaps been the most remarkable of all – growing at an average annual pace of more than 10% a year in the five years to 2007.
But that’s not the important point. The important point is that more of the same lies ahead – as the modelling in the companion paper to this report showed, global demand for many of the commodities Australia produces and exports is set to grow strongly by 2020.
This presents Australia’s miners, policymakers and regulators with a complex set of challenges as they struggle to significantly expand the Australian supply chain in a timely fashion that will see Australians maximise the income associated with Australia’s comparative advantage.
Chart 5 outlines the calculations (based on the AE-GLOBAL model) of the increase in global industry size required to meet projected commodity demand in 2020.
� For example, by 2020 global coal production needs to grow to be 45% more than 2006 production levels, while iron ore has to grow 54% above its 2006 scale, and aluminium to 58% above its 2006 production scale.
� This is a question of scale – very large increases in supply are required.
CHART 5: GLOBAL INDUSTRY SCALE INCREASE REQUIRED BY 2020
0%
20%
40%
60%
80%
100%
120%
Gold Lead Coal Copper Iron ore Aluminium Zinc Nickel
Infrastructure 2020
5
This trend will continue, with emerging economy demand expected to keep growing strongly while demand in the industrialised economies lags behind. For example, over the period to 2013 ABARE expects that China will account for around 70% of the growth in aluminium consumption.
2.2 GLOBAL SUPPLY HAS ALSO GROWN SOLIDLY, BUT HAS BEEN UNABLE TO MATCH THE GAINS IN DEMAND
This is not just a demand story. The global supply of commodities has also lifted sharply over the past few years as miners have responded to higher prices. But demand gains have been rather faster than those on the supply front meaning that, as yet, the lift in production has done little to suppress price growth, with the latter hitting new highs for many minerals.
Even so, supply growth has been strong across a range of commodities, though in many instances the ability to bring new capacity on line has been affected by a combination of factors ranging from shortages of key equipment and long lead times for delivery, to skill shortages and instability in the countries where mineral deposits are being developed.
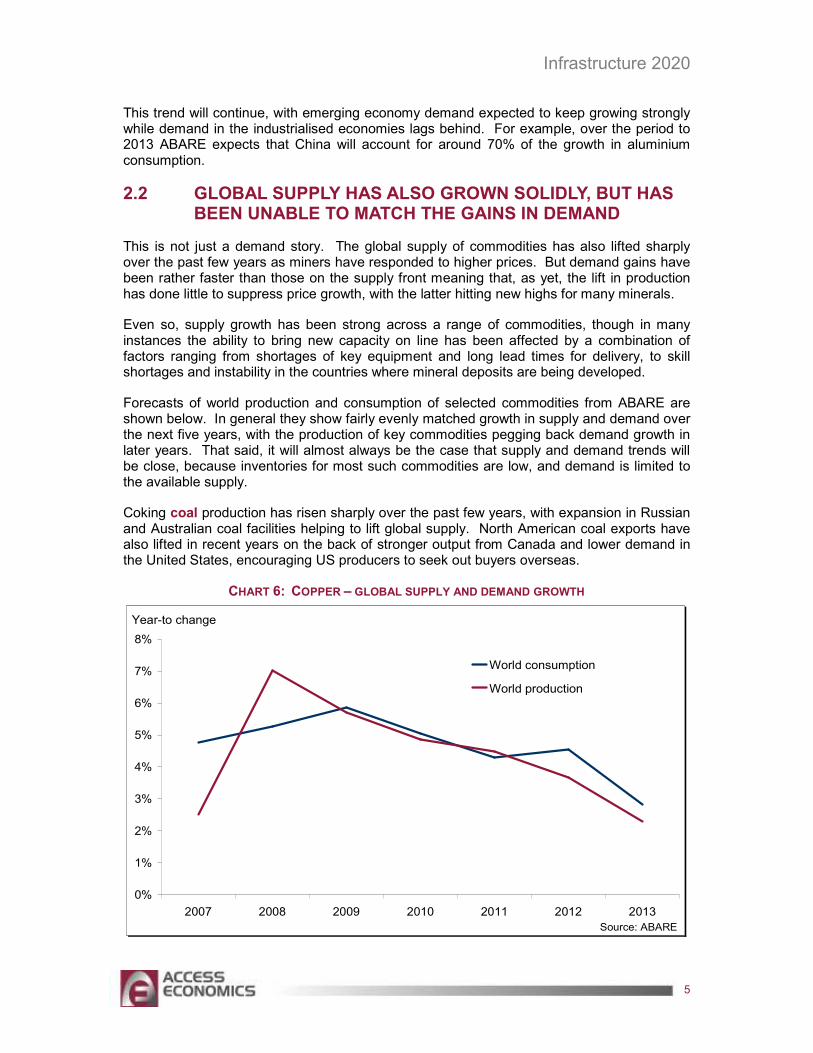
Forecasts of world production and consumption of selected commodities from ABARE are shown below. In general they show fairly evenly matched growth in supply and demand over the next five years, with the production of key commodities pegging back demand growth in later years. That said, it will almost always be the case that supply and demand trends will be close, because inventories for most such commodities are low, and demand is limited to the available supply.
Coking coal production has risen sharply over the past few years, with expansion in Russian and Australian coal facilities helping to lift global supply. North American coal exports have also lifted in recent years on the back of stronger output from Canada and lower demand in the United States, encouraging US producers to seek out buyers overseas.
CHART 6: COPPER – GLOBAL SUPPLY AND DEMAND GROWTH
0%
1%
2%
3%
4%
5%
6%
7%
8%
2007 2008 2009 2010 2011 2012 2013
World consumption
World production
Source: ABARE
Year-to change
Infrastructure 2020
6
ABARE also expects coal exports from Africa to lift over the coming years, with a major mine in Mozambique currently being developed. In all, coal exports are forecast to increase by close to 4% per year over the five years to 2013, with Australia leading the way in production.
World copper production is expected to increase by some 7% in 2008 after an expansion to supply capacity in China and Chile. African copper output is also expected to increase over the coming years due to a new mine in Zambia, while production expansion in the United States will also contribute to increased supply. Australia’s copper production is also set to increase, with refined copper production set to rise with the completion of an upgrade to the Townsville copper refinery in Queensland.
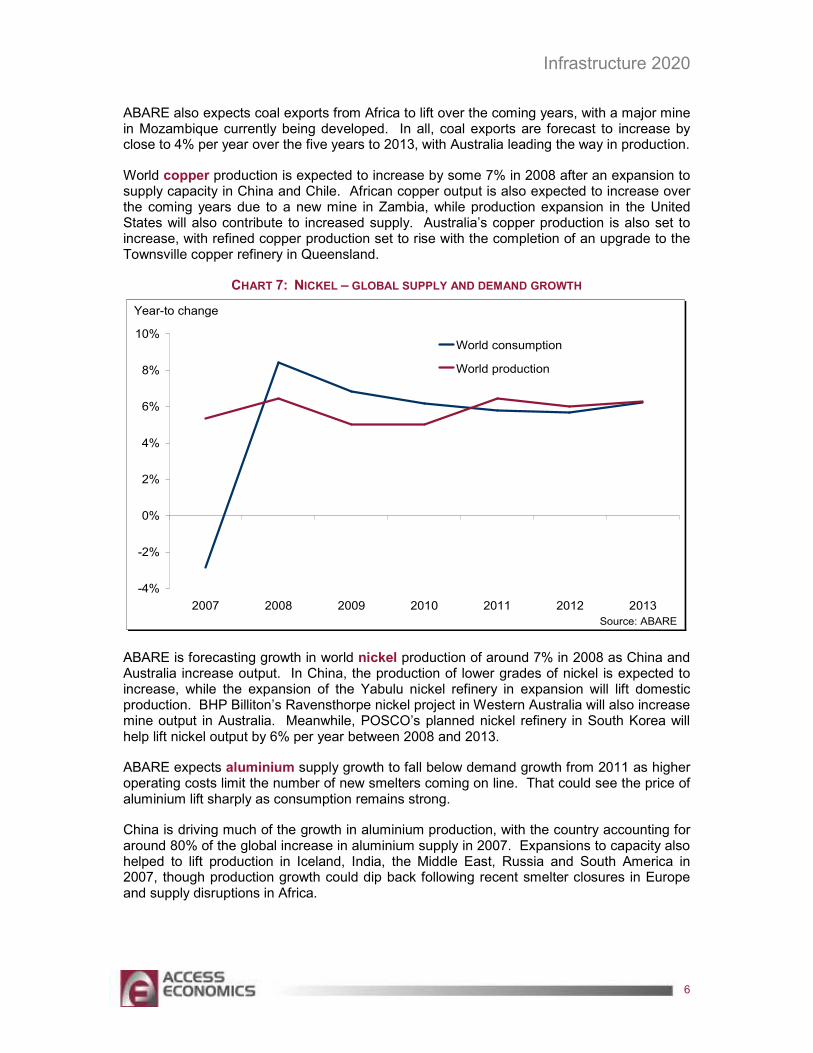
CHART 7: NICKEL – GLOBAL SUPPLY AND DEMAND GROWTH
-4%
-2%
0%
2%
4%
6%
8%
10%
2007 2008 2009 2010 2011 2012 2013
World consumption
World production
Year-to change
Source: ABARE
ABARE is forecasting growth in world nickel production of around 7% in 2008 as China and Australia increase output. In China, the production of lower grades of nickel is expected to increase, while the expansion of the Yabulu nickel refinery in expansion will lift domestic production. BHP Billiton’s Ravensthorpe nickel project in Western Australia will also increase mine output in Australia. Meanwhile, POSCO’s planned nickel refinery in South Korea will help lift nickel output by 6% per year between 2008 and 2013.
ABARE expects aluminium supply growth to fall below demand growth from 2011 as higher operating costs limit the number of new smelters coming on line. That could see the price of aluminium lift sharply as consumption remains strong.
China is driving much of the growth in aluminium production, with the country accounting for around 80% of the global increase in aluminium supply in 2007. Expansions to capacity also helped to lift production in Iceland, India, the Middle East, Russia and South America in 2007, though production growth could dip back following recent smelter closures in Europe and supply disruptions in Africa.

Infrastructure 2020
7
CHART 8: ALUMINIUM – GLOBAL SUPPLY AND DEMAND GROWTH
0%
2%
4%
6%
8%
10%
12%
14%
2007 2008 2009 2010 2011 2012 2013
World consumption
World production
Year-to change
Source: ABARE
Chart 9 shows global production of gold fell over the four years to 2007-08, placing upward pressure on prices. In 2007, output falls were evident in South Africa, the United States, Peru and Argentina, though mine output lifted in China, Indonesia, Ghana, Brazil and Mexico.
CHART 9: GOLD – GLOBAL SUPPLY AND DEMAND GROWTH
-8%
-6%
-4%
-2%
0%
2%
4%
6%
8%
2007 2008 2009 2010 2011 2012 2013
World consumption
World production
Year-to change
Source: ABARE
Infrastructure 2020
8
Though gold production is expected to rise over the coming years, the lift is likely to be modest. New mines in Australia, South Africa and South America will add to output, though existing mines are becoming increasingly mature.
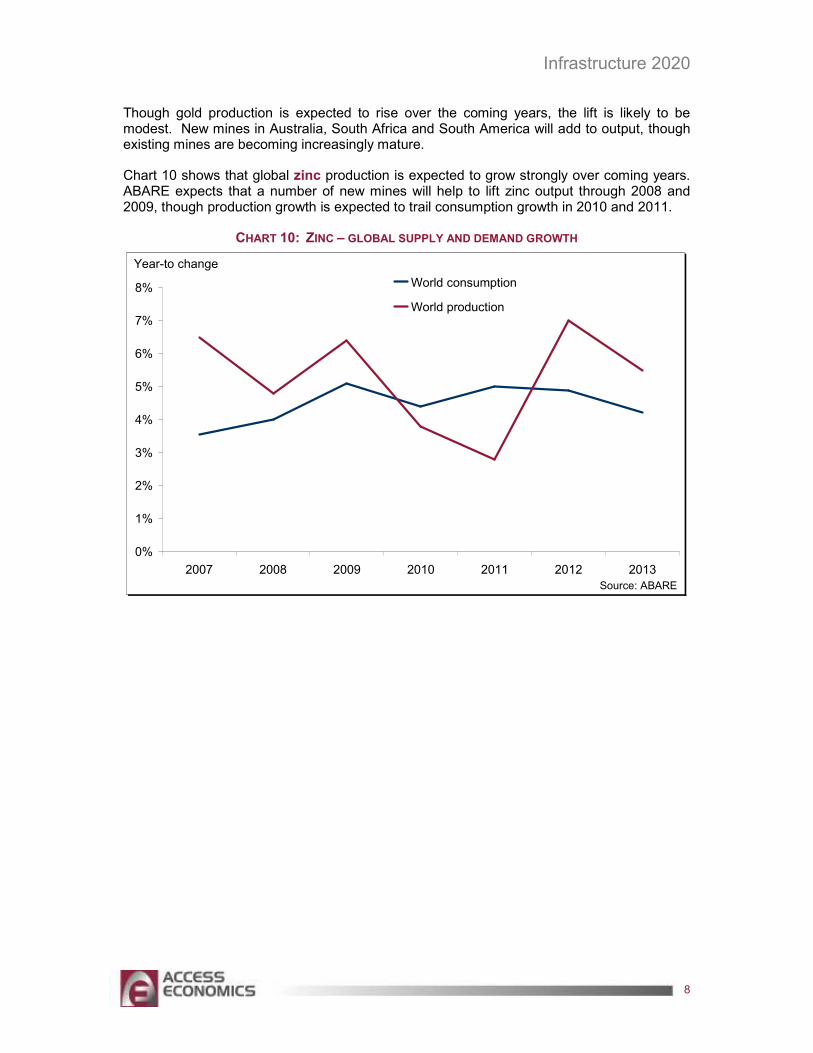
Chart 10 shows that global zinc production is expected to grow strongly over coming years. ABARE expects that a number of new mines will help to lift zinc output through 2008 and 2009, though production growth is expected to trail consumption growth in 2010 and 2011.
CHART 10: ZINC – GLOBAL SUPPLY AND DEMAND GROWTH
0%
1%
2%
3%
4%
5%
6%
7%
8%
2007 2008 2009 2010 2011 2012 2013
World consumption
World production
Year-to change
Source: ABARE
Infrastructure 2020
9
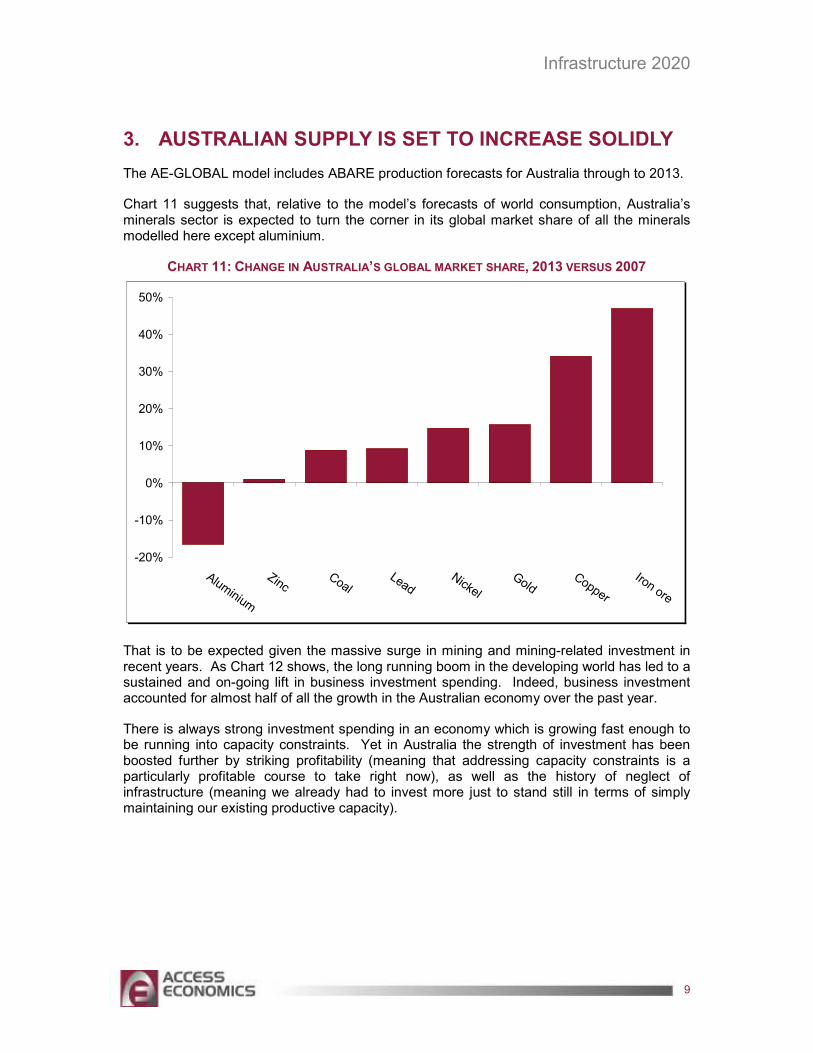
3. AUSTRALIAN SUPPLY IS SET TO INCREASE SOLIDLY
The AE-GLOBAL model includes ABARE production forecasts for Australia through to 2013.
Chart 11 suggests that, relative to the model’s forecasts of world consumption, Australia’s minerals sector is expected to turn the corner in its global market share of all the minerals modelled here except aluminium.
CHART 11: CHANGE IN AUSTRALIA’S GLOBAL MARKET SHARE, 2013 VERSUS 2007
-20%
-10%
0%
10%
20%
30%
40%
50%
Aluminium
ZincCoal
LeadNickel
GoldCopper
Iron ore
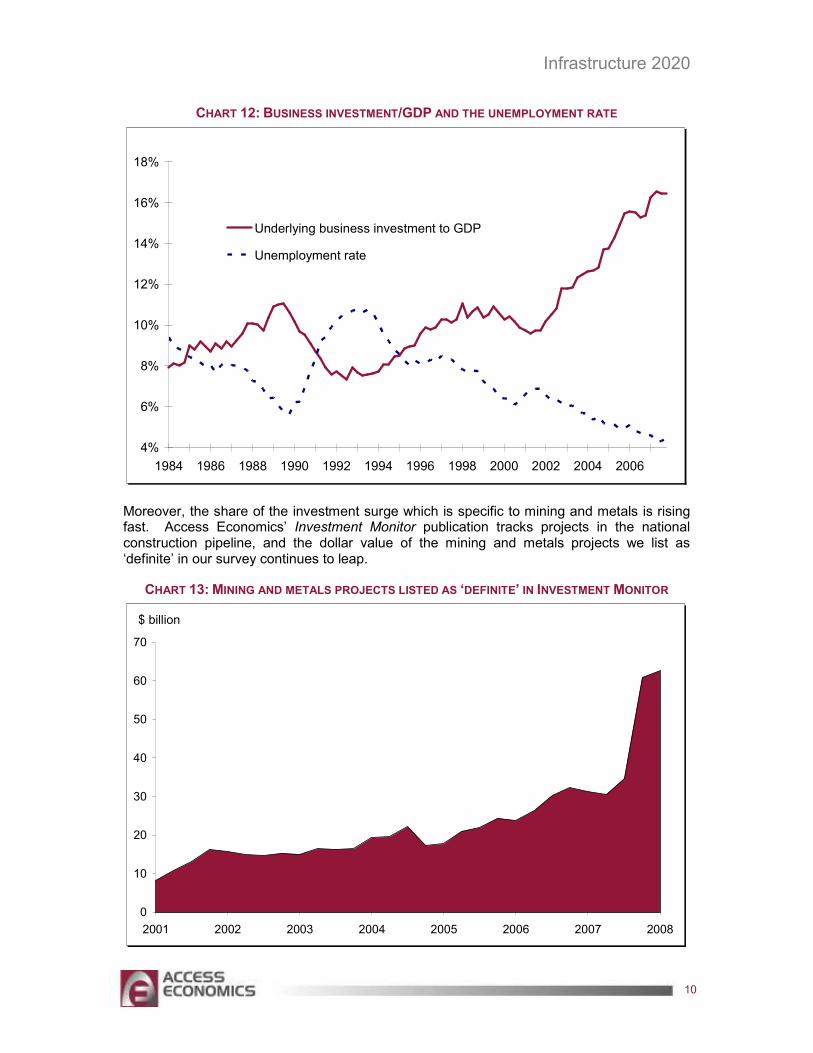
That is to be expected given the massive surge in mining and mining-related investment in recent years. As Chart 12 shows, the long running boom in the developing world has led to a sustained and on-going lift in business investment spending. Indeed, business investment accounted for almost half of all the growth in the Australian economy over the past year.
There is always strong investment spending in an economy which is growing fast enough to be running into capacity constraints. Yet in Australia the strength of investment has been boosted further by striking profitability (meaning that addressing capacity constraints is a particularly profitable course to take right now), as well as the history of neglect of infrastructure (meaning we already had to invest more just to stand still in terms of simply maintaining our existing productive capacity).
Infrastructure 2020
10
CHART 12: BUSINESS INVESTMENT/GDP AND THE UNEMPLOYMENT RATE
4%
6%
8%
10%
12%
14%
16%
18%
1984 1986 1988 1990 1992 1994 1996 1998 2000 2002 2004 2006
Underlying business investment to GDP
Unemployment rate
Moreover, the share of the investment surge which is specific to mining and metals is rising fast. Access Economics’ Investment Monitor publication tracks projects in the national construction pipeline, and the dollar value of the mining and metals projects we list as ‘definite’ in our survey continues to leap.
CHART 13: MINING AND METALS PROJECTS LISTED AS ‘DEFINITE’ IN INVESTMENT MONITOR
0
10
20
30
40
50
60
70
2001 2002 2003 2004 2005 2006 2007 2008
$ billion

Infrastructure 2020
11
Turning to the increase in the dollar value of projects we list as ‘definite’, the growth of those over the past year is relatively moderate across a range of sectors. As Chart 14 shows, that is true, for example, for farm-related business investment, as well as projects in ‘social infrastructure’ (including the likes of hospitals and schools) and in much of manufacturing.
That suggests that, outside of resources, the investment pipeline is solid but definitely not spectacular.
CHART 14: INDUSTRY SCALE INCREASE REQUIRED BY 2020
-2
0
2
4
6
Mar-04 Sep-04 Mar-05 Sep-05 Mar-06 Sep-06 Mar-07 Sep-07 Mar-08
Farm-related
Other manufacturing
Social infrastructure
$ billion change on year earlier
Source: Access Economics
Yet, despite that, the overall business investment outlook remains remarkably strong: it is just increasingly becoming one-dimensional.
CHART 15: INDUSTRY SCALE INCREASE REQUIRED BY 2020
-10
-5
0
5
10
15
20
25
30
35
Mar-04 Sep-04 Mar-05 Sep-05 Mar-06 Sep-06 Mar-07 Sep-07 Mar-08
Commercial building
Mining & metals
Economic infrastructure
$ billion change on year earlier
Source: Access Economics
The numbers involved are massive. Three years ago the level of definite investment in Australia’s mining and metals sectors was $18 billion – now it is $63 billion. And three years
Infrastructure 2020
12
ago the value of projects we list as ‘in planning’ in mining and metals was $79 billion – now it is a stunning $134 billion.
So mining investment – already huge – is set to lift even further, with the second chart here showing that the increase in the dollar value of projects we list as ‘definite’ in the ‘mining and metals’ sector as absolutely jumping over the past year.
The forward agenda for economic infrastructure also remains strong – just not quite as strong as the outlook for the mining sector. Transport, ports and energy generation are all getting their fair share of investment dollars. There are, for example, port upgrades underway in Western Australia and Queensland.
The failure of business and Government to forecast the dramatic increase in global demand for commodities meant that Australia was underprepared for the resources boom. A lack of infrastructure capacity has therefore constrained Australia’s export growth.
While export values have increased markedly due to rapidly rising commodity prices, export volumes have disappointed, reflecting the constraints on Australia’s miners in getting their product to market due to insufficient rail and port infrastructure and a lack of skilled labour.
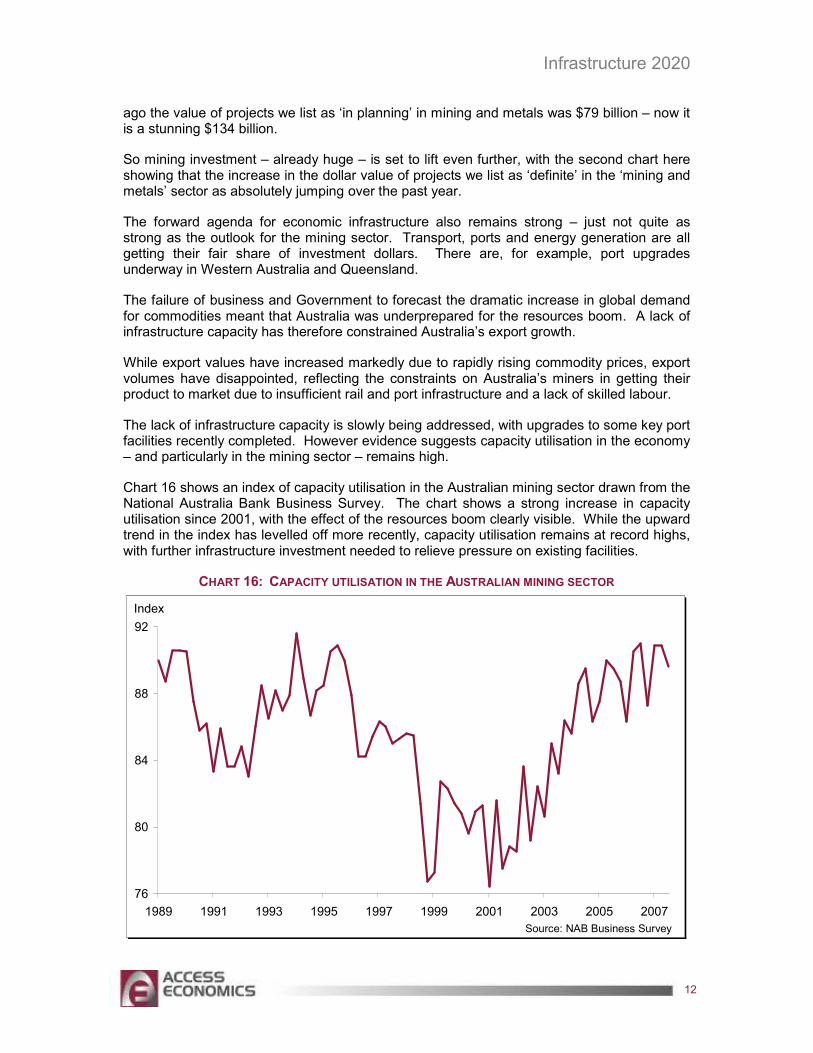
The lack of infrastructure capacity is slowly being addressed, with upgrades to some key port facilities recently completed. However evidence suggests capacity utilisation in the economy – and particularly in the mining sector – remains high.
Chart 16 shows an index of capacity utilisation in the Australian mining sector drawn from the National Australia Bank Business Survey. The chart shows a strong increase in capacity utilisation since 2001, with the effect of the resources boom clearly visible. While the upward trend in the index has levelled off more recently, capacity utilisation remains at record highs, with further infrastructure investment needed to relieve pressure on existing facilities.
CHART 16: CAPACITY UTILISATION IN THE AUSTRALIAN MINING SECTOR
76
80
84
88
92
1989 1991 1993 1995 1997 1999 2001 2003 2005 2007
Index
Source: NAB Business Survey
Infrastructure 2020
13
Further infrastructure upgrades and reforms need to occur to ensure Australia maintains export growth. Despite the exceptional rise in the terms of trade, net exports accounted for a little more than one-eighth of Australian GDP growth over the five years to 2007, down from one-third over the previous two decades. Reforms are needed which reduce regulatory burdens and make it easier for firms to undertake investment projects. Additionally, earlier identification of infrastructure bottlenecks and capacity constraint hot-spots needs to occur.
Further infrastructure upgrades will boost national income by enabling miners to supply their product to market more quickly. With demand in the economy currently outstripping supply, putting upward pressure on prices, alleviating capacity constraints will also help to reduce inflation by boosting the supply side of the economy.
The facilitation of some of these measures may be helped by a new body announced by the Federal Government – Infrastructure Australia. This body, chaired by Sir Rod Eddington, will advise the public and private sectors on national infrastructure priorities. It will also administer the $20 billion infrastructure fund announced in the 2008-09 Federal Budget. While these funds in the Budget will cover road and other projects, it is likely that a significant portion of the fund will go towards ports and other mining-related infrastructure as well.
Infrastructure Australia will also develop nationally consistent guidelines for undertaking Public-Private-Partnership projects, reducing regulatory burden, and will undertake regular audits to assess the adequacy of existing facilities.
While that $20 billion fund has the potential to boost public spending on infrastructure over time, private spending has been strong over recent years. Major upgrades to port and rail facilities in Queensland and Western Australia have been completed, with more projects currently underway or in planning stages.
As a result, in 2008-09 alone there may be considerable increases in the volume of output of nickel, LNG, copper, iron ore, thermal coal, oil, gold, alumina and zinc. In each case, the growth in output of these minerals is expected to be greater than the output growth in the wider Australian economy.
Some sectors are seeing more modest gains, including both coking coal and aluminium. However, the pipeline of investment underway in mining has never been stronger, and its payoff period in production edges ever closer. For example, BHP Billiton aims to lift its annual production capacity of 105 million tonnes to 155 million tonnes in 2010 and 300 million tonnes by 2015. Not to be outdone, Rio aims to lift its capacity from 179 million tonnes in 2007 to 320 million tonnes by 2013.
Moreover, the medium term momentum in mining output is striking. There are 50 ‘advanced’ minerals mining and processing projects, and a further 182 ‘less advanced projects’ (projects either undergoing a feasibility study or where no definite decision has been made to proceed) representing an investment of $140 billion.
Not all of that investment will go ahead, but much of it will. And, although it will take time, those investments will eventually show up as more mining output.
3.1 AUSTRALIAN SUPPLY SIDE SCENARIOS: HOLDING THE LINE
The following set of charts lays out the recent performance of Australian mineral production, as well as scenario-based projections.
Infrastructure 2020
14
There are two charts for each mineral modelled here – one showing the level of Australian output, and the second showing Australian output as a share of global demand.
As noted, in each case the forecasts use a combination of global demand forecasts from the AE-GLOBAL model, in combination with:
� ABARE production forecasts to 2013.
� Forecasts to 2020 which then follow one of three scenarios. These scenarios are termed Decline, Holding the Line, and Advance, where these names refer to the post-2013 experience in Australian market share.
The scenario discussed here – the Holding the Line scenario – assumes that, beyond 2013, Australia maintains its global market share by mineral at its 2013 levels.
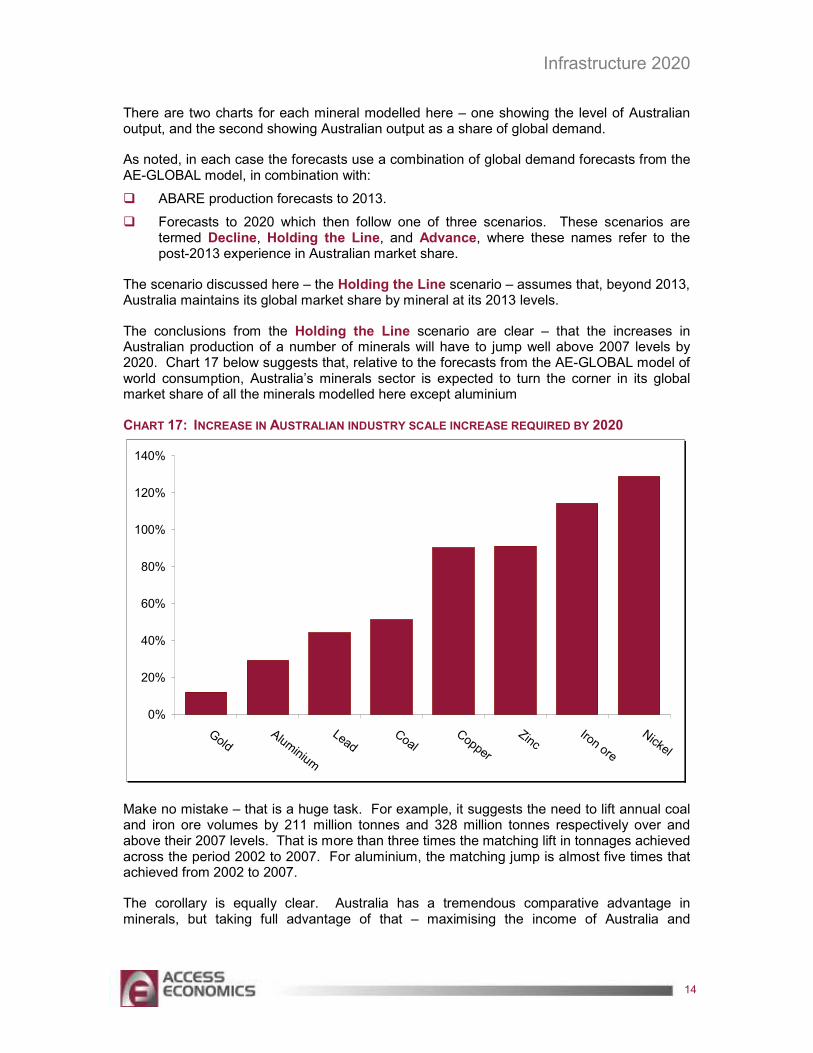
The conclusions from the Holding the Line scenario are clear – that the increases in Australian production of a number of minerals will have to jump well above 2007 levels by 2020. Chart 17 below suggests that, relative to the forecasts from the AE-GLOBAL model of world consumption, Australia’s minerals sector is expected to turn the corner in its global market share of all the minerals modelled here except aluminium
CHART 17: INCREASE IN AUSTRALIAN INDUSTRY SCALE INCREASE REQUIRED BY 2020
0%
20%
40%
60%
80%
100%
120%
140%
GoldAlum
inium
LeadCoal
Copper
ZincIron ore
Nickel
Make no mistake – that is a huge task. For example, it suggests the need to lift annual coal and iron ore volumes by 211 million tonnes and 328 million tonnes respectively over and above their 2007 levels. That is more than three times the matching lift in tonnages achieved across the period 2002 to 2007. For aluminium, the matching jump is almost five times that achieved from 2002 to 2007.
The corollary is equally clear. Australia has a tremendous comparative advantage in minerals, but taking full advantage of that – maximising the income of Australia and

Infrastructure 2020
15
Australians – means being prepared for the physical infrastructure, workforce and regulatory implications of that further surge in commodity production in coming years.
That means the Australian minerals sector needs public policymakers to set policy with an eye to the horizon, lest the continuing growth in global commodity demand catches us by surprise and limits our ability to pursue an area of strong comparative advantage as a nation.
We have already fumbled this ball once, but the surge in global commodity demand is continuing, and the risk of repeating our mistakes is rising. Future prosperity requires policies to start adjusting now to help ensure that the supply chains and regulatory frameworks will be in place for Australia to pursue its comparative advantage in minerals production.
The following charts outline the forecast for Australian production volumes by mineral under the Holding the Line scenario.
CHART 18: AUSTRALIAN COAL PRODUCTION
-
100,000
200,000
300,000
400,000
500,000
600,000
700,000
1998 2000 2002 2004 2006 2008 2010 2012 2014 2016 2018 2020
Kt
Forecast
Chart 18 shows that Australian black coal production is set to grow strongly over the forecast period, building on moderate gains achieved over the past decade. Coal is Australia’s key energy source and a major input into the production of steel. For these reasons, the industrialisation of developing countries such as China has played an important role in underpinning global coal demand.
Infrastructure upgrades to key coal links will also improve Australian coal export growth. An expansion of the Kooragang Island coal terminal and the development of a third coal terminal in Newcastle will help to increase exports from New South Wales, while upgrades to the RG Tanna and Dalrymple Bay coal terminals in Queensland are also helping to ease capacity constraints.

Infrastructure 2020
16
Chart 19 shows Australian coal production as a share of global coal demand is expected to rebound from 2009 and thereafter as new mine projects increasingly come on-stream, boosting mine capacity.
CHART 19: AUSTRALIAN PRODUCTION SHARE, COAL
7.0%
7.5%
8.0%
8.5%
9.0%
9.5%
10.0%
1998 2002 2006 2010 2014 2018
ABARE forecast Model assumption
A recent review of the supply chain at the supply capacity noted that:
“A coordinated approach to master planning of infrastructure is essential. The situation where investments are being made without concurrent investment in other parts of the supply chain and then additional forecast tonnages are contracted out should never be allowed to happen again. The regulatory frameworks that underpin the governance of the supply chain should support this approach. Implementing the facilitation and coordination roles will be a significant step in moving forward.” Goonyella Coal Chain Capacity Review – Second and Final Report
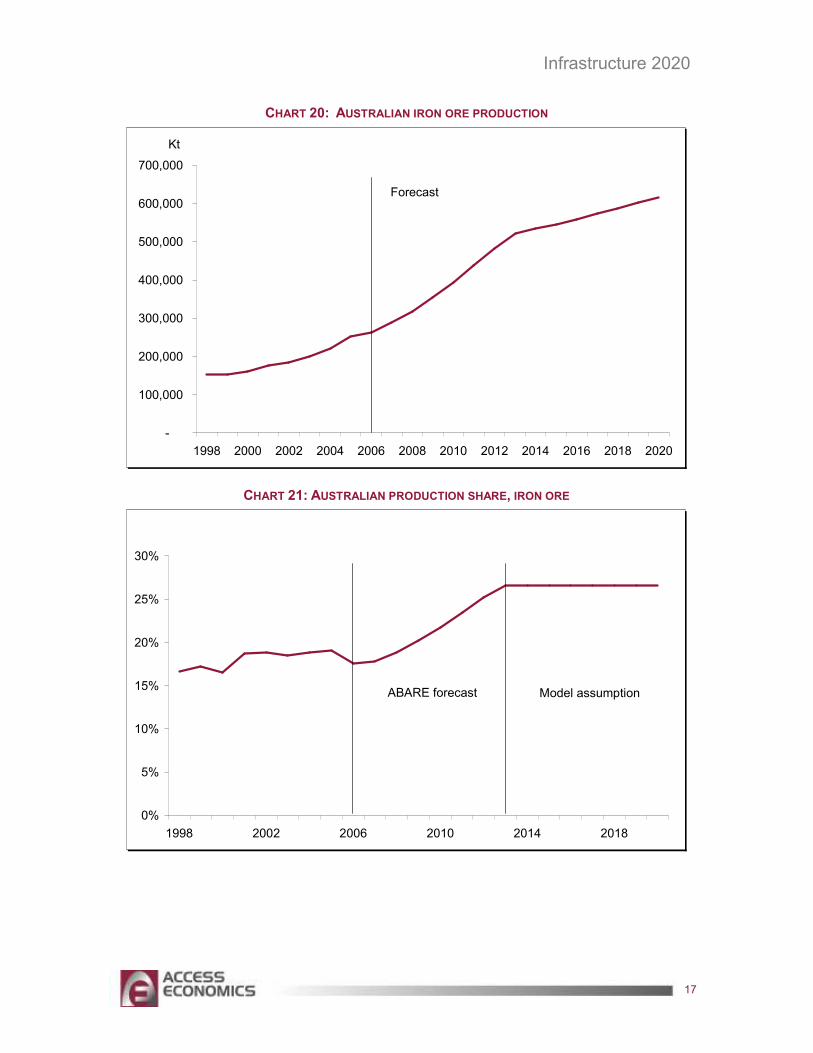
Chart 20 shows that Australian iron ore production is expected to see major gains over coming years. Strong price increases have encouraged rapid investment in new capacity with a number of mine expansions currently underway, particularly in Western Australia.
New entrants into the Australian iron ore market will help boost future supply, with Fortescue Metals recently shipping its first ore from Western Australia. Fortescue joins BHP Billiton and Rio Tinto – both of which are rapidly expanding their existing iron ore facilities.
ABARE expects Australia’s iron ore production to average growth of 10% per year over the next five years, to reach 520 million tonnes, and forecasts from the AE-GLOBAL model (based on the Holding the Line assumption of constant global market shares from 2013 to 2020) show continued strong growth in Australia’s iron ore production out to 2020.
Infrastructure 2020
17
CHART 20: AUSTRALIAN IRON ORE PRODUCTION
-
100,000
200,000
300,000
400,000
500,000
600,000
700,000
1998 2000 2002 2004 2006 2008 2010 2012 2014 2016 2018 2020
Kt
Forecast
CHART 21: AUSTRALIAN PRODUCTION SHARE, IRON ORE
0%
5%
10%
15%
20%
25%
30%
1998 2002 2006 2010 2014 2018
ABARE forecast Model assumption

Infrastructure 2020
18
CHART 22: AUSTRALIAN ALUMINIUM PRODUCTION
-
500
1,000
1,500
2,000
2,500
3,000
1998 2000 2002 2004 2006 2008 2010 2012 2014 2016 2018 2020
Kt
Forecast
Chart 22 shows that Australian aluminium production is expected to increase steadily over the forecast period, however ABARE’s forecasts suggest that Australian production as a share of global aluminium demand will continue to fall.
CHART 23: AUSTRALIAN PRODUCTION SHARE, ALUMINIUM
0%
1%
2%
3%
4%
5%
6%
7%
8%
1998 2002 2006 2010 2014 2018
ABARE forecast Model assumption

Infrastructure 2020
19
Without any major additions to Australia’s aluminium production capacity expected to come on line over the forecast period, aluminium supply in Australia is somewhat constrained.
ABARE suggests that rising electricity prices and an uncertain outlook regarding carbon emissions pricing is making Australia a less competitive investment location for aluminium production facilities.
In contrast, aluminium production is expected to increase strongly in other countries, where production capacity is being expanded. In China, aluminium production capacity is expected to increase by almost 2,800 kilotonnes over the five years to 2013, while capacity in Russia, the United Arab Emirates and India is expected to increase by 1,850 kilotonnes, 1,400 kilotonnes and 940 kilotonnes respectively over the same period. Those capacity increases will contribute to Australia’s declining share of global aluminium production seen in Chart 23 above.
Australia’s copper production is also expected increase over the forecast period, as seen in Chart 24. After fairly moderate growth in copper production over the past decade, Australian copper output is expected to increase substantially after 2008. That reflects the fact that a number of new mines have recently come on line and are expected to ramp up production, while additional copper mines are scheduled to be commissioned towards the end of 2008.
These include Compass Resources’ Browns Oxide mine in the Northern Territory (to be commissioned shortly), Oxiana’s Prominent Hill copper project in South Australia, Hillgrove Resources’ Kanmantoo project in South Australia and Newmont’s Boddington project in Western Australia (a gold project that will produce copper as a by-product).
CHART 24: AUSTRALIAN COPPER PRODUCTION
-
200
400
600
800
1,000
1,200
1,400
1,600
1,800
1998 2000 2002 2004 2006 2008 2010 2012 2014 2016 2018 2020
Kt
Forecast
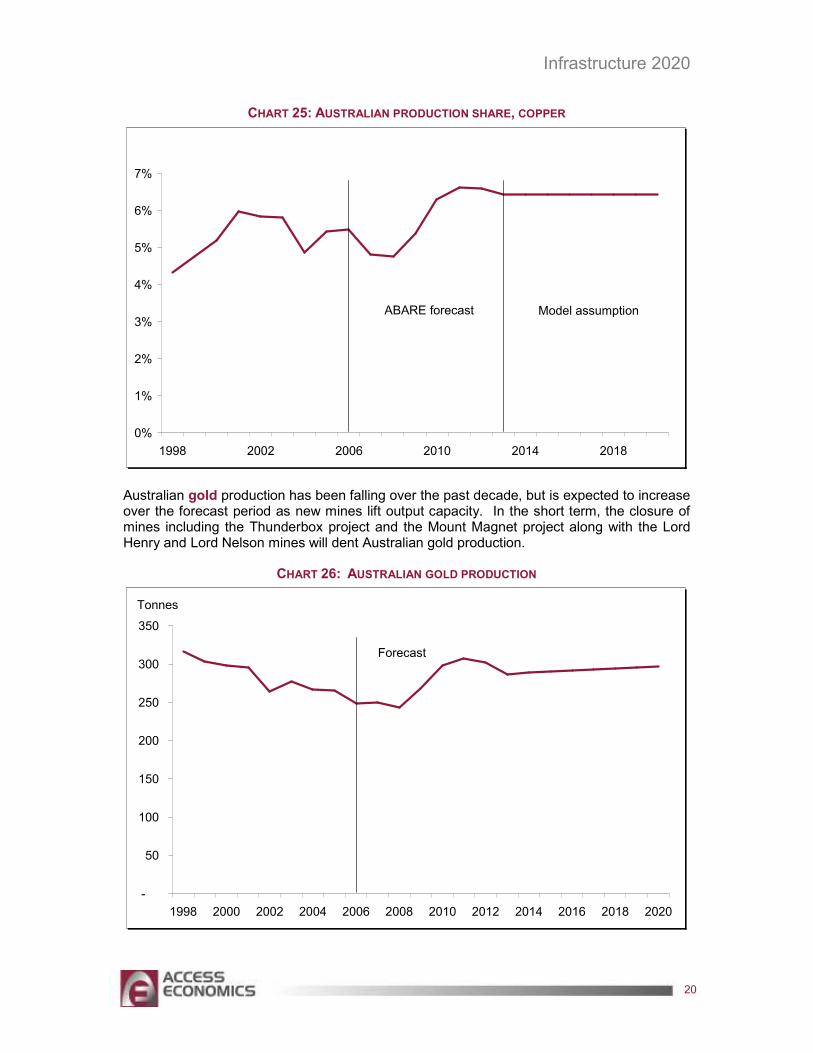
Chart 25 shows that the commissioning of these projects is projected to lead to an increase in Australia’s global copper production share.
Infrastructure 2020
20
CHART 25: AUSTRALIAN PRODUCTION SHARE, COPPER
0%
1%
2%
3%
4%
5%
6%
7%
1998 2002 2006 2010 2014 2018
ABARE forecast Model assumption
Australian gold production has been falling over the past decade, but is expected to increase over the forecast period as new mines lift output capacity. In the short term, the closure of mines including the Thunderbox project and the Mount Magnet project along with the Lord Henry and Lord Nelson mines will dent Australian gold production.
CHART 26: AUSTRALIAN GOLD PRODUCTION
-
50
100
150
200
250
300
350
1998 2000 2002 2004 2006 2008 2010 2012 2014 2016 2018 2020
Tonnes
Forecast

Infrastructure 2020
21
However, the commissioning of key projects will lift output capacity notably over the medium term. The Boddington gold project in Western Australia is the most significant gold project underway. That project is expected to be commissioned in late 2008 and will produce around 31 tonnes of gold per year – more than 10% of current Australian output.
Chart 26 shows the expected ramp up in gold production over the medium term, reversing the downward trend of recent years. That ramp up will improve Australia’s share of global gold production over the same period, seen in Chart 27. Overall, Australian gold producers are expected to perform strongly over the forecast period, reversing a decline in production in recent years and improve their share of global gold output.
CHART 27: AUSTRALIAN PRODUCTION SHARE, GOLD
0%
2%
4%
6%
8%
10%
12%
1998 2002 2006 2010 2014 2018
ABARE forecast Model assumption
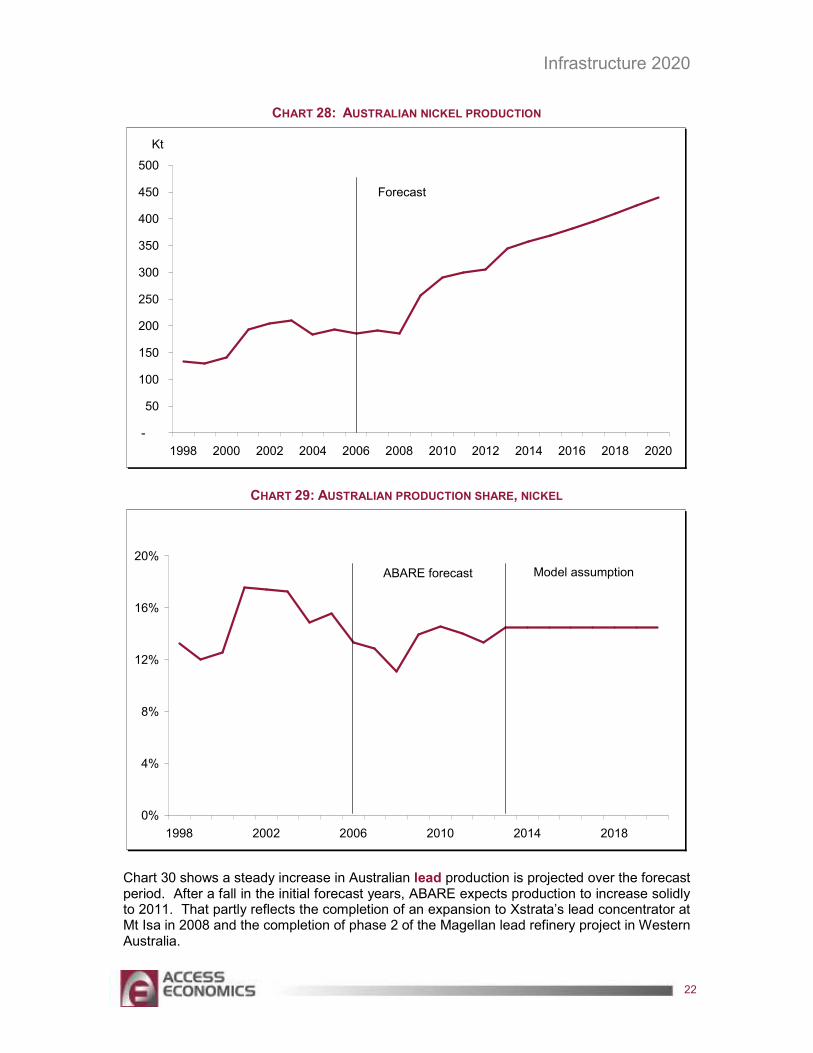
Chart 28 shows that Australian nickel production is expected to increase rapidly after 2008, maintaining solid growth over the entire forecast period. That gain comes despite Australia maintaining a relatively constant share of global production, with world nickel production expected to lift to match a (rather rapid) rise in global demand.
Most of the projected increase from 2008 comes from the commissioning of new mines, with BHP Billiton’s Ravensthorpe mine and Allegiance’s Avebury mine both coming on line in the near term.
The combined capacity of these mines (at 58,000 tonnes of nickel per year) represents the majority of the medium term increase in Australian production. Chart 29 shows that, despite the strong increase in output, Australian nickel production as a share of global nickel demand is expected to remain steady.
Infrastructure 2020
22
CHART 28: AUSTRALIAN NICKEL PRODUCTION
-
50
100
150
200
250
300
350
400
450
500
1998 2000 2002 2004 2006 2008 2010 2012 2014 2016 2018 2020
Kt
Forecast
CHART 29: AUSTRALIAN PRODUCTION SHARE, NICKEL
0%
4%
8%
12%
16%
20%
1998 2002 2006 2010 2014 2018
ABARE forecast Model assumption
Chart 30 shows a steady increase in Australian lead production is projected over the forecast period. After a fall in the initial forecast years, ABARE expects production to increase solidly to 2011. That partly reflects the completion of an expansion to Xstrata’s lead concentrator at Mt Isa in 2008 and the completion of phase 2 of the Magellan lead refinery project in Western Australia.

Infrastructure 2020
23
CHART 30: AUSTRALIAN LEAD PRODUCTION
-
200
400
600
800
1,000
1,200
1998 2000 2002 2004 2006 2008 2010 2012 2014 2016 2018 2020
Kt
Forecast
Chart 31 shows that Australia will continue to lose some market share in global lead production, though in general the share is expected to remain relatively constant over the forecast period.
CHART 31: AUSTRALIAN PRODUCTION SHARE, LEAD
0%
2%
4%
6%
8%
10%
12%
1998 2002 2006 2010 2014 2018
ABARE forecast Model assumption
Infrastructure 2020
24
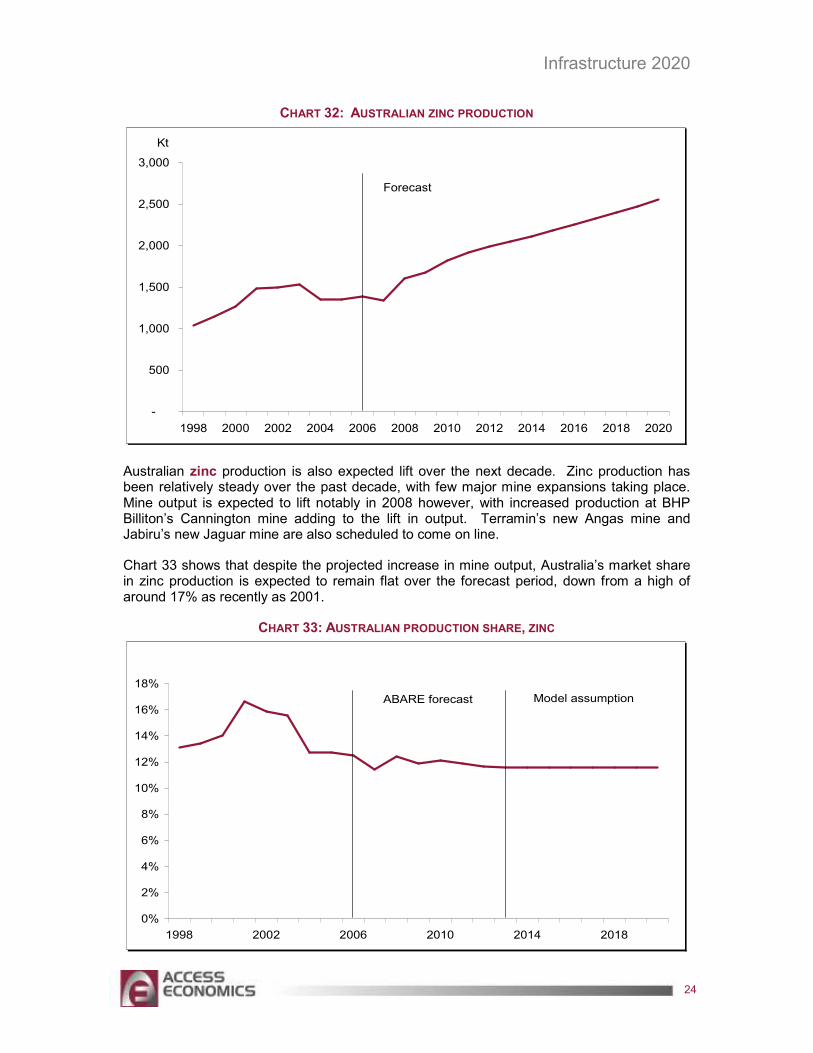
CHART 32: AUSTRALIAN ZINC PRODUCTION
-
500
1,000
1,500
2,000
2,500
3,000
1998 2000 2002 2004 2006 2008 2010 2012 2014 2016 2018 2020
Kt
Forecast
Australian zinc production is also expected lift over the next decade. Zinc production has been relatively steady over the past decade, with few major mine expansions taking place. Mine output is expected to lift notably in 2008 however, with increased production at BHP Billiton’s Cannington mine adding to the lift in output. Terramin’s new Angas mine and Jabiru’s new Jaguar mine are also scheduled to come on line.
Chart 33 shows that despite the projected increase in mine output, Australia’s market share in zinc production is expected to remain flat over the forecast period, down from a high of around 17% as recently as 2001.
CHART 33: AUSTRALIAN PRODUCTION SHARE, ZINC
0%
2%
4%
6%
8%
10%
12%
14%
16%
18%
1998 2002 2006 2010 2014 2018
ABARE forecast Model assumption

Infrastructure 2020
25
4. THE ‘ADVANCE’ AND ‘DECLINE’ SCENARIOS
4.1 AUSTRALIAN SUPPLY SIDE SCENARIOS: DECLINE
What if the world held a party, but Australia didn’t turn up?
That is, in a sense, the story of recent years. The emerging economies of the world are in a purple patch, and global industrial commodity demand has been leaping as a result, but Australia’s share of global industrial commodity demand has faded fast. Chart 34 shows the change in Australia’s global market share for key minerals between 2002 and 2007.
CHART 34: THE CHANGE IN AUSTRALIA’S GLOBAL MARKET SHARE, 2007 VERSUS 2002
-35%
-30%
-25%
-20%
-15%
-10%
-5%
0%
GoldIron ore
CoalCopper
Aluminium
Nickel
ZincLead
The second scenario considered for this report still allows for a considerable turnaround from the recent experience in Australia between now and 2013, as the sharp lift in investment in mining and metals and associated infrastructure facilitates a matching sharp gain in Australian output across a range of minerals. The latter, as noted above, has been benchmarked to ABARE’s forecasts for Australian minerals output.
Rather, the point of difference in the Decline scenario lies in the period from 2014 to 2020, beyond the timescale of the ABARE forecasts. That period reverts to the experience of 2002 to 2007, with Australia once again ceding market share to the rest of the world.
That relative loss has been calibrated to match the average annual loss of global market share across all the minerals modelled for this report, rather than assuming a return to the commodity-specific losses noted in Chart 34 above. On that basis, all the minerals modelled here lose market share at the rate of 2.6% a year – meaning that, for example, if Australia held a global market share for a given mineral of 10% in 2013, that is modelled to fall to 9.74% in 2014, 9.49% in 2015, 9.24% in 2016, and so on.
Infrastructure 2020
26
What that implies for the level of Australian production depends on the underlying gains in global demand by mineral. Where those are greater than 2.6% a year, then Australian production continues to grow from 2013 to 2020, and vice versa where the underlying gains in global demand by mineral are less than 2.6% a year.
Such a scenario would be one of a failure to capitalise on Australia’s strong comparative advantage in resources, held back by one or more of the many minefields that stand between the most prosperous possible position in 2020 and today’s sustainable throughput of industrial commodities through Australian supply chains.
After all, it only takes breaks in the chain – in the availability of skilled workers, or the adequacy of the State and Federal regulatory framework (such as for approvals), or the speed of native title negotiations, or the fumbling caused by the splintering of ownership along supply chains – to result in a lack of rail or mine or road capacity which then makes the difference between better and worse outcomes for Australia and the incomes of Australians.
4.2 AUSTRALIAN SUPPLY SIDE SCENARIOS: ADVANCE
Yet there is a better alternative than the Decline or Holding the Line scenarios.
The Advance scenario paints a picture of success – where Australian businesses and policymakers are aware of and plan for the supply side implications of the continuing industrial revolution in half the world.
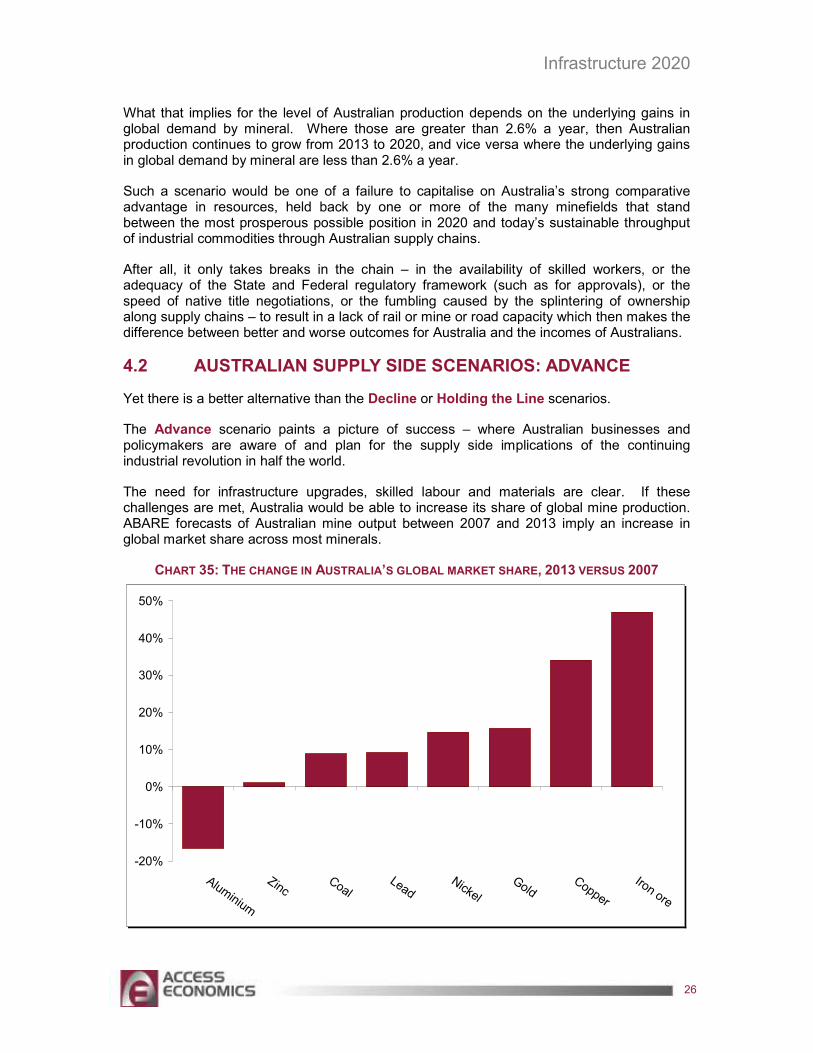
The need for infrastructure upgrades, skilled labour and materials are clear. If these challenges are met, Australia would be able to increase its share of global mine production. ABARE forecasts of Australian mine output between 2007 and 2013 imply an increase in global market share across most minerals.
CHART 35: THE CHANGE IN AUSTRALIA’S GLOBAL MARKET SHARE, 2013 VERSUS 2007
-20%
-10%
0%
10%
20%
30%
40%
50%
Aluminium
ZincCoal
LeadNickel
GoldCopper
Iron ore
Infrastructure 2020
27
Chart 35 shows the change in Australia’s global share for key minerals over the six years to 2013. This third scenario examines the effect of further improvements in market share in 2014 and beyond. As with earlier scenarios, the Advance scenario allows for an expected turnaround in Australian production between 2007 and 2013 (as forecast by ABARE). It then assumes that those gains are maintained between 2014 and 2020.
Similarly to the Decline scenario, the relative gain has been calibrated to match the average expected annual gain of global market share across all the minerals modelled for this report, rather than assuming commodity-specific gains. All minerals are assumed to gain market share at the rate of 3.1% a year – meaning that, for example, if Australia held a global market share for a given mineral of 10% in 2013, that is then modelled to rise to 10.31% in 2014, 10.63% in 2015, 10.95% in 2016, and so on.
4.3 THE IMPLICATIONS FOR AUSTRALIAN PRODUCTION
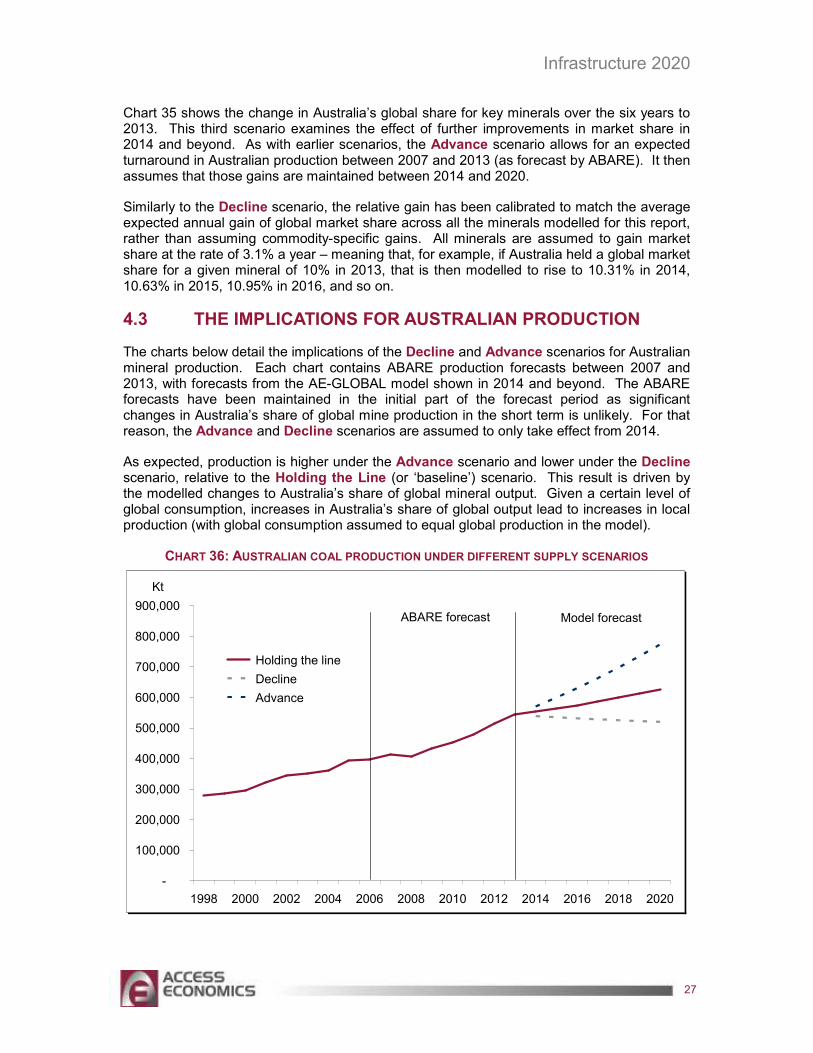
The charts below detail the implications of the Decline and Advance scenarios for Australian mineral production. Each chart contains ABARE production forecasts between 2007 and 2013, with forecasts from the AE-GLOBAL model shown in 2014 and beyond. The ABARE forecasts have been maintained in the initial part of the forecast period as significant changes in Australia’s share of global mine production in the short term is unlikely. For that reason, the Advance and Decline scenarios are assumed to only take effect from 2014.
As expected, production is higher under the Advance scenario and lower under the Decline scenario, relative to the Holding the Line (or ‘baseline’) scenario. This result is driven by the modelled changes to Australia’s share of global mineral output. Given a certain level of global consumption, increases in Australia’s share of global output lead to increases in local production (with global consumption assumed to equal global production in the model).
CHART 36: AUSTRALIAN COAL PRODUCTION UNDER DIFFERENT SUPPLY SCENARIOS
-
100,000
200,000
300,000
400,000
500,000
600,000
700,000
800,000
900,000
1998 2000 2002 2004 2006 2008 2010 2012 2014 2016 2018 2020
Holding the line
Decline
Advance
ABARE forecast Model forecast
Kt

Infrastructure 2020
28
As the loss in market share is assumed to be the same across all minerals, the proportionate changes in output under each scenario are the same for each mineral. That is, Australian production of each mineral is expected to be almost 24% higher under the Advance scenario and almost 17% lower under the Decline scenario relative to the Holding the Line scenario.
As an example, Chart 36 above shows expected Australian coal production under the different supply scenarios. Under the initial market share assumptions, Australian black coal production is expected to be almost 625 million tonnes in 2020. Output under the Advance scenario is more than 773 million tonnes, while under the Decline scenario output in 2020 dips to around 520 million tonnes.
CHART 37: AUSTRALIAN IRON ORE PRODUCTION UNDER DIFFERENT SUPPLY SCENARIOS
-
100,000
200,000
300,000
400,000
500,000
600,000
700,000
800,000
900,000
1998 2000 2002 2004 2006 2008 2010 2012 2014 2016 2018 2020
Holding the line
Decline
Advance
ABARE forecast Model forecast
Kt
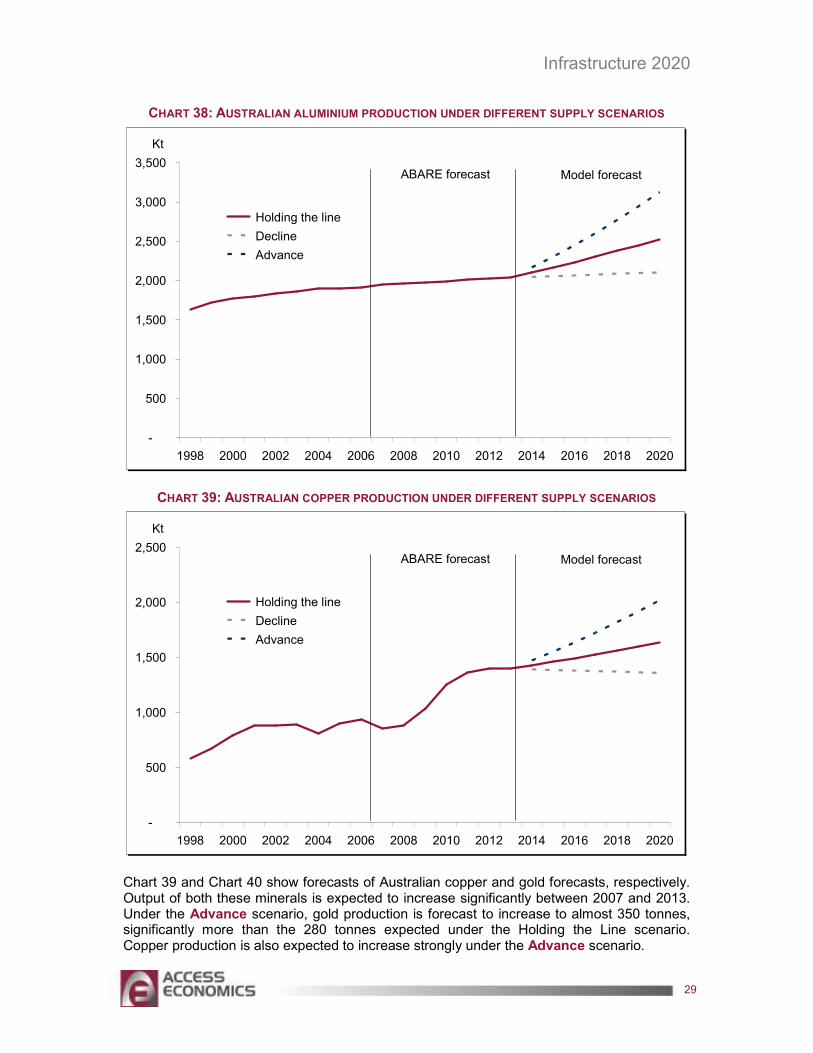
Forecasts for Australian iron ore and aluminium production are shown in Chart 37and Chart 38. For both these commodities, production under the Decline scenario remains relatively steady at 2013 levels. That reflects the sharp expected increase in global consumption of iron ore and aluminium, offsetting the expected reduction in Australian market share.
Infrastructure 2020
29
CHART 38: AUSTRALIAN ALUMINIUM PRODUCTION UNDER DIFFERENT SUPPLY SCENARIOS
-
500
1,000
1,500
2,000
2,500
3,000
3,500
1998 2000 2002 2004 2006 2008 2010 2012 2014 2016 2018 2020
Holding the line
Decline
Advance
ABARE forecast Model forecast
Kt
CHART 39: AUSTRALIAN COPPER PRODUCTION UNDER DIFFERENT SUPPLY SCENARIOS
-
500
1,000
1,500
2,000
2,500
1998 2000 2002 2004 2006 2008 2010 2012 2014 2016 2018 2020
Holding the line
Decline
Advance
ABARE forecast Model forecast
Kt
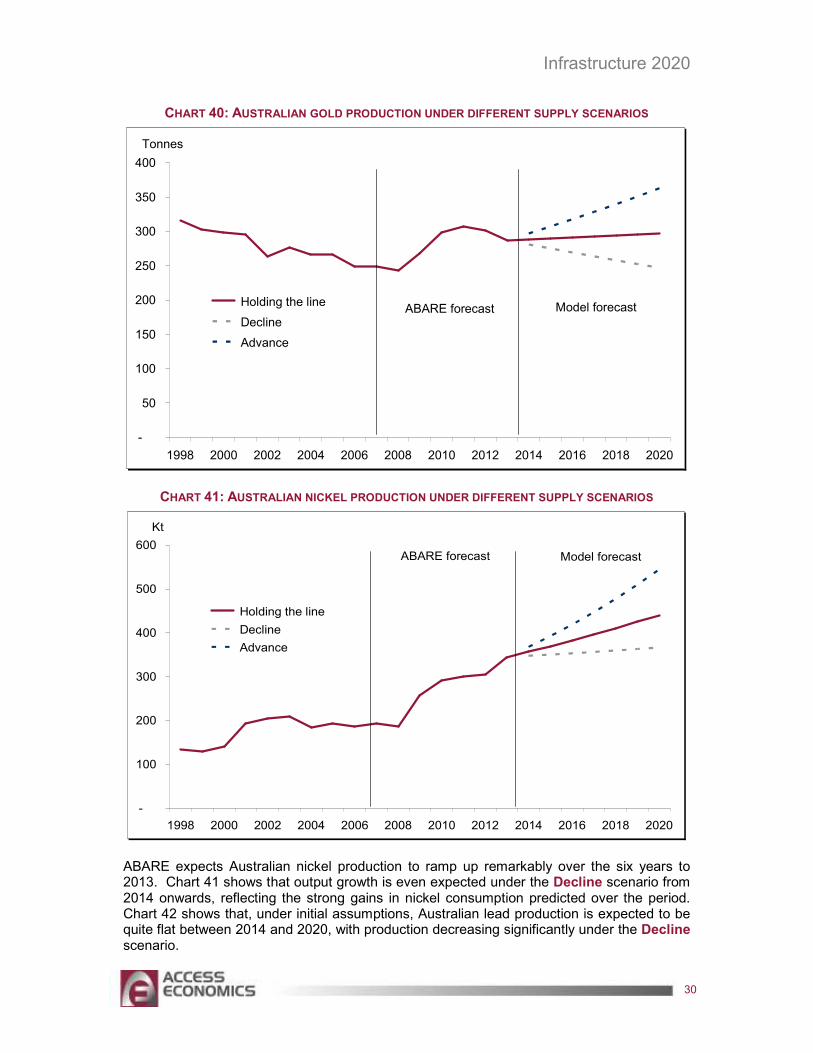
Chart 39 and Chart 40 show forecasts of Australian copper and gold forecasts, respectively. Output of both these minerals is expected to increase significantly between 2007 and 2013. Under the Advance scenario, gold production is forecast to increase to almost 350 tonnes, significantly more than the 280 tonnes expected under the Holding the Line scenario. Copper production is also expected to increase strongly under the Advance scenario.
Infrastructure 2020
30
CHART 40: AUSTRALIAN GOLD PRODUCTION UNDER DIFFERENT SUPPLY SCENARIOS
-
50
100
150
200
250
300
350
400
1998 2000 2002 2004 2006 2008 2010 2012 2014 2016 2018 2020
Holding the line
Decline
Advance
ABARE forecast Model forecast
Tonnes
CHART 41: AUSTRALIAN NICKEL PRODUCTION UNDER DIFFERENT SUPPLY SCENARIOS
-
100
200
300
400
500
600
1998 2000 2002 2004 2006 2008 2010 2012 2014 2016 2018 2020
Holding the line
Decline
Advance
ABARE forecast Model forecast
Kt
ABARE expects Australian nickel production to ramp up remarkably over the six years to 2013. Chart 41 shows that output growth is even expected under the Decline scenario from 2014 onwards, reflecting the strong gains in nickel consumption predicted over the period. Chart 42 shows that, under initial assumptions, Australian lead production is expected to be quite flat between 2014 and 2020, with production decreasing significantly under the Decline scenario.

Infrastructure 2020
31
CHART 42: AUSTRALIAN LEAD PRODUCTION UNDER DIFFERENT SUPPLY SCENARIOS
-
200
400
600
800
1,000
1,200
1,400
1998 2000 2002 2004 2006 2008 2010 2012 2014 2016 2018 2020
Holding the line
Decline
Advance
ABARE forecast Model forecast
Kt
CHART 43: AUSTRALIAN ZINC PRODUCTION UNDER DIFFERENT SUPPLY SCENARIOS
-
500
1,000
1,500
2,000
2,500
3,000
3,500
1998 2000 2002 2004 2006 2008 2010 2012 2014 2016 2018 2020
Holding the line
Decline
Advance
ABARE forecast Model forecast
Kt
The strong increase in Australian zinc production expected under the Holding the Line scenario is shown in Chart 43. Production is expected to be even stronger under the Advance scenario, but is expected to remain flat after 2013 under the Decline scenario.

Infrastructure 2020
32
Both the Decline and Advance scenarios would have a significant effect on national income. Using the latest minerals prices from April and May 2008 (and assuming an exchange rate of US 95 cents), the total value of output in 2020 can be calculated under each scenario in today’s dollars.
The implied dollar differences are vast.
The cost of ‘getting it wrong’ is striking. The Decline scenario implies that, in today’s dollars, Australia would be more than $91 billion worse off in 2020 alone compared to the Holding the Line scenario – 8½% of today’s national income.
In contrast, the benefits of getting it right are even more massive. Australia’s national income would be almost $129 billion higher in 2020 under the Advance scenario than under the Holding the Line scenario – some 12% of today’s national income.
In both cases these are gross amounts – not the net benefit to Australia. To invest relatively more in minerals and the associated hard and soft infrastructure required to get them to market means that we would have less resources available to be invested in the ‘next best option’ (and vice versa).
However, Australia’s comparative advantage in resources suggests that this is a once in a lifetime opportunity to surf an incredible wave of global development.
As Treasury Secretary Ken Henry has noted (2006, p. 6):
“To date, we have responded well to the challenges of the ICT revolution, population ageing, the re-emergence of China and India and the discipline of a full capacity economy. ... Yet the risks of policy error are considerable. In our present economic circumstances, the premium on high quality policy decisions is unusually high.”

Infrastructure 2020
33
5. A LOOK BACK AT PREVIOUS EXPANSION CYCLES
While the rise in industrial commodity prices in recent years has driven a sharp rise in global and Australian mining and infrastructure investment, Australian export volume growth so far remains relatively weak (despite volume increases in some key commodities).
To determine whether the lack of export volume growth has been unusually poor, it is useful to compare Australia’s experience in the current commodity price boom (defined as beginning in 2001-02) with that of the previous boom (defined as beginning in 1977-78).
Chart 44 draws on research work done at the Federal Treasury. It shows the levels of real mining investment and non-rural commodity export volumes from the two years before these two booms started.
CHART 44: AUSTRALIA’S TWO MINING BOOMS
0
100
200
300
400
-2 -1 0 1 2 3 4 5 6 7 8 9 10 11
Previous boom (year 1: 1977-78) Current boom (year 1: 2001-02)Series3 Series4
Investment
Export volumes
Index
Source: ABS, Treasury. Export volume in 2006-07 is an estimate
Notably, investment in new mining output actually contracted in both instances prior to the beginning of the upswing.
The overall message from the chart is simple: from the time when the investment cycle begins to increase rapidly, it takes almost eight years before export volumes increase in a meaningful way.
While the current boom exhibits some characteristics that are different from the last boom, it is clear that rather long lead times are a feature of investment in mining.
Assuming that past experience is relevant to the current expansion cycle, then Australia can expect to see mining output and hence resource export volumes begin to pick up more significantly over the next five years.

Infrastructure 2020
34
Chart 45 shows just how long it took after 1977-78 for mining output to show sustained rates of increase. The chart shows five year annual average rates of increase in Australian mining output.
CHART 45: FIVE YEAR ANNUAL AVERAGE GAINS IN AUSTRALIAN MINING OUTPUT
-1%
0%
1%
2%
3%
4%
5%
6%
7%
8%
9%
10%
11%
1979 1984 1989 1994 1999 2004 2009 2014 2019
Consistent with the
Holding the Line scenario
Although a pick up started to become evident in 1982-83, these rates took until 1985 to show a considerable lift.
The latter was then sustained for some years, with mining output doubling in the decade through to the early 1990s.
Or, in other words, we’ve done this before – Australian mining output has risen notably in response to sustained investment.
Again, however, the difference this time will be scale. Measured in terms of tonnes of output, the expansion of Australia’s mining sector during the 1980s was a third of that required between now and 2020 to meet the forecasts of the Holding the Line scenario.

Infrastructure 2020
35
6. IS COMPARATIVE ADVANTAGE AND A MULTI BILLION DOLLAR PRIZE ENOUGH?
Is Australia’s considerable comparative advantage in resources and a multi billion dollar prize for pursuing that comparative advantage enough to ensure it actually occurs?
Apparently not. Australia lost market share and billions in potential revenue and profits in the five years to 2007 as we failed to surf a structural shift up in commodity demand growth emanating from emerging market economies.
That means we can do better. We can pursue our considerable comparative advantage in minerals, to our considerable benefit.
In theory the task is simple – dig up more, put it in a truck/train/ship and supply has expanded and the dollars roll in.
Yet in practice increasing the supply of minerals to the global market is often significantly more complex – largely because of the scale involved and the skills required to pull off large expansions, additions to supply chains and new operations.
Then throw into the mix that everyone else around the world is also trying to expand supply at the same time and is competing for the same resources – skilled workers, trucks, tyres, explosives, rolling stock for trains and other large pieces of complex mining equipment – and you start to get the picture. It takes time.
The scale is enormous. Australia’s Goonyella Coal Chain (GCC, our largest coal supply chain) loaded around 89 million tonnes in 2007. Access Economics estimates that global coal consumption will increase by around 1908 million tonnes between 2007 and 2020. That is an increase in global consumption of around 21 times Australia’s current output from the GCC.
For the Australian industry to maintain a stable share of the global coal market beyond 2013, our production needs to increase by around 50% by 2020.
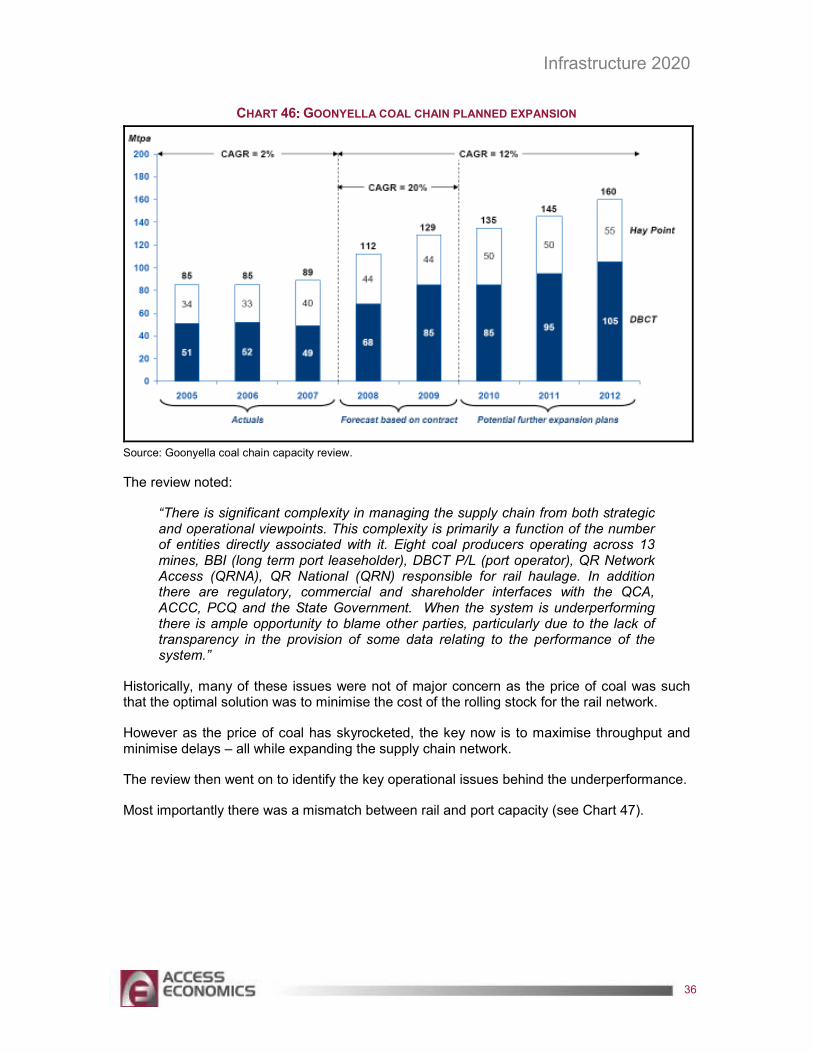
Current growth ambitions for the next few years are on the right track within the GCC. Its capacity is forecast to increase to 160 million tonnes a year by 2012 – representing an 80% increase in production capacity (see Chart 46).
But while such ambitions are on the right track, the recent record is less than stellar, with the system continuing to have a shortfall between planned and actual volumes shipped. Underperformance costing in excess of $1 billion was recorded in 2006-07, resulting in a recent review which was conducted by Mr Stephen O’Donnell.
Infrastructure 2020
36
CHART 46 : GOONYELLA COAL CHAIN PLANNED EXPANSION
Source: Goonyella coal chain capacity review.
The review noted:
“There is significant complexity in managing the supply chain from both strategic and operational viewpoints. This complexity is primarily a function of the number of entities directly associated with it. Eight coal producers operating across 13 mines, BBI (long term port leaseholder), DBCT P/L (port operator), QR Network Access (QRNA), QR National (QRN) responsible for rail haulage. In addition there are regulatory, commercial and shareholder interfaces with the QCA, ACCC, PCQ and the State Government. When the system is underperforming there is ample opportunity to blame other parties, particularly due to the lack of transparency in the provision of some data relating to the performance of the system.”
Historically, many of these issues were not of major concern as the price of coal was such that the optimal solution was to minimise the cost of the rolling stock for the rail network.
However as the price of coal has skyrocketed, the key now is to maximise throughput and minimise delays – all while expanding the supply chain network.
The review then went on to identify the key operational issues behind the underperformance.
Most importantly there was a mismatch between rail and port capacity (see Chart 47).

Infrastructure 2020
37
CHART 47 : THERE CONTINUES TO BE A MISMATCH BETWEEN PLANNED RAIL AND PORT CAPACITY
Source: Goonyella coal chain capacity review.
The GCC review outlined a number of issues:
� The bottleneck in the system is lack of rail rolling stock capacity.
� The port will become the bottleneck until early next year – due to construction required to increase the port’s capacity to approximately 68 million tonnes a year.
� Following completion of this work, the bottleneck will return to being lack of rolling stock. Queensland Rail’s plans to address this situation have yet to be finalised.
� The Review’s study of the overall supply chain indicated that a business improvement program should be urgently commenced across the entire supply chain, with the initial focus being on Queensland Rail, reflecting the current bottleneck in the supply chain.
The GCC review’s principal recommendations included:
� The creation of a central coordination role to oversee and if necessary coordinate all activities which span the whole of the coal supply chain.
� QRN to immediately commence a process, including negotiating commercial contracts with users, to purchase additional train sets to allow it to meet projected volumes.
� A business improvement program be commenced across the supply chain, starting immediately with Queensland Rail as this is the current bottleneck.
� Given the scale of issues uncovered the review suggested further analysis.
Expansion of mining supply chains can be complex. Such expansion takes time and requires significant capital. And where multiple users and owners of various parts of the supply chain are a feature of the system, tops down management of the entire chain is required to maximise output, profits and revenues.
Infrastructure 2020
38
7. A SHARED ROLE – PRIVATE AND GOVERNMENT
Australia’s economy has been operating at close to full capacity for several years now, as is evidenced by rising inflationary pressures and skilled wages.
In response to this a number of studies have examined constraints such as infrastructure bottlenecks and congestion.
Among others, the Business Council of Australia (BCA 2005, 2007) raised concerns that infrastructure bottlenecks were already hurting Australia’s economy in a range of areas, including bulk and container ports, intermodal transport hubs, rail freight networks, urban roads, urban and agricultural water supply, and electricity networks.
In 2005, the Export and Infrastructure Taskforce (led by Brian Fisher) reported that export infrastructure constraints had emerged in the context of the sharp increase in world demand for Australia's resource commodities. The infrastructure taskforce reported that:
“Without action to remove impediments to efficient investment in infrastructure, Australia’s export potential over the next five to ten years risks being compromised.”
The report went on to identify existing regulatory frameworks and practices (as at 2005) as a significant negative for the ongoing development of export infrastructure:
“The greatest impediment to the development of infrastructure necessary for Australia to realise its export potential is the way in which the current economic regulatory framework is structured and administered.”
The findings were damning of existing practices, noting systems were often adversarial, cumbersome, complicated, time consuming, inefficient and subject to gaming by participants.
All of these issues led to infrastructure capacity being developed at a far slower pace than was necessary or was required. Importantly, the report found that, where Australia’s logistics chains are vertically integrated and subject to much less economic regulation, the response to increased global demand has been timely, effective and efficient.
In contrast, in those parts of the economy where economic regulation sits between investors in export related infrastructure and users, lengthy delays have been widespread.
In 2005, Australia had at least nine different economic regulators applying differing legislation and placing their own interpretations upon that legislation in the export infrastructure arena.
The report noted this fragmented approach to regulation and the inconsistencies generated between regulators created significant uncertainty for businesses and actually added to the level of risk associated with various projects in what were otherwise efficient investments.
Most importantly the report pointed out that:
“Australia’s exporters operate in highly competitive global markets. They are reliant on infrastructure investment that is undertaken in a timely way, not a time frame dictated by regulatory processes. Waiting two or three years for regulatory decisions is as unacceptable as it is unnecessary.”

Infrastructure 2020
39
And the end result:
“In the absence of decisive policy action, significant infrastructure bottlenecks constraining Australia’s exports are likely to develop over the next five to ten years. The areas of principal concern are port channels, road and rail access to major ports and rail track.”
The issue going forward is that of ensuring a timely and effective response to any of these issues to the extent that they remain ongoing.
These concerns mean that the Australian economy's physical infrastructure has not responded quickly enough to the shift in demand for our commodity exports reflected by the new highs in the terms of trade.
Economic commentator John Edwards for example, noted that:
“The lesson of the new decade is that failures of supply can be as damaging as failures of demand. … Policies that influence supply … include the removal of infrastructure bottlenecks, the provision of additional infrastructure to meet expected demand, programs in education, and training and retraining that increase the supply of skilled workers.”
There remains a strong, clear and consistent call from industry for the Australian Government to take a leadership role in facilitating efficient investment in infrastructure, especially key transport infrastructure, and in the reform of regulatory processes.
These widely held concerns over Australia's infrastructure constraints and export performance in recent years resulted in the Government's announcement in February 2008 of a review into Australia's export policies and programs, chaired by David Mortimer.
In addition, the Government has agreed to undertake an Infrastructure Audit – as recommended by the Fisher report – as there is very little data and information available that can be used to analyse the extent of infrastructure mismanagement and underinvestment and where an appropriate role for government exists.
This is a positive step in the right direction as is the announcement of the new infrastructure body to manage the process.
7.1 FEDERAL TREASURY’S VIEWS ON INFRASTRUCTURE
The 2008-09 Budget papers outline the role and importance of the capital stock – including public and private infrastructure – for Australia's GDP growth.
The Budget papers note that Australia's productive potential is largely driven by the interactions between and combined effects of the following:
� The rate at which the volume and quality of Australia's physical capital stock increases. This, in turn, will reflect trends in the size and economic efficiency of both the business or private capital stock, and public sector infrastructure.
� The rate at which the size and skill base of Australia's workforce increases, including the rate of overall population growth, the changing age structure of the population, the rate of active participation in the labour force across age groups and genders, and changing levels of education and training and attainment.

Infrastructure 2020
40
� The extent of 'pure' productivity, or multi-factor productivity, growth. This represents improvements in allocative and dynamic efficiency that are not already captured in the elements discussed above.
The points outlined above highlight the role of the various factors that affect both productivity and participation. Importantly the Budget papers also note the role of well targeted investment in physical infrastructure as a factor that will increase productivity by both increasing the capital stock (a no brainer) but also by improving the efficiency of other factors of production. This, for example, suggests that there are flow on effects related to efficient investment in the capital stock, greater than its immediate use.
Within this broad framework it is important to be mindful that ‘efficient investment’ in new capacity and the ‘optimal utilisation’ of existing capacity are also critical factors in raising an economy's productive capacity or that of any infrastructure chain.
In many Australian examples, infrastructure often involves 'network' effects. This is where one project has large effects (positive or negative) on other infrastructure. Problems may arise if these network effects are not recognised during the planning of infrastructure projects. Importantly, this may require significant coordination where a number of infrastructure providers (and users) are likely to be impacted by decisions affecting the supply chain.
Again, this very important point was outlined by the Fisher review, and was also part of the solutions outlined and expanded on in the review of the Goonyella coal supply chain.
In this example it was outlined that there is a critical role for a central coordination body to:
� maximise investment returns by efficient operation of assets,
� optimise and carefully plan and coordinate expansion strategies,
� analyse the functionality of the supply chain,
� analyse stoppages and breakdowns and methods to minimise maintenance disruptions, and
� deal with regulatory issues.
Overlayed above all of these principals is the key point that well-functioning markets with effective price signals are necessary to support effective decision making.
Together these factors provide a conceptual framework for assessing the appropriate role of the private sector and the government in improving outcomes in infrastructure and skills markets for Australia’s export industries.
As Federal Treasury pointed out in the 2008-09 Budget papers, the average age of Australia's public sector infrastructure has generally been rising since the 1970s (see Chart 48), “providing some support for the view that we are approaching, or past, the point where much of the large amount of public infrastructure put in place in the 1950s and 1960s will need to be renewed or replaced”.
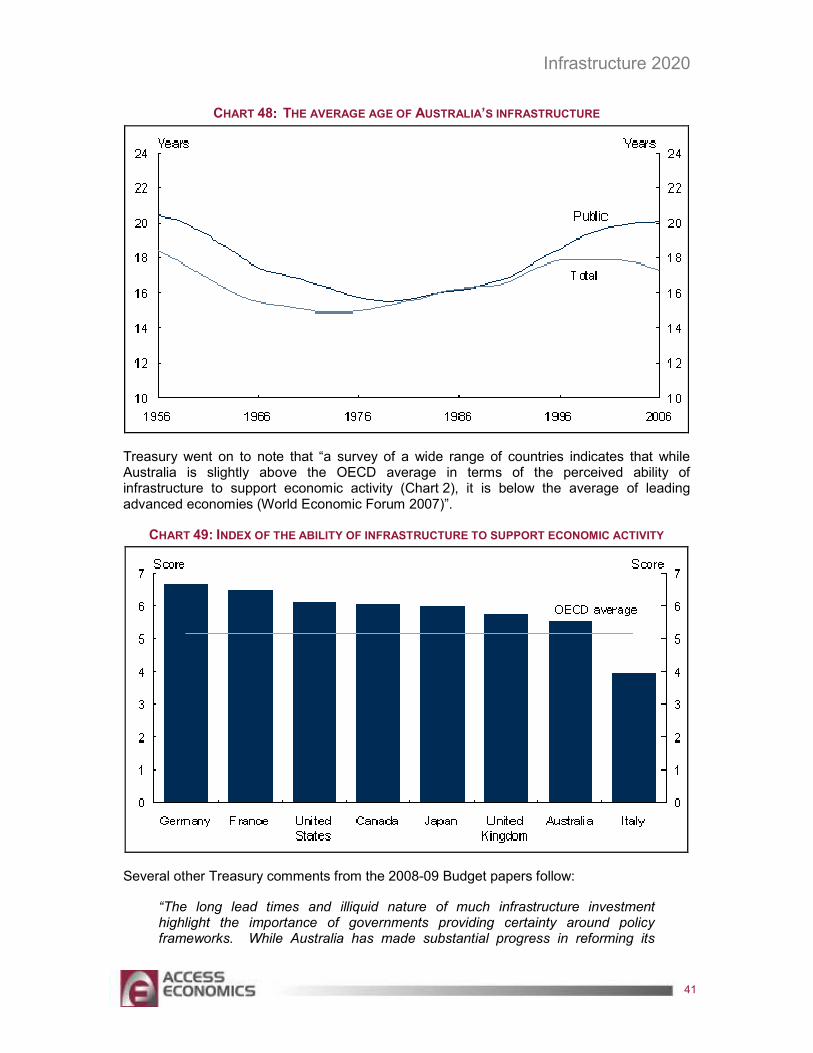
Infrastructure 2020
41
CHART 48 : THE AVERAGE AGE OF AUSTRALIA’S INFRASTRUCTURE
Treasury went on to note that “a survey of a wide range of countries indicates that while Australia is slightly above the OECD average in terms of the perceived ability of infrastructure to support economic activity (Chart 2), it is below the average of leading advanced economies (World Economic Forum 2007)”.
CHART 49: INDEX OF THE ABILITY OF INFRASTRUCTURE TO SUPPORT ECONOMIC ACTIVITY
Several other Treasury comments from the 2008-09 Budget papers follow:
“The long lead times and illiquid nature of much infrastructure investment highlight the importance of governments providing certainty around policy frameworks. While Australia has made substantial progress in reforming its
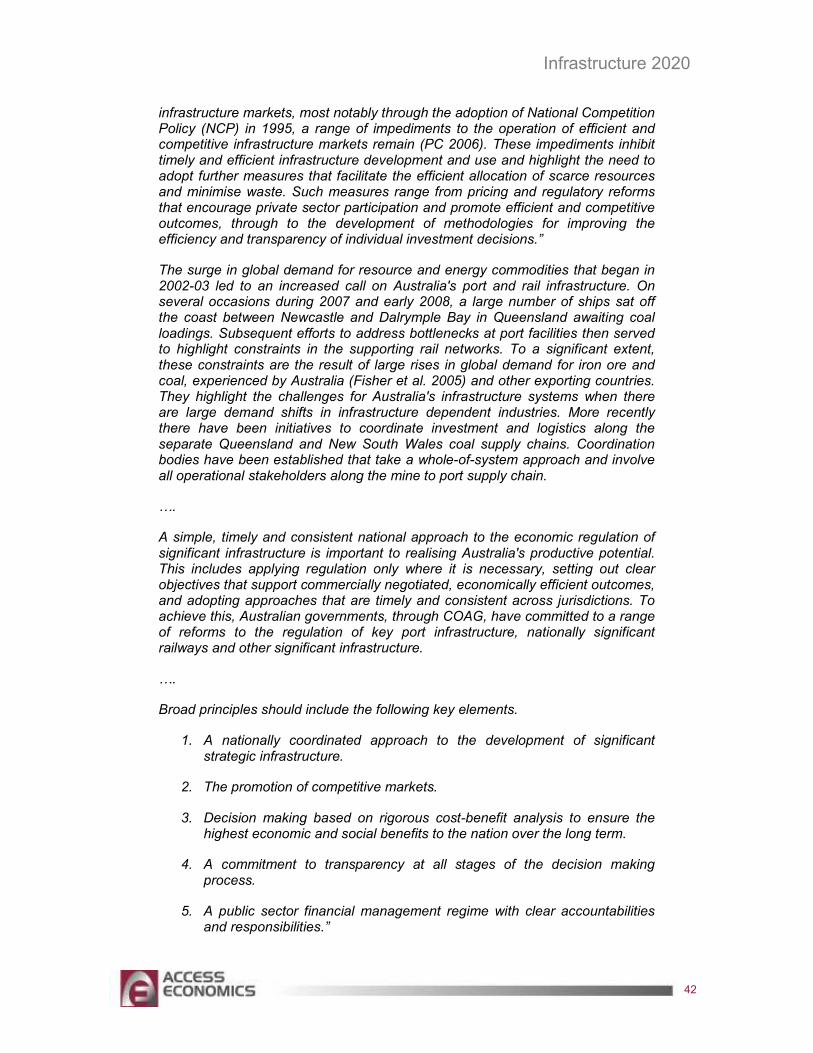
Infrastructure 2020
42
infrastructure markets, most notably through the adoption of National Competition Policy (NCP) in 1995, a range of impediments to the operation of efficient and competitive infrastructure markets remain (PC 2006). These impediments inhibit timely and efficient infrastructure development and use and highlight the need to adopt further measures that facilitate the efficient allocation of scarce resources and minimise waste. Such measures range from pricing and regulatory reforms that encourage private sector participation and promote efficient and competitive outcomes, through to the development of methodologies for improving the efficiency and transparency of individual investment decisions.”
The surge in global demand for resource and energy commodities that began in 2002-03 led to an increased call on Australia's port and rail infrastructure. On several occasions during 2007 and early 2008, a large number of ships sat off the coast between Newcastle and Dalrymple Bay in Queensland awaiting coal loadings. Subsequent efforts to address bottlenecks at port facilities then served to highlight constraints in the supporting rail networks. To a significant extent, these constraints are the result of large rises in global demand for iron ore and coal, experienced by Australia (Fisher et al. 2005) and other exporting countries. They highlight the challenges for Australia's infrastructure systems when there are large demand shifts in infrastructure dependent industries. More recently there have been initiatives to coordinate investment and logistics along the separate Queensland and New South Wales coal supply chains. Coordination bodies have been established that take a whole-of-system approach and involve all operational stakeholders along the mine to port supply chain.
….
A simple, timely and consistent national approach to the economic regulation of significant infrastructure is important to realising Australia's productive potential. This includes applying regulation only where it is necessary, setting out clear objectives that support commercially negotiated, economically efficient outcomes, and adopting approaches that are timely and consistent across jurisdictions. To achieve this, Australian governments, through COAG, have committed to a range of reforms to the regulation of key port infrastructure, nationally significant railways and other significant infrastructure.
….
Broad principles should include the following key elements.
1. A nationally coordinated approach to the development of significant strategic infrastructure.
2. The promotion of competitive markets.
3. Decision making based on rigorous cost-benefit analysis to ensure the highest economic and social benefits to the nation over the long term.
4. A commitment to transparency at all stages of the decision making process.
5. A public sector financial management regime with clear accountabilities and responsibilities.”
Infrastructure 2020
43
APPENDIX A
This article by Geoscience Australia (September 2007) was published by the ABS.
“Mining in Australia dates back thousands of years with the continent's Indigenous people looking for the best stone to use as hunting and cooking implements. This search for stone continued with the arrival of the First Fleet, when convicts were assigned to cut sandstone blocks from the shores of Port Jackson for the Governor's residence, warehouses, military barracks, prisons and other buildings.
The country's first truly commercial mining venture was at Newcastle in 1799 when coal was exported to Bengal. The coal had been discovered in 1791 by a convict, William Bryant, and led to the establishment of a penal settlement at what was then known as 'Coal River' in 1801. From those humble beginnings, Newcastle has developed into a major metropolitan centre and Australia has become one of the largest coal producers in the world. Production of raw black coal reached a total of 398 million tonnes in 2006, and created exports worth around $23 billion (b).
Overall, mining activity accounts for around 8% of Australia's gross domestic product and has contributed over $500b directly to Australia's wealth during the past 20 years. There are around 320,000 Australians employed in the industry, either directly or indirectly in support industries. Many are in sparsely populated, remote and regional Australia.
To put it in perspective, Australia is the world's largest exporter of black coal, iron ore and gold. It also holds the status of being the leading producer of bauxite and alumina as well as the second largest producer of uranium, lead and zinc; the third largest producer of iron ore, nickel, manganese and gold; the fourth largest producer of black coal, silver and copper; and the fifth largest producer of aluminium.
However, only a handful of major new discoveries have been made in recent years. In an attempt to reverse this trend, mining companies are stepping up exploration efforts in both existing areas of mineralisation and in areas which so far have attracted limited exploration investment. Mineral exploration expenditure in 2006-07 was $1.7b, close to $1b more than in 2002-03. Metres drilled over the same period increased by 64% to 8,455,000 metres.
In the past, available technology meant that mining was limited largely to deposits which were close to the surface with the search for new mineralisation being confined to relatively shallow drilling and observations of near-to-surface geology. But a major change is happening.
The Australian Government through Geoscience Australia is helping to limit the risk associated with mineral exploration by developing a greater understanding of the geological makeup of the continent. The agency has begun a program to look far beneath the surface and look at the geological architecture of the Earth's crust deep below some of Australia's most significant mineral provinces and in areas which geologists believe hold the potential for major mineral deposits.
This approach, which uses techniques such as deep seismic surveys, gravity surveys and airborne electromagnetic surveys can be expected to significantly increase the opportunities for new mineral discoveries beneath Australia's land surface.

Infrastructure 2020
44
Already surveys have revealed complex structures extending to the boundary between the Earth's crust and the mantle, commonly known as the Moho or Mohorovicic discontinuity. In some cases these surveys have extended to around 60 kilometres (km) below the surface to provide vital clues about the geological controls on the distribution of known mineralisation.
In some cases these deep crustal surveys have shown how particular mineral deposits have formed from mineral rich fluids which were forced up to flow along deep fractures in the Earth's crust. The surveys also have revealed similarities between the deep and the near-to-surface geological architecture of areas with known mineralisation and other, targeted survey areas. The discoveries have heightened the likelihood of locating similar mineralisation and provide a guide for exploration companies which could significantly reduce the risk associated with costly drilling programs.
An example is provided near Broken Hill (New South Wales) where an anomaly occurring between 42 and 54 km below the surface helps to explain the previously puzzling difference between 1,720 million year old rocks in the Broken Hill region and less than 600 million year old rocks in the more easterly Darling region. The information will greatly assist explorers to more directly identify locations for other potentially significant mineralisation in the Broken Hill region by focusing exploration in the older rocks.
Through this and similar projects undertaken in the Gawler region of South Australia, the Kalgoorlie/Boulder district in Western Australia, the Tanami Desert on the Western Australian/Northern Territory border, the Mount Isa/Cloncurry/Charters Towers region in north Queensland and gold-bearing regions in central Victoria, mining companies are being presented with new exploration opportunities. Already the results have led to new targeted drilling programs in the Gawler region, north-west Queensland and the Tanami region.
By adding data from these deep seismic investigations to other geological and geophysical information gathered over the past 60 years, geologists will be able to obtain a fuller understanding of the evolution of the continent. The production of predictive maps and three-dimensional imaging indicating regions with a high potential to host mineral deposits can be expected to lead to accelerated exploration investment and investigation by industry of mineral provinces not previously recognised.
This heightened interest combined with the continuing passion among today's miners and the dedication of geologists and other scientists in the various geosciences will ensure Australia has a continuing mining heritage for many years to come. Already the sophisticated program of deep crustal imaging has created opportunities for innovative ways to probe and interpret the Earth's secrets in an effort to discover new lodes to rival the legendary deposits of Broken Hill, Mount Isa, Kalgoorlie/Boulder, Hamersley and Olympic Dam.
The mining industry has come a long way since a long boat ventured along the coast north of Port Jackson and returned with a few lumps of coal. But as new discoveries aided by sophisticated scientific analysis unfold, ore bodies such as Broken Hill and Mount Isa will one day be equated to that long boat and handful of coal.”