global mining towardsprojects.gtk.fi/export/sites/projects/mineraalistrategia/documents/...manganese...
TRANSCRIPT

Global mining towards 2030 !
Cop
perd
raw
ing:
Kai
ande
rsSe
mpl
er.
Suomen mineraalistrategian avajaisseminaari,
Esbo 17:e mars 2010.
Magnus Ericsson

Mining can be sustainable -Garpenberg mine since 13th c.
Courtesy: Boliden.
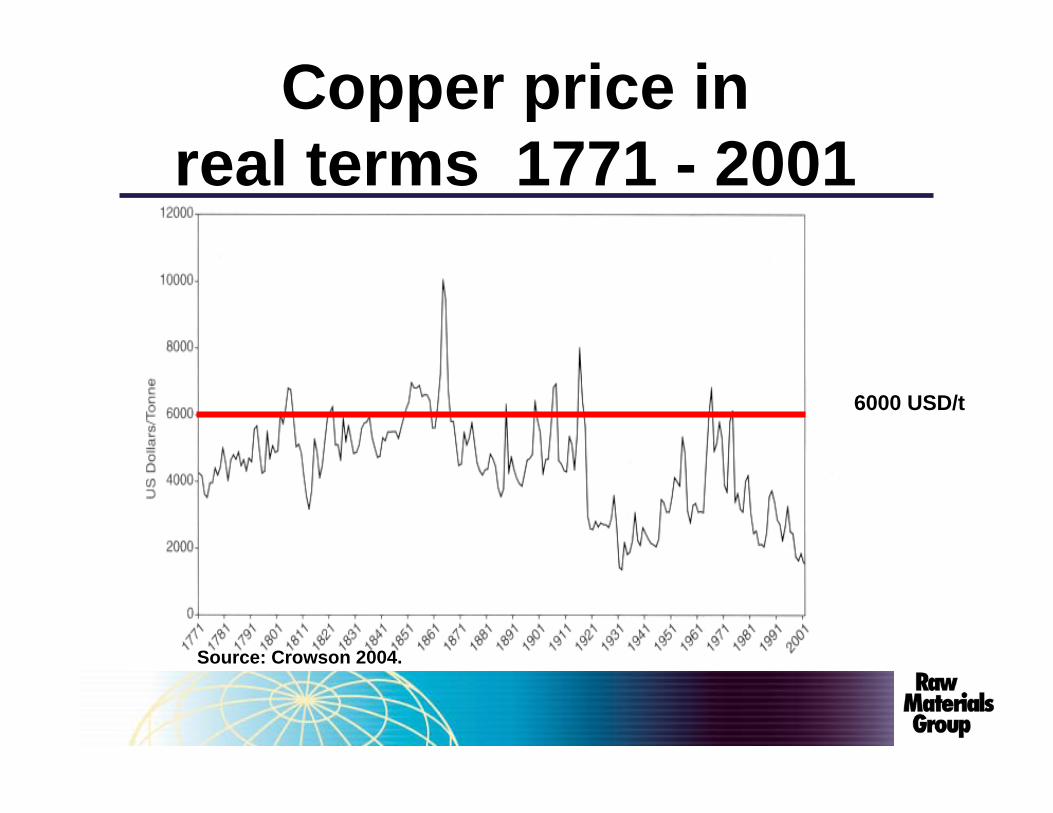
Copper price in real terms 1771 - 2001
6000 USD/t
Source: Crowson 2004.
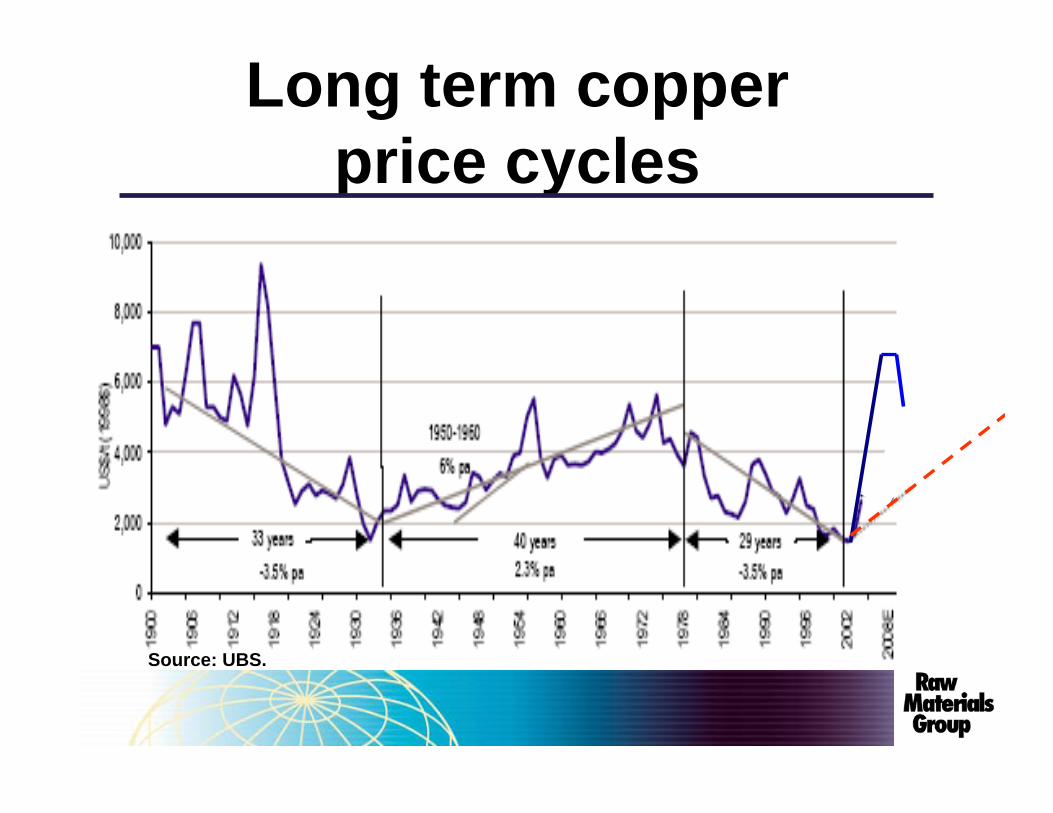
Long term copperprice cycles
Source: UBS.

Technical development
Drilling technology during 100 years
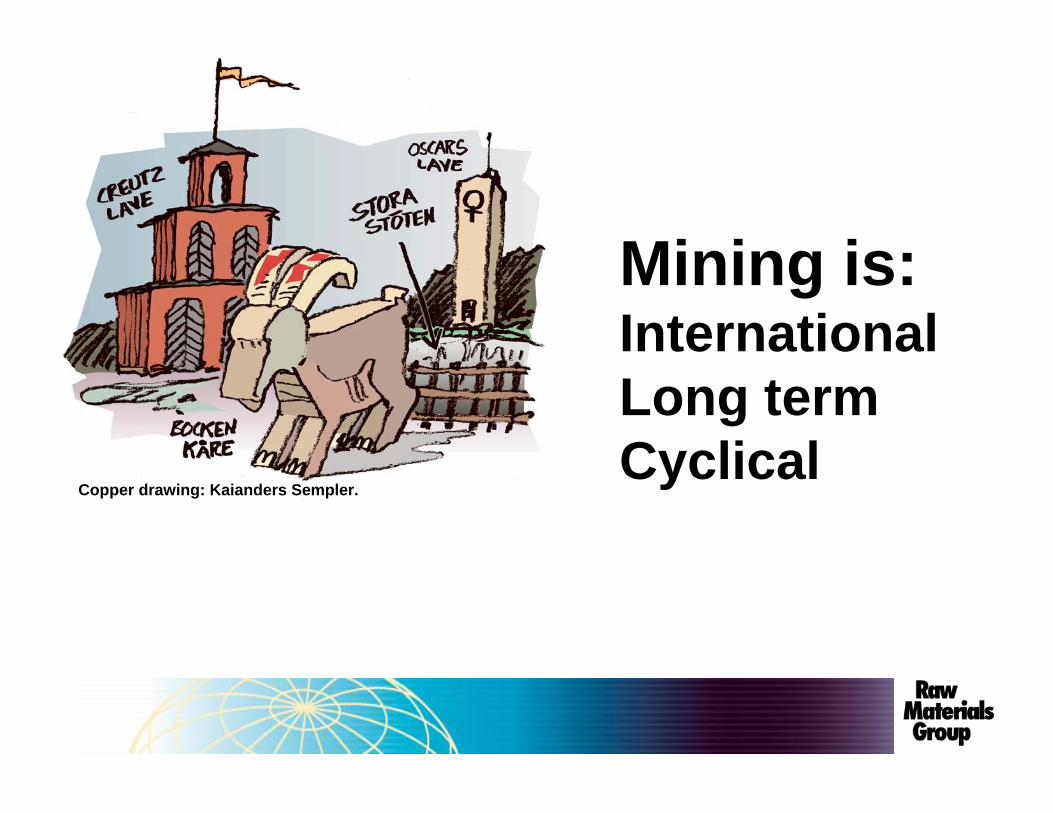
Copper drawing: Kaianders Sempler.
Mining is: InternationalLong term Cyclical

Agenda
• Long term trends• Nordic countries in the world• Policy implications
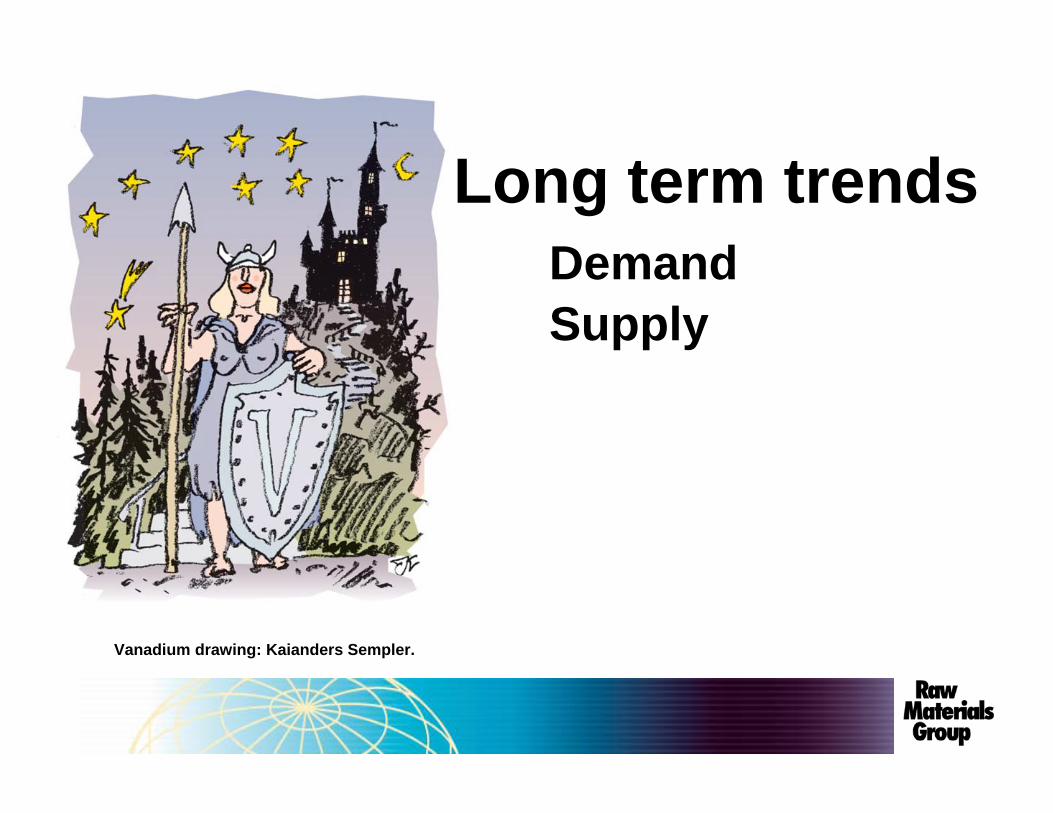
Vanadium drawing: Kaianders Sempler.
Long term trends DemandSupply

Special properties of metals
• High strength• Affordable cost• Conduct heat and electricity• Beautiful• Undestructable
Source: T. Graedel, Yale University.

Metal end useSteelCopper
Gold
Source: Raw Materials Group, Stockholm 2009.
China stimulus
Source: NDRC
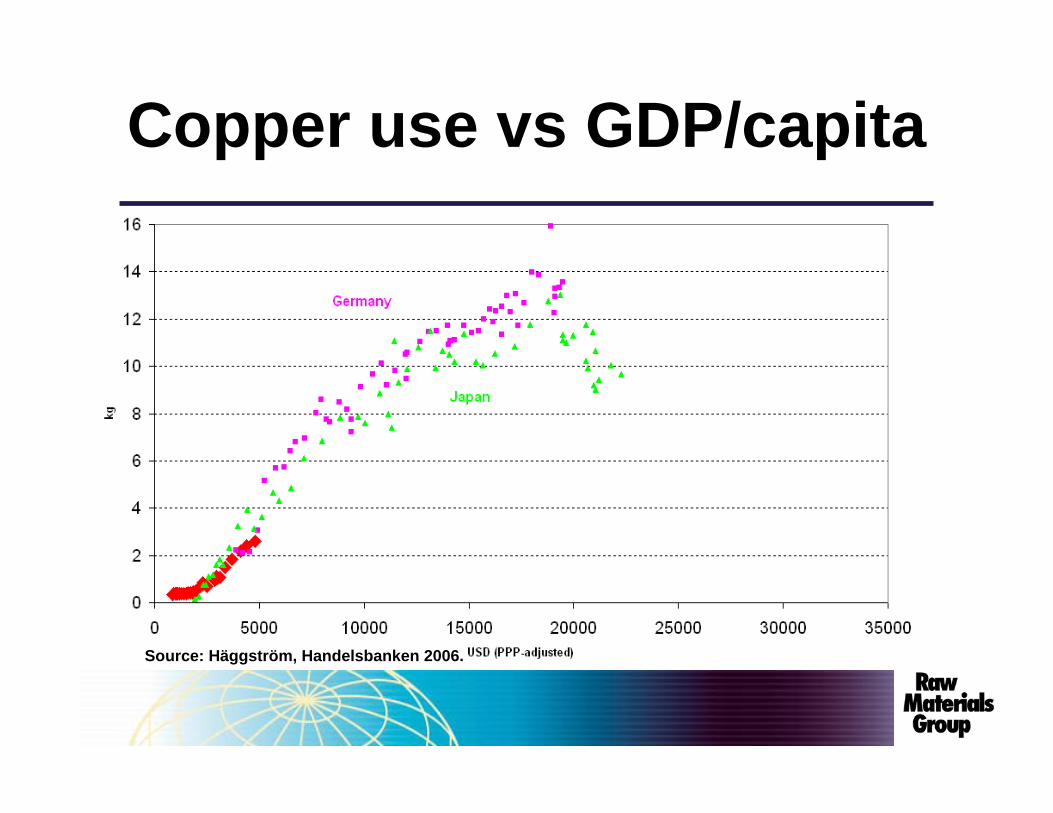
Copper use vs GDP/capita
Source: Häggström, Handelsbanken 2006.
0
500
1000
1500
2000
19001910192019301940195019601970198019902000200820102020
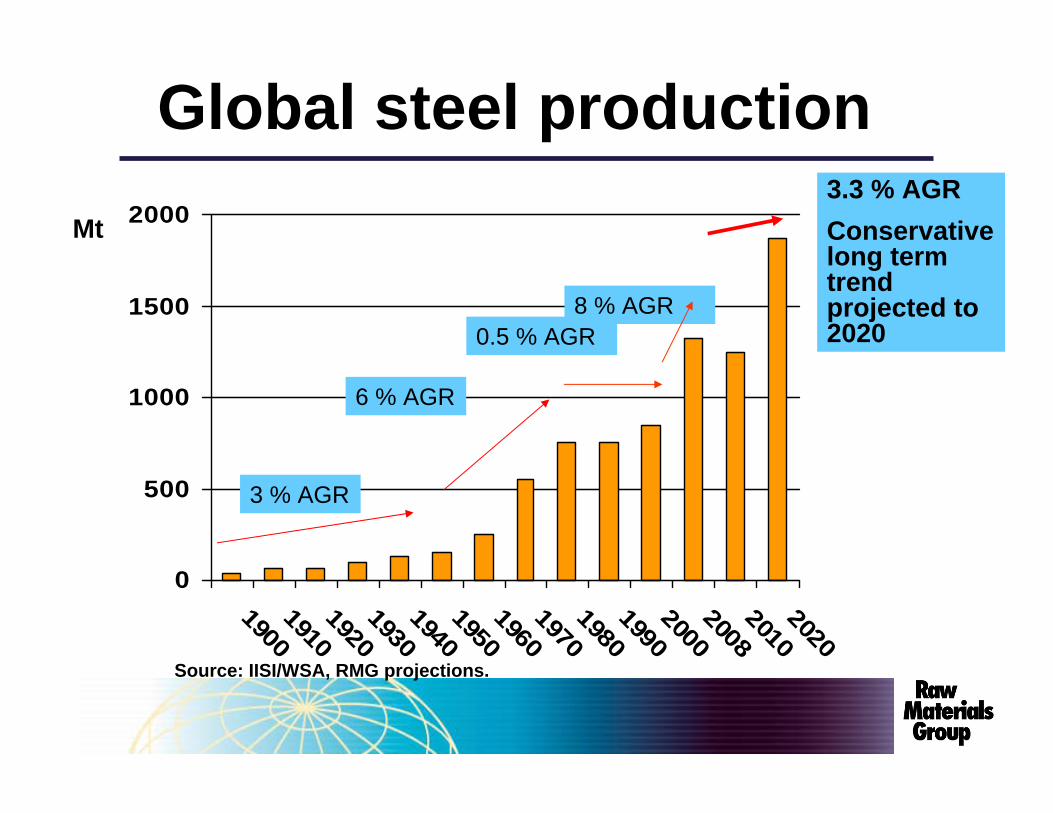
Global steel productionMt
Source: IISI/WSA, RMG projections.
3.3 % AGRConservativelong term trend projected to 2020
6 % AGR
0.5 % AGR
3 % AGR
8 % AGR
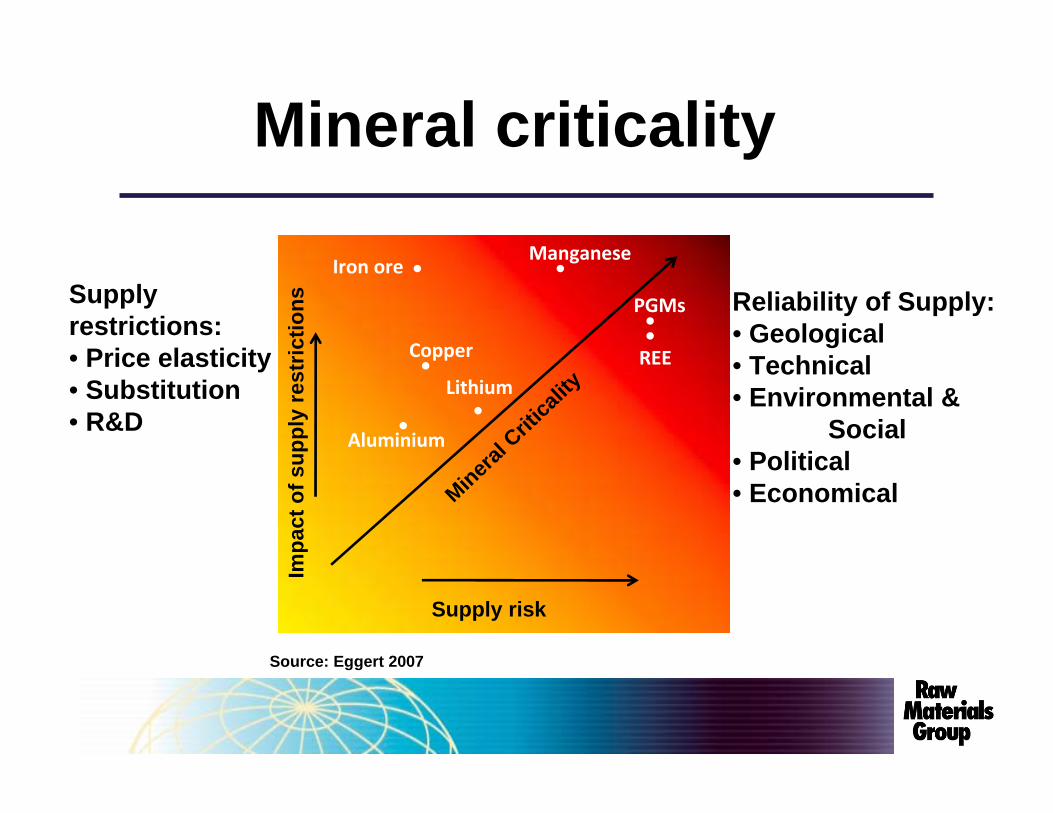
Mineral criticality
Source: Eggert 2007
Impa
ct o
f sup
ply
rest
rictio
ns
Supply risk
Mineral C
ritica
lity
Reliability of Supply:• Geological• Technical• Environmental &
Social• Political• Economical
Supply restrictions:• Price elasticity• Substitution• R&D
Iron oreManganese
Lithium
Aluminium
Copper
PGMs
REE

Vanadium drawing: Kaianders Sempler.
Demand summary• Metals cannot be replaced.• Extended period of growth.• China/Asia major engines.• Infrastructure & personal use.• Decline less dramatic than expected – long term growth will slow down but remain steady.
• New strategic metals.
REM drawing: Kaianders Sempler.
Supply
0
10
20
30
40
50
60
70
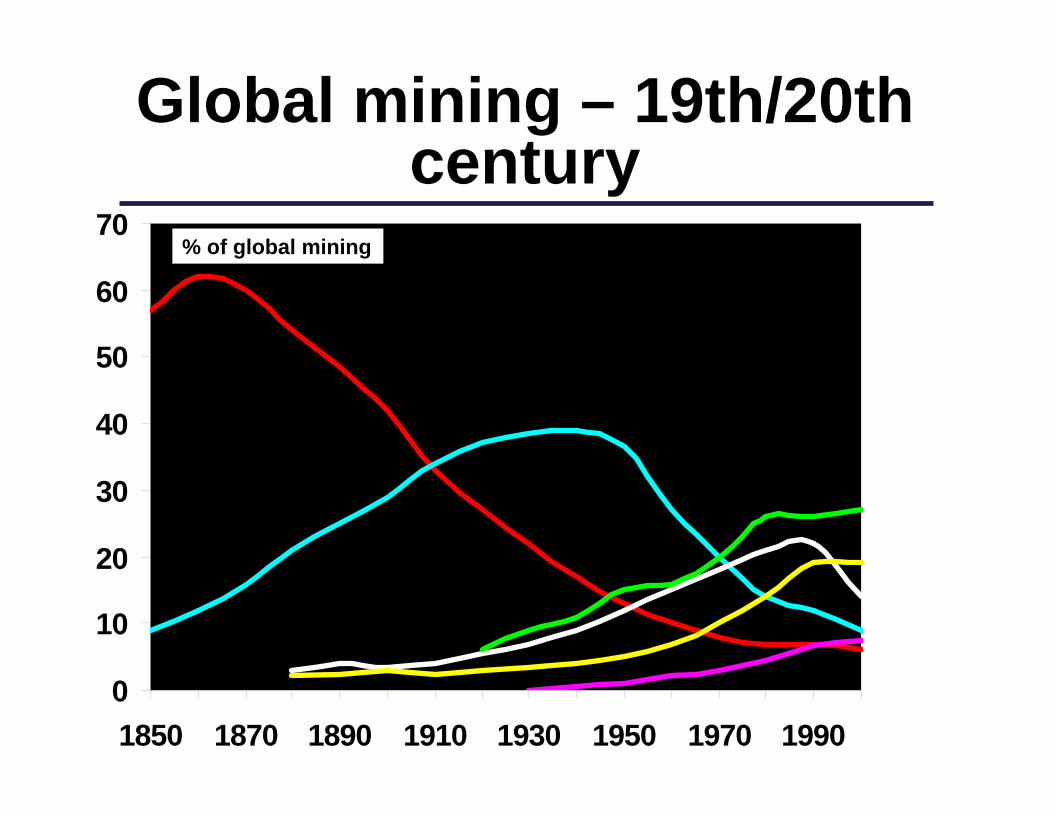
1850 1870 1890 1910 1930 1950 1970 1990
% of global mining
Global mining – 19th/20th century

Value of global mining
Source: Raw Materials Group, Stockholm 2009
Value of metals, diamonds and uranium

Metals value at mine2008 total ~ 463 billion USD, metals, diamonds and uranium
Source: Raw Materials Group, Stockholm 2009
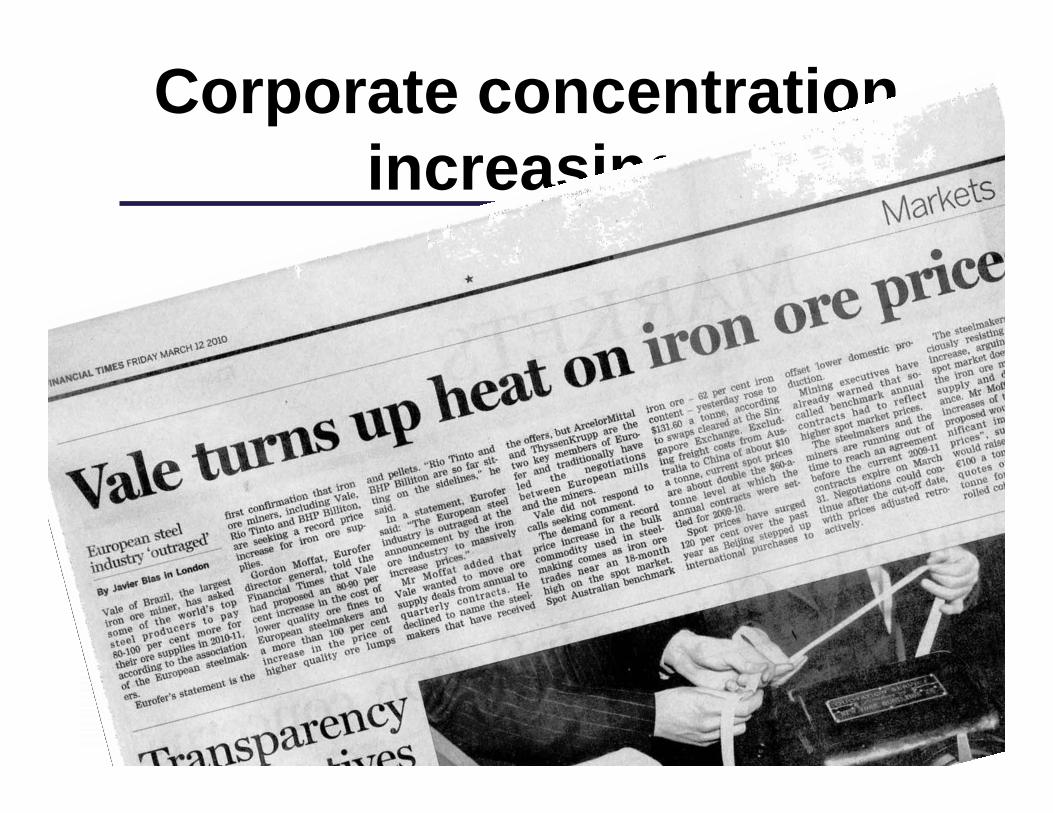
Corporate concentration increasing

Concentration by metal
Source: Raw Materials Group 2010.
%
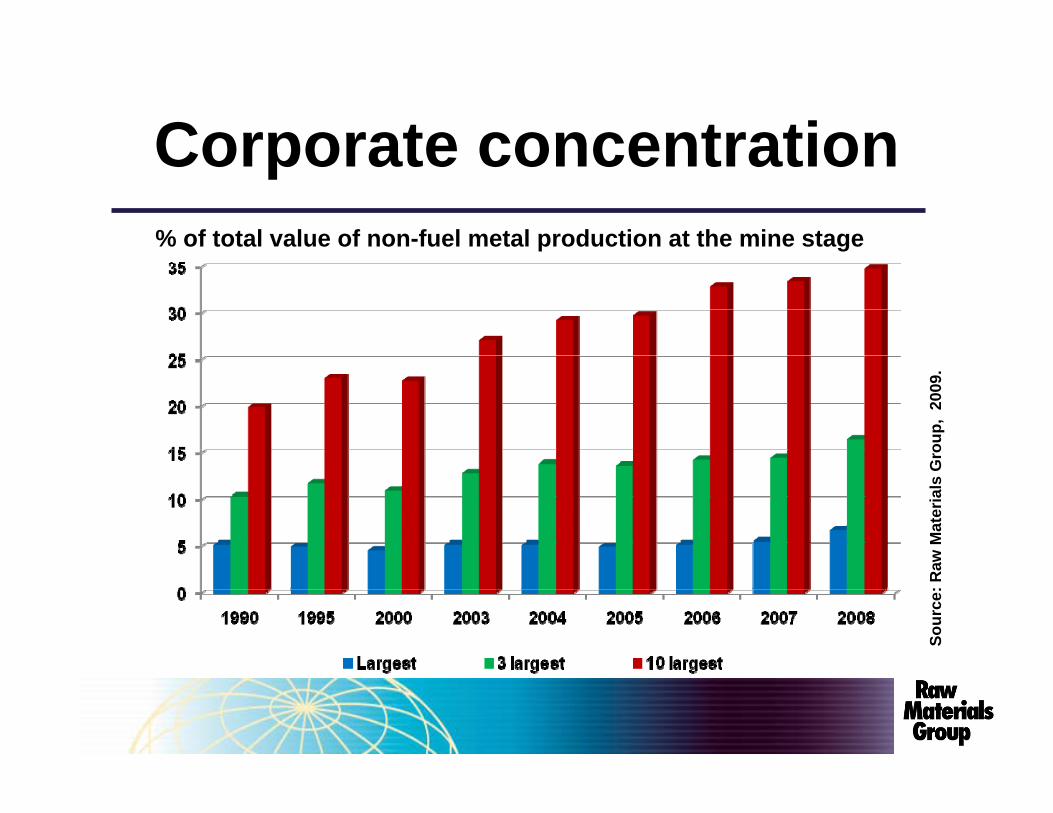
Corporate concentration% of total value of non-fuel metal production at the mine stage
Sour
ce: R
aw M
ater
ials
Gro
up,
2009
.

Production by foreign companies
0 10 20 30 40 50 60 70% of world production
Bauxite
Copper
Gold
Zinc
Nickel
Iron ore
Sources: UNCTAD, based on Raw Materials Data, 2007.
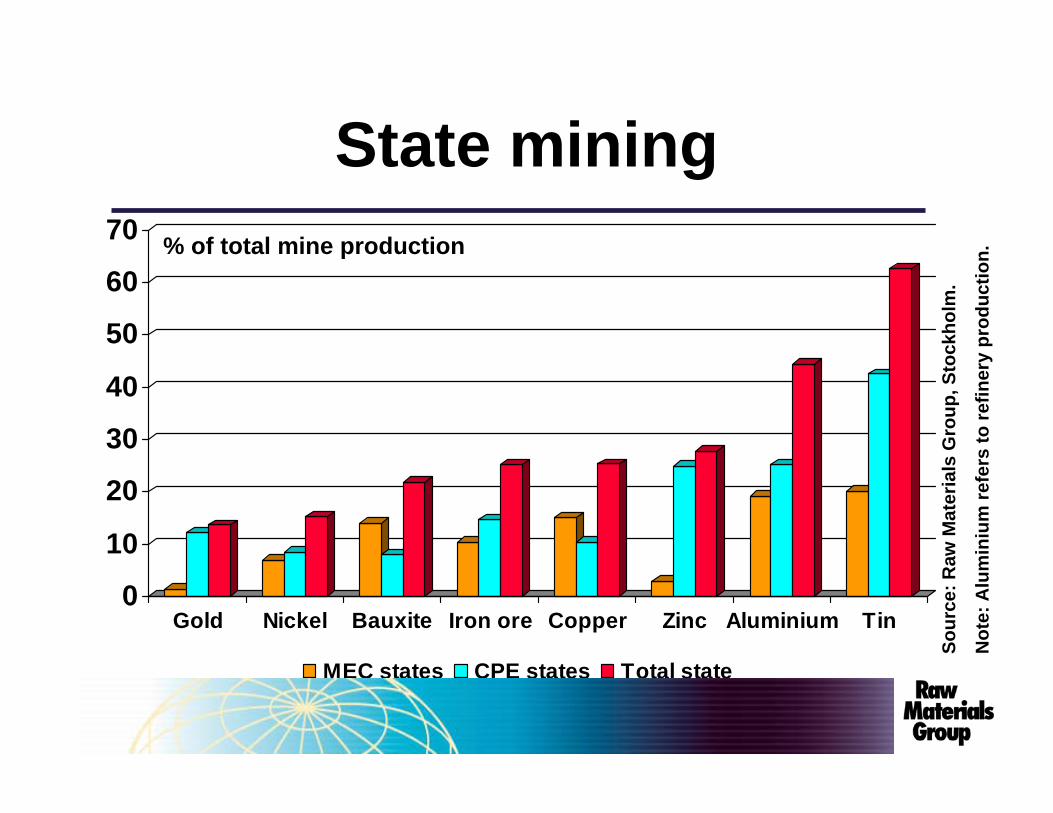
0
10
20
30
40
50
60
70
Gold Nickel Bauxite Iron ore Copper Zinc Aluminium Tin
MEC states CPE states Total state
Sour
ce: R
awM
ater
ials
Gro
up, S
tock
holm
.
Not
e: A
lum
iniu
m re
fers
to re
finer
y pr
oduc
tion.% of total mine production
State mining
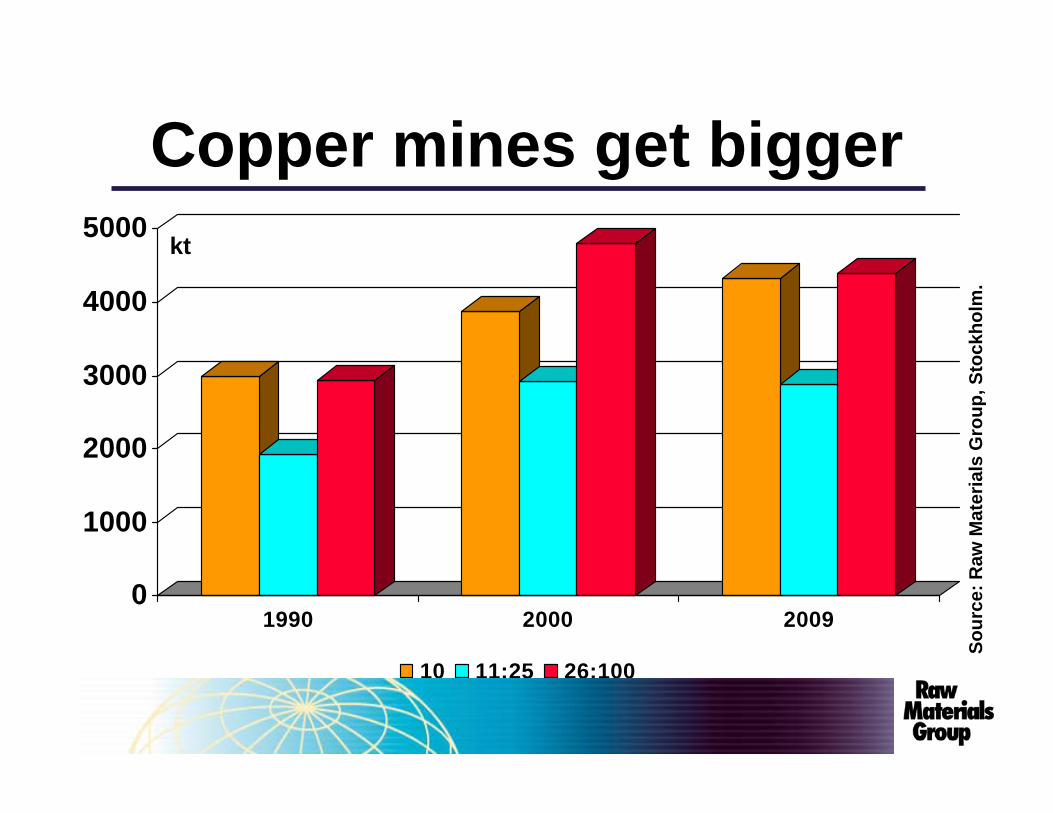
0
1000
2000
3000
4000
5000
1990 2000 2009
10 11:25 26:100
Sour
ce: R
awM
ater
ials
Gro
up, S
tock
holm
.
kt
Copper mines get bigger

Exploration
Sources: 1995-2008 MEG, 2009-2011 RMG.
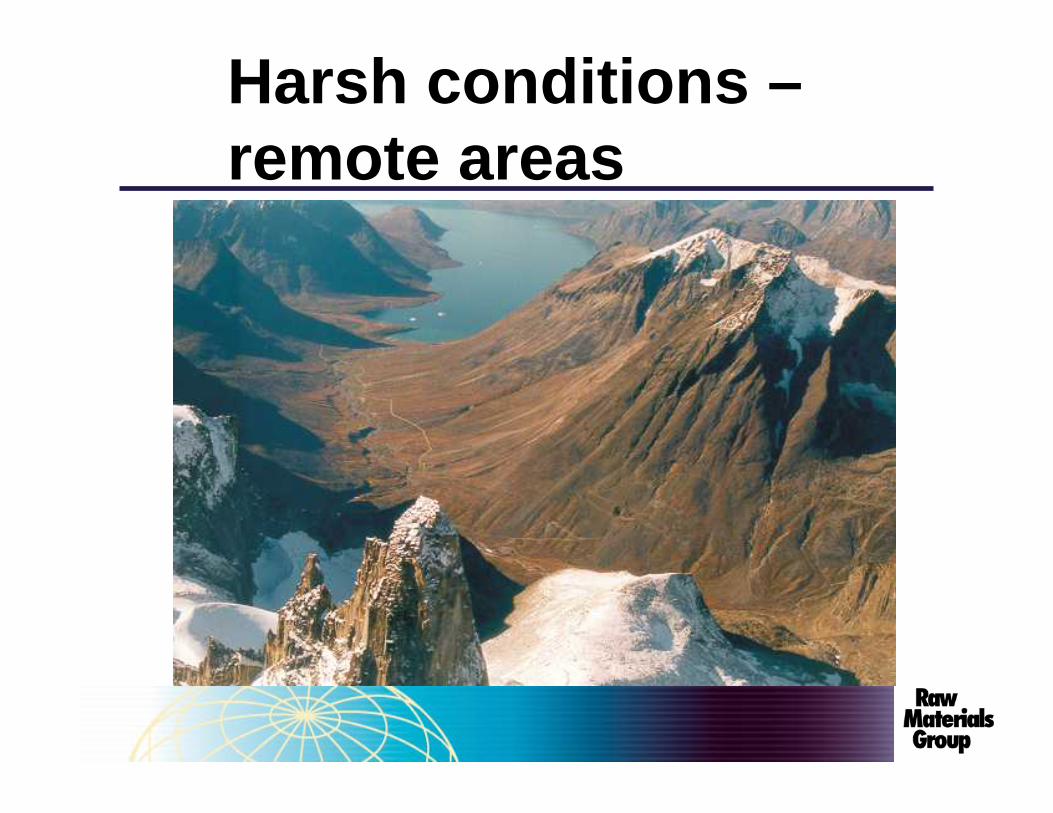
Harsh conditions –remote areas

Grades in copper production
Mean value 0.7 %
Source: Raw Materials Group, Stockholm 2009
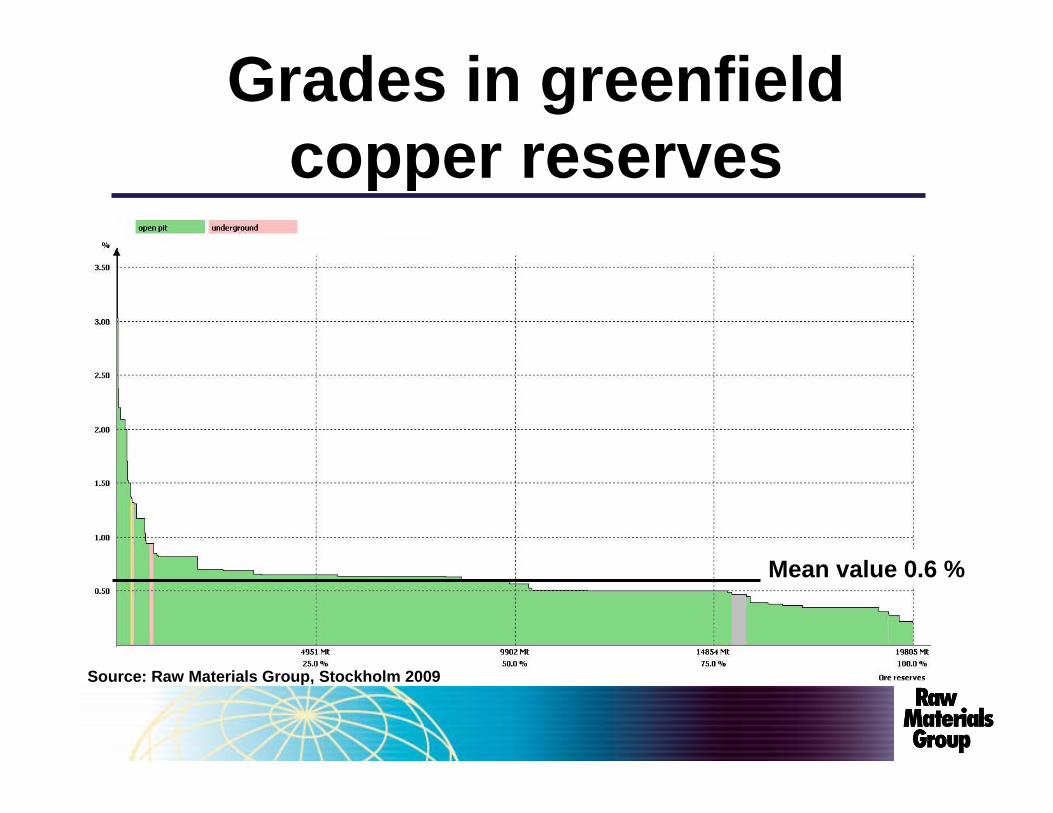
Grades in greenfieldcopper reserves
Mean value 0.6 %
Source: Raw Materials Group, Stockholm 2009

Increasingly difficult
• Remote locations• Harsh conditions• Lower oregrades• Deeper orebodies• Long permitting process
• Lack of people soon again ?!
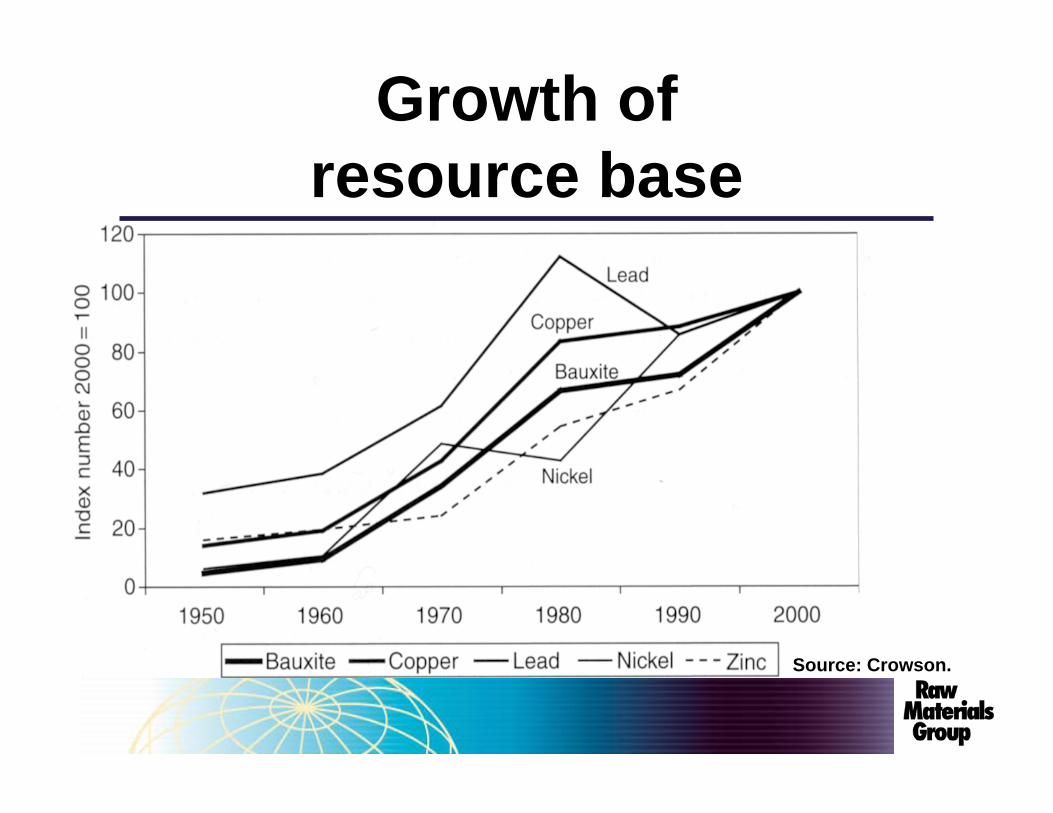
Growth of resource base
Source: Crowson.
REM drawing: Kaianders Sempler.
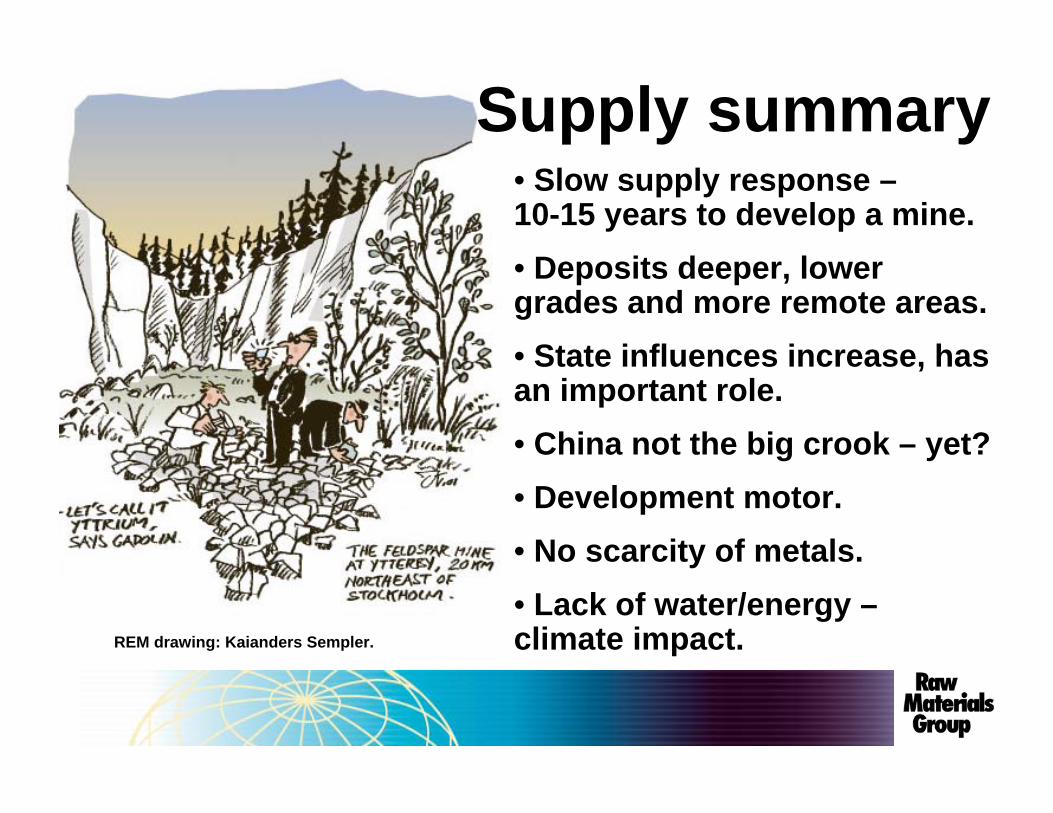
Supply summary • Slow supply response –10-15 years to develop a mine.• Deposits deeper, lower grades and more remote areas.• State influences increase, has an important role.• China not the big crook – yet?• Development motor.• No scarcity of metals.• Lack of water/energy –climate impact.
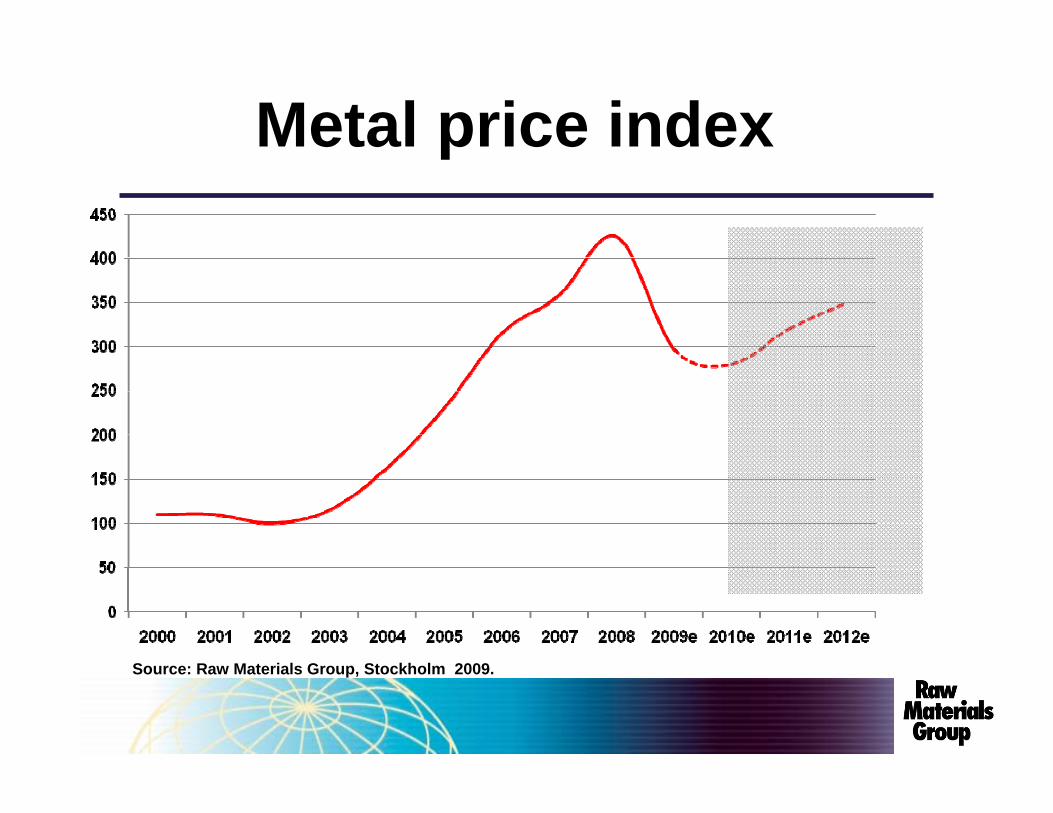
Metal price index
Source: Raw Materials Group, Stockholm 2009.
Nickel drawing: Kaianders Sempler.
Nordic countries in a global context
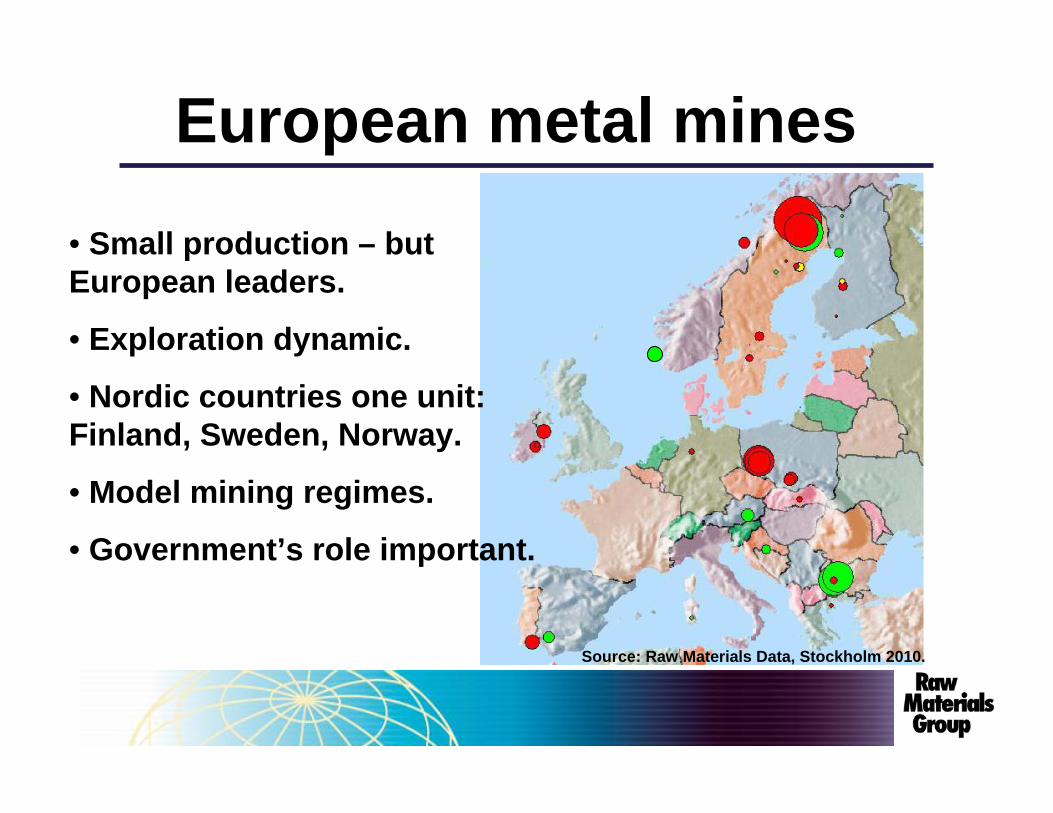
European metal mines
Source: Raw Materials Data, Stockholm 2010.
• Small production – but European leaders.
• Exploration dynamic.
• Nordic countries one unit: Finland, Sweden, Norway.
• Model mining regimes.
• Government’s role important.
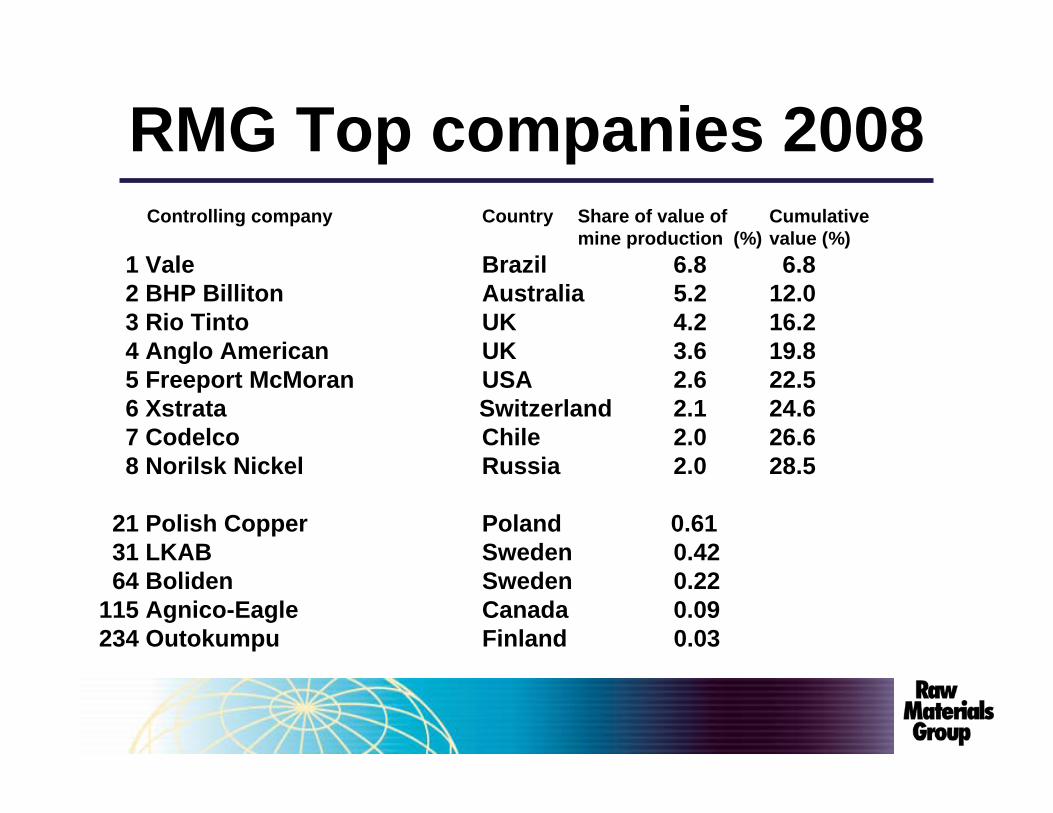
RMG Top companies 2008Controlling company Country Share of value of Cumulative
mine production (%) value (%) 1 Vale Brazil 6.8 6.82 BHP Billiton Australia 5.2 12.03 Rio Tinto UK 4.2 16.24 Anglo American UK 3.6 19.85 Freeport McMoran USA 2.6 22.56 Xstrata Switzerland 2.1 24.67 Codelco Chile 2.0 26.68 Norilsk Nickel Russia 2.0 28.5
21 Polish Copper Poland 0.6131 LKAB Sweden 0.4264 Boliden Sweden 0.22
115 Agnico-Eagle Canada 0.09234 Outokumpu Finland 0.03
Source: Raw Materials Data, Stockholm 2005.

Nordic top mines 2008Mine Metal Country Company Rank
mine1 Kiruna Fe Swe LKAB 532 Malmberget Fe Swe LKAB 1063 Tellnes Ti Nor NL Industries 283 4 Aitik Cu Swe Boliden 2855 Garpenberg Zn/Pb Swe Boliden 306 6 Zinkgruvan Zn/Pb Swe Lundin Mining 3867 Kristineberg Zn/Pb Swe Boliden 4608 Kemi Cr Fin Outokumpu 4859 Pyhäsalmi Zn Fin Inmet 500
10 Rana Fe Nor L Nilsen & söner 78111 Svartliden Au Swe Dragon 84712 Orivesi Au Fin Dragon 927
Source: Raw Materials Data, Stockholm 2005.
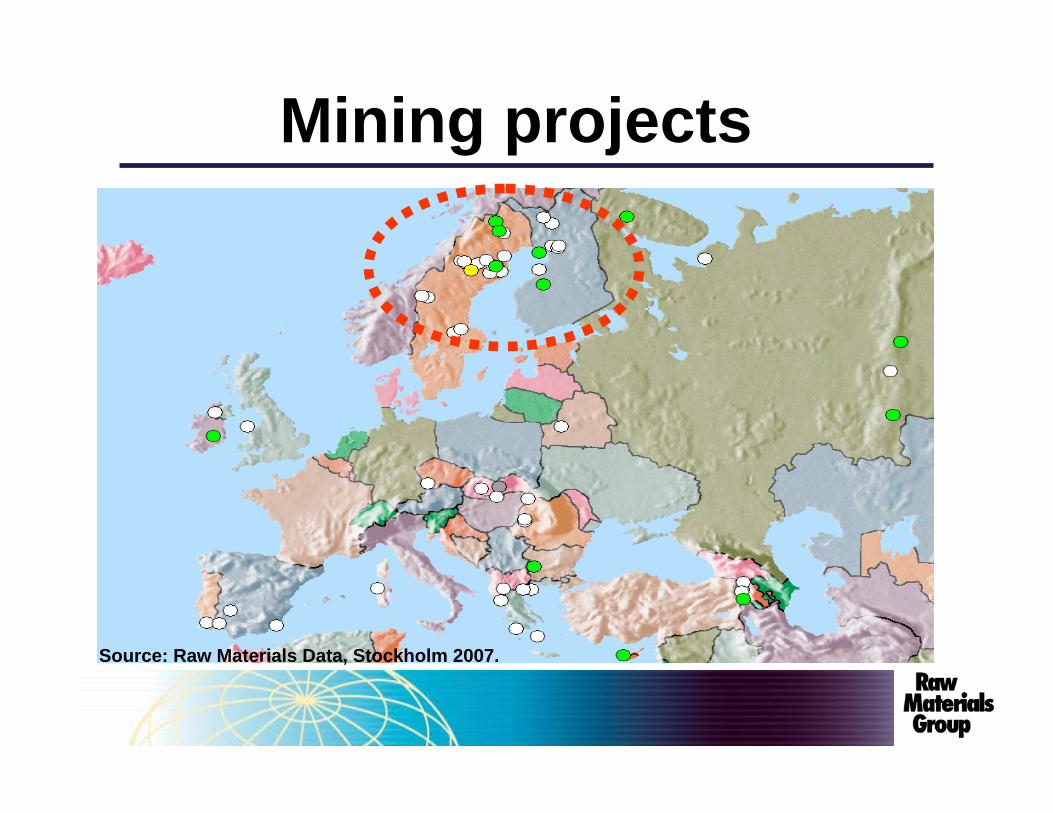
Mining projects
Source: Raw Materials Data, Stockholm 2007.

Bothnian cluster market shares
0 50 100
MiningExplorationSmeltingFlash smeltersDrill unitsSAG mills
Source: Noras, Ericsson 2006.
% estimate of total world

Mining cluster in northern Europe
Source: Noras, Ericsson 2006.
BarentsBothnian
Baltic
Nickel drawing: Kaianders Sempler.
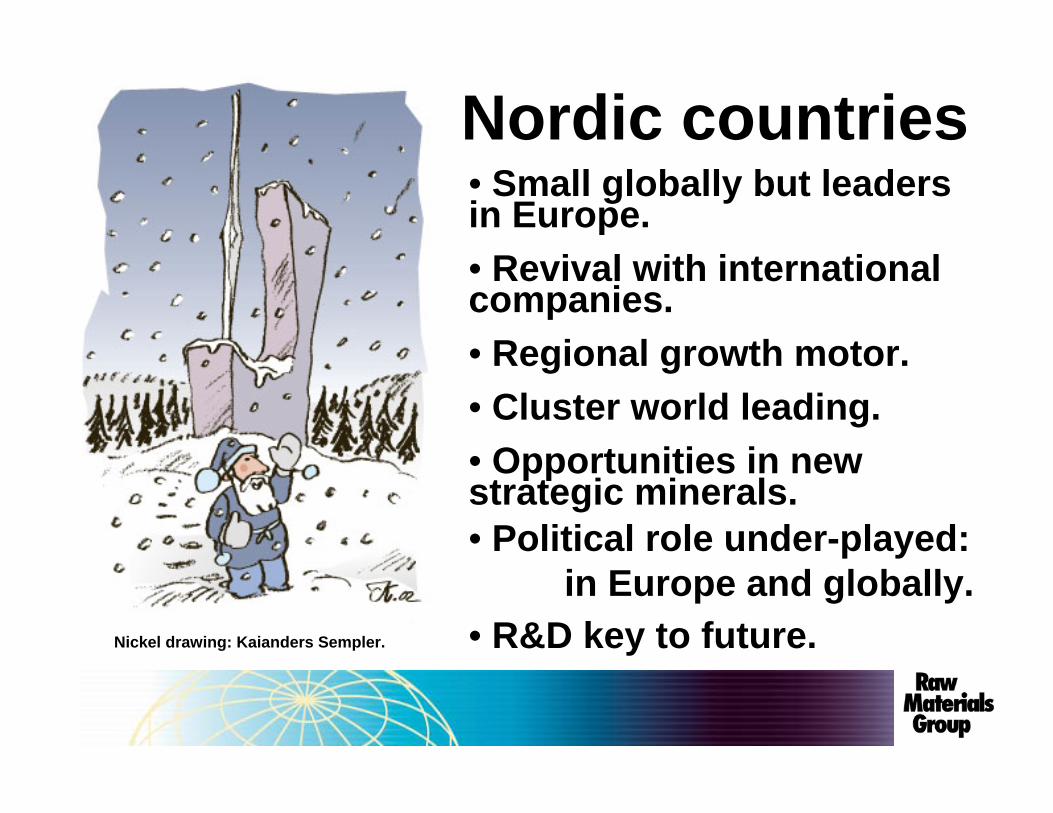
Nordic countries• Small globally but leaders in Europe.• Revival with international companies.• Regional growth motor.• Cluster world leading.• Opportunities in new strategic minerals.• Political role under-played:
in Europe and globally.• R&D key to future.

Manganese drawing: Kaianders Sempler.
Policy implications
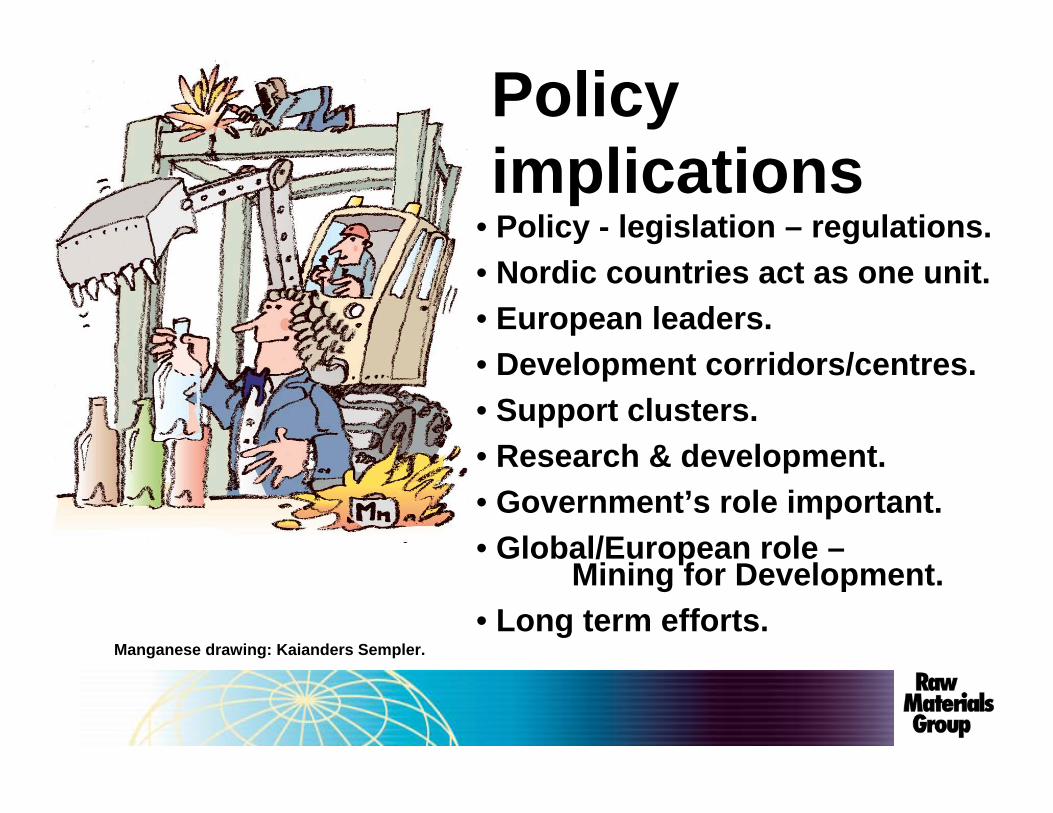
Manganese drawing: Kaianders Sempler.
Policy implications
• Policy - legislation – regulations.• Nordic countries act as one unit.• European leaders.• Development corridors/centres.• Support clusters.• Research & development.• Government’s role important.• Global/European role –
Mining for Development.• Long term efforts.
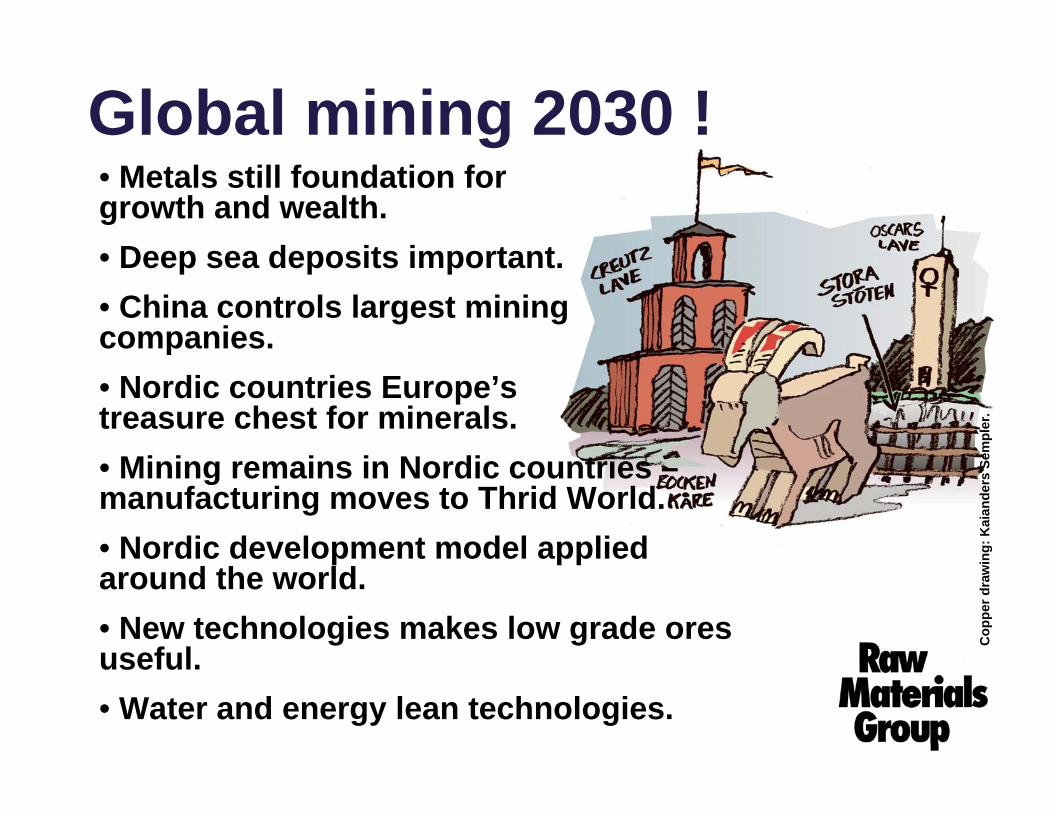
Global mining 2030 !
Cop
perd
raw
ing:
Kai
ande
rsSe
mpl
er.
• Metals still foundation for growth and wealth.• Deep sea deposits important.• China controls largest mining companies.• Nordic countries Europe’s treasure chest for minerals.• Mining remains in Nordic countries –manufacturing moves to Thrid World.• Nordic development model applied around the world.• New technologies makes low grade ores useful. • Water and energy lean technologies.

Tungsten drawing: Kaianders Sempler.
Raw Materials GroupMagnus Ericsson
PO Box 3127 SE-169 03 Solna, Sweden
Tel: +46-8-744 00 65 Fax: +46-8-744 0066
E-mail: [email protected]
www.rmg.se
Kiitos/Tack!