flexible cognitive strategies during motor learningipalab/papers/taylor and ivry - 2011 -...
TRANSCRIPT
Flexible Cognitive Strategies during Motor LearningJordan A. Taylor1*, Richard B. Ivry1,2*
1 Department of Psychology, University of California, Berkeley, Berkeley, California, United States of America, 2 Helen Wills Neuroscience Institute, University of California,
Berkeley, Berkeley, California, United States of America
Abstract
Visuomotor rotation tasks have proven to be a powerful tool to study adaptation of the motor system. While adaptation insuch tasks is seemingly automatic and incremental, participants may gain knowledge of the perturbation and invoke acompensatory strategy. When provided with an explicit strategy to counteract a rotation, participants are initially veryaccurate, even without on-line feedback. Surprisingly, with further testing, the angle of their reaching movements drifts inthe direction of the strategy, producing an increase in endpoint errors. This drift is attributed to the gradual adaptation ofan internal model that operates independently from the strategy, even at the cost of task accuracy. Here we identifyconstraints that influence this process, allowing us to explore models of the interaction between strategic and implicitchanges during visuomotor adaptation. When the adaptation phase was extended, participants eventually modified theirstrategy to offset the rise in endpoint errors. Moreover, when we removed visual markers that provided external landmarksto support a strategy, the degree of drift was sharply attenuated. These effects are accounted for by a setpoint state-spacemodel in which a strategy is flexibly adjusted to offset performance errors arising from the implicit adaptation of an internalmodel. More generally, these results suggest that strategic processes may operate in many studies of visuomotoradaptation, with participants arriving at a synergy between a strategic plan and the effects of sensorimotor adaptation.
Citation: Taylor JA, Ivry RB (2011) Flexible Cognitive Strategies during Motor Learning. PLoS Comput Biol 7(3): e1001096. doi:10.1371/journal.pcbi.1001096
Editor: Jorn Diedrichsen, University College London, United Kingdom
Received April 11, 2010; Accepted January 28, 2011; Published March 3, 2011
Copyright: � 2011 Taylor, Ivry. This is an open-access article distributed under the terms of the Creative Commons Attribution License, which permitsunrestricted use, distribution, and reproduction in any medium, provided the original author and source are credited.
Funding: Jordan A. Taylor was supported by National Research Service Award F32NS064749 from the National Institute of Neurological Disorders and Stroke(NINDS). Richard B. Ivry was supported by R01HD060306 from the National Institutes of Child Health and Human Development, P01NS040813 from NINDS, andIIS0703787 from the National Science Foundation. The funders had no role in study design, data collection and analysis, decision to publish, or preparation of themanuscript.
Competing Interests: The authors have declared that no competing interests exist.
* E-mail: [email protected] (JAT); [email protected] (RBI)
Introduction
When learning a new motor skill, verbal instruction often proves
useful to hasten the learning process. For example, a new driver is
instructed on the sequence of steps required to change gears when
using a standard transmission. As the skill becomes consolidated,
the driver no longer requires explicit reference to these
instructions. Operating a vehicle with a stiffer or looser clutch
does not generally require further instruction, but rather entails a
subtle recalibration, or adaptation of the previously learned skill.
Indeed, the use of an explicit strategy may even lead to
degradation in the expert’s performance. Consideration of these
contradictory issues brings into question the role of instructions or
explicit strategies in sensorimotor learning.
The type of motor task and nature of the instruction can have
varying effects on motor execution and learning [1–3]. In the serial
reaction time task (SRT), participants produce a sequence of cued
button presses. If the participant is informed of the underlying
sequence, learning occurs much more rapidly compared to when
sequential learning arises from repeated performance [4].
However, learning in the SRT task entails the linkage of a series
of discrete actions. Explicit instructions of the sequence structure
may be viewed as a way to create a working memory
representation of the series. Many skills lack such a clear elemental
partition and, as such, participants cannot easily verbalize what a
successful movement entails. For example, the pattern of forces
required to move the hand in a straight line in a novel force field
[5–7] would be hard to verbalize.
Various studies have examined the role of explicit strategies in
tasks involving sensorimotor adaptation [8–11]. The benefits of an
explicit strategy may be illusory with adaptive processes arising
from automatic and incremental updating of a motor system that
is impenetrable to conscious intervention [12–16]. However,
performance measures indicate that adaptation may differ
between conditions in which participants are either aware or
unaware of the changes in the environment [17]. For example, a
large visuomotor rotation can be introduced abruptly, in which
case, awareness is likely, or introduced incrementally such that
participants are unaware of the rotation. The abrupt onset of large
unexpected errors may promote the use of cognitive strategies
[18–20]. Participants who gain explicit knowledge of an imposed
visuomotor rotation show better performance during learning than
participants who report little or no awareness of the rotation [10].
Moreover, the rate of learning, at least in the early phase of
adaptation, correlates positively with spatial working memory span
[21], suggesting that strategic compensation may be dependent on
working memory capacity. Studies of sensorimotor adaptation
during aging also indicate that the rate of learning is slower in
older adults compared to young adults, despite similar aftereffects
[22–24]. This cost is absent in older adults who report awareness
of the rotation [25].
In many of the studies cited above, the assumption has been that
the development of awareness can lead to the utilization of
compensatory strategies. However, few studies have directly
sought to manipulate strategic control during sensorimotor
adaptation. One striking exception is a study by Mazzoni and
PLoS Computational Biology | www.ploscompbiol.org 1 March 2011 | Volume 7 | Issue 3 | e1001096

Krakauer [9]. Participants viewed a display of eight small circles,
or visual landmarks, that were evenly spaced by 45u to form a
large, implicit ring. The target location was specified by presenting
a bullseye within one of the eight circles. After an initial training
phase in which the visuomotor mapping was unaltered, a 45urotation in the counterclockwise direction (CCW) was introduced.
In the standard condition in which no instructions were provided,
participants gradually reduced endpoint error by altering their
movement heading in the clockwise direction (CW). In the strategy
condition, participants were given explicit instructions to move to
the circle located 45u clockwise to the target. This strategy enabled
these participants to immediately eliminate all error. However, as
training continued, the participants progressively increased their
movement heading in the clockwise direction. As such, the
endpoint location of the feedback cursor drifted further from the
actual target location and, thus, performance showed an increase
in error over training, a rather counterintuitive result [26].
Mazzoni and Krakauer [9] proposed that this drift arises from
the implicit adaptation of an internal forward model. Importantly,
the error signal for this learning process is not based on difference
between the observed visual feedback and target location. Rather,
it is based on the difference between the observed visual feedback
and strategic aiming location. Even though participants aim to a
clockwise location of the target (as instructed), the motor system
experiences a mismatch between the predicted state and the visual
feedback. This mismatch defines an error signal that is used to
recalibrate the internal model. Reducing the mismatch results in
an adjustment of the internal model such that the next movement
will be even further in the clockwise direction. Thus, the operation
of an implicit learning process that is impervious to the strategy
produces the paradoxical deterioration in performance over time.
In the present paper, we start by asking how this hypothesis
could be formalized in a computational model of motor learning.
State space modeling techniques have successfully described
adaptation and generalization during motor learning [27–29].
These models focus on how learning mechanisms minimize error
from trial to trial. Variants of these models postulate multiple
learning mechanisms that operate at different time scales [28].
Within this framework, strategic factors might be associated with
fast learning processes that rapidly reduce error. However, such
models are unable to account for the drift that arises following the
deployment of a strategy. To address these issues, we developed a
series of setpoint state-space models of adaptation to quantitatively
explore how strategic control and implicit adaptation interact.
Assuming a fixed strategy, adaptation should continue to occur
until the error signal, the difference between the feedback location
and the aiming location is zero; that is, the visual feedback matches
the intended aim of the reach. As such, drift arising from implicit
adaptation should continue to rise until it offsets the adopted
strategy. To test this prediction, we increased the length of the
adaptation phase. Moreover, we manipulated the salience of the
visual landmarks used to support the strategy. We hypothesized
that these landmarks served as a proxy for the aiming location. If
this assumption is correct, then elimination of the visual landmarks
should weaken the error signal, given uncertainty concerning the
aiming location, and drift should be attenuated. We test this
prediction by comparing performance with and without visual
landmarks.
Results
Current models of sensorimotor adaptation have not addressed
the effect of explicit strategies. Therefore, we started with the
standard state-space model (Eq 1 and 2), and incrementally
modified it to accommodate the use of an explicit strategy. The
standard model for target error is given as:
etargetn ~ rn{rest
n
� �ð1Þ
restnz1~Arest
n zBetargetn ð2Þ
where etargetn is the target endpoint error on movement n, rnis the
rotation, restn is the internal model’s estimation of the rotation, A is a
memory term, and B represents either a learning rate or sensitivity
to error [27–30]. As expected, this model gradually learns to
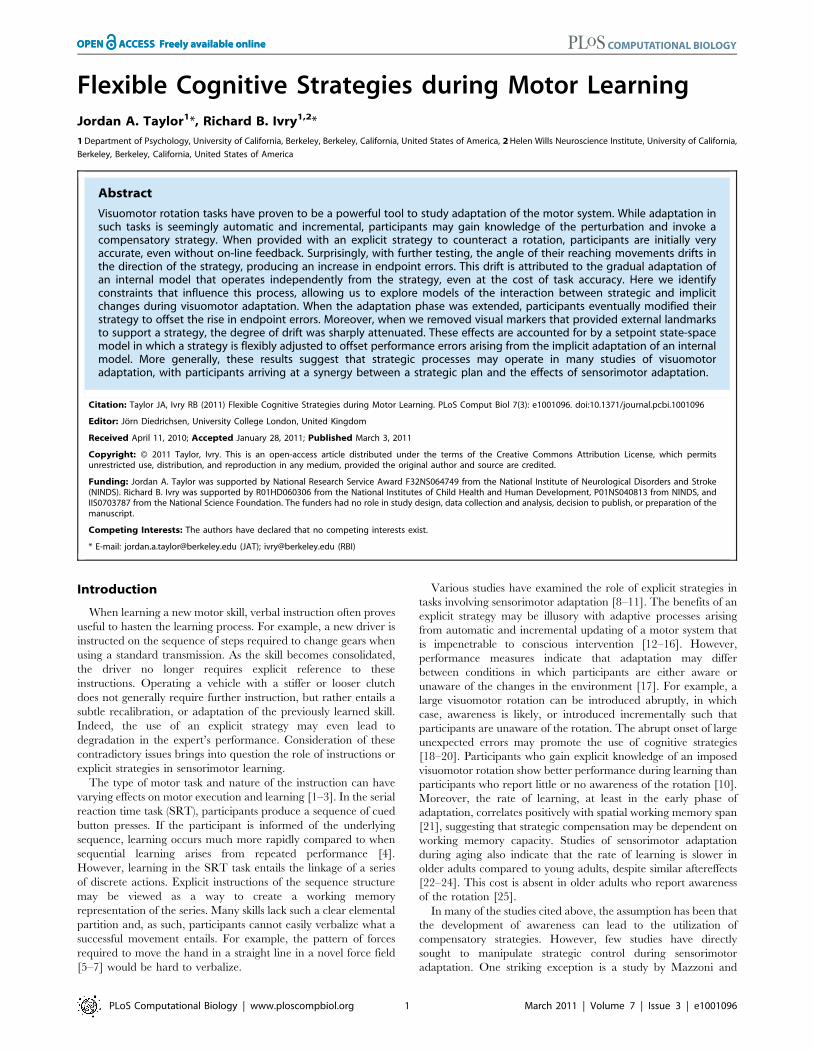
compensate for a visuomotor rotation (Figure 1A – black line;
simulated with A = 1 and B = 0.02).
Modeling strategy use during visuomotor adaptationWhen informed of an appropriate strategy that will compensate
for the rotation, participants immediately counteract the rotation
and show on-target accuracy. The standard model as formulated
above does not provide a mechanism to implement an explicit
strategy. To allow immediate implementation of the strategy, we
postulate that there is direct feedthrough of the strategy (s) to the
target error equation (equation 1):
etargetn ~ snz rn{rest
n
� �� �actual ð3Þ
Direct feedthrough allows the strategy to contribute to the target
error equation without directly influencing the updating of the
internal model. If the strategy operated through the internal
model, then the impact of the strategy would take time to evolve,
assuming there is substantial memory of the internal model’s
estimation of the rotation (i.e., A has a high value in Eq. 2). With
direct feedthrough, the implementation of an appropriate strategy
can immediately compensate for the rotation. In the current
arrangement, the appropriate strategy is fixed at 45u in the CW
direction from the cued target.
Author Summary
Motor learning has been modeled as an implicit process inwhich an error, signaling the difference between thepredicted and actual outcome is used to modify a modelof the actor-environment interaction. This process isassumed to operate automatically and implicitly. However,people can employ cognitive strategies to improveperformance. It has recently been shown that whenimplicit and explicit processes are put in opposition, theoperation of motor learning mechanisms will offset theadvantages conferred by a strategy and eventually,performance deteriorates. We present a computationalmodel of the interplay of these processes. A key insight ofthe model is that implicit and explicit learning mechanismsoperate on different error signals. Consistent with previousmodels of sensorimotor adaptation, implicit learning isdriven by an error reflecting the difference between thepredicted and actual feedback for that movement. Incontrast, explicit learning is driven by an error based onthe difference between the feedback and target locationof the movement, a signal that directly reflects taskperformance. Empirically, we demonstrate constraints onthese two error signals. Taken together, the modeling andempirical results suggest that the benefits of a cognitivestrategy may lie hidden in many motor learning tasks.
Flexible Strategies during Motor Learning
PLoS Computational Biology | www.ploscompbiol.org 2 March 2011 | Volume 7 | Issue 3 | e1001096
Once the strategy is implemented, performance should remain
stable since the error term is small. Indeed, a model based on Eq. 3
immediately compensates for the rotation. The target error, the
difference between the feedback location and target location, is
essentially zero on the first trial with the strategy, and remains so
throughout the rotation block (Figure 1B – green line). However,
this model fails to match the empirical results observed by
Mazzoni and Krakauer [9]: performance drifts over time with an
increase in errors in the direction of the strategy. This
phenomenon led the authors to suggest that the prediction error
signal to the internal model is not based on target error. Instead,
the error signal should be defined by the difference between the
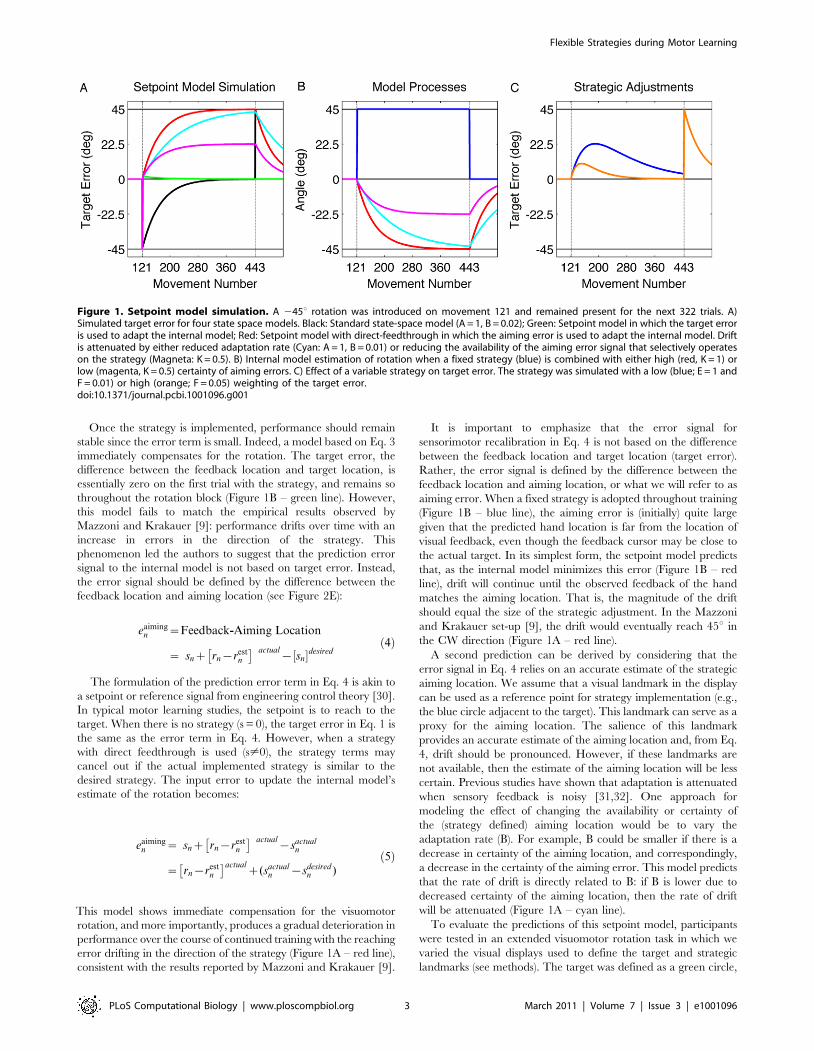
feedback location and aiming location (see Figure 2E):
eaimingn ~Feedback-Aiming Location
~ snz rn{restn
� �� �actual{ sn½ �desired
ð4Þ
The formulation of the prediction error term in Eq. 4 is akin to
a setpoint or reference signal from engineering control theory [30].
In typical motor learning studies, the setpoint is to reach to the
target. When there is no strategy (s = 0), the target error in Eq. 1 is
the same as the error term in Eq. 4. However, when a strategy
with direct feedthrough is used (s?0), the strategy terms may
cancel out if the actual implemented strategy is similar to the
desired strategy. The input error to update the internal model’s
estimate of the rotation becomes:
eaimingn ~ snz rn{rest
n
� �� �actual{sactual
n
~ rn{restn
� �actualz(sactual
n {sdesiredn )
ð5Þ
This model shows immediate compensation for the visuomotor
rotation, and more importantly, produces a gradual deterioration in
performance over the course of continued training with the reaching
error drifting in the direction of the strategy (Figure 1A – red line),
consistent with the results reported by Mazzoni and Krakauer [9].
It is important to emphasize that the error signal for
sensorimotor recalibration in Eq. 4 is not based on the difference
between the feedback location and target location (target error).
Rather, the error signal is defined by the difference between the
feedback location and aiming location, or what we will refer to as
aiming error. When a fixed strategy is adopted throughout training
(Figure 1B – blue line), the aiming error is (initially) quite large
given that the predicted hand location is far from the location of
visual feedback, even though the feedback cursor may be close to
the actual target. In its simplest form, the setpoint model predicts
that, as the internal model minimizes this error (Figure 1B – red
line), drift will continue until the observed feedback of the hand
matches the aiming location. That is, the magnitude of the drift
should equal the size of the strategic adjustment. In the Mazzoni
and Krakauer set-up [9], the drift would eventually reach 45u in
the CW direction (Figure 1A – red line).
A second prediction can be derived by considering that the
error signal in Eq. 4 relies on an accurate estimate of the strategic
aiming location. We assume that a visual landmark in the display
can be used as a reference point for strategy implementation (e.g.,
the blue circle adjacent to the target). This landmark can serve as a
proxy for the aiming location. The salience of this landmark
provides an accurate estimate of the aiming location and, from Eq.
4, drift should be pronounced. However, if these landmarks are
not available, then the estimate of the aiming location will be less
certain. Previous studies have shown that adaptation is attenuated
when sensory feedback is noisy [31,32]. One approach for
modeling the effect of changing the availability or certainty of
the (strategy defined) aiming location would be to vary the
adaptation rate (B). For example, B could be smaller if there is a
decrease in certainty of the aiming location, and correspondingly,
a decrease in the certainty of the aiming error. This model predicts
that the rate of drift is directly related to B: if B is lower due to
decreased certainty of the aiming location, then the rate of drift
will be attenuated (Figure 1A – cyan line).
To evaluate the predictions of this setpoint model, participants
were tested in an extended visuomotor rotation task in which we
varied the visual displays used to define the target and strategic
landmarks (see methods). The target was defined as a green circle,
Figure 1. Setpoint model simulation. A 245u rotation was introduced on movement 121 and remained present for the next 322 trials. A)Simulated target error for four state space models. Black: Standard state-space model (A = 1, B = 0.02); Green: Setpoint model in which the target erroris used to adapt the internal model; Red: Setpoint model with direct-feedthrough in which the aiming error is used to adapt the internal model. Driftis attenuated by either reduced adaptation rate (Cyan: A = 1, B = 0.01) or reducing the availability of the aiming error signal that selectively operateson the strategy (Magneta: K = 0.5). B) Internal model estimation of rotation when a fixed strategy (blue) is combined with either high (red, K = 1) orlow (magenta, K = 0.5) certainty of aiming errors. C) Effect of a variable strategy on target error. The strategy was simulated with a low (blue; E = 1 andF = 0.01) or high (orange; F = 0.05) weighting of the target error.doi:10.1371/journal.pcbi.1001096.g001
Flexible Strategies during Motor Learning
PLoS Computational Biology | www.ploscompbiol.org 3 March 2011 | Volume 7 | Issue 3 | e1001096
appearing at one of eight possible locations, separated by 45u(Figure 2, only three shown here). By encouraging the participants
to make movements that ‘‘sliced’’ through the target, and only
providing feedback at the point of intersection with the virtual
target ring, we were able to train the participants to move quickly
with relatively low trial-to-trial variability. We assume that
participants mostly relied on feedforward control given the
ballistic nature of the movements and absence of continuous
online feedback.
Participants were assigned to one of three experimental groups
(n = 10 per group), with the groups defined by our manipulation of
the blue landmarks in the visual displays. For the aiming-target
group (AT), the blue circles were always visible, similar to the
method used by Mazzoni and Krakauer. For the disappearing
aiming-target group (AT), the blue circles were visible at the start
of the trial and disappeared when the movement was initiated. For
the no aiming-target group (NoAT), the blue landmarks were not
included in the display.
The participants were initially required to reach to the green
target (Figure 2A). Movement duration, measured when the hand
crossed the target ring, averaged 275650.8 ms with no significant
difference between groups (F2,27 = 1.02, p = 0.37). Following the
initial familiarization block, participants were trained to use a
strategy of moving 45u in the CW direction from the green target
location, (Figure 2B). This location corresponded to the position of
the neighboring blue circle. Feedback was veridical in this phase
(e.g., corresponded to hand position). To help participants in the
NoAT group learn to move at 45u, the blue circles were also
presented on half of the trials for this group (in this phase only).
The mean angular shifts, relative to the green target, were
43.461.6u and 42.961.2u for the AT and DAT groups,
respectively (Figure 3 - orange). For the NoAT group, the mean
angular shift was 43.560.9u when the aiming target was present
and 40.167.1u when the aiming target was absent. While the
variance was considerably larger for trials without the aiming
target, the means were not significantly different (t18 = 0.95,
p = 0.38).
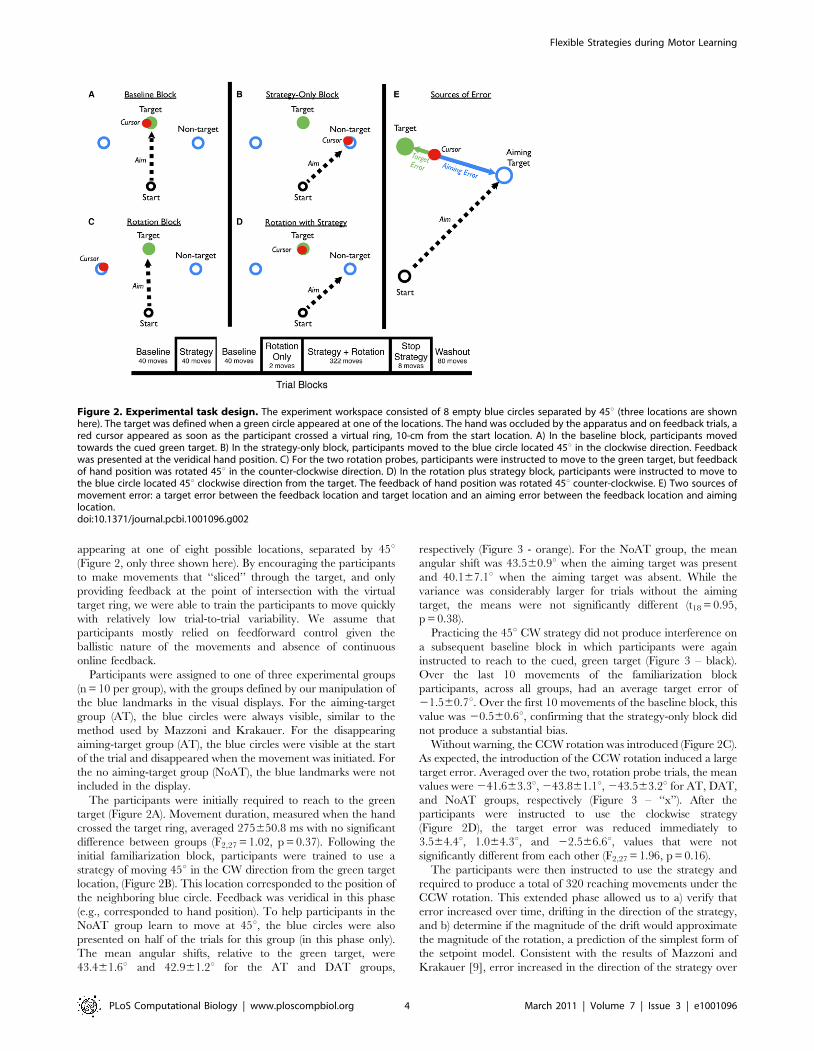
Practicing the 45u CW strategy did not produce interference on
a subsequent baseline block in which participants were again
instructed to reach to the cued, green target (Figure 3 – black).
Over the last 10 movements of the familiarization block
participants, across all groups, had an average target error of
21.560.7u. Over the first 10 movements of the baseline block, this
value was 20.560.6u, confirming that the strategy-only block did
not produce a substantial bias.
Without warning, the CCW rotation was introduced (Figure 2C).
As expected, the introduction of the CCW rotation induced a large
target error. Averaged over the two, rotation probe trials, the mean
values were 241.663.3u, 243.861.1u, 243.563.2u for AT, DAT,
and NoAT groups, respectively (Figure 3 – ‘‘x’’). After the
participants were instructed to use the clockwise strategy
(Figure 2D), the target error was reduced immediately to
3.564.4u, 1.064.3u, and 22.566.6u, values that were not
significantly different from each other (F2,27 = 1.96, p = 0.16).
The participants were then instructed to use the strategy and
required to produce a total of 320 reaching movements under the
CCW rotation. This extended phase allowed us to a) verify that
error increased over time, drifting in the direction of the strategy,
and b) determine if the magnitude of the drift would approximate
the magnitude of the rotation, a prediction of the simplest form of
the setpoint model. Consistent with the results of Mazzoni and
Krakauer [9], error increased in the direction of the strategy over
Figure 2. Experimental task design. The experiment workspace consisted of 8 empty blue circles separated by 45u (three locations are shownhere). The target was defined when a green circle appeared at one of the locations. The hand was occluded by the apparatus and on feedback trials, ared cursor appeared as soon as the participant crossed a virtual ring, 10-cm from the start location. A) In the baseline block, participants movedtowards the cued green target. B) In the strategy-only block, participants moved to the blue circle located 45u in the clockwise direction. Feedbackwas presented at the veridical hand position. C) For the two rotation probes, participants were instructed to move to the green target, but feedbackof hand position was rotated 45u in the counter-clockwise direction. D) In the rotation plus strategy block, participants were instructed to move tothe blue circle located 45u clockwise direction from the target. The feedback of hand position was rotated 45u counter-clockwise. E) Two sources ofmovement error: a target error between the feedback location and target location and an aiming error between the feedback location and aiminglocation.doi:10.1371/journal.pcbi.1001096.g002
Flexible Strategies during Motor Learning
PLoS Computational Biology | www.ploscompbiol.org 4 March 2011 | Volume 7 | Issue 3 | e1001096

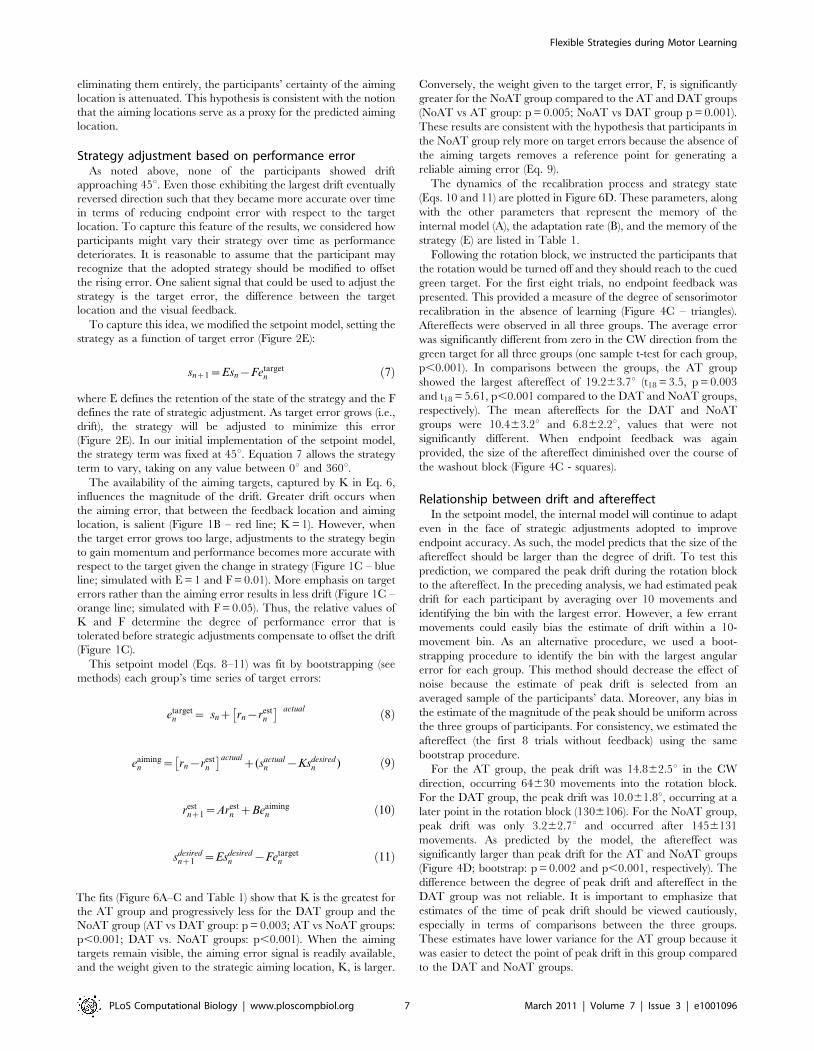
the initial phase of the rotation block. However, the extent of the
drift fell far short of the magnitude of the rotation. To quantify the
peak drift, each participant’s time series of endpoint errors was
averaged over 10 movements and we identified the bin with the
largest error. Based on this estimate of peak drift, a significant
difference was observed between groups (F2,27 = 21.9, p,0.001;
Figure 4A). This is consistent with the prediction of the model
based that the salience of the aiming targets would influence the
estimation of the aiming location. Drift was largest when the
aiming targets were always visible, and progressively less for the
DAT and NoAT groups. Drift was not isolated to particular target
locations (Figure 4B).
Our rotation plus strategy block lasted 320 trials, nearly four
times the number of trials used by Mazzoni and Krakauer [9]. This
larger window provides an interesting probe on learning given that
the participants become progressively worse in performance with
respect to the target over the drift phase. While the AT group had
the largest drift, they eventually showed a change in performance
such that the heading angle at the end of the rotation block was close
to 45u CW from the green target (Figure 3A). By the end of training,
their target error was only 0.363.9u, which was not significantly
different from zero (t9 = 0.17, p = 0.85). We did not observe a
consistent pattern in how these participants counteracted the drift
(Figure 5). Two participants showed clear evidence of an abrupt
change in their performance, suggesting a discrete change in their
aiming strategy. For the other eight AT participants, the changes in
performance were more gradual.
The drift persisted over the 320 trials of the rotation block for
participants in the DAT group (Figure 3C). The average drift was
5.964.8u at the end of training, a value that was significantly
greater than zero (t9 = 2.40, p = 0.04). Given that the NoAT group
showed minimal drift, we did not observe any consistent changes
in performance over the block. At the end of training, the mean
target error was only 1.061.9u, a value which is not significantly
different from zero (t9 = 1.01, p = 0.33).
The effect of aiming target availabilityThe availability or certainty in the estimate of the aiming
location was manipulated by altering the presence of the aiming
target across the groups. As predicted by the setpoint model, the
degree of drift was attenuated as the availability of the aiming
targets decreased. In the current implementation of our model,
this decrease in drift rate is captured by a decrease in the
adaptation rate (B): with greater uncertainty, the weight given to
the error term for updating the internal model is reduced.
However, one prediction of this model is at odds with the
empirical results. Variation in the adaptation rate not only predicts
a change in drift rate, but also predicts a change in the washout
period. Specifically, decreasing the adaptation rate should produce
a slower washout, or extended aftereffect (Figure 1B – cyan). This
prediction was not supported. The washout rates are similar across
the three groups (bootstrap, p.0.11 between all groups). One
could hypothesize different adaptation rates during the rotation
and washout phases, with the effect of target certainty only
relevant for the former. However, a post hoc hypothesis along these
lines is hard to justify.
Alternatively, it is possible that the adaptation rate (B) is similar
for the three groups and that the variation in drift rate arises from
another process. One possibility is that the manipulation of the
availability of the aiming targets influences the certainty of the
desired strategy term in Equation 4, and correspondingly, modifies
the aiming error term:
eaimingn ~ rn{rest
n
� �actualz(sactual
n {Ksdesiredn ) ð6Þ
A value of K that is less than 1 will attenuate drift (Figure 1A –
magenta line; simulated with K = 0.5) because the strategy output
(Eq. 3) and the desired strategy (Eq. 6) do not completely cancel
out. Consequently, the error used to adjust the internal model will
be smaller and produce attenuated drift (Figure 1B – magenta
line). Moreover, because the strategy is no longer used during the
washout phase, the K term is no longer relevant. Thus, the
washout rates should be identical across the three groups,
assuming a constant value of B.
In sum, while variation in B or K can capture the group
differences in drift rate, only the latter accounts for the similar
rates of washout observed across groups. When the availability of
the aiming targets is reduced, either by flashing them briefly or
Figure 3. Group averaged endpoint error relative to the target for the three groups. Participants first practiced moving to the cued targetwithout a rotation (black) and while using the strategy without a rotation (orange). The rotation was turned on between movements 121 and 443(dashed vertical lines). For the first two of these trials, the rotation probes, the participants had not been given the strategy (X’s). For the next 320rotation trials, participants were instructed to use the strategy. Following this, the rotation was turned off and participants were instructed to movetowards the cued target, first without endpoint feedback (X’s) and then with endpoint feedback (circles). A) Aiming-Target Group (blue). B)Disappearing Aiming-Target Group (magenta). C) No Aiming-Target Group (red). Shading represents the 95% confidence interval of the mean.doi:10.1371/journal.pcbi.1001096.g003
Flexible Strategies during Motor Learning
PLoS Computational Biology | www.ploscompbiol.org 5 March 2011 | Volume 7 | Issue 3 | e1001096

Figure 4. Time course of drift and aftereffect, and the relationship of drift to target location and aftereffect. A) Average endpointangular error relative to the target for the three groups, binned by averaging over epochs of ten movements (AT group in blue, DAT group inmagenta, NoAT group in red). B) Peak drift with respect to the eight target location for the three groups. The empty circles are the target locations. Toidentify peak drift, 10 bins of four movements were calculated for each direction. C) Angular error after the rotation was turned off and participantswere instructed to stop using the strategy. Triangles are average of the first eight post-rotation trials, performed without visual feedback. Squares arewashout block with feedback. D) Relationship of drift and aftereffect based on the estimated peak drift for each participant and the first eight post-rotation trials. For B) and D), the means and 95% confidence interval of the mean were estimated through bootstrapping.doi:10.1371/journal.pcbi.1001096.g004
Figure 5. Performance during the rotation block of three participants. A and B are from the AT group; C is from the DAT group. A) Driftfollowed by large fluctuations in error. B) Drift followed by an abrupt change in target error. C) Continuous drift across training.doi:10.1371/journal.pcbi.1001096.g005
Flexible Strategies during Motor Learning
PLoS Computational Biology | www.ploscompbiol.org 6 March 2011 | Volume 7 | Issue 3 | e1001096
eliminating them entirely, the participants’ certainty of the aiming
location is attenuated. This hypothesis is consistent with the notion
that the aiming locations serve as a proxy for the predicted aiming
location.
Strategy adjustment based on performance errorAs noted above, none of the participants showed drift
approaching 45u. Even those exhibiting the largest drift eventually
reversed direction such that they became more accurate over time
in terms of reducing endpoint error with respect to the target
location. To capture this feature of the results, we considered how
participants might vary their strategy over time as performance
deteriorates. It is reasonable to assume that the participant may
recognize that the adopted strategy should be modified to offset
the rising error. One salient signal that could be used to adjust the
strategy is the target error, the difference between the target
location and the visual feedback.
To capture this idea, we modified the setpoint model, setting the
strategy as a function of target error (Figure 2E):
snz1~Esn{Fetargetn ð7Þ
where E defines the retention of the state of the strategy and the F
defines the rate of strategic adjustment. As target error grows (i.e.,
drift), the strategy will be adjusted to minimize this error
(Figure 2E). In our initial implementation of the setpoint model,
the strategy term was fixed at 45u. Equation 7 allows the strategy
term to vary, taking on any value between 0u and 360u.The availability of the aiming targets, captured by K in Eq. 6,
influences the magnitude of the drift. Greater drift occurs when
the aiming error, that between the feedback location and aiming
location, is salient (Figure 1B – red line; K = 1). However, when
the target error grows too large, adjustments to the strategy begin
to gain momentum and performance becomes more accurate with
respect to the target given the change in strategy (Figure 1C – blue
line; simulated with E = 1 and F = 0.01). More emphasis on target
errors rather than the aiming error results in less drift (Figure 1C –
orange line; simulated with F = 0.05). Thus, the relative values of
K and F determine the degree of performance error that is
tolerated before strategic adjustments compensate to offset the drift
(Figure 1C).
This setpoint model (Eqs. 8–11) was fit by bootstrapping (see
methods) each group’s time series of target errors:
etargetn ~ snz rn{rest
n
� �� �actual ð8Þ
eaimingn ~ rn{rest
n
� �actualz(sactual
n {Ksdesiredn ) ð9Þ
restnz1~Arest
n zBeaimingn ð10Þ
sdesirednz1 ~Esdesired
n {Fetargetn ð11Þ
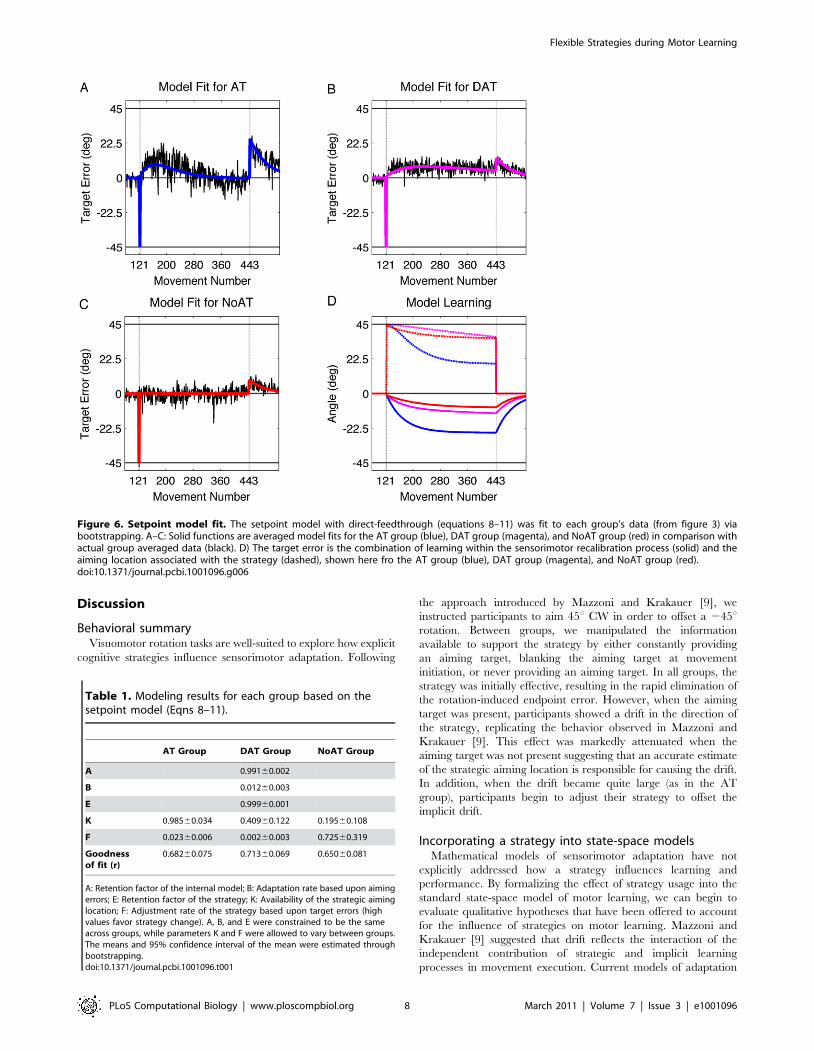
The fits (Figure 6A–C and Table 1) show that K is the greatest for
the AT group and progressively less for the DAT group and the
NoAT group (AT vs DAT group: p = 0.003; AT vs NoAT groups:
p,0.001; DAT vs. NoAT groups: p,0.001). When the aiming
targets remain visible, the aiming error signal is readily available,
and the weight given to the strategic aiming location, K, is larger.
Conversely, the weight given to the target error, F, is significantly
greater for the NoAT group compared to the AT and DAT groups
(NoAT vs AT group: p = 0.005; NoAT vs DAT group p = 0.001).
These results are consistent with the hypothesis that participants in
the NoAT group rely more on target errors because the absence of
the aiming targets removes a reference point for generating a
reliable aiming error (Eq. 9).
The dynamics of the recalibration process and strategy state
(Eqs. 10 and 11) are plotted in Figure 6D. These parameters, along
with the other parameters that represent the memory of the
internal model (A), the adaptation rate (B), and the memory of the
strategy (E) are listed in Table 1.
Following the rotation block, we instructed the participants that
the rotation would be turned off and they should reach to the cued
green target. For the first eight trials, no endpoint feedback was
presented. This provided a measure of the degree of sensorimotor
recalibration in the absence of learning (Figure 4C – triangles).
Aftereffects were observed in all three groups. The average error
was significantly different from zero in the CW direction from the
green target for all three groups (one sample t-test for each group,
p,0.001). In comparisons between the groups, the AT group
showed the largest aftereffect of 19.263.7u (t18 = 3.5, p = 0.003
and t18 = 5.61, p,0.001 compared to the DAT and NoAT groups,
respectively). The mean aftereffects for the DAT and NoAT
groups were 10.463.2u and 6.862.2u, values that were not
significantly different. When endpoint feedback was again
provided, the size of the aftereffect diminished over the course of
the washout block (Figure 4C - squares).
Relationship between drift and aftereffectIn the setpoint model, the internal model will continue to adapt
even in the face of strategic adjustments adopted to improve
endpoint accuracy. As such, the model predicts that the size of the
aftereffect should be larger than the degree of drift. To test this
prediction, we compared the peak drift during the rotation block
to the aftereffect. In the preceding analysis, we had estimated peak
drift for each participant by averaging over 10 movements and
identifying the bin with the largest error. However, a few errant
movements could easily bias the estimate of drift within a 10-
movement bin. As an alternative procedure, we used a boot-
strapping procedure to identify the bin with the largest angular
error for each group. This method should decrease the effect of
noise because the estimate of peak drift is selected from an
averaged sample of the participants’ data. Moreover, any bias in
the estimate of the magnitude of the peak should be uniform across
the three groups of participants. For consistency, we estimated the
aftereffect (the first 8 trials without feedback) using the same
bootstrap procedure.
For the AT group, the peak drift was 14.862.5u in the CW
direction, occurring 64630 movements into the rotation block.
For the DAT group, the peak drift was 10.061.8u, occurring at a
later point in the rotation block (1306106). For the NoAT group,
peak drift was only 3.262.7u and occurred after 1456131
movements. As predicted by the model, the aftereffect was
significantly larger than peak drift for the AT and NoAT groups
(Figure 4D; bootstrap: p = 0.002 and p,0.001, respectively). The
difference between the degree of peak drift and aftereffect in the
DAT group was not reliable. It is important to emphasize that
estimates of the time of peak drift should be viewed cautiously,
especially in terms of comparisons between the three groups.
These estimates have lower variance for the AT group because it
was easier to detect the point of peak drift in this group compared
to the DAT and NoAT groups.
Flexible Strategies during Motor Learning
PLoS Computational Biology | www.ploscompbiol.org 7 March 2011 | Volume 7 | Issue 3 | e1001096
Discussion
Behavioral summaryVisuomotor rotation tasks are well-suited to explore how explicit
cognitive strategies influence sensorimotor adaptation. Following
the approach introduced by Mazzoni and Krakauer [9], we
instructed participants to aim 45u CW in order to offset a 245urotation. Between groups, we manipulated the information
available to support the strategy by either constantly providing
an aiming target, blanking the aiming target at movement
initiation, or never providing an aiming target. In all groups, the
strategy was initially effective, resulting in the rapid elimination of
the rotation-induced endpoint error. However, when the aiming
target was present, participants showed a drift in the direction of
the strategy, replicating the behavior observed in Mazzoni and
Krakauer [9]. This effect was markedly attenuated when the
aiming target was not present suggesting that an accurate estimate
of the strategic aiming location is responsible for causing the drift.
In addition, when the drift became quite large (as in the AT
group), participants begin to adjust their strategy to offset the
implicit drift.
Incorporating a strategy into state-space modelsMathematical models of sensorimotor adaptation have not
explicitly addressed how a strategy influences learning and
performance. By formalizing the effect of strategy usage into the
standard state-space model of motor learning, we can begin to
evaluate qualitative hypotheses that have been offered to account
for the influence of strategies on motor learning. Mazzoni and
Krakauer [9] suggested that drift reflects the interaction of the
independent contribution of strategic and implicit learning
processes in movement execution. Current models of adaptation
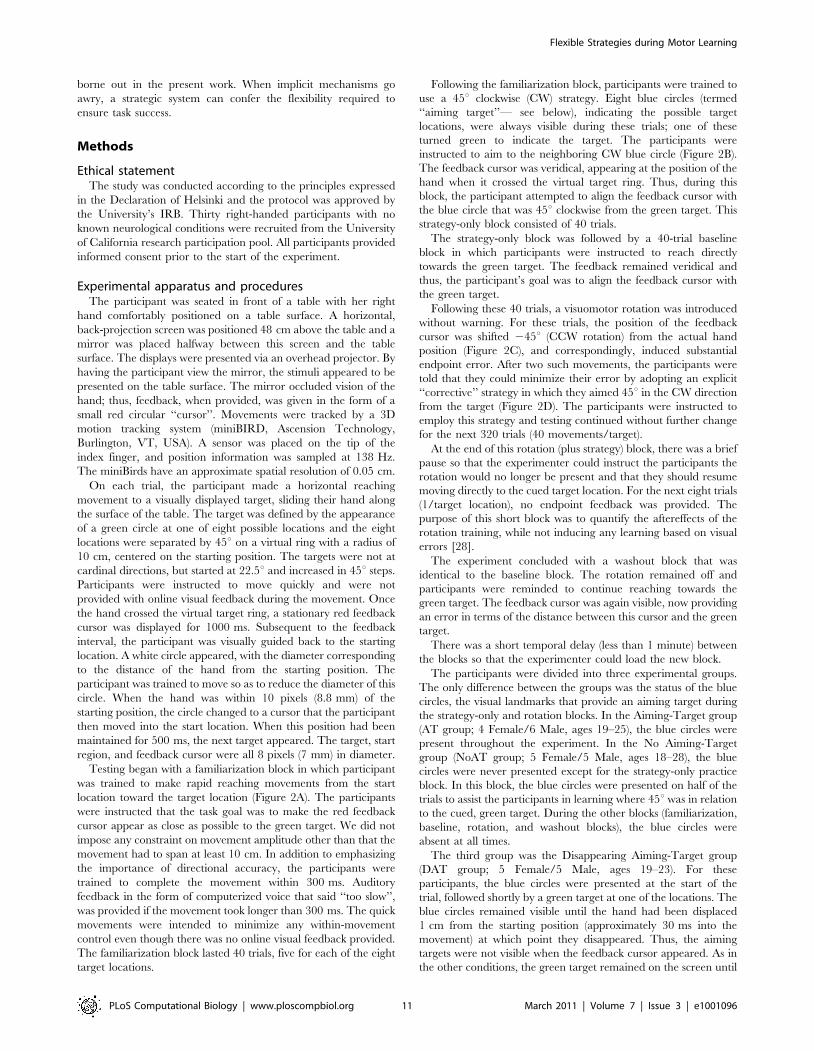
Table 1. Modeling results for each group based on thesetpoint model (Eqns 8–11).
AT Group DAT Group NoAT Group
A 0.99160.002
B 0.01260.003
E 0.99960.001
K 0.98560.034 0.40960.122 0.19560.108
F 0.02360.006 0.00260.003 0.72560.319
Goodnessof fit (r)
0.68260.075 0.71360.069 0.65060.081
A: Retention factor of the internal model; B: Adaptation rate based upon aimingerrors; E: Retention factor of the strategy; K: Availability of the strategic aiminglocation; F: Adjustment rate of the strategy based upon target errors (highvalues favor strategy change). A, B, and E were constrained to be the sameacross groups, while parameters K and F were allowed to vary between groups.The means and 95% confidence interval of the mean were estimated throughbootstrapping.doi:10.1371/journal.pcbi.1001096.t001
Figure 6. Setpoint model fit. The setpoint model with direct-feedthrough (equations 8–11) was fit to each group’s data (from figure 3) viabootstrapping. A–C: Solid functions are averaged model fits for the AT group (blue), DAT group (magenta), and NoAT group (red) in comparison withactual group averaged data (black). D) The target error is the combination of learning within the sensorimotor recalibration process (solid) and theaiming location associated with the strategy (dashed), shown here fro the AT group (blue), DAT group (magenta), and NoAT group (red).doi:10.1371/journal.pcbi.1001096.g006
Flexible Strategies during Motor Learning
PLoS Computational Biology | www.ploscompbiol.org 8 March 2011 | Volume 7 | Issue 3 | e1001096

cannot be readily modified to account for this interaction. Rather,
we had to consider more substantive architectural changes.
Borrowing from engineering control theory, we used a setpoint
model in which the internal model can be recalibrated around any
given reach location. The idea of a setpoint is generally implicit in
most models of learning, but this component does not come into
play since the regression is around zero. However, simply making
the setpoint explicit is not sufficient to capture the drift
phenomenon. The strategy must have direct feedthrough to the
output equation in order to implement the explicit strategy while
allowing for an internal model to implicitly learn the visuomotor
rotation.
This simple setpoint model was capable of completely
eliminating error on the first trial and capture the deterioration
of performance with increased training. Drift arises because the
error signal is driven by the difference between the internal
model’s prediction of the aiming location and the actual, endpoint
feedback. The idea that an aiming error signal is the source of drift
is consistent with the conjecture of Mazzoni and Krakauer [9]. An
important observation in the current study is that, given
uncertainty in the prediction of the aiming location, participants
use external cues as a proxy in generating this prediction. This
hypothesis accounts for the observation that drift was largest when
the aiming target was always visible, intermediate when the aiming
target was only visible at the start of the trial, and negligible when
the aiming target was never visible. The aiming target, when
present, served as a proxy for predicted hand position, and helped
define the error between the feedback cursor and aiming location
in visual coordinates. When the aiming target was not present, the
aiming location was less well-defined in visual coordinates, and
thus, the relationship between the aiming location and feedback
cursor was less certain. Under this condition, the participant’s
certainty of the error was reduced and adaptation based of this
signal was attenuated. Quantitatively, progressively smaller values
of K were observed with decreasing availability of the aiming
targets.
The attenuation of adaptation with increasing uncertainty (as
reflected by reduced drift) is similar to the effects on adaptation
predicted by a Kalman filter when measurement noise is large.
Several studies have shown that adaptation rates can change when
the certainty of sensory information is manipulated [31,32]. In our
study, variation in certainty of the desired aiming location (K)
influenced the magnitude of drift. As the availability of the aiming
targets was reduced, the corresponding estimate of the aiming
error became less certain, producing slower adaptation of the
internal model, or reduced drift. Moreover, since K directly
operates on the estimate of the strategic aiming location, this
parameter does not affect the rate of washout since the strategy is
no longer used. Consistent with this prediction, the rate of washout
was similar across the three groups.
The effect of the visual landmarks on adaptation also provides
insight into why other studies have not observed drift, even when
participants develop some explicit awareness of the rotation, and
presumably, use that knowledge [8,10,11,24,25] to improve
performance rapidly. Several key methodological differences are
relevant. First, in most visuomotor rotation studies, online visual
feedback is provided during the movements. This may impede
drift because participants observe the casual relationship between
movement of their hand and the endpoint, cursor feedback [33].
Drift itself could be corrected by online feedback. Second,
participants in the earlier studies were not given a clear, explicit
strategy, and importantly, were not provided with visual
landmarks that could support a self-generated strategy. Under
such conditions, participants face a difficult estimation process.
The absence of landmarks would increase uncertainty in
implementing a self-generated strategy. Moreover, the motor
system would not have a salient visual signal for grounding the
comparison of feedback and aiming location. As shown by our no-
aiming target condition, drift is minimal when the landmarks are
absent. Thus, the absence of drift in the visuomotor adaptation
literature cannot be taken as evidence that strategies are not
relevant. It is likely that, when initial error signals are large,
learning involves a combination of strategic and recalibration
processes.
Two sources of errorsOur model entails two types of error signals: an aiming
prediction error between the feedback location and aiming
location, and performance error between the feedback location
and the target location (Figure 2E). The aiming error drives the
drift phenomenon while the target error is used to restore
performance. Intuitively, the motor system should be able to
recalibrate the internal model around any desired reach location, a
feature captured by the setpoint model. When there is an accurate
estimate of the strategy (the setpoint), then the strategy naturally
falls out of the error equation, allowing the internal model to
recalibrate around any position. The setpoint mechanism is
revealed when a strategy is imposed to counteract a visuomotor
rotation. A counterintuitive consequence of this process is the rise
in error over time because the motor system is recalibrating
around the strategic aiming location (or its proxy) and not the
target location.
Interestingly, while there was an initial rise in endpoint error,
this function eventually reversed, returning close to zero endpoint
error by the end of the strategy phase for the AT group. We
assume that at some point, the size of the endpoint error exceeded
the participant’s self-defined tolerance for errors and caused them
to modify the strategy. Unfortunately, we do not have a direct
measure of strategy change. Examination of the learning profiles
revealed considerable variability across individual participants
(Figure 4A and Figure 5). This variability likely reflects multiple
sources of noise, as well as instability in the use of a strategy. We
obtained self-reports in a debriefing session at the end of the
experiment. A few subjects in the AT and DAT groups reported
adjusting their strategy such that they reached to a location
between the cued target and aiming target, or that shifted to reach
straight to the cued target.
At a minimum, multiple processes are required to capture this
nonmonotonic learning function. In our initial modeling efforts,
we fixed the strategy for the entire training process. Under this
assumption, the system should exhibit drift that is equal in size to
the rotation, an effect never observed. Thus, the final version of
our model is a variant of a two-rate state space model [28], but
with the two rates reflecting different error sources. As described
above, adaptation of an implicit model is driven by the aiming
error. In contrast, the strategy is adjusted on a trial-by-trial basis as
a function of the current target error. Target errors are initially
quite small and, thus have little effect on performance. However,
as the target errors become large due to adaptation of the internal
model, adjustments in the strategy are required to improve
endpoint accuracy. Aiming to a new location resets the
recalibration around a new setpoint. To reach a stable state,
participants would need to progressively adjust their strategic
aiming location to a point where aiming error and target error
cancel each other out.
It is reasonable to assume that our manipulation of the
availability of the aiming locations influenced the degree of
certainty associated with the desired aiming location. When
Flexible Strategies during Motor Learning
PLoS Computational Biology | www.ploscompbiol.org 9 March 2011 | Volume 7 | Issue 3 | e1001096

certainty is reduced, adaptation arising from the aiming error
signal is slower, and in our two-process model, the level of
adaptation achieved by the motor system is lowered. Moreover,
the model does not predict that drift will reach 45u. The strategy is
adjusted, reaching a point where it offsets the drift arising from
adaptation of the internal model. The interplay of these two
processes is complex (Figure 6D). With both occurring continu-
ously during training, the system reaches a pseudo-equilibrium
state at which additional changes to both processes becomes
relatively small.
Linking the strategy adjustment to the target error signal offers a
process-based approach to capture flexibility in strategy use. Our
setpoint model captures this through the strategy adjustment
parameter (F), a weighting term on target error. The NoAT group
appears to give more weight to target error than the AT and DAT
group. Interestingly, the modeling results indicate that the AT
group showed more utilization of the target errors than the DAT
group. We assume this arises because the AT group eventually
offset the relatively large drift to restore on-target accuracy. In
contrast, the DAT group never corrected for drift, suggesting that
the weight given to target errors for this group was nearly zero.
It is important to highlight one difference in how we
conceptualize changes in the rate of strategy adjustment (F)
compared to changes in the rate of adaptation (B). Adjustments in
a strategy can occur on very fast timescale; for example, once
instructed, participants were able to immediately offset the full
rotation. Variation in F refers to the rate at which participants
change where to aim. In contrast, B reflects a gradual process,
reflecting the rate of change in a system designed to reach a
desired location.
Alternative models of strategy changeIn many sensorimotor adaptation tasks, variable learning rates
are used to model the substantial variability observed in individual
learning curves. In a similar manner, our setpoint model captures
individual differences in strategy utilization by varying the strategy
adjustment rate (F). Nonetheless, this formulation does not
adequately capture the full range of behavior observed in the
current study. In particular, this approach is insufficient to account
for abrupt changes in performance. For example, the learning
profile shown in Figure 5B suggests a categorical change in
strategy. That is, the participant abandoned what was becoming
an unacceptable strategy to search for a new strategy. Indeed, in a
post-test interview, this participant reported changing the aiming
location to a position halfway between the cued target and the
aiming location.
An alternative approach to model strategy change could be
derived from models of reinforcement learning [34–37]. In such
models, participants explore different regions of a strategy space,
attempting to quickly identify the policy that results in small target
error. In our task, a shift in policy might occur when the rise in
target error due to adaptation exceeds a threshold. That is, when a
chosen action fails to achieve the predicted reward, a new strategy
is adopted. This approach would provide a way to fit the data of
the few participants who exhibited categorical-like changes in
performance.
A reinforcement learning approach based on a discrete set of
strategies is problematic with the current data set. At one extreme,
one might suppose that such values could take on the locations of
the aiming targets (e.g., 0u and 45u), and perhaps some
intermediary points (e.g., 22.5u, the point halfway between two
aiming targets). At the other extreme, the set might consist of a
large set of values. Choosing a sparse set of potential actions will
result in more abrupt changes in performance, while choosing a
finer set of potential actions will allow for more gradual changes.
Studies designed to explore reinforcement learning models
generally use a limited set of choices and performance thus entails
discrete shifts in behavior. In our task, reach direction spans a
continuous space, and in fact, for most of our participants, the
changes in performance were gradual. Future experiments that
constrain the set of potential actions and manipulate reward may
be better suited for employing a reinforcement learning perspec-
tive to explore strategy change.
Qualitative changes in performance may also indicate that the
participants have fundamentally changed their conceptualization
of the task. For example, rather than view the task goal as one
involving reaching to targets, the participant may have switched to
an orientation in which the task goal involved mastering a game in
which the hand is a tool [38–40]. By this account, the initial drift
would result from the operation of implicit adaptation of an
internal model of the arm as described above. However, when this
drift became too large, the participant switched to treating the task
as a game, with the arm now conceptualized in a manner similar
to how we view a computer mouse. Accurate performance now
required learning the appropriate transformation between the
movements of the tool and the task workspace. The error signal for
this form of learning would no longer be based on the difference of
predicted hand/object location and the feedback location; we are
able to readily accept that the movement of a mouse-driven cursor
results in feedback in an alternative workspace. Rather, the error
signal here is the difference between the cued target location and
the feedback location. An error signal of this form would not
produce drift.
The reconceptualization hypothesis would predict that peak
drift should equal or be greater than the aftereffect. This follows
from the idea that adaptation of the internal model should cease at
the time the task goal changes from reaching to tool mastery. Once
the participant switches from learning about their arm to learning
how to play the visuomotor game, then there the internal model
would not continue to learn. The target error gains emphasis and
the aiming error falls out. As such, the aftereffect should equal the
drift value or be lower if there is some time-dependent decay of the
adaptation effects [41].
While this hypothesis is plausible, there are also some
limitations. First, it is important to keep in mind that in almost
all adaptation studies, the only visual signals are the target location
and a feedback cursor. Under such conditions, aftereffects are
prominent, indicating adaptation of an internal model and not just
learning a game. One would have to assume that tool
conceptualization was more pronounced in the present study
because of the strategic instructions. Second, our estimate of the
aftereffect is actually larger than the peak drift for two of the three
groups (Figure 4D). This observation, while at odds with the
reconceptualization hypothesis, is consistent with the setpoint
model. In our model, the aiming error signal will continue to
modify the internal model even as strategy adjustments reduce
target error. As such, the aftereffect, an estimator of implicit
adaptation should be equal to or larger than peak drift.
While future research will be required to explore the
mechanisms of strategy change, the current study advances our
understanding of the interactions that arise between explicit,
strategic processes and implicit, motor adaptation. Consistent with
Mazzoni and Krakauer [9], the results make clear that strategies
should not be viewed simply as representations that can facilitate
implicit learning mechanisms. Rather, implicit learning mecha-
nisms operate with a considerable degree of autonomy and, under
certain conditions, can override the influence of an explicit
strategy. Nonetheless, the benefits of strategic capabilities are also
Flexible Strategies during Motor Learning
PLoS Computational Biology | www.ploscompbiol.org 10 March 2011 | Volume 7 | Issue 3 | e1001096
borne out in the present work. When implicit mechanisms go
awry, a strategic system can confer the flexibility required to
ensure task success.
Methods
Ethical statementThe study was conducted according to the principles expressed
in the Declaration of Helsinki and the protocol was approved by
the University’s IRB. Thirty right-handed participants with no
known neurological conditions were recruited from the University
of California research participation pool. All participants provided
informed consent prior to the start of the experiment.
Experimental apparatus and proceduresThe participant was seated in front of a table with her right
hand comfortably positioned on a table surface. A horizontal,
back-projection screen was positioned 48 cm above the table and a
mirror was placed halfway between this screen and the table
surface. The displays were presented via an overhead projector. By
having the participant view the mirror, the stimuli appeared to be
presented on the table surface. The mirror occluded vision of the
hand; thus, feedback, when provided, was given in the form of a
small red circular ‘‘cursor’’. Movements were tracked by a 3D
motion tracking system (miniBIRD, Ascension Technology,
Burlington, VT, USA). A sensor was placed on the tip of the
index finger, and position information was sampled at 138 Hz.
The miniBirds have an approximate spatial resolution of 0.05 cm.
On each trial, the participant made a horizontal reaching
movement to a visually displayed target, sliding their hand along
the surface of the table. The target was defined by the appearance
of a green circle at one of eight possible locations and the eight
locations were separated by 45u on a virtual ring with a radius of
10 cm, centered on the starting position. The targets were not at
cardinal directions, but started at 22.5u and increased in 45u steps.
Participants were instructed to move quickly and were not
provided with online visual feedback during the movement. Once
the hand crossed the virtual target ring, a stationary red feedback
cursor was displayed for 1000 ms. Subsequent to the feedback
interval, the participant was visually guided back to the starting
location. A white circle appeared, with the diameter corresponding
to the distance of the hand from the starting position. The
participant was trained to move so as to reduce the diameter of this
circle. When the hand was within 10 pixels (8.8 mm) of the
starting position, the circle changed to a cursor that the participant
then moved into the start location. When this position had been
maintained for 500 ms, the next target appeared. The target, start
region, and feedback cursor were all 8 pixels (7 mm) in diameter.
Testing began with a familiarization block in which participant
was trained to make rapid reaching movements from the start
location toward the target location (Figure 2A). The participants
were instructed that the task goal was to make the red feedback
cursor appear as close as possible to the green target. We did not
impose any constraint on movement amplitude other than that the
movement had to span at least 10 cm. In addition to emphasizing
the importance of directional accuracy, the participants were
trained to complete the movement within 300 ms. Auditory
feedback in the form of computerized voice that said ‘‘too slow’’,
was provided if the movement took longer than 300 ms. The quick
movements were intended to minimize any within-movement
control even though there was no online visual feedback provided.
The familiarization block lasted 40 trials, five for each of the eight
target locations.
Following the familiarization block, participants were trained to
use a 45u clockwise (CW) strategy. Eight blue circles (termed
‘‘aiming target’’— see below), indicating the possible target
locations, were always visible during these trials; one of these
turned green to indicate the target. The participants were
instructed to aim to the neighboring CW blue circle (Figure 2B).
The feedback cursor was veridical, appearing at the position of the
hand when it crossed the virtual target ring. Thus, during this
block, the participant attempted to align the feedback cursor with
the blue circle that was 45u clockwise from the green target. This
strategy-only block consisted of 40 trials.
The strategy-only block was followed by a 40-trial baseline
block in which participants were instructed to reach directly
towards the green target. The feedback remained veridical and
thus, the participant’s goal was to align the feedback cursor with
the green target.
Following these 40 trials, a visuomotor rotation was introduced
without warning. For these trials, the position of the feedback
cursor was shifted 245u (CCW rotation) from the actual hand
position (Figure 2C), and correspondingly, induced substantial
endpoint error. After two such movements, the participants were
told that they could minimize their error by adopting an explicit
‘‘corrective’’ strategy in which they aimed 45u in the CW direction
from the target (Figure 2D). The participants were instructed to
employ this strategy and testing continued without further change
for the next 320 trials (40 movements/target).
At the end of this rotation (plus strategy) block, there was a brief
pause so that the experimenter could instruct the participants the
rotation would no longer be present and that they should resume
moving directly to the cued target location. For the next eight trials
(1/target location), no endpoint feedback was provided. The
purpose of this short block was to quantify the aftereffects of the
rotation training, while not inducing any learning based on visual
errors [28].
The experiment concluded with a washout block that was
identical to the baseline block. The rotation remained off and
participants were reminded to continue reaching towards the
green target. The feedback cursor was again visible, now providing
an error in terms of the distance between this cursor and the green
target.
There was a short temporal delay (less than 1 minute) between
the blocks so that the experimenter could load the new block.
The participants were divided into three experimental groups.
The only difference between the groups was the status of the blue
circles, the visual landmarks that provide an aiming target during
the strategy-only and rotation blocks. In the Aiming-Target group
(AT group; 4 Female/6 Male, ages 19–25), the blue circles were
present throughout the experiment. In the No Aiming-Target
group (NoAT group; 5 Female/5 Male, ages 18–28), the blue
circles were never presented except for the strategy-only practice
block. In this block, the blue circles were presented on half of the
trials to assist the participants in learning where 45u was in relation
to the cued, green target. During the other blocks (familiarization,
baseline, rotation, and washout blocks), the blue circles were
absent at all times.
The third group was the Disappearing Aiming-Target group
(DAT group; 5 Female/5 Male, ages 19–23). For these
participants, the blue circles were presented at the start of the
trial, followed shortly by a green target at one of the locations. The
blue circles remained visible until the hand had been displaced
1 cm from the starting position (approximately 30 ms into the
movement) at which point they disappeared. Thus, the aiming
targets were not visible when the feedback cursor appeared. As in
the other conditions, the green target remained on the screen until
Flexible Strategies during Motor Learning
PLoS Computational Biology | www.ploscompbiol.org 11 March 2011 | Volume 7 | Issue 3 | e1001096

the end of the feedback interval. We opted to use blue circles on a
black background as the visual landmarks to minimize visual
aftereffects for the DAT group.
Movement analysisKinematic information was analyzed with Matlab (MathWorks,
Natick, MA). Movement duration was defined as the interval from
when the hand was 1 cm from the start position until it passed
through the virtual target ring (10 cm radius). We determined the
heading of the hand at the point of intersection and used this to
compute the endpoint hand angle, defined as the difference
between this heading and a straight line connecting the starting
position and the target (green circle except for the strategy-only
block). When there was no rotation, the target error was identical
to the endpoint hand angle. When the rotation was present, the
target error was the endpoint hand angle plus 45u. The angular
endpoint error was used to infer the motor plan (plus noise) since
the movements were made without on-line feedback and at a
speed that minimized corrective movements. Since there was a
substantial difference between groups in terms of drift, we
measured the aftereffect relative to the target location.
For the analyses of movement accuracy, movements within each
block were averaged over 10-trial bins. However, we did not bin
the first two movements when the rotation was first introduced
(pre-strategy), nor did we bin the first two movements after the
strategy was introduced. Rather, these two movement pairs were
averaged separately to quantify error introduced by the rotation
and the initial success of the participant using the strategy,
respectively.
A key dependent measure in this study is the magnitude of the
drift exhibited during the rotation block. Estimating peak drift is
difficult, not only because of noise in performance, but also
because some participants exhibited non-monotonic drift func-
tions. To minimize these problems, we used a boostrapping [42]
method to estimate peak drift. Using the group averaged data, we
created bins of 10 movements each and then identified the bin
with the largest angular deviation. The group averaged data was
recompiled 1000 times by randomly resampling with replacement
from the participant pool. The estimate of the time of the peak
drift was chosen as the movement number in the middle of this 10-
movement bin.
We used a similar method to compute the aftereffect. Here we
focused exclusively on the first 8 trials following the end of the
strategy plus rotation phase, trials in which no visual feedback was
provided. The bootstrapping method here produces only a slightly
different estimate of the aftereffect compared to a simple averaging
across the observed data from these 8 trials.
To quantify the deadaptation rate during the washout phase, we
fit an exponential function [26] to the time series of target
endpoint errors. Specifically, we bootstrapped the washout data
from each group to provide an estimate of the exponential decay
rate. We compared these rates to determine if there was a
difference in the rate of deadaptation.
To statistically evaluate the results of the bootstrapping
procedures, the mean statistics of each resampled iteration were
calculated and then used to determine p values [29,42]. All
statistical analyses were performed in Matlab. For the analyses that
did not involve bootstrapping, we report the degrees of freedom
for the F-values when performing ANOVAs across groups and t-
values when performing t-tests within groups.
Occasionally participants did not move to the cued, green target
(on baseline and washout blocks), mistakenly implemented the
strategy in the wrong direction (i.e., went CCW instead of CW on
rotation blocks), or moved to a location far from the target. We
eliminated trials in which the movement heading was more than
three standard deviations from the mean for that block. This
resulted in an average removal of less than 1% of the movements
per participant and the number of such erroneous movements was
similar across the three groups (F2,27 = 1.58, p = 0.22).
ModelingThe Nelder–Mead method or simplex method [43], imple-
mented in Matlab as fminsearch, was used to fit the data from the
baseline, rotation, stop-strategy, and washout blocks. We did not
fit the data from the familiarization block and strategy-only block.
The instruction to use the strategy was implemented by setting the
value of s to 45 at the start of the strategy+rotation block. The
value was reset to 0 at the start of the washout block. While the
simplex method can be sensitive to initial conditions, we obtained
similar estimates of the parameters (within the confidence intervals
of those parameters) with different starting values with the current
data sets. Thus, the same initial conditions (values of zero for all
parameters) were used for each participant. The goodness of fit
was measured by the root mean square error (rms) and Pearson’s
correlation coefficient (r) between the output of the model for
endpoint hand angle and the participant’s endpoint hand angle.
Custom software was written to bound the parameters between 0
and 1. The sign of the parameters is dependent on the convention
we used for the target errors: CCW to the target was negative and
CW was positive. The equations were adjusted to make all the
parameters positive. The parameter K was bound from 0.1 to 1 for
all groups because we found that the simplex method sometimes
reached a local minimum of K = 0 for the NoAT group
(approximately 10% of fits). The data from the NoAT group is
more difficult to fit because of the absence of drift and relatively
small aftereffect.
A, B, and E, the parameters characterizing the internal model
memory, adaptation gain, and strategy memory, were fit for all the
groups collectively. K the parameter characterizing the availability
of the aiming target (strategic aiming location) and F, the influence
of target errors, were estimated separately for each group through
bootstrapping. The group’s averaged data was computed by
resampling with replacement the participant pool, repeating this
1000 times, and fitting the setpoint model (Eqns 8–11) to each
resampled average.
Acknowledgments
We would like to thank Azeen Ghorayshi for help with data collection.
Thanks to John Schlerf for setting up the experimental equipment, Arne
Ridderikhoff for help with data analysis, and Greg Wojaczynski for helpful
comments. We are grateful to John Krakauer for his many comments
throughout the course of this project and for suggesting the reconceptu-
alization hypothesis.
Author Contributions
Conceived and designed the experiments: JAT RBI. Performed the
experiments: JAT. Analyzed the data: JAT. Wrote the paper: JAT RBI.
References
1. Wulf G, Shea CH (2002) Principles derived from the study of simple skills do not
generalize to complex skill learning. Psychon Bull Rev 9: 185–211.
2. Wulf G, Prinz W (2001) Directing attention to movement effects enhances
learning: A review. Psychon Bull Rev 8: 648–660.
Flexible Strategies during Motor Learning
PLoS Computational Biology | www.ploscompbiol.org 12 March 2011 | Volume 7 | Issue 3 | e1001096
3. Yarrow K, Brown P, Krakauer JW (2009) Inside the brain of an elite athlete: the
neural processes that support high achievement in sports. Nat Rev Neurosci 10:
585–596.
4. Curran T, Keele SW (1993) Attentional and nonattentional forms of sequence
learning. J Exp Psychol Learn Mem Cogn 19: 189–189.
5. Lackner JR, Dizio P (1994) Rapid adaptation to Coriolis force perturbations of
arm trajectory. J Neurophysiol 72: 299.
6. Shadmehr R, Mussa-Ivaldi FA (1994) Adaptive representation of dynamics
during learning of a motor task. J Neurosci 14: 3208.
7. Gandolfo F, Mussa-Ivaldi FA, Bizzi E (1996) Motor learning by field
approximation. Proc Natl Acad Sci 93: 3843.
8. Bock O, Abeele S, Eversheim U (2003) Human adaptation to rotated vision:
interplay of a continuous and a discrete process. Exp Brain Res 152: 528–532.
9. Mazzoni P, Krakauer J (2006) An implicit plan overrides an explicit strategy
during visuomotor adaptation. J Neurosci 26: 3642.
10. Werner S, Bock O (2007) Effects of variable practice and declarative knowledge
on sensorimotor adaptation to rotated visual feedback. Exp Brain Res 178:
554–549.
11. Sulzenbruck S, Heuer H (2009) Functional independence of explicit and implicit
motor adjustments. Conscious Cogn 18: 145–159.
12. Cunningham H (1989) Aiming error under transformed spatial mappings
suggests a structure for visual-motor maps. J Exp Psychol Hum Percept Perform
15: 493–506.
13. Cunningham HA, Welch RB (1994) Multiple concurrent visual-motor
mappings: implications for models of adaptation. J Exp Psychol Hum Percept
Perform 20: 987–987.
14. Imamizu H, Shimojo S (1995) The locus of visual-motor learning at the task or
manipulator level: implications from intermanual transfer. J Exp Psychol Hum
Percept Perform 21: 719–719.
15. Osu R, Hirai S, Yoshioka T, Kawato M (2004) Random presentation enables
subjects to adapt to two opposing forces on the hand. Nat Neurosci 7: 111–112.
doi:10.1038/nn1184.
16. Krakauer JW, Pine ZM, Ghilardi M, Ghez C (2000) Learning of Visuomotor
Transformations for Vectorial Planning of Reaching Trajectories. J Neurosci 20:
8916–8924.
17. Kagerer FA, Contreras-Vidal JL, Stelmach GE (1997) Adaptation to gradual as
compared with sudden visuo-motor distortions. Exp Brain Res 115: 557–561.
18. Hwang EJ, Smith MA, Shadmehr R (2006) Dissociable effects of the implicit and
explicit memory systems on learning control of reaching. Exp Brain Res 173:
425–437.
19. Malfait N, Ostry DJ (2004) Is interlimb transfer of force-field adaptation a
cognitive response to the sudden introduction of load? J Neurosci 24: 8084.
20. Slachevsky A, Pillon B, Fourneret P, Pradat-Diehl P, Jeannerod M, et al. (2001)
Preserved adjustment but impaired awareness in a sensory-motor conflict
following prefrontal lesions. J Cogn Neurosci 13: 332–340.
21. Anguera JA, Reuter-Lorenz PA, Willingham DT, Seidler RD (2010)
Contributions of Spatial Working Memory to Visuomotor Learning. J Cogn
Neurosci 22: 1917–1930.
22. McNay EC, Willingham DB (1998) Deficit in learning of a motor skill requiring
strategy, but not of perceptuomotor recalibration, with aging. Learn Mem 4:411.
23. Fernandez-Ruiz J, Hall C, Vergara P, Dıaz R (2000) Prism adaptation in normal
aging: slower adaptation rate and larger aftereffect. Brain Res Cogn Brain Res 9:223–226.
24. Bock O (2005) Components of sensorimotor adaptation in young and elderlysubjects. Exp Brain Res 160: 259–263.
25. Heuer H, Hegele M (2008) Adaptation to visuomotor rotations in younger and
older adults. Psychol Aging 23: 190–202.26. Martin TA, Keating JG, Goodkin HP, Bastian AJ, Thach WT (1996) Throwing
while looking through prisms: II. Specificity and storage of multiple gaze–throwcalibrations. Brain 119: 1199.
27. Thoroughman KA, Shadmehr R (2000) Learning of action through adaptivecombination of motor primitives. Nature 407: 742–747.
28. Smith MA, Ghazizadeh A, Shadmehr R (2006) Interacting Adaptive Processes with
Different Timescales Underlie Short-Term Motor Learning. Plos Biol 4: e179.29. Thoroughman KA, Taylor JA (2005) Rapid reshaping of human motor
generalization. J Neurosci 25: 8948.30. Brogan W (1991) Modern Control Theory. 3rd ed. Upper Saddle River, New
Jersey: Prentice-Hall.
31. Ernst MO, Banks MS (2002) Humans integrate visual and haptic information ina statistically optimal fashion. Nature 415: 429–433.
32. Burge J, Ernst MO, Banks MS (2008) The statistical determinants of adaptationrate in human reaching. J Vis 8: 20.1–19.
33. Kording KP, Beierholm U, Ma WJ, Quartz S, Tenenbaum JB, et al. (2007)Causal inference in multisensory perception. PLoS ONE 2: e943.
34. Sutton RS, Barto AG (1998) Reinforcement Learning: An Introduction.
Cambridge, MA: MIT Press.35. Han CE, Arbib MA, Schweighofer N (2008) Stroke rehabilitation reaches a
threshold. PLoS Comp Biol 4: e1000133.36. Takahashi Y, Schoenbaum G, Niv Y (2008) Silencing the critics: understanding
the effects of cocaine sensitization on dorsolateral and ventral striatum in the
context of an Actor/Critic model. Front Neurosci 2: 86–99.37. Swinehart CD, Abbott LF (2006) Dimensional reduction for reward-based
learning. Network 17: 235–252.38. Kluzik J, Diedrichsen J, Shadmehr R, Bastian AJ (2008) Reach Adaptation:
What Determines Whether We Learn an Internal Model of the Tool or Adaptthe Model of Our Arm? J Neurophysiol 100: 1455–1464.
39. Berniker M, Kording K (2008) Estimating the sources of motor errors for
adaptation and generalization. Nat Neurosci 11: 1454–1461.40. Huang VS, Krakauer JW (2009) Robotic neurorehabilitation: a computational
motor learning perspective. J Neuroeng Rehab 6: 5.41. Brashers-Krug T, Shadmehr R, Bizzi E (1996) Consolidation in human motor
memory. Nature 18: 252–5.
42. Fisher N (1993) Statistical analysis of circular data. Cambridge, UK: CambridgeUniversity Press.
43. Nelder JA, Mead R (1965) A Simplex Method for Function Minimization.Comput J 7: 308–313.
Flexible Strategies during Motor Learning
PLoS Computational Biology | www.ploscompbiol.org 13 March 2011 | Volume 7 | Issue 3 | e1001096