demand determinants and use value of gudumale...
TRANSCRIPT

ISSN: 2349-5677
Volume 1, Issue 11, April 2015
75
Demand Determinants and Use Value of Gudumale
Recreational Area, in Hawassa City, Ethiopia
Dr.P.NandeeswaraRao Wogine Markos
Ass. Professor, Dept. Of economics Lecturer, Dept. of Economics
HawasaaUniversity,Ethiopia. HawasaaUniversity,Ethipia
[email protected] [email protected]
Abstract
This paper presents the estimate of economic value of Gudumale recreational area.
Recreation is an activity that increases visitors’ satisfaction. The demand for recreation
has been growing with the increase in standard of living and/or income. The objective of
this study is to measure the economic use value of Gudumale recreational site in order to
show how the site authorities can extract revenue and improves the qualities of the
recreation services and develops the types and varieties of the services. The research
encompasses the analysis of data collected from 180 randomly selected visitors in the
Gudumale recreational area in Hawassa. To measure the recreational economic benefits
from Gudumale recreation site Individual travel cost method was employed Individual
Travel Cost Method (ITCM) is preferred to Zonal TCM in this study because of its
statistical efficiency.
In the selection of a model the number of visits has been taken into account, which is
truncated at one. In this study, travel costs, visitors’ income, level of education, and visit to
WondoGenet and Sodere substitute recreation site were positively related and major
determinants of visits to the site, were as family size, visits to Langano and AbjataShalla
substitute recreation site and being the head of the family were negatively related and
found to be major determinants of visits to the site. To estimate the annual recreational
value the truncated Poisson model was employed and found Birr 8,383,605.This implies
that the site authorities collected 10.61% of this sum. Therefore, this quantitative valuation
may help authorities to make informed decisions on the area for better planning and
management of the environmental resources.
Key words: Gudumale; Recreation; Travel; Truncated; Valuation.
ISSN: 2349-5677
Volume 1, Issue 11, April 2015
76
Introduction Economics is about making choices. Making choices about the environment is more complex
than making choices in the context of purely 'private' goods and services (Pearce et al, 1998).
Private goods tend to be bought and sold in markets. Public goods have the feature that
consumption tends to be 'joint' between individuals. Nowadays, the main environmental
economy subject, which is almost publicly accepted, is the fact that the environment is
inseparable from the economy and any changes in one may affect directly the other one
(Mortezaet al, 2009). Economic valuation can contribute positively to the formulation and
evaluation of environmental policies (Lant, 1994). Environmental systems provide material
and experiential benefits that contribute directly to human well-being, and it is meaningful
and important to quantify these benefits in understandable terms.
Recreation is a human activity, which increases visitor’s utility. Hence, resource managers
are facing decisions that balance society’s different needs and values, while trying to ensure
ecosystem sustainable integrity. This commonly leads to conflict and litigation, as
individuals and stakeholder’s opinions of resources are commonly markedly different (FAO,
2000). Therefore, managers need information that provides quantifiable measures of
individual preferences and values associated with different recreational services, to make
effective, efficient, and equity planning and policy decisions. Money metrics of recreational
service is thought as an important and desired tool in resource management.
In order to measure the economic value of environmental goods and services, economists
developed several techniques that help to value the service and goods gained from the
ecosystem. Travel cost method is one of the techniques that is used to value the
environmental services and goods. Travel cost method is mostly used to measure the value of
recreational benefit of environmental services and goods. The travel cost method can then be
interpreted as a special case of the production function approach (Dosi, 2000).
Recreational service of natural resources is one of the services among many others that
provide satisfaction for household or recreationist. The recreational services can be
appropriately valued by using travel cost method. The basic approach that drives this method
is, if a consumer wants to use the recreational services of a site he/she has to visit it (Mendes,
2005). The travel cost to reach the site is considered as the implicit or the proxy price of the
visit, and changes in the travel cost will cause a variation in the number of visits. Study of
these visitations across individuals will allow the estimation of demand functions and the
derivation of the welfare measure. A travel cost is calculated on per person per visit or
recreation day basis (Blackwell, 2007).
Statement of the Problem
Economic presumption put forward that resources be allocated such that marginal value
product or benefits are equated across uses to maximize total returns or social benefits
(Gibbons, 1987). Unlike other private marketable goods, values of recreation sites cannot
easily be determined through the interaction of supply and demand. Thus, there is a need to
have some ways to put an economic estimate to recreation sites whose values are not easily

ISSN: 2349-5677
Volume 1, Issue 11, April 2015
77
determined in conventional market situations.
Theoretically, Clawson(1959) explained that putting an accurate and acceptable value on
recreation site would be valuable in resource management in different ways. First, it would
provide a means for comparing the importance of recreation with that of other uses of the
same resources. Secondly, the value of the recreation to be provided by a proposed recreation
site would provide one measure of the desirability of making the necessary investment in the
project. Thus, we need to attribute values that reflect the true social costs and benefits of
recreational activities using some techniques of valuation of environmental resources.
Apart from this, Gudumale recreation site is widely used as a natural recreation area for many
people in Ethiopia. It is prominent in its amenity of the pleasantness of the beautiful
environment, boating, swimming, the wildlife and bird like (Hippopotamus and monkey
watching), camping, striking view of Lake Hawassa and other recreational activities. If the
site authorities are not aware of the approximate economic value of the site, they are not able
to make informed decision about the potential environmental benefit of the site.
Consequently, the quality of the site may deteriorate over time, which could force visitors of
the site to shift to other substitute sites. This phenomenon may, over time, result in an
irreversible damage to the different environmental resources on the site as well as to the state
of business.
Hence, there is a need to estimate the value of the site that could help to compare the
economic value of the site in its present recreational use versus some other land use
(development) option that private developers or government authorities may come up with.
Such economic value estimates are lacking and this research was initiated to fill that gap.
The specific objectives of the study
•To identify the determinants of visit to the Gudumale recreation site.
• To estimate a demand function for the recreation site and approximate the sitebenefits.
Research Questions
The research was conducted in the form of a survey that addressed the following questions:
a) What are the determinants of individual’s visits to Gudumale recreational area?
b) What is the demand function for Gudumale recreational site?
c) What is the annual recreational benefit of the Gudumale recreation site?
Here the researcher discusses a brief on Valuation of (Environmental
Goods) Recreational Site Using TCM: Theoretical Framework
Here theoretical framework is presented to valuate environmental benefit of recreational area.
The TCM is a non-market technique, which seeks to place a value on recreational sites by
using consumption behavior (Fang et al, 2010). Specifically, the costs of consuming the
ISSN: 2349-5677
Volume 1, Issue 11, April 2015
78
recreational amenity of a particular site are used as proxies for prices. These costs include
travel costs, entrance fee, on-site expenditure and outlay on important equipment.
This basic theory is presented as developed by Brookshire et al (1982), Bateman and Turner
(1993) and recently summarized by Freeman (2003). A given household will have a utility
function which comprises a vector of the quantities of market goods (X), a vector of
environmental goods, e.g., recreational activity (Q) whose quantities or qualities are fixed for
individuals, and a vector of time spent in various activities (T) that yield utility to the
individual. Specifically:
U = U(X, Q, T) ……… (1)Here, a household’s utility is also composed of visits to a
recreation site that yield utility to the individual. In addition, traveling to a recreational site
could be significant in a household’s utility function. Let's denote Vj= visits to recreation site
j and dij= total distance traveled by an individual i to site j. Both Vj and dij are explained as a
vector. Thus, a household's utility function can be specified as follows:
U=U(X, Vj,Vjdij, Qj) ………(2)
Each rational household maximizes this utility function subject to the budget constraints; the
income constraint is represented by the equation:
Y– ∑FVj - TCVjdij - X = 0 ……3)
Where: -F = entrance fee (which is non-existent). Hence: equation (3) becomes:
Y- TCVjdij - X = 0
The time constraint is represented by the equation:
T- StjVj - ttijVjdij = 0……… (4)
Where: -
Y = Disposable income of a visitor
C = Travel cost per km (money expenditure on travel)
T = Total time spent for recreation
Stj = Time spent on site j per visit
tjVj=Total time spent on site j for the number of visits at site j.
ttij= Travel time per km for a single visit of individual i to site j.
ttijVjdij= Total travel time for a number of visits of individual i to site j.
In equation(2) above, the utility function is assumed to be increasing in X, Vjand Qj.
However, the utility obtained from Vjdij (total travel) cannot be known a priori. ∂U
𝜕X= 𝑈𝑥 ≥ 0,
∂U
𝜕v j= 𝑈𝑣 ≥ 0 and
∂U
𝜕Q j= 𝑈𝑄 ≥ 0
But 𝜕𝑈
𝜕𝑉𝑗𝑑𝑖𝑗 is indeterminate a priori.
By forming the Lagrangean function and considering first order conditions with some
rearrangements, we obtain:

ISSN: 2349-5677
Volume 1, Issue 11, April 2015
79
𝑈𝑣
𝑈𝑥= −∑𝐶𝑑𝑖𝑗 + 𝜆∑ 𝑡𝑡𝑖𝑗𝑑𝑖𝑗 ……(5)
𝜕𝑈
𝑉𝑗 =−𝜇∑𝐶𝑑𝑖𝑗 + 𝜆 ∑ 𝑡𝑡𝑖𝑗 + 𝜆 ∑ 𝑡𝑡𝑖𝑗𝑑𝑖𝑗
∂U
𝜕v j= Marginal utility of a visit to site j
𝜇 ∑𝐶𝑑𝑖𝑗 = Opportunity cost of travel to site j
𝜆∑ 𝑡𝑡𝑖𝑗 = Opportunity cost of time spent on site j
𝜆∑ 𝑡𝑡𝑖𝑗𝑑𝑖𝑗 = Opportunity cost of time spent on travel to site j
The above equations demonstrate that marginal rate of substitution between recreational
activities and consumption of goods with the TC associated with a visit is taken into account
in equilibrium for a rational economic agent.
Solving all the equations from the first-order conditions, we can obtain the Marshallian
demand function: number of visits as a function of basic variables such as entrance fee (if
any), money expenditure on travel, disposable income of visitors, environmental good (in this
case is recreational visits) and distance traveled to the recreation site. Then, the total area
under this demand curve is the total recreational benefit associated with a given trip. It is in
this way that the TC estimation technique is used to estimate the environmental benefit of the
site
Methodology
Sample unit
Gudumale Recreational Area, in Hawassa City, Ethiopia is taken as a sample unit for
the research purpose
Data Collection Method
The survey was carried out through on site face-to-face interviews of the recreationists of the
site using structured questionnaire. The questionnaire was designed to capture all the
necessary variables that are used to establish the demand equation of the site. Accordingly,
the questionnaire for primary data survey included detailed socio-economic characteristics of
visitors and main features of visits. Secondary data was collected from the Association about
the last year’s total number of visits and other information about the site.
Data Analysis
Data Coding and Diagnosis
Truncated negative binomial or Truncated Poisson regression is appropriate for truncated
dependent variable with count data/integer (Greene, 2003). Nevertheless, the significance of
ISSN: 2349-5677
Volume 1, Issue 11, April 2015
80
the coefficients in a Poisson regression can be greatly overstated if the variance of the
dependent variable is not equal to its mean (over dispersion). Test of over dispersion was
done and found that the data has no over dispersion problem (see appendix 3). Therefore,
the Poisson regression can be used in this study.
Descriptive Analysis
The socio-economic data was presented by using descriptive statistics. The frequency, mean,
variance and other distribution is being presented or tabulated by using table and their
respective distribution or percentage.
Econometric Analysis
Gudumale recreation demand study was carried out based on information obtained from
actual visitors of the site during the survey period. Since potential visitors were excluded
from the sample, the dependent variable is truncated. i.e. only number of visits greater than or
equal to one is considered in this recreation demand model. Foreign visitors were excluded
from the sample because of multipurpose trip and difficulty to isolate the particular cost to
the site. Hence, Ordinary Least Squares (OLS) might give biased estimates of the parameters.
Since the dependent variable (number of visits) is truncated at a certain point, maximum
likelihood estimation is taken as an appropriate technique in selecting recreation demand
model, Greene (2003).
The Truncated Model
The truncated model for the recreation demand function is adopted from Greene (2003) as
follows:
Vij = 𝛽Xi + 휀i..............7)
Assuming Vij/Xi ~ N (μ, 𝛿2) and μ = 𝛽Xi
Where: Vij = Individual i's visit to site j
Xi = Vector of explanatory variables for individual i
𝛽 = Parameters
휀i = Error term
In this truncated model, we observe Vij only if Vij 1.
Now, taking the density function of Vij (truncated variable) with probability density function
of f(Vij), mean μ = 𝛽 Xi and standard error𝛿.
𝑓 𝑉𝑖𝑗 𝑉𝑖𝑗 ≥ 1 =𝑓(𝑉𝑖𝑗 )
𝑝𝑟𝑜𝑏 𝑉𝑖𝑗 ≥1=
(1
𝛿 )𝜙 [𝑉𝑖𝑗 −𝛽𝑥𝑖]∕𝜎
1−Φ(𝛼𝑖)….…… (8)
Where: 𝜙(.) = Standard normal probability distribution function
(.)= Standard normal cumulative distribution function
𝛼𝑖= (1- 𝛽Xi)/ 𝜎

ISSN: 2349-5677
Volume 1, Issue 11, April 2015
81
Hence:𝐸 𝑉𝑖𝑗 𝑉𝑖𝑗 ≥ 1 = 𝛽𝑥𝑖 + 𝜎 𝜙 [1−𝛽𝑥𝑖]∕𝜎
1−Φ[1−𝛽𝑥𝑖]∕𝜎……(9)
𝑉𝑎𝑟 𝑉𝑖𝑗 𝑉𝑖𝑗 ≥ 1 = 𝜎2 [1 − 𝛿(𝛼𝑖)]…… (10)
Clearly, the conditional mean and variance are non-linear functions. Thus, ML estimation is
preferred to OLS due to the fact that in a truncated model, the partial derivative of Equation
(9) with respect to Xi is equal to 𝛽 [1−𝛿(𝛼𝑖)] which is different from𝛽. In the estimation of
the truncated model maximum likelihood (ML) estimation is used.
SPSSVersion 17 &NLOGIT Version3is used to obtain the parameter estimates of the ML
estimator.
In this study, the data for the dependent variable (visits per year) are typical of count data
(integer). Truncated Poisson Regression (TPR) is, therefore, used to study such count data
(Greene, 2003).Because the data for the dependent variable is integers, truncated below one
visit per year, equation estimation by OLS regression is inappropriate. Maddala (1992)
showed that the estimated regression line by OLS will be biased estimate of true slope when
the dependent variable is truncated. The result is that the least squares method understates
price elasticity and overstates consumers' surplus. Price elasticity is defined as (in this case)
the percentage change in quantity demanded (trips) caused by a one percent change in money
trip price (travel cost). The regression results were obtained for this study, therefore,
estimated using maximum likelihood (ML) estimators. Since Poisson and negative binomial
regression functional forms are equivalent to a logarithmic transformation of the dependent
variable, truncated Poisson or truncated negative binomial regression is appropriate for
dependent variables with count data (integer). Thus, truncated Poisson model was used to
represent a simple count data model. As stated in Parsons (2003), the Poisson regression
model specifies that each Vi (number of trip) is drawn from a Poisson distribution with
parameter𝜆, which is related to the regressors Xi.
The primary equation of the model is:
𝑝𝑟𝑜𝑏 𝑉𝑖 = 𝑣𝑖 =exp (−𝜆)𝜆𝑖
𝑣
v i ……………(11)
Where: V = 0, 1, 2, 3…; and λ is the expected number of trips = E(V), which is taken as equal to
the variance of the random variable = Var(V).
The most popular functional forms are linear, quadratic, semi-log and log-log. There is no
consensus in the literature reviewed on the preferred choice. Because the dependent variable
consists mostly of low values (i.e. skewed to the left), this study uses the semi–log form. The
logarithm of the dependent variable helps to adjust its skewness to normal distribution (Nam
and Son, 2001).
TABLE 1 Descriptions and hypothesis of variables
Variable description Description Hypothesized effect
Travel Cost Continuous −

ISSN: 2349-5677
Volume 1, Issue 11, April 2015
82
Age of visitors Continuous −
Monthly Income of visitors Continuous +
Family Size Continuous − Education Level Dummy +
Sex of visitors Dummy Indeterminate a priori
Marital Status of Visitors Dummy Indeterminate a priori
Mode of Transportation Dummy Indeterminate a priori
Group Size of visitors Continuous −
Head of family Dummy Indeterminate a priori
Occupation of Visitors Dummy Indeterminate a priori
Wondogenetrecreation Site Dummy Indeterminate a priori
Langano recreation site Dummy Indeterminate a priori
Sodere Recreation Site Dummy Indeterminate a priori
AbjataShalla recreation Site Dummy Indeterminate a priori
The general semi-log function for the individual travel cost model is:
ln(λ) = ∑ βiXi
ni=1 …………(12)
Equation (12) is a Poisson form of a recreation demand. Substituting equation (12) into (11)
gives an expression for the probability of observing an individual take Vtrips as a function of
trip cost and individual characteristics. The parameters in equation (12) are estimated by
maximum likelihood. For each person in the sample the analyst knows the independent
variables. Using these data and equations (11) and (12) the probability of observing the
number of trips actually taken is constructed for each person in the sample. The likelihood of
observing the actual pattern of visits then is the product of these probabilities.
L= exp −𝜆𝑖 .𝜆
𝑖
𝑣𝑖
V i !
𝑛𝑖=1 . …………(13)
An individual is denoted by i = 1…,n, so Viis the number of trips taken by person i. In
estimation, the parameters βi, on which λ depends according to equation (12)are chosen to
maximum L.
Consumer surplus, or access value, for each person in the sample has an explicit form in the
Poisson model. For individual I the surplus is:
Cs =∕1
−𝛽𝑖∕ ………(14)
Where: λi is the expected number of trips from equation (12). Once the parameters of the
model are estimated, equation (14) is used to calculate the surplus value for each individual in
the sample and then aggregated over the population of users to arrive at a total access value.
The corrected probability for an on-site sample is a slight variation on the basic Poisson
probability in equation (11). It takes the form:
𝑝𝑟 𝑣𝑖 𝑣𝑖 > 0 = exp (−𝜆𝑖)𝜆𝑖
𝑣𝑖−1
𝑉𝑖 −1 !……(15)
ISSN: 2349-5677
Volume 1, Issue 11, April 2015
83
This corrects for truncation at one trip and differs from the basic Poisson regression only by
vi−1replacing vi. With on-site sampling then equation (15), instead of (11), enters the
likelihood function for each individual. Consumer surplus is still measured as shown in
equation (14). Finally accordingly the interpretation was undertaken.
Calculation of Travel Cost
Opportunity cost of time
In this research the opportunity cost of time is measured by asking individual how much they
would be willing to accept if they are requested to cancel their visit.
Monetary cost related to travel
Monetary cost of visit includes fuel costs and other special costs that people may incur
associated with trip such as entrance fee, car spare part costs, money spent on food, drinks,
etc. in connection with trip when people travel to get into the site. This was measured by
asking the visitors how much total cost they spent for accommodation including entrance fee
and for transportation: if they use public bus the tariff is considered and own care fuel cost
and maintenance cost was considered.
Results and Discussion
The empirical findings of households' characteristics and visitations as well as the regression
results and the aggregate value estimation are presented and discussed.
Descriptive Analysis
Socio-Economic Characteristics of Household
The survey data was collected from a sample of 200 visitors of the site. However,20
questionnaires were discarded due to incompleteness. Hence, the responses of 180 visitors
were used for this study. During the survey period, it was found that visitors came from
different region of the country. The respondents were government employees, NGO workers,
businessmen and some students who came to the site with their relatives.
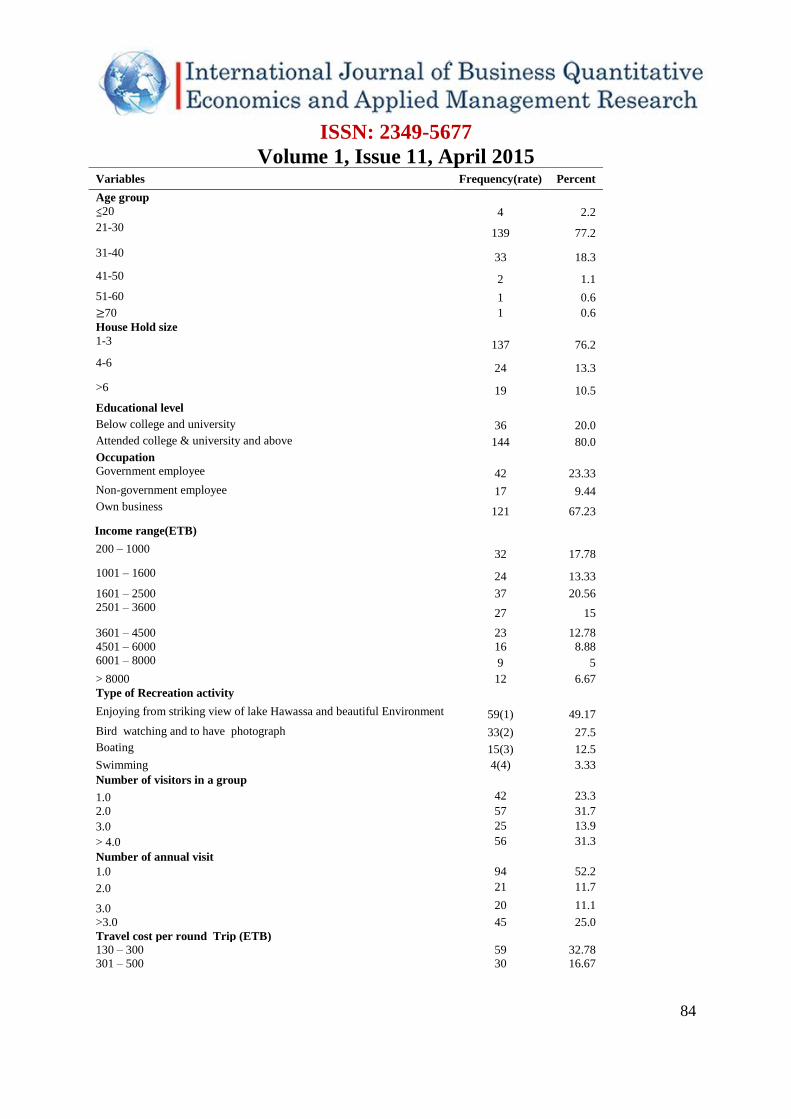
Table: 2 Socio-Economic Characteristics of Household (N=180)
ISSN: 2349-5677
Volume 1, Issue 11, April 2015
84
Variables Frequency(rate) Percent
Age group 20
4
2.2
21-30 139 77.2
31-40 33 18.3
41-50 2 1.1
51-60 1 0.6
≥70 1 0.6
House Hold size
1-3 137 76.2
4-6 24 13.3
>6 19 10.5
Educational level
Below college and university 36 20.0
Attended college & university and above 144 80.0
Occupation Government employee
42
23.33
Non-government employee 17 9.44
Own business 121 67.23
Income range(ETB)
200 – 1000 32 17.78
1001 – 1600 24 13.33
1601 – 2500 37 20.56
2501 – 3600 27 15
3601 – 4500 23 12.78
4501 – 6000 16 8.88
6001 – 8000 9 5
> 8000 12 6.67
Type of Recreation activity
Enjoying from striking view of lake Hawassa and beautiful Environment 59(1) 49.17
Bird watching and to have photograph 33(2) 27.5
Boating 15(3) 12.5
Swimming 4(4) 3.33
Number of visitors in a group
1.0 42 23.3
2.0 57 31.7
3.0 25 13.9
> 4.0 56 31.3
Number of annual visit
1.0 94 52.2
2.0 21 11.7
3.0 20 11.1
>3.0 45 25.0
Travel cost per round Trip (ETB)
130 – 300 59 32.78
301 – 500 30 16.67

ISSN: 2349-5677
Volume 1, Issue 11, April 2015
85
In this sample, it was observed that 74.4% of respondents were male. Of the total
respondents, 26.1% were married of which 6.7% were married women while 19.4% were
married men. The rest (73.9%) of the respondents were single. It was also observed that
27.2% of the respondents were heads of their household.
As indicated in Table 2, 96.6% of visitors were between 21 and50 years old. Visitors that
were less than 21 accounted for 2.2% of sampled visitors, while 1.2% of the respondents
were greater than 50 years old. The mean age of the respondents was 27.85years. If we look
at the number of visitors in different age groups, we observe that it is increasing up to 20-30
age groups and decreases subsequently.
As can be seen from Table 2,60.6% of sample visitors had no other members in their family.
15.6% of them had no more than 3 members in their family. It was found that as the number
of members in a family increases, the number of visitors to the site decreased. This suggests
that people who had larger family size are less likely to take more visits to the recreation site.
The average household size of sample visitors is 2.5.
A good proportion of visitors had education at college or university level. As indicated in the
Table 4.3,80% of sample visitors had completed their college or university education. And
the remaining (20%) was illiterate and attending elementary & high school.
As can be seen in Table 2, 23.33% of visitors were government employees while 9.44% were
non-government employees and 67.22% ran their own business. It was also observed that
about 75.6% of sample visitors came to the site using public bus.
As shown in the Table 2, 70.55% of sample visitors did earn monthly income ranging
between birr 1000 and 6000. The average monthly income of respondents was birr 3,969.71.
The fact that 82.2% of the sample visitors' monthly income was greater than Birr 1000
demonstrates that relatively high-income groups went to the recreation site.
Responses of Households to Visitation
The basic assumption of Travel cost method is that people reflect their willingness to pay for
a site by the amount of money and time they spent in traveling to the site. Thus, total number
of annual visits and travel costs per trip are the two crucial elements used to construct the
demand curve for recreational area.
Only 42 visitors (23.3%) were observed traveling alone during the survey period. All 76.7%
of sample visitors were traveling in-group. As shown in Table 4.6 many of the visitors
(68.4%) came to the site in-group of 2-6 people. The average number of persons in a group
was 3.29. From Table 4.6, the number of visits decreased as the number of people
501 - 1000 25 13.89
1001 – 1600 24 13.33
ISSN: 2349-5677
Volume 1, Issue 11, April 2015
86
As indicated in Table 2, 52.2% of sample visitors have visited the site only once during the
last 12 months. About22.8% of them visited the site 2 or 3 times during this period. The
average number of annual visits to the site per individual was estimated at 2.78.
As shown in Table 2, about 76.67% of sample visitors spent Birr 130 - 1600 to recreate on
the site. Travel cost per round trip consists of both mileage and time costs. Mileage costs
include fuel costs and other special costs that people may incur associated with trip (e.g., car
spare part costs, money spent on food, drinks, etc. in connection with trip when people travel
to get into the site). Time costs are measured by the opportunity cost of time spent on site and
travelling to site, which, in this study, is obtained by asking visitors how much they would be
willing to be paid by any economic agent if they were requested to cancel their visitations.
The minimum round trip travel cost was Birr 130 and the maximum was Birr 8,818.20. The
average round trip travel cost was Birr 1,127.20.
The response rate may be a good indicator of recreationist’s interest in different types of
recreation activities. The activity with the highest rating was enjoyment from striking view of
Lake Hawassa, beautiful Environment, scenery of the lake and bird watching and
photographing, more than 76.67% of the visitors preferred these recreation activities
Econometric Analysis
As noted earlier, the recreation demand function is approximated using the number of visits
to the site as dependent variable and the travel cost associated with the trip and other socio-
economic characteristics as independent variables.
The truncated Poisson model is used to estimate the demand function since the dependent
variable has only integral values and the values are greater than or equal to one (truncation)(
Hesselnet al., 2003; Hagerty&Moeltner, 2005).
Model Specification
LnV = 0 -1 TC + 2 AG + 3 Y-4FZ + 5ED + 6 G + 7MS-8TS+9GZ-10 HF + 11OC +
12WGRS-13LRS + 14SRS-15AJSRS + i………… (16)
Where:
V= Individuals' number of visits.
TC = visitors' travel cost.
AG = visitors' years of age
Y= visitors' monthly income.
FZ = visitors' family size.
ISSN: 2349-5677
Volume 1, Issue 11, April 2015
87
ED= visitors' level of education as dummy variable (1 for above college and
university, and 0 otherwise)
G= visitors’ Sex as dummy variable. (1 for male, 0 for female)
MS = visitors’ marital status as dummy variable. (1 for married, 0 otherwise)
TS = visitors' mode of transportas dummy variable (1forpublic bus, 0 otherwise).
GZ = number of visitors in a group
HF = visitors’ head of the familyas dummy variable (1 for head of the family, 0 otherwise)
OC = visitors' occupation as dummy variable. (1 for government employee, 0 otherwise)
WGRS =Wondogenet Recreation Substitute site as dummy variable (1 for visits to WGRS, 0
otherwise)
LRS = Langano Recreation Substitute site as dummy variable (1 for visits to LRS,
0otherwise)
SRS = Soderie Recreation Substitute site as dummy variable (1 for visits to SRS, 0
otherwise)
AJSRS=AbijataShalla Recreation Substitute site as dummy variable (1 for visits to AJSRS, 0
otherwise)
The visitors who made a multipurpose trip were excluded from the sample to avoid the
possible occurrence of over estimation of Gudumale recreation site. The regression results
obtained from this model are estimated using ML estimator. The robust regression results of
the truncated Poisson model are displayed inTable3 below.
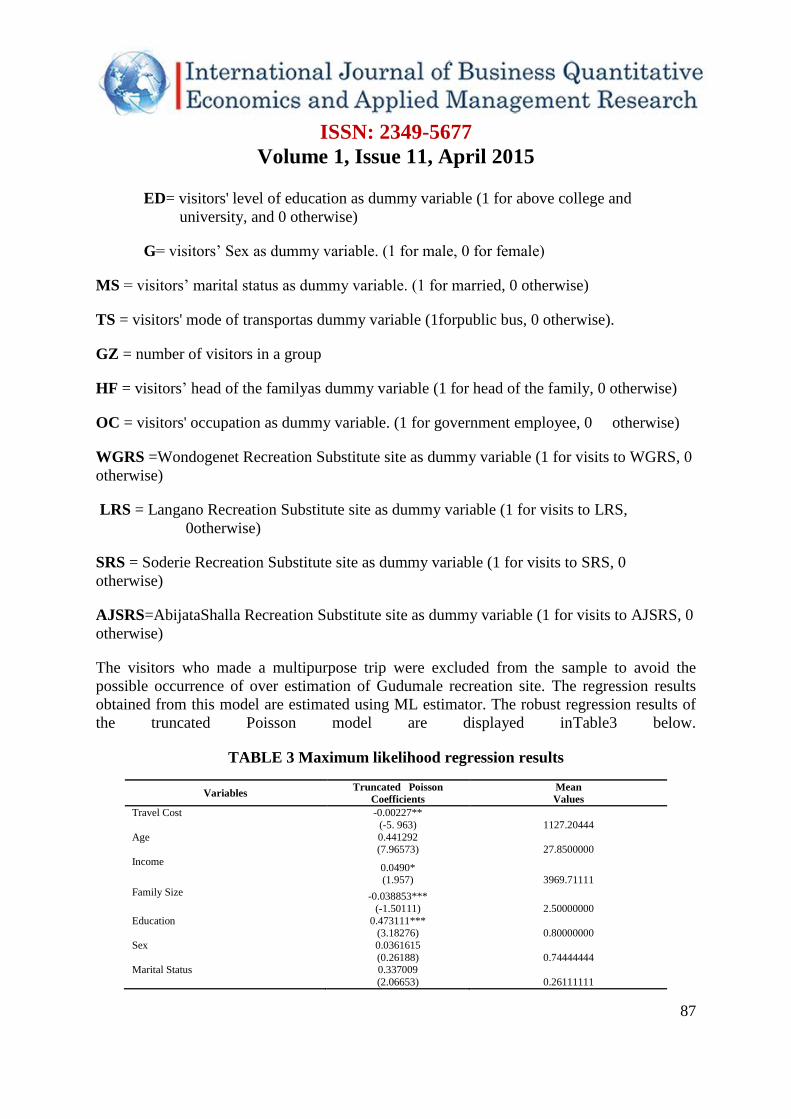
TABLE 3 Maximum likelihood regression results
Variables Truncated Poisson
Coefficients
Mean
Values
Travel Cost -0.00227**
(-5. 963) 1127.20444
Age 0.441292
(7.96573)
27.8500000
Income 0.0490* (1.957) 3969.71111
Family Size -0.038853***
(-1.50111)
2.50000000
Education 0.473111*** (3.18276)
0.80000000
Sex 0.0361615
(0.26188)
0.74444444 Marital Status 0.337009
(2.06653)
0.26111111

ISSN: 2349-5677
Volume 1, Issue 11, April 2015
88
Mode of Transportation -0.154828
(-0.941632)
0.24444444
Group Size 0.0446105 (5.2463)
3.28888889
Head of family -0.910372**
(-5.07732)
0.27222222 Occupation 0.195195
(1.43735)
0.23333333
Wondogenetrecreation Site 1.13218*** (9.39158)
0.32222222
Langano recreation site -0.274128***
(-2.18434)
0.31666667 Sodere Recreation Site 0.562132**
(4.61942)
0.28333333
AbjataShalla recreation Site -0.51389**
(-2.20956)
0.07222222
Constant 2.082006 (8.13)
N/A
ML Results
Unrestricted Log Likelihood = - 325.5624
Restricted Log Likelihood (𝛽0= 0) = - 472.6460 R2 = 0.6492
Number of observations = 180
***,**,and * are significance at 1 %, 5% and 10 %, respectively. Numbers in parenthesis
are t-values.N/A=Not available
The log-likelihood ratio (LR) can be used to test the significance of the model (Greene,
2003).LR = -2(Restricted Log L - Unrestricted Log L) In this case, the unrestricted log
likelihood is–325.5624 and the restricted log likelihoodis–472.6460. Thus, LR is equal to
294.1672
However, at 1% significance level, the table value of the test with 15degrees of freedom( 𝜒2,
15) is 30.58.Since the computed value is greater than the critical (tabled)value; we can reject
the null hypothesis that says all independent variables are irrelevant at 1% significance level.
Thus, the model used in this study is significant at 1%significance level.
R2 was 64.92 percent, and the adjusted R
2 was 61.71 percent, indicating that the model
explains nearly two-thirds of the total variation in the data. In their survey of the TCM
Loomis and Walsh (1997) and Green (2003), observed that R2
values exceeding 50 percent
are considered acceptable in empirical demand estimation.
Demand Estimation
The regression results are presented in Table 4.9. The results indicate that travel cost (TC)
has a negative and significant impact at 5% significance level on the demand for visits to
Gudumale recreation site, as expected. In particular, the results show that, ceterisparibus, the
demand for visits to Gudumale recreation site would increases by 1 trip if visitor's travel cost
decreased by Birr 220.20. Similarly, visitors' income (Y) has a positive and significant
influence on the demand for visits to the site. In particular, the number of visit would
decrease by 1 trip when visitor’s income decreases by Birr 1,204.10, ceteris paribus. The

ISSN: 2349-5677
Volume 1, Issue 11, April 2015
89
conditional mean estimate (λ) of the trips taken to the Gudumale recreational site is 2.76390.
This does not vary much with the actual mean of 2.77778 trips observed in the sample.
Furthermore, the coefficient of the dummy variable for Wondogenet Recreation Site is
positive and significant at 1% significant level, suggesting that those who visit Wondogenet
Recreation site are more likely to visit Gudumale recreation site, other things remaining the
same. Family size (FZ) and being head of the family(HD) are found to have a negative and
significant effect at 1% and 5% level of significant respectively, suggest that as the number of
the family increases the number of visit to Gudumale recreation site would decreased and
being head of the family visitors are less likely to visit the site. Similarly, Langano recreation
site is found to have a negative and significant effect. The negative sign of the coefficient of
the dummy variable for Langano recreation site suggests that those who had visited Langano
recreation site are less likely to visit Gudumale recreation site, other things remaining the
same.
The positive sign of the coefficient of education variable suggests that more educated people
(college and university) visit the site more frequently than less educated ones(elementary and
high school).
Other explanatory variables such as occupation of visitors, sex, and mode of transportation,
group size and marital status are found to be insignificant determinants of visits to Gudumale
recreation site. Though the extent of significance of these variables differs from one study to
the other, many of these variables are found in several TCM studies as principal factors
affecting the demand for visits to a recreation site. The results obtained in this research are
also consistent with other studies in similar areas e.g., see Shammin(1999), Jeong
andHaab(2004).
Demand Function and Recreational Benefit Estimation
The demand function for visits to Gudumale recreation site is constructed by relating visitors’
number of visits (V) to Gudumale recreation site with their travel costs (TC). The exponential
function is selected in this study as the benefit estimates from the power function are not
defined.
The typical Log-linear travel cost model hypothesis is explained in eq. (17)(Pak, M. and M.
F., Tüker, 2006)
LnVij=0 1𝑇𝐶𝑖 + 휀i……(17)
Where:
Vij= individual i's annual visits to site j.
TCi= individual i’s travel cost

ISSN: 2349-5677
Volume 1, Issue 11, April 2015
90
0 =the sum of the values of all other significant variables (assuming allthe other
variables are at their mean values) and the constant termin the original model.
i= residual assumed to be normally distributed with mean = 0, and variance =𝜎2,
i.e.,(0,𝜎2).
The demand function estimated for visitation to Gudumale recreation site is stated as follows:
Ln Vij= 10.553– 0.00227TC--i (18)
By considering sample visitors only, the annual recreational benefit of Gudumale Recreation
site is estimated by calculating the area under the demand curve. This area is calculated by
transforming equation (18) into an exponential function and integrating the inverse demand
function between 0 and the average number of visits which was estimated at Birr 106,047 for
the average number of visits. The recreational benefit of the site per visit per person was,
therefore, estimated at Birr 589.
Considering the annual sales record of Gudumale recreation site, the total number of visits to
the site for the last 12-months period before the survey was 14,230.
Then, the estimated individual recreational benefit per visit per person can be translated into
total annual recreational benefit as follows:
Birr 589 x 14,230= Birr 8,383,605
Therefore, the total annual recreational benefit of the site was estimated to be Birr
8,383,605.Using the exponential demand function, consumer surplus (CS) for the average
number of visits is calculated as the area below the demand curve and above the average
travel cost. Thus, individual consumer surplus (CS) per visit was approximated to Birr 440.
This consumer surplus per visit can be translated into aggregate consumer surplus for the
total number of 14,230 visits for the 12-month period before the survey, which was
approximated to Birr 6,263,192.
Summary, Conclusions and Recommendations
Economic value of most of recreation areas, national parks and other natural resources were
not known well in Ethiopian. The quality of these resources is therefore decreasing from time
to time due to lack of proper management of the resources.
The major objective of this study is to estimate the economic use value of Gudumale
recreation site. Though there are problems of getting accurate and reliable data in the process
of estimation of the value of natural resources, it is practically manageable to put monetary
values on such recreation site. For this purpose, an environmental technique of valuation for
recreational area viz. travel cost method (TCM) was employed.

ISSN: 2349-5677
Volume 1, Issue 11, April 2015
91
Since the data for the dependent variables are integers, count data models were used. The
dependent variable is truncated at a point where number of visits is greater than or equal to
one. Furthermore the statistical test showed that the data has no over dispersion problem.
Thus, the truncated Poisson model was used in the empirical analysis instead of the negative
binomial model.
The regression results obtained from this study showed that travel costs, visitor’s income,
family size, level of education, being a head of the family, availability of Wondogenet,
Sodere, Abjata-Shalla and Langaano substitute recreation sites were important determinants
of the recreation demand of the site.
The coefficient of travel cost is negative and significant at 5% significant level, implying that
an increase in travel cost reduces the number of visits of the site. Similarly, the coefficient of
income variable is positive and significant at 10% significant level, implying that the demand
for recreation increases as visitor’s income increases and vice-versa. The relationship
between education variable and recreation demand was Positive and significant implying that
the more educated people make more frequent visit than less educated ones.
Furthermore the recreational benefit computed from the regression analysis indicated that the
recreational benefits per person amounted to Birr 589. The expected total annual benefit of
the site was, therefore, estimated at Birr 8,383,605. Use of a travel cost model to estimate the
willingness of users to pay for visits to Gudumale recreation sites has demonstrated that these
sites provide substantial values to users.
The result of this study indicates that the benefit of visitors from the site is larger than the
annual income that the site authority earned from visitors of the site, as expected. Based on
these results of the study, it is therefore legitimate to draw the following recommendations.
The site management was able to capture only about 10.61% of the true economic
recreational benefit of the site for the 12-month period before the survey. This implies that
the amount of revenue that the site authorities collected from the service is far from the true
economic recreational benefit of the site.
If we compare the true economic recreational benefit of the site and the actual revenue
collected by the site authorities, it may be possible to further augment the actual revenue
collected from the site, which could again possibly be reinvested to improve the quality and
the conservation benefit of the site.
Consequently, site authorities and other concerned bodies need to be aware that there may be
a possible danger of underestimation of the conservation benefit of the site if future economic
decision of managing this resource fails to properly consider the true recreational benefit of
the site. Failure to properly internalize as much of the true benefit of the site for conservation
and improvement of the quality of the site may lead to possible occurrence of an irreversible
damage on the natural resources of the site. The site management should give great emphasis
to improve the existing services and hence increases their revenue. The current payment or
ISSN: 2349-5677
Volume 1, Issue 11, April 2015
92
entrance fee should be increased at least twice to capture 20% of the total economic benefits,
which goes for recreationists annually.
This research attempted to measure the recreational benefit of Gudumale recreation site. It is
only one component of the total economic benefit of the site. The total economic value of the
site also includes other use values of the site (such as option value) and non-use values of the
site (such as bequest value and existence value).The total economic value of the site requires
an effort of attaching a monetary value to all these values of the site. Therefore, it is advisable
if site authorities or other concerned bodies encourage research to estimate the total economic
value of the site. Decision makers need to have adequate scientific information about
economic values of environmental resources before they plan to launch similar projects. By
any measure, decision on allocation of environmental resources would be appropriate if it is
based on an economic estimate obtained through accepted estimation techniques than valuing
resources on the basis of peoples' traditional value judgment. It would, therefore, be of great
importance if conservation/ recreational authorities like Environmental protection agency
(EPA) and Tourism commission base their future management decisions on the economic
value of these resources estimated using environmental valuation techniques.
References
Amoako-Tuffour, J. and R. Mart´ınez-Espi˜neira (2008). Leisure and the opportunity
cost of traveltime in recreation demand analysis. Mimeo St. Francis Xavier
University.
Barbier, E.B. (1998). Environmental Project Evaluation in Developing Countries:
Valuing the Environment as Input, Note di Lavoro(86.98), FondazioneEniE.Mattei,
Milan.
Bateman, I. and R.K. Turner (1993). Valuation of the Environment, Methods and
Techniques, in Turner, R.K. (eds), Sustainable Environmental Economics and
Management: Principles and Practices, Belhaven Press, London.
Bergeland, O. (1998). Environmental Targets and non market Valuation.
Environmental Institute, University College, Dubline.
Blackwell, B. (2007). The Value of a Recreational Beach Visit: An Application to
Mooloollaba Beach and Comparisons with Other Outdoor Recreation, Victoria,
Australia,37(1): 156-161.
Clawson, M. and J. Knetsch (1966). Economics of Outdoor recreation.
JohnsHopkins University Press, Baltimore.
Clawson, M. (1959) Methods of Measuring the Demand for and Value of Outdoor
Recreation. Resources for the Future, Washington D.C.
ISSN: 2349-5677
Volume 1, Issue 11, April 2015
93
Dixon, J. A. (2008). Environmental Valuation: Challenges and Practices a Personal
View. Conference Paper No. 96734. Kailua, Hawaii.
Drimal, S. (2002). Travel cost analysis of recreation value in the wet tropical world
heritage area. Economic analysis and policy, Vol. 32No. 2
Fang, Z., C. Tian, H. Ying and W. Nai’a (2010). Using Multi-destination ZTCM to
Evaluate the Recreational Values of Cultural Sights: an Application to Jiayuguan,
China. Chinese Journal of Population, Resources and Environment,8(1): 69 –71
.
Freeman, A.M. (2003). The Measurement of Environmental and Resource Value:
Theory and Method. Resources for the Future. Washington D.C.
Gibbons, D. C. (1987). The Economic Value of Water. Resources for the Future.
John Hopkins University Press. Washington D.C.
Greene, W.H. (2003).Econometric Analysis, (5th
ed). Prentice-Hall Inc., New Jersey.
.
Hellerstein, Daniel M. (1991). Using Count Data Models in Travel Cost Analysis with
Aggregate Data. American Agricultural Economics Association, 73:860 – 867.
Jeong, H. and T.Haab (2004). The Economic Value of Marine Recreational Fishing:
Applying Benefit Transfer to Marine Recreational Fisheries Statistics Survey.
Working Paper: AEDE-WP-0039-04, Ohio State University.
Kolstad, C.D. (2000). Environmental economics. Oxford University Press. Oxford.
Krutilla, J. V. (1967). Conservation Reconsidered, American Economic Review, 57:
787−796.
Larson, M.D. (1993). Joint Recreation Choices and Implied Values of Time. Land
Economics, 69 (3):270 – 286.
Loomis, J. B. and W. Richard (1997). Recreation Economic Decisions: Comparing
Benefits and Costs. State College, Pennsylvania: Venture Publishing, Inc.
Maddala, G.S. (1992). Introduction to Econometrics, (2nd Edn). Macmillan
Publishing Company, New York.
Rolfe, J. and J. Bennett(2006). Choice Modeling and the Transfer of
Environmental Values. New Horizons in Environmental Economics, Edward Elgar
Publishing.
Rosato, P. and E. Defrancesco(2002). Individual Travel Cost Method and Flow Fixed
Costs. FondazioneEni Enrico Mattei.
http://www.feem.it/web/activ/_activ.html[accessed date Apr 20, 2010]
Shammin, R. (1999). Application of the Travel Cost Method (TCM): A Case Study of
Environmental Valuation of Dhaka Zoological Garden, IUCN/US.
http://www.iucnus.org/publications.html[accessed date Apr 15, 2010].
Smith, V.K. (1988). Selection and Recreation Demand. American Journal of
Agricultural Economics, 70: 29 – 36.
World Bank (1998). Economic Analysis and Environmental Assessment. Supplement
of the Environmental Assessment Sourcebook 23.The World Bank- Environment
Department. Washington D.C.