carpool and bus matching program for the university … the university of texas at austin ......
TRANSCRIPT

CARPOOL AND BUS MATCI-IING PROGRAM
FOR THE UNIVERSITY OF TEXAS AT AUSTIN
Sandra Rosenbloom Nancy J. Shelton
RESEARCH REPORT 11
September 1974

CARRlJL AND BUS mTCH I NG PRffiRPMS FOR THE
UNIVERSIlY (f TEXAS AT AUSTIN
by
Sandra Rosenbloan, Assistant Professor The Graduate Program in Camunity
and Regional Plaming
Nancy J. Shelton, Research Associate The Graduate Program in Camrunity
and Regional Plaming
RESEARCH REPORT 11 SEPTEMBER 1974
Grateful appreciation is extended to the members of the University ad hoc Ccmnittee on Energy Conservation, tmder the chainnanship of Dr. Archie Straiton, for their support and guidance. Appreciation is also extended to Ben Harrison, Tan Rioux and Charlie Copeland. A special tribute is due to all the School of Architecture and Plaming secretaries for their patience during the roost hectic days of the carpool matching program. The detailed analysis of this data was made possible by a grant fran the Academic Developm:mt Fund of the Council for Advanced Transportation Studies.

T
Table of Contents
List of Figures ......................................................... ii
List of Tables .......................................................... iii
I . Foreword. . . . . . . . . . . . . . . . . . . . . . . . . . . . . . . . . . . . . . . . . . . . . . . . . . . . . . . . . . . i v
I I. Introduction ........................................................ 1
III. Survey Procedures and Preliminary Results ........................... 4
IV. IIIIpact Anal ys is .................................................... 29
V. Proposed new routes for service to the University Community ........ 34
Bibliography .......................................................... 37 -43
Appendices
Appendix I - Carpool COIIIputer Program Description .................... 44
II - Traffic Control Zones in Each Census Tracts ............. 46
III - Summary Vehicle Occupancy Counts ........................ 48
IV - Supporting Data for Suggested Bus Routes ................ 52
i

.. •
List of Figures
Figure 1. Percentage Response to All Survey Questions .•.............. 25-28
Figure 2. Map of Proposed Routes •...••.•.•.....••...•................... 36
ii

, •
List of Tables
Table 1. Number Staff and Faculty in Each Census Tract ••••••.......•.•.• 8
Table 2. Zone by Zone Totals, Question 1 •••••••••.•.•.•.........•.... 9-16
Table 3. Present MOde - Percent by Census Tract ......................•. 17
Table 4. Time Leaving Home for School •.......••........................ 19
Table 5. Time Leaving School for Home ...•..•....•••..................•• 20
Table 6. Cost Preference, Round Trip, By Census Tract ..•...•.•....•..•• 24
Table 7. 24-Hour Volume Counts for Four Major locations around the lJIliversity ................................... ............... .. 29
Table 8. Vehicle Occupancy; Speedway North of 19th Street: Before ...... 3l
Table 9. Vehicle Occupancy; Speedway North of 19th Street: After .....•. 32
iii

I. Foreword
In October 1973 officials of the University of Texas at Austin became
concerned with the effect on the continued smooth operation of the Uni
versity of the growing energy crisis. The President's ad hoc Energy
Conservation Committee called on members of the Graduate Program in
Community and Regional Planning (CRP) for assistance in the development
of effective contingency plans and the development of meaningful trans
portation alternatives for University personnel. CRP faculty and students
designed and administered a carpool and bus matching survey and program,
with the University Data Processing Division in charge of compilation
and computer services.
In March 1974, Professor Rosenbloom, the survey director, was awarded
a grant by the Council for Advanced Transportation Studies, to study the
impact of the implementation of the CRP bus and carpool matching program
on the University community. Although it was hoped that the CRP program
would be underway prior to the start of the spring semester, January 1974,
a number of delays retarded completion of the survey until late spring
and several additional computer problems caused a delay in the production
of the final carpool matching lists until the end of the spring semester.
The many delays and the production of several erroneous carpool lists,
which had to be voided after delivery to survey respondents, undoubtedly
adversely affected the formation of many carpools and made much of the
information too untimely to be useful. Those involved in the original
surv-ey believe that carpooling is a viable transportation alternative for
many university employees and believe that the University should consider

timely and effective methods of encouraging this transportation mode. In
addition to this carpool report, a separate analysis was prepared on the
bus-related responses to this survey. MS. Nancy J. Shelton undertook
this analysis and the results are presented in her Masters thesis "A
Proposed Bus System to Serve the Faculty and Staff of the University of
Texas at Austin."

II. Introduction
In January of 1974 the University of Texas at Austin undertook a
survey of its full-time faculty and staff to determine their interest in
both carpooling and bus alternatives to their present mode of travel.
Over 65% of the slightly under 10,000 persons surveyed returned com
pleted questionnaires; the compilation and analysis of those data is pre
sented in this report. Because University programmers wanted to 1) address
questionnaires to each respondent individually and 2) reduce data com
pilation costs for information already on permanent personnel files (e.g.
addresses, phone numbers, work location), a special program was written
to collect and analyze all collected data and the offer to use the exist
ing Federal Highway Administration carpooling program was declined.
See Appendix I for a summary of the parameters of the computer pro-
gram used.
The collected data were conpiled and analyzed in two stages. First,
all persons indicating interest in carpooling (either as a passenger or
a driver) were given an individual print-out listing all other interested
persons in their neighborhood. Neighborhoods were determined by Austin
traffic zones; all respondents were asked to identify the traffic zone
in which they lived from a map attached to each questionnaire. Inter
ested carpoolers were listed on print-outs by the time of day they wished
to leave home for work and the days they desired to carpool. Three separ
ate carpool matching routines were run; the largest for the UT campus
itself, one for University Systems employees in downtown Austin and one
for the joint Balcones Research, Applied Labs facility north of Austin
on Hwy 183.
1

Initial compilation of data from this survey, presented in this re
port, reveals that 44% of all campus personnel come to campus alone in
their cars, 'While only 24% currently carpool. Seven percent of campus
ccmnuters walk to work, another two percent take the city bus, ten percent
ride part or the entire way on the student shuttle bus, and a little over
four percent cycle to work. Twenty-five percent of the respondents, however,
indicated they would be interested in both carpools and bus services if
they were available and convenient; another 13% were interested in only bus
services 'While seven percent were interested in only carpools.
A master list of all interested carpoolers is maintained at the
Periodicals Reserve desk in the Main Library so that any new personnel
or those changing their mind can still form carpools.
The second stage of the work involved a detailed analysis of the re
sponses indicating interest in special bus services. Several bus options
were investigated using the survey data to both set parameters for and
to project the effectiveness of proposed systems such as demand-actuated
services, subscription home-to-work services and new bus routes. The
University currently contracts for a special shuttle bus service for its
40,000 students; this bus system carries 30,000 passenger trips daily
and the analysis of bus data generated suggestions for either incor
poration into this existing system or for improvements in the City of
Austin bus system.
A preliminary study was made of the immediate short-term improvements
derived from the matching of interested carpoolers. This study consisted
of a "before and after" survey of traffic congestion and vehicle occu
pancy (performed by the Austin Urban Transportation Department) at key
2

locations around the University campus and a sampling of those who in
dicated carpool interest to determine their experience and actual changes
in travel habits.
3

III. Survey Procedures and Preliminary Results
To obtain information on faculty/staff interest in carpooling and
buses, a questionnaire was individually addressed and distributed to all
faculty and staff members working 20 hours per week or more. Questions
on personnel interest, schedules, and level of service desired were in
cluded, and all persons were asked to locate their residence on a zoned
map of the city. A list of persons in each department who had not re
turned useable forms was sent to the department head with the request that
the department contact these people and encourage them to return the
questionnaires; new forms were available for persons who no longer had
their personalized form. Some forms had to be returned directly to per
sons who inadvertently failed to answer one or more of the questions,
yet expressed interest in carpooling or buses. Persons who were not
interested in either carpooling or buses frequently simply acknowledged
lack of interest and returned an incomplete questionnaire; these question
naires were also returned and the persons were asked to note their zone
of residence and present mode of transportation to provide better infor
mation for the overall study on residences and modes for the faculty/staff
as a whole.
Approximately 10,000 survey forms were sent to faculty and staff
members and, after two follow-ups, 6240 useable questionnaires were
returned. Since the university sent forms to all persons on their pay
roll working at least 20 hrs/wk, this also included same persons working
in out-of-town research centers such as McDonald Observatory and the
Marine Science Institute at Port Aransas; and the Galveston, San Antonio,
4

and EI Paso Nursing Schools. These questionnaires were returned blank,
along with those for people who had resigned from the university recently.
TWo other UT branches in Austin also received questionnaires, but these
are not being included in the study, since the staff involved is small
and so many different locations are involved. (There were 268 useable
questionnaires from the Balcones Research Center in Northwest Austin and
57 from the UT Systems Office in downtown Austin.)
There were several lengthy time delays in the computer matching of
interested respondents and, in addition, errors in computer programming
resulted in the necessity to void the first distributed carpool lists.
All respondents were told to discard the first list, and a second list
was later distributed to interested persons. There is no way to estimate
the number of people who were disuaded from carpool use because of either
the initial time delay or the recurrent computer errors.
Persons interested in carpooling were given lists of names and
phone numbers and addresses (both campus and home numbers) of people
living in or near their zone who were also interested in carpooling and
the times at which they left home for work. This was done with a comput
erized matching program developed by the University of Texas Data
Processing Division.
A master list of all interested carpoolers, a large zone map, and
a detailed instruction sheet were placed in the periodicals room of the
Main Library on campus to aid those persons who joined the university later
or changed their minds about carpooling. This list included the same
information as the individual carpool lists, arranged by zone, so that
interested people merely had to find their zone and then contact the
persons whose schedules matched theirs.
5

Because of the errors in the original matching program and other
demands on their time the Data Processing Division was unable to provide
promised information on the questionnaire responses, as originally antici
pated. Eventually, at great additional expense, all survey data were con
verted from the Data Processing Division's IBM 360 to the University
Research computer and data analysis was continued as orginally contemplated.
The number of faculty and staff members living in each zone is shown
in Table 1. The number who expressed interest in bus service to and from
campus are shown, by zone, in Table 2. Regarding the present mode of
transportation to and from campus of all the respondents; 46.32% were
car drivers alone; 25.42% were car passengers or in a carpool; 8.82% used
the UT shuttle buses; 7.42% walk; 4.51% rode a bicycle or motorcycle;
2.12% used a city bus; 1.10% used a park and ride system with the UT
shuttle buses, and 4.28% used some other means of transportation. This
is a total of 71.75% who arrived in automobiles and 9.92% who arrived at
campus on the UT shuttle buses. (See Table 3).
These percentages were different from those for persons expressing
an interest in buses. Of those expressing an interest in bus service,
64.4% came to campus as cardrivers alone, 19.98% were car passengers or
in a carpool. 2.79% rode the UT shuttle buses; 2.75% rode a bicycle or
motorcycle, 2.66% walked; 1.61% used the city buses; 1.05% used the UT
shuttle buses in a park and ride situation, and 4.67% used other means
of transportation to campus. This is a total of 84.38% who arrived in
automobiles and 3.84% who arrived on UT shuttle busses.
This constitutes a larger percentage of car drivers and car passengers
than the total sample (84.38% for the bus people vs. 71.75% total). The
percentages were smaller for shuttle bus use (3.84% for bus people vs.
9.92% total sample), for bicycle/motorcycle use (2.75% vs. 4.51% total)
6

and for walking (2.66% vs. 7.42% total). This is understandable, since
persons within walking distance would probably not need bus service as
much as those living further away from campus, who were otherwise depen
dent upon automobiles. Likewise, persons who already had access to UT
shuttle bus service would not be as interested in new bus service as
persons with no shuttle bus serivce.
7

Table I
NUMBER STAFF AND FACULTY IN EACH CENSUS TRACT
QUESTION #1;
CENSUS TRACT TRAFFIC ZONES DENSITY PER ACRE
0001 230 0.113 0002 221 0.139 0003 421 0.187 0004 191 0.196 0005 194 0.602 0006 314 0.503 0007 104 0.267 0008 84 0.056 0009 45 0.044 0010 22 0.037 0011 31 0.049 0012 104 0.168
13.01 94 0.107 13.02 99 0.066
0014 124 0.141 15.01 149 0.173 15.02 133 0.114 15.03 61 0.073, 16.01 408 0.202 16.02 210 0.289 17.01 324 0.145 17.02 124 0.124 18.01 270 0.231 18.02 158 0.139 18.03 124 0.123
0019 110 0.095 0020 87 0.055
21.01 402 0.131 21.02 85 0.038
0022 6 0.015 23.01 221 0.122 23.02 38 0.028 23.03 5 0.043 0024 30 0.025
8

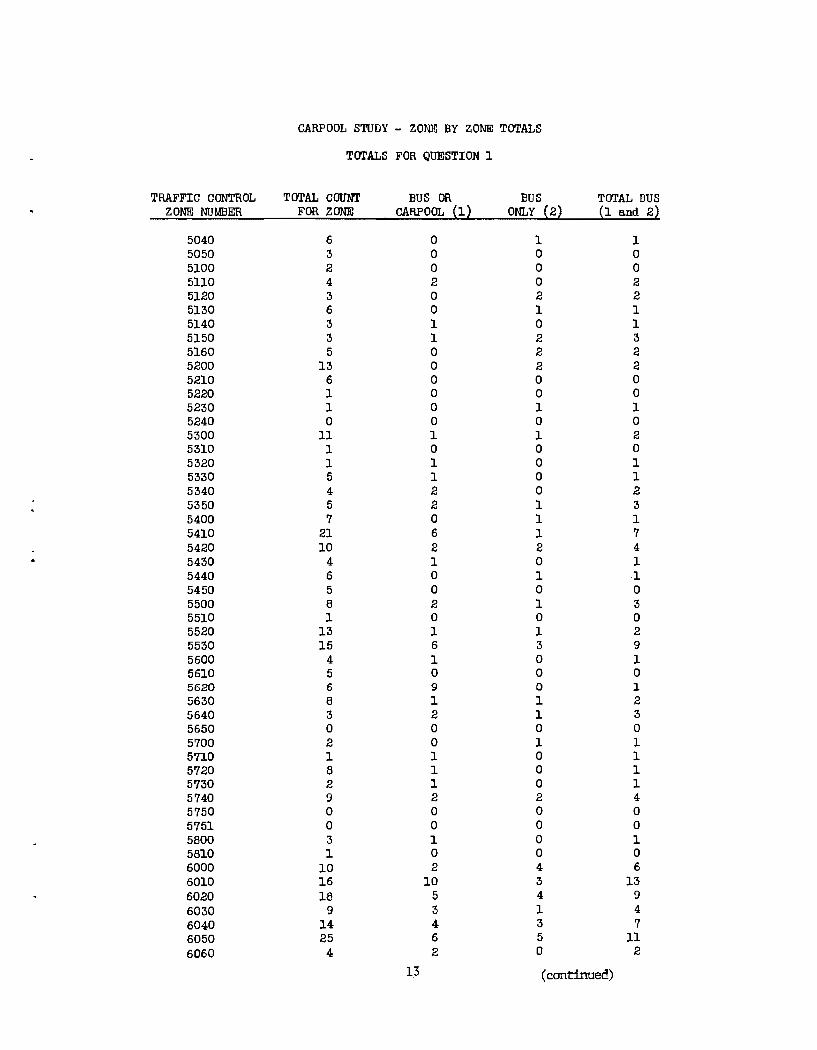
Table 2 CARPOOL STUDY - ZONE BY ZONE TOTALS
TOTALS FOR QUESTION 1
TRAFFIC CONTROL TOTAL COUNT BUS OR BUS TOTAL BUS ZONE NUMBER FOR ZONE CARPOOL ~ll ONLY {2l {1 and 22
0000 6 1 1 2 0100 3 0 1 1 1000 13 4 2 6 1010 4 1 0 1 1020 3 1 1 2 1030 0 0 0 0 1040 2 0 1 1 1050 6 0 1 1 1060 25 3 5 8 1070 24 3 3 6 1080 44 9 2 11 1100 11 6 0 6 1110 28 7 6 13 1120 15 1 2 3 1130 19 3 4 7 1140 8 2 3 -5 1200 46 11 4 15 1210 35 10 8 18 1220 42 10 8 18 1230 2 0 1 1 1240 5 1 0 1 1250 43 13 6 19 1260 39 11 8 19 1271 75 12 8 20
w 1272 46 5 3 8 1300 3 1 0 1 1310 19 8 4 12 1320 8 2 2 4 1330 22 11 4 15 1340 51 15 16 31 1400 34 9 8 17 1410 28 14 15 19 1420 13 2 2 4 1430 26 7 4 II 1500 19 6 3 9 1520 15 4 5 9 1600 30 9 4 13 1610 14 3 3 6 1620 37 13 15 18 1700 34 9 8 17 1710 20 8 3 11 1720 2 1 0 1 1730 24 9 2 II 1740 25 10 4 14 1800 48 16 4 20
. 1810 75 34 11 45 1820 16 4 2 6 1900 0 0 0 0 1910 59 22 9 31 2000 20 4 0 4 2010 14 1 1 2 2020 32 6 3 9
9 ( continued)

CARPOOL STUDY - ZONE BY ZONE TOTALS
TOTALS FOR QUESTION 1
TRAFFIC CONTROL TOTAL COUNT BUS OR BUS TOTAL BUS ZONE NUMBER FOR ZONE CARPOOL ~ll ONLY (2~ {I and 2l
2030 25 2 3 5 2040 8 3 a 3 2050 2 a a a 2100 55 2 1 3 2110 1 a a a 2120 2 a a a 2200 11 1 a 1 2210 35 5 2 7 2220 8 a a a 2230 15 0 2 2 2240 6 0 a 0 2250 15 0 a a 2300 49 4 9 13 2310 37 3 5 8 2320 31 5 a 5 2330 20 1 3 4 2340 32 4 4 8 2400 6 3 2 5 2410 56 5 13 18 2420 75 6 7 13 2430 73 9 9 8 2500 1 a a a 2510 27 3 a 3
• 2520 11 1 a 1 2530 19 a a 0 2540 27 7 2 9 2550 17 2 2 4 2560 25 5 3 8 2600 10 0 2 2 2610 8 0 1 1 2620 25 6 2 8 2630 38 6 4 10 2640 29 5 7 12 2650 14 0 1 1 2700 39 4 7 11 2710 33 6 1 7 2720 2 0 0 0 2730 16 7 2 9 2740 9 1 1 2 2750 12 2 2 4 2760 4 0 0 0 2800 11 4 0 4 2810 6 1 2 3 2820 24 3 5 8 2830 6 1 0 1 2840 3 0 0 0 2850 6 1 1 2 2860 15 6 5 11 2870 2 0 0 0 2880 26 8 4 12 2890 15 1 2 3 2900 2 0 0 0
10 (continued)

CARPOOL STUDY - ZONE BY ZONE TOTALS
TOTALS FOR QUESTION 1
TRAFFIC CONTROL TOTAL COUNT BUS OR BUS TOTAL BUS ZONE NUMBER FOR ZONE CARPOOL ~1) ONLY '2~ ~1 and 2l
2910 19 0 1 1 2920 21 4 4 8 2930 39 7 4 11 2940 13 4 1 5 2950 22 5 3 8 2960 12 3 2 5 2970 8 0 0 0 2980 7 4 2 6 2990 15 2 3 5 3000 4 1 1 2 3010 7 1 0 1 3020 8 4 1 5 3030 5 2 0 2 3040 0 0 0 0 3050 27 6 3 9 3060 1 0 1 1 3070 4 2 1 3 3080 14 4 4 8 3100 22 3 6 9 3110 6 1 2 3 3120 13 3 2 5 3130 14 2 3 5 3140 8 3 0 3 3150 16 5 2 7 3200 0 0 0 0 3210 14 5 3 8 3220 24 6 8 14 3230 27 15 3 18 3240 8 2 1 3 3250 17 8 2 10 3260 29 12 3 15 3270 30 12 5 17 3300 20 4 3 7 3310 5 2 0 2 3320 12 3 1 4 3330 17 4 0 4 3400 15 5 4 9 3410 11 6 1 7 3420 27 13 1 14 3430 20 9 4 13 3440 78 22 8 30 3450 5 0 0 0 3500 28 9 5 14 3510 30 11 2 13 3520 17 3 3 6 3530 32 8 7 6 3540 9 4 2 6 3550 8 1 1 2 3600 2 0 1 1 3610 1 0 0 0 3700 4 0 2 2 3710 25 9 1 10
11 (continued)

CARPOOL STUDY - ZONE BY ZONE TCYrALS
TCYrALS FOR QUESTION 1
TRAFFIC CONTROL TCYrAL COUNT BUS OR BUS TCYrAL BUS ZONE NUMBER FOR ZONE CARPOOL (ll ONLY ~2l {1 and 2l
3720 35 15 5 20 3730 9 3 1 4 3740 3 1 0 1
·3800 9 1 1 2 3810' 15 3 3 6 4000 6 1 1 2 4010 10 0 1 1 4020 8 2 2 4 4030 2 1 0 1 4040 21 3 4 7 4050 60 13 13 26 4060 10 4 4 8 4070 26 7 4 11 4080 5 2 1 3 4090 15 4 0 4 4100 2 0 1 1 4110 7 4. 0 4 4120 13 1 2 3 4130 3 0 0 0 4140 6 3 0 3 4200 18 4 1 5 4210 70 26 7 33 4220 40 12 7 19 4300 36 11 3 14 4310 28 10 1 11 4320 27 7 7 14 4330 19 2 5 7 4340 17 5 5 10 4350 33 8 4 12 4400 80 24 9 33 4410 3 0 0 0 4420 2 1 0 1 4430 9 3 l. 4
4431 7 0 0 0 4500 2 0 0 0 4510 19 7 5 12 4520 1 0 0 0 4530 17 8 0 8 4540 5 0 1 1 4550 23 10 4 14 4600 36 16 7 23 4610 8 3 2 5 4620 4 2 1 :3 4630 0 0 0 0 4700 29 16 1 17 4710 0 0 0 0 4800 7 1 1 2 4901 0 0 0 0 5000 10 2 0 2 5010 8 2 1 3 5020 2 0 0 0 5030 3 2 0 2
12 (continued)
CARPOOL S'lUDY - ZONE BY ZONE TOTALS
TOTALS FOR QUESTION 1
TRAFFIC CONTROL TOTAL COUNT BUS OR BUS TOTAL BUS ZONE NUMBER FOR ZONE CARPOOL ~1} ONLY {2~ ~1 and 2l
5040 6 0 1 1 5050 3 0 0 0 5100 2 0 0 0 5110 4 2 0 2 5120 3 0 2 2 5130 6 0 1 1 5140 3 1 0 1 5150 3 1 2 3 5160 5 0 2 2 5200 13 0 2 2 5210 6 0 0 0 5220 1 0 0 0 5230 1 0 1 1 5240 0 0 0 0 5300 11 1 1 2 5310 1 0 0 0 5320 1 1 0 1 5330 5 1 0 1 5340 4 2 0 2 5350 5 2 1 3 5400 7 0 1 1 5410 21 6 1 7 5420 10 2 2 4 5430 4 1 0 1 5440 6 0 1 1 5450 5 0 0 0 5500 8 2 1 3 5510 1 0 0 0 5520 13 1 1 2 5530 15 6 3 9 5600 4 1 0 1 5610 5 0 0 0 5620 6 9 0 1 5630 8 1 1 :3 5640 3 2 1 3 5650 0 0 0 0 5700 2 0 1 1 5710 1 1 0 1 5720 8 1 0 1 5730 2 1 0 1 5740 9 2 2 4 5750 0 0 0 0 5751 0 0 0 0 5800 3 1 0 1 5810 1 0 0 0 6000 10 2 4 6 6010 16 10 3 13 6020 18 5 4 9 6030 9 3 1 4 6040 14 4 3 7 6050 25 6 5 11 6060 4 2 0 2
13 ( continued)

CARPOOL STUDY - ZONE BY ZONE TOTALS
TOTALS FOR QUESTION 1
TRAFFIC CONTROL TOTAL COUNT BUS OR BUS TOTAL BUS ZONE NUMBER FOR ZONE OARPOOL {ll ONLY ~2l 11 and 2l
6070 10 3 2 5 6080 2 1 1 2 6090 11 4 5 9 6100 10 5 1 6 6110 9 1 4 5 6120 10 2 3 5 6130 8 3 2 5 6140 2 0 0 0 6200 18 1 2 3 6210 32 14 6 20 6222 26 7 2 9 6223 4 8 0 3 6224 22 8 2 10 6225 11 2 1 3 6230 1 0 1 1 6301 18 2 5 7 6302 15 2 0 2 6303 26 5 4 9 6304 14 4 1 5 6310 0 0 0 0 6320 3 1 0 1 6400 4 2 0 2 6410 b 0 1 1 6420 8 5 0 5 6430 5 1 1 2 6500 6 1 1 2 6510 1 1 0 1 6520 0 0 0 0 6530 4 0 0 0 6600 5 2 0 2 6700 0 0 0 0 6701 0 0 0 0 6710 1 0 0 0 6720 2 0 0 1 6730 0 0 0 0 6800 2 0 0 0 6810 0 0 0 0 6820 6 1 1 2 6900 15 6 0 6 6901 2 0 0 0 6910 11 2 1 3 6911 0 0 0 0 6920 0 6 0 0 7000 2 1 0 1 7010 2 0 1 1 7020 0 0 0 0 7030 13 6 1 7 7040 6 1 1 2 7050 3 1 a 1 7060 6 0 2 2 7070 8 2 1 3 7080 15 5 2 7
14 (continued)

CARPOOL STUDY - ZONE BY ZONE TOTALS
TOTALS FOR QUESTION 1
TRAFFIC CONTROL TOTAL COUNT BUS OR BUS TOTAL BUS ZONE NUMBER FOR ZONE CARPOOL (1) ONLY (2) (1 and 2)
7100 4 1 0 1 7110 17 4 5 9 7120 11 7 1 8 7130 6 2 2 4 7140 16 5 2 7 7150 10 1 1 2 7160 9 9 9 9 7170 9 6 9 6 7180 12 6 2 8 7200 1 0 1 1 7210 49 24 10 34 7220 34 15 9 23 7300 27 15 1 16 7310 59 26 7 33 7400 9 4 4 8 7500 17 6 3 9 7501 9 2 1 3 7510 0 0 0 0 7520 0 0 0 0 7530 5 1 0 1 7600 8 3 0 3 7610 9 1 0 1 7620 8 2 1 3
" 7630 6 3 9 3 7640 24 8" 2 10 7650 6 3 0 3 7700 13 8 0 8 7710 10 :3 1 4 7720 7 2 1 3 7730 5 1 0 1 7740 3 1 0 1 7750 3 1 0 1 7760 1 1 0 1 7770 2 1 1 2 7800 4 0 0 0 7810 5, 1 1 2 7820 2 0 0 0 7830 8 2 0 2 7840 1 0 1 1 7841 :3 0 1 1 7850 10 2 1 3 7860 9 2 0 2 7870 17 5 1 6 7871 4 0 1 1 7900 12 4 0 4 7910 8 4 1 5 7920 21 10 3 13 7930 4 0 0 0 7940 6 3 0 3 7950 14 4 4 8 7960 16 9 0 9 8000 4 2 1 3
15 (continued.)

OARPOOL STUDY - ZONE BY ZONE TOTALS
TOTALS FOR QUESTION 1
TRAFFIC CONTROL TOTAL COUNT BUS OR BUS TOl'AL BUS ZONE NUMBER FOR ZONE CARPOOL ~1} ONLY ~2} ~1 and 2~
8060 3 2 0 2 8070 21 4 2 6 8080 4 3 0 3 8130 10 4 1 5 8140 0 0 0 0 8150 1 0 0 0 8160 2 1 0 1 8170 9 3 3 6 8180 3 0 0 0 8220 18 5 2 7 8230 7 6 0 6 8240 30 10 2 12 8250 1 0 0 0 8260 2 0 0 0 8270 9 3 0 3 8300 22 8 2 10 8310 4 1 0 1 8320 2 0 1 1 8330 6 2 1 3 8340 23 11 5 16 9000 1 0 0 0 9010 10 4 1 5 9020 52 15 5 20 9030 14 7 3 10 9060 4 2 1 3 9070 33 12 2 4 9080 12 4 4 8 9090 14 6 0 6 9100 2 1 0 1 9110 7 1 0 1 9120 1 0 1 1 9130 0 0 0 0 9140 0 0 0 0 9150 0 0 0 0 9160 1 1 0 1 9170 2 1 0 1 9180 0 0 0 0 9190 0 0 0 0 9290 2 0 0 0 9300 3 2 0 2 9310 2 1 0 1 9996 219 39 5 44 9997 127 26 1 27 9998 200 24 7 31 9999 94 31 3 34
16

Table 3
PRESENT MODE - PERCENT BY CENSUS TRACT
CAR CARPOOL/ PARK AND DRIVER CAR RIDE: USE SHUTTLE CITY BICYCLE/ arHER: ALONE PASSENGER . SHUTTLE BUS BUS MarORCYCLE WALK EXPLAIN'
CENSUS TRACT 1 2 3 4 5 6 7 8
0001 64.15 21.69 0.94 0 4.72 5.2 0.47 2.83 0002 42.65 18.48 2.37 6.16 3.32 16.1 7.1 3.79 0003 35.6 16.54 1.0 24.06 2.25 11.2 4.51 4.76 0004 31.15 17.58 0.5 16.1 2.01 10.55 19.09 3.0 0005 17.8 8.9 0.52 8.37 0 18.32 44.5 1.57 0006 8.82 4.58 0 10.78 0 9.47 62.4 3.92 0007 16.16 4.04 0 7.07 1.01 6.06 63.6 2.02 0008 51.9 30.7 0 1.92 6.73 3.85 4.8 0 0009 41.86 27.9 0 0 25.58 0 2.32 2.32 0010 50 10 0 0 35 5 0 0 0011 28.57 10.7 0 17.8 7.14 14.28 17.8 3.57 0012 22.2 17.17 2.02 36.36 0 10.10 4.04 8.08
13.01 58.5 28.72 1.06 1.06 4.25 3.19 0 3.19 13.02 54.9 24.17 1.09 0 7.69 5.49 1.09 5.49
0014 43.2 23.7 0.84 17.7 1.69 4.24 0 8.47 15.01 56.94 36.8 0 0 0.69 1.38 0 4.16 15.02 57.14 27.7 2.38 1.58 3.17 1.58 0 6.35 15.03 60.3 17.2 10.34 3.45 1.72 5.17 0 1.72 16.01 52.04 17.09 1.27 16.3 0.51 5.10 2.29 5.35 16.02 18.6 16.7 1.96 56.8 0 1.47 0.49 3.92 17.01 66.7 27.3 0 0 0.63 1.27 0 4.13 17.02 62.7 27.1 0.84 0 0 3.39 0 5.9 18.01 62.7 25.9 1.18 0 3.53 1.57 0 5.09 18.02 62.9 31.8 1.3 0 0.65 0.65 0 2.6 18.03 55.5 32.8 0 0 2.52 0.84 0 8.4
0019 70.1 23.4 1.87 0 0.93 1.87 0 1.87 0020 58.02 38.3 2.5 0 0 0 0 1.23
21.01 54.85 26.3 1.02 6.12 2.55 1.78 0.26 7.14 21.02 64.1 19.29 1.28 0 10.2 0 0 5.13 0022 80 "20 0 0 0 0 0 0
23.01 44.8 22.8 1.29 26.3 0.43 0.43 0 3.88 23.02 44.1 35.3 0 0 8.82 2.94 0 8.82 23.03 50 50 0 0 0 0 0 0 0024 42.85 42.85 0 0 0 0 - 0 14.2,8
17

Persons who were interested in carpools were asked (question 8)
which things were most important to them and it was found that preference
in parking at the university and early university leaving time for
carpool members were desired most. Other responses are shown in Fig. 1.
Question 9 asked the respondents what time they left home for UT
each day. Of the persons who left at the same time each week, 30.1% left
between 7:30 and 8:00am; 28.17% left between 7:00 and 7:30am; and a total
of 81.21% left between 6:30 and 8:30am. Persons who left at different
times during the week had more trips and these trips were spread out
through the day with a less pronounced peak period. The most cornmon
leaving time on Monday was 9-llam (18.32%), 8:00-8:30am on Tuesday
(19.18%), 8:30-9:00am on Wednesday (17.48%), 8:00-8:30am on Thursday
(18.45%), and 9-llam on Friday (17.82%). The percentages and exact
numbers for the other times are shown in Table 4.
Faculty- and staff members were then asked in question 10 to give the
approximate time at which they left the campus for home. The most com
mon time both for persons who left at the same time every day and for
those who left at different times during the week was from 5:00 to 5:30pm.
Table 5 contains data on the exact numbers and percentages.
The majority {54.69%) of persons who were interested in carpooling
said they would use it MOnday through Friday. Fig. 1 shows the percent
ages for the other responses.
Persons interested in buses showed similar preferences, with 63.85%
using them Monday through Friday. Therefore, it might be best to operate
the buses only on weekdays.
When asked if they expected significant changes in their schedules for
the 1974-75 academic year, 62.30% said they did not, 13.39% said they did,
18

I-' !.O
Seme ti,me all week
Monday
Tuesday
l'I1ednesday
Thursday
Friday
~eme time ~11 week
~onday
l'uesday
,'wednesday
~ursday
Friday
6:30 - 7:00 -7:00 em 7:30
11.06,% 28.17'1 (377) (960)
3.90,% 12.301. (26) (82)
4.401. 9.751. (28) (62)
4.141. 11.201. (27) (73)
4.261. 8.041. (27) (51)
3.531. 11.521. (23) (75)
4:00 - 4:30'-4:30 pm 5:00
0.061. 0.06'1 (2) (2)
0.151. 01. (2) CO)
0.161. 0.471-(1) (3)
01. 0.151-(0) (1)
0.161. 0.161. (1) (1)
01. 0.151. (0) (1)
, .
Table 4
TIME LEAVING HOME FOR SCHOOL
7:30 -8:00
30.11-(1026)
15.921. (106)
11.011. (70)
15.181. (99)
11.041. (70)
14.901. (97)
5:00 -5:30
0.061-(2)
01. (0)
0.321. (2)
01. (0)
0.471. (3)
01. (0)
8:00 -8:30
11.88% (405)
16.071. (107)
19.181. (122)
15.801. (103)
18.451. (117)
16.441. (107)
5:30 -6:00
0.091. (3)
0.301. (2)
0.311-(2)
0.461-(3)
0.631-(4)
0.461-(3)
8:30 -9:00
6.25% (213)
15.621. (104)
16.821. (107)
17.481. (114)
16.41. (104)
16.901. (110)
6:00 -6:30
0.061. (2)
0.151-(1)
0.311. (2)
0.151. (1)
01-(0)
0.151-(1)
9:00 -11:00
4.05% (138)
18.321. (122)
16.041. (102)
16.411. (107)
17.031. (108)
17.821. (116)
6:30 -8:30
0.18% (6)
0.151-(1)
0.631. (4)
0.461. ( 3)
0.631. (4)
01. (0)
11:00 - 1:00 -1:00 pm 3:00
1.171. 2.82'1 (40) (96)
9.611. 1. 651. (64) (11)
10.691. 2.361. (68) (15)
9.971. 2.301. (65) (15)
10.251. 4.421. (65) (28)
9.221. 1. 691. (60) (11)
3:00 -3:30
0.56'1 (19)
0.901. ( 6)
0.471. (3)
0.611. (4)
0.631. (4)
0.611. ( 4)
3:30 -4:00
0.091-(3)
0.751. (5)
0.311. (2)
0.311. (2)
0.631. ( 4)
0.151. (1)
8:30 - 10:30 - 12:30 - not appli-10:30 12:30 6:30 cable
0.121. 0.321- 0.121. 2.79'1 (4) (11) (4) (95)
0.151- 0.151. 0.151- 3.751. (1) (1) (1) (25)
0.161. 0.471. 0.161. 5.971-(1) (3) (1) (38)
0.151. 0.311. 0.151. 4.751. (1) (2) (1) (31)
0.321. 0.321. 0.161. 5.991-(2) (2) (1) (38)
0.151. 01- 01- 6.301. (1) 'CO) (0) (41)

N o
Same time all week
Monday
Tuesday
Wednesday
Thursday
Friday
Same time lall week
~onday
~esday
~ednesday
~ursday
Frida.y
6:30 - 7:00 -7:00 em 7:30
0.5~% (18)
0.4~ (13)
01. O"/. (0) (0)
O"/. 0.13"/. (0) (1)
O"/. O.26"/. (0) (2)
O"/. 0.271. (0) (2)
0.13"/. O"/. (1) (0)
4:00 - 4:30 -4:30 pm 5:00
5.101 17.61-(16.7) (578)
9.,14"/. ,13.13"/. (n) (102)
7.65"/. 10.30"/. (57) (77) ,
8.46"/. 11.20"/. (65) (86)
8.191. 12.62"/. (61) (94)
1l.27"/. 12.84"/. (86) (98)
:table 5
TIME LEAVING SCHOOL FOR HOME
7:30 -8:00
0.40% (13)
O"/. (0)
01. (0)
O"/. (0)
O"/. (0)
01. (0)
5:00 -5:30
45.75~ (1499)
H.63"/. (137)
15.84"/. (118)
17.581, (135)
14.76"/. (110)
20.1B"/. (154)
8:00 -8:30
0.15% (5)
0.261. (2) ,
01. (0)
O.13"/. (1)
0.13 (1)
0.131. (1)
5:30 -6:00
9.8~ (322)
n.n"/. (91)
8.60"/. (64)
10.161, (78),
9.13"/. (68)
9.301. (n)
8:30 -9:00
0.27% (9)
0.13"/. (1)
O"/. (0)
01. (0)
01. (0)
0.261. (2)
6:00 -6:30
3.0~"/. (100)
7.34"/. (57)
10.34"/. (77)
6.511. (50)
9.66"/. (72)
4.06"/. (31)
9:00 -11:00
0.06% (2)
1.42"/. (11)
0.67"/. (5)
0.52"/. (4)
0.671. (5)
0.79"/. (6)
6:30 -8:30
2.23"/. (73)
6.18"/. (48)
7.65"/. (57)
5.60"/. (43)
B.46"/. (63)
2.B8"/. (22)
11:00 - 1:00 -1:00 pm 3:00
1.4~% 2.08% (47) (68)
3.86"/. 5.79"/. (30) (45)
3.89"/. 6.04"/. (29) ( (5)
5.34"/. 6.901. (41) (53)
4.43"/. 6.n"/. (33) (50)
6.4a"/. n.01"/. (49) (84)
3:00 -3:30
1.59~ (52)
5.66"/. (44)
4.97"/. (37)
6. 51"/. (50)
5.10"/. (38)
7.60"/. (58)
3:30 -4:00
1. 401 (46)
4.501. (35)
4.831. (36)
4.82"/. (37)
3. 49"/. (26)
5.37"/. (41)
8:30 - 10:30 - 12:30 - not appli-10:30 12:30 6:30 oable
0.79"/. 3.8~ 0.61"/. 2.8.ff. (26) , (125) (20) (93)
7.72"/. 2.44"/. 0.39"/. 2.70"/. (60) (19) (3) (21)
10.47"/. 2.42"/. 0.40"/. 5.77"/. (78) (18) (3) (43)
8. 59"/. 2.34"/. 0.39"/. 4.69';' (66) (18) (3) (36)
B.3a"/. 2.28"/. 0.54"/. 5.23~ (62) (17) (4) (39)
0.79"/. 0.9a"/. 0.13"/. 5.901,. (6) (7) (1) (45)

and 24.32% did not know. It would therefore be safe to assume that the
data gathered in this study would be applicable to a system for the 1974-75
year, also.
Potential carpool drivers were asked how many people including them
selves could comfortably fit in their cars (question 14), and 30.44% said
that four people could while 13.65% said five people could. Other responses
'Were less frequent and appear in Fig. 1.
A student survey was taken in the fall of 1973 to provide information
for the shuttle bus system. This was done during registration and student
identification card distribution to include the greatest number of students
possible. In the interest of combining these data with those obtained
from the faculty and staff on their residence patterns and to avoid double
counting, faculty and staff members were asked whether or not they were
registered for a class in the fall of 1973. Results showed that 78.39%
said they were not students, and 21.61% said they were, which means they
were also included in the student survey.
Faculty and staff members said they would be willing to pay 25-50¢/day/
round trip (71.78% of the faculty and staff) and 21.32% said they would
pay 50-75¢/day/round trip. With slightly over 93% preferring a daily cost
of under 75¢ it
under 50¢.
necessary to keep the cost under 75¢ and preferably
The way in which they would prefer to pay for the service was also
examined. A daily fare was preferred by 27.30%, a monthly pass by 21.79%,
a semester pass by 18.78%. Other responses are shown in Fig. 1.
The maximum distances that people would walk to be picked up by a
carpool and a bus were asked for in question 18 and 19, respectively.
Generally, people were willing to walk further to be picked up by a bus
than by a carpool. For a carpool, 21.05% of the people wanted to be
21

picked up at home only, 7.07% would walk 1/2 block or less, 14.64% would
walk 1 block; 14.14% would walk 2 blocks. For the question on buses,
19.13% would walk 1 block or less, 22.51% would walk 2 blocks; 17.49%
would walk 3 blocks; 14.88% would walk 4 blocks or more.
Ten to thirty minutes riding time for bus or carPool was acceptable
to over 70% of those responding. For a one way trip between home and
campus, 7.02% were willing to ride 10 minutes or less, 33.14% accepted
a 10-20 minute trip; 3.5% accepted a 20-30 minute trip, 13.04% a 30-45
minute trip, 3.25% a 45 minute or longer trip, and 5.05% said the question
was not applicable.
The university currently sells parking permits to faculty, staff,
and students to allow them to park in UT lots. Question 21 asked the
faculty and staff members if they would still buy a UT parking permit
for their car if they used the bus; and 51.38% said they would, while
48.62% said they would not. This would result in about a 50% reduction
in parking fees for bus riders.
Persons using the bus, who would still buy the parking permit were
asked to explain why, and it was found that 37.78% would need it to come
to campus at night and on weekends and 24.75% wanted the permit in case
emergencies arose. The other responses occurred less frequently and are
given in Table 2.
Maximum waiting time for carpool and bus users was examined to help
determine bus headways, and it was found that 46.88% would wait 5-10
minutes, 30.75% would wait 10-15 minutes. It would therefore be unadvis
able to attempt to operate a system with headways greater than 15 minutes.
22

Of the total number of respondents, 64.39% said they were interested
in considering other transportation modes than their present one, while
35.61% were not interested in new modes. Those who said they were not
interested were asked to return the questionnaire at that point, and did
not complete the rest of the questionnaire.
Questions 4 and 5 asked whether or not the person would consider a
bus or a carpool under different circumstances. If gasoline were rationed
or cost 80¢ per gallon, 46.79% said they would use either a bus or a car
pool, 18.06% said they would only use a bus, 10.52% said they would only
use a carpool, 6.35% said the question was not applicable, and 18.28% said
they already used a bus or carpool. In question 5, which asked what they
would do at the present time, 39.14% would use only a carpool, 9.66% said
the question was not applicable, and 21.52% said they already used a bus
or carpool.
To include persons who did not have a car, question 6 asked whether
or not they would like to be a carpool passenger, although they could never
be a carpool driver. The results showed that 25.65% said they would like
to be carpool passengers, 22.74% said they would not, and 51.64% said
the question was not applicable. The last response includes people who
do not have access to a car.
The hours of bus service desired were explored in question 7, and
35.87% of the respondents said that peak morning and afternoon service
only (7am-9am and 4pm-7pm) was important to them; 25.36% wanted all day,
fairly frequent service; and 21.13% wanted both all day and late evening
service; Other responses are shown in Fig. 1.
23

Table 6
COST PREFERENCE, ROUND TRIP, BY CENSUS TRACT
25¢-50¢ 50¢-754 75¢-$1.00 $1.00- $1. 50 $1.50-$2.00
0001 64.2 31.8 2.65 0.662 0.662 0002 80 18.5 0.74 0 0.74 0003 90.3 9.27 0 0 0.39 0004 87.2 10.09 2.75 0 0 0005 93.2 5.48 1.37 0 0 0006 86.9 10.6 2.46 0 0 0007 81.4 16.3 2.32 0 0 0008 81.4 16.3 2.32 0 0 0009 68.75 31.25 0 0 0 0010 87.5 12.5 0 0 0 0011 82.4 17.6 0 0 0 0012 89.7 10.3 0 0 0
13.01 66.2 28.17 5.63 0 0 13.02 80.64 17.8 1.61 0 0
0014 79.3 17.24 3.44 0 0 15.01 60 33.04 6.09 0.87 0 15.02 69.5 26.83 3.66 0 0 15.03 75 20 5 0 0 16.01 79.49 17.22 3.3 0 0 16.02 90.14 7.75 1.41 0 0.70 17.01 46.93 41.67 10.53 0.88 0 17.02 59.26 34.57 4.94 1.23 0 18.01 65.73 29.78 3.93 0.56 0 18.02 62.73 33.64 2.73 0 0.91 18.03 ·63.75 27.5 8.75 0 0
0019 60.98 28.05 9.76 1.22 0 0020 69.39 24.49 6.12 0 0
21.01 75.30 21.96 2.74 0 0 21.02 83.33 16.67 0 0 0 0022 0 0 0 0 0
23.01 75.6 19.64 2.98 1.19 0.6 23.02 86.96 8.7 4.35 0 0 23.03 100 0 0 0 0
0024 89.47 10.53 0 0 0
24

Figure 1
Percentage Response to all Survey Questions
University ltansportation Alternatives
PLEASE INDICATE THE ITEM SUITABLE TO YOUR SITUATION
Present r--------p;..:' ====:.:-~-. ~-::----:--:-:-----=--:----::-::-:-:--:-----::-:-:------, Number orl ]1. Please check the attached map and find the traffic Responsed I I ! _ zone you live in; write it in the space at the left.
2772 1522
66 528 127 270 444 256
3927
2172
1953 754 439 265 763
1612 776 446 398 887
2. 46. 32!t 25.43" 1.10~ 8.82:~ 2.12% 4.51~ 7.42t 4.28%
1.
64.39%
35.61%
4.
46. 79c~ 18.06% 10. 52~ 6.35:b
18.28%
5.
39.14% 18.84% 10.f\i~ 9.66%
21.52:"
Which mode of transportation do you use most of the time: (1) card river alone (2) carpool/car passenger (3) park ,and ride: use shuttle (4) shuttle bus (5) city bus (6) bicyc1e/mot?rcycle (7) walk (8) other: explain
In view of the national energy and pollution crises, would you consider exploring transportation options such as expanding your carpool or using improved bus service or acquiring riders for your car. etc.?
(1) Yes, I would be interegted in exploring transportation options
(2) No. I would not be interested in exploring, transportation options.
If your response is Yes, please continue the questionnaire. If not, please return this questionnaire without finishing it to your immediate supervisor.
Would you use a bus system and/or a carpool for your daily work trips, if gasoline were rationed or cost 80¢ per gallon?
(1) Yes, bus or carpool (2) Yes, bus only (3) Yes. carpool only (4) Not applicable (5) I already use a bus or a carpool
Would you use a bus system and/or a carpool for your daily work trips now, if it were available and convenient?
(1) Yes, bus or-carpool (2) Yes. bus only (3) Yes, carpool only (4) Not applicable (5) I already use a bus or a carpool
25 (continued)

1051 932
2115
1043 1475
110 869 615
293 613 200 363 341 638
1571
6.
25.65% 22.74.:~ 51.61%
7.
8.
7.27% 15.22%
5.19% 9~01% 8.46%
15.83~~ 39.00%
ITJsame time all week
9.
IMonday Tuesday Wednesday Thursday Friday
D:Jsame time all week
IMonday Tuesday Wednesday Thursday Friday
10.
Even though you would never be a carpool driver. would you like to be a carpool passenger? (potential carpool drivers should give (3) as their answer)
(1) Yes (2) No (3) Not applicable
If you are willing to use a bus. which of these is important to you?
(1) all day fairly frequent service (7 am to 6 pm) (2) peak morning and afternoon service only
(7 am to 9 am and 4 pm to 7 pm) (3) late evening service ( 6 pm to 12 pm) (4) 1 and 3 (5) not applicable
If you are willing to use a carpool which of these is important to you?
(1) ride only with friends "(2) preference in parking at the University (3) early Univ. leaving time for carpool members (4) all of the above (5) 1 and 2 above (6) 2 and 3 above (7) not applicable
Please write the approximate time you leave home for UT each working day. using the code in parentheses. If it is generally the same time each day write the code in the top boxes. If it is not. use the appropriate code for each day of the week.
(01) 6:30 - 7:00 am (02) 7:00 - 7:30 (03) 7:30 - 8:00 (04) 8:00 - 8:30 (05) 8:30 - 9:00 (06) 9:00 -11:00 (07)11:00 - 1:00 pm (08) 1:00 - 3:00 (09) 3:00 - 3:30 (10) 3:30 - 4:00
(11) 4:00 - 4:30 (12) 4:30 - 5:00 (13) 5:00 - 5:30 (14) 5:30 - 6:00 (15) 6:00 - 6:30 (16) 6:30 - 8:30 (17) 8:30 -10:30 (18)10:30 -12:30 (19)12:30 - 6:30 (20)not 4pplicable
Using the time codes above please write the approximate time you leave the UT campus each working day. If it is generally the same time each day write tile code in the top boxes. If it is not. use the appropriate code for each day of the week.
(continued) 26

2227 239 114 259
1234
2602 188 115 272 899
(1) 551 (2) 2564 (3) 1001
317 441
1244 558 220
1307
877 3182
2643 785 185
49 20
97 264 750 870 325
1090 178 419
54.69~ 5.87-:; 2.80'h 6.33':;
30.30:-;
63.~5~ 4.61:t 2.82% 6.671:,
22. 04;~
21.61:& 78.39~
71.78% 21.32%
5.02% 1.3J:b 0.54%
2.431 6. 61)~
18. 7r:-"~ 21.79.<&
8.14;;; 27.30.0; 4.46'~
10.49%
11.
12.
Which days of the week would you generally use a carpool to campus?
(l) Monday through Friday (2) Monday. Wednesday, Friday (3) Tuesday and Thursday (4) Other (5) Not applicable
Which days of the week would you generally use a bus to campus?
(1) Monday through Friday (2) Monday. Wednesday. Friday (3) Tuesday and Thursday (4) Other (5) Not applicable
13. Do you expect significant changes in your schedule in the academic year 1974-751
14.
IS.
16.
17.
(1) Yes 13.39~ (2) No 62.30; (3) Unknown 24.3276
If you were to be a carpool driver, how many people, including yourself, could comfortably ride in your ear?
(l) Two people (2) Three people (3) Four people (4) Five people (5) Six people (6) Not applicable
Everyone registered for a class in the fall of 1973 has been included in the student shuttle bus survey. Were you registered for a class in the fall of 1973?
(1) Yes (2) No
If you would be interested in buses, how much would you be willing to pay?
(1) 25¢-50¢/day round trip (2) 50¢-75¢/day round trip (3) 75¢-$1.OO/day round trip (4) $l.OO-$1.50/day round trip (5) $1.50-$2.00/day round trip
If you would be interested in buses, how would you prefer to pay for the service?
(1) nine months (2) twelve months (3) semester pass (4) monthly pass (5) weekly pass (6) daily fare (7) amount deducted from each paycheck (8) not applicable
(continued)
27

18. What is the maximum distance you would walk to be picked up by a carpool, regardless of the weather?
860 21.05% (1) want to be picked up at home only 289 7.07:1, (2) 1/2 block or less 598 14.64% (3) 1 block 578 14.14~ (4) 2 blocks 380 9. 30'~ (5) 3 blocks 298 7.29% (6) 4 blocks or more
108) 26.50~ (7) not applicable
19. What is the maximum distance you would walk to
165 4.02% be picked up by a bus, regardless of the weather?
(1) want to be picked up at home only 395 9.39:;S (2) 1/2 block or less 795 19. 39~ (3) 1 block 923 22.51~ (4) 2 blocks 717 17.49.t (5) 3 blocks 610 14.88% (6) 4 blocks or more 505 12.32% (7) not applicable
'20. What is the maximum time you would be willing to I spend riding on the bus or in a carpool for a one-way trip between home and campus?
289 7.02% (1) 10 minutes or less 1365 33.14% (2) 10 - 20 minutes 1586 38.50% (3) 20- 30 minutes
537 13.04% (4) 30 - 45 minutes 134 3. 25;~ (5) 45 minutes or more 208 5.05% (6) not applicable
(1) 2042 21- If you used the bus, would you still buy a UT (2) 1932 parking permit for your car?
(1) Yes 51. 38 ~ (2) No 48.62%
22. If you answered yes to question 21 why would you still buy a UT permit?
271 12.31't.' (1) need to come to campus alone during day 832 37 .78~ (2) come to campus at night/weekends 545 24.75.:t (3) emergencies might arise 235 10.67~ (4) can only use bus on certain days 319 14.49;5 (5) other
23. I"hat is the maximum time that you are willing to wait if you have to wait either by a bus stop or to be picked up by a carpool?
321 7.78% (1) less than 5 minutes 1933 46.88% (2) 5 - 10 minutes 126R 30.75% (3) 10 - 15 minutes 295 7.15% ( 4) 15 -' 20 minutes
82 1.99% (5) 20 - 30 minutes 27 0.65% (6) more than 30 minutes
197 4.?8.~ ( 7) not applicable
28

IV. Impact Analysis
An attempt was made to measure the impact of this survey by moni
toring traffic flows and vehicle occupancy near and around the University
campus before and after the presentation of carpool .matching data to the
University community. A planned before-and-after modal choice study
had to be dropped because the carpool w~tching information was not
presented to the University community effectively until the end of the
Spring semester. Since many respondents and interested carpoolers had
decided schedule variations during the summer months, it was deemed in-
feasible to attempt to measure impact in this way at that time.
Four major locations around the University were chosen to monitor
traffic flows into and out of the campus. Table 7 identifies those loca
tions and gives preliminary vehicle counts before and after the dissemina
tion of carpool matching information.
LOCATION
1. Southbound on Speedway (north of San Jacinto)
2. Northbound on Guadalupe (south of 26th Street)
3. Westbound on 26th Street (east of San Jacinto)
4. Eastbound on 24th Street (west of San Gabriel)
Table 7
24-HOUR VOLUME Before (3-5-74) After (4-9-74)
3,313 2,838
11,521 11,308
5,137 8,986
6,149 6,578
29

Vehicle occupancy counts were also taken on the above dates during the
A.M. peak period between 7:15 and 8:15 at a location on Speedway just
north of 19th Street. The following infonnation was derived from the
count:
CATEOORY BEFORE AFTER
Percent Passenger Vehicles 90.56 89.88 Percent Trucks 1.04 0.00 Percent Buses 8.38 10.35 Average Passenger Vehicle
Occupancy 1.22 1.39 Average Truck Occupancy 1.00 0.00 Average Bus Occupancy 25.72 17.93 Overall Average Vehicle Occupancy 3.27 3.11
Tables 8 and 9 present these summary data in detailed tabular form;
Appendix III presents full traffic counts,
In general these variations in traffic flows and vehicular occupancy
cannot be considered significant; their statistical validity as measures
of change in travel behavior are in doubt. It is assumed that another
set of data points would have to be collected to adequately assess the
impact of the carpooling program on individual travel behavior.
30
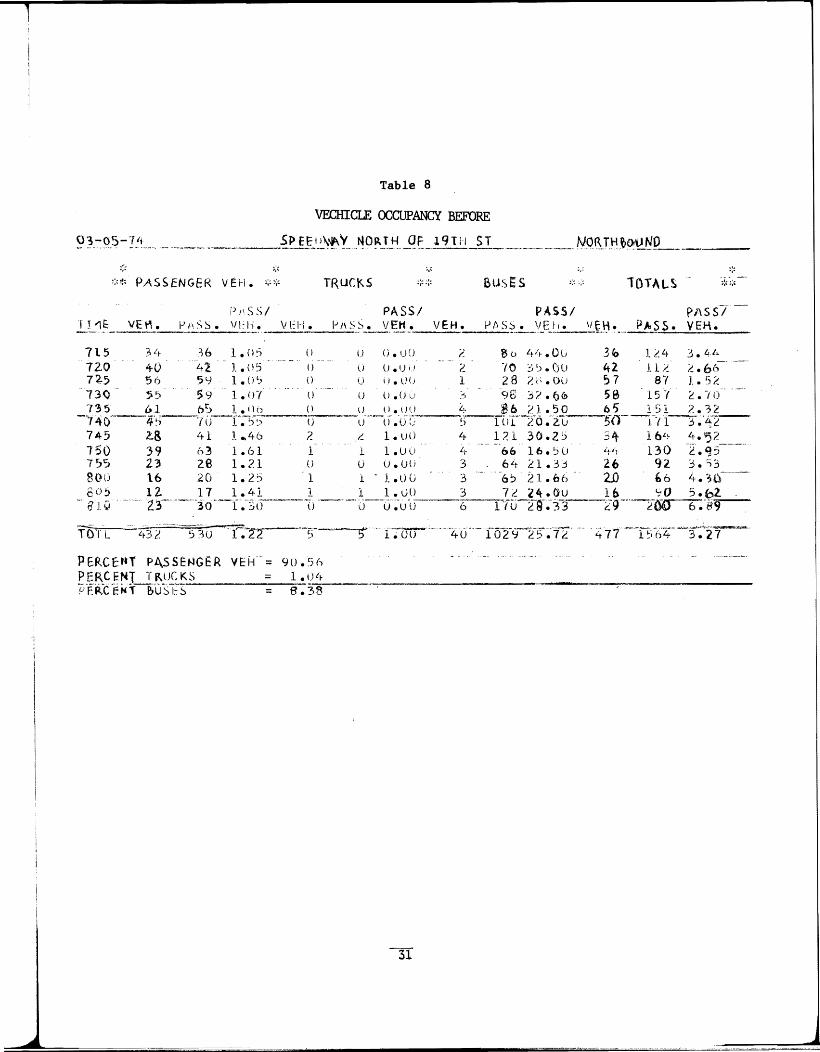
Table 8
VECHICIE OCCUPANCY BEFORE
~ ?:::9.S,- !.~1_._.. __ .. __________ 5P ~J:_I_~\~ y_.~O~_~_~._qE_19 T 112-.1. ____ .. __ . ___ . ___ N9I'\T.tt.~o:.t}J~P __ _
** PASSENGER VEH. ** BusES 10TALS -
j)nSS/ PASS/ PkSS/ PAss7 -r I1E: 'IE"". 1.1 /-\. S S. \IE H. V l:H . ...;.. __ I...I_I\_S_S_._V.E2.!:!_. __ V ..... E_H_.~ __ P_A _S? __ • _VJ_t_1 ._~~.\:\.~ .. ~~~S. VEH.
7 1 5 3 ':..=$ (:, 1 • (l ~) (I u o.uo 2 ~o I.,.l .. • O\J 3~ 11.4 3.4·'-.. 72.0 40 -42 1.0:5 () U U.I) i.I % -/0 ~I).(JU 42 11i:: %.(:,6 72-5 S6 SY 1.0':, n· u il. UU 1 28 ? i:\ .ou 57 87 1.52
..
13Q 55 ,9 l.cn 0 U o.{) : .... ) 98 ::'?()<b 58 15 "( 2. -, 735 61 6S 1.06 (_1 __ _
--140--ij:~)--'tlj-l. :j~) 0 u __ ._u . • _.(!~l ~. $0 21.50 oS 1 ~j 1 ?.32 ,- n)I--XO '-Z0--50'--Cll----;-~ 'ifz--u (l • U ,) ,)
745 ~S 41 1~46 2 t.. 1.1.)0 1.1- 121 30.25 34 1 bl~ _~·52 _. 150 39 63 1.61 1 1 1.Uu 'j- 66 16.'JU <.1. i l 130 Z.q 7~5 23 ZS 1.21 () (j 3 64 21.3j 26 92 :;. r.; 3 800 16 20 1.25 1 1. 3 6, 21.66 2..0 b6 4. ,ll--805 12 17 1.4 3 7~ 24.0u 16 ~o 5. b2. .. 81
1;2.3------30----'C. ..-.--.-.~- 6 1 -ru-t9-~-33--Z9-··2-0l'J6." 8-9 --.

-Table 9
."-~~" ... - --
VEHIClE OCCUPANCY AFTER
SPEEnllAY NORTH UF 1 ';1TH ST
,;::;.:
S 7------------P-ii.sb7 "fIliI: IIEH. PI\SS. VcH. VEIi. Pi\SS. Vf:H. VtH. PASS. VI:H. VcH. PASS. VEH.
H.OO d 25 3.12 .--,,--::-----"'--...:;:,..:---;;- '-60---C6--S4--3-.--;f7--
o O.UO 2 30 15.00 ~5 61 2.44
B'j 1.5 31 2.06 0 00.00 0 (J 0.00 312.06 iL}O 26 43 1.65 0 0 O.uO Z 51 12.7'j jU ~4 3.13
745 32 40 1.25 0 0 0.00 1 75 75.00 33 115 3.48 -7:; 0---['1--45 1. 66--------,0·---U.--;---.00-."'00----,4.---.1 06 i6-~5()--:rl--15f-2;::-~\7---
-/5'j 29 37 1.27 0 0 0.00 4 81 20.25 33 118 3.57
(105 ?g 3!:> 1.25 a 15 11 l.b o
) (II L o P i: RC E I') r P II SSl:"rG-EKVE R - - H 9 • 64 PERC EI-IT TRUCKS = 0.00 PEnt-b,,! I 130St $ = 10. 35
o 0.00 3 53 17.66 88 2.113 o 0.00 2 19 9.1)0 II 36 2.11
o 0.00 32

\1/27113-1:>-1"-13 01/01'174 'J112-?/74 OU19114 03/19174
7U" 815 715 815 715 81S 715 815 715 815 715 815
• o
LA"AII AT IIIIIIII'E
PASS YEH ••
• PAS51
TRUCKS ..' bUSES
~OR1HKOIJND
... •
PASSI
tOUlS
PA~SI VtH PA~S V~H ~.u~ •• ~~oo ••• o.**
• "ASSI
YtH .. ASS vet. ....... "'q ..... $ ...
YFH P~SS V~H •• ua •••••• **ecco
V~H "AS~ VEH o.$ ••• ~~~Vg.oo*y.
2060 21Y4 ' IIl25 1913 2068 2235
21>97 2791 2349 2427 2553 28'10
1.29 "29' 1.27 31 1.28 11 1.26 16 1.23 14 1.29._. _ .. 2.7
44' 41 11 23 17 40
1~51 - 4-1.32 3 1.00 2 1.43 3 1.21 2 1.48 3
SOUTH CwiGRESS AT BRIDGS
111 .. 74 75 S6 69
100
20.25 ~4.66
37.50 111.1>1> 34.50 .n.3)
21U )lUll I lin 1932 20114 2265
NORTHeoUNO
21122 2'1t6 2435 'HIII> 21>1'1 1$0)0
1.3) 1.30 1.32 1.29 1.;>6 l.n
.. PE K'.;C It 'IF tllrL V',L
9ij.43 911.41 VY.~~
fJY.O~
'1't.2) 98.67
1.117 1."" 0.59 0.112 0.67 1.1 'f
0.1 .. 0.13 0.10 0.15 0.09 o.u
• •
. - ... - --'-----:--'nSS-vt..---:"-,RlJCKs---:.·-- 8uses •• • PASSI
VEH "ASS VEH ..O¥.Ob •••••••••
tOtA LS' ... .... ~ ~ .. Ct:·'T nF • i~Tl VOL
.. • TINE PA.SI PASSI • P~SSI
VEH PASS VEH VEH PASS YEH *~~~ •• ¥o~o ••• o*Q. .o* ••• o~ ••• OQ*.
nUt DCG ENf) VEH "ASS Vfl< v •• , TKllto: ~IJS .~ •••• o.* •••• ~o.. O~y~~~O~~~OuO.O ••• O.
lllil7lH 715 815 15<12 2130 1.3io···' ;Ii, 32 1 ;33 7 156 -.. 2?57 1613 ~320 1.43
12-11'-73 715 815 1709 2273 1.33 9 11 1.22 7 200 2A.57 1725 2484 1.<44 1)l/0~n4 715 1115 15(11 201)4 1.38 22 5U 2.27 8 195 24.37 1531 2329 1.52 0112'lII7" 715 815 1272 1691 1.32 16 21 1.31 10 22b 22.80 1298 19"0 1 .... 9 02119174 715 815 un 2033 1.31 17 22 1.29 9 207 2~.00 1577 221>2 1.43 03!19174 __ .71t . .!I.~~ . _1~9L.H6.~. _!.3.L._P __ 28 1.21 ~ 2211 2e.5!!. ' 1723 2622 1.52
-~-.
lAMAR BlYO AT W 19TH ST SOUTHBOUND
.. ···'·'sS-vE'i'---."--"TR·ueK5 - •• - "--1l0seS'---". • • • • •
TIllE PASSI PASSI PAHI nATE ·6€G END VEH PASS VEH VEH PAS. YEH
PASSI VEil PASS YeH • ••••• 0 •••••••••
VEH PA~' V,"
11/27/7) 11.-1~-n 01/0;;174 01129174 OU19174 113/19114
715 715 715
'715 715 715
815 815 815 815 815 815
~~¥ •• $~~O ••••• oo. ..Q •••• ~ ••• Qo ••
1727 2149 -1.24'·' ··~··-lu . 2.00 1547 1931 1.24 9 11 1.22 16(14 1921 1.19 8 1~ 1.87 1516 1858 1.22 9 14 1.55 1540 1899 1.23 7 10 1.42 1469 __ 1811. ___ ~ •. ~.!._ .J.~_. __ .~~ _ 2.10
0- - 0 o 0 o 0 o (I
o 0 o 0
0.00 0.00 0.00 0.00 0.00 o.o~
.qO~ •• ~e~nft*$.~~~
1732 1551> 11>12 1525 1547 1479
2159 1'142 1"36 lb72 1909 1892
l.lio 1.1.4 l.ll) 1.22 1.23 1~27
REO RIVER NORTH OF 26TH Sf SOUTH80UND
nATE
1112-173 12-l0-H »1/0<1174 oll3t'/"4 ,n/20/74 l'- /2 91!4
.. - ..... ·-lJTSS·V"K·--•• ·--yRuClrs .. ·· - .... --·QuSES .. . . . .. .. TillE
lIeG EIliO
715 1115 715 815 715 815 71S 815 715 815
791 660 1>21> 910 809
.. 71S 8lL_82~.
1014 IIll 041
1238 1148 H2O.
PASSI 'ASSI VEH VEH PASS VEH
'1.30·"-'-'6"'-' . II -1.ll 1.31 6 6 1.00 1.34 :; !> 1.00 1.31> 7 II 1.14 1.29 6 II 1.33 1 •. 3.~_ 1.00
PASSI VEH PASS VEH .O.O.O~$ ••••• *.O
10 325 3? .50 ; 94 111,80 , 73 1<.1>0
30 323 10.71> 13 31>2 27.84
.J_~_ ~29 29.~O
VEHICLE OCCUPANCY SUrd4ARY REP()RT
TUTALS' •• •
PASSI IIEH PloSS VEH
.o~.o.o.oo •••• oo~
907 1367 1.&9 671 971 I ....... 1>36 919 1.44 947 1569 l.bS 9011 1518 1.67 ~43 1~55 1.72
E_ST 7TH Sf AT CHICON ~eST\lOUNO
------_._._._- ...
• TIME
nATf 8EG HlO
-. PASS vEH ..... ' •• '-'TRUCKS" .. --- IIUSES
• • PASSI
VEN PASS VEH veH PASS PASSI
veH VEH PASS
•• TUTALS .... • •
PASSI PASSI VeH VEH PM.S VF.H
~* ••••• O$OO •••• ~o •••.•• ,Ul........ : •••. *.(::1i):Cto ••••• ~.
1172"/73 -'715 --' 815 12-Zo-73 71" 815 01/09/74 715 ii' "1130174 715 815 • 01/20/74 715 815 03/2M.". 11'._.8U
114~ ·-I77l--·I". 55 .... -Si.--7Y'··1 ;2Ii"-'-2 '-"-1,--
717 l22b 1.51 3S ~4 1.54 Z b
770 1106 1.54 33 411 1.45 I 5 Al8 1239 1 .... 9 311 44 lots 0 l> 761 1109 1.45 43 52 1.20 .. -- 1 3
_ TH1, .•• 1.1<\6 ..... 1.4L .4~ _1.1 ._H!._I!_. 0 ..
33
2.00 '1200 1847 1.53 3.00 8l'o H~o 1.57 5.00 804 1239 l.S4 0.00 806 12K3 1.48 3.00 805 11M 1.44 0.00 832 1217 1.46
~a.07 1.411 0.43 ~~.07 0.52 0.40 ~8.04 1."3 0.~2 '17.99 1.23 0.77 9&.35' 1.07 0.~7 98.21J 1.33 0.41>
P&KtE~T OF • tulL VUL •
VEl< TRIJCO: .. uS .O~l)Jr¥.OO*"# •••• oo ••
99.11 99."~ 99.50 99.40 99.54" 99.32
0.21$ 0.57 0.49 0.59 0.45 0.1>7
0.00 0.00 0.00 0.00 0.00 0.00
PEKe.,"T OF • tOlL "tIL •
VEH hlltK bllS .~OOu •• ~O •• 04 •••••• ~
98.01 0.74 1.23 98.3~ 0.<1" 0.74 911 .... :z 0.711 0.711 91>.09 0.73 3.16 97.90 0.66 1.4' 97.98 0.71 1.)0
"F.Kee·'T (IF .. tUlI. ~,)L "
VtH TK"'« IIIIS
95.16 ".bl> 0.16 95.4' 4.2~ 11.24 'is.77 .... 10 o.U 95.c-l. 4.38 11.00 94.53 S.l<\ 0.12 94.59 ,.40 0.00

v. Proposed new routes for service to the University Community
There were many respondents to the initial survey who expressed great
interest in extension of existing bus service as a viable transportation
alternative for themselves. Only preliminary recommendations for such
services can be made at this time, and no specific system is considered
as the actual operator of these routes. Areas of sufficient density or
concentration of interested personnel were identified from the survey as
possible trip-generators but no recommendations are made as to actual
number of vehicles in service, headways or service characteristics.
Faculty and staff members living in areas already served by the
UT shuttle bus system can use that system by paying a small semester fee,
so no new routes will be added in those areas. East Austin between Town
Lake and Manor Road has very few people interested in a bus system, so
no new routes will be devised for this area. Southeast Austin, except
for the already served Riverside Drive area south of Town Lake and east
of IH 35, also had very few persons interested in buses, so it likewise
is being excluded.
To serve the area west of IH 35 and south of Town Lake, two routes
have been devised as illustrated in Figure 2. The area west of IH 35
and north and east of the Colorado River, in the northwest and west
parts of the city has two proposed routes. The area north of the muni
cipal airport and south of US Hwy 290 has one route.
These five routes should be able to reach the majority of the faculty/
staff persons who presently do not have access to the UT shuttle bus system
but who are interested in bus transportation to and from campus. Part II
34

of this report gave a detailed analysis of the service characteristics
desired by respondents on such bus routes, including waiting and riding
time, cost per round trip, and method of payment.
35

MAP PREPARED BV THOMAS W. RIOUX
MAP & STREET CUIDE
OF
AUSTIN, TEXAS AND
URBAN AREAS
c , I
7530
~ r:~====~~~~ ~;::::::::::::::!
6600

BIBLIOGRAPHY

Bibliography
An Alternative to Car Pooling. Research Report for the Executive. Research
Institute for America, New York, pp. 5-6, January 7, 1974.
Describes the 3M experiment in promoting subscription buses and its
. relevance for other small private bus companies.
A Proposal for a Demonstration Project: Seattle-Everett SMSA Carpooling
Program. City of Seattle, Washington, February 1974.
Outlines a five-point demonstration program for promoting car-pooling
in the metropolitan area, with estimates of costs and timing.
Baltimore Federal Executive Board Carpooling Pilot Project. U. S. Depart-
ment of Transportation.
A brief but comprehensive report of a carpool program conducted in 1973.
BRYARS, CRAIG. Let's Try Pooling It. Highway User, pp. 4-7, July 1973.
Discusses past experiences in carpooling and reco1lll1ends it as a strategy~\ I
for reducing gas consumption.
Car-Pool Match-Up Part of the Tri-Met Plan, Passenger Transport, p. 4, January
18, 1974.
Reports metropolitan-wide computer match-up of "citizens troubled by a
shortage of gasoline" in Portland, Oregon. Total cost--$250,OOO are
federal funds.
Carpools and Buses: Two Ways to Cut Commuting Costs and Ease Traffic Con-
gestion. Highway Users Federation.
A pamphlet explaining and promoting the use of carpools and buses.,_"\
C01III1ent: What Carpools Can Do. Highway User, p. i, September 1973.
Reviews findings of a recent study by the Highway Users Federation and
concludes that carpooling offers a practical near-term substitute for"'2\-.
mass transit. \
37

Computerized Carpool Matching of FHWA Headquarters, U. S. Department of
Transportation.
A report on a carpool program conducted in 1972 in Washington, D. C.
It contains information on conduct of the program, and a transit poten-
tia1 analysis.
DOT Pushing Carpools as Energy An$wer. Passenger Transport, pp. 2, 4, Janu-
ary 18, 1974.
Reports ;computer matching program developed by Federal Highway Admin-
istration to assist employers in the use of carpools. May 1, 1974,
listed as target date to have matching programs in all urbanized areas
of 50,000 or more.
FISHER, STEWART. An Energy Conservation Program for San Antonio! Bexar
County. City of San Antonio, San Antonio, 1974.
Proposal for a county-wide program to optimize the use of existing
transportation facilities and shift passenger travel to high occupancy
vehicles through car pools, bus pools, and park-ride express bus
service.
~Fourteen Tips on Carpooling. Portland Metropolitan Area Carpool Project.
A pamphlet describing the advantages of carpooling and fourteen common
sense tips for carpools.
HOFFMAN, RONALD G. :;f'
Department, St. Paul, 1974.
Carpooling: The Minnesota Experience. Minnesota Highway
Describes the Highway Department's experiments with carpooling in the
Twin Cities area.
How to Make Car Pool Work at Your Company. Portland Metropolitan Area Car-
pool Project, February 1974.
A "how-to" manual prepared for employers to facilitate their partici~
pation in the project.
38

Instant Mini Mass Transit: Carpooling on the SFOB. Tool Bridge Administration,
San Francisco. 1974.
A public relations release promoting carpools by describing the time and
money savings available to car pools on the San Francisco-Oakland Bay
Some Notes on Computerized Carpool Matching Experiences.
North Carolina A & T State University, Greensboro, 1974.
A pilot project to assess carpool matching programs in Greensboro,
North Carolina, using the Federal Highway Administration computer pack-
age. The report contains extensive comments on the experiences of the
project, including costs.
KIRBY, RONALD F. and KERAN V. BHATT. Guidelines on the Operation of Sub-
scription Bus Services. Working paper, Urban Institute, Washington, D.C.,
'February 1974.
Alternative approaches to organizing and operating subscription bus
services are discussed and case histories are reviewed.
LAUGHBON, RICHARD W., Director for Services. Correspondence Concerning
Ongoing Projects. Department of the Army, Pueblo Army Depot, Pueblo,
Colorado, July 9, 1974.
A brief description of the staggered work hours and carpooling programs
at the Pueblo Army Depot.
MAIER, DEL, General Services Administrator. Correspondence Concerning On-
going Projects. State of Nebraska, Lincoln, July 22, 1974.
A letter providing brief information on a carpooling program in Omaha.
~C CANN, HOWARD. The IRS "Share a Ride" Program. U. S. Department of
Transportation, Washington, D. C., 1974.
A description and results of an informal locator board' carpooling pro-
ject in Austin. 39

Miami Bus-Pools Cater to Auto Users. Passenger Transport, p. 4, January 18,
1974.
Description of express bus service to large companies, subsidized by
them at the rate of approximately $40 a day.
People are First. Northern Virginia Transportation Commission, Annual Report,
1972-1973.
Analysis of NVTC 1972-1973 projects, including busways, traffic surveil
lance, computeride (a program to encourage carpools and bus pools), and
dial-a-ride. Contains performance results to date of Shirley Highway
busway and other area buslanes.
POKA, ERVIN and MORIN, DONALD A. Commuter "Bus Clubs" Serve the Suburbanite.
Highway and Urban Mass Transportation, pp. 5-7, Fall-Winter 1973.
A brief description of the Reston, Virginia Bus Club and the beneficial
effects of bus clubs.
Portland Metropolitan Area Carpool Project: Progress Report. March 31, 1974.
A progress report evaluating the project's efforts and discussing the
project's direction for its remaining four months of operation.
Portland Metropolitan Area Carpool Project: Weekly Progress Report.
April 1, 1974.
A memorandum reviewing the status of the· project.
PRATSCH, LEW. Carpool and Buspool Matching Guide, Third Edition. U. S.
Department of Transportation, Washington, D. C., November 1973.
This report describes in detail many successful pooling programs and
discusses carpool and buspool considerations.
Study Shows Preferential Car Pool Lane Working Well. Auto Club News Pic
torial, p. 15, August 1974.
An article describing the operation and benefits of a special freeway
ramp for high occupancy vehicles in the Long Beach area.
40

The "Poof It" Work Kit. Highway Users Federation for Safety and Mobility,
1974.
A "how to" manual for carpool projects. It contains information on
types of pools, organization motivation, public information and promo
tion, matching and legal aspects.
User Documentation for the FHWA Carpool Matching Program. U. S. Department
of Transportation, Washington, D. C., 51 pp., January 1974.
A complete description of the Federal Highway Administration computer
program for carpool matching.
VOORHEES, ALAN M. and ASSOCIATES, INCORPORATED. Buspools. U. S. Department
of Transportation, Office of the Secretary, Federal Highway Administration,
and Urban Mass Transportation Administration, January 1974, 18 pp.
Incentives to Carpooling. U. S. Department of Transportation,
Office of the Secretary, Federal Highway Administration, Urban Mass Trans
portation Administration, January 1974, 24 pp.
This report discusses in detail cost-related, travel time, convenience,
intangible, and organizational incentives to carpooling.
Legal and Institutional Issues of Carpooling. U. S. Department of
Transportation, Office of the Secretary, Federal Highway Administration,
Urban Mass Transportation Administration, January 1974, 24 pp.
A report designed to aid state and local program administrators in
understanding and responding to legal and institutional issues that
arise from carpooling. Legal, security, compensation, and insurance
isues are discussed in detail.
41

Manual Carpool Matching Methods. U. S. Department of Transporta
tion, Office of .the Secretary, Federal Highway Administration, Urban Mass
Transportation Administration, January 1974, 25 pp.
This report describes the three basic types of manual matching methods,
general or common system elements, and application of manual matching.
________ • Organization for Carpooling. U. S. Department of Transportation,
Office of the Secretary, Federal Highway Admipistration, Urban Mass Trans
portation Administration, January 1974, 23 pp.
This report discusses four current carpool organizational efforts and
establishes guidelines for local and state organization.
Review of Matching and Software and Procedures. U. S. Department
of Transportation, Office of the Secretary, Federal Highway Administration
Urban Mass Transportation Administration, January 1974, 27 pp.
An inventory of the status of carpool software as of January 1, 1974.
It describes the status, capability, documentation, system management,
and limitations of each program. In addition, the name of a contact
person is provided.
Transit/Taxi Coordination. U. S. Department of Transportation, Of
fice of the Secretary, Federal Highway Administration, Urban Mass Trans
portation Administration, January 1974, 26 pp.
This report discusses potential opportunities and problems facing
transit and taxi operations which may result from a carpool program.
Strategies and guidelines for coordinating carpooling and integrating
transit/taxi interests are outlined.
42

Vanpools. U. S. Department of Transportation, Office of the Secre
tary, Federal Highway Administration, Urban Mass Transportation Adminis
tration, January 1974, 13 pp.
An overview of vanpooling presented in non-technical terms for those
interested in starting a program. The report describes the methods,
benefits, costs and problems associated with implementing a vanpool pro
gram.
WEBSTER, DANIEL, JR., Director. Correspondence Concerning Ongoing Projects.
Maine Department of Transportation, Augusta, Maine, July 24, 1974
A letter announcing that carpooling projects have just begun in the
Augusta and Lewiston-Auburn areas.
43

Appendix I
CARPOOL COMPUTER PROGRAM DESCRIPTION
Software Status Inquiry Date: 02/15/74
First Used: February 1974
Current Version: 1974
Installed at: One location
Language: (ANSI) COBOL
Computer: 1MB 370/155
Core Required: l20K bytes
Tape or Disk: Sequential Access
Time Required: 10 minutes
Test Case: 413 matches
Capability Summary
Geo-coding--Uses a system of traffic zones to identify the horne zone.
Matching--The program will match participant within traffic zones and
time ranges. The program is a single destinations program.
Reporting--A master list--one for each traffic zone will be printed.
An individualized, one for each person in a traffic zone, list is
also produced and mailed to each participant.
File Maintenance--Updating of the master file for additions and
deletions is available. A request list for selected traffic zones
can be obtained.
System Management
The system is unique to the University of Texas and has been used only
at the University of Texas at Austin.
44

Limitations
The program is limited to a single destination. The program requires
l20K bytes of core and the only access available at the present time is
sequential. Documentation for the. system is not available.
45

APPENDIX II
Traffic Control Zones in Each Census Tract
Census Tracts
0001 0002 OOOJ 0004 OOO~ 0006 0002 0008 ~
Zones 1500 2400 2600 2500 2420 2100 0100 4000 1520 2410 2610 2510 2430 2200 2000 4010 1600 2720 2620 2520 2530 2210 2010 4020 1610 2730 2630 2550 2540 2220 2020 4030 1620 2740 2640 2560 2230 20)0 5000 1700 2750 ;650 2650 2240 2040 5010 1710 2760 2710 ~11~5 2250 2050 5020 1120 2800 2910 * 2120 2300 5310 1730 2810 2920 000 2310 5320 1140 2820 2930 4010 2320 5330
2830 2940 4020 2330 5340 2840 2950 4030 2340 5400 2850 2960 4040 5410 2860 2970 4050 5420 2810 2980 5430 2880 2990 5440 2890 3000 5450 2900 4060
4070 4080 4090 4100 4110
~2700
------------------------------------------------------------QQQ2 0010 0011 0012 IJ.Ol IJ.02 0014 l~.Ol
5030 5130 0000 1020 7100 1000 6000 3200 5040 5140 1000 1030 1110 7010 6010 3210 5110 5160 1010 1040 7120 7020 6020 3220 5120 5210 5050 1050 7130 7030 6030 3230 5200 5220 5100 1060 7140 7040 6040 3240 5240 5230 5150 1070 7150 7050 6050 3250 5300 1080 7150 1060 6060 3260 5350 1110 7070 6010 3210
7180 7080 6200 7600 7100 1910 1110
1120 11JO 11 0
~~gg 1110
46

1~.O2 1~.02 16.01 16.02 12·01 12. 02 18.01 18.02 I{s(..!o
3100 3010 1100 1230 1800 7920 1900 4510 3110 3020 1110 121W 1810 7940 3400 4520 3120 3040 1120 1250 1820 7950 3410 4530 3130 3050 1130 1260 1910 7960 3420 4540 )140 3060 1140 1271 9000 8220 3430 4550
• 3150 3070 1200 1272 9010 8230 3440 4600 3300 3080 1210 9020 8240 3450 4610 3310 1220 9030 8250. 3600 4620 3320 1300 9060 8260 3610 4630 3330 1310 9070 8270 3700 4700
1320 9080 3710 4710 1330 3720 4800 1340 3730 9110 1400 3740 9180 1410 3810 9190 1420 ~090 1430 120
91~0 91 0 9150 9160 9170
~9100
~------------------------~---------------------~------------. 18.0J 0019 0020 21.01 21.02 0022 2J.Ol 2J.02
3500 7200 7620 3030 4130 4410 6080 6310 3510 7210 7630 4120 5500 5800 6090 6320 3520 7220 7640 4200 5510 6100 6400 3530 7500 7650 4210 5520 6110 6410 3540 7501 7800 4220 5530 6120 6420 3550 7810 4300 5600 6130 6430
7820 4310 5610 6140 6500 7830 4320 5620 6200 6510 7900 4330 5630 6210 6520 7910 4340 5700 6222 6530 7930 4350 5710 6223 9310
4400 5720 6224 4430 5730 6225 4431 5740 6230
5750 6301 5751 63(Q
6303 -------------~-----------------------------~--- 6 4.--------.2J.02 0024
6600 6710 6900 7840 7841 7850
47

Appendix III
7;30 "7 /2.'1 10(; q'Z. 1: 45 1..3 8 , 12. 1St;, ,37 HR. TOT. ,~/{) ?-13 .; t) J7r
~8~:_OO ____ ~+--+~_1Q!l~~ __ ~~h~O~V' ~~ __ +-~/~/J~.~~~-+~/~~f+-__ +-__ +-__ 8:15 p,qi lit: 7'1 (3..3
8:30 1:1 ,.;. 17. 5
8:45 144 HR.. TOT.
9: 00 ;,;/ '"I 4(,./
11:00 i'11 70 z
/3(,
:: ;(7
l~ 'I (/
r:! ..... " .. , .
1:00 l'K 143 11.";..J7'-11--+_· _+-...j..::J'.;..':..,:'1-l' I--+---ll--+.!::..Jt::;:"':-,I+-_+_-+-_ 1-2-:-00---I--+--I--+..J.l"':::':::::·p+--+--f--r;;~ 1- "i '/. 1,/)
3:00 1.'1t:; T7/1 3:r'"J :/(0 $ ,TOTAL
!4;00
I
:4:30 : :~4:~4~5 ____ ~+--4 __ ~4~'~'~~~I--~~~q/~~ __ +-~/~1~~~-+ __ 1-~c:-,/~';-r __ -r __ -r---
J 4·, <I'l? lId,
1./(''17 IXIX:X 1.32 X ><1><
IXX>< ~ .... --------------------~-------------------48

•
VEHICLE VOLUME COUNT
. Locllt iO,n 14.0 C?~~ P9. ~~~ I/~. 7l.","/'/t: F/p:~~.~~~~~f~~rSr" '" Stllrting
Time H
7:00 PH
8:00
9:00
10:00
11:00
12:00 H
1:00 AM
2:00
3:00
4:00
5:00
6:00
Sub-total
24 Hra. otal
24 Hr •
. 24/12 ,
FroD' North On_ ... 'i:.o ... ,,_du,(q/L L S R 'T
I/S"J . /(J
//1 51' (J 32-/3 f l.-
/ 8 ~O
From South From Ellst On (/ /.I."? r(,., /'1' ~I!. On ~c9 1",1' J)
L S R T L S R T
.5'Yz.. LL,)J
~tJ7 31X £}Z ~i .. ? 'lIZ ~:;>W;:;
610 [J,;) / )30 /11 /ct; ·/3 ..s/ ,;;3 /2- /f) 1/ J
rJ8 :J~ )7 It..?
49
'i" D~e I/~ 9·] , , ._'1") ('6"
From Weot Total Ork)"n./~Q;''' ,..>,'/ Entering
L S R T NS EW T
1//0 ]JJ JJ; /t( /'/0 gS" ;;;a J'/ 1/ b
/7 72

,
VEHICLE VOLUME COUNT f~
Loc:ation {~,?:. ~C~l/~~I1/'~t.~~/,~·i:l'f·~~Tw,,~~_Sh,eS~~_,}~ Z Date 1/- Y'-?JL StarUng From North From South From East From West ;11./1-1 Total
Time 0. C:"'l." \"'l" .":1 J, Or ~II ."," ""'~ Or '"_'? 1- t;' Wr-V J,,''''('?/''',j Enterln • H L 's R
, T L S R. T L S R. T L S R. T NS EW T _.
I 7:00 AH 1)9 ,3.'1 ~ '11 i 7:15 to/ 71! j;;l 20 ( 7:30 C;j IJol ~/S 1/37" I 7:45 //3 /,;7/1 }y l'Ir !
i HR. TOT. ~'/Y 3{-,zi ('--,73 ,/'13 8:00 '2 /","'31 1I}2 1/..55"" 8:15 76 fb I 1/.32- /;1..3 8:30 I/D0 /18 II )'3 ;)0':5'
8:45 1Y5' /30 106 V{,b HR. TOT. 13fLt 1l/01i (bY 1-/// 9:00 1/;3 '/5"bl If?;' - t-I t.j 1 10:00 /-.53 57? jr;. ,:. .... ', ,/ 31J 11:00 /,)eI )z 2..1 1t17b .5DL
. I/J7 6131 s}C '//? 12: 00 N
1:00 PH I-?h ))JI 9.3 :~jj
2:00 J -? z... ;?O( lS/~ 3Y1 3:00 J)) XD/ ~fi \.:r(>..~
TOTAL 110::' III/V :;'(~I G ')/:. '0
4:00 33 1/9/ Is2 Rf 4:15 rJ') )08 /32. ' 9..3 4:30 3r[- 21,7 I/W /,)0 4:45 'IS h./0b l/9b /30 HR. TOT. /3/ Cf7~ /y '1" -. . ";', '-5:00 tfV I3~Y 180 /IS-5:15 35' ~8.? ldL /D6 5:30 1/f }J..3 /28 JD~ 5:45 .£..3 190/ /b3 9'9 HR. TOT. I }z, If),), ! 1-" • ,'7 ~
j )-. . '/
6:00 , .)13 (1)0/ If: <'7 I/i
~~t~f' ?J,?j ~-')ol ': 1/(/ iSl/) / 1 ~ Hr. .}, -:J 1?.3 .1 ,?}o L ?I'-/ ...:.:-().::J I X >< >< 24/12 r J.:} 9 /,"'-,..:::....;., /,3 0 /.~I X >< r>< 24 Hr. d23a //d£) 6 d7d)(o p;;sJ8 >< D< I><
50

VEHICLE VOLUME COUNT
Locatlon Pf·~~l.ltl:l I1,SIo,nJAt:'.·'!.!.'2. , Weather Date ,'1- ~--'14
Surtlng From North From Sout~. From East. 'II. o. W.O, ~'.' Tlme ~(;'OWAY On IJ .. _;i rl··~·1 ' • .,.I(to On ;: .' (".. '~J , I' (I" EnterS np;
H R T L S R T I 1.1 S s R _T F.\l T
",,,I . 1:00 PH ~t:.(' '/0$
8:00 ;, (..0,/1 l'lr 3-ZZ
9:00 14 l~ "3 :c'oz.. ~o7
10:00 c" C/.~.:i I /7:> /// , -f 1
I i 4(' 1 I 'It;. i 11:00 '1/2 I / {I
112:00 K 4J. .5f~· I !/? 'i':.r ; 1:00 AK= 10 1(.5 II "i, -; 1/3 i2:00 C' .- :: ,./ I ,.~ 'ZI
: 3:00 :.\ 121.. II I ..3 7
·4:00 I 2-1../ I ~ /a
,5:00 10 .... . 17, .""';, t ... . j
6:00 ,1.7 f' - sa ,:..
•
Sub-total 7/('! .rtffs /"/.3(,. /.)'(1 Z-24 Hu.
~.31.3 1152./ <!3'i v,./".,~ Total 24 Hr.
3aJ'~ I/S,/ '::/3'/ /.,/(/ '1 r><rx - IX I>< 24/12 r I.~a I, tjJ /'32- 1.3'Z-
•
51

•
eliminated from bus service, since 73% of those interested in buses are
also interested in carpools.
a5 -- 2388 people interested in bus or carpool or bus only; NE, NW, W - 541
people in shuttle served zones - 392
933
Shuttle buses already serve zones with NR + SR: 6040, 6050, 6200, 6301 6302,
6303, 6304, 6222, 6224, 6225, ~030, 2040 • 1i .
ER + MS: 1230, 1240, 1271, 1250, 1260, 1272, 1120, 1080, 1040, 1050, 1060,
1070, 1130~ 1140, 1010, 1020, 1000, 2000, 2020, 2010 - 134
IF: 2420, 2430, 2700, 2620, 2710, 2630, 2910, 2920, 2980 • 82
S2

• J
,
CR: 4200, 3030, 2950, 4090, 2650, 2640, 2610, 2600, 2550, 2560, 2520 - 48
EC + we + IC: 2320, 2310, 2340, 2330, 2300, 2250, 2220, 2210, 2240, 2230,
2100, 2200, 2120, 2110, 2510, 2500 • 54
~ in shuttle served zones
S route--7100, 7110, 7140, 7210, 7500, 7120 • 68 people 27 minutes; if add
2nd loop of 7920, 7968, 8240, 7950, 7940, 7930, 7910, 7950 • 53 people,
Total of 121 people • 45 minutes
WL route--7220, 7300, 8310, 7510 = 40 people 7310 has 33 people, but roads
too bad - narrow, hills, poor paving - no buses 35 minutes
S3

l
Council for Advanced Transportation Studies
THE UNIVERSITY OF TEXAS AT AUSTIN