boiler efficiency workshop - for homes - enbridge … hours 8,000 hr/yr boiler hours 5,000 hr/yr...
TRANSCRIPT

Boiler Efficiency Workshop
May 30, 2013
Presented by:
Aqeel Zaidi, P.Eng., CEM, CMVPEnergy Solutions Manager
Questions and follow-up should be directed to:[email protected]

Safety Moment: Heat Stress
2
• On hot days it is possible for anyone to be susceptible to heat exhaustion or in severe cases heat stroke
• The ambient conditions in boiler rooms are generally hot and the heat gets worse in the summer.
• The ambient temperature could easily reach over 100°F
Avoid heat stress by:
• Drinking plenty of fluids
• Increasing the frequency and duration of rest breaks
• Watching out for each other

Safety Moment: Heat Stress
3
• During hot days it is possible for anyone to be susceptible to heat exhaustion or in severe cases heat stroke
• The ambient conditions in boiler rooms are generally hot. It gets worse in the Summer.
• The ambient temperature can easily reach over 100 F
• Drink plenty of fluids
• Increase frequency & duration of rest breaks
• Watch out for each other

• Steam Basics
• Combustion basics
• Definition of boiler efficiency
• How to identify and quantify combustion improvement opportunities
• How to identify and quantify heat recovery opportunities
o Blowdown heat recoveryo Combustion air preheatingo Feedwater economizerso Condensing economizers
• Practical exercises
4
Today’s Workshop Will Cover:

5
Cond.Tank
Make-UpWater – 50%
CondensateReturn – 50%180 °FDEAERATOR
8 psig
Boilers: 3 X 500 BHP Plant Operating Hours: 8,000 hrs.Natural Gas Cost: $1.1 million/yr. Each Boiler Runs For 5,000 hrs.
Building our Workshop Steam Plant
Natural Gas4.4 million m3/yr.
Total Steam15,000 pph Process SteamSat. Steam @ 100 psig
Stack Flue Gas
Blowdown4%
DA Steam10%
BoilerFeedwater
Boiler 1 Boiler 2 Boiler 3

6
Today’s Objective
Improve boiler and steam plant efficiency enough to reduce natural gas (NG) costs by 20%
Boiler Plant Specifications:Number of Boilers 3Boiler Rating 500 HPPlant Hours 8,000 hr/yrBoiler Hours 5,000 hr/yrNatural Gas Cost (0.25 $/m3) $1.1 million/yrRated Input per Boiler 20.9 MMBtu/hrAvg. Firing Rate 50%Hourly Gas Consumption per Boiler 10.5 MMBtu/hr

To achieve our 20% savings objective, we must:
1. Identify savings opportunities
2. Quantify the opportunities
This will require a review of some basic principles of steam and combustion.
0% Saved

Basic Concepts of Steam
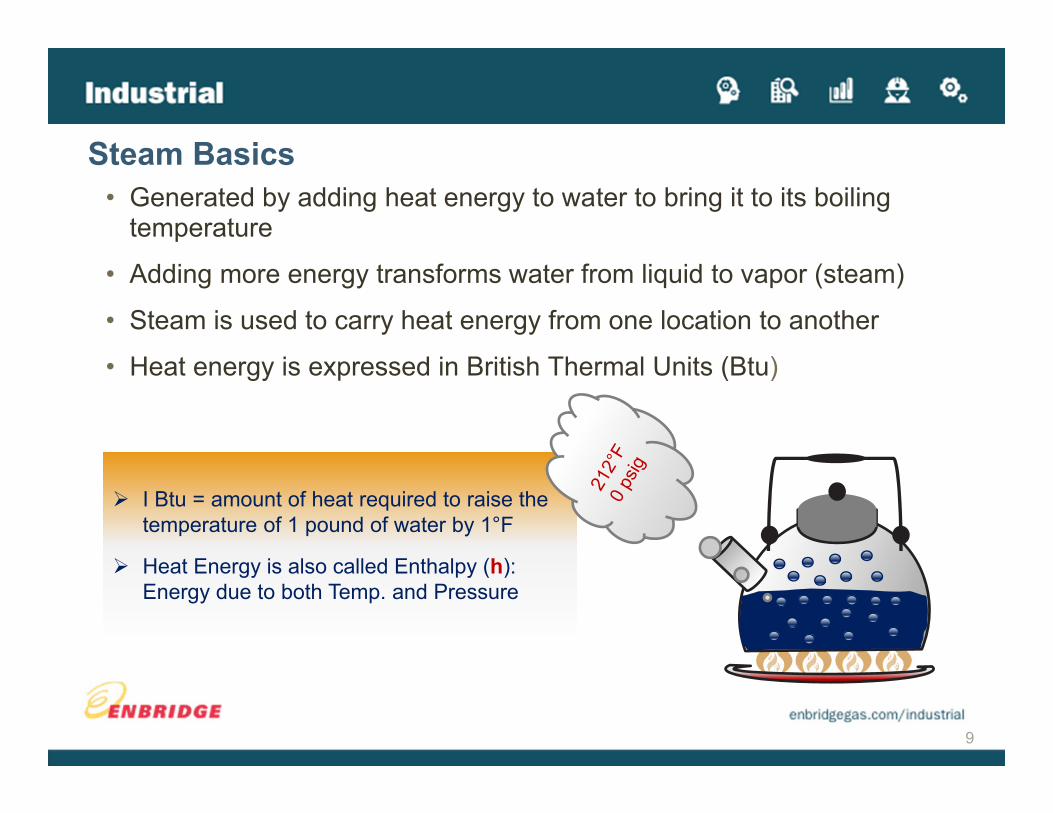
• Generated by adding heat energy to water to bring it to its boiling temperature
• Adding more energy transforms water from liquid to vapor (steam)
• Steam is used to carry heat energy from one location to another
• Heat energy is expressed in British Thermal Units (Btu)
9
I Btu = amount of heat required to raise the temperature of 1 pound of water by 1°F
Heat Energy is also called Enthalpy (h): Energy due to both Temp. and Pressure
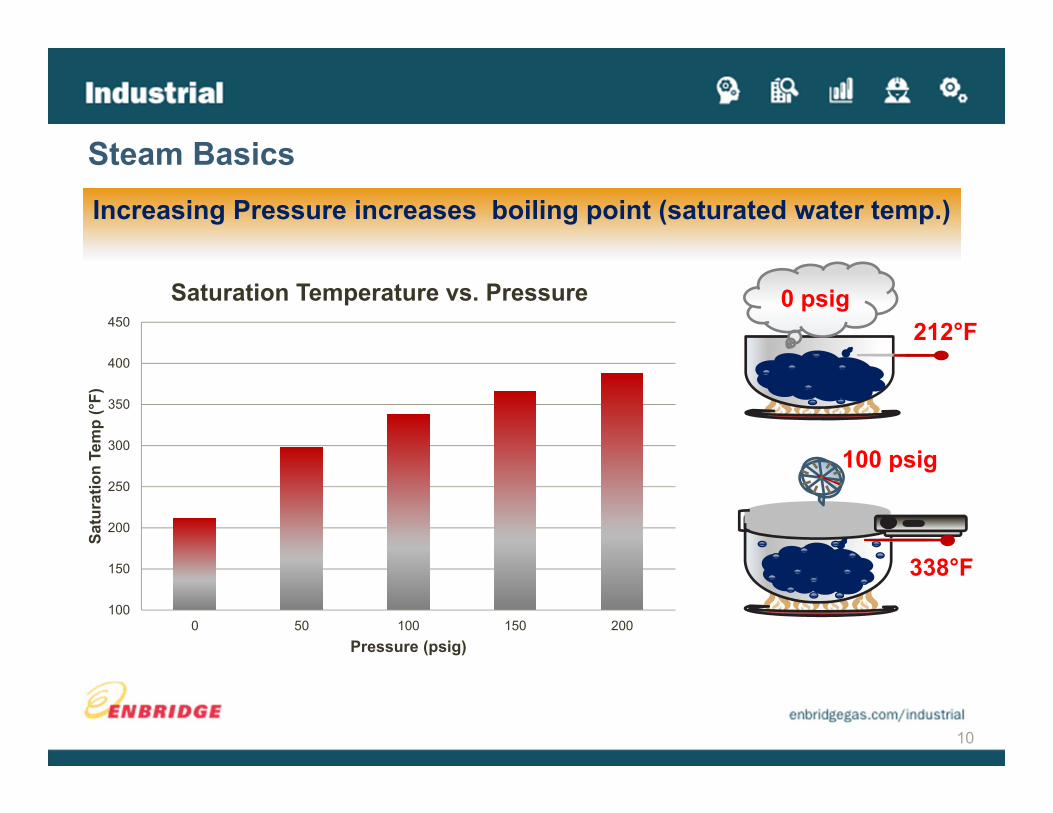
Steam Basics
10
Increasing Pressure increases boiling point (saturated water temp.)
0 psig
100
150
200
250
300
350
400
450
0 50 100 150 200
Satu
ratio
n Te
mp
(°F)
Pressure (psig)
Saturation Temperature vs. Pressure212°F
100 psig
338°F
Steam Basics

• Heat required to make steam has two components:o Sensible heat (Btu/lb)o Latent heat (Btu/lb)
• Sensible Heato Amount of heat required to raise the temperature of water from
32°F to its boiling point (saturated water)
o Adding sensible heat raises the temperature
o It can be detected with a thermometer
o Sensible heat of water at 32°F is taken as zero
11
Steam Basics – Sensible vs. Latent Heat

12
0 psig212°F
100 psig
338°F
More Sensible Heat is required to boil water at a higher pressure
1 lb of saturated watercontains 180 Btu
1 lb saturated watercontains 309 Btu
Steam Basics – Sensible Heat
0
50
100
150
200
250
300
350
400
0 50 100 150 200
Sensible Heat vs. Pressure
Sens
ible
Hea
t (B
tu/lb
)
Pressure (Psig)
o Increasing the temperature of water going into the boiler reduces the amount of Sensible Heat required to boil the water
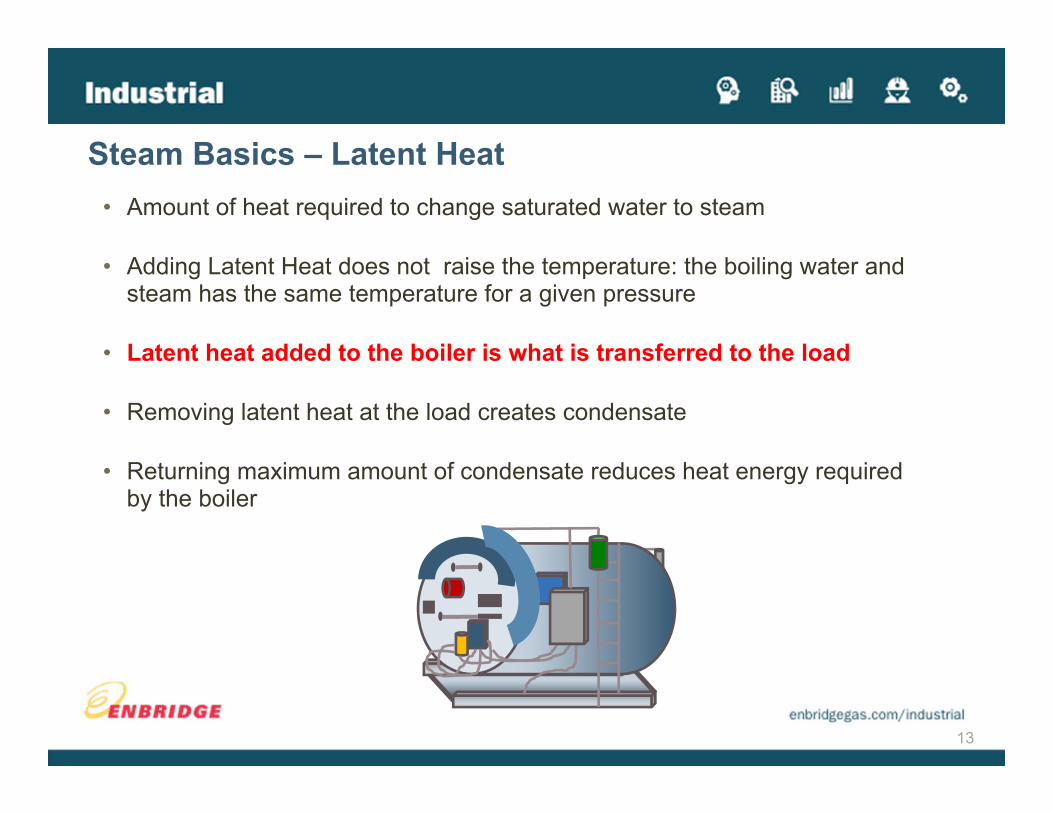
• Amount of heat required to change saturated water to steam
• Adding Latent Heat does not raise the temperature: the boiling water and steam has the same temperature for a given pressure
• Latent heat added to the boiler is what is transferred to the load
• Removing latent heat at the load creates condensate
• Returning maximum amount of condensate reduces heat energy required by the boiler
13
Steam Basics – Latent Heat

14
750
800
850
900
950
1000
0 50 100 150 200
Latent Heat vs. Pressure
Steam Basics – Latent Heat vs. Pressure
Pressure (psig)
Late
nt H
eat (
Btu
/lb)

• Total Heat of Steam = hg
• Sensible Heat = hf
• Latent Heat = hfg
For 100 psig steam:
hf (saturated liq. Enthalpy) = 309 Btu/lb
hfg (latent heat) = 880 Btu/lb
hg (saturated vapour enthalpy)= 1189 Btu/lb
15
Total Heat of Steam = Sensible Heat + Latent HeatSteam Basics – Total Heat of Steam
0
200
400
600
800
1000
1200
1400
Latent HeatSensible Heat
338°F
Total heat of Steam at 100 psig
100 psigPressure (psig)
Hea
t (B
tu/h
r)
880
309338°F
32°F

16Courtesy of: Spirax Sarco
Steam Basics – Enthalpy Explained

Basic Concepts of Combustion
18
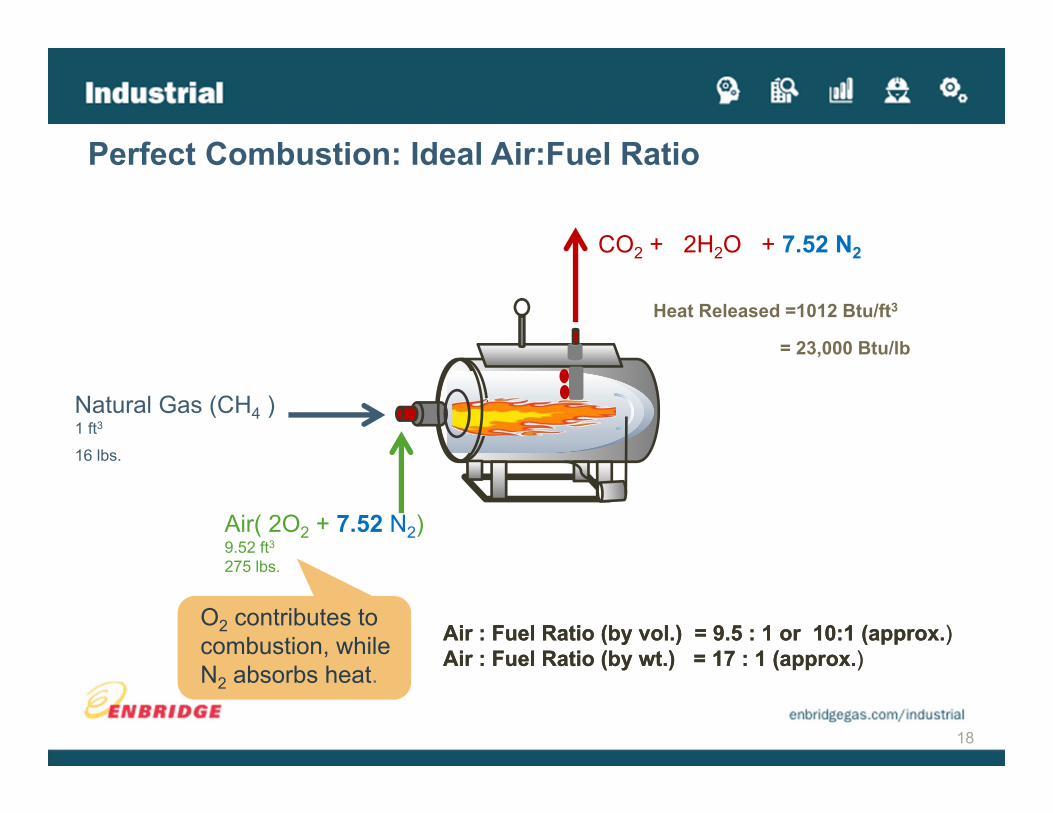
Air : Fuel Ratio (by vol.) = 9.5 : 1 or 10:1 (approx.)Air : Fuel Ratio (by wt.) = 17 : 1 (approx.)Air : Fuel Ratio (by vol.) = 9.5 : 1 or 10:1 (approx.)Air : Fuel Ratio (by wt.) = 17 : 1 (approx.)
Perfect Combustion: Ideal Air:Fuel Ratio
CO2 + 2H2O + 7.52 N2
Natural Gas (CH4 )1 ft3
16 lbs.
Air( 2O2 + 7.52 N2)9.52 ft3275 lbs.
O2 contributes to combustion, while N2 absorbs heat.
Heat Released =1012 Btu/ft3
= 23,000 Btu/lb

19
• All boiler burners use excess air to avoid risk of CO and un-burned CxHy
• Excess air varies with firing rate
A:F by Volume18:1 @ 10% O212:1 @ 3% O2
Practical Air:Fuel Ratio for Complete Combustion
Natural Gas (CH4 )1 ft3
16 lbs.
Excess Aire.g. x= 0.2 for 20%
Air(1+x) (2O2 + 7.52 N2).
Excess O2Low Fire: 8 - 12 %High Fire: 3 - 5%
CO2 + 2H2O + x 2O2 + (1 + x) 7.52 N2
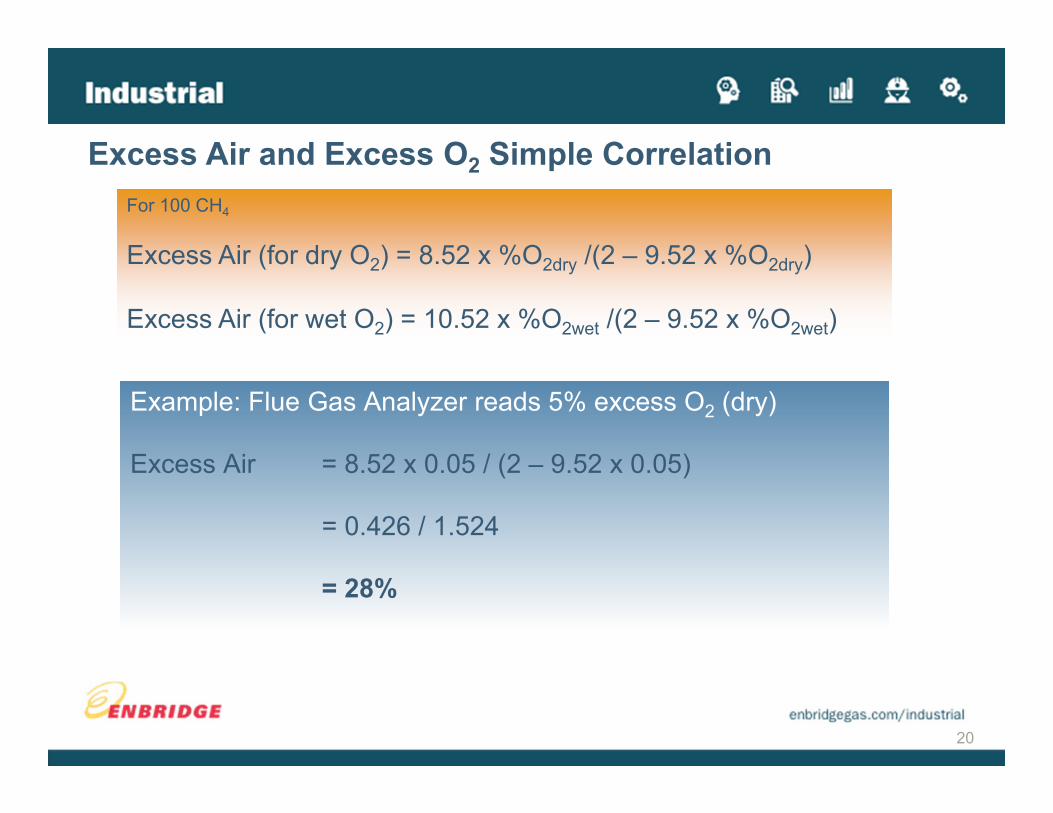
Example: Flue Gas Analyzer reads 5% excess O2 (dry)
Excess Air = 8.52 x 0.05 / (2 – 9.52 x 0.05)
= 0.426 / 1.524
= 28%
20
For 100 CH4
Excess Air (for dry O2) = 8.52 x %O2dry /(2 – 9.52 x %O2dry)
Excess Air (for wet O2) = 10.52 x %O2wet /(2 – 9.52 x %O2wet)
Excess Air and Excess O2 Simple Correlation
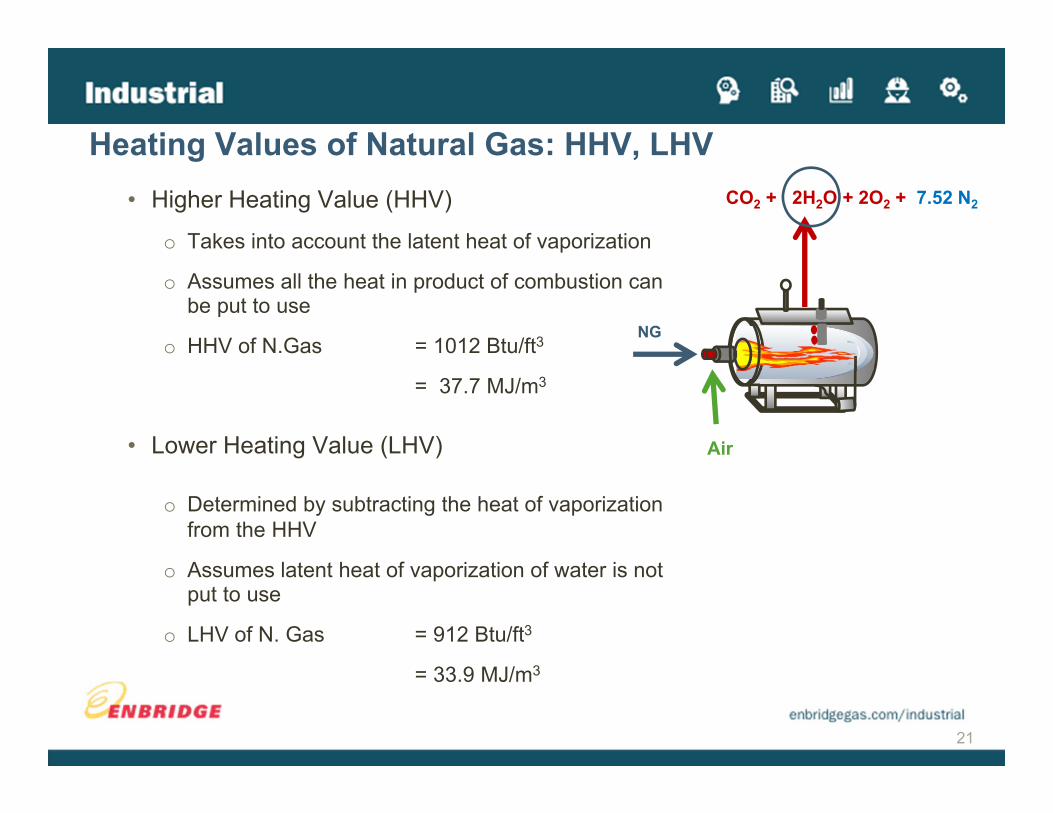
• Higher Heating Value (HHV)
o Takes into account the latent heat of vaporization
o Assumes all the heat in product of combustion can be put to use
o HHV of N.Gas = 1012 Btu/ft3
= 37.7 MJ/m3
• Lower Heating Value (LHV)
o Determined by subtracting the heat of vaporization from the HHV
o Assumes latent heat of vaporization of water is not put to use
o LHV of N. Gas = 912 Btu/ft3
= 33.9 MJ/m3
21
Heating Values of Natural Gas: HHV, LHV
Air
CO2 + 2H2O + 2O2 + 7.52 N2
NG
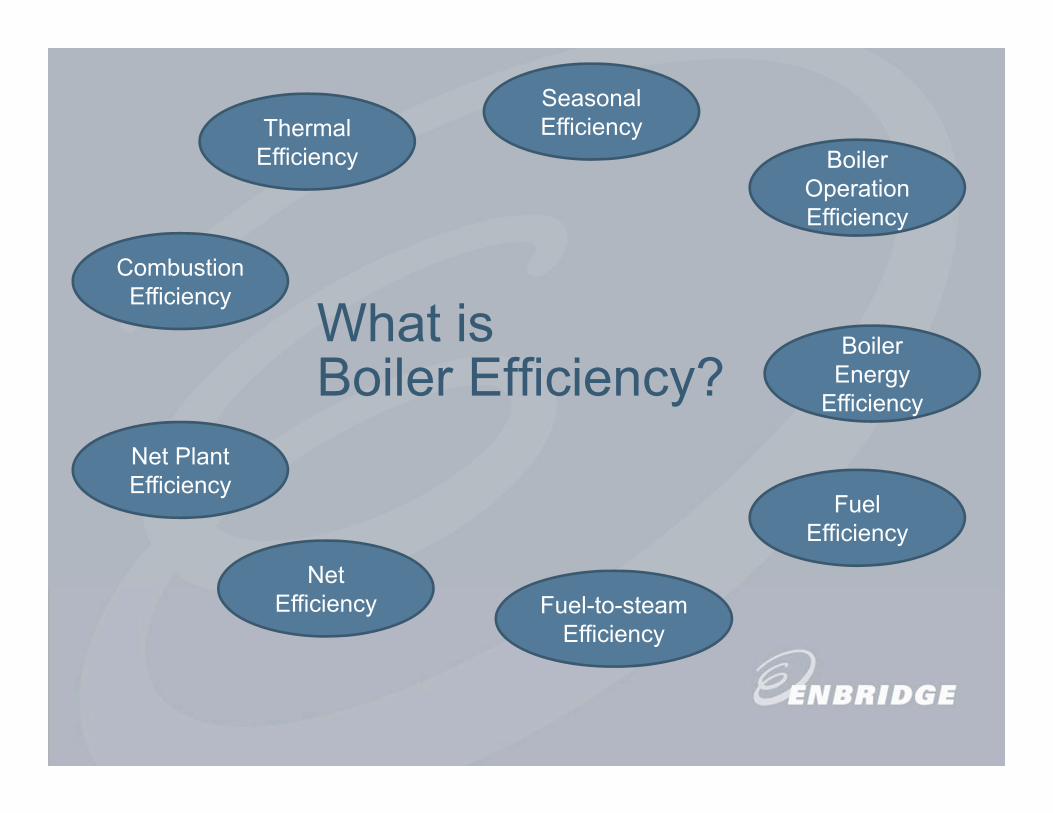
What is Boiler Efficiency?
Combustion Efficiency
Fuel Efficiency
Fuel-to-steam Efficiency
Net Plant Efficiency
Net Efficiency
Thermal Efficiency
Seasonal Efficiency
Boiler Operation Efficiency
Boiler Energy
Efficiency

To identify energy saving opportunities, we need to properly understand what Boiler Efficiency means:
We’ll focus on four commonly used efficiencies for Steam Boilers:
1. Combustion efficiency
2. Fuel efficiency, ASME PTC 4-2008
3. Fuel-to-steam efficiency
4. Net plant efficiency
23
Steam Boiler Efficiency
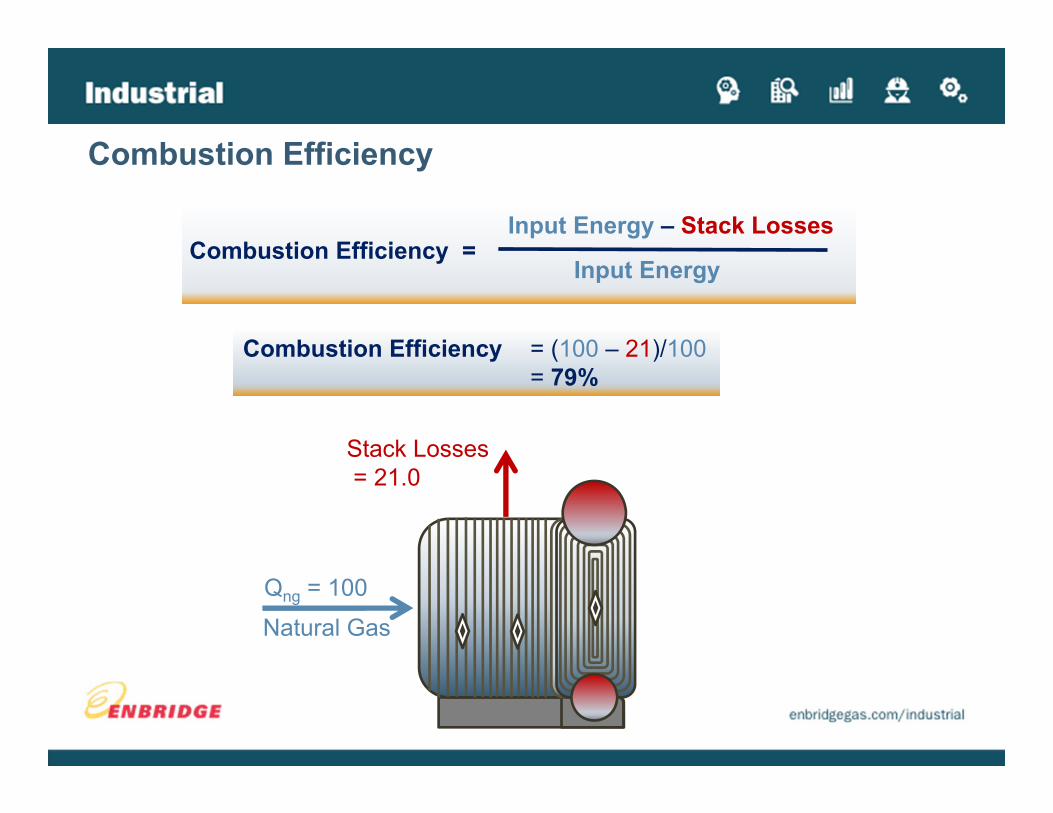
Qng = 100
Natural Gas
Stack Losses= 21.0
Combustion Efficiency = (100 – 21)/100= 79%
Combustion Efficiency =Input Energy
Input Energy – Stack Losses
Combustion Efficiency

79% of Fuel Energy is Delivered to Boiler
Combustion Efficiency
Qng = 100
Natural Gas
Stack Losses= 21.0
79.0Available

Combustion Efficiency
Combustion Efficiency =Input Energy
Input Energy – Stack Losses
Qng = 100
Natural Gas
Stack Losses= 21.0
79.0Available
There is no need to know gas consumption or steam production to calculate combustion efficiency.
But how do we measure stack losses?

27
Enbridge Can Help!
Flue Gas Analyzers Are Used To Measure Stack Loss
28
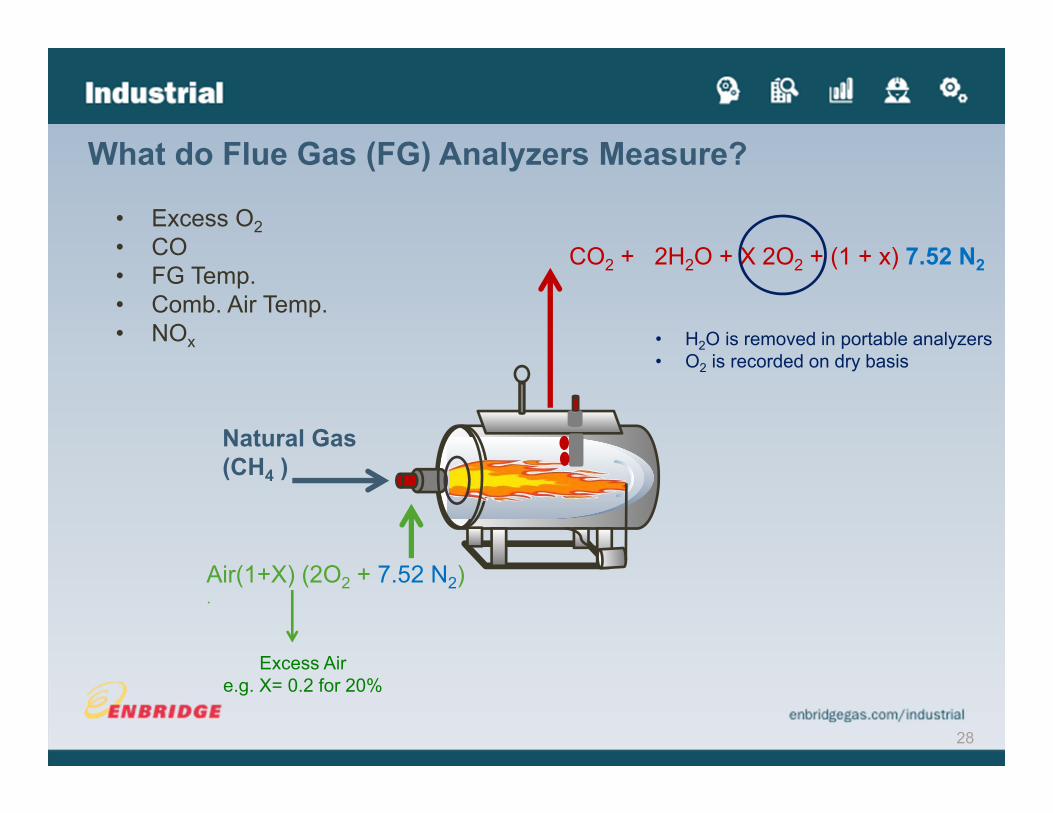
Natural Gas (CH4 )
• H2O is removed in portable analyzers• O2 is recorded on dry basis
What do Flue Gas (FG) Analyzers Measure?
Excess Aire.g. X= 0.2 for 20%
Air(1+X) (2O2 + 7.52 N2).
CO2 + 2H2O + X 2O2 + (1 + x) 7.52 N2
• Excess O2• CO• FG Temp.• Comb. Air Temp.• NOx

29
• Dry flue gas losso Heat lost in the “Dry” products of combustion (CO2, O2, N2) which carry only sensible heat
• Loss in water from burning Hydrogeno Hydrogen component of fuel exits in the form of water vapouro Most of its enthalpy is in the form of heat of vaporization o Approximately 10% of natural gas energy is lost
• CO losso CO is a fuel - any CO in the flue gas represents a loss
• Unburned Hydrocarbons (CxHy) losso Unburned combustibles (CxHy) have the same Higher Heating Value (HHV) as natural gas -
any CxHy in the flue gas represents fuel loss
Types of Stack Losses

• Dry flue gas (CO2, O2, N2) • Water from burning H2• CO • Unburned Hydrocarbons, CxHyStack Losses
(Calculated as a % of fuel)
Natural Gas
Combustion Efficiency
Combustion Efficiency (%) = 100 – Σ losses

Use the Combustion Efficiency Chart to determine the combustion efficiency based on the following parameters:
ParametersExcess O2 = 8%Flue Gas Temp. Tfg = 460 °FCombustion Air Temp. Tair = 80 °F
Calculate Delta T = (460 – 80) °F= 380 °F
O2 340 360 380 400 4207.00 80.6 80.1 79.5 79.0 78.47.50 80.4 79.8 79.2 78.6 78.08.00 80.0 79.4 78.9 78.3 77.78.50 79.7 79.1 78.5 77.9 77.2
Excess, % FG Temperature - Combustion Air
Exercise # 1

32
Fuel Efficiency – ASME PTC 4-2008(% of fuel energy transferred to boiler feedwater)
There are two methods of calculating Fuel Efficiency:
1. Input-Output (Direct) Method:
2. Energy Balance (Indirect) Method:

33
Fuel Efficiency – Boiler Heat Balance
Qng
Natural Gas
QslStack loss Qra
RadiationLoss
QstSteam
QbdBlowdown
QfwFeedwater
Qng + Qfw = Qsl + Qra + Qst + Qbd
Qng - Qsl - Qra = Qst + Qbd - Qfw
Output for Indirect Method Output for Direct Method

34
Fuel Efficiency – ASME PTC 4-2008
1. Input-Output (Direct) Method:
2. Energy Balance (Indirect) Method:
Qng
Natural Gas
QslStack loss Qra
RadiationLoss
QstSteam
QbdBlowdown
QfwFeedwater
FuelEfficiency(Qst
+ Qbd – Qfw)
Qng x100
FuelEfficiencyQng – (Qsl + Qra)
Qng x100
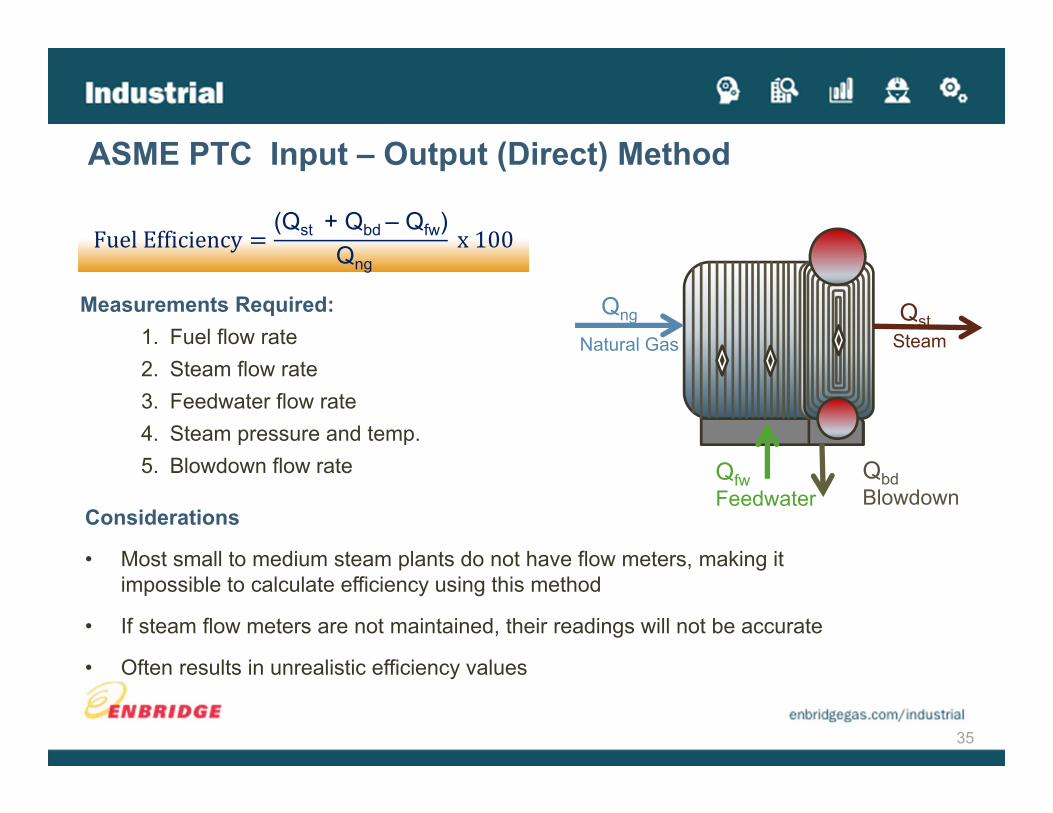
Measurements Required:1. Fuel flow rate2. Steam flow rate3. Feedwater flow rate4. Steam pressure and temp.5. Blowdown flow rate
35
ASME PTC Input – Output (Direct) Method
FuelEfficiency(Qst
+ Qbd – Qfw)
Qng x100
Qng
Natural GasQst
Steam
QbdBlowdown
QfwFeedwater
Considerations
• Most small to medium steam plants do not have flow meters, making it impossible to calculate efficiency using this method
• If steam flow meters are not maintained, their readings will not be accurate
• Often results in unrealistic efficiency values

Measurements Required:1. Measure stack losses (%) with a flue gas analyzer2. Calculate radiation losses (%) – Typically 0.5 to 1% of boiler rating3. In some cases, include unaccounted for losses (%) – 0.1% of input4. Subtract from 100%
36
ASME PTC Energy Balance (Indirect) Method
FuelEfficiencyQng – (Qsl + Qra)
Qng x100
Fuel Efficiency (%) = 100 – Σ losses as a % of Qng (Stack, Radiation, Unaccounted for)
Considerations• Needs accurate measurements of losses• Does not require gas and steam flow measurements• Generally more accurate than Input-Output Method• Preferred method by ASME PTC 4-2008

37
Fuel-to-Steam Efficiency
Practical efficiency• Reflects the amount of fuel energy converted to steam• No standard definition like Fuel Efficiency in ASME PTC
But what is the “ "? Steam, yes, but what is the energy absorbed by steam?
38
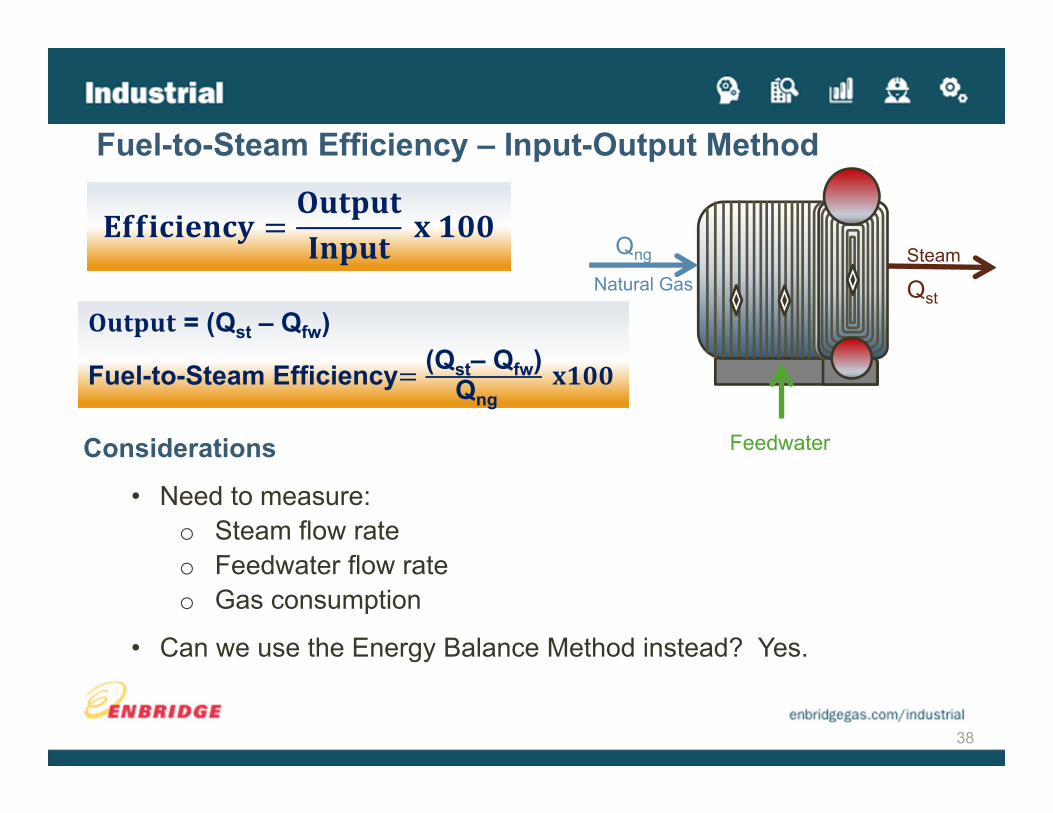
Fuel-to-Steam Efficiency – Input-Output Method
= (Qst – Qfw)
Fuel-to-Steam Efficiency (Qst– Qfw)Qng
Considerations
• Need to measure:o Steam flow rateo Feedwater flow rateo Gas consumption
• Can we use the Energy Balance Method instead? Yes.
Qng
Natural GasSteam
Feedwater
Qst

39
Fuel-to-Steam Efficiency – Energy Balance Method
Qng
Natural Gas
QslStack Qra
Radiation
Steam
QbdBlowdownFeedwater
F-t-S Qng – Qsl − Qra −Qbd)Qng
=
Considerations• Measure losses with a flue gas analyzer• Notice: BD is considered a loss, ASME PTC considers it an output • Very good tool to calculate steam flow rate• Will do an exercise to calculate steam flow when Fuel-to-Steam efficiency is known
Losses
100 – Σ losses (% of Qng)

• Radiation loss (%of fuel input) is constant at all firing rateso A higher percentage of fuel input is lost at low firing rates
• Efficiency is reduced at low firing rates due to high excess O2and high radiation loss
• Optimum efficiency to operate boiler at is generally higher than 50% firing rate
40
Fuel-to-Steam Efficiency
Combustion Effiency
Fuel-to-SteamEfficiencyEf
ficie
ncy
(%)
Fuel Input (MBTU/HR)

Fuel-to-Steam Efficiency = (Qng – Qsl – Qra - Qbd ) / Qng
Stack Loss (Qsl) = (1- Ƞcombustion) x Qng
Radiation Loss (Qra) = 1% of Boiler Rated Input
Exercise # 2 – Fuel-to-Steam Efficiency
Qsl = (1 – 0.789) x 10.5= 2.22 MMBtu/hr
Qrad = 0.01 x 21= 0.21 MMBtu/hr
Fuel-to-Steam Efficiency = (10.5 – 2.22-0.21-0.1) / 10.5= 76 %
Calculate the fuel-to-steam efficiency using the Energy Balance Method.
Parameters:Natural Gas (Qng) = 10.5 MMBtu/hr
Blowdown (Qbd) = 0.1 MMBtu/hrBoiler Input Rating = 21 MMBtu/hr
Ƞcombustion = 78.9%

Steam Flow =( 0.76 x 10.5 x1,000,000) / ((1,189-198) - (4% x 198)= 8,118 pph
Exercise # 3 – Steam Flow
Qin
Natural Gas
Stack
Steam flow
Blowdown (BD) (4%)Feedwater
Calculate the steam flow using the following parameters:
Parameters:Indirect Ƞfuel-to-steam = 76 %Natural Gas Input (Qin) = 10.5 MMBtu/hrBlowdown (BD) % = 4% (0.04)Steam Enthalpy Gas (hg) = 1,189 Btu/lbFW enthalpy (hfw) = 198 Btu/lbȠ = Efficiency
Steam flow = Ƞfuel-to-steam* Qin* 1,000,000 / ((hg-hfw) – (%BD x hfw))

Most common mistake made in calculating steam flow is the use of Combustion Efficiency instead of Fuel-to-Steam Efficiency
Ƞcombustion = 78.9 %
Steam flow = Ƞcombustion* Qin* 1,000,000 / ((hg-hfw) – (%BD x hfw))
= 0.789 * 10.5 * 1,000,000 / {(1,189-198) – (0.04 x 198)}
= 8,428 pph (as compared to 8,118)
Exercise # 3 – Steam Flow

44
CondensateReturn – 50%180 F
Net Plant Efficiency = 68.3%
Cond.Tank
Make UpWater – 50%
CondensateReturn – 50%180 °FDEAERATOR
8 psig
Natural Gas4.4 million m3/yr.
Total Steam15,139 pph
Process Steam13,617 pphSat. Steam @ 100 psig
Stack Flue Gas
Blowdown4%
DA Steam10%
BoilerFeedwater
Boiler 1 Boiler 2 Boiler 3
Net Plant Efficiency – Takes into Account Steam to DA

• Combustion Efficiency: % of fuel energy delivered to boiler
• Fuel Efficiency: % of fuel energy picked up by the boiler feedwater
• Fuel-to-Steam Efficiency: % of fuel energy used to produce steam
• Net plant Efficiency: % of fuel energy used to deliver steam out of steam plant
45
Summary of Efficiency Definitions
46
Cost of Steam
Steam
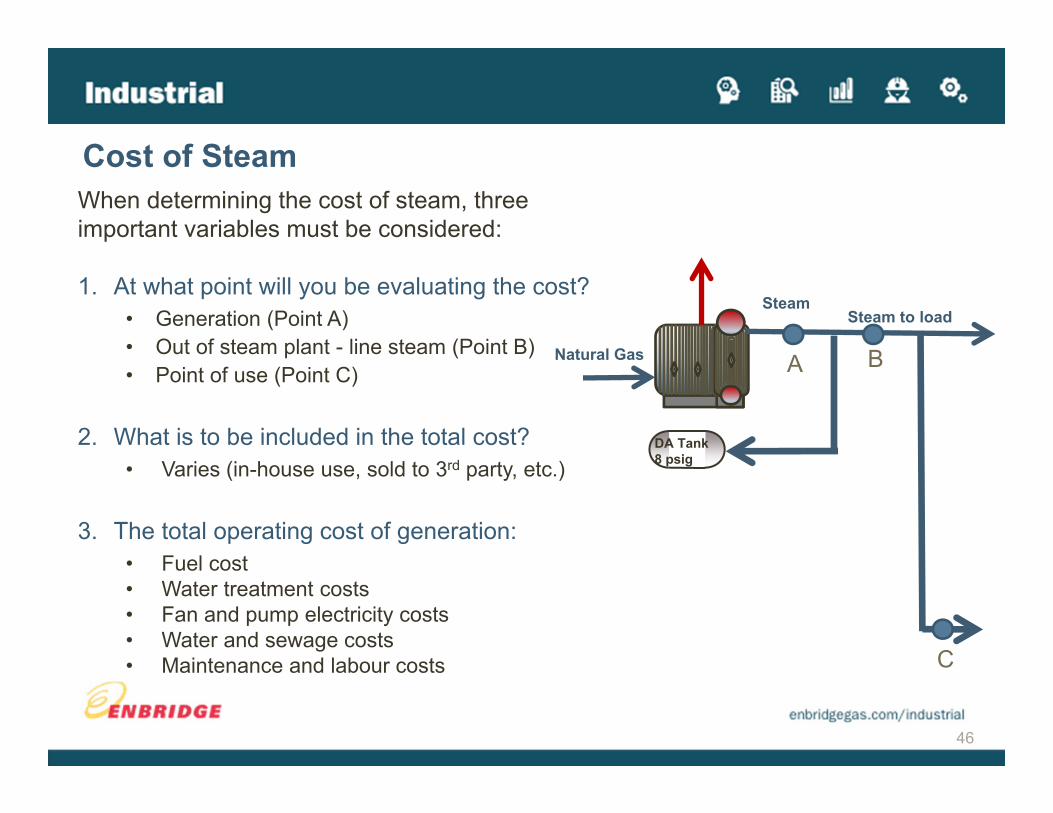
When determining the cost of steam, three important variables must be considered:
1. At what point will you be evaluating the cost?• Generation (Point A)• Out of steam plant - line steam (Point B)• Point of use (Point C)
2. What is to be included in the total cost?• Varies (in-house use, sold to 3rd party, etc.)
3. The total operating cost of generation:• Fuel cost• Water treatment costs• Fan and pump electricity costs• Water and sewage costs• Maintenance and labour costs
Natural Gas
Steam to load
DA Tank8 psig
A
C
B

Fuel Steam Cost = $7.0 x (1,189 – 198)Btu/lb/ (1,000 x 76%)= $9.1 to produce 1,000 lb of steam
Exercise # 4 – Fuel Cost of Steam ($/1,000 lb)Calculate the cost of steam generated at Point A using the following parameters:
Fuel Steam Cost($/1,000 lb) xȠfuel−to−steam
Parameters:Steam Enthalpy(hg) = 1,189 Btu/lb
Feedwater Enthalpy (hfw) = 198 Btu/lb
Ƞfuel-to-steam = 76%Fuel Cost = $7.0MMBtu

Cost Components Cost( $/1,000 lb)
1 Fuel Cost of Steam Generation (FC) 9.10Other Cost Factors *2 Electricity consumption 0.3253 Water 0.1284 Water treatment 0.115 Labour 1.0276 Maintenance 0.474Total of Other Costs (2 – 6) 2.064
Total Cost of Generation (CG) $11.16/1,000 lbBased on an Enbridge study of 25 manned water tube boiler plants by: Bob Griffin
Approximate Cost of GenerationCG = FC * ( 1 + 0.30)
Source: US DOE Steam Technical Brief “How to Calculate True Cost of Steam” by Kumana & Associate and Steam Technical Subcommittee
Exercise # 4 – Fuel Cost of Steam ($/1000 lb)

Natural Gas Savings Opportunities

• Stack loss is a major source of heat loss
• Reducing stack loss will help us reduce our gas consumption and achieve our savings target
50
Gas Savings Opportunity – Stack Loss
Qng = 100Natural Gas
Qsl = 21.0Stack
QstSteam flow
Qbd = 0.7 (4% of FW)Blowdown
QfwFeedwater
Qra = 2.5(1% of boiler rating)

Stack loss can be reduced by:
1. Improving combustion• Reduce excess air (O2)• Reduce/eliminate CO and CxHy
2. Reducing flue gas temperature• Recover heat from hot flue gases • (40°F drop = 1% efficiency improvement)
3. Increasing combustion air temperature• Consider air pre-heater• Draw air from a high point in the boiler room
51
Gas Savings Opportunity – Stack Loss
Air
CO2 + 2H2O + X 2O2 + (1 + x) 7.52 N2
NG

• Excess air is required to achieve proper combustion
• Excess air wastes heat as air enters at ambient temp. and leaves at stack temp.
o 79% of air goes for a free ride
How much excess air is required?
• Depends on burner design, boiler configuration, air/fuel control, etc.:o Older coil-tube boilers without Linkageless Controls (LLC) have high
excess O2 : (5% – 12%)
o Fire-tube boilers generally have lower excess O2 :(4% – 9%)
o Large water-tube boilers can achieve lower excess O2 : (2% - 6%)
Reducing Excess O2

1. Set up a flue gas analyzer
2. Bring boiler to the minimum firing or high firing rate
3. Reduce O2 until CO starts to appear
4. Increase air slightly to give a safety margin
5. Lock this pin-position for this air:fuel ratio
6. Increase/decrease firing rate
7. Repeat process for each pin position to develop an O2characterization curve
How to Find the Optimum Level of O2

54
Typical Excess O2 Characterization Curves
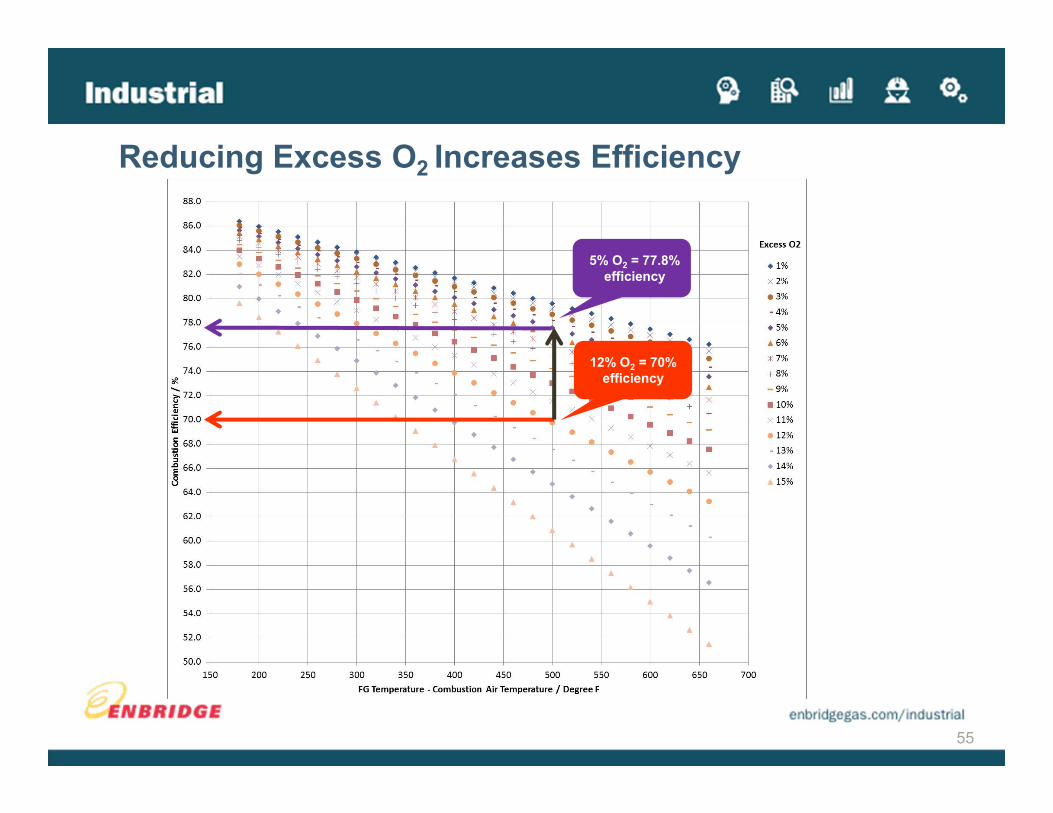
55
Reducing Excess O2 Increases Efficiency
12% O2 = 70% efficiency
5% O2 = 77.8% efficiency
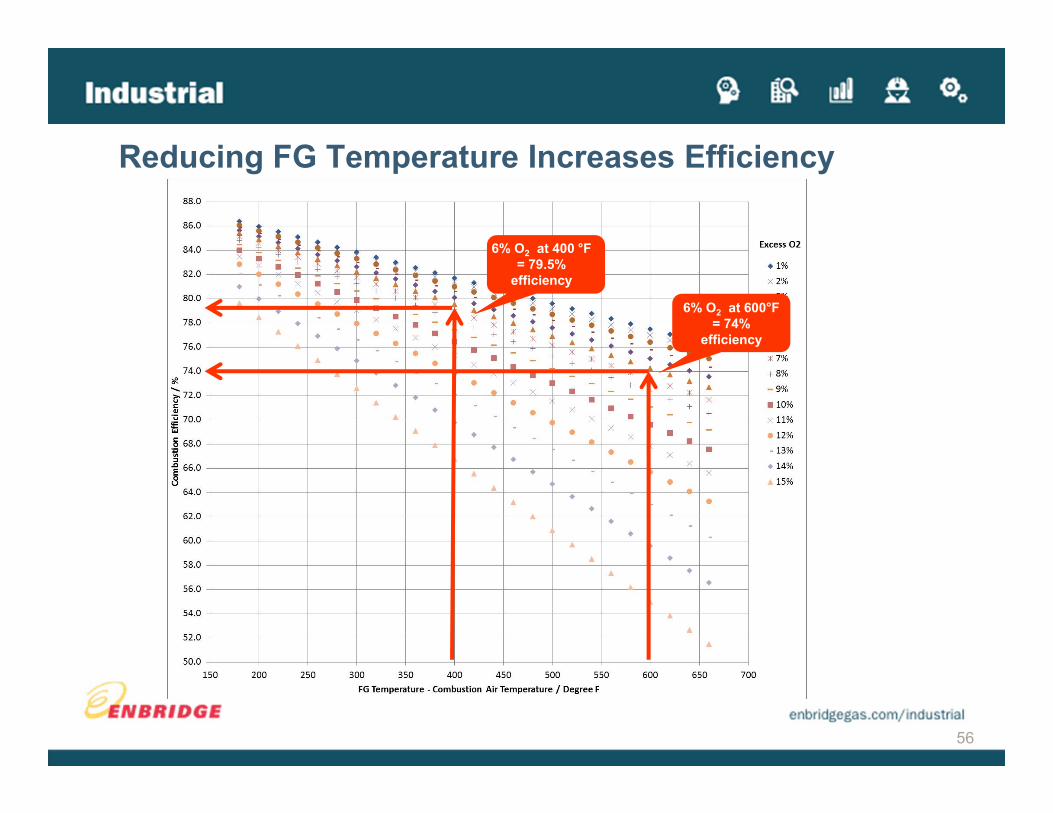
56
Reducing FG Temperature Increases Efficiency
6% O2 at 400 °F = 79.5%
efficiency
6% O2 at 600°F = 74%
efficiency

57
O2 340 360 380 400 4204.00 82.0 81.5 81.1 80.6 80.14.50 81.8 81.3 80.8 80.4 79.95.00 81.6 81.1 80.6 80.1 79.65.50 81.4 80.9 80.4 79.9 79.36.00 81.2 80.6 80.1 79.6 79.06.50 80.9 80.4 79.8 79.3 78.77.00 80.6 80.1 79.5 79.0 78.47.50 80.4 79.8 79.2 78.6 78.08.00 80.0 79.4 78.9 78.3 77.78.50 79.7 79.1 78.5 77.9 77.2
Excess, %FG Temperature - Combustion Air
Use the Combustion Efficiency Chart to calculate the cost savings associated with reducing excess O2 levels from 8% to 5%.
Exercise # 5a : Excess O2 Cost Savings
Ƞold = 78.9 %
Calculate new ƞȠnew = 80.6 %

58
Energy Saving = Qin x {1 - (Ƞold/Ƞnew)}
Exercise # 5b : Excess O2 Cost Savings Parameters:FG temp. – Comb Air = 380 °F
Old excess O2 = 8%
New excess O2 = 5%
Ƞold = 78.9%
Ƞnew = 80.6%
Qin = 10.5 MMBtu/hr
Hours = 5,000 hrs
Cost of Gas = $0.25/m3
1 MMBtu = 1,000,000 Btu
1ft3 Natural Gas = 1,012 Btu
1m3 = 35.314 ft3
Energy Saving = 10.5 x (1- 78.9/80.6)= 0.221 MMBtu/hr
Annual Saving = 0.221 x 5,000= 1,105 MMBtu
Conversion Factor = 1 MMBtu x (1,000,000Btu/1MMBtu) x (1ft3/1,012 Btu) x (1m3/35.314 ft3)= 27.982m3
Annual Savings m3 = 1,105 x 27.982= 30,920 m3
Gas Cost Savings = $7,730 /yr per boiler
Calculate the cost savings associated with reducing excess O2 levels from 8% to 5%.

59
Linkageless Controls

To properly assess the value of linkageless controls, we must first understand:
1. The purpose of combustion controls
2. The types of boiler combustion controls – today we will focus on: • Linkages• Linkageless Controls
3. How LLCs improve combustion efficiency
60
Linkageless (LLC) Controls

Maintain optimum air:fuel ratio at all firing rates to run boilers safely at optimum combustion efficiency
Monitor process boiler temperature and pressure and quickly respond to changes in load
61
Purpose of Combustion Controls:

• Mechanical system using cams, linkages and jackshafts to characterize the air:fuel ratio
• A single actuator motor adjusts its jackshaft arm according to master load (demand) signal
• As the actuator motor moves the jackshaft, the arms connected to the fuel valve and air fan damper move with it
• Air:fuel ratio is set by adjusting the cam
• Calibrating involves combustion tests in which actuator is positioned to various settings, usually at least 10, and at each setting setscrews are adjusted to achieve the desired O2 level in flue gas
62
Linkage Combustion Controls
Primary Fuel Valve
Second Fuel Valve
Fan
Firing RateActuator Prime Motor

• Hysteresis or drift caused by wear, tear and slop in linkages
• Control devices do not return to the same position during boiler ramp-up or turn-down
63
Issues with Linkage Controls:

• Air : fuel ratio is typically set high to compensate for hysteresis
• Air : fuel ratio generally drifts after tune-up
These issues result in:
o Reduced efficiency
o Safety concerns (High CO and combustibles)
Most small boilers do not have an in-situ flue gas analyzer, and as a result, high CO can not be detected until tune-up.
64
Issues with Linkage Controls:

• Obviously no linkages
• Individual servomotors attached to gas valve and air damper. Position of each motor is programmed independently
• A programmable control unit provides precise air:fuel ratio over entire range
• No hysteresis for a properly tuned and maintained LLC system
• Additional controller can be added to provide O2 trim
65
Linkageless Combustion Controls
Linkageless Combustion Control System
P Steam Pressure
MicroprocessorController
Combustion Air Blower
Natural Gas
Gas Control Valve with Servo Motor Drive
Combustion Air Damper with Servo Motor Drive
Burner

66
0.001.002.003.004.005.006.007.008.009.0010.00
0% 20% 40% 60% 80% 100% 120%
Excess O2
Firing Rate
Boiler 3 Oxygen Curve with LLC
Ramping Up
Turning Down
Linkagelss Controls

67
Honeywell
Siemens
Honeywell and Siemens LLC Systems

68
Linkages Linkageless with Honeywell LLC
Power Flame Boiler Burner

1. No hysteresiso Function of “Base Case” burner age
2. Improved combustion efficiency due to:o Reduced excess airo Accurate characterization of air:fuel ratioo Accurate control of firing rateo Depends on how much excess O2 can be reduced
3. Reduced cycling due to improved turn-down
o Savings are a function of “Base Case” burner turndown
4. Additional savings due to O2 trim
69
Gas Savings Opportunity: Linkageless Controls

70
We’re here to help!
What your ESC uses to
calculate and quantify LLC
Savings Opportunities

• Reduce O2
• Maintain optimum air/fuel all the time
• Savings
71
Initiative SavingsRemoval of hysteresis 0.50 %Improved combustion 2.19 %Increased turndown 0.13 %Total 2.82 %Annual gas savings /boiler 41,427 m3/yrGas cost saving / boiler $10,357Gas savings for 3 boilers 124,281 m3
Gas cost savings for 3 boilers $31,070
Gas Savings Opportunity: Install LLC
2.8% Saved

• Some vendors claim 10 - 15% savings, based on unrealistic assumptions
• Savings possible if burner is in very bad condition with very high O2, CO, Combustibles, Cycling etc.
• Need to establish “base case” performance
• Your ESC will help you establish a base line to calculate realistic savings
• Important to estimate savings based on a real “base case”
• LLC installation for a less than 100 HP (4.2 MMBtu/hr input) boiler would typically not be cost effective
72
Personal experiences with LLC

73
Blowdown Loss

Blowdown loss can be reduce by:
1. Reducing amount of BD
2. Recovering BD heat
• Flash tank
• Heat exchanger
74
Gas Savings Opportunity: Blowdown (BD) Loss

• When water is boiled, steam is generated
• Solids are left behind:o Suspended solids form sludge which degrades heat transfero Dissolved solids promote foaming and water carryover
• Water is discharged to keep solids within acceptable limitso Bottom blowdown from mud drum removes suspended solids (once/twice a day)o Surface blowdown removes dissolved solids, concentrated near liquid surface
(continuous)
• Insufficient BD leads to carryover and deposits
• Excessive BD leads to wasted energy, water and chemicals
• Blowdown water temp. is same as steam
• Typical range is 3% – 6% of feedwater
75
Blowdown Basics

76230 F
Blowdown Heat Recovery
Cond.Tank
Make-UpWater – 50%
CondensateReturn – 50%180°F
DEAERATOR
8 psig
Natural Gas4.4 million m3/yr.
Total Steam15,139 pph
Process Steam13,617 pphSat. Steam @ 100 psig
Stack Flue Gas
Blowdown4%
DA Steam10%
BoilerFeedwater
Boiler 1 Boiler 2 Boiler 3
1. Flash Tank2. Heat Exchanger
To Drain
Flash Tank
Heat Exchanger
Flash Stream
10 psig

77
To Drain
Flash Tank
Heat Exchanger
Flash Steam
Make-UpWater – 50%
BD Pressure100 psig
10 psig
Steam Pressure
psig 0 2 3 5 10 1590 12.6 11.9 11.6 11.1 10.0 8.8100 13.3 12.6 12.3 11.9 10.7 9.5110 14.0 13.4 13.1 12.6 11.4 10.3
Percent of Blowdown / Condensate FlashedFlash Tank Pressure / Low Steam Pressure
Exercise # 6a – Flash Tank SavingsUse the Flash Steam Table to find the percentage of flash steam and then calculate the blowdown heat recovery savings associated with installing a flash tank.
Parameters:Blowdown Pressure = 100 psigFlash Tank Pressure = 10 psig
% Flash Steam = 10.7 %

78
Flash Steam Flow = 10.7 % x 630 lb/hr = 67.41 lb/hr
Flash Steam Savings = 67.41 lb/hr x 962 Btu/lb= 64,848.42 Btu/hr
Annual Flash Steam Savings= (64,848.42 x 8,000)/(1,000,000 x 0.76)= 682.61 MMBtu/yr
Gas Savings = 682.61 x 27.982= 19,101 m3/yr
Flash Steam Flow = %Flash x BD Flow Rate
Flash Steam Savings = Flash Steam Flow Rate x Enthalpy
Annual Flash Steam Savings = (Flash Steam Savings x Hours)/(1,000,000 x Ƞfuel-to-steam)
Exercise # 6a – Flash Tank Savings
Parameters:% Flash Steam = 10.7% Ƞfuel-to-steam = 76.8%Boiler Blowdown = 4% (0.04) Enthalpy = 962 Btu/lbFW Flow Rate = 15,760 lbs/hrBD Flow Rate = 630 pphBD Pressure = 100 psigFlash Tank Pressure = 10 psigPlant Hours = 8,000 hrs1 MMBtu = 27.982m3

79
Blowdown Liquid Flow = 630 – 67.41= 563 lb/hr
Energy Savings = 563 lb/hr x 1 Btu/lb°F x (239 – 65)°F= 97,962 Btu/hr
Annual Energy Savings = (97,962 Btu/hr x 8,000)/(1,000,000 x 0.76)= 783,696,000/760,000 = 1,031.18 MMBtu x 27.982m3
= 28,854 m3
Blowdown Liquid Flow = Blowdown Flow Rate – Flash Steam Flow Rate
Energy Savings = Blowdown Liquid Flow x Heat Capacity x (Tinlet – Toutlet)
Annual Energy Savings = (Energy Savings x Hours)/(1,000,000 x Ƞfuel-to-steam)
Exercise # 6b – Heat Exchanger SavingsCalculate the savings associated with installing a heat exchanger.
Parameters:Ƞfuel-to-steam = 76%Blowdown Flow Rate = 630 pphHeat Capacity = 1 Btu/hr°FInlet Temp. (Tinlet) = 239°FOutlet Temp. (Tout) = 65°FPlant hours = 8,000 hours1 MMBtu = 27.982m3
80
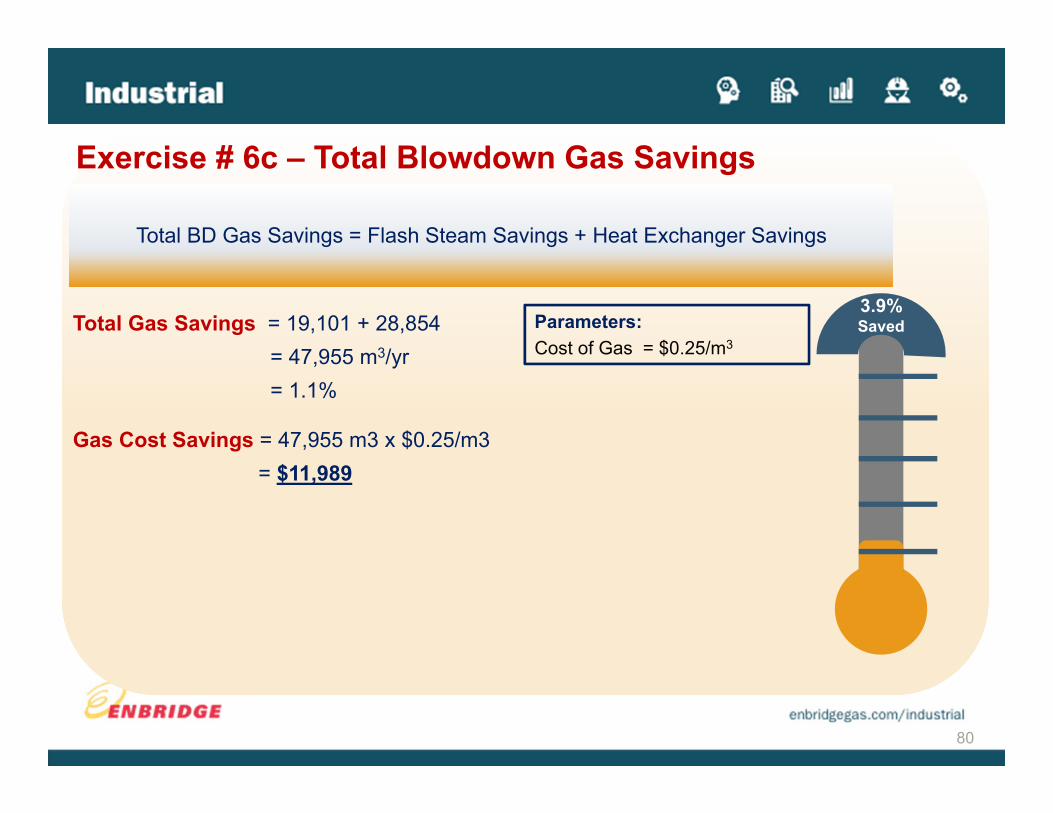
Total Gas Savings = 19,101 + 28,854= 47,955 m3/yr= 1.1%
Gas Cost Savings = 47,955 m3 x $0.25/m3= $11,989
Total BD Gas Savings = Flash Steam Savings + Heat Exchanger Savings
Exercise # 6c – Total Blowdown Gas Savings
Parameters:Cost of Gas = $0.25/m3
3.9% Saved

81
Insulation of Pipes and Valves

• Bare pipes and valves lose a significant amount of heat
• Insulation is required to prevent heat loss through valves and pipes
• Lack of proper insulation poses a safety hazard to plant workers
• Insulation is often removed or damaged during maintenance without being replaced
• Any surface over 120°F should be insulated
82
Gas Savings Opportunity: Insulation of Pipes and ValvesReasons for installing and monitoring insulation on steam valves and pipes:

• Insulation increases the amount of steam energy available for end uses
• Insulation can reduce heat loss by 90%
• Valves have a large surface area: e.g. a 6” gate valve may have over 6 square feet of surface area
• Removable and reusable insulation covers that are easy to remove and replace are available
• Your ESC can provide savings estimates
• 3EPLUS software is available
83
Gas Savings Opportunity: Insulation of Pipes and Valves

84
Source: US DOE Steam tip Sheet #17
Gas Savings Opportunity: Insulation of Pipes and Valves

85
Prepared by Enbridge, based on data from US DOE Steam tip Sheet #17
Gas Savings Opportunity: Insulation of Pipes and Valves

86
Process Steam
Sat. Steam @ 100 psig
Boiler 1 Boiler 2 Boiler 3
Steam Plant: Un-Insulated Pipe and Valves

87
Heat Loss (no insulation)= 1,072 MMBtu/yr
Heat Loss (1” insulation)= 120 MMBtu/yr
Heat Saved = 952 MMBtu/yr
= (89%)
Gas Savings = 35,319m3/yr
Gas Cost Savings = $8,830 per yr
Sample Project: Installing Insulation on PipesCalculate the savings associated with insulating a 150 ft long X 4” dia pipe
Parameters:Steam Pressure = 100 psigOperating Temp. = 338°FHours = 8,000 HrsȠfuel-to-steam = 76%Cost of Gas = $0.25/m3
1 MMBtu = 27.982m3
1 MMBtu = 1 Mil. Btu

88
Net energy savings = (2,718 x 3) + (4,250 x 3)= 20,904 Btu/hr x 8,000= 167,232,000 Btu/hr/1,000,000 = 167.2 MMBtu/yr
Gas savings (valves) = 167.2 MMBtu/hr / 0.76= 220 MMBtu/yr x 27.982= 6,156 m3
Gas savings (150’ pipe) = 35,319m3
Total gas savings = 41,475m3
Gas cost savings = $10,369
Exercise # 7 : Installing Insulation on ValvesCalculate the savings associated with insulating three 4” valves and three 6” valves.
Parameters:4” Savings = 2,718 Btu/hr
6” Savings = 4,250 Btu/hr
Steam Pressure = 100 psig
Operating Temp. = 338°F
Hours = 8,000 Hrs
Ƞfuel-to-steam = 76%
Cost of Gas = $0.25/m3
1 MMBtu = 27.982m3
1 MMBtu = 1 Mil. Btu
Net Savings = Σ Energy Savings from All ValvesGas Savings = Net Savings/ Ƞfuel-to-steam
4.8% Saved

2013 Insulation Survey Campaign
Enbridge will fund 100% of the cost of an Insulation Survey up to a maximum of $2,500.00
per customer!!
Special promotion beginning right here, right now
Limited space available - first come, first serve basis
Scope of Work must be approved by an ESC
Application forms due by October 1, 2013
Flyer in package has additional information
Speak with your ESC to find out if this campaign is right for you!

90
Flue Gas Heat Recovery

Flue gas heat recovery can be achieved through:
• Air Preheaters
• Feedwater Economizers
• Condensing Economizers
91
Gas Savings Opportunity: Flue Gas Heat Recovery
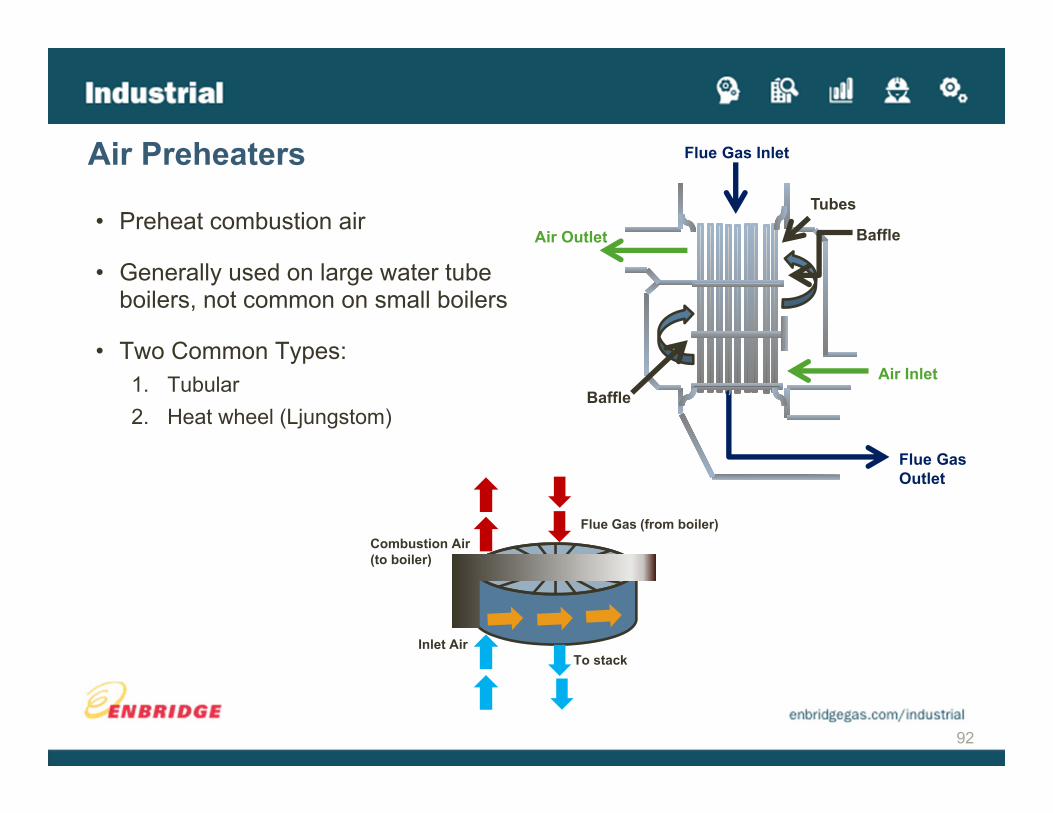
• Preheat combustion air
• Generally used on large water tube boilers, not common on small boilers
• Two Common Types:1. Tubular2. Heat wheel (Ljungstom)
92
Air Preheaters
Flue Gas Outlet
Air InletBaffle
Air Outlet Baffle
Tubes
Flue Gas Inlet
Flue Gas (from boiler)
To stackInlet Air
Combustion Air (to boiler)

93
Purpose: Preheat boiler feedwaterGas Savings Opportunity: Feedwater Economizers
FW Economizer
460°F
Natural Gas
Steam flow
Blowdown
Stack300°F
288°F
DEAERATOR
230°F
8 psig
Feedwater

1.In-line
Cylindricalo Fire tube and coil tube boilers
Rectangularo Large water tube boilers
2.Integral
Built-in as part of boiler. e.g. Miura, Clayton
94
Types of Feedwater Economizers
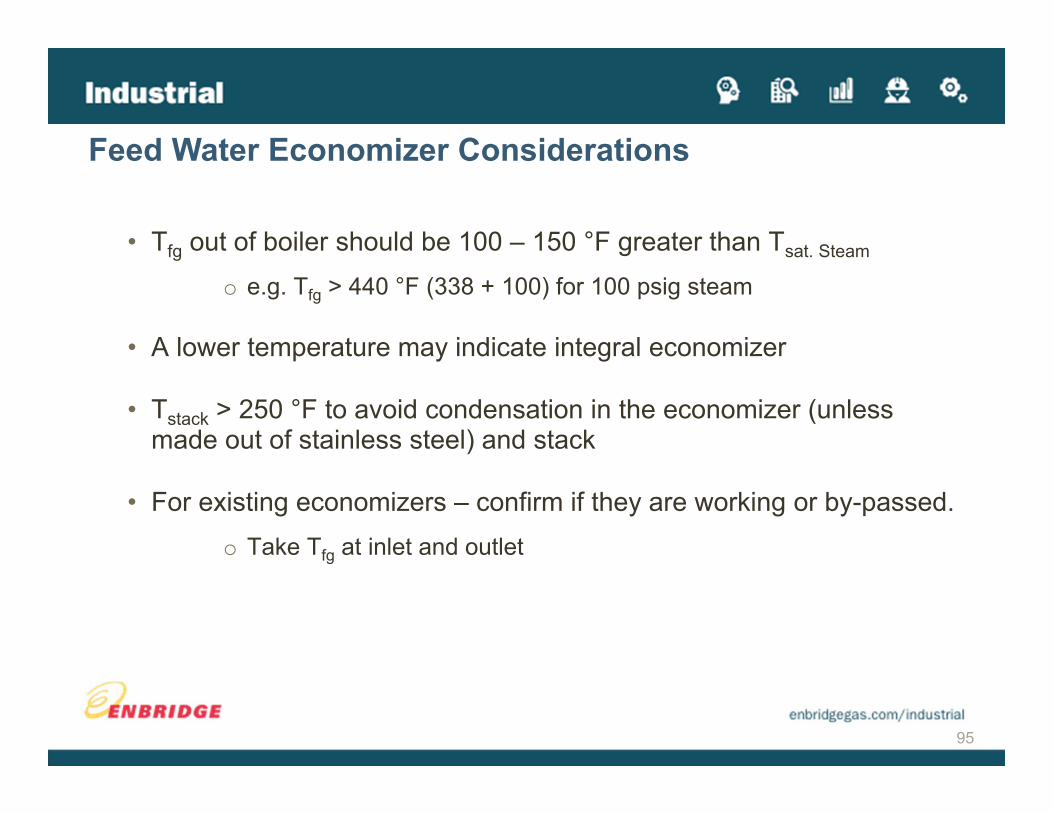
• Tfg out of boiler should be 100 – 150 °F greater than Tsat. Steam
o e.g. Tfg > 440 °F (338 + 100) for 100 psig steam
• A lower temperature may indicate integral economizer
• Tstack > 250 °F to avoid condensation in the economizer (unless made out of stainless steel) and stack
• For existing economizers – confirm if they are working or by-passed. o Take Tfg at inlet and outlet
95
Feed Water Economizer Considerations

96
Major Suppliers of Feedwater Economizers
Thermogenics Cain
Cleaver BrooksE-Tech
Canon
Heatspong
Kentube
Combustion and Energy

97
ParametersȠw/o econo. = 80.6 %O2 = 5%Tout = 300 °FTair = 80 °FDelta T = 220 °F
O2 200 220 240 260 280 300 320 340 360 3804.50 85.3 84.8 84.3 83.8 83.3 82.8 82.3 81.8 81.3 80.85.00 85.1 84.6 84.1 83.6 83.1 82.6 82.1 81.6 81.1 80.65.50 85.0 84.5 84.0 83.5 82.9 82.4 81.9 81.4 80.9 80.4
Excess, FG Temperature - Combustion Air Temp,Degree F
Ƞnew = 84.6 %
460 °F
300 °F
230 °F
288 °F
Exercise # 8 : Installing a Feedwater EconomizerUse your Combustion Efficiency Chart to identify the new efficiency level after installing a feedwater economizer and then calculate the associated savings.

98
Energy Savings = 10.5 x (1- 80.6/84.6)= 0.5 MMBtu/hr
Annual Savings = 0.5 MMBtu/hr x 5,000 Hrs= 2,500 MMBtu/yr x 27.982m3
= 69,955 m3
Gas Cost Savings = 69,955 m3 x 0.25m3
= $17,489/yr per boiler
Gas Cost Savings for 3 Boilers = $17,489 x 3 boilers=$52,467/yr
Energy Savings = Qin x {1 - (Ƞold/Ƞnew)}
Exercise # 8 : Installing a Feedwater Economizer
ParametersȠold = 80.6%Ƞnew = 84.6%O2 = 5%Tout = 300 °FTair = 80 °FDelta T = 220 °FQin = 10.5 MMBtu/hr
Hours = 5,000 HrsCost of Gas = $0.25/m3
1 MMBtu = 27.982m3
9.6% Saved

• Condensing economizers help maximize boiler heat recovery
Gas Savings Opportunities: Condensing Economizers
Hot gas 300 °F+

1. Review basic concepts of condensing heat recovery 2. Types of condensing economizers3. Energy savings potential4. Case studies5. Potential applications6. Key considerations7. Exercises
Condensing Economizer Overview

When one molecule of CH4 is burned, it produces two molecules of H2O
• One lb of CH4 produces 2.25 lb of water
• One lb of Natural Gas produces 2.14 lb of water
CH4 + 2O2 + 7.52 N2 CO2 + 2H2O + 7.52 N2
36 lb2.25 lb
16 lb1 lb
Basic Concept of Condensing Heat Recovery

• Water in products of combustion is vaporized due to heat of combustion
• Water vapours absorb about 10% of fuel input (Hydrogen Loss in Combustion Efficiency)
• Energy is lost to atmosphere with exhaust gases through stack
• Heat of vaporization can be recovered if flue gases are cooled below water dew point
• When water vapour condenses, it releases heat of vaporization
• Condensing economizer recovers both:1. Heat of condensation (latent heat) 2. Sensible heat
Basic Concepts of Condensing Heat Recovery

Source: DOE Condensing Economizers Tip Sheets
Indirect Contact Direct Contact
200 F
135 F
Types of Condensing Economizers

104Excess O2 = 5%
Condensation starts below dew point at
about 137 °F
Sensible heat only
Sensible and latent heat
As flue gas temperature decreases,
efficiency increases

105
Natural Gas
Main Stack
Steam Steam to load
Cond.Tank
Makeup Water
Cond. returnDA Tank7 psig
FWEcono.
CondensingEcon
New Stack
200°F
60°F300°F
Savings come from steam reduction in DA tank to heat make-up water
CondReturn.
Cond.Tank
Make-upWater
Before
Energy Savings with Condensing Economizers
Condensing Economizer

106
Mak
e-U
p W
ater
Con
dens
ate
Flue gas
Requirements of Flue Gas and Condensate PassagewaysFlue gas
Mak
e-U
p W
ater
Con
dens
ate
Flue gas and condensate must flow in the same direction
(parallel flow)

Available Heat Varies with FG Temp. leaving Economizer
0
0.2
0.4
0.6
0.8
1
1.2
1.4
1.6
75 F 100 F 125 F 150 F
Latent HeatSensible Heat
Heat available from one boiler
Flue Gas Temp. Leaving Condensing Economizer (°F)
Hea
t Ava
ilabl
e (M
MB
TU/h
r)
1.39
1.11
0.61
0.38
Tfg-in = 300 F
0.82
0.61
0.17
0.380.440.500.56

Recovered Heat Depends on Heat Sink Size
0
0.2
0.4
0.6
0.8
1
1.2
1.4
1.6
25% 50% 75% 100%
Heat Available@ 75 F ExitTemp., 62 FMUW Temp.
Heat Recoveredat various MUWRates
Make-up Water Rate %
Hea
t (M
MB
tu/h
r)
1.39 1.39 1.39 1.39
1.13
0.85
0.57
0.28

• Two 350 HP coil tube boilers, 105 psig saturated steam
• 100% boiler make-up water
• 5 day x 24 hr operation
• ConDex condensing economizer system installed on roof
• Pull exhaust from two stacks into one common duct feeding Condex
Case Study: Indirect Condensing Economizer
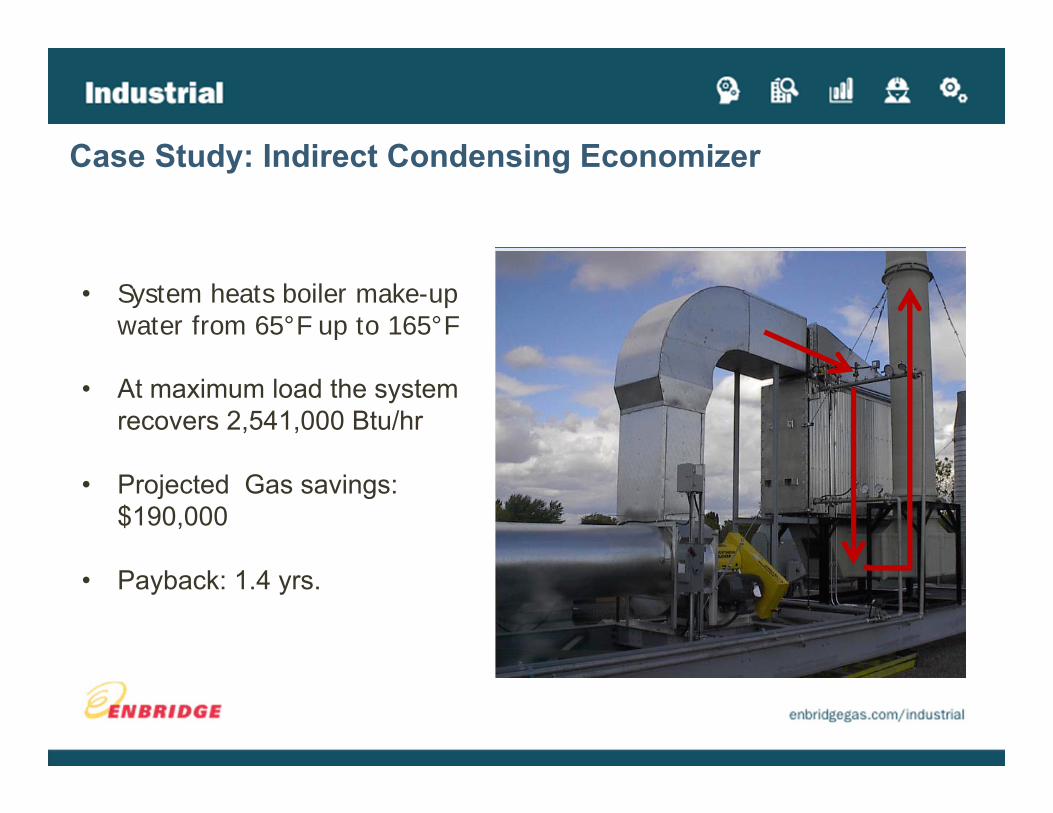
• System heats boiler make-up water from 65°F up to 165°F
• At maximum load the system recovers 2,541,000 Btu/hr
• Projected Gas savings: $190,000
• Payback: 1.4 yrs.
Case Study: Indirect Condensing Economizer

• Industries with steam boilers, requiring a large amount of hot water such as make-up, washing, process, DHW
• Best Candidates:
o Textile, commercial laundries
o Food and beverage
o Breweries
o Non-integrated paper mills
o Chemicals
o District heating
o Large hospitals
o Greenhouses
Typical Applications

• Establish how much heat is availableo Existing FW economizer, Flue gas temp., excess O2, steam
production, gas consumption, hours of operation, etc.
• Is there sufficient heat sink available?o Boiler make-up watero Domestic hot water o Process water
• Entering temperature of heat sink must be below dew point to cause condensation
• Evaluate impact on existing system including blowdown, flash steam, DA, water treatment etc.
Key Considerations

• Space for installation, stacks, icing due to plume impingement, indoor/outdoor installation, etc.
• Cost savings, installation costs, payback
• Direct versus indirect?
o Site specifico Customer preferenceo Costo Temperature requiremento Applicationo Heat sink, etc.
Key Considerations

• Not an “off-the-shelf” technology for many applications. Often an engineered solution is required.
• Requires a good understanding of the technology and its application.
• Needs a suitable heat sink. Small amounts of make-up water (25%) capture only a small portion of available heat.
• Need to include condensing economizer as part of a standard steam plant assessment.
Condensing heat recovery is a proven, commercially available cost-effective technology
Key Considerations

115
Case Study: In-line Condensing EconomizerFor individual boilers (100 – 500 BHP), a new in-line condensing stack economizer is available:

Indirect Contact Economizers
• Combustion and Energy System, Toronto, Canada
• E-Tech, Tulsa, Oklahoma
• Benz Air, Las Vegas, NV
• Sidel System USA, California
• CHX Corporation, Clifton Park, NY
Direct Contact Economizers
• Sofame, Montreal, Canada
• Thermal Energy System, Ottawa, Canada
• Direct Contact Inc. Renton, WA
• Kemco System
Major Manufacturers

117
300°F
62°F
200°F
300°F
Exercise # 9 : Indirect Contact Condensing Economizer

118
300°F
62°F
200°F
126°F
Exercise # 9 : Indirect Contact Condensing EconomizerCalculate the savings associated with installing a condensing economizer to heat make-up water.
ParametersQin = 9.8 MMBtu/hrȠnew combustion = 84.6 %Ƞnew fuel-to-steam = 81.5%Water Tin = 62 °FWater Tout = 200 °FMake-up Water Flow = 4,041 lb/hrHeat Capacity = 1 Btu/hr °FHours = 5,000 HrsCost of Gas = $0.25/m3
1 MMBtu = 27.982m3
1 MMBtu = 1 mil. Btu# of Boilers = 3
Heat Available in Flue Gases = Qin x (1- Ƞnew combustion)
Heat Recovered = Make-Up Water Flow x Heat Capacity x (Water Tout – Water Tin)
Gas Savings = Heat Recovered/ Ƞnew fuel-to-steam

119
Step 1: Calculate heat available in flue gases
Heat available in stack = 9.8 x (1-0.846)= 1.5 MMBtu/hr
Step 2: Calculate heat recovered by 50% make-up water
Heat recovered = 4,041 x 1 x (200 – 62)= 557,658 Btu/hr/1,000,000= 0.558 MMBtu/hr
Step 3: Check if Heat Recovered is less than Heat Available
Exercise # 9 : Indirect Contact Condensing Economizer
ParametersQin = 9.8 MMBtu/hrȠnew combustion = 84.6 %Ƞnew fuel-to-steam = 81.5%Water Tin = 62 °FWater Tout = 200 °FMake-up Water Flow = 4,041 lb/hrHeat Capacity = 1 Btu/hr °FHours = 5,000 HrsCost of Gas = $0.25/m3
1 MMBtu = 27.982m3
1 MMBtu = 1 mil. Btu# of Boilers = 3

120
Step 4 : Calculate gas savings
Gas Savings = 0.558 / 81.5%= 0.6847 MMBtu/hr (6.7% of energy in)
Annual Saving = 0.6847 x 5,000= 3,423 MMBtu x 27.982m3
= 95,782m3
Gas cost Savings = $0.25/m3 x 95,782m3
= $23,946/yr/boiler
Gas Cost Savings for 3 Boilers = $71,838/yr
Exercise # 9 : Indirect Contact Condensing Economizer
16.1% Saved

121
Total Steam15,139 pph
Process Steam13,617 pphSat. Steam @ 100 psig
Stack Flue Gas
Boiler 1 Boiler 2 Boiler 3
Condensate
Process Water40 gpm20,000 pph
Steam1705 pph
65°F
140°F
Condensing Economizers to Heat Process Water
Currently process water is heated with steam
Can we heat process water with flue gases?

122
Flue Gases 300°F
62°F
200°F
300°F
Add a Second Coil to Heat Process Water
MUW
126°F
Heat water to 120°F with FG, then top it up to 140°F with steam
Flue Gases
120°F
65°F
Process Water
Process Water40 gpm20,000 pph
Steam455 pph
120°F
140°F
From boiler

123
Exercise # 10 : Heating Process Water Calculate the savings associated with adding a second coil to the condensing economizer to heat process water.
Heat Recovered = Process Water Flow x Heat Capacity x (Tout – Tin)
Gas Savings = Heat Recovered/ Ƞnew fuel-to-steam
ParametersQng x 3 boilers = 29.4 MMBtu/hrȠnew fuel-to-steam = 81.5 %Water Tin = 65 °FWater Tout = 120 °FProcess Water Flow = 20,000 lb/hrHeat Capacity = 1 Btu/hr °F
Hours = 5,000 HrsCost of Gas = $0.25/m3
1 MMBtu = 27.982m3
1 MMBtu = 1 mil. Btu
Heat Recovered = 20,000 lb/hr x 1Btu/hr°F x (120-65)°F= 1,100,000 Btu/hr/1,000,000= 1.1 MMBtu/hr
Gas Savings = 1.1 MMBtu/hr/81.5%= 1.35 MMBtu/hr
Annual Gas Savings = 1.35 MMBtu/hr x 5,000= 6,750 MMBtu/yr x 27.982m3
= 188,879 m3/yr
Cost Savings = 188,879m3/yr x $0.25/m3
= $47,220/yr

How does our plant look with all the improvements?
Did we achieve our goal of 20% savings?

125
Cond.Tank
CondensateReturn
DEAERATOR
8 psig
Energy Efficient Steam Plant
Natural Gas
Stack Flue Gas
BD
BoilerFeedwater
Boiler 1 Boiler 2 Boiler 3
To Drain
Flash Tank
Heat Exchanger
Make-UpWater
FWEconomizer
Process Water
Flue Gases
Condensing Economizer

126
Project Summary Net Gas Savings (m3)
Net Costs Savings($)
Improve Combustion with LinkagelessControls
124,281 m3 $31,070
Recover Heat from Boiler Blowdown 47,955 m3 $11,989
Insulate Valves 41,475 m3 $10,369Heat Feedwater with a FeedwaterEconomizer
209,865 m3 $52,467
Heat Make-Up Water with a Condensing Economizer
287,346 m3 $71,383
Heat Process Water with a Condensing Economizer
188,879 m3 $47,220
Total Savings 899,801 m3 $224,498
Exercise # 11 : Summary of Savings
Total Gas Costs = $1.1 million/yrTotal Cost Savings = $224,498/yrPercentage Savings = 20%

127
20% Saved

Opportunity Identification
MeasurementEngineering Analysis
Action and Implementation
Through testing and energy use analysis.
Quantify key energy inputs
Analyzing data and Monetizing Savings.
Arm our customers with information.
Knowledge Development
At Enbridge, We’re here to help:
Contact your ESC to learn
more about our free services and
financial incentives!

129
At Enbridge, We’re here to help:
• There are many things you can do to ensure your boiler plant is as efficient as possible.
• Each boiler plant is different and opportunities should be assessed on a case by case basis.
• Your Enbridge Energy Solutions Consultant is available to help you: Evaluate the efficiency of your boiler plant Quantify key energy inputs and outputs Identify energy savings opportunities Monetize energy savings opportunities Connect you with third party vendors Identify any Enbridge incentives you may qualify for Develop an implementation plan

THANK YOU! QUESTIONS?
Knowledge Development
OpportunityIdentification
MeasurementEngineering Analysis
Action andImplementation