ap chemistry lab manual quarter 3 - class...
TRANSCRIPT

AP CHEMISTRY LAB MANUAL
QUARTER 3
Page(s) Lab Name Date Performed
Possible Points Points Earned
2 Lab Equipment Diagrams
3 - 8 Rate of Decomposition of Calcium Carbonate 1/5 - 1/6 55
9 - 15 Kinetics of Crystal Violet Fading 1/9 - 1/10 55
17 - 22 Acidity of Beverages 1/18 - 1/19 55
23 - 27 Designing a Hand Warmer 2/3 - 2/6 50
29 -35 Hess’s Law 2/7 - 2/8 50
1

2

Name: ____________________________ Period: _____ Date: ________
RATE OF DECOMPOSITION OF CALCIUM CARBONATE
Purpose The purpose of this lab is to use the method of initial rates to study the heterogeneous reaction of calcium carbonate with hydrochloric acid. Different concentrations of hydrochloric acid will be prepared and the evolution of carbon dioxide gas will be observed as a function of increasing volume of the gas. Initial rates will be determined using graphical analysis. Background What factors determine how fast a chemical reaction will occur? The answer has applications in food science, geology, ecology and even art and architecture. Consider the weathering of marble statues from ancient times. These works of art are being eroded as acid rain dissolves the calcium carbonate that makes up marble. Calcium carbonate, CaCO3, is one of the most abundant minerals on Earth. More than 4% of the Earth’s crust is composed of calcium carbonate. It is a major component of limestone, marble, seashells, bedrock, etc. Limestone and marble have been among the most widely used building materials for more than 5000 years, from the pyramids in Egypt to the Parthenon in Greece and the Taj Mahal in India. In many places, limestone is also the foundation of our Earth -literally, since it forms both bedrock and mountain ranges. Calcium carbonate dissolves in water only to a limited extent, but its solubility is greatly enhanced when the water is acidic. The gradual dissolution of limestone and marble, as well as coral and seashells, in acids is due to acid-base neutralization. The products of the neutralization reaction between calcium carbonate and hydrochloric acid are calcium chloride and carbonic acid, or H2CO3. Carbonic acid is unstable, decomposing to give carbon dioxide gas and water.
CaCO3 (s) + 2HCl (aq) → CaCl2 (aq) + H2CO3 (aq) Equation 1 H2CO3 (aq) → CO2 (g) + H2O (l) Equation 2
The rate of the overall reaction (see Equation 3) and its dependence on the concentration of HCl are important concerns in environmental chemistry due to the combined effects of acid rain and ocean acidification.
CaCO3 (s) + 2HCl (aq) → CaCl2 (aq) + CO2 (g) + H2O (l) Equation 3 Kinetics is the study of the rates of chemical reactions. As reactants are transformed into products in a chemical reaction, the amount of reactants will decrease and the amount of products will increase. The rate of the reaction can be determined by measuring the amount, concentration or pressure of reactants or products as a function of time. In some cases, it is possible to use a simple visual clue to determine a reaction rate. Some of the “clues” that may be followed to measure a reaction rate include color intensity (spectroscopy), amount of precipitate (gravimetric analysis) or amount of gas generated. In the case of the reaction of CaCO3 with HCl, one of the products is a gas. Since either volume or mass of the gas is proportional to moles, the rate can followed by measuring the time it takes for a specific volume or mass of carbon dioxide to be released. The reaction rate is calculated by dividing the quantity of carbon dioxide produced by the time (see Equation 4). The rate of the reaction describes how fast the reaction occurs - the faster the rate, the less time that is needed for a specific amount of reactants to be converted into products.
ate R = timechange in the number of moles of CO2 Equation 4
Some factors that affect the rates of chemical reactions include the nature of the reactants, their concentration, the reaction temperature, the surface area of solids, the presence of catalysts. The relationship between the rate of a reaction and the concentration of reactants is expressed in a mathematical equation called a rate law. For a general reaction of the form
A + B → C
3

the rate law can be written as Rate = k [A]n[B]m
where k is the rate constant, [A] and [B] are the molar concentrations of the reactants, and n and m are exponents that define how the rate depends on the individual reactant concentrations. The rate decreases over the course of the reaction as the concentrations of the reactants decrease. Rate laws are usually determined by analyzing the rate after approximately 10-20% of reactant(s) have been consumed. For a heterogeneous reaction, that is, a reaction that contains a pure solid or liquid, the concentration of the solid(s) and/or liquid(s) are omitted from the rate law expression. That is because the concentration of a pure solid or liquid is equivalent to its density divided by its molar mass. The density and molar mass remain essentially constant with constant temperature and thus, the concentration of a pure solid or liquid does not change significantly over the course of a reaction. For this reason, a reaction such as
H2 (aq) + B (s) → C
would have a rate law form written as
Rate = k [A]n
The concentration of B, a solid, has been omitted as it will remain constant throughout the course of the reaction. The exponents n and m are also referred to as the order of reaction with respect to each reactant. In the above reaction, the reaction is said to n th order in A and m th order in B. In general, n and m will positive whole numbers - typical values of n and m are 0, 1 and 2. When the order = 0, the rate does not depend on the concentration of that particular reactant. When order = 1, the rate has a linear dependence on the concentration of that reactant (i.e., concentration doubles, rate doubles or concentration is quartered, rate is quartered). In essence the same effect that is applied to the concentration is also applied to the rate. When order = 2, the rate has an exponential dependence on the concentration of that reactant (i.e., concentration doubles, rate quadruples [22=4] or concentration is divided by 3, rate is divided by 9 [⅓2 = 1/9]). The values of the order MUST be determined experimentally - they cannot be predicted simply by looking at the coefficients of the balanced chemical equation (although in some cases, the the coefficients may accidentally be the same as the order, but there is no correlation). Prelab Questions (7 pts)
1. Collision theory states that the rate of the reaction depends on the number of collisions between molecules or ions, the average energy of the collisions and their effectiveness. How does the dependence of rate on concentration support the ideas of collision theory? Explain.
_________________________________________________________________________________________________ _________________________________________________________________________________________________ _________________________________________________________________________________________________ _________________________________________________________________________________________________
2. The reaction expressed in Equation 3 will have the following rate law form: rate = k [HCl]n. Explain why the concentration of calcium carbonate does not appear in the rate law.
_________________________________________________________________________________________________ _________________________________________________________________________________________________ _________________________________________________________________________________________________ _________________________________________________________________________________________________
3. The average rate of hydrogen peroxide with iodide ions to produce iodine wa determined for three initial concentrations of hydrogen peroxide as shown in the table below. What is the order of the reaction with respect to hydrogen peroxide? Explain your reasoning.
4

_________________________________________________ _________________________________________________ _________________________________________________ _________________________________________________ _________________________________________________ _________________________________________________ _________________________________________________ _________________________________________________ Materials
Calcium carbonate (marble chips), CaCO3, 3-5 g Gas collection apparatus Hydrochloric acid solution, 6 M, 30 mL Syringe, 140-mL Silicon grease or petroleum jelly Syringe adaptor Water, distilled Stopcock/valve Analytical balance Stopper, one-hole Beakers, 100- or 150-mL, 3 Graduated cylinder, 10 mL Clamp, buret Mortar and pestle Erlenmeyer flasks, 125-mL, 3 Timer/stopwatch Test tubes, 5 Wash bottle Test tube rack Serological pipette
Safety Hydrochloric acid is corrosive to skin and eyes and toxic by inhalation or skin absorption. Avoid contact with eyes and skin and clean up all spills immediately. For the gas collection experiment, do not use more than 0.5 g of calcium carbonate per trial or exceed a hydrochloric acid concentration of 6 M in any trial. Wear chemical safety glasses, gloves and a chemical-resistant apron. wash hands thoroughly with soap and water before leaving the laboratory. please follow all laboratory safety guidelines! Procedure ➸ Day 1 In your groups, review the list of materials and discuss how many trials will be necessary to determine the rate law, including an order with respect to hydrochloric acid. Your goal today is to prepare the necessary dilutions of hydrochloric acid that you will be using for these trials. Each trial should…
○ use no more than 10 mL of stock or diluted hydrochloric acid solution. ○ use a similar mass and surface area of marble chip (do not exceed 0.5 g in any trial). ○ be timed starting when the stopper and syringe are replaced in the flask. ○ ensure that the rubber gasket of the syringe has been lightly greased with silicone jelly to prevent “sticking”
of plunger to syringe body. Questions ➸ Day 1 (8 pts)
1. How many trials will your group be conducting and what will be [HCl] in each? _________________________________________________________________________________________________ _________________________________________________________________________________________________ _________________________________________________________________________________________________
2. You have 6 M HCl stock solution to work with and should prepare no more than 10 mL of any dilution. Show your dilution calculation for at least one trial and fill in the necessary volumes of stock solution and water for all trials. Add more rows to the table if necessary.
_________________________________________________________________________________________________ _________________________________________________________________________________________________
5

_________________________________________________________________________________________________
Trial Stock Solution Diluted Solution Volume Stock Solution Volume Water Total Volume
1 6 M 10 mL
2 6 M 10 mL
3 6 M 10 mL
4 6 M 10 mL
3. How will you ensure that each trial contains a uniform sample of calcium carbonate (marble chip)?
_________________________________________________________________________________________________ _________________________________________________________________________________________________ _________________________________________________________________________________________________ Procedure ➸ Day 2
1. Obtain and prepare the samples of calcium carbonate that will be used in your trials. Record the precise mass of each in the data table.
2. Place the first sample of calcium carbonate to be used into a 125-mL
Erlenmeyer flask.
3. Set up the gas-collection apparatus as shown in Figure 1. Make sure the rubber stopper fits securely in the flask and that the valve is open. It may be helpful to use silicon jelly to ensure a snug and smooth fit for the stopper.
4. Remove the stopper and syringe assembly from the flask and quickly but
carefully add the first sample of hydrochloric acid sample to be used to the flask. Immediately replace the stopper and syringe assembly in the flask and begin timing.
5. The syringe plunger will gradually expand and lift upward as gas is generated
and collects in the syringe.
6. Measure the volume of gas in the syringe at one-minute intervals for at least 5 minutes. To overcome friction between the plunger and syringe body, it may be helpful to depress the plunger gently just before taking a volume reading.
7. Repeat steps 2-6 for all remaining calcium carbonate samples.
Data Table ➸ Day 2 (8 pts)
Trial
6

Mass CaCO3 (g)
[HCl]
Volume CO2 @ 1 min
Volume CO2 @ 2 min
Volume CO2 @ 3 min
Volume CO2 @ 4 min
Volume CO2 @ 5 min
add additional data cells as needed for more trials/more time intervals
Graphs and Results ➸ Day 2 (27 pts)
● Graph volume (in mL) of CO2 produced on the y-axis vs. time (in min) on the x-axis for each trial. ● Be sure to label axes with titles and units and label each graph with a trial number. ● Determine the initial by finding the linear slope in the first few minutes of each trial (show an example below). ● Complete the table of initial rates below.
TRIAL _________ TRIAL _________
TRIAL _________ TRIAL _________
7

Show an example of initial rate (slope) determination. Include units. ______________________________________________________________________________________________ _________________________________________________________________________________________________ _________________________________________________________________________________________________
Trial [HCl] (M) Initial rate of appearance of CO2 (include units!)
1
2
3
4
rate = k [HCl]n
Based on the results in the table above, what is n , the order of the reaction with respect to HCl? Explain your reasoning. _________________________________________________________________________________________________ _________________________________________________________________________________________________ __________________________________________________________________________________________________________________________________________________________________________________________________ _________________________________________________________________________________________________ _________________________________________________________________________________________________ Results (5 pts) n determined correctly, with reasonable explanation: 5 pts n determined incorrectly, but with reasonable explanation: 3 pts n determined incorrectly, and with unreasonable explanation: 1 pt
8

Name: ____________________________ Period: _____ Date: ________
KINETICS OF CRYSTAL VIOLET FADING Purpose The purpose of this lab is to use spectroscopy and graphical analysis to determine the rate law for the color-fading reaction of crystal violet with sodium hydroxide. A calibration curve of absorbance vs. concentration of crystal violet dye will be prepared first, using a series of standard dilutions. Each standard will be measured at an optimum wavelength for absorbance. The Beer-Lambert law will be used, along with the calibration curve, to determine the concentration of the dye using an absorbance reading taken at timed intervals during the fading reaction. Finally, graphs of concentration, natural logarithm of concentration and inverse concentrations as functions of time will be prepared and examined for linear quality to determine the order of the reaction with respect to crystal violet. Background Crystal violet belongs to a class of intensely colored organic compounds called triphehylmethane dyes. The structure and color of crystal violet depends on pH, making it a valuable acid-base indicator as well as an excellent dye. The major structural form of crystal violet is the monovalent cation, abbreviated CV+, which is shown in Figure 1a. CV+ is the predominant form of crystal violet in the solid state in the aqueous state across a broad range of pH values from 1 to 13. The positive charge shown on the central carbon atom in Figure 1a is delocalized via resonance to the three nitrogen atoms. See Figure 1b for one of the three additional resonance forms with the positive charge on the nitrogen atom. Delocalization of the charge across the system of double bonds in the benzene rings stabilizes the carbocation and is responsible for the vibrant purple color the dye.
In strongly basic solutions, the purple CV+ cation slowly combines with hydroxide ions to form a neutral product, CVOH, which is colorless (see Figure 2).
9

The rate of the reaction (Equation 1) is slower than typical acid-base proton transfer reactions and depends on the initial concentration of both crystal violet and hydroxide ions.
CV+ + OH- → CVOH Equation 1 purple colorless
Exactly how much the rate changes as the reactant concentration is varied depends on the rate law for the reaction. In the case of the reaction of CV+ with OH- ion, the rate law has the general form
Rate = k [CV+]n[OH-]m Equation 2 The exponents n and m are defined as the order of reaction for each reactant and k is the rate constant for the reaction at a particular temperature. The values of the exponents n and m must be determined by experiment. When the concentration of OH- is much greater than the concentration of CV+ ions (1000:1), the [OH-]m term will not change significantly over the course of the reaction compared to the [CV+]n term. It may therefore be treated as a constant and Equation 2 can be reduced to the form
Rate = k [CV+]n Equation 3 Equation 3 is an example of a pseudo-rate law. The prefix “pseudo” indicates that it is a simplification of the true rate law. Recall that the absorbance for a specific concentration of a solution with a fixed path length varies directly with the absorptivity coefficient of the solution. This relationship is known as the Beer-Lambert law, or Beer’s law.
A = abc Equation 4 where A is the absorbance of the solution, a is the molar absorptivity coefficient, b is the path length in cm, corresponding to the distance light travels through the cuvette and solution, and c is the concentration of the solution. Beer’s law provides the basis of spectroscopy in quantitative analysis. Using this relationship, concentration and absorbance may be calculated if one variable is known while keeping a and b constant. This relationship is also extremely valuable in kinetics experiments, making it possible to follow the rate of disappearance of a colored substance while measuring its absorbance as a function of time.
10

Prelab Questions (10 points) The visible absorption spectrum for crystal violet, CV+, is shown in Figure 3. The concentration of the dye used to prepare the spectrum was 12.5 µM (1.25 x 10⁻⁷ M).
1. Absorbance measurements are most accurate and sensitive in the range of 0.2-1.0.
a. What would be the optimum wavelength for generating a Beer’s law calibration curve for CV+? ______________________________________________________________________________________________ _________________________________________________________________________________________________ _________________________________________________________________________________________________
b. What would be the approximate absorbance of 12.5 µM CV+ at the chosen wavelength in part (a)?
______________________________________________________________________________________________ _________________________________________________________________________________________________ _________________________________________________________________________________________________
2. Absorbance and concentration are proportional and thus can be related as . Using this information and yourc1
A1 = c2
A2 answer from part (1b), complete the table below of estimated absorbances for the additional four standards A-D that will be prepared. Show one example of your calculations.
______________________________________________________________________________________________ _________________________________________________________________________________________________ _________________________________________________________________________________________________
Standard A B C D E
Concentration CV+ 2.5 µM 5.0 µM 7.5 µM 10.0 µM 12.5 µM
Estimated absorbance
3. The CV stock solution has a concentration of 25 µM. Using the 25 µM stock solution, complete the following table to
show how you would prepare 2.5, 5.0, 7.5, 10.0 and 12.5 µM solutions of CV+. Assume that the final volume of each standard will be 10.0 mL in all cases. Show one example of your calculations.
______________________________________________________________________________________________ _________________________________________________________________________________________________ _________________________________________________________________________________________________
11

A B C D E
Concentration (micromolar, µM) 2.5 5.0 7.5 10.0 12.5
Stock solution (mL)
Water (mL)
Total (mL) 10 10 10 10 10
Materials
Crystal violet solution, 25 µM (2.5 x 10⁻⁵ M), 50 mL Cuvettes or test tubes Sodium hydroxide solution, NaOH, 0.02 M, 30 mL Pipette, serological, 10-mL Water, distilled Pipette filler Beaker, borosilicate, 50-mL Stirring rod Spectrophotometer or colorimeter
Safety Dilute sodium hydroxide solution is irritating to eyes and skin. Crystal violet is a strong dye and will stain clothes and skin. Clean up all spills immediately. Wear chemical safety glasses, gloves and a chemical-resistant apron. wash hands thoroughly with soap and water before leaving the laboratory. Please follow all laboratory safety guidelines!
Procedure ➸ Day 1
1. Turn on spectrophotometer or colorimeter and allow it warm up for 15-20 minutes before use. Adjust the wavelength setting to the optimum wavelength that you selected in the Prelab section.
2. Obtain approximately 20 mL of 25 µM crystal violet stock solution in a 50-mL beaker.
3. Using proper dilution techniques and practices, prepare standards A-E as described in the Prelab section.
4. Calibrate the spectrophotometer or colorimeter (note: it is helpful to “check” the calibration after every 3-4 readings or
so to ensure accuracy).
5. Record absorbance readings for the standards in the Day 1 Data Table.
Data Table ➸ Day 1 (5 points)
Standard A B C D E
Concentration
Absorbance
12

Graph ➸ Day 1 (10 points) Prepare a calibration curve using Excel, Google Sheets or neatly by hand that includes the following:
● Absorbance values plotted along the y-axis; concentration values plotted along the x-axis ● Title for graph ● Labels and units (when necessary) for axes ● Appropriate spacing for data points ● A linear trendline with equation displayed ● An R2 value (the closer to 1, the more reliable your data is)
Paste below or attach your graph to the lab report. The trendline equation for this graph is _________________________________________. Substituting y and x for absorbance (A) and concentration (c), the equation is __________________________________.
13

Procedure ➸ Day 2 1. Turn on spectrophotometer or colorimeter and allow it warm up for 15-20 minutes before use. Adjust the wavelength
setting to the optimum wavelength that you selected in the Prelab section.
2. Prepare a “blank” for analysis that is equal volumes of distilled water and 0.02 M NaOH. Fill a cuvette with this blank and use it to calibrate the spectrophotometer or colorimeter.
3. Measure 10.0 mL of 25 µM crystal violet stock solution using a serological pipette and add it to a clean 50-mL
beaker.
4. Rinse the pipette several times with distilled water, then rinse it several times with small volumes of 0.02 M NaOH solution.
5. Measure 10.0 mL of 0.02 M sodium hydroxide using the rinsed serological pipette. Add the NaOH to the 50-mL
beaker with crystal violet and immediately begin timing the reaction.
6. Transfer the reacting solution to a cuvette and clean the outside of the cuvette with a lint-free wipe. Place into the colorimeter and close the lid.
7. Record absorbance measurements every 20 seconds for 15 minutes. Note: you will not be able to get a reading for 0
seconds and possibly not for 20 seconds either; this is perfectly ok. Try to begin recording absorbances by 40 seconds into the reaction.
8. Thoroughly scrub all glassware and cuvettes immediately when finished with reaction; crystal violet will stain
glassware and render it otherwise useless! Data Table ➸ Day 2 (5 points)
Time (s) Absorbance Time (s) Absorbance Time (s) Absorbance Time (s) Absorbance
0 260 520 780
20 280 540 800
40 300 560 820
60 320 580 840
80 340 600 860
100 360 620 880
120 380 640 900 (15 min)
140 400 660
160 420 680
180 440 700
200 460 720
220 480 740
240 500 760
14

Calculations and Graphs ➸ Day 2 (20 points) Instructions and examples for calculations and graph preparations here: Attach your spreadsheet of calculations and graphs for [CV] vs. time, ln[CV] vs. time, and 1/[CV] vs. time to your lab report. What is the order of the reaction with respect to crystal violet? Justify your answer using evidence from your three graphs. _________________________________________________________________________________________________ _________________________________________________________________________________________________ __________________________________________________________________________________________________________________________________________________________________________________________________ _________________________________________________________________________________________________ _________________________________________________________________________________________________ Results (5 pts) order determined correctly, with reasonable explanation: 5 pts order determined incorrectly, but with reasonable explanation: 3 pts order determined incorrectly, and with unreasonable explanation: 1 pt
15

this page is intentionally blank!
16

Name: ____________________________ Period: _____ Date: ________
ACIDITY OF BEVERAGES
Purpose The goal of this lab is to conduct acid-base titrations and determine the concentration of acid in common beverages such as orange juice or pineapple juice. The beverages contain weak acids, which will be titrated with a strong base, such as sodium hydroxide. Data will be obtained to determine the concentration of the weak acid present in the beverage and to construct a titration curve for the reaction. Background The main acids present in fruits and fruit juices are citric acid (in citrus fruits), tartaric acid (in grapes), and malic acid (in apples). All of these are characterized as weak acids.
The amount of citric acid in citrus fruit juices can be determined by titration with a standardized solution of base, such as sodium hydroxide. A standard solution is one whose concentration is accurately known, usually to three significant figures. In a titration, a sodium hydroxide solution of known molarity is carefully and slowly added using a buret to a measured volume of fruit juice containing an indicator. The exact volume of sodium hydroxide that must be be added to reach the indicator endpoint is measured and then used to calculate the concentration of citric acid in the juice that was neutralized. Citric acids is a tricarboxylic acid - it has three ionizable or “active” hyrdogen atoms in its structure. One mole of citric acid therefore reacts with three moles of sodium hydroxide via the acid-base neutralization reaction shown below in Equation 1.
Acid-base titrations are an extremely useful technique to determine the concentration of an acid or base in a sample. In titrating beverages such as orange juice, apple juice and sodas that contain weak acids, the beverage is called the analyte and the strong base is used as the titrant . A sample setup for a titration is shown in Figure 2, where a buret containing the titrant is clamped to a support stand and a beaker or flask containing the analyte is set atop a stir plate. If a pH probe is
17

inserted into the solution, a titration curve can be constructed by plotting the pH of the solution on the y-axis versus the volume of the titrant added on the x-axis. The shape of the titration curve may be used to distinguish strong and weak acids in the analyte, and also permits graphic analysis of the equivalence point . At the equivalence point, moles of added titrant are stoichiometrically related to moles of the analyte in the sample. For example, in Equation 1, the equivalence point would occur when 1 mole of citric acid has been neutralized by 3 moles of NaOH. Choosing a suitable indicator for a titration is important for accurate results. Indicators signify the endpoint of a titration when a sudden change in the color of the analyte solution occurs. Indicators have different pH transition ranges and exhibit different colors in acidic versus basic solutions. The color change arises because indicators are weak acids fro which the form HIn and the conjugate base form In- have different colors. An appropriate indicator for a titration is one whose color change occurs close to the theoretical pH of the equivalence point. Examples of indicators are shown in the following table, along with their colors and pH ranges.
Indicator pH range Color change
Bromothymol blue 6.0 - 7.6 Yellow to blue
Phenolphthalein 8.2 - 10.0 Colorless to pink
Thymol blue 8.0 - 9.6 1.2 - 2.8
Yellow to blue Red to yellow
Prelab Questions (8 pts)
1. What is the molar mass of citric acid? Use the formula from Figure 1 to help you. _________________________________________________________________________________________________ _________________________________________________________________________________________________ _________________________________________________________________________________________________
2. A 10.0-mL sample of pineapple juice was titrated with 0.100 M sodium hydroxide, NaOH solution. The average volume of NaOH required to reach the endpoint was 12.8 mL.
a. Calculate the number of moles of sodium hydroxide required to reach the endpoint. _________________________________________________________________________________________________ _________________________________________________________________________________________________ _________________________________________________________________________________________________
b. Using the mole ratio for the reaction shown in Equation 1, determine the number of moles of citric acid that was neutralized by the amount of sodium hydroxide determined in part (a).
_________________________________________________________________________________________________ _________________________________________________________________________________________________ _________________________________________________________________________________________________
c. Use your answer from Question 1 to determine the mass of citric acid in 10.0 mL of the juice. _________________________________________________________________________________________________ _________________________________________________________________________________________________ _________________________________________________________________________________________________
d. The concentration of acid in juices is typically described in grams of acid per 100 mL of juice. What is the concentration of citric acid in pineapple juice?
_________________________________________________________________________________________________ _________________________________________________________________________________________________ _________________________________________________________________________________________________
18

3. Write balanced chemical equations for the neutralization reaction of…
a. hydrochloric acid with sodium hydroxide _________________________________________________________________________________________________ _________________________________________________________________________________________________
b. acetic acid with sodium hydroxide _________________________________________________________________________________________________ _________________________________________________________________________________________________
4. The titration curves for the reactions from Question 3 are shown below.
a. What was the initial pH of each reaction?
_________________________________________________________________________________________________ _________________________________________________________________________________________________ _________________________________________________________________________________________________
b. What was the pH of at the equivalence point for each reaction? _________________________________________________________________________________________________ _________________________________________________________________________________________________ _________________________________________________________________________________________________
c. How do the shapes of the titration curves for strong acids with strong bases differ from those of weak acids with strong bases?
_________________________________________________________________________________________________ _________________________________________________________________________________________________ _________________________________________________________________________________________________ Materials
Sodium hydroxide, NaOH, 0.100 M Phenolphthalein, 1-2 mL Samples, fruit juices or soda, 60-mL Magnetic stirrer and stir bar Water, distilled pH meter Beaker, 150-mL Support stand and buret clamp
19

Beral pipettes Funnel Buret, 50-mL Graduated cylinder, 100-mL
Safety Dilute sodium hydroxide and acid solutions are irritating to eyes and skin. Avoid contact of all chemicals with eyes and skin. All food-grade items that have been brought into the lab are considered laboratory chemicals and are for lab use only. Do not taste or ingest any materials in the chemistry lab. Do not remove any food items from the lab after they have been used in the lab. Wear chemical safety glasses, gloves and a chemical-resistant apron. Wash hands thoroughly with soap and water before leaving the laboratory. Please follow all laboratory safety guidelines! Procedure ➸ Day 1
1. Obtain 20-mL of fruit juice or soda, whichever your group has been assigned. Be sure to record the identity of your sample in the Day 1 Data Table. Place your sample in a 150-mL beaker.
2. Dilute your sample with approximately 30-mL of distilled water for a sample volume of 50-mL in total.
3. Add a few drops of phenolphthalein indicator to the beaker.
4. Carefully add a stir bar to the beaker and set on the stir plate mixing at a low-moderate speed (no splashing).
5. Now prepare your buret. Make sure the valve is closed (perpendicular to body). Using a funnel, add approximately
5-10 mL of sodium hydroxide solution to the buret. Over the sink, open the valve and allow the rinse solution to drain. Repeat this process twice more for a total of three rinses. Close the buret valve and clamp to the ring stand.
6. Again using a funnel, fill the buret close to, but not over the 50.00-mL mark. Record the initial volume of the buret,
estimating the hundredths place.
7. Place a clean and dry pH probe into the 150-mL beaker and record the initial pH.
8. Position the stirring plate with beaker and probe directly under the buret tip. Carefully, slowly open the buret valve and add 1 mL of titrant (NaOH solution) to the analyte (juice/soda solution), then close the valve. Record the pH.
9. Continue adding 1 mL volumes of titrant and recording the resulting pH until you have added a total of 40.00 mL of
titrant. Additionally, highlight, star or circle the point during the titration when a significant and persistent color change occurs.
10. Turn off probe and stirrer, clean all instruments and glassware.
Data Table ➸ Day 1 (10 pts)
Analyte identity:
Titrant pH Titrant pH Titrant pH Titrant pH
20

volume (mL) volume (mL) volume (mL) volume (mL)
Graph ➸ Day 1 (10 pts) Prepare a titration curve using Excel, Google Sheets or neatly by hand. Your graph should include:
● pH along the y-axis; volume titrant along the x-axis ● Title for graph ● Labels and units (when necessary) for axes ● Appropriate spacing for data points ● An arrow, circle, highlight, or other significant marker for the color change that occurred.
Attach your graph to the lab report. Procedure ➸ Day 2 Using the same techniques as Day 1, perform two additional titrations, each with 20.0-mL samples of juice or soda. Today, you will not use a probe or measure pH, as the goal is not to prepare a titration curve, but to determine the mass of weak acid in the beverage. Therefore, only titrate to the endpoint. Since you know from yesterday where the endpoint will be (approximately), quickly add the majority of titrant, then slowly add dropwise until you have reached the first sign of a faint but persistent color change of the indicator. For example, if you learned yesterday that it took 12.85 mL of titrant to reach the endpoint, today quickly add 10 or 11 mL of titrant, then add dropwise until you can find the exact endpoint. Record initial and final volumes of the titrant in the buret. Tips for a “perfect” titration:
● Ensure that no bubbles are seen in the buret or buret tip. ● Use your squeeze bottle of distilled water to periodically rinse down any droplets that may splash onto the sides of
the beaker. ● You may see “flashes” of color right where the buret stream hits the analyte; this is not the endpoint unless the color
change is persistent after mixing for a few seconds. ● Read the volume of the buret at eye level...you may need to stand on a chair! ● Don’t forget to add the indicator - you will titrate forever!
Data Table ➸ Day 2 (7 pts)
Trial Initial volume titrant Final volume titrant Total volume titrant added
Color at endpoint
21

1
2
Calculations ➸ Day 2 (12 pts) Choose a trial to show a set of calculations.
1. How many moles of 0.100 M NaOH were used to neutralize the weak acid in the juice or soda? _________________________________________________________________________________________________ _________________________________________________________________________________________________
2. How many moles of acid were neutralized by this amount of sodium hydroxide? _________________________________________________________________________________________________ _________________________________________________________________________________________________
3. What mass of citric acid is present in a 20.0 mL of fruit juice? _________________________________________________________________________________________________ _________________________________________________________________________________________________
4. How many grams of acid are present per 100 mL of juice? _________________________________________________________________________________________________ _________________________________________________________________________________________________ Results (8 pts)
Identity of beverage
Trial Grams acid/100 mL juice Average True value (for teacher)
Points earned (for teacher)
1
2
0-20% error: 8 pts 20-40% error: 6 pts 40-60% error: 4 pts 60%+ error: 2 pts
Name: ____________________________ Period: _____ Date: ________
DESIGNING A HAND WARMER
22

Purpose The goal of this lab is design an effective hand warmer that is inexpensive, nontoxic and safe for the environment. Each group will be provided with several different solids, along with costs and individual Material Safety Data Sheets (MSDS). The heat of solution will be determined for each solid using principles of calorimetry, and this information, along with cost and safety will be used to propose a design for best all-around hand warmer. Background Hand warmers are familiar cold weather gear used to to quickly provide warmth to frigid fingers. Many commercial hand warmers consist of plastic packaging containing a solid and an inner pouch filled with water. When the pack is activated, the solid dissolves in water and produces a large temperature change. The energy or enthalpy change associated with the process of a solute dissolving in a solvent is called the heat of solution (ΔHsoln). At constant pressure, this enthalpy change, ΔHsoln, is equal in magnitude to the heat loss or gain, q , to the surroundings. Recall that energy cannot be gained or lost, it is conserved while it is transferred from one body to another! In the case of an ionic solid dissolving in water, the overall energy change is the net results of three processes:
1. The energy required to break the attractive forces in the ionic crystal lattice (ΔH1 = +X kJ/mol) 2. The energy required to disrupt intermolecular forces between water molecules (ΔH2 = +Y kJ/mol) 3. The energy released when the dissociated (free) ions form ion-dipole attractive forces with the water
molecules (ΔH3 = -Z kJ/mol) The overall process can be represented by the following equation:
ΔHsoln = ΔH1 + ΔH2 + ΔH3 = (X + Y - Z) kJ/mol Equation 1 If the amount of energy released in the third process (ΔH3) is greater than the amount of energy required to separate the solute and solvent particles (ΔH1 + ΔH2), then the sum (ΔHsoln) of the energy changes will be negative and the solution process is exothermic (releases or gives off heat). If the amount of energy released in the third process is less than the amount of energy required to separate the solute and solvent particles, then the sum of energy changes will be positive and the solution process is endothermic (requires or absorbs heat). Heats of solution and other enthalpy changes are generally measured in an insulated vessel called a calorimeter that reduces or prevents heat loss to the atmosphere outside the reaction vessel. The process of a solute dissolving in water may either release heat into the resulting aqueous solution or absorb heat from the solution, but the amount of heat exchanged between the calorimeter and the outside surroundings should be minimal. When using a calorimeter, the reagents being studied are mixed directly in the calorimeter and the temperature is recorded both before and after the reaction has occurred. The amount of heat transfer (q ) may be calculated using the following heat energy equation:
q aq = m × c × ΔT Equation 2 Where m is the total mass of the solution (solute plus solvent), c is the specific heat capacity of the solution, and ΔT is the observed temperature change. The specific heat capacity of the solution is generally assumed to be the same as that of water, namely, 4.18 J/g oC. When measuring the heat transfer for an exothermic heat of solution using a calorimeter, most of the heat released is absorbed by the aqueous solution (q aq ). A small amount of heat, however, will be absorbed by the calorimeter itself (q cal ). The overall heat transfer (q soln ) for the reaction the becomes:
q soln = - (q aq + q cal ) Equation 3 In order to determine the correction factor q cal for heat of solution calculations, the heat capacity of the calorimeter, also called the calorimeter constant, C cal , must be determined experimentally.
23

q cal = C cal ΔT Equation 4
The calorimeter constant has units J/oC. This correction factor is determined by mixing equal volumes of hot and cold water together. The hot water will lose energy (-q hot ) and the cold water will gain energy (+q cold ). Additionally, the calorimeter will absorb some energy from the hot water as well (+q cal ), creating the expression:
-q hot = (q cold +q cal ) Equation 5 Substituting the variables from Equations 2 and 4 into Equation 5, the expression becomes:
-(m hot × c water × ΔT hot ) = (m cold × c water × ΔT cold ) + (C cal × ΔT cold ) Equation 6 Therefore, if the masses of hot and cold water are determined prior to mixing, as well as the initial temperatures of hot and cold water and the final temperature of the mixed system are all measured, then C cal can be determined by rearranging the variables of Equation 6 to the following expression:
Ccal = ΔT cold−(m × c × ΔT ) − (m × c × ΔT )hot water hot cold water cold Equation 7
Prelab Questions (8 pts)
1. When chromium chloride, CrCl2, is dissolved in water, the temperature of the water decreases. a. Is the heat of solution exothermic or endothermic? Explain.
_________________________________________________________________________________________________ _________________________________________________________________________________________________ _________________________________________________________________________________________________
b. Which is stronger - the attractive forces between water molecules and chromium and chloride ions, or the lattice energy of CrCl2 and the intermolecular forces of water? Explain.
_________________________________________________________________________________________________ _________________________________________________________________________________________________ _________________________________________________________________________________________________
2. A solution was formed by combining 25.0 g of solid A with 60.0 mL of distilled water, with the water initially at 21.4oC. The final temperature of the solution was 25.3oC. Calculate the heat released as the solid dissolves, q soln , assuming that no heat is lost to the calorimeter. See Equation 2.
_________________________________________________________________________________________________ _________________________________________________________________________________________________ _________________________________________________________________________________________________
3. The experiment in Question 2 was repeated, this time with a correction factor included to account for heat lost to the calorimeter. C cal
was found to be 8.20 J/oC. [Use Equations from Background to help you answer the following]. a. What is q cal ?
_________________________________________________________________________________________________ _________________________________________________________________________________________________ _________________________________________________________________________________________________
b. What is q soln ? _________________________________________________________________________________________________ _________________________________________________________________________________________________ _________________________________________________________________________________________________
24

4. The solid from Question 2 is aluminum sulfate, Al2(SO4)3. Calculate the molar heat of solution, ΔHsoln , for aluminum sulfate. Hint: the units for molar heat of solution are kJ/mol...first determine the heat released per gram of solid.
_________________________________________________________________________________________________ _________________________________________________________________________________________________ _________________________________________________________________________________________________ Materials
Solids: Ammonium chloride, NH4Cl, 15 g Calorimeter (two nested polystyrene cups) Calcium chloride, CaCl2, 15 g Graduated cylinder, 100-mL Sodium acetate, NaC2H3O2, 15 g Heat-resistant gloves or tongs Sodium chloride, NaCl, 15 g Hot plate Lithium chloride, LiCl, 15 g Magnetic stirrer and stir bar Sodium carbonate, Na2CO3, 15 g Paper towels Magnesium sulfate, MgSO4, 15 g Support stand and ring clamp
Water, distilled Thermometer, digital Analytical balance Timer Beaker, 250-mL Weighing dishes
Safety Lithium chloride is moderately toxic by ingestion. Calcium chloride and ammonium chloride are slightly toxic. Magnesium sulfate is a body tissue irritant. Sodium acetate is a body tissue irritant and respiratory tract irritant. Avoid contact of all chemicals will eyes and skin. Wear chemical safety glasses, gloves and a chemical-resistant apron. Wash hands thoroughly with soap and water before leaving the laboratory. Please follow all laboratory safety guidelines! Procedure ➸ Day 1
1. Set up a calorimeter consisting of two nested polystyrene cups in a ring clamp attached to a support stand.
2. Place a magnetic stirrer below the calorimeter, then
lower the ring clamp until the bottom of the cup just sits on the surface of the magnetic stirrer (see Figure 1).
3. Measure 100.0 mL of distilled water in a 100-mL
graduated cylinder and transfer the water into the calorimeter.
4. Add a magnetic stir bar to the calorimeter and set the bar spinning slowly.
5. Measure and record the initial temperature of the water, T cold, initial , in the Day 1 Data Table.
6. Carefully pour 100.0 mL of hot water in a 100-mL graduated cylinder. Measure and record the temperature of the
hot water, T hot, initial , in the Day 1 Data Table. 7. Immediately pour the hot water into the room temperature water in the calorimeter. (Stir bar should be stirring
continuously).
8. Insert the thermometer and record the final temperature, T final , after 20 seconds of mixing.
9. Empty and dry the calorimeter.
25

10. Repeat Steps 3-9 at least once more.
11. Calculate the calorimeter constant, C cal , using Equation 7 from the Background section.
Data Table ➸ Day 1 (7 pts)
Trial mcold* Tcold, initial mhot* Thot, initial Tfinal ΔTcold ΔThot
1
2
*assume the density of water is 1 g/mL at all temperatures. Calculations ➸ Day 1 (8 pts) Choose one trial to show your calculations.
1. What is C cal ? Show work and include units. _________________________________________________________________________________________________ _________________________________________________________________________________________________ _________________________________________________________________________________________________ _________________________________________________________________________________________________ _________________________________________________________________________________________________
2. Give an average C cal value from your trials.
_________________________________________________________________________________________________ _________________________________________________________________________________________________ _________________________________________________________________________________________________ Procedure ➸ Day 2
1. Record your assigned solid in the Day 2 Data Table. You will perform three trials to determine the molar enthalpy of solution, ΔHsoln for your solid.
2. Set up the calorimeter as described in Steps 1 and 2 from Day 1 Procedure (see Figure 1).
3. Measure approximately 5 grams of solid into a weighing dish. Record the exact mass to the nearest 0.001 g.
4. Measure 45.0 mL of distilled water into a 100-mL graduated cylinder. Record the exact volume to the nearest 0.01
mL.
5. Add the water to the calorimeter, set the stir bar to mixing at a low speed. Record the initial temperature of the water, T initial , in the Day 2 Data Table.
6. Add the solid, ensuring that the stir bar continues to move at a constant speed (may need to increase the speed
setting). 7. Record the highest or lowest temperature achieved by the mixture, T final .
8. Retrieve the stir bar, then wash the contents of the calorimeter into the sink and dry thoroughly.
9. Repeat Steps 3-8 at least twice more for a total of three trials.
26

Data Table ➸ Day 2 (7 pts)
Trial msolid mwater* msoln Tintial Tfinal ΔT
1
2
3
*assume the density of water is 1 g/mL at all temperatures. Calculations ➸ Day 2 (10 pts) Choose one trial to show your calculations. Use the equations from the Background section.
1. Using your value of C cal from yesterday, what is q cal _________________________________________________________________________________________________ _________________________________________________________________________________________________ _________________________________________________________________________________________________
2. What is q aq ? _________________________________________________________________________________________________ _________________________________________________________________________________________________ _________________________________________________________________________________________________
3. What is q soln ? _________________________________________________________________________________________________ _________________________________________________________________________________________________ _________________________________________________________________________________________________
4. What is the molar enthalpy (in kJ/mol)? _________________________________________________________________________________________________ _________________________________________________________________________________________________ _________________________________________________________________________________________________ Enter your average molar enthalpy value at the link provided in class. Compare the enthalpies shared by the rest of the students, as well as average price/gram for the chemicals and toxicity warnings. Then, decide which solid will make the best hand warmer, justifying your choice based on heat of solution, price and toxicity. (10 points) _________________________________________________________________________________________________ _________________________________________________________________________________________________ __________________________________________________________________________________________________________________________________________________________________________________________________ _________________________________________________________________________________________________ __________________________________________________________________________________________________________________________________________________________________________________________________ _________________________________________________________________________________________________ _________________________________________________________________________________________________
this page is intentionally blank!
27

Name: ____________________________ Period: _____ Date: ________
HESS’S LAW: HEAT OF FORMATION OF MAGNESIUM OXIDE
Purpose The goal of this lab is to experimentally verify the heat of formation of magnesium oxide, MgO using Hess’s Law. A series of reactions will be performed and their associated enthalpies measured to approximate ΔHf for MgO. Background Energy changes that occur during ordinary chemical reactions can be complex. Chemical reactions involve the breaking of chemical bonds in a given set of reactants, and the formation of new chemical bonds in a given set of products. A common measurement used when discussing the relationship between energy and chemical changes for a chemical process is enthalpy , ΔH. The enthalpy change of a chemical reaction is defined as the amount of heat released or absorbed by the reaction at constant pressure. It is a measurement of the difference between heat content of products and reactants. The sign of the quantity ΔH indicates the direction of energy flow. If ΔH has a negative sign, heat has been transferred from the reactants to the surrounding environment in an exothermic reaction. If ΔH has a positive sign, heat has been transferred from the surrounding environment to the reactants in an endothermic reaction. Enthalpy is known as an extensive property , which means the amount of energy exchanged is based on the amount of substance being investigated, not the pathway of the reaction. Hess’s Law states that the total enthalpy change for any process that consists of a series of steps is equal to the sum of the enthalpies of the individual steps. For example, the reaction shown below
CS2 (l) + 3O2 (g) → CO2 (g) + 2SO2 (g) ΔH = -1076 kJ/mol releases 1076 kilojoules per mole of reactant. This can be verified in one step, as shown in the above reaction, or in a series of steps. Consider the three reactions below and their enthalpies. Reaction 1: C (s) + O2 (g) → CO2 (g) ΔH = -394 kJ/mol Reaction 2: S (s) + O2 (g) → SO2 (g) ΔH = -297 kJ/mol Reaction 3: C (s) + 2S (s) → CS2 (l) ΔH = +88 kJ/mol The reactions can be rearranged to sum to the equation shown previously.
Reaction 1 was unchanged, thus its enthalpy is also unchanged. Reaction 2 was multiplied by 2 in order to match the coefficients of 2 for S and SO2, thus its enthalpy will also be multiplied by 2. Finally, Reaction 3 was reversed in order to put CS2 on the reactant side, thus its enthalpy will have the sign reversed. Adding together these modified enthalpies:
-394 kJ/mol + 2(-297 kJ/mol) + (-88 kJ/mol) = -1076 kJ/mol Although the three reactions were done in a series of steps, their net sum of enthalpies matches the enthalpy of the single step reaction. This is the essence of Hess’s law; the enthalpy change for a reaction is the same regardless of the pathway or sequence of steps taken to arrive at the net reaction.
28

In this lab, Hess’s law will be used to verify the enthalpy of formation of magnesium oxide. Enthalpies of formation, ΔHf
o are defined as the energy change that accompanies one mole of a compound from its constituent elements in their standard states at 1 atmosphere of pressure. The superscript “o” indicates measurements taken at 1 atmosphere of pressure and 25oC, or 298 K. Magnesium oxide, MgO is composed of magnesium and oxygen. Magnesium is a solid at 1 atmosphere and 25oC and oxygen is a diatomic gas at these conditions. Therefore, the equation for the formation reaction is:
Mg (s) + ½ O2 (g) → MgO (s) ΔHfo = -602 kJ/mol The standard value for the enthalpy of formation (referenced here from NIST Chemistry WebBook) is -602 kJ/mol. This reaction is highly exothermic and is generally unsafe to perform in a standard high school laboratory setting. Therefore, it is an ideal reaction to study indirectly, with Hess’s law. The following reactions will be used to confirm the literature value of the enthalpy of formation. Reaction 1: Magnesium with Hydrochloric Acid
Mg (s) + 2HCl (aq) → MgCl2 + H2 (g) The first reaction performed will be a dissolution of magnesium metal in hydrochloric acid. The enthalpy change of the reaction will be measured by calorimetry. It is the choice of your group whether or not to perform a calibration exercise first to determine a calorimeter constant. Reaction 2: Magnesium Oxide with Hydrochloric Acid
MgO (s) + 2HCl (aq) → MgCl2 + H2O (l)
The first reaction performed will be an acid-base reaction between magnesium oxide and hydrochloric acid. The enthalpy change of the reaction will be measured by calorimetry. Again, it is the choice of your group whether or not to perform a calibration exercise first to determine a calorimeter constant. Reaction 3: The Formation of Water
H2 (g) + ½ O2 (g) → H2O (l) ΔHfo = -286 kJ/mol
This reaction will actually not be performed, however, the equation and its corresponding enthalpy value will be used. Enthalpy can be determined using the calorimetry equation
q aq = m × c × ΔT Equation 1 Where m is the total mass of the solution (solute plus solvent), c is the specific heat capacity of the solution, and ΔT is the observed temperature change. The specific heat capacity of the solution is generally assumed to be the same as that of water, namely, 4.18 J/g oC. If calibration steps are not taken, then it can be assumed that all heat generated by the reaction is absorbed by the aqueous solution (or vice versa), and therefore:
q soln = -q aq Equation 2 If calibration steps are taken, then Equation 2 must be adjusted to account for some amount of heat being lost to the calorimeter and surroundings.
q soln = -(q aq + q cal ) Equation 3
29

Where the term q cal can be found by determined the correction factor C cal .
q cal = C cal ΔT Equation 4
Ccal = ΔT cold
−(m × c × ΔT ) − (m × c × ΔT )hot water hot cold water cold Equation 5
Prelab Questions (8 pts)
1. Consider the three reactions described in the Background section that will be needed for this lab. Rearrange those three equations so that they sum to match the stoichiometry of the formation equation for MgO.
_________________________________________________________________________________________________ _________________________________________________________________________________________________ _________________________________________________________________________________________________ _________________________________________________________________________________________________ _________________________________________________________________________________________________ _________________________________________________________________________________________________
2. What will you need to do to the measured enthalpies of Reactions 1, 2 and 3 (reverse the sign, multiply/divide by a number, etc) in order to calculate an experimental value for the enthalpy of formation of MgO?
_________________________________________________________________________________________________ _________________________________________________________________________________________________ _________________________________________________________________________________________________ _________________________________________________________________________________________________ _________________________________________________________________________________________________ _________________________________________________________________________________________________
3. From the following enthalpy changes, Xe (g) + F2 (g) → XeF2 (s) ΔHo = -123 kJ/mol Xe (g) + 2F2 (g) → XeF4 (s) ΔHo = -262 kJ/mol
calculate the value of ΔHo for the reaction XeF2 (s) + F2 (g) → XeF4 (s). Show your work. _________________________________________________________________________________________________ _________________________________________________________________________________________________ _________________________________________________________________________________________________ _________________________________________________________________________________________________ _________________________________________________________________________________________________ _________________________________________________________________________________________________
4. From the following enthalpy changes, 4NH3 (g) + 5O2 (g) → 4NO (g) + 6H2O (l) ΔHo = -1170 kJ/mol 4NH3 (g) + 3O2 (g) → 2N2 (g) + 6H2O (l)ΔHo = -1530 kJ/mol
calculate the value of ΔHo for the reaction N2 (g) + O2 (g) → 2NO (g). Show your work. _________________________________________________________________________________________________ _________________________________________________________________________________________________ _________________________________________________________________________________________________ _________________________________________________________________________________________________ _________________________________________________________________________________________________
30
5. From the following enthalpy changes. C (s) + O2 (g) → CO2 (g) ΔHo = -394 kJ/mol H2 (g) + ½ O2 (g) → H2O (l) ΔHo = -286 kJ/mol 2C2H2 (g) + 5O2 (g) → 4CO2 (g) + 2H2O (l) ΔHo = -2599 kJ/mol
calculate the value of ΔHo for the reaction 2C (s) + H2 → C2H2 (g). Show your work. _________________________________________________________________________________________________ _________________________________________________________________________________________________ _________________________________________________________________________________________________ _________________________________________________________________________________________________ _________________________________________________________________________________________________ _________________________________________________________________________________________________ Materials
Polystyrene cups, 2 Thermometer Weighing tray Metal spatula Magnesium metal pieces Analytical balance Magnesium oxide, solid Graduated cylinder, 100-mL Hydrochloric acid, 1 M Magnetic stirrer and stir bar
Safety Magnesium is a highly flammable solid; keep away from heat, sparks, open flames and hot surfaces. Hydrochloric acid is corrosive, acutely toxic and is a skin and respiratory tract irritant; it will cause severe burns and eye damage. Do not breathe mist, vapors or spray. Wear chemical safety glasses, gloves and a chemical-resistant apron. Wash hands thoroughly with soap and water before leaving the laboratory. Please follow all laboratory safety guidelines! Procedure ➸ Day 1
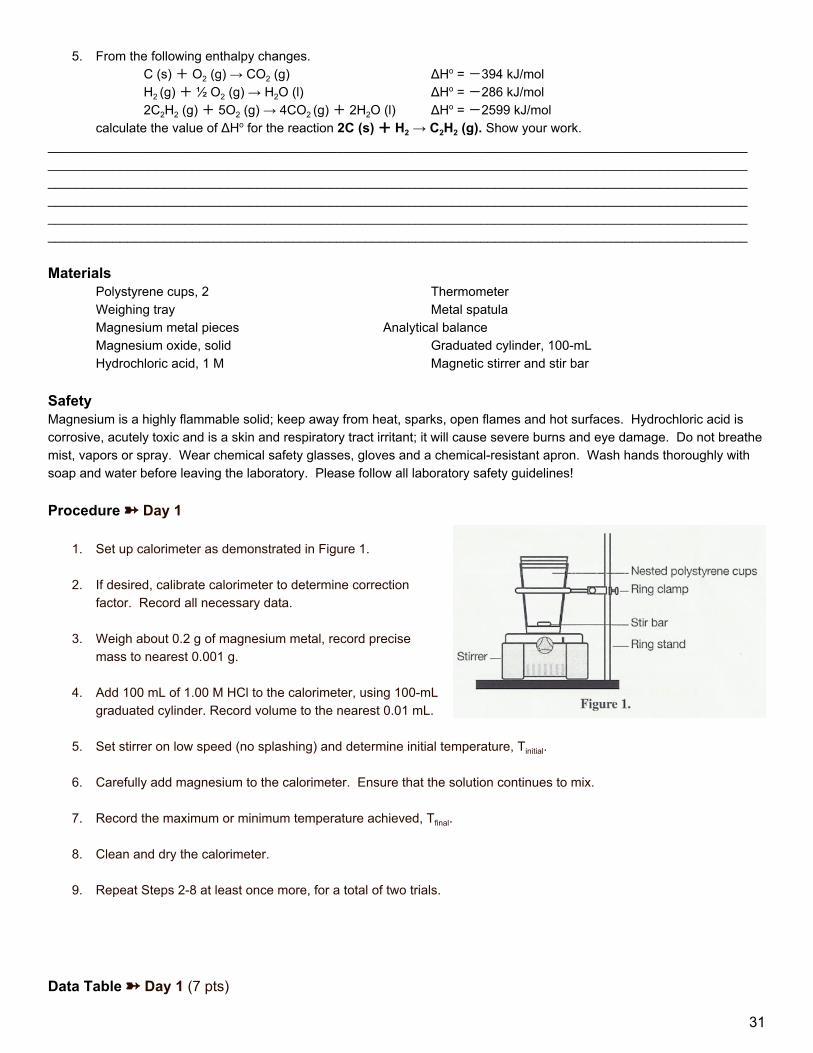
1. Set up calorimeter as demonstrated in Figure 1.
2. If desired, calibrate calorimeter to determine correction factor. Record all necessary data.
3. Weigh about 0.2 g of magnesium metal, record precise
mass to nearest 0.001 g.
4. Add 100 mL of 1.00 M HCl to the calorimeter, using 100-mL graduated cylinder. Record volume to the nearest 0.01 mL.
5. Set stirrer on low speed (no splashing) and determine initial temperature, Tinitial.
6. Carefully add magnesium to the calorimeter. Ensure that the solution continues to mix.
7. Record the maximum or minimum temperature achieved, Tfinal.
8. Clean and dry the calorimeter.
9. Repeat Steps 2-8 at least once more, for a total of two trials.
Data Table ➸ Day 1 (7 pts)
31

Use this Table ONLY if you have decided to determine a calibration correction factor, Ccal.
Trial mcold* Tcold, initial mhot* Thot, initial Tfinal ΔTcold ΔThot
1
2
*assume the density of water is 1 g/mL.
Trial mMg mHCl soln* mtotal Tintial Tfinal ΔT
1
2
*assume the density of the HCl solution is 1 g/mL. Calculations ➸ Day 1 (8 pts) Choose one trial to show your calculations. ONLY answer Questions 1 and 2 if you went through calibration steps.
1. What is C cal ? Show work and include units. _________________________________________________________________________________________________ _________________________________________________________________________________________________ _________________________________________________________________________________________________ _________________________________________________________________________________________________ _________________________________________________________________________________________________
2. Give an average C cal value from your trials.
_________________________________________________________________________________________________ _________________________________________________________________________________________________ _________________________________________________________________________________________________
3. Use the Equations from the Background section to determine q soln . _________________________________________________________________________________________________ _________________________________________________________________________________________________ _________________________________________________________________________________________________
4. Determine the number of moles of Mg used in the trial. _________________________________________________________________________________________________ _________________________________________________________________________________________________ _________________________________________________________________________________________________
5. Determine the enthalpy of solution, in kJ/mol. _________________________________________________________________________________________________ _________________________________________________________________________________________________ _________________________________________________________________________________________________
6. Determine the average ΔHo for Reaction 1. _________________________________________________________________________________________________ _________________________________________________________________________________________________ _________________________________________________________________________________________________
32

Procedure ➸ Day 2
1. Set up calorimeter as demonstrated in Figure 1.
2. If desired, calibrate calorimeter to determine correction factor. Record all necessary data.
3. Weigh about 0.5 g of magnesium oxide, record precise mass to nearest 0.001 g.
4. Add 100 mL of 1.00 M HCl to the calorimeter, using 100-mL graduated cylinder. Record volume to the nearest 0.01 mL.
5. Set stirrer on low speed (no splashing) and determine initial temperature, Tinitial.
6. Carefully add magnesium oxide to the calorimeter. Ensure that the solution continues to mix.
7. Record the maximum or minimum temperature achieved, Tfinal.
8. Clean and dry the calorimeter.
9. Repeat Steps 2-8 at least once more, for a total of two trials.
Data Table ➸ Day 2 (7 pts)
Trial mMgO mHCl soln* mtotal Tintial Tfinal ΔT
1
2
*assume the density of the HCl solution is 1 g/mL. Calculations ➸ Day 2 (12 pts) Choose one trial to show your calculations.
1. Use the Equations from the Background section to determine q soln . Use correction factor if you have calibrated. _________________________________________________________________________________________________ _________________________________________________________________________________________________ _________________________________________________________________________________________________
2. Determine the number of moles of MgO used in the trial. _________________________________________________________________________________________________ _________________________________________________________________________________________________ _________________________________________________________________________________________________
3. Determine the enthalpy of solution, in kJ/mol. _________________________________________________________________________________________________ _________________________________________________________________________________________________ _________________________________________________________________________________________________
4. Determine the average ΔHo for Reaction 2. _________________________________________________________________________________________________ _________________________________________________________________________________________________ _________________________________________________________________________________________________
33

5. Use your average experimental values of ΔHo for Reactions 1 and 2, along with the stated value of ΔHo for Reaction 3 from the Background section to determine an experimental value for the enthalpy of formation of magnesium oxide. Show your work.
Mg (s) + ½ O2 (g) → MgO (s) ΔHof = ? _________________________________________________________________________________________________ _________________________________________________________________________________________________ _________________________________________________________________________________________________ _________________________________________________________________________________________________ _________________________________________________________________________________________________ _________________________________________________________________________________________________ Results (8 pts)
Experimental ΔHof True ΔHof Percent error (for teacher)
Points (for teacher)
-602 kJ/mol
0-20% error: 8 pts 20-40% error: 6 pts 40-60% error: 4 pts 60%+ error: 2 pts
34