adams employment, and county projections housing 2,344 2,344 2,344 2,344 2,344 2,344 2,344 2,344...
TRANSCRIPT
ADAMS COUNTY
Employment, Population, and
Housing Projections
2016 Vision West ND Projection Series
1) Online Webinars: One‐hour webinars for each county discussing recent trends and presenting future projections for employment, population, and housing. Webinars are available at http://www.visionwestnd.com/webinars.php
2) Overview Report: NDSU document that discusses study assumptions, data and methods, and overall results of the projection series, along with background data for the study. Report is available at http://ageconsearch.umn.edu/
3) Final Project Presentation: Presentation to Vision West ND highlighting the key elements of the study and conclusions for future change in employment, population, and housing. Slides can be viewed at http://www.visionwestnd.com
4) County Factsheets: Detailed graphs and tabular data identifying trends and projections of employment, population, and housing for individual counties.
Study Authors
Dean A. Bangsund Department of Agribusiness and
Applied Economics
Nancy M. Hodur, PhD Center for Social Research
Vision West ND funded the study
through grants from the North Dakota Association of Oil and Gas Producing Counties and the North Dakota Energy
Infrastructure and Impact Office. NDSU is an equal opportunity institution. Copyright © 2017 by Bangsund and Hodur. All rights reserved. Readers may make verbatim copies of this document for non‐commercial
purposes by any means, provided this
copyright notice appears on all such copies.

‐0.15
‐0.1
‐0.05
0
0.05
0.1
0.15
0.2
Per Population
Age Cohorts of Permanent Residents
Adams County2014 Net Migration Rates by Gender and Age Cohort
Male Female
Definition: Net migration is the sum of the number of residents leaving the county and the number of residents moving into the county. Positive net migration means more people moved into the county than moved out of the county. Negative net migration means more people moved out of the county than moved into the county.Source: NDSU, Center for Social Research
‐25
‐20
‐15
‐10
‐5
0
5
10
15
20
25
30
Percent of Population
Adams CountyNet Migration Rates
Definition: Net migration is the sum of the number of residents leaving the county and the number of residents moving into the county. Positive net migration means more people moved into the county than moved out of the county. Negative net migration means more people moved out of the county than moved into the county. Source: NDSU, Center for Social Research

750
800
850
900
950
1,000
1,050
2001 2002 2003 2004 2005 2006 2007 2008 2009 2010 2011 2012 2013 2014‐60
‐40
‐20
0
20
40
60
80
Wage/Salary Em
ploym
ent
Head
Count of Migratoin
Adams CountyEmployment and Net Migration
Net Migration Total Wage/Salary Employment
Sources: 2016 Statewide Housing Needs assessment, NDSU; Job Service North Dakota
0.0%
0.2%
0.4%
0.6%
0.8%
1.1%
1.3%
1.5%
1.7%
1.9%
2.1%
2000 2001 2002 2003 2004 2005 2006 2007 2008 2009 2011 2012 2013 2014
Share of Population
Adams CountyTrends in Fertility and Mortality Rates
Fertility Rate Mortality Rate Fertility Trend Mortality Trend
Source: 2016 Statewide Housing Needs assessment, NDSU
0%
10%
20%
30%
40%
50%
60%
70%
80%
90%
100%
2002 2004 2006 2008 2010 2012 2014
Percentage
of Wage and Salary Jobs
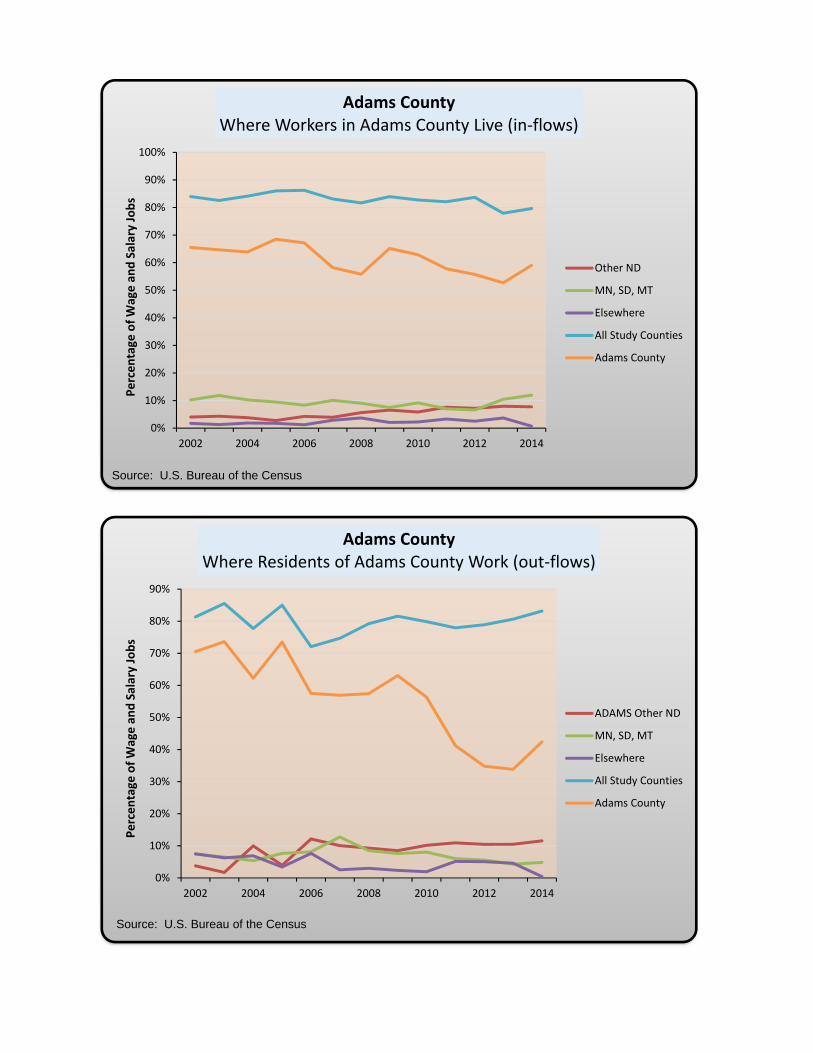
Adams CountyWhere Workers in Adams County Live (in‐flows)
Other ND
MN, SD, MT
Elsewhere
All Study Counties
Adams County
Source: U.S. Bureau of the Census
0%
10%
20%
30%
40%
50%
60%
70%
80%
90%
2002 2004 2006 2008 2010 2012 2014
Percentage
of Wage and Salary Jobs
Adams CountyWhere Residents of Adams County Work (out‐flows)
ADAMS Other ND
MN, SD, MT
Elsewhere
All Study Counties
Adams County
Source: U.S. Bureau of the Census

0
200
400
600
800
1,000
1,200
1,400
1,600
2000 2002 2004 2006 2008 2010 2012 2014
Jobs (fte)
Adams CountyWage/Salary and Farm/Ranch Employment
Wage and Salary Employment Farm and Ranch Proprietors
Sources: Job Service North Dakota, U.S. Bureau of the Census
0
200
400
600
800
1,000
1,200
1990 1992 1994 1996 1998 2000 2002 2004 2006 2008 2010 2012 2014
Wage and Salary Em
ploym
ent
Counties with Minor Oil and Gas EmploymentAll Wage and Salary Employment
Adams Billings Golden Valley Hettinger Slope
Source: Job Service North Dakota
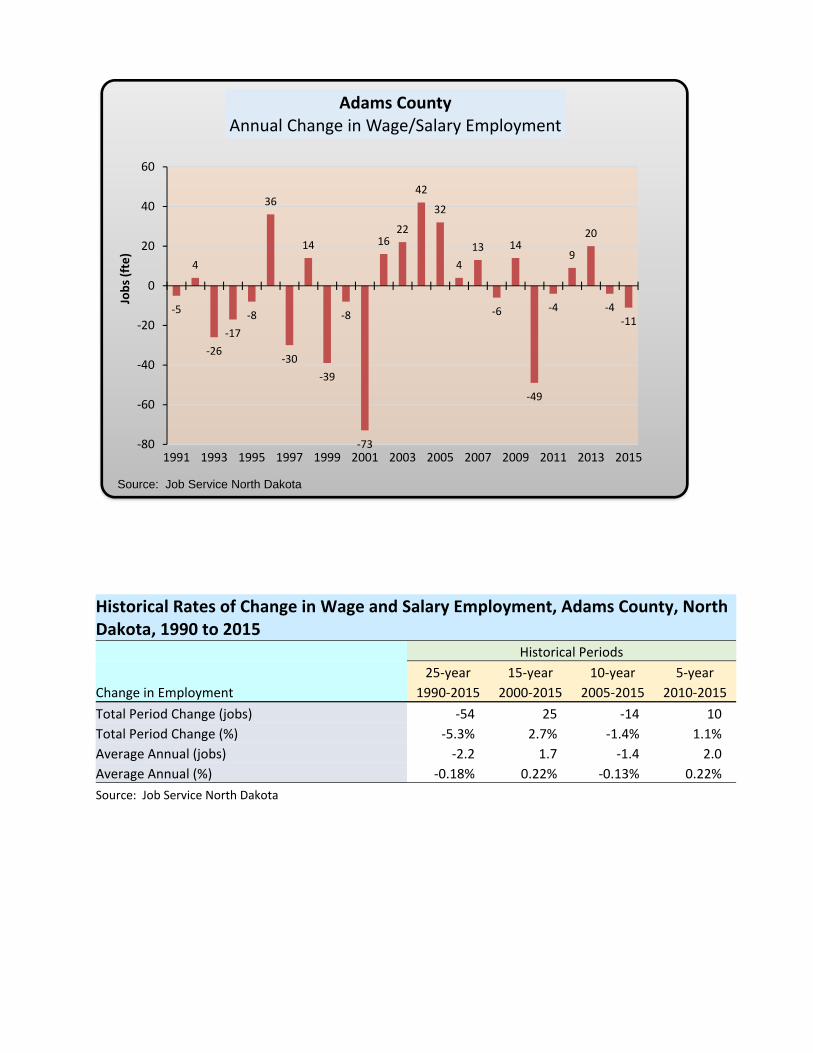
Historical Rates of Change in Wage and Salary Employment, Adams County, North Dakota, 1990 to 2015
Historical Periods
25‐year 15‐year 10‐year 5‐year
Change in Employment 1990‐2015 2000‐2015 2005‐2015 2010‐2015
Total Period Change (jobs) ‐54 25 ‐14 10
Total Period Change (%) ‐5.3% 2.7% ‐1.4% 1.1%
Average Annual (jobs) ‐2.2 1.7 ‐1.4 2.0
Average Annual (%) ‐0.18% 0.22% ‐0.13% 0.22%
Source: Job Service North Dakota
‐5
4
‐26
‐17
‐8
36
‐30
14
‐39
‐8
‐73
1622
42
32
4
13
‐6
14
‐49
‐4
9
20
‐4‐11
‐80
‐60
‐40
‐20
0
20
40
60
1991 1993 1995 1997 1999 2001 2003 2005 2007 2009 2011 2013 2015
Jobs (fte)
Adams CountyAnnual Change in Wage/Salary Employment
Source: Job Service North Dakota

y = 386.82x‐0.056
R² = 0.6408
0
50
100
150
200
250
300
350
400
450
Sole Proprietors (fte)
Adams CountyHistorical and Projected Farm and Ranch Operators
Historical Projected Trend
Sources: U.S. Bureau of the Census; NDSU Employment Forecasting
0
200
400
600
800
1,000
1,200
1,400
Wage and Salary Em
ploym
ent (FTE)
Adams CountyHistorical and Projected Wage and Salary Employment
Observed Low Forecast Moderate Forecast
High Forecast 10‐yr Trend 15‐yr Trend
Sources: Job Service North Dakota; NDSU Employment Forecasting
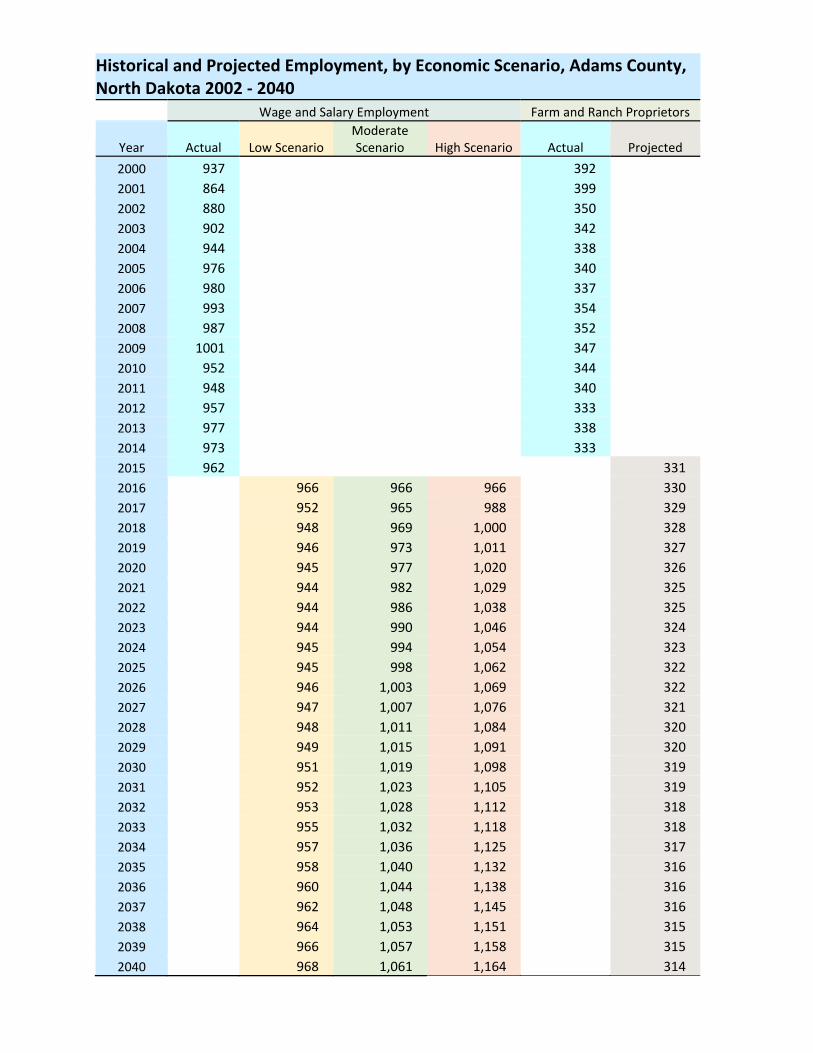
Historical and Projected Employment, by Economic Scenario, Adams County, North Dakota 2002 ‐ 2040
Wage and Salary Employment Farm and Ranch Proprietors
Year Actual Low Scenario Moderate Scenario High Scenario Actual Projected
2000 937 392
2001 864 399
2002 880 350
2003 902 342
2004 944 338
2005 976 340
2006 980 337
2007 993 354
2008 987 352
2009 1001 347
2010 952 344
2011 948 340
2012 957 333
2013 977 338
2014 973 333
2015 962 331
2016 966 966 966 330
2017 952 965 988 329
2018 948 969 1,000 328
2019 946 973 1,011 327
2020 945 977 1,020 326
2021 944 982 1,029 325
2022 944 986 1,038 325
2023 944 990 1,046 324
2024 945 994 1,054 323
2025 945 998 1,062 322
2026 946 1,003 1,069 322
2027 947 1,007 1,076 321
2028 948 1,011 1,084 320
2029 949 1,015 1,091 320
2030 951 1,019 1,098 319
2031 952 1,023 1,105 319
2032 953 1,028 1,112 318
2033 955 1,032 1,118 318
2034 957 1,036 1,125 317
2035 958 1,040 1,132 316
2036 960 1,044 1,138 316
2037 962 1,048 1,145 316
2038 964 1,053 1,151 315
2039 966 1,057 1,158 315
2040 968 1,061 1,164 314
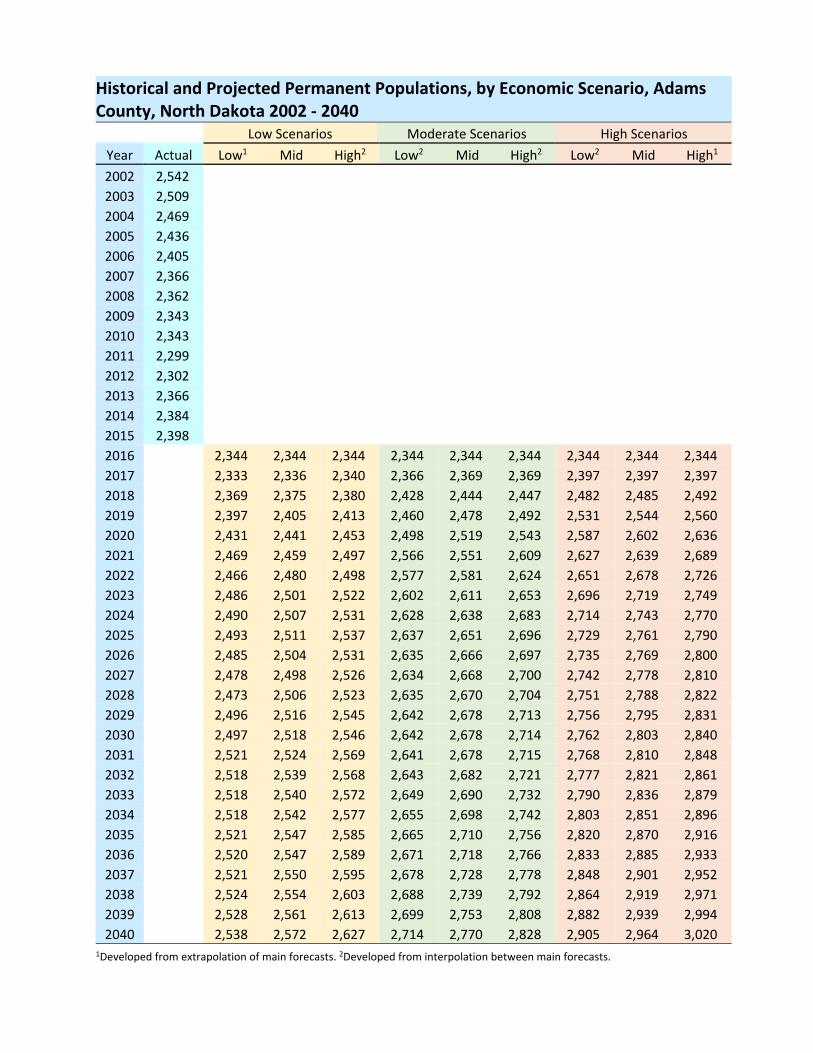
Historical and Projected Permanent Populations, by Economic Scenario, Adams County, North Dakota 2002 ‐ 2040
Low Scenarios Moderate Scenarios High Scenarios
Year Actual Low1 Mid High2 Low2 Mid High2 Low2 Mid High1
2002 2,542
2003 2,509
2004 2,469
2005 2,436
2006 2,405
2007 2,366
2008 2,362
2009 2,343
2010 2,343
2011 2,299
2012 2,302
2013 2,366
2014 2,384
2015 2,398
2016 2,344 2,344 2,344 2,344 2,344 2,344 2,344 2,344 2,344
2017 2,333 2,336 2,340 2,366 2,369 2,369 2,397 2,397 2,397
2018 2,369 2,375 2,380 2,428 2,444 2,447 2,482 2,485 2,492
2019 2,397 2,405 2,413 2,460 2,478 2,492 2,531 2,544 2,560
2020 2,431 2,441 2,453 2,498 2,519 2,543 2,587 2,602 2,636
2021 2,469 2,459 2,497 2,566 2,551 2,609 2,627 2,639 2,689
2022 2,466 2,480 2,498 2,577 2,581 2,624 2,651 2,678 2,726
2023 2,486 2,501 2,522 2,602 2,611 2,653 2,696 2,719 2,749
2024 2,490 2,507 2,531 2,628 2,638 2,683 2,714 2,743 2,770
2025 2,493 2,511 2,537 2,637 2,651 2,696 2,729 2,761 2,790
2026 2,485 2,504 2,531 2,635 2,666 2,697 2,735 2,769 2,800
2027 2,478 2,498 2,526 2,634 2,668 2,700 2,742 2,778 2,810
2028 2,473 2,506 2,523 2,635 2,670 2,704 2,751 2,788 2,822
2029 2,496 2,516 2,545 2,642 2,678 2,713 2,756 2,795 2,831
2030 2,497 2,518 2,546 2,642 2,678 2,714 2,762 2,803 2,840
2031 2,521 2,524 2,569 2,641 2,678 2,715 2,768 2,810 2,848
2032 2,518 2,539 2,568 2,643 2,682 2,721 2,777 2,821 2,861
2033 2,518 2,540 2,572 2,649 2,690 2,732 2,790 2,836 2,879
2034 2,518 2,542 2,577 2,655 2,698 2,742 2,803 2,851 2,896
2035 2,521 2,547 2,585 2,665 2,710 2,756 2,820 2,870 2,916
2036 2,520 2,547 2,589 2,671 2,718 2,766 2,833 2,885 2,933
2037 2,521 2,550 2,595 2,678 2,728 2,778 2,848 2,901 2,952
2038 2,524 2,554 2,603 2,688 2,739 2,792 2,864 2,919 2,971
2039 2,528 2,561 2,613 2,699 2,753 2,808 2,882 2,939 2,994
2040 2,538 2,572 2,627 2,714 2,770 2,828 2,905 2,964 3,020 1Developed from extrapolation of main forecasts. 2Developed from interpolation between main forecasts.
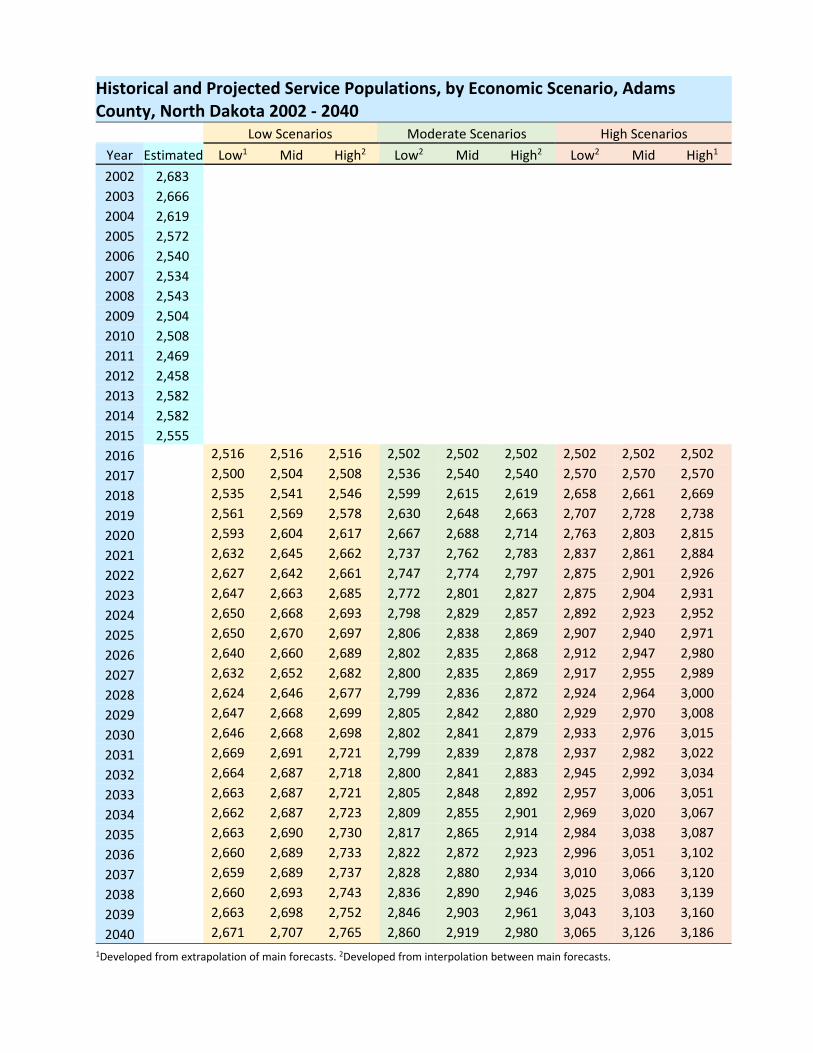
Historical and Projected Service Populations, by Economic Scenario, Adams County, North Dakota 2002 ‐ 2040
Low Scenarios Moderate Scenarios High Scenarios
Year Estimated Low1 Mid High2 Low2 Mid High2 Low2 Mid High1
2002 2,683
2003 2,666
2004 2,619
2005 2,572
2006 2,540
2007 2,534
2008 2,543
2009 2,504
2010 2,508
2011 2,469
2012 2,458
2013 2,582
2014 2,582
2015 2,555
2016 2,516 2,516 2,516 2,502 2,502 2,502 2,502 2,502 2,502
2017 2,500 2,504 2,508 2,536 2,540 2,540 2,570 2,570 2,570
2018 2,535 2,541 2,546 2,599 2,615 2,619 2,658 2,661 2,669
2019 2,561 2,569 2,578 2,630 2,648 2,663 2,707 2,728 2,738
2020 2,593 2,604 2,617 2,667 2,688 2,714 2,763 2,803 2,815
2021 2,632 2,645 2,662 2,737 2,762 2,783 2,837 2,861 2,884
2022 2,627 2,642 2,661 2,747 2,774 2,797 2,875 2,901 2,926
2023 2,647 2,663 2,685 2,772 2,801 2,827 2,875 2,904 2,931
2024 2,650 2,668 2,693 2,798 2,829 2,857 2,892 2,923 2,952
2025 2,650 2,670 2,697 2,806 2,838 2,869 2,907 2,940 2,971
2026 2,640 2,660 2,689 2,802 2,835 2,868 2,912 2,947 2,980
2027 2,632 2,652 2,682 2,800 2,835 2,869 2,917 2,955 2,989
2028 2,624 2,646 2,677 2,799 2,836 2,872 2,924 2,964 3,000
2029 2,647 2,668 2,699 2,805 2,842 2,880 2,929 2,970 3,008
2030 2,646 2,668 2,698 2,802 2,841 2,879 2,933 2,976 3,015
2031 2,669 2,691 2,721 2,799 2,839 2,878 2,937 2,982 3,022
2032 2,664 2,687 2,718 2,800 2,841 2,883 2,945 2,992 3,034
2033 2,663 2,687 2,721 2,805 2,848 2,892 2,957 3,006 3,051
2034 2,662 2,687 2,723 2,809 2,855 2,901 2,969 3,020 3,067
2035 2,663 2,690 2,730 2,817 2,865 2,914 2,984 3,038 3,087
2036 2,660 2,689 2,733 2,822 2,872 2,923 2,996 3,051 3,102
2037 2,659 2,689 2,737 2,828 2,880 2,934 3,010 3,066 3,120
2038 2,660 2,693 2,743 2,836 2,890 2,946 3,025 3,083 3,139
2039 2,663 2,698 2,752 2,846 2,903 2,961 3,043 3,103 3,160
2040 2,671 2,707 2,765 2,860 2,919 2,980 3,065 3,126 3,186
1Developed from extrapolation of main forecasts. 2Developed from interpolation between main forecasts.

Projected Permanent and Service Populations, by Economic Scenario, Adams County, North Dakota 2017 – 2040
Low Scenarios Moderate Scenarios High Scenarios
Low Mid High Low Mid High Low Mid High
‐‐‐‐‐‐‐‐‐‐‐‐‐‐‐‐‐‐‐‐‐‐‐‐‐‐‐‐‐‐‐‐‐‐‐‐‐‐‐‐ Permanent Population ‐‐‐‐‐‐‐‐‐‐‐‐‐‐‐‐‐‐‐‐‐‐‐‐‐‐‐‐‐‐‐‐‐‐‐‐‐‐‐‐ Total Percentage Change in Population 8.3% 9.7% 12.1% 15.8% 18.2% 20.6% 23.9% 26.4% 28.9% Average Annual Change in Population 8 10 12 15 18 20 23 26 28 Average Annual Percentage Change in Population 0.33% 0.39% 0.48% 0.62% 0.70% 0.79% 0.90% 0.99% 1.07%
‐‐‐‐‐‐‐‐‐‐‐‐‐‐‐‐‐‐‐‐‐‐‐‐‐‐‐‐‐‐‐‐‐‐‐‐‐‐‐‐ Service Population ‐‐‐‐‐‐‐‐‐‐‐‐‐‐‐‐‐‐‐‐‐‐‐‐‐‐‐‐‐‐‐‐‐‐‐‐‐‐‐‐ Total Percentage Change in Population 5.8% 6.9% 8.5% 12.6% 14.5% 16.5% 19.3% 21.4% 23.4% Average Annual Change in Population 8 9 11 17 19 22 25 28 31 Average Annual Percentage Change in Population 0.30% 0.35% 0.43% 0.63% 0.72% 0.81% 0.94% 1.0% 1.1% NOTE: Permanent population refers to individuals that live in permanent housing and are counted as residents of that respective geography. Service population is a head count of all individuals living in an area regardless of residency, even if some of those individuals reside in temporary, seasonal, or other undocumented lodging arrangements. Service population in this study also includes commuting workers who are employed in the county but retain permanent residence elsewhere.
0
500
1,000
1,500
2,000
2,500
3,000
3,500
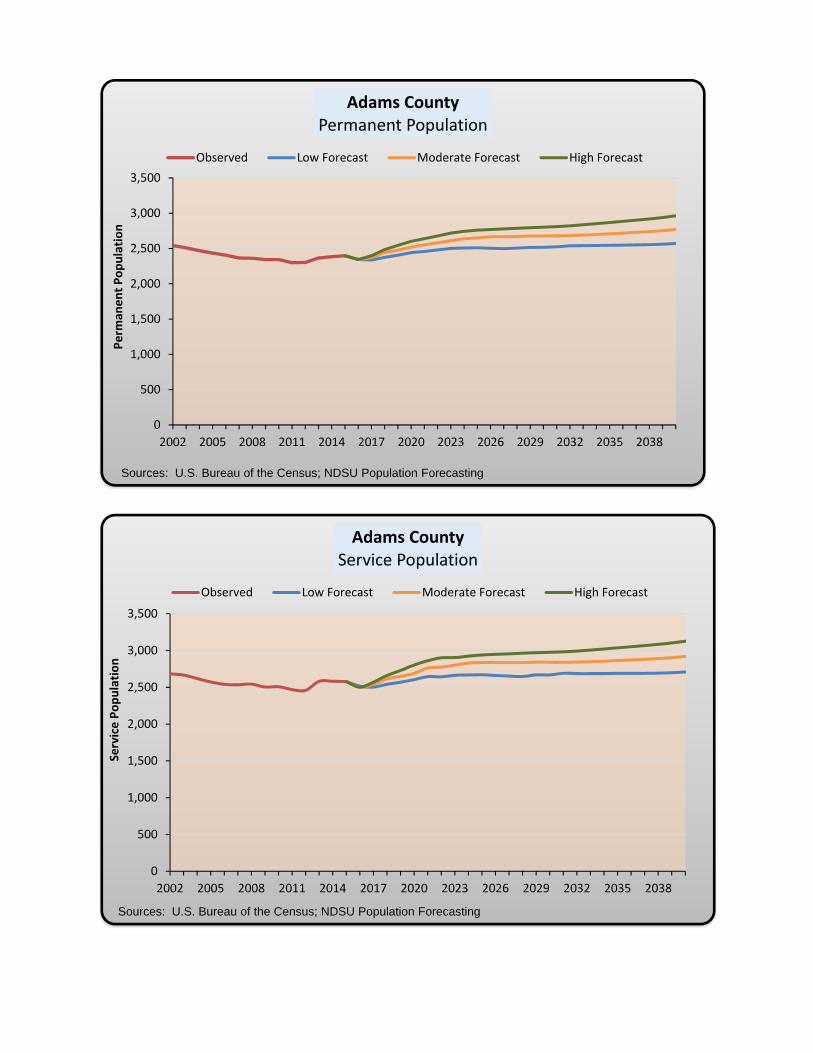
2002 2005 2008 2011 2014 2017 2020 2023 2026 2029 2032 2035 2038
Perm
anent Population
Adams CountyPermanent Population
Observed Low Forecast Moderate Forecast High Forecast
Sources: U.S. Bureau of the Census; NDSU Population Forecasting
0
500
1,000
1,500
2,000
2,500
3,000
3,500
2002 2005 2008 2011 2014 2017 2020 2023 2026 2029 2032 2035 2038
Service Population
Adams CountyService Population
Observed Low Forecast Moderate Forecast High Forecast
Sources: U.S. Bureau of the Census; NDSU Population Forecasting

0
500
1,000
1,500
2,000
2,500
3,000
3,500
2002 2005 2008 2011 2014 2017 2020 2023 2026 2029 2032 2035 2038
Population
Adams CountyPermanent and Service Population
Observed Permanent Population Observed Service PopulationPermanent Pop Moderate Forecast Service Pop Moderate Forecast
Sources: U.S. Bureau of the Census; NDSU Population Forecasting
400
420
440
460
480
500
520
540
560
580
600
Popualtion
Adams CountyPopulation Ages 0 through 19
Historical
2300 wells/yr
2000 wells/yr
1700 wells/yr
1500 wells/yr
1250 wells/yr
1000 wells/yr
800 wells/yr
600 wells/yr
400 wells/yr
Source: NDSU Population Forecasting

Historical and Projected Population Ages 0 through 4, by Economic Scenario, Adams County, North Dakota 2002 – 2039
Low Scenarios Moderate Scenarios High Scenarios
Year Actual Low1 Mid High2 Low2 Mid High2 Low2 Mid High1
2014 131
2015 129
2016 128
2017 128 128 128 128 128 128 128 128 128
2018 126 126 126 126 126 126 127 127 127
2019 123 123 123 123 123 123 124 124 124
2020 120 120 120 120 121 121 121 122 122
2021 118 118 118 118 119 120 120 121 121
2022 117 117 118 117 118 119 119 121 122
2023 117 117 117 117 118 119 119 121 122
2024 117 117 118 116 118 120 119 122 123
2025 116 117 117 116 117 120 118 122 123
2026 114 115 115 114 115 118 116 120 122
2027 111 112 113 111 113 116 113 117 119
2028 108 108 109 108 110 113 110 114 116
2029 104 105 106 105 107 109 107 110 112
2030 101 102 103 103 104 106 104 107 109
2031 99 99 100 100 101 104 102 105 106
2032 97 97 98 98 99 101 100 102 104
2033 95 95 96 96 97 99 98 100 101
2034 93 94 95 94 96 97 96 98 99
2035 93 93 94 93 94 96 95 97 98
2036 92 93 93 93 94 95 95 96 97
2037 92 93 93 93 94 95 95 96 97
2038 93 94 94 94 95 96 96 97 98
2039 95 95 96 96 97 98 98 99 100 1Developed from extrapolation of main forecasts. 2Developed from interpolation between main forecasts.

Historical and Projected Population Ages 5 through 9, by Economic Scenario, Adams County, North Dakota 2002 – 2039
Low Scenarios Moderate Scenarios High Scenarios
Year Actual Low1 Mid High2 Low2 Mid High2 Low2 Mid High1
2014 129
2015 133
2016 134
2017 134 134 134 134 134 134 134 134 134
2018 136 136 136 136 136 136 136 136 136
2019 140 140 140 140 140 140 140 140 140
2020 142 142 142 142 142 142 142 142 142
2021 142 142 142 142 142 142 142 142 142
2022 141 141 141 141 141 141 141 141 141
2023 138 138 138 138 138 138 138 138 138
2024 133 133 133 133 133 133 134 134 134
2025 129 129 129 129 130 130 130 131 131
2026 126 126 126 126 127 128 128 129 130
2027 125 125 125 125 126 127 127 129 129
2028 124 124 125 124 125 127 126 129 130
2029 124 125 125 124 125 128 126 130 131
2030 123 124 125 123 125 127 126 129 131
2031 121 122 123 121 123 126 124 127 129
2032 118 119 120 118 120 123 121 125 127
2033 115 115 116 115 117 120 117 121 123
2034 111 112 113 112 114 116 114 118 120
2035 108 108 110 109 111 113 111 114 116
2036 105 106 107 107 108 110 108 111 113
2037 103 103 104 104 106 108 106 109 110
2038 101 101 102 102 104 105 104 106 108
2039 100 100 101 101 102 103 102 104 106 1Developed from extrapolation of main forecasts. 2Developed from interpolation between main forecasts.
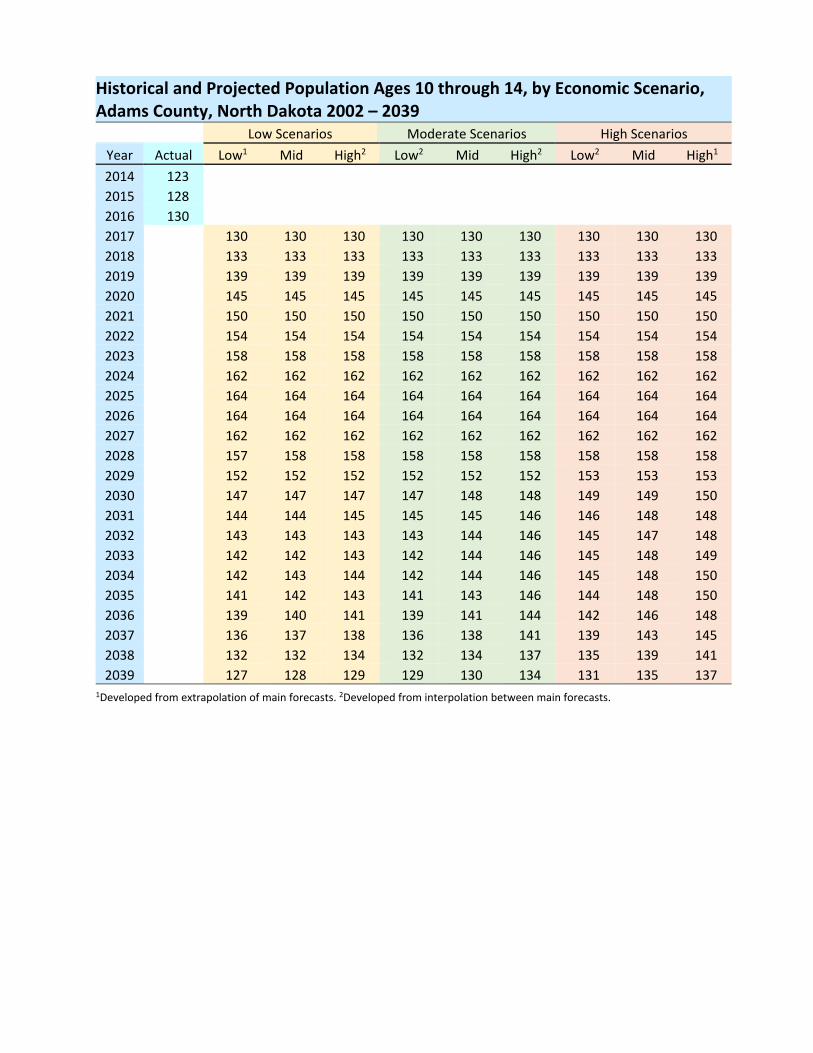
Historical and Projected Population Ages 10 through 14, by Economic Scenario, Adams County, North Dakota 2002 – 2039
Low Scenarios Moderate Scenarios High Scenarios
Year Actual Low1 Mid High2 Low2 Mid High2 Low2 Mid High1
2014 123
2015 128
2016 130
2017 130 130 130 130 130 130 130 130 130
2018 133 133 133 133 133 133 133 133 133
2019 139 139 139 139 139 139 139 139 139
2020 145 145 145 145 145 145 145 145 145
2021 150 150 150 150 150 150 150 150 150
2022 154 154 154 154 154 154 154 154 154
2023 158 158 158 158 158 158 158 158 158
2024 162 162 162 162 162 162 162 162 162
2025 164 164 164 164 164 164 164 164 164
2026 164 164 164 164 164 164 164 164 164
2027 162 162 162 162 162 162 162 162 162
2028 157 158 158 158 158 158 158 158 158
2029 152 152 152 152 152 152 153 153 153
2030 147 147 147 147 148 148 149 149 150
2031 144 144 145 145 145 146 146 148 148
2032 143 143 143 143 144 146 145 147 148
2033 142 142 143 142 144 146 145 148 149
2034 142 143 144 142 144 146 145 148 150
2035 141 142 143 141 143 146 144 148 150
2036 139 140 141 139 141 144 142 146 148
2037 136 137 138 136 138 141 139 143 145
2038 132 132 134 132 134 137 135 139 141
2039 127 128 129 129 130 134 131 135 137 1Developed from extrapolation of main forecasts. 2Developed from interpolation between main forecasts.

Historical and Projected Population Ages 15 through 19, by Economic Scenario, Adams County, North Dakota 2002 – 2039
Low Scenarios Moderate Scenarios High Scenarios
Year Actual Low1 Mid High2 Low2 Mid High2 Low2 Mid High1
2014 119
2015 114
2016 115
2017 115 115 115 116 116 116 116 116 116
2018 116 116 116 117 117 117 117 117 117
2019 120 120 121 121 121 121 122 122 122
2020 126 126 126 127 127 127 128 128 128
2021 131 131 131 133 133 133 133 133 133
2022 137 137 137 138 138 138 138 138 138
2023 143 143 143 144 144 144 144 143 144
2024 149 149 149 150 150 150 150 150 150
2025 154 154 154 155 155 155 155 155 155
2026 158 158 159 159 159 159 159 159 159
2027 162 162 162 162 162 163 163 163 163
2028 165 165 165 165 165 165 166 166 166
2029 167 167 167 167 167 167 168 168 168
2030 168 168 168 167 168 168 168 168 168
2031 167 167 167 166 166 166 166 166 166
2032 164 164 164 163 163 163 163 163 163
2033 159 159 159 159 159 159 159 159 160
2034 153 153 154 153 153 154 154 154 155
2035 149 149 149 149 150 150 151 152 152
2036 146 147 147 147 148 149 149 151 151
2037 145 146 146 146 148 149 149 151 152
2038 145 146 147 146 147 150 149 152 154
2039 146 146 147 146 147 150 149 153 155 1Developed from extrapolation of main forecasts. 2Developed from interpolation between main forecasts.

Projected Housing Inventory Requirements for Permanent Population, by Economic Scenario, Adams County, North Dakota 2017 – 2040
Low Scenarios Moderate Scenarios High Scenarios
Low Mid High Low Mid High Low Mid High
‐‐‐‐‐‐‐‐‐‐‐‐‐‐‐‐‐‐‐‐‐‐‐‐‐‐‐‐‐‐‐‐‐‐‐‐‐‐‐‐ Permanent Housing ‐‐‐‐‐‐‐‐‐‐‐‐‐‐‐‐‐‐‐‐‐‐‐‐‐‐‐‐‐‐‐‐‐‐‐‐‐‐‐‐ Total Percentage Change in Housing na 15.3% na na 25.0% na na 34.8% na Average Annual Change in Housing (no. of units) na 9 na na 14 na na 20 na Average Annual Percentage Change in Housing na 0.60% na na 0.94% na na 1.3% na NA=not available. Projected housing inventories were only estimated for the medium rig count for the low, moderate, and high oil price scenarios.
0
200
400
600
800
1,000
1,200
1,400
1,600
1,800
2,000
Housing Units
Adams CountyHistorical and Projected Housing Inventory
Observed Low Scenario Moderate Scenario High Scenario
Source: NDSU Forecasting

0.0
0.2
0.4
0.6
0.8
1.0
1.2
1.4
1.6
1.8
2.0
People per Occupied Housing Unit
Adams CountyPeople per Occupied Housing Unit
Historical Low Growth Forecast Moderate Growth Forecast
High Growth Forecast 14‐yr Trend
Sources: U.S. Bureau of the Census; NDSU Forecasting
0
200
400
600
800
1,000
1,200
1,400
1,600
1,800
2,000
0
500
1,000
1,500
2,000
2,500
3,000
3,500
Housing Inventory
Population
Adams CountyPopulation and Housing Inventories
Historical Population Low Growth Scenario Population Forecast
Historical Housing Inventory Low Growth Scenario Housing Inventory
Sources: U.S. Bureau of the Census; NDSU Forecasting
0
200
400
600
800
1,000
1,200
1,400
1,600
1,800
2,000
0
500
1,000
1,500
2,000
2,500
3,000
3,500
Housing Inventory
Population
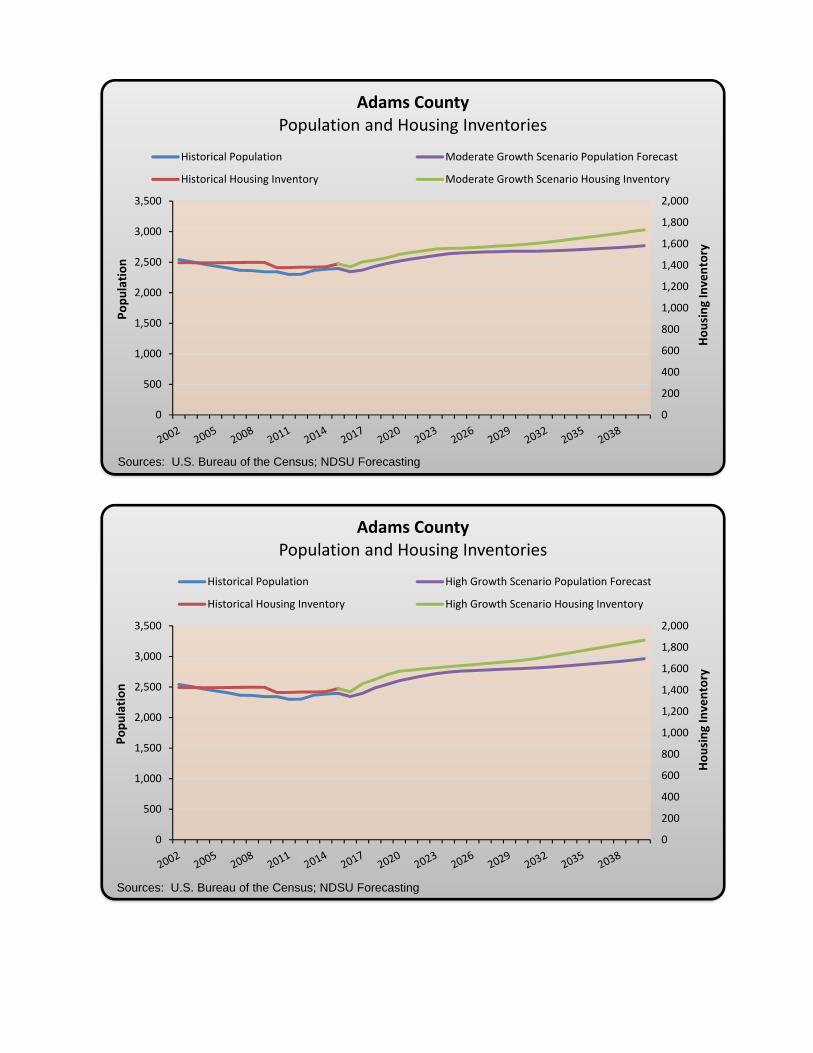
Adams CountyPopulation and Housing Inventories
Historical Population Moderate Growth Scenario Population Forecast
Historical Housing Inventory Moderate Growth Scenario Housing Inventory
Sources: U.S. Bureau of the Census; NDSU Forecasting
0
200
400
600
800
1,000
1,200
1,400
1,600
1,800
2,000
0
500
1,000
1,500
2,000
2,500
3,000
3,500
Housing Inventory
Population
Adams CountyPopulation and Housing Inventories
Historical Population High Growth Scenario Population Forecast
Historical Housing Inventory High Growth Scenario Housing Inventory
Sources: U.S. Bureau of the Census; NDSU Forecasting

Historical and Projected Rates of Change in Housing Inventories, Adams County, North Dakota, 2000 to 2035
Change in Housing Inventories
Historical Periods
15‐year 10‐year 5‐year
2000‐2015 2005‐2015 2010‐2015
Housing Units Added (total)1 ‐3 ‐10 36
Housing Units Added (annual average)1 ‐0.2 ‐1 7
Economic Growth Scenarios
2016 to 2035
Low Moderate High
Housing Units Required (total additional)2 164 271 384
Housing Units Required (average annual)2 8 14 19
1Based on 2000 and 2010 Decennial Censuses and 2016 North Dakota Statewide Housing Needs
Assessment. 2Based on 2015 housing inventories reported in the 2016 North Dakota Statewide Housing Needs
Assessment.

Additional Resources 2016 Statewide Housing Needs Assessment Link to report: https://www.ndhfa.org/Publications/HousingNeeds.html
NDSU Department of Agribusiness and Applied Economics Links to departmental reports: http://ageconsearch.umn.edu/
https://www.ag.ndsu.edu/agecon/
NDSU Center for Social Research Link to the Center: https://www.ndsu.edu/csr/
North Dakota Compass and North Dakota Kids Count Links to programs: http://www.ndcompass.org/
http://www.ndkidscount.org/
Vision West ND Link to their website: http://www.visionwestnd.com/
North Dakota Job Service Links to Job Service North Dakota reports pertaining to oil and gas industry
North Dakota’s Oil and Gas Economy https://www.ndworkforceintelligence.com/gsipub/index.asp?docid=578
North Dakota Oil and Gas Industry Employment https://www.ndworkforceintelligence.com/gsipub/index.asp?docid=586
Census on the Map Link to data portal: http://onthemap.ces.census.gov/
Study Authors Dean A. Bangsund Department of Agribusiness and Applied Economics NDSU [email protected] 701‐231‐7471 Nancy Hodur, PhD Center for Social Research NDSU [email protected] 701‐231‐7357