a publication of the scientific association … edited parallel shell commands calling ... the...
TRANSCRIPT

InfocommunicationsJournal
A PUBLICATION OF THE SCIENTIFIC ASSOCIATION FOR INFOCOMMUNICATIONS (HTE)
SEPTEMBER 2017 Volume IX Number 3 ISSN 2061-2079
PAPERS FROM OPEN CALL
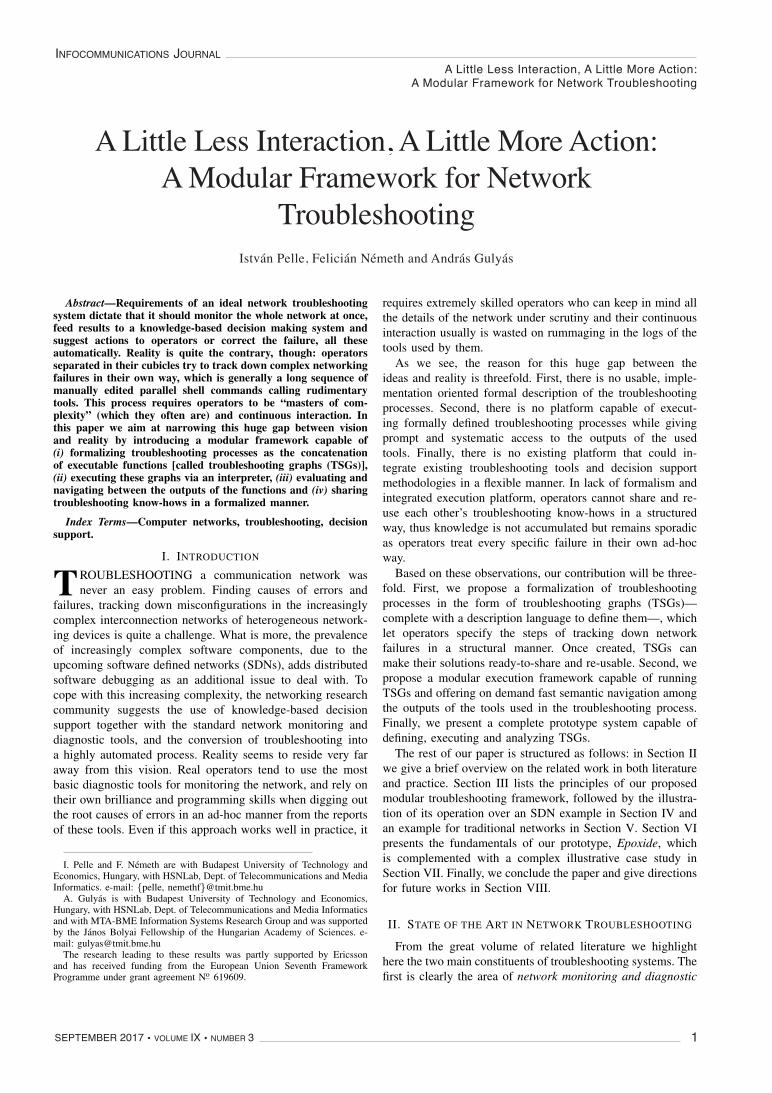
A Little Less Interaction, A Little More Action: A Modular Framework for Network Troubleshooting ........................... István Pelle, Felicián Németh and András Gulyás 1
View-Invariant Person Identification by Orthogonal View Gait Signature and Fusion of Classifiers ......................... Sagar Arun More and Pramod Jagan Deore 9
Live face detection method based on local binary pattern and bandelet ................................Haiqing Liu, Shuhua Hao, Yuancheng Li, Xiang Li and Jie Ma 17
PAPERS OF APPLIED RESEARCH
Extension of RFID Based Indoor Localization Systems With Smart Transponders ....................... Tamás Helfenbein, Roland Király, Márton Törőcsik, Emil Tóth and Sándor Király 25
CALL FOR PAPERS / PARTICIPATION
IEEE/IET International Symposium on Communication Systems, Networks and Digital Signal Processing IEEE/IET CSNDSP 2018, Budapest, Hungary ............................................................................ 32
ACM SIGCOMM 2018, Budapest, Hungary ................................................................................. 33
Wireless Days Conference WD 2018, Dubai, United Arab Emirates ..................................................................................... 34
3rd Cloudification of the Internet of Things Conference CIoT 2018, Paris, France ........................................................................................................... 35
ADDITIONAL
Guidelines for our Authors .......................................................................................................... 36

INFOCOMMUNICATIONS JOURNAL
ÖZGÜR B. AKAN Koc University, Istanbul, TurkeyJAVIER ARACIL Universidad Autónoma de Madrid, SpainLUIGI ATZORI University of Cagliari, ItalyLÁSZLÓ BACSÁRDI University of West HungaryJÓZSEF BÍRÓ Budapest University of Technology and Economics, HungarySTEFANO BREGNI Politecnico di Milano, ItalyVESNA CRNOJEVIÇ-BENGIN University of Novi Sad, SerbiaKÁROLY FARKAS Budapest University of Technology and Economics, HungaryVIKTORIA FODOR Royal Technical University, StockholmEROL GELENBE Imperial College London, UKCHRISTIAN GÜTL Graz University of Technology, AustriaANDRÁS HAJDU University of Debrecen, HungaryLAJOS HANZO University of Southampton, UKTHOMAS HEISTRACHER Salzburg University of Applied Sciences, AustriaJUKKA HUHTAMÄKI Tampere University of Technology, FinlandSÁNDOR IMRE Budapest University of Technology and Economics, HungaryANDRZEJ JAJSZCZYK AGH University of Science and Technology, Krakow, PolandFRANTISEK JAKAB Technical University Kosice, SlovakiaKLIMO MARTIN University of Zilina, SlovakiaDUSAN KOCUR Technical University Kosice, SlovakiaANDREY KOUCHERYAVY St. Petersburg State University of Telecommunications, RussiaLEVENTE KOVÁCS Óbuda University, Budapest, Hungary
MAJA MATIJASEVIC University of Zagreb, CroatiaVACLAV MATYAS Masaryk University, Brno, Czech RepublicOSCAR MAYORA Create-Net, Trento, ItalyMIKLÓS MOLNÁR University of Montpellier, FranceSZILVIA NAGY Széchenyi István University of Gyôr, HungaryPÉTER ODRY VTS Subotica, SerbiaJAUDELICE DE OLIVEIRA Drexel University, USAMICHAL PIORO Warsaw University of Technology, PolandROBERTO SARACCO Trento Rise, ItalyGHEORGHE SEBESTYÉN Technical University Cluj-Napoca, RomaniaBURKHARD STILLER University of Zürich, SwitzerlandCSABA A. SZABÓ Budapest University of Technology and Economics, HungaryLÁSZLÓ ZSOLT SZABÓ Sapientia University, Tirgu Mures, RomaniaTAMÁS SZIRÁNYI Institute for Computer Science and Control, Budapest, HungaryJÁNOS SZTRIK University of Debrecen, HungaryDAMLA TURGUT University of Central Florida, USAESZTER UDVARY Budapest University of Technology and Economics, HungarySCOTT VALCOURT University of New Hampshire, USAJINSONG WU Bell Labs Shanghai, ChinaKE XIONG Beijing Jiaotong University, ChinaGERGELY ZÁRUBA University of Texas at Arlington, USA
Editorial BoardEditor-in-Chief: ROLLAND VIDA, Budapest University of Technology and Economics (BME), Hungary
Associate Editor-in-Chief: ÁRPÁD HUSZÁK, Budapest University of Technology and Economics (BME), Hungary
Indexing informationInfocommunications Journal is covered by Inspec, Compendex and Scopus.
Infocommunications Journal is also included in the Thomson Reuters – Web of ScienceTM Core Collection, Emerging Sources Citation Index (ESCI)
www.infocommunications.hu
Infocommunications JournalTechnically co-sponsored by IEEE Communications Society and IEEE Hungary Section
SupportersFERENC VÁGUJHELYI – president, National Council for Telecommunications and Information Technology (NHIT)
GÁBOR MAGYAR – president, Scientic Association for Infocommunications (HTE)
Articles can be sent also to the following address:Budapest University of Technology and Economics
Department of Telecommunications and Media InformaticsTel.: +36 1 463 1102, Fax: +36 1 463 1763
E-mail: [email protected]
Editorial Office (Subscription and Advertisements):Scientic Association for InfocommunicationsH-1051 Budapest, Bajcsy-Zsilinszky str. 12, Room: 502Phone: +36 1 353 1027E-mail: [email protected] • Web: www.hte.hu
Publisher: PÉTER NAGY
HU ISSN 2061-2079 • Layout: PLAZMA DS • Printed by: FOM Media
Subscription rates for foreign subscribers: 4 issues 10.000 HUF + postage
A Little Less Interaction, A Little More Action:A Modular Framework for Network Troubleshooting
INFOCOMMUNICATIONS JOURNAL
SEPTEMBER 2017 • VOLUME IX • NUMBER 3 1
A Little Less Interaction, A Little More Action:A Modular Framework for Network
TroubleshootingIstván Pelle, Felicián Németh and András Gulyás
1
A Little Less Interaction, A Little More Action:A Modular Framework for Network
TroubleshootingIstvan Pelle, Felician Nemeth, Andras Gulyas
Abstract—Requirements of an ideal network troubleshootingsystem dictate that it should monitor the whole network at once,feed results to a knowledge-based decision making system andsuggest actions to operators or correct the failure, all theseautomatically. Reality is quite the contrary, though: operatorsseparated in their cubicles try to track down complex networkingfailures in their own way, which is generally a long sequence ofmanually edited parallel shell commands calling rudimentarytools. This process requires operators to be “masters of com-plexity” (which they often are) and continuous interaction. Inthis paper we aim at narrowing this huge gap between visionand reality by introducing a modular framework capable of(i) formalizing troubleshooting processes as the concatenationof executable functions [called troubleshooting graphs (TSGs)],(ii) executing these graphs via an interpreter, (iii) evaluating andnavigating between the outputs of the functions and (iv) sharingtroubleshooting know-hows in a formalized manner.
Index Terms—Computer networks, troubleshooting, decisionsupport.
I. INTRODUCTION
TROUBLESHOOTING a communication network wasnever an easy problem. Finding causes of errors and
failures, tracking down misconfigurations in the increasinglycomplex interconnection networks of heterogeneous network-ing devices is quite a challenge. What is more, the prevalenceof increasingly complex software components, due to theupcoming software defined networks (SDNs), adds distributedsoftware debugging as an additional issue to deal with. Tocope with this increasing complexity, the networking researchcommunity suggests the use of knowledge-based decisionsupport together with the standard network monitoring anddiagnostic tools, and the conversion of troubleshooting intoa highly automated process. Reality seems to reside very faraway from this vision. Real operators tend to use the mostbasic diagnostic tools for monitoring the network, and rely ontheir own brilliance and programming skills when digging outthe root causes of errors in an ad-hoc manner from the reportsof these tools. Even if this approach works well in practice, it
I. Pelle and F. Nemeth are with Budapest University of Technology andEconomics, Hungary, with HSNLab, Dept. of Telecommunications and MediaInformatics. e-mail: {pelle, nemethf}@tmit.bme.hu
A. Gulyas is with Budapest University of Technology and Economics,Hungary, with HSNLab, Dept. of Telecommunications and Media Informaticsand with MTA-BME Information Systems Research Group and was supportedby the Janos Bolyai Fellowship of the Hungarian Academy of Sciences. e-mail: [email protected]
The research leading to these results was partly supported by Ericssonand has received funding from the European Union Seventh FrameworkProgramme under grant agreement No 619609.
requires extremely skilled operators who can keep in mind allthe details of the network under scrutiny and their continuousinteraction usually is wasted on rummaging in the logs of thetools used by them.
As we see, the reason for this huge gap between theideas and reality is threefold. First, there is no usable, imple-mentation oriented formal description of the troubleshootingprocesses. Second, there is no platform capable of execut-ing formally defined troubleshooting processes while givingprompt and systematic access to the outputs of the usedtools. Finally, there is no existing platform that could in-tegrate existing troubleshooting tools and decision supportmethodologies in a flexible manner. In lack of formalism andintegrated execution platform, operators cannot share and re-use each other’s troubleshooting know-hows in a structuredway, thus knowledge is not accumulated but remains sporadicas operators treat every specific failure in their own ad-hocway.
Based on these observations, our contribution will be three-fold. First, we propose a formalization of troubleshootingprocesses in the form of troubleshooting graphs (TSGs)—complete with a description language to define them—, whichlet operators specify the steps of tracking down networkfailures in a structural manner. Once created, TSGs canmake their solutions ready-to-share and re-usable. Second, wepropose a modular execution framework capable of runningTSGs and offering on demand fast semantic navigation amongthe outputs of the tools used in the troubleshooting process.Finally, we present a complete prototype system capable ofdefining, executing and analyzing TSGs.
The rest of our paper is structured as follows: in Section IIwe give a brief overview on the related work in both literatureand practice. Section III lists the principles of our proposedmodular troubleshooting framework, followed by the illustra-tion of its operation over an SDN example in Section IV andan example for traditional networks in Section V. Section VIpresents the fundamentals of our prototype, Epoxide, whichis complemented with a complex illustrative case study inSection VII. Finally, we conclude the paper and give directionsfor future works in Section VIII.
II. STATE OF THE ART IN NETWORK TROUBLESHOOTING
From the great volume of related literature we highlighthere the two main constituents of troubleshooting systems. Thefirst is clearly the area of network monitoring and diagnostic

A Little Less Interaction, A Little More Action:A Modular Framework for Network Troubleshooting
SEPTEMBER 2017 • VOLUME IX • NUMBER 32
INFOCOMMUNICATIONS JOURNAL
2
tools, of which main purpose is to seek for symptoms ofspecific failures. The palette is very broad here, ranging fromthe most basic tools (like ping, traceroute, tcpdump, netstat,nmap [1] or GNU Debugger (GDB)), through monitoringprotocols (such as SNMP and RMON [1]), configurationanalyzers (e.g. Splat [2]), performance measurement tools(e.g. iperf [1]) and packet analyzers (like Wireshark), tothe more complex ones, such as NetFlow, HSA [3], [4] andATPG [5]. On top of these, SDN specific tools have added awhole new segment targeting the investigation of specific partsof the architecture. Tools such as Anteater [6], OFRewind [7],NetSight [8], VeriFlow [9], NICE [10], SOFT [11], FORT-NOX [12] and OFTEN [13] all fill a niche in SDN trou-bleshooting.
One level up, the output symptoms of these tools can beaggregated and fed into different automatic reasoning solu-tions. The first representatives of these were created as earlyas the second half of the 1980s [14] targeting the discoveryof failures in telecommunication networks. Early on, rule-based methods were used to resolve issues by using if–thenstatements [15]. Later case-based reasoning [16] and model-based [17] methods were developed. The former utilized a col-lection of previous cases as a basis for failure analysis, whilethe latter used models of structural and functional behaviorto reason about network issues. Fault-symptom graphs [18]and dependency or causality graphs [19], [20] introducedthe concept of tracking failures using graphs that createdconnections between symptoms, detection and root causes.This concept led to the application of Bayesian networks [21],[22] where belief—in the most probable failure root cause—propagation is based on a probabilistic model.
A. What We See in Current Practice
Despite the readily available set of advanced troubleshoot-ing tools and decision support mechanisms, operators seemto use the most rudimentary tools (like ping, traceroute,tcpdump etc.) while they completely rely on their mindsas a knowledge-base. For testing this, we conducted an in-house survey querying which type of problems local admin-istrators run into most frequently and what network trou-bleshooting tools they use most commonly. The results, wefound were completely in accordance with those outlinedin [23]. Most problems were caused by connectivity issuesthat arose from a variety of reasons ranging from hardwarefailures to configuration changes that became necessary dueto security issues. Used troubleshooting tools show similaritiesalso: mostly simple task specific tools are utilized, in certaincases combining them in a script to explore typical failures.Network information is usually stored in simple spreadsheetsand proprietary monitoring or troubleshooting tools are usedonly when they have a low cost—or are preferably free. Wefound that automatic tools are less frequently used and manualtroubleshooting dominates problem solving.
To get a deeper sense of the process, imagine the followingscenario: an operator wants to monitor certain traffic flowsin an SDN network and analyze whether these flows complywith certain criteria. By applying manual troubleshooting
using multiple shells, our fictional operator has to connectto different devices—SDN switches and hosts—run softwaretools to extract traffic data and then filter these to obtainthe flows. This process relies on the application of repetitivetasks—login and invocation of specific tools—and analyzingtextual data. This process poses four main problems. (i) Whenhistorical data is needed, the tools cannot be closed, thus theyquickly overpopulate the working environment. (ii) While theprocess is extremely flexible—as operators use tools of theirchoosing in the way and logic they see fit—, processing thedata quickly becomes overwhelming and inefficient withoutcomputerized help. (iii) There is no clear way that the pro-cess—the steps to be taken—can be recorded and later reusedin a flexible enough manner. (iv) The process is unorganized,thus operators’ time is spent mostly on filtering and findingthe correlation between the different outputs and keeping inmind the mapping between different shells and devices.
III. DESIGN PRINCIPLES OF A MODULAR FRAMEWORKFOR NETWORK TROUBLESHOOTING
Instead of proposing a new troubleshooting tool or anotherdecision support mechanism, we suggest here a framework1
capable of combining existing (and future) special-purposetools and reasoning methodologies in a modular fashion. Ourconcept builds on the observation that operators combinedifferent troubleshooting tools to find out the root cause ofa network issue. In the following sections, we go throughthe main notions that we use to describe such troubleshootingprocesses and the fundamentals of our framework capable ofexecuting troubleshooting graphs (TSGs).
A. Nodes: Wrappers Around Troubleshooting Tools
First we define an abstraction that incorporates the basicelements of a troubleshooting process: nodes are wrappersaround troubleshooting tools or smaller, processing functions.These are considered as black boxes hiding their internaloperation from the outside (see Fig. 1). Operators have threetypes of interfaces for communicating with nodes. On inputsthey execute operations (e.g. a text stream to process orclock ticks). Configuration arguments relay static parameters.Finally, outputs relay the exact output of the wrapped tool orprovide extra processing before generating results.
Three stages make up the life cycle of a node. Nodesenter their initialization stage only once, where environmentsetup is performed, including resource allocation and initialconfiguration. At the execution stage, nodes read the dataarriving on their inputs and query the wrapped process orfunction. Analysis or modification on the wrapped tool’soutput is also performed here. The node is constantly in thisstage when it has been initialized but not yet been terminated.Finally, the node reaches the termination stage when it is beingstopped. This stage is responsible for clearing up allocatedresources and terminating wrapped processes.
1Our initial research and implementation of a subset of current frameworkfunctionality is discussed in [24].

A Little Less Interaction, A Little More Action:A Modular Framework for Network Troubleshooting
INFOCOMMUNICATIONS JOURNAL
SEPTEMBER 2017 • VOLUME IX • NUMBER 3 3
3
Input #0
Input #1...
Input #n
Output #0
Output #1...
Output #o
Config #1 Config #2. . .
Config #m
Wrapped tool
Fig. 1: A conceptual node.
B. Edges: Accessible Data Transfer
We use edges to describe the connections between nodes.Besides specifying the nodes to connect, the main featurerequired from edges is to provide accessibility for node out-puts: information over the edges is observable and modifiableon demand by operators. When access is given to edges,operators can analyze troubleshooting processes on the lowestlevels. By making historical data available on edges, back-tracking network condition changes becomes feasible duringruntime. Modifiable edges provide the additional benefit ofdirect operator interaction with nodes, which is helpful forinstant testing purposes. This method also helps channeling—otherwise unobtainable—data into our system from the net-work environment.
C. The Troubleshooting Graph
By leveraging the power of wrapper nodes and accessibleedges, troubleshooting processes can be formalized as TSGs:series of tools and transformations.
Besides the simple concatenation of nodes, creatingbranches is possible through special purpose decision nodes.These nodes are processing nodes capable of analyzing in-coming data and matching them against a specific criteria set.Such nodes can provide generalized decision making apparatusthat can combine results arriving from different nodes andimplement arbitrary decision functions to analyze and evaluatethem.
For a text-based representation of TSGs, we define a simpleClick-inspired [25] description language. Such language fitsperfectly to our concept as we look at nodes as black boxes thathave inputs, outputs and configuration arguments, which thelanguage supports by default. Port-based explicit node linkingis also a feature that we make good use of. An exemplary TSGand its definition using the language is given in Section IV.
D. Execution Framework for TSGs
In order to bring the TSG concept closer to implemen-tation, we designed our execution framework around threecornerstones. (i) Interpretation: since a TSG is only a formaldescription, the framework provides a parser to interpret thegraph. (ii) Execution: the TSG concept describes how toconnect tools to each other but it does not deal with theproblem of when and how a node’s life cycle is managedand how a node is notified when its inputs are updated.
(iii) Navigation options: the benefit of handling interconnectedtroubleshooting tools as a graph is that it creates a natural orderin the troubleshooting process. In order to better manage thecomplex information set contained in the graph, the frameworkprovides different apparatuses to aid observing the executionstate and navigating through the graph.
E. Recommendation System and Knowledge Sharing
The framework provides a recommendation system thatis able to suggest new nodes for operators, based on theircurrent setup, by searching for similarities in a TSG repository.Operators can upload their existing TSGs to this repositoryhereby promoting knowledge sharing.
IV. AN SDN EXAMPLE USING TSGS
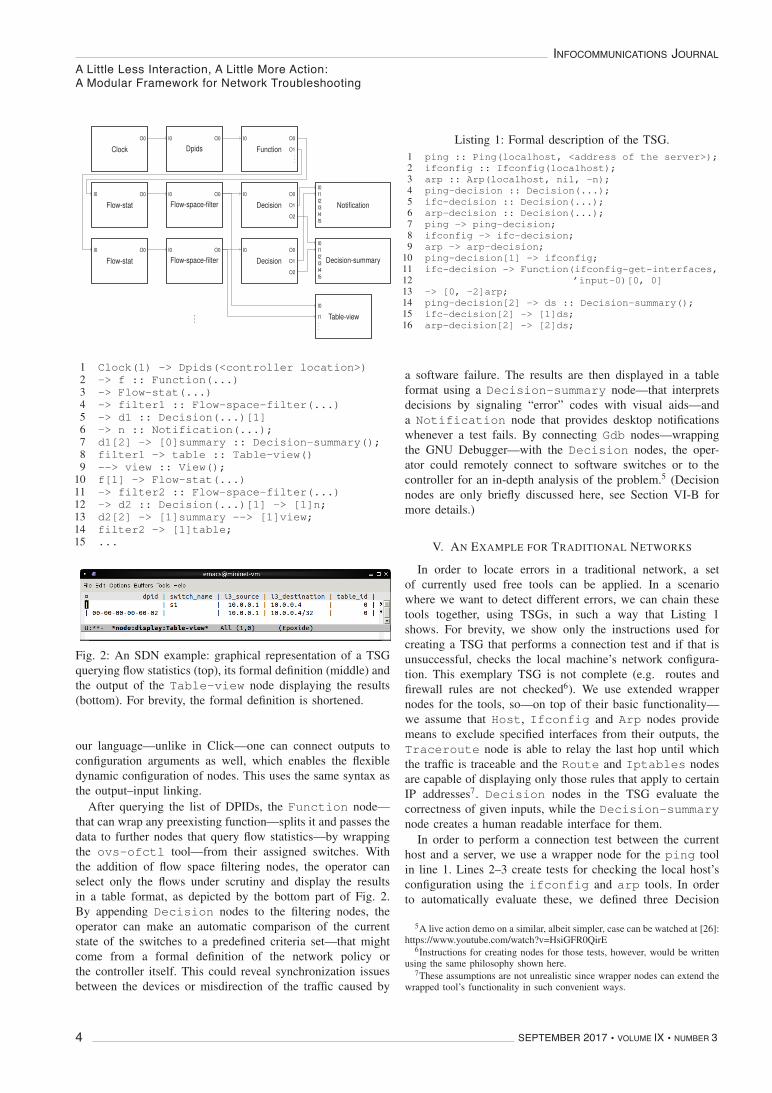
In order to solve our running example from Section II-A,instead of manually gathering information about the flows,operators can create a TSG—such as the one shown in Fig. 2—that automates the process for them.2 They can leverage aunified interface for accessing different OpenFlow capableentities by using nodes to interact with different controllerplatforms and Open vSwitch (OVS) switches. These nodes areable to collect dapatapath identifiers (DPIDs) and flow statis-tics information. Additionally, we created processing nodes forfiltering flow statistics on a flow space3 basis.
In line 1 of the example of Fig. 2, we define nodesquerying DPIDs from the controller4 on a timely basis bywriting expressions that are always terminated by semicolons.Nodes can be defined by assigning an instance name to awrapper node using the :: operator and linked with edges toother nodes using the -> linking operator. For simplicity, theinstance name can be omitted if the node is not referencedin the code later on (see the Dpids node). Configurationarguments follow the node instance assignment in parentheses.Let’s stop now to have a closer look at the Dpids node. Onits single output, the node relays the DPIDs of the switchesconnected to a certain SDN controller, each time it receivesan enabling signal on its single input. The single configurationargument specifies the location of this controller. In the ini-tialization stage, the node sets up connection to the controller.At execution time, it accesses the controller’s specific API toquery the DPID information, while at the termination stage,the ongoing processes are stopped and the connection to thecontroller is closed.
Linking operators always have the list of node outputs ontheir left side and the list of inputs on their right side—asin line 7 of the example. Multiple edges can also be createdbetween two nodes in a single expression this way. Outputsand inputs are always referred to with their zero-based indices.In case only the 0th input or output appears in a linkingexpression, one can omit its index, as depicted in line 1. In
2With an appropriate node repository, only the connections need to becorrectly specified among nodes.
3Those flow table entries make up a flow space that match given sourceand destination point pairs.
4Nodes accessing POX, Floodlight and OpenDaylight controllers are cur-rently available.
A Little Less Interaction, A Little More Action:A Modular Framework for Network Troubleshooting
SEPTEMBER 2017 • VOLUME IX • NUMBER 34
INFOCOMMUNICATIONS JOURNAL
4
O0
ClockI0 O0
DpidsI0 O0
O1...
Function
I0 O0
Flow-stat
I0 O0
Flow-stat
I0 O0
Flow-space-filter
I0 O0
Flow-space-filter
...
I0 O0
O1
O2
Decision
I0 O0
O1
O2
Decision
I0I1I2I3I4I5
Notification
I0I1I2I3I4I5
Decision-summary
I0
I1...
Table-view
1 Clock(1) -> Dpids(<controller location>)2 -> f :: Function(...)3 -> Flow-stat(...)4 -> filter1 :: Flow-space-filter(...)5 -> d1 :: Decision(...)[1]6 -> n :: Notification(...);7 d1[2] -> [0]summary :: Decision-summary();8 filter1 -> table :: Table-view()9 --> view :: View();
10 f[1] -> Flow-stat(...)11 -> filter2 :: Flow-space-filter(...)12 -> d2 :: Decision(...)[1] -> [1]n;13 d2[2] -> [1]summary --> [1]view;14 filter2 -> [1]table;15 ...
Fig. 2: An SDN example: graphical representation of a TSGquerying flow statistics (top), its formal definition (middle) andthe output of the Table-view node displaying the results(bottom). For brevity, the formal definition is shortened.
our language—unlike in Click—one can connect outputs toconfiguration arguments as well, which enables the flexibledynamic configuration of nodes. This uses the same syntax asthe output–input linking.
After querying the list of DPIDs, the Function node—that can wrap any preexisting function—splits it and passes thedata to further nodes that query flow statistics—by wrappingthe ovs-ofctl tool—from their assigned switches. Withthe addition of flow space filtering nodes, the operator canselect only the flows under scrutiny and display the resultsin a table format, as depicted by the bottom part of Fig. 2.By appending Decision nodes to the filtering nodes, theoperator can make an automatic comparison of the currentstate of the switches to a predefined criteria set—that mightcome from a formal definition of the network policy orthe controller itself. This could reveal synchronization issuesbetween the devices or misdirection of the traffic caused by
Listing 1: Formal description of the TSG.1 ping :: Ping(localhost, <address of the server>);2 ifconfig :: Ifconfig(localhost);3 arp :: Arp(localhost, nil, -n);4 ping-decision :: Decision(...);5 ifc-decision :: Decision(...);6 arp-decision :: Decision(...);7 ping -> ping-decision;8 ifconfig -> ifc-decision;9 arp -> arp-decision;
10 ping-decision[1] -> ifconfig;11 ifc-decision -> Function(ifconfig-get-interfaces,12 ’input-0)[0, 0]13 -> [0, -2]arp;14 ping-decision[2] -> ds :: Decision-summary();15 ifc-decision[2] -> [1]ds;16 arp-decision[2] -> [2]ds;
a software failure. The results are then displayed in a tableformat using a Decision-summary node—that interpretsdecisions by signaling “error” codes with visual aids—anda Notification node that provides desktop notificationswhenever a test fails. By connecting Gdb nodes—wrappingthe GNU Debugger—with the Decision nodes, the oper-ator could remotely connect to software switches or to thecontroller for an in-depth analysis of the problem.5 (Decisionnodes are only briefly discussed here, see Section VI-B formore details.)
V. AN EXAMPLE FOR TRADITIONAL NETWORKS
In order to locate errors in a traditional network, a setof currently used free tools can be applied. In a scenariowhere we want to detect different errors, we can chain thesetools together, using TSGs, in such a way that Listing 1shows. For brevity, we show only the instructions used forcreating a TSG that performs a connection test and if that isunsuccessful, checks the local machine’s network configura-tion. This exemplary TSG is not complete (e.g. routes andfirewall rules are not checked6). We use extended wrappernodes for the tools, so—on top of their basic functionality—we assume that Host, Ifconfig and Arp nodes providemeans to exclude specified interfaces from their outputs, theTraceroute node is able to relay the last hop until whichthe traffic is traceable and the Route and Iptables nodesare capable of displaying only those rules that apply to certainIP addresses7. Decision nodes in the TSG evaluate thecorrectness of given inputs, while the Decision-summarynode creates a human readable interface for them.
In order to perform a connection test between the currenthost and a server, we use a wrapper node for the ping toolin line 1. Lines 2–3 create tests for checking the local host’sconfiguration using the ifconfig and arp tools. In orderto automatically evaluate these, we defined three Decision
5A live action demo on a similar, albeit simpler, case can be watched at [26]:https://www.youtube.com/watch?v=HsiGFR0QirE
6Instructions for creating nodes for those tests, however, would be writtenusing the same philosophy shown here.
7These assumptions are not unrealistic since wrapper nodes can extend thewrapped tool’s functionality in such convenient ways.

A Little Less Interaction, A Little More Action:A Modular Framework for Network Troubleshooting
INFOCOMMUNICATIONS JOURNAL
SEPTEMBER 2017 • VOLUME IX • NUMBER 3 5
5
Fig. 3: Summarizing a troubleshooting scenario.
nodes. ping-decision checks whether the ping was suc-cessful. ifc-decision uses a custom function to validatethe interface configuration returned by the ifconfig node.The arp-decision node performs a simple check to testwhether there are entries in the Address Resolution Protocol(ARP) cache. These Decision nodes are then connected withtheir respective wrapper nodes in lines 7–9. In order to checkthe local host’s configuration only when the connection testwas unsuccessful, we need to connect the ifconfig node tothe negative output of the ping-decision node—line 10implements that. If there are interfaces on the host that arecorrectly configured, we need to check whether the host canregister the layer 2 addresses from its network. We defined aFunction node in line 11 in order to retrieve the interfacenames from the output of the ifc-decision and fed theseto the Arp node. Finally, we defined a Decision-summarynode in lines 14–16 to display information collected fromevery Decision node in a summarizing table.
We executed the extended version of this TSG in a homenetworking environment, where a Linux host was connectedto the residential gateway via WiFi connection. A possibleoutput of the Decision-summary node is shown in Fig. 3.The node gives the results of the individual decisions inthe TSG as well as an overall evaluation of the currenttroubleshooting scenario: connection with the remote servercannot be established but the configuration of the current hostseems to be fine. The most basic assumption at this point canbe that the problem is caused by either the residential gatewayor it is located at the Internet Service Provider’s side.
These simple examples attest that by using TSGs, we canachieve a state of automation where operators can recognizefailure modes at a glance by looking at the error codes,or can further delve into details by navigating through theoutputs of nodes. Using the navigation options provided by theframework, the operator can walk through the troubleshootingprocess in an orderly fashion. Results are going to be displayedaccording to the workflow, laid out when setting up the processof locating the issue.
By offering proper formalization, TSGs—or theirsubgraphs—can be reused in similar scenarios withslight adjustments to the node configuration arguments.Besides re-usability, TSGs can act as a technique to collecttroubleshooting know-hows. Once a network problem isuncovered using a TSG, it automatically becomes a guidelinefor discovering future similar issues. By collecting a library ofthese, operators can greatly decrease problem solution times
and the efficiency of knowledge transfer to new operatorscan also increase. If TSGs are not only collected within aclosed environment—i.e. within a company—but are sharedwith a greater audience, they can prove to be beneficial forthe whole networking community. If a wide TSG library ispaired with problem descriptions and solutions, new nodesand test cases can be recommended to an operator, based onprevious cases described by TSGs in the library.
VI. PROTOTYPE
For proofing the concept of our framework, we createda prototype implementation, named Epoxide, using GNUEmacs as a platform. Emacs is an extensible, customizabletext editor, its central concept, the buffer, is responsible forholding file contents, subprocess outputs, providing configu-ration interfaces, etc. By its extensible nature, Emacs offereda particularly good platform to build Epoxide upon. Emacssupports, via its advanced text manipulation and documenta-tion functions, writing TSG definitions that we store in .tsgconfiguration files. We implemented our execution frameworkand wrapper nodes using Emacs’s own Lisp dialect, EmacsLisp. Nodes and their outputs are assigned to Emacs buffersfor observability. Node interface and connection informationis stored in buffer local variables. We note that while Emacsproved to be a good fit for our notions, the concept describedin Section III can be implemented on other platforms as well.
A. Framework Functions
Epoxide provides two methods to create TSGs. The firstoption is building the graph by interpreting its definitionwritten in our description language. Opening a .tsg file inEmacs automatically loads Epoxide and interprets the TSGstored in it. Using this method, graphs can be saved andlater reused and shared. Since we added self-documentingcapabilities to nodes and leveraged functionality provided byEmacs’s ElDoc package, the framework offers hints on nodeinterfaces during TSG definition. Syntax highlighting helps todifferentiate semantic units at this stage and when Emacs’sAuto Complete package is installed, it can provide intelligentcode completion for setting up nodes. At first, the parsercollects the nodes, their configuration arguments and the linksbetween the nodes. The framework assigns unique names tonode objects and outputs and maps these to buffers wherenodes can write directly during their execution stage. Thismethod can also be used to modify TSGs by way of editingthe .tsg file and reevaluating it. A downside is that buffercontents prior to the modification get lost.
As a second option, we provide a method for incrementallybuilding TSGs at run time using a drag and drop method.This method has the benefit that operators can monitor theoutput of the used tools and adjust their methodology to theresults they have acquired until that point (which is fully in linewith current practice). The parser creates the objects for thenodes and interconnections, and commits these to the .tsgfile. Run-time modification of the graph—node reconfigurationand relinking—is provided by this functionality as well via anEmacs widget based interface. These two methods can be used

Ethernet with Time Sensitive Networking Tools for Industrial Networks
SEPTEMBER 2017 • VOLUME IX • NUMBER 36
INFOCOMMUNICATIONS JOURNAL
6
Output changed Queryconnected nodes
Scheduler
Execute node
Fig. 4: Scheduling of node execution.
in conjunction and offer flexibility while retaining the benefitof being able to store troubleshooting scenarios.
Once TSG execution is started, the framework takes care ofnode events, as depicted in Fig. 4. A scheduler is created—using the timerfunctions package—that handles a queue forregistering node output changes. Each time an output haschanged, the framework queries which nodes have that as theirinput. These destination nodes are then inserted to the end ofthe queue. Parallel to this, a simple scheduling mechanism isrunning that always takes the first item from the beginning ofthe queue and sends a signal to that node to enter into theexecution stage. When the call returns, the scheduler movesto the next node in line and so on.
Basic navigability among the created buffers is providedby Emacs key bindings. Epoxide supplies the apparatus tomove from one node buffer to its output buffers or to thenext node’s buffer (in forward or backward direction). Totraverse a TSG, a visualization can be used also, supportedby the Emacs COGRE package. When the Graphviz externalsoftware is installed, the displayed graph can be drawn usingan automatic layout for better visual clarity. Semantic groupingof the created buffers is provided using the Ibuffer package:a dynamic list is displayed that aggregates buffers based ontheir types and roles in the current context. Custom grouping ofbuffers is also available via a special node class, a View, thatcan collect nodes or their outputs and display them together.
The current implementation of Epoxide provides a modulefor collecting TSG related data and supplying node recommen-dations. We created the instrumentation for basic case-basedreasoning where currently available TSGs are considered asdescriptions of previous troubleshooting cases. These TSGsare indexed and their data—together with information from thecurrent TSG—is passed to a recommender. The recommenderthen can suggest nodes based on these pieces of data. Wecreated an interface in the framework to which recommenders,developed by third parties, can connect as well. By now, wehave implemented the most basic recommender that suggeststhe most popular nodes and displays them using Emacs’s Idopackage. Most popular nodes are computed by counting everynode in all previously written TSGs and ordering them inthe descending order of their cumulative count. Nodes thatare already used in the current TSG, are excluded from thesuggestion list.
B. Branching Nodes
When creating the apparatus that enables conditionalbranching in Epoxide, the most basic expectation was to(i) provide functionality to analyze and evaluate the outputof any node and, based on the result, (ii) create branches
Tool 1
. . .
Tool n
Verify input 0
. . .
Verify input nC
ombine
orselect
Positive output
Negative output
Status output
Decision node
Fig. 5: Schematics of a Decision node.
in a TSG, the same way a decision would in a flow chart.Additionally, we wanted to have the ability to (iii) selectamong different inputs or to use a combination of them. Thiscriterion was inspired by how nodes work in a Bayesiannetwork: they receive the results of lower level nodes andcalculate their outputs based on that. To satisfy these criteria,we implemented a single Decision node. Since nodes canbe added to Epoxide in a modular fashion, this is onlyone possible implementation that satisfies our initial criteria.Operators are free to add their own version. A Decision-summary node was developed in conjunction, for summarizingthe outputs of such nodes.
Fig. 5 shows the schematics of our Decision node. The nodecan attach to any wrapper node8 and incoming data is firstverified (as per (i)): compliance with a certain criteria set isdetermined. The node can use any function for verification thathas at least one argument (the input) and can return false, whenverification failed, or any string otherwise. When verificationof the inputs is finished, further processing can be done usinga second stage function, in accordance with (iii). An operatorcan use a function to select an input with, for example, the orfunction: the first of the inputs that passed verification is goingto be the result of this stage. Other functions can implementmore complex processing, like in the aforementioned Bayesiannetwork example where the result would be a probabilityvalue. Such second stage functions should return a string incase of a positive decision or false otherwise. We definedtwo node outputs to relay these return values (as per (ii)).The first displays information in the positive case, the secondin the negative. We implemented an additional output forinteroperating with Decision-summary nodes.
C. Implementing Nodes
The modular architecture of Epoxide makes it possible foranyone to implement new nodes. A node developer—whoimplements a node—has to create separate node definition filesthat contain Emacs Lisp code to provide self-documentationfor nodes and implement the three life cycle stages via func-tions. For proper interaction with nodes, the node definitionfiles and these functions should comply with a fixed namingscheme. Node self-documentation functions should provideinformation about node interfaces and could also implementvalidation functions to check the compliance of argumentswith certain criteria. The functions implementing the sepa-rate node life cycle stages are called by the framework onspecific occasions. The initialization function is evoked afterthe buffers belonging to the node are set up. The execution
8The node is also prepared to handle the asynchronism and the differentoutput formats of the wrapper nodes.
A Little Less Interaction, A Little More Action:A Modular Framework for Network Troubleshooting
INFOCOMMUNICATIONS JOURNAL
SEPTEMBER 2017 • VOLUME IX • NUMBER 3 7
7
function is called every time a change occurs on any of thenode’s inputs. Finally, the termination function is invokedbefore the framework closes the buffers associated with thenode. These functions can draw on common node functionsprovided by the framework. Epoxide implements functions forsetting up node buffers with basic data, reading inputs andconfiguration arguments, writing outputs and handling remoteaccess using Emacs’s Transparent Remote Access, MultipleProtocols (TRAMP) package.
VII. A CASE STUDY: TROUBLESHOOTING IN SERVICEFUNCTION CHAINING
One of the main goals of the UNIFY project9 was todesign a Service Function Chaining control plane architectureand implement a proof-of-concept prototype. Additionally,the project also introduces the concept of Service-ProviderDevOps to combine the developer and operational workflowsin carrier grade environments. DevOps results in faster deploy-ment cycle of novel networking services. Instead of designingcomplex services as a whole, these services are assembledfrom atomic network functions. However, fast deploymentcycles require faster testing phases and troubleshooting in theoperational environment. Even when a new service is createdby re-using components of previous ones, it is still going tobe different enough from earlier scenarios to implicate newtroubleshooting challenges. In these cases, previous knowledgeis not always directly applicable. By providing an integratedplatform for running troubleshooting tools and an apparatusto automatize their execution, our tool makes the formationof new troubleshooting scenarios easier, thus enabling quickerservice deployment.
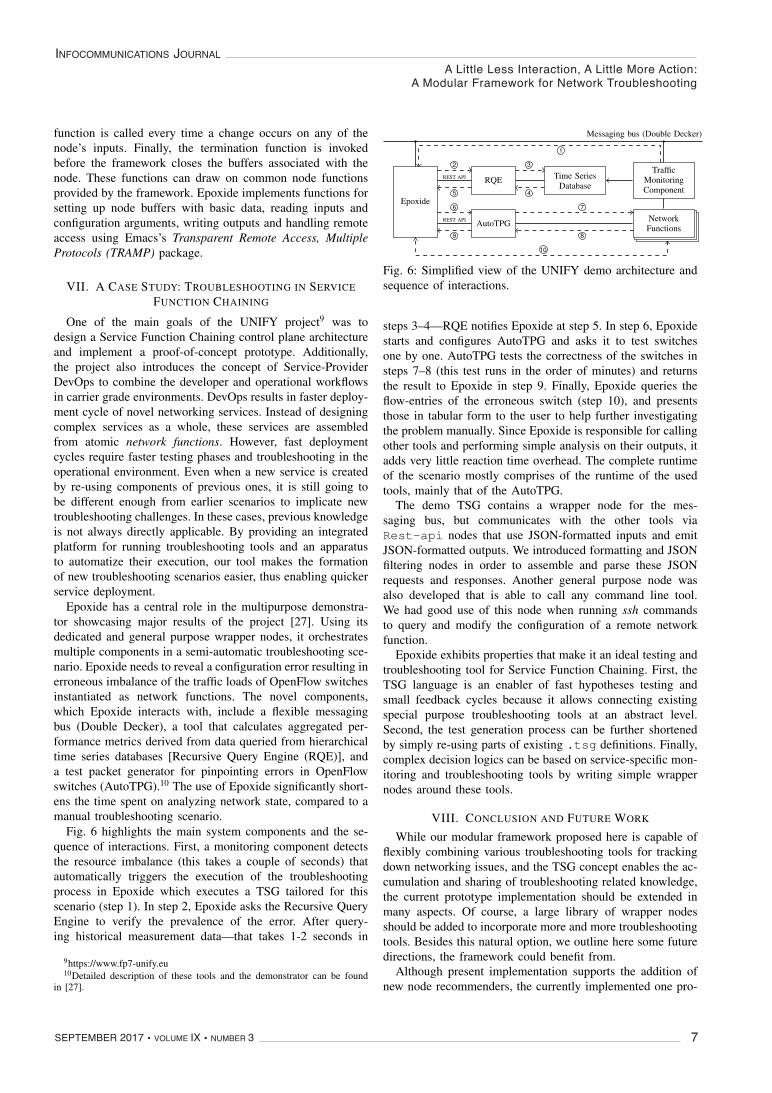
Epoxide has a central role in the multipurpose demonstra-tor showcasing major results of the project [27]. Using itsdedicated and general purpose wrapper nodes, it orchestratesmultiple components in a semi-automatic troubleshooting sce-nario. Epoxide needs to reveal a configuration error resulting inerroneous imbalance of the traffic loads of OpenFlow switchesinstantiated as network functions. The novel components,which Epoxide interacts with, include a flexible messagingbus (Double Decker), a tool that calculates aggregated per-formance metrics derived from data queried from hierarchicaltime series databases [Recursive Query Engine (RQE)], anda test packet generator for pinpointing errors in OpenFlowswitches (AutoTPG).10 The use of Epoxide significantly short-ens the time spent on analyzing network state, compared to amanual troubleshooting scenario.
Fig. 6 highlights the main system components and the se-quence of interactions. First, a monitoring component detectsthe resource imbalance (this takes a couple of seconds) thatautomatically triggers the execution of the troubleshootingprocess in Epoxide which executes a TSG tailored for thisscenario (step 1). In step 2, Epoxide asks the Recursive QueryEngine to verify the prevalence of the error. After query-ing historical measurement data—that takes 1-2 seconds in
9https://www.fp7-unify.eu10Detailed description of these tools and the demonstrator can be found
in [27].
Epoxide
RQE
AutoTPG
Time SeriesDatabase
NetworkFunctions
TrafficMonitoringComponent
Messaging bus (Double Decker)
REST API
REST API
1
2
5
3
4
6
9
7
8
10
Fig. 6: Simplified view of the UNIFY demo architecture andsequence of interactions.
steps 3–4—RQE notifies Epoxide at step 5. In step 6, Epoxidestarts and configures AutoTPG and asks it to test switchesone by one. AutoTPG tests the correctness of the switches insteps 7–8 (this test runs in the order of minutes) and returnsthe result to Epoxide in step 9. Finally, Epoxide queries theflow-entries of the erroneous switch (step 10), and presentsthose in tabular form to the user to help further investigatingthe problem manually. Since Epoxide is responsible for callingother tools and performing simple analysis on their outputs, itadds very little reaction time overhead. The complete runtimeof the scenario mostly comprises of the runtime of the usedtools, mainly that of the AutoTPG.
The demo TSG contains a wrapper node for the mes-saging bus, but communicates with the other tools viaRest-api nodes that use JSON-formatted inputs and emitJSON-formatted outputs. We introduced formatting and JSONfiltering nodes in order to assemble and parse these JSONrequests and responses. Another general purpose node wasalso developed that is able to call any command line tool.We had good use of this node when running ssh commandsto query and modify the configuration of a remote networkfunction.
Epoxide exhibits properties that make it an ideal testing andtroubleshooting tool for Service Function Chaining. First, theTSG language is an enabler of fast hypotheses testing andsmall feedback cycles because it allows connecting existingspecial purpose troubleshooting tools at an abstract level.Second, the test generation process can be further shortenedby simply re-using parts of existing .tsg definitions. Finally,complex decision logics can be based on service-specific mon-itoring and troubleshooting tools by writing simple wrappernodes around these tools.
VIII. CONCLUSION AND FUTURE WORK
While our modular framework proposed here is capable offlexibly combining various troubleshooting tools for trackingdown networking issues, and the TSG concept enables the ac-cumulation and sharing of troubleshooting related knowledge,the current prototype implementation should be extended inmany aspects. Of course, a large library of wrapper nodesshould be added to incorporate more and more troubleshootingtools. Besides this natural option, we outline here some futuredirections, the framework could benefit from.
Although present implementation supports the addition ofnew node recommenders, the currently implemented one pro-

A Little Less Interaction, A Little More Action:A Modular Framework for Network Troubleshooting
SEPTEMBER 2017 • VOLUME IX • NUMBER 38
INFOCOMMUNICATIONS JOURNAL
8
vides only a basic functionality. We consider this a basis toimplement better recommenders. Suggestions could be mademore relevant by taking the environment of the nodes intoconsideration and suggesting node configurations as well. Theprocess could further be supported by using a community-based repository of TSGs where TSGs can be analyzed andused for supplying better suggestions.
With the help of an appropriate failure propagation modeland formal description of the network policy, we believe,TSGs containing network tests and basic evaluations can begenerated with little operator intervention or totally unsuper-vised. By adding the possibility to create hierarchical TSGs,Epoxide could create more complex tests that are selected andconfigured automatically depending on results acquired fromthe network at real time.
REFERENCES
[1] Sloan, J. D., Network Troubleshooting Tools. O’Reilly, 8 2001.[2] Abrahamson, C., Blodgett, M., Kunen, A., Mueller, N., and Parter, D.,
“Splat: A Network Switch/Port Configuration Management Tool,” inProceedings of the 17th Conference on Systems Administration (LISA2003), 2003.
[3] Kazemian, P., Chan, M., Zeng, H., Varghese, G., McKeown, N., andWhyte, S., “Real Time Network Policy Checking Using Header SpaceAnalysis,” in NSDI, 2013, pp. 99–111.
[4] Kazemian, P., Varghese, G., and McKeown, N., “Header Space Analysis:Static Checking for Networks,” in NSDI, 2012, pp. 113–126.
[5] Zeng, H., Kazemian, P., Varghese, G., and McKeown, N., “Automatictest packet generation,” in Proceedings of the 8th international confer-ence on Emerging networking experiments and technologies. ACM,2012, pp. 241–252.
[6] Mai, H., Khurshid, A., Agarwal, R., Caesar, M., Godfrey, P. B., andKing, S. T., “Debugging the Data Plane with Anteater,” in Proceedingsof the ACM SIGCOMM 2011 Conference, ser. SIGCOMM ’11. NewYork, NY, USA: ACM, 2011, pp. 290–301. [Online]. Available:http://doi.acm.org/10.1145/2018436.2018470
[7] Wundsam, A., Levin, D., Seetharaman, S., Feldmann, A. et al.,“OFRewind: Enabling Record and Replay Troubleshooting for Net-works,” in USENIX Annual Technical Conference, 2011.
[8] Handigol, N., Heller, B., Jeyakumar, V., Mazieres, D., and McKeown,N., “I know what your packet did last hop: Using packet histories totroubleshoot networks,” in Proc. USENIX NSDI, 2014.
[9] Khurshid, A., Zhou, W., Caesar, M., and Godfrey, P., “Veriflow: verify-ing network-wide invariants in real time,” ACM SIGCOMM ComputerCommunication Review, vol. 42, no. 4, pp. 467–472, 2012.
[10] Canini, M., Venzano, D., Peresini, P., Kostic, D., Rexford, J. et al., “ANICE Way to Test OpenFlow Applications,” in NSDI, vol. 12, 2012, pp.127–140.
[11] Kuzniar, M., Peresini, P., Canini, M., Venzano, D., and Kostic, D., “Asoft way for openflow switch interoperability testing,” in Proceedings ofthe 8th international conference on Emerging networking experimentsand technologies. ACM, 2012, pp. 265–276.
[12] Porras, P., Shin, S., Yegneswaran, V., Fong, M., Tyson, M., and Gu, G.,“A security enforcement kernel for openflow networks,” in Proceedingsof the first workshop on Hot topics in software defined networks. ACM,2012, pp. 121–126.
[13] Kuzniar, M., Canini, M., and Kostic, D., “OFTEN testing OpenFlownetworks,” in Software Defined Networking (EWSDN), 2012 EuropeanWorkshop on. IEEE, 2012, pp. 54–60.
[14] Mathonet, R., Van Cotthem, H., and Vanryckeghem, L., “DANTES AnExpert System for Real-Time Network Troubleshooting,” in Proceedingsof the 10th International Joint Conference on Artificial Intelligence,1987, pp. 527–530.
[15] Hitson, B. L., “Knowledge-Based Monitoring and Control: An Approachto Understanding the Behavior TCP/IP Network Protocols,” in Sym-posium proceedings on Communications architectures and protocols,vol. 18, 1988.
[16] Lewis, L., “A Case-Based Reasoning Approach to the Management ofFaults in Communications Networks,” in Twelfth Annual Joint Confer-ence of the IEEE Computer and Communications Societies, 1993.
[17] Jakobson, G. and Weissman, M., “Real-time telecommunication networkmanagement: extending event correlation with temporal constraints,”in Proceedings of the fourth international symposium on Integratednetwork management IV, 1995, pp. 290–301.
[18] Reali, G. and Monacelli, L., “Definition and performance evaluation ofa fault localization technique for an NGN IMS network,” in IEEE Trans-actions on Network and Service Management, 2009, p. 6(2):122136.
[19] Lu, J., Dousson, C., Radier, B., and Krief, F., “Towards an Auto-nomic Network Architecture for Self-healing in TelecommunicationsNetworks,” in Mechanisms for Autonomous Management of Networksand Services, vol. 6155, 2010, pp. 110–113.
[20] ——, “A Self-diagnosis Algorithm Based on Causal Graphs,” in TheSeventh International Conference on Autonomic and Autonomous Sys-tems, 2011.
[21] Charniak, E., “Bayesian networks without tears: making Bayesian net-works more accessible to the probabilistically unsophisticated,” in AIMagazine, vol. 12, 1991, pp. 50–63.
[22] Khanafer, R., “Automated diagnosis for UMTS networks using Bayesiannetwork approach,” in IEEE Transactions on Vehicular Technology,2008, p. 57:24512461.
[23] Zeng, H., Kazemian, P., Varghese, G., and McKeown, N., “A Survey onNetwork Troubleshooting,” 2014.
[24] Pelle, I., Levai, T., Nemeth, F., and Gulyas, A., “One tool to rulethem all: A modular troubleshooting framework for SDN (and other)networks,” in Proceedings of the 1st ACM SIGCOMM Symposium onSoftware Defined Networking Research, 2015.
[25] Kohler, E., Morris, R., Chen, B., Jannotti, J., and Kaashoek, M. F., “TheClick modular router,” ACM Transactions on Computer Systems (TOCS),vol. 18, no. 3, pp. 263–297, 2000.
[26] Levai, T., Pelle, I., Nemeth, F., and Gulyas, A., “Epoxide: A modularprototype for sdn troubleshooting,” in Proceedings of the 2015 ACMConference on Special Interest Group on Data Communication, 2015,pp. 359–360.
[27] Marchetto, G. and Sisto, R. (editors), “Deliverable D4.3: Updated con-cept and evaluation results for SP-DevOps,” in eprint arXiv:1610.02387,2016.
Istvan Pelle received M.Sc. degree in ComputerEngineering at Budapest University of Technologyand Economics, Budapest, Hungary in 2015. Cur-rently he is pursuing the Ph.D. degree with BudapestUniversity of Technology and Economics. His re-search interests include software defined networksand network troubleshooting.
Felician Nemeth received his M.Sc. degree in Com-puter Science from BME in 2000. He is a researchfellow at the Department of Telecommunicationsand Media Informatics of the same university. Hewas a member of national research projects and theEFIPSANS, OPENLAB, UNIFY FP7 EU projects.His current research interests focus on SoftwareDefined Networking, congestion control methodsand autonomic computing.
Andras Gulyas received M.Sc. and Ph.D. degree inInformatics at Budapest University of Technologyand Economics, Budapest, Hungary in 2002 and2008 respectively. Currently he is a research fellowat the Department of Telecommunications and Me-dia Informatics. His research interests are complexand self-organizing networks and software definednetworking.
István Pelle received M.Sc. degree in Computer Engineering at Budapest University of Technology and Economics, Budapest, Hungary in 2015. Cur-rently he is pursuing the Ph.D. degree with Buda-pest University of Technology and Economics. His research interests include software defined networks and network troubleshooting.
Felicián Németh received his M.Sc. degree in Com-puter Science from BME in 2000. He is a research fellow at the Department of Telecommunications and Media Informatics of the same university. He was a member of national research projects and the EFIPSANS, OPENLAB, UNIFY FP7 EU projects.His current research interests focus on Software Defined Networking, congestion control methods and autonomic computing.
András Gulyás received M.Sc. and Ph.D. degree in Informatics at Budapest University of Technology and Economics, Budapest, Hungary in 2002 and 2008 respectively. Currently he is a research fellow at the Department of Telecommunications and Media Informatics. His research interests are complex and self-organizing networks and software defined networking.
8
vides only a basic functionality. We consider this a basis toimplement better recommenders. Suggestions could be mademore relevant by taking the environment of the nodes intoconsideration and suggesting node configurations as well. Theprocess could further be supported by using a community-based repository of TSGs where TSGs can be analyzed andused for supplying better suggestions.
With the help of an appropriate failure propagation modeland formal description of the network policy, we believe,TSGs containing network tests and basic evaluations can begenerated with little operator intervention or totally unsuper-vised. By adding the possibility to create hierarchical TSGs,Epoxide could create more complex tests that are selected andconfigured automatically depending on results acquired fromthe network at real time.
REFERENCES
[1] Sloan, J. D., Network Troubleshooting Tools. O’Reilly, 8 2001.[2] Abrahamson, C., Blodgett, M., Kunen, A., Mueller, N., and Parter, D.,
“Splat: A Network Switch/Port Configuration Management Tool,” inProceedings of the 17th Conference on Systems Administration (LISA2003), 2003.
[3] Kazemian, P., Chan, M., Zeng, H., Varghese, G., McKeown, N., andWhyte, S., “Real Time Network Policy Checking Using Header SpaceAnalysis,” in NSDI, 2013, pp. 99–111.
[4] Kazemian, P., Varghese, G., and McKeown, N., “Header Space Analysis:Static Checking for Networks,” in NSDI, 2012, pp. 113–126.
[5] Zeng, H., Kazemian, P., Varghese, G., and McKeown, N., “Automatictest packet generation,” in Proceedings of the 8th international confer-ence on Emerging networking experiments and technologies. ACM,2012, pp. 241–252.
[6] Mai, H., Khurshid, A., Agarwal, R., Caesar, M., Godfrey, P. B., andKing, S. T., “Debugging the Data Plane with Anteater,” in Proceedingsof the ACM SIGCOMM 2011 Conference, ser. SIGCOMM ’11. NewYork, NY, USA: ACM, 2011, pp. 290–301. [Online]. Available:http://doi.acm.org/10.1145/2018436.2018470
[7] Wundsam, A., Levin, D., Seetharaman, S., Feldmann, A. et al.,“OFRewind: Enabling Record and Replay Troubleshooting for Net-works,” in USENIX Annual Technical Conference, 2011.
[8] Handigol, N., Heller, B., Jeyakumar, V., Mazieres, D., and McKeown,N., “I know what your packet did last hop: Using packet histories totroubleshoot networks,” in Proc. USENIX NSDI, 2014.
[9] Khurshid, A., Zhou, W., Caesar, M., and Godfrey, P., “Veriflow: verify-ing network-wide invariants in real time,” ACM SIGCOMM ComputerCommunication Review, vol. 42, no. 4, pp. 467–472, 2012.
[10] Canini, M., Venzano, D., Peresini, P., Kostic, D., Rexford, J. et al., “ANICE Way to Test OpenFlow Applications,” in NSDI, vol. 12, 2012, pp.127–140.
[11] Kuzniar, M., Peresini, P., Canini, M., Venzano, D., and Kostic, D., “Asoft way for openflow switch interoperability testing,” in Proceedings ofthe 8th international conference on Emerging networking experimentsand technologies. ACM, 2012, pp. 265–276.
[12] Porras, P., Shin, S., Yegneswaran, V., Fong, M., Tyson, M., and Gu, G.,“A security enforcement kernel for openflow networks,” in Proceedingsof the first workshop on Hot topics in software defined networks. ACM,2012, pp. 121–126.
[13] Kuzniar, M., Canini, M., and Kostic, D., “OFTEN testing OpenFlownetworks,” in Software Defined Networking (EWSDN), 2012 EuropeanWorkshop on. IEEE, 2012, pp. 54–60.
[14] Mathonet, R., Van Cotthem, H., and Vanryckeghem, L., “DANTES AnExpert System for Real-Time Network Troubleshooting,” in Proceedingsof the 10th International Joint Conference on Artificial Intelligence,1987, pp. 527–530.
[15] Hitson, B. L., “Knowledge-Based Monitoring and Control: An Approachto Understanding the Behavior TCP/IP Network Protocols,” in Sym-posium proceedings on Communications architectures and protocols,vol. 18, 1988.
[16] Lewis, L., “A Case-Based Reasoning Approach to the Management ofFaults in Communications Networks,” in Twelfth Annual Joint Confer-ence of the IEEE Computer and Communications Societies, 1993.
[17] Jakobson, G. and Weissman, M., “Real-time telecommunication networkmanagement: extending event correlation with temporal constraints,”in Proceedings of the fourth international symposium on Integratednetwork management IV, 1995, pp. 290–301.
[18] Reali, G. and Monacelli, L., “Definition and performance evaluation ofa fault localization technique for an NGN IMS network,” in IEEE Trans-actions on Network and Service Management, 2009, p. 6(2):122136.
[19] Lu, J., Dousson, C., Radier, B., and Krief, F., “Towards an Auto-nomic Network Architecture for Self-healing in TelecommunicationsNetworks,” in Mechanisms for Autonomous Management of Networksand Services, vol. 6155, 2010, pp. 110–113.
[20] ——, “A Self-diagnosis Algorithm Based on Causal Graphs,” in TheSeventh International Conference on Autonomic and Autonomous Sys-tems, 2011.
[21] Charniak, E., “Bayesian networks without tears: making Bayesian net-works more accessible to the probabilistically unsophisticated,” in AIMagazine, vol. 12, 1991, pp. 50–63.
[22] Khanafer, R., “Automated diagnosis for UMTS networks using Bayesiannetwork approach,” in IEEE Transactions on Vehicular Technology,2008, p. 57:24512461.
[23] Zeng, H., Kazemian, P., Varghese, G., and McKeown, N., “A Survey onNetwork Troubleshooting,” 2014.
[24] Pelle, I., Levai, T., Nemeth, F., and Gulyas, A., “One tool to rulethem all: A modular troubleshooting framework for SDN (and other)networks,” in Proceedings of the 1st ACM SIGCOMM Symposium onSoftware Defined Networking Research, 2015.
[25] Kohler, E., Morris, R., Chen, B., Jannotti, J., and Kaashoek, M. F., “TheClick modular router,” ACM Transactions on Computer Systems (TOCS),vol. 18, no. 3, pp. 263–297, 2000.
[26] Levai, T., Pelle, I., Nemeth, F., and Gulyas, A., “Epoxide: A modularprototype for sdn troubleshooting,” in Proceedings of the 2015 ACMConference on Special Interest Group on Data Communication, 2015,pp. 359–360.
[27] Marchetto, G. and Sisto, R. (editors), “Deliverable D4.3: Updated con-cept and evaluation results for SP-DevOps,” in eprint arXiv:1610.02387,2016.
Istvan Pelle received M.Sc. degree in ComputerEngineering at Budapest University of Technologyand Economics, Budapest, Hungary in 2015. Cur-rently he is pursuing the Ph.D. degree with BudapestUniversity of Technology and Economics. His re-search interests include software defined networksand network troubleshooting.
Felician Nemeth received his M.Sc. degree in Com-puter Science from BME in 2000. He is a researchfellow at the Department of Telecommunicationsand Media Informatics of the same university. Hewas a member of national research projects and theEFIPSANS, OPENLAB, UNIFY FP7 EU projects.His current research interests focus on SoftwareDefined Networking, congestion control methodsand autonomic computing.
Andras Gulyas received M.Sc. and Ph.D. degree inInformatics at Budapest University of Technologyand Economics, Budapest, Hungary in 2002 and2008 respectively. Currently he is a research fellowat the Department of Telecommunications and Me-dia Informatics. His research interests are complexand self-organizing networks and software definednetworking.

View-Invariant Person Identification by OrthogonalView Gait Signature and Fusion of Classifiers
INFOCOMMUNICATIONS JOURNAL
SEPTEMBER 2017 • VOLUME IX • NUMBER 3 9
View-Invariant Person Identification by OrthogonalView Gait Signature and Fusion of Classifiers
Sagar Arun More, Member, IEEE, and Pramod Jagan Deore
JOURNAL OF LATEX CLASS FILES, VOL. , NO. , JANUARY 1
View-Invariant Person Identification by OrthogonalView Gait Signature and Fusion of Classifiers
Sagar Arun More, Member, IEEE, and Pramod Jagan Deore
Abstract—In this paper, we proposed the use of three orthogo-nal views of gait signature for view-invariant person identificationsystem. We also experimented the fusions of classifiers in orderto improve the recognition performance. Two classifiers usedcorresponding to two LDA spaces. The first classifier usedfor angle classification followed by second classifier for personidentification. The proposed mechanism of selective kNN (s-kNN)has boosted the recognition performance and found very effective.We got 97.07% maximum rank-1 angle classification accuracyand 93% maximum rank-1 person identification accuracy.
Index Terms—Gait Bio-metrics, View-Invariant, Linear Dis-criminant Analysis.
I. INTRODUCTION
B IO-METRICS is considered as one of the successfulapplications of pattern recognition and has been widely
used in several domains, such as authentication in highlyrestricted areas, attendance record in office premises, citizen-ship identification-verification and in the field of forensics.These bio-metric systems are mostly based on modalities likefingerprint, iris and face. However, commonly used bio-metricrecognition systems usually operates in constrained acquisitionscenarios and under rigid protocols. This scenario motivatesresearchers to explore the development of non-cooperativesystems [1]. In the bio-metrics application which requiresdistant data (sample) capture, it becomes almost impossible toacquire the samples, e.g. fingerprints or iris. Besides popularbio-metric modalities like fingerprint, face and iris; activitybased biometrics [2] can add the value to the identificationprocess. Especially, in the case of bio-metric applicationswhere far distant data capture process is involved. In suchscenario, gait is the useful bio-metric trait. The gait recognitionis based on the activity of person, namely walking. Thegait activity is the composition of motion trajectories andcoordinated movements of the various body parts and mostlysuffer from the co-variate conditions.
There are several advantages of the gait based personidentification over the conventional bio-metrics such as:
1) Most suitable for non-cooperative and unconstrainedbio-metric process.
2) Walking normally happens with subject without de-manding from it and hence it’s a natural sample.
Sagar Arun More is with the Department of Electronics and Telecommu-nication Engineering, R. C. Patel Institute of Technology, Shirpur, 425405,INDIA e-mail: ([email protected]).
Pramod Jagan Deore is with the Department of Electronics and Telecom-munication Engineering, R. C. Patel Institute of Technology, Shirpur, 425405,INDIA e-mail: ([email protected]).
Manuscript received; revised; accepted;.
3) Unlike face and iris, gait can be captured from multi-ple angle / views, which makes data acquisition moreinformative.
4) Even works well with low quality video data.5) No fine details are required as in face, iris or fingerprint
based recognition system.Though, the gait recognition has been researched for long
time, there are challenges such as:1) In some situations like restaurants, shopping malls walk-
ing doesn’t always happen.2) In crowded places, walking can be done in restrictive
manner, leading to a change in gait cycle and affectingbio-metric process negatively.
3) Particular place or situation may have predictable activ-ity to be happened more frequently and hence can beexploited e.g. in college / department canteen, shakinghands and paying bill after taking out wallet can be moredominant activities.
4) Gait sample may not give accurate shape profiles withloose clothes.
5) Gait can be affected by various co-variate factors likespeed, cloths, surface of walking, illness, drunkenness,pregnancy.
6) Viewing angle effect plays vital role in multi viewsystem.
In the unconstrained environment and distant data capturebased bio-metric system, fingerprint, iris and face recognitioncould not be the right choice. Comparatively gait, comprisedof motion trajectories of various body parts, have a poten-tial to get captured properly from relatively far distance. Itdoesn’t need systematic data capture process and only camerainstallation is required, where subjects are not necessarily beinformed, which makes the identification process protocol free.
II. LITERATURE OVERVIEW
Gait recognition have attracted researchers in recent yearsbecause of it’s various advantages as discussed earlier. Thegait recognition methods can be broadly categorized as modelfree and model based methods. In model free methods, thefeatures for recognition are directly extracted from the spatialdomain and in model based methods the features are extractedby modelling the human body by some mathematical means.
a) Model Free Approach: This approach directly extractfeatures from the spatial domain like [3], [4], which useProcrustes shape analysis. After extracting silhouette, authorsapply Procrustes shape analysis to obtain mean shape asgait signature. Whereas in [5], gait energy image obtained
View-Invariant Person Identification by OrthogonalView Gait Signature and Fusion of Classifiers
SEPTEMBER 2017 • VOLUME IX • NUMBER 310
INFOCOMMUNICATIONS JOURNAL
JOURNAL OF LATEX CLASS FILES, VOL. , NO. , JANUARY 2
from the sequence of gait images used for recognition as itpreserves the temporal information. In [6], author use fusionof multiple gait cycles for recognition. The gait cycle isestimated by calculating auto correlation. From each gaitcycle, they extract gait energy image and motion silhouetteimage for classification and recognition. The wavelet analysisis also used in gait recognition [7], [8]. In [7], author utilizethe property of radon transform and Haar wavelet transformto extract horizontal and vertical features. Another waveletbased approach [8] use time-frequency analysis of extractedgait cycle. After wavelet decomposition they calculate mean,standard deviation, skewness and kurtosis of each sub-band. Asimple city block distance measure is used for classification.Methods based on image geometry transformations have alsobeen proposed [9], which is independent of view angle. In[10], author use height and stride length as soft bio-metrics ina probabilistic framework for gait recognition.
In a recent GEI based method [11], horizontal motionestimated by computing Shanon entropy of each row of GEI.Further, group Lasso learning algorithm is used to segmentthe motion based vector into blocks of similar motion values.The body part, which has highest average motion vector valueis selected as a feature vector.
b) Model Based Approach: In this approach, the variousfeatures can be extracted by modelling human body. An initialmodel based attempt for gait-based recognition in a spatio-temporal (XYT) volume is done by Niyogi and Adelson [12].A 5-stick model is used to generate gait pattern in XYT whichis further used for classification. In [4], Procrustes analysisis used for static feature extraction and the dynamic featuresextracted by modelling the human body by truncated cone forvarious body parts and sphere for head. In [13], bulk motion,shape and articulated motion estimation was done by gaitmotion model adaptation. In [14], authors proposed a fusionbased method, in which they divide silhouette into 7 parts andfit ellipse in those regions. They extract various parametersof ellipse. All these parameters of 7 regions constitute a novelfeature vector. Whereas, [15] use fusion of several features forrecognition like area, gravity center and orientation of eachbody part.
Recent development in model based gait recognition em-phasizes modelling the multi-view gait sequences by usingview normalization techniques. Worapan et al [16]–[19] useView Transformation Model (VTM) to normalize probe andgallery view in the same direction. The method presented in[16] is SVD based VTM approach and [17] is SVR based.The problem like data redundancy in their earlier methods isimproved in [18]. Whereas, [19] uses MLP to construct VTMmodel for multi-view and cross-view gait recognition.
c) View-Invariant Approach: The view-invariant gaitidentification is relatively new research area. The most de-sirable property of this approach is to identify test subjectwalking at any arbitrary view angle. It uses either any one oftwo or both approaches as discussed earlier. i. e. model freeor model based. In [20], a viewpoint independent method isproposed which requires single camera without calibration andprior knowledge of subject / person pose. The test subject isidentified by projecting the limb motion of subject which is
walking at arbitrary view angle onto the lateral / side-viewplane. First, they do marker less joint estimation followedby reconstruction method for viewpoint rectification. In [21],author proposes a joint subspace learning method for view-invariant gait recognition. First, radon transform based energyimages of sequences extracted and further they perform canon-ical correlation analysis to get representation coefficients,which they use as view-invariant features. Next, they obtainprototypes of various views by using PCA. The samples ofdifferent views represented as linear combination of theseprototypes and then extract the coefficients which further usedfor recognition. Whereas in [22], author extracts a gait textureimage which preserves gait information of a particular viewangle. Further, they apply transform invariant low rank texturesto project gait information of arbitrary view on to sagittalplane. In a recent paper [23], gait flow image extracted byLukas-Kanade method as dynamic feature, head and shouldermean shape by Procrustes shape analysis as static feature.In identification phase, they compute view angle or walkingdirection of test subject along with the static and dynamicfeatures. A simple Euclidean distance classifier is used to findsimilarity measure between test and gallery images.
In [24], complete canonical correlation analysis is used toinvestigate correlation between two gait features consideringnormal walking sequences. They randomly select a sample fortraining and testing on different view angle. In [25], the authorsextract width of 4 different sub regions of silhouette whichthen combined to construct gait signature. They considered allview angle and 3 normal walking sequences for training andeach view angle taking one view at a time and 3 normal walk-ing sequences for testing. A robust view invariant approachis proposed by [26], in which view angle is classified usingentropy of the limb region of GEI and person identification isdone by using multi scale shape analysis.
III. OVERVIEW OF THE PROPOSED METHOD
Gkalelis et. al. decomposes motion in activity as a com-bination of basic movement patterns, the so-called dynemes,calculated from fuzzy C-means (FCM) clustering methodas described in [27]. The number of dynemes are decidedfrom the leave-one-out cross-validation procedure, which isan extension of the method described in [28]. Their algorithmcombines fuzzy vector quantization (FVQ) of [29] usingposture vectors (column/row wise one-dimensional vector ofbinary silhouettes) and Linear Discriminant Analysis (LDA) todiscover the most discriminating dynemes as well as representand discriminate the different human movements in terms ofthese dynemes. This method was extended in [30], [31] and[32] for the multi-view videos. The training and testing videoswere captured by multi-view cameras and dynemes werecalculated from all the videos irrespective of their view anglesto make the motion representation and their classification viewindependent.
Since, FCM or CM based clustering gives vector quanti-zation of the posture vector description, it is possible thatdiscriminative information may loss. This can be overcomeusing sparse coding of posture vectors as done in [33]. Hence,
JOURNAL OF LATEX CLASS FILES, VOL. , NO. , JANUARY 3
in this experiment, we use sparse coding of posture vector.The objective criterion and optimization of sparse coding wereformulated as given in [34] and [35]. The results with meanand max pooling of feature representation from the sparsecodebook were studied and found that, mean pooling basedrepresentation is most suitable. This approach compared withthe large margin nearest neighbor (LMNN) [36] and foundsuperior to it.
In this work, we use CASIA multi-view gait databases B[40] which consists of 124 subjects. Each subject is depictedin 10 instances (video sequences) with various co-variates like;normal/slow walking (nm−01 to nm−06), with bag (bg−01,bg−02), with coat (cl−01, cl−02). The instances are capturedat 11 different viewing angles (0o, ..., 180o). Thus, the databaseconsists of 124 × 10 × 11 = 13, 640 gait instances (videosequences). In this experiment, we use 6 instances i.e. normaland slow walking sequences.
We have experimented gait recognition using LDA withdifferent number of training (K) and testing (S) sample’s set(instances/sequences). The performance in form of recognitionaccuracy is shown in the Table I. Figure 1 shows it’s graphicalplot. It can be inferred that the reduction in the number oftraining samples generates over-fitting issue in the classifierand hence degrades the performance. Another hypothesisgenerated here by experimentation is that, performance withparticular angle gait sequence is dependent on whether thatangle samples are included in the training or not. In uncon-strained environment, where subject is expected to walk in anydirection yielding gait sequence in any angle, the issue of in-clusion of particular angle becomes vital with two constraints.First, having the the number of all angle or regular discreteangles in the range of 0 to 180 degree in training can loadthe system resources like memory and computational power.Secondly, it can be unmanageable to capture gait sequencesfrom subjects in all possible angle views. The performanceacross the possible angles with different set angles in trainingis shown in the Table II and Figure 2 shows it’s plot. Itis observed that, non-inclusion of particular angle-view gaitsequences in training gives abrupt degradation by more than90% fall in rank-1 accuracy. More recently there are someattempts as reported in [37], [38], [39] and [2], where classifieris trained with the set of instances which includes all the viewangle sequences from each subject.
IV. PROPOSED METHODOLOGY
The main complexity of the activity based recognitionlies in three components, namely, 1) Dynemes Calculation,2) Feature Extraction and 3) Classification. Our proposedapproach use three orthogonal views in multi-view captureand sparse coding of posture vectors. The dynemes wereused to calculate its histogram using distance measure and itsfuzzification as described in [2]. The training features can beobtained by projecting training instances on the LDA subspaceto maximize the discrimination in inter-class samples andminimize the intra-class variance. However, in doing so, kNNtraining instances with different gait-angles or view anglescan give the enough variation in their features to overlap
1 1.5 2 2.5 3 3.5 4
90
95
Number of Training Samples (K)
Ran
k-1
Acc
urac
yin
%
kNN with CentroidkNN without Centroid
Fig. 1. Plot of Performance with different values of Training Samples -K(CASIA B)
with space of other classes. To overcome this problem, weproposed to have two kNN classifiers corresponding to thetwo LDA subspaces in series. The first LDA subspace is tohave projection from gait samples for discriminating them indifferent view-angle classes irrespective of the subject identity.The view angle is obtained from the first LDA subspace usingkNN classifier trained by same training samples as used indynemes calculation. The second LDA subspace, obtainedwith subjects classes irrespective of their view-angles (gait-angles), is then used to project gait samples for testing andtraining. The histogram features extraction and two LDAsubspace construction are shown in Figure 3. While using kNNclassifier on the test samples, test samples are compared onlywith the samples corresponding to the view angle obtainedfrom angle based classifier. Thus, the kNN classifier selectsthe kNN samples from training instances based on the angleof the test gait sequence, as determined from the first classifier.This method is different from the framework proposed in [2] inthe sense that, former employs the fusion of two classifiers inparallel, while later one uses two classifiers in series. However,the upper bound of performance in our approach is limited bythe performance given by first classifier, which outputs theview-angle class and hence, it becomes critical component inthe recognition system. This classifier is expected to give morethan 95% performance in typical case, additionally its outputdecision can be validated by additional strategy. At present,this validation strategy is kept out of scope of this paper asangle identification classifier used here is certain to providerecognition accuracy of more than 97%. The system blockdiagram of our approach based on two classifiers in series isshown in Figure 4. The main contributions of this approachare,
1) This is most suitable for single-view camera with un-constrained gait sequence with respect to direction ofwalk.
2) The samples considered in person classifier are corre-sponding to the angle of gait sequence classified byangle classifier in which person is walking, as opposedto the all angle view inclusion in the person classifierbefore fusing the results as in case of [2].

View-Invariant Person Identification by OrthogonalView Gait Signature and Fusion of Classifiers
INFOCOMMUNICATIONS JOURNAL
SEPTEMBER 2017 • VOLUME IX • NUMBER 3 11
JOURNAL OF LATEX CLASS FILES, VOL. , NO. , JANUARY 2
from the sequence of gait images used for recognition as itpreserves the temporal information. In [6], author use fusionof multiple gait cycles for recognition. The gait cycle isestimated by calculating auto correlation. From each gaitcycle, they extract gait energy image and motion silhouetteimage for classification and recognition. The wavelet analysisis also used in gait recognition [7], [8]. In [7], author utilizethe property of radon transform and Haar wavelet transformto extract horizontal and vertical features. Another waveletbased approach [8] use time-frequency analysis of extractedgait cycle. After wavelet decomposition they calculate mean,standard deviation, skewness and kurtosis of each sub-band. Asimple city block distance measure is used for classification.Methods based on image geometry transformations have alsobeen proposed [9], which is independent of view angle. In[10], author use height and stride length as soft bio-metrics ina probabilistic framework for gait recognition.
In a recent GEI based method [11], horizontal motionestimated by computing Shanon entropy of each row of GEI.Further, group Lasso learning algorithm is used to segmentthe motion based vector into blocks of similar motion values.The body part, which has highest average motion vector valueis selected as a feature vector.
b) Model Based Approach: In this approach, the variousfeatures can be extracted by modelling human body. An initialmodel based attempt for gait-based recognition in a spatio-temporal (XYT) volume is done by Niyogi and Adelson [12].A 5-stick model is used to generate gait pattern in XYT whichis further used for classification. In [4], Procrustes analysisis used for static feature extraction and the dynamic featuresextracted by modelling the human body by truncated cone forvarious body parts and sphere for head. In [13], bulk motion,shape and articulated motion estimation was done by gaitmotion model adaptation. In [14], authors proposed a fusionbased method, in which they divide silhouette into 7 parts andfit ellipse in those regions. They extract various parametersof ellipse. All these parameters of 7 regions constitute a novelfeature vector. Whereas, [15] use fusion of several features forrecognition like area, gravity center and orientation of eachbody part.
Recent development in model based gait recognition em-phasizes modelling the multi-view gait sequences by usingview normalization techniques. Worapan et al [16]–[19] useView Transformation Model (VTM) to normalize probe andgallery view in the same direction. The method presented in[16] is SVD based VTM approach and [17] is SVR based.The problem like data redundancy in their earlier methods isimproved in [18]. Whereas, [19] uses MLP to construct VTMmodel for multi-view and cross-view gait recognition.
c) View-Invariant Approach: The view-invariant gaitidentification is relatively new research area. The most de-sirable property of this approach is to identify test subjectwalking at any arbitrary view angle. It uses either any one oftwo or both approaches as discussed earlier. i. e. model freeor model based. In [20], a viewpoint independent method isproposed which requires single camera without calibration andprior knowledge of subject / person pose. The test subject isidentified by projecting the limb motion of subject which is
walking at arbitrary view angle onto the lateral / side-viewplane. First, they do marker less joint estimation followedby reconstruction method for viewpoint rectification. In [21],author proposes a joint subspace learning method for view-invariant gait recognition. First, radon transform based energyimages of sequences extracted and further they perform canon-ical correlation analysis to get representation coefficients,which they use as view-invariant features. Next, they obtainprototypes of various views by using PCA. The samples ofdifferent views represented as linear combination of theseprototypes and then extract the coefficients which further usedfor recognition. Whereas in [22], author extracts a gait textureimage which preserves gait information of a particular viewangle. Further, they apply transform invariant low rank texturesto project gait information of arbitrary view on to sagittalplane. In a recent paper [23], gait flow image extracted byLukas-Kanade method as dynamic feature, head and shouldermean shape by Procrustes shape analysis as static feature.In identification phase, they compute view angle or walkingdirection of test subject along with the static and dynamicfeatures. A simple Euclidean distance classifier is used to findsimilarity measure between test and gallery images.
In [24], complete canonical correlation analysis is used toinvestigate correlation between two gait features consideringnormal walking sequences. They randomly select a sample fortraining and testing on different view angle. In [25], the authorsextract width of 4 different sub regions of silhouette whichthen combined to construct gait signature. They considered allview angle and 3 normal walking sequences for training andeach view angle taking one view at a time and 3 normal walk-ing sequences for testing. A robust view invariant approachis proposed by [26], in which view angle is classified usingentropy of the limb region of GEI and person identification isdone by using multi scale shape analysis.
III. OVERVIEW OF THE PROPOSED METHOD
Gkalelis et. al. decomposes motion in activity as a com-bination of basic movement patterns, the so-called dynemes,calculated from fuzzy C-means (FCM) clustering methodas described in [27]. The number of dynemes are decidedfrom the leave-one-out cross-validation procedure, which isan extension of the method described in [28]. Their algorithmcombines fuzzy vector quantization (FVQ) of [29] usingposture vectors (column/row wise one-dimensional vector ofbinary silhouettes) and Linear Discriminant Analysis (LDA) todiscover the most discriminating dynemes as well as representand discriminate the different human movements in terms ofthese dynemes. This method was extended in [30], [31] and[32] for the multi-view videos. The training and testing videoswere captured by multi-view cameras and dynemes werecalculated from all the videos irrespective of their view anglesto make the motion representation and their classification viewindependent.
Since, FCM or CM based clustering gives vector quanti-zation of the posture vector description, it is possible thatdiscriminative information may loss. This can be overcomeusing sparse coding of posture vectors as done in [33]. Hence,
JOURNAL OF LATEX CLASS FILES, VOL. , NO. , JANUARY 3
in this experiment, we use sparse coding of posture vector.The objective criterion and optimization of sparse coding wereformulated as given in [34] and [35]. The results with meanand max pooling of feature representation from the sparsecodebook were studied and found that, mean pooling basedrepresentation is most suitable. This approach compared withthe large margin nearest neighbor (LMNN) [36] and foundsuperior to it.
In this work, we use CASIA multi-view gait databases B[40] which consists of 124 subjects. Each subject is depictedin 10 instances (video sequences) with various co-variates like;normal/slow walking (nm−01 to nm−06), with bag (bg−01,bg−02), with coat (cl−01, cl−02). The instances are capturedat 11 different viewing angles (0o, ..., 180o). Thus, the databaseconsists of 124 × 10 × 11 = 13, 640 gait instances (videosequences). In this experiment, we use 6 instances i.e. normaland slow walking sequences.
We have experimented gait recognition using LDA withdifferent number of training (K) and testing (S) sample’s set(instances/sequences). The performance in form of recognitionaccuracy is shown in the Table I. Figure 1 shows it’s graphicalplot. It can be inferred that the reduction in the number oftraining samples generates over-fitting issue in the classifierand hence degrades the performance. Another hypothesisgenerated here by experimentation is that, performance withparticular angle gait sequence is dependent on whether thatangle samples are included in the training or not. In uncon-strained environment, where subject is expected to walk in anydirection yielding gait sequence in any angle, the issue of in-clusion of particular angle becomes vital with two constraints.First, having the the number of all angle or regular discreteangles in the range of 0 to 180 degree in training can loadthe system resources like memory and computational power.Secondly, it can be unmanageable to capture gait sequencesfrom subjects in all possible angle views. The performanceacross the possible angles with different set angles in trainingis shown in the Table II and Figure 2 shows it’s plot. Itis observed that, non-inclusion of particular angle-view gaitsequences in training gives abrupt degradation by more than90% fall in rank-1 accuracy. More recently there are someattempts as reported in [37], [38], [39] and [2], where classifieris trained with the set of instances which includes all the viewangle sequences from each subject.
IV. PROPOSED METHODOLOGY
The main complexity of the activity based recognitionlies in three components, namely, 1) Dynemes Calculation,2) Feature Extraction and 3) Classification. Our proposedapproach use three orthogonal views in multi-view captureand sparse coding of posture vectors. The dynemes wereused to calculate its histogram using distance measure and itsfuzzification as described in [2]. The training features can beobtained by projecting training instances on the LDA subspaceto maximize the discrimination in inter-class samples andminimize the intra-class variance. However, in doing so, kNNtraining instances with different gait-angles or view anglescan give the enough variation in their features to overlap
1 1.5 2 2.5 3 3.5 4
90
95
Number of Training Samples (K)
Ran
k-1
Acc
urac
yin
%
kNN with CentroidkNN without Centroid
Fig. 1. Plot of Performance with different values of Training Samples -K(CASIA B)
with space of other classes. To overcome this problem, weproposed to have two kNN classifiers corresponding to thetwo LDA subspaces in series. The first LDA subspace is tohave projection from gait samples for discriminating them indifferent view-angle classes irrespective of the subject identity.The view angle is obtained from the first LDA subspace usingkNN classifier trained by same training samples as used indynemes calculation. The second LDA subspace, obtainedwith subjects classes irrespective of their view-angles (gait-angles), is then used to project gait samples for testing andtraining. The histogram features extraction and two LDAsubspace construction are shown in Figure 3. While using kNNclassifier on the test samples, test samples are compared onlywith the samples corresponding to the view angle obtainedfrom angle based classifier. Thus, the kNN classifier selectsthe kNN samples from training instances based on the angleof the test gait sequence, as determined from the first classifier.This method is different from the framework proposed in [2] inthe sense that, former employs the fusion of two classifiers inparallel, while later one uses two classifiers in series. However,the upper bound of performance in our approach is limited bythe performance given by first classifier, which outputs theview-angle class and hence, it becomes critical component inthe recognition system. This classifier is expected to give morethan 95% performance in typical case, additionally its outputdecision can be validated by additional strategy. At present,this validation strategy is kept out of scope of this paper asangle identification classifier used here is certain to providerecognition accuracy of more than 97%. The system blockdiagram of our approach based on two classifiers in series isshown in Figure 4. The main contributions of this approachare,
1) This is most suitable for single-view camera with un-constrained gait sequence with respect to direction ofwalk.
2) The samples considered in person classifier are corre-sponding to the angle of gait sequence classified byangle classifier in which person is walking, as opposedto the all angle view inclusion in the person classifierbefore fusing the results as in case of [2].

View-Invariant Person Identification by OrthogonalView Gait Signature and Fusion of Classifiers
SEPTEMBER 2017 • VOLUME IX • NUMBER 312
INFOCOMMUNICATIONS JOURNAL
JOURNAL OF LATEX CLASS FILES, VOL. , NO. , JANUARY 4
Training Samples Testing Samples kNN with Centroid kNN without CentroidK S Rank-1 Accuracy(%) Avg. Accuracy(%) Rank-1 Accuracy(%) Avg. Accuracy(%)
[1,3,5,6] [2,4] 98.59 97.65 98.59 97.65[1,2,3,4] [5,6] 96.72 97.65 96.72 97.65[1,2,3] [5,6] 94.85 96.37 95.32 96.49[2,3,4] [5,6] 96.72 96.37 96.26 96.49[1,2,4] [5,6] 96.72 96.37 97.19 96.49[1,3,4] [5,6] 97.19 96.37 97.19 96.49[1,2] [5,6] 94.39 96.37 94.39 96.49[1,3] [5,6] 94.39 96.37 95.32 96.49[1,4] [5,6] 97.19 95.32 97.19 95.47[2,3] [5,6] 94.85 95.32 94.39 95.37[2,4] [5,6] 95.79 95.32 95.79 95.47[3,4] [5,6] 95.32 95.32 95.79 95.47[1] [5,6] 87.85 90.18 87.85 90.18[2] [5,6] 90.18 90.18 90.18 90.18[3] [5,6] 88.78 90.18 88.78 90.18[4] [5,6] 93.92 90.18 93.92 90.18
TABLE IPERFORMANCE WITH DIFFERENT TRAINING / TESTING SAMPLES SET OF CASIA B
Training % Testing Accuracy with S=[1, 2, 3, 4, 5, 6] with view angle as follows Testing withwith Non-Ortho.
K=[1, View with3, 5, 6] S=[1to6]
View Angle 00 180 360 540 720 900 1080 1260 1440 1620 1800 Avg. Accu.(%) Avg. Accu.(%)A=0 97.44 6.45 4.43 2.28 1.47 0.80 0.80 1.74 1.74 1.61 8.06 11.32 2.2B=90 1.61 0.80 1.07 5.10 36.29 94.35 27.82 7.79 2.41 0.80 1.34 16.37 10.5
C=180 5.64 2.41 1.47 0.80 1.74 1.61 1.61 1.07 0.80 5.10 97.44 10.71 1.74A+B+C 51.34 3.36 1.61 2.95 11.02 38.02 6.58 3.36 1.74 3.2 68.14 17.39 4.23
Min(A,B,C) 96.37 6.18 3.49 2.95 32.52 92.87 27.28 3.89 0.94 1.34 83.46 31.94 9.82
TABLE IIPERFORMANCE WITH ORTHOGONAL VIEW ANGLES 00 , 900 & 1800 TRAINING (CASIA B)
0 20 40 60 80 100 120 140 160 180
0
20
40
60
80
100
View Angle
Rec
ogni
tion
Acc
urac
yin
%
Frontal View TrainingLateral View TrainingBack View TrainingFusion Sum ScoreFusion Min Score
Fig. 2. Graph on Performance with Orthogonal View Angles 00, 900 & 1800 Training (CASIA B)
JOURNAL OF LATEX CLASS FILES, VOL. , NO. , JANUARY 5
Fig. 3. Histogram Features Extraction and Two LDA Subspaces
3) The proposed mechanism of selective kNN (s-kNN)classifier improves the person identification result.
4) Significant results for non-orthogonal view angles.The system with s-kNN i.e. rank-N s-kNN classifier is
shown in Figure 5.
Fig. 4. S-kNN Classifier
V. EXPERIMENTAL RESULTS AND DISCUSSION
Experiments performed considering normal and fast walk-ing instances. Initially we performed experiment consider-ing orthogonal angles 00, 900 & 1800 in training instances{1, 3, 5, 6} excluding instances {2, 4}. Results in terms oftesting accuracy considering testing instances {1, 2, 3, 4, 5, 6}is shwon in Table II. It is found that, the recognition accu-racy infers when particular angle instance is not included intraining. The average recognition accuracy for non-orthogonalview angles is also shown in Table II.
Experimentally it is found that, the orthogonal views ofangles 180, 1080 and 1620 are useful for training efficientlyas reported in [37]. As the dyneme representation is resilient
Fig. 5. Rank-N S-kNN Classifier
Fig. 6. Dynemes Poses
to noise, the set of 340 & 500 dynemes are calculated fromtraining instances, {1, 3, 5, 6} of 124 subjects with orthogonalview angles 18o, 108o and 162o excluding instances {2, 4}.Figure 6 shows 500 dynemes for instances {1, 3, 5, 6}. Theoverall and across angle recognition accuracies are presentedin Table III. The experiments were performed with LDA usingkNN and s-kNN classifiers. Significant results obtained fornon orthogonal view angles considering all instances by ourmethod. Where, pID is person identification and VA is viewangle accuracy.
The further improvement in the performance of system isachieved by rank-N s-kNN classifier. The results with differenttraining set are shown in Table IV. It can be observed that, therank-1 angle classification accuracy and pID rank-1 accuracyimproves significantly with increased number of instances intraining.
A. Comparative Work
In [37], the strategy was proposed to determine the leastnumber of viewing angles from available maximum numberof views to be used in training so that recognition withdifferent gait angle sequences can be maximized. It is theoptimization problem and training set with views from 18o,108o and 162o is experimentally found to be the best solution.We implemented our approach with these training set andcompared with results obtained with their approach as reported
JOURNAL OF LATEX CLASS FILES, VOL. , NO. , JANUARY 4
Training Samples Testing Samples kNN with Centroid kNN without CentroidK S Rank-1 Accuracy(%) Avg. Accuracy(%) Rank-1 Accuracy(%) Avg. Accuracy(%)
[1,3,5,6] [2,4] 98.59 97.65 98.59 97.65[1,2,3,4] [5,6] 96.72 97.65 96.72 97.65[1,2,3] [5,6] 94.85 96.37 95.32 96.49[2,3,4] [5,6] 96.72 96.37 96.26 96.49[1,2,4] [5,6] 96.72 96.37 97.19 96.49[1,3,4] [5,6] 97.19 96.37 97.19 96.49[1,2] [5,6] 94.39 96.37 94.39 96.49[1,3] [5,6] 94.39 96.37 95.32 96.49[1,4] [5,6] 97.19 95.32 97.19 95.47[2,3] [5,6] 94.85 95.32 94.39 95.37[2,4] [5,6] 95.79 95.32 95.79 95.47[3,4] [5,6] 95.32 95.32 95.79 95.47[1] [5,6] 87.85 90.18 87.85 90.18[2] [5,6] 90.18 90.18 90.18 90.18[3] [5,6] 88.78 90.18 88.78 90.18[4] [5,6] 93.92 90.18 93.92 90.18
TABLE IPERFORMANCE WITH DIFFERENT TRAINING / TESTING SAMPLES SET OF CASIA B
Training % Testing Accuracy with S=[1, 2, 3, 4, 5, 6] with view angle as follows Testing withwith Non-Ortho.
K=[1, View with3, 5, 6] S=[1to6]
View Angle 00 180 360 540 720 900 1080 1260 1440 1620 1800 Avg. Accu.(%) Avg. Accu.(%)A=0 97.44 6.45 4.43 2.28 1.47 0.80 0.80 1.74 1.74 1.61 8.06 11.32 2.2B=90 1.61 0.80 1.07 5.10 36.29 94.35 27.82 7.79 2.41 0.80 1.34 16.37 10.5
C=180 5.64 2.41 1.47 0.80 1.74 1.61 1.61 1.07 0.80 5.10 97.44 10.71 1.74A+B+C 51.34 3.36 1.61 2.95 11.02 38.02 6.58 3.36 1.74 3.2 68.14 17.39 4.23
Min(A,B,C) 96.37 6.18 3.49 2.95 32.52 92.87 27.28 3.89 0.94 1.34 83.46 31.94 9.82
TABLE IIPERFORMANCE WITH ORTHOGONAL VIEW ANGLES 00 , 900 & 1800 TRAINING (CASIA B)
0 20 40 60 80 100 120 140 160 180
0
20
40
60
80
100
View Angle
Rec
ogni
tion
Acc
urac
yin
%
Frontal View TrainingLateral View TrainingBack View TrainingFusion Sum ScoreFusion Min Score
Fig. 2. Graph on Performance with Orthogonal View Angles 00, 900 & 1800 Training (CASIA B)

View-Invariant Person Identification by OrthogonalView Gait Signature and Fusion of Classifiers
INFOCOMMUNICATIONS JOURNAL
SEPTEMBER 2017 • VOLUME IX • NUMBER 3 13
JOURNAL OF LATEX CLASS FILES, VOL. , NO. , JANUARY 5
Fig. 3. Histogram Features Extraction and Two LDA Subspaces
3) The proposed mechanism of selective kNN (s-kNN)classifier improves the person identification result.
4) Significant results for non-orthogonal view angles.The system with s-kNN i.e. rank-N s-kNN classifier is
shown in Figure 5.
Fig. 4. S-kNN Classifier
V. EXPERIMENTAL RESULTS AND DISCUSSION
Experiments performed considering normal and fast walk-ing instances. Initially we performed experiment consider-ing orthogonal angles 00, 900 & 1800 in training instances{1, 3, 5, 6} excluding instances {2, 4}. Results in terms oftesting accuracy considering testing instances {1, 2, 3, 4, 5, 6}is shwon in Table II. It is found that, the recognition accu-racy infers when particular angle instance is not included intraining. The average recognition accuracy for non-orthogonalview angles is also shown in Table II.
Experimentally it is found that, the orthogonal views ofangles 180, 1080 and 1620 are useful for training efficientlyas reported in [37]. As the dyneme representation is resilient
Fig. 5. Rank-N S-kNN Classifier
Fig. 6. Dynemes Poses
to noise, the set of 340 & 500 dynemes are calculated fromtraining instances, {1, 3, 5, 6} of 124 subjects with orthogonalview angles 18o, 108o and 162o excluding instances {2, 4}.Figure 6 shows 500 dynemes for instances {1, 3, 5, 6}. Theoverall and across angle recognition accuracies are presentedin Table III. The experiments were performed with LDA usingkNN and s-kNN classifiers. Significant results obtained fornon orthogonal view angles considering all instances by ourmethod. Where, pID is person identification and VA is viewangle accuracy.
The further improvement in the performance of system isachieved by rank-N s-kNN classifier. The results with differenttraining set are shown in Table IV. It can be observed that, therank-1 angle classification accuracy and pID rank-1 accuracyimproves significantly with increased number of instances intraining.
A. Comparative Work
In [37], the strategy was proposed to determine the leastnumber of viewing angles from available maximum numberof views to be used in training so that recognition withdifferent gait angle sequences can be maximized. It is theoptimization problem and training set with views from 18o,108o and 162o is experimentally found to be the best solution.We implemented our approach with these training set andcompared with results obtained with their approach as reported
JOURNAL OF LATEX CLASS FILES, VOL. , NO. , JANUARY 4
Training Samples Testing Samples kNN with Centroid kNN without CentroidK S Rank-1 Accuracy(%) Avg. Accuracy(%) Rank-1 Accuracy(%) Avg. Accuracy(%)
[1,3,5,6] [2,4] 98.59 97.65 98.59 97.65[1,2,3,4] [5,6] 96.72 97.65 96.72 97.65[1,2,3] [5,6] 94.85 96.37 95.32 96.49[2,3,4] [5,6] 96.72 96.37 96.26 96.49[1,2,4] [5,6] 96.72 96.37 97.19 96.49[1,3,4] [5,6] 97.19 96.37 97.19 96.49[1,2] [5,6] 94.39 96.37 94.39 96.49[1,3] [5,6] 94.39 96.37 95.32 96.49[1,4] [5,6] 97.19 95.32 97.19 95.47[2,3] [5,6] 94.85 95.32 94.39 95.37[2,4] [5,6] 95.79 95.32 95.79 95.47[3,4] [5,6] 95.32 95.32 95.79 95.47[1] [5,6] 87.85 90.18 87.85 90.18[2] [5,6] 90.18 90.18 90.18 90.18[3] [5,6] 88.78 90.18 88.78 90.18[4] [5,6] 93.92 90.18 93.92 90.18
TABLE IPERFORMANCE WITH DIFFERENT TRAINING / TESTING SAMPLES SET OF CASIA B
Training % Testing Accuracy with S=[1, 2, 3, 4, 5, 6] with view angle as follows Testing withwith Non-Ortho.
K=[1, View with3, 5, 6] S=[1to6]
View Angle 00 180 360 540 720 900 1080 1260 1440 1620 1800 Avg. Accu.(%) Avg. Accu.(%)A=0 97.44 6.45 4.43 2.28 1.47 0.80 0.80 1.74 1.74 1.61 8.06 11.32 2.2B=90 1.61 0.80 1.07 5.10 36.29 94.35 27.82 7.79 2.41 0.80 1.34 16.37 10.5
C=180 5.64 2.41 1.47 0.80 1.74 1.61 1.61 1.07 0.80 5.10 97.44 10.71 1.74A+B+C 51.34 3.36 1.61 2.95 11.02 38.02 6.58 3.36 1.74 3.2 68.14 17.39 4.23
Min(A,B,C) 96.37 6.18 3.49 2.95 32.52 92.87 27.28 3.89 0.94 1.34 83.46 31.94 9.82
TABLE IIPERFORMANCE WITH ORTHOGONAL VIEW ANGLES 00 , 900 & 1800 TRAINING (CASIA B)
0 20 40 60 80 100 120 140 160 180
0
20
40
60
80
100
View Angle
Rec
ogni
tion
Acc
urac
yin
%
Frontal View TrainingLateral View TrainingBack View TrainingFusion Sum ScoreFusion Min Score
Fig. 2. Graph on Performance with Orthogonal View Angles 00, 900 & 1800 Training (CASIA B)
JOURNAL OF LATEX CLASS FILES, VOL. , NO. , JANUARY 4
Training Samples Testing Samples kNN with Centroid kNN without CentroidK S Rank-1 Accuracy(%) Avg. Accuracy(%) Rank-1 Accuracy(%) Avg. Accuracy(%)
[1,3,5,6] [2,4] 98.59 97.65 98.59 97.65[1,2,3,4] [5,6] 96.72 97.65 96.72 97.65[1,2,3] [5,6] 94.85 96.37 95.32 96.49[2,3,4] [5,6] 96.72 96.37 96.26 96.49[1,2,4] [5,6] 96.72 96.37 97.19 96.49[1,3,4] [5,6] 97.19 96.37 97.19 96.49[1,2] [5,6] 94.39 96.37 94.39 96.49[1,3] [5,6] 94.39 96.37 95.32 96.49[1,4] [5,6] 97.19 95.32 97.19 95.47[2,3] [5,6] 94.85 95.32 94.39 95.37[2,4] [5,6] 95.79 95.32 95.79 95.47[3,4] [5,6] 95.32 95.32 95.79 95.47[1] [5,6] 87.85 90.18 87.85 90.18[2] [5,6] 90.18 90.18 90.18 90.18[3] [5,6] 88.78 90.18 88.78 90.18[4] [5,6] 93.92 90.18 93.92 90.18
TABLE IPERFORMANCE WITH DIFFERENT TRAINING / TESTING SAMPLES SET OF CASIA B
Training % Testing Accuracy with S=[1, 2, 3, 4, 5, 6] with view angle as follows Testing withwith Non-Ortho.
K=[1, View with3, 5, 6] S=[1to6]
View Angle 00 180 360 540 720 900 1080 1260 1440 1620 1800 Avg. Accu.(%) Avg. Accu.(%)A=0 97.44 6.45 4.43 2.28 1.47 0.80 0.80 1.74 1.74 1.61 8.06 11.32 2.2B=90 1.61 0.80 1.07 5.10 36.29 94.35 27.82 7.79 2.41 0.80 1.34 16.37 10.5
C=180 5.64 2.41 1.47 0.80 1.74 1.61 1.61 1.07 0.80 5.10 97.44 10.71 1.74A+B+C 51.34 3.36 1.61 2.95 11.02 38.02 6.58 3.36 1.74 3.2 68.14 17.39 4.23
Min(A,B,C) 96.37 6.18 3.49 2.95 32.52 92.87 27.28 3.89 0.94 1.34 83.46 31.94 9.82
TABLE IIPERFORMANCE WITH ORTHOGONAL VIEW ANGLES 00 , 900 & 1800 TRAINING (CASIA B)
0 20 40 60 80 100 120 140 160 180
0
20
40
60
80
100
View Angle
Rec
ogni
tion
Acc
urac
yin
%
Frontal View TrainingLateral View TrainingBack View TrainingFusion Sum ScoreFusion Min Score
Fig. 2. Graph on Performance with Orthogonal View Angles 00, 900 & 1800 Training (CASIA B)

View-Invariant Person Identification by OrthogonalView Gait Signature and Fusion of Classifiers
SEPTEMBER 2017 • VOLUME IX • NUMBER 314
INFOCOMMUNICATIONS JOURNAL
JOURNAL OF LATEX CLASS FILES, VOL. , NO. , JANUARY 6
Training Testing % Accuracy with S=[1, 2, 3, 4, 5, 6] with view angles as follows Testingwith with
K=[1, 3, Non-Ortho.5, 6] with Views with124 Sub. S=[1 to 6]
00 180 360 540 720 900 1080 1260 1440 1620 1800 Avg.%340-LDA- 95.83 96.23 95.56 94.62 87.76 85.61 87.09 92.33 93.81 93.27 95.56 92.52
kNN500-LDA- 95.16 96.37 96.63 95.29 88.97 85.88 89.65 94.48 94.48 93.95 96.10 93.36
kNN340-LDA- 97.58 97.31 96.10 96.63 94.62 89.65 91.66 95.43 94.48 93.27 96.77 94.85-pID
S-kNN340-LDA- 97.84 98.25 97.44 97.17 97.71 97.58 6.10 96.50 94.75 94.35 97.58 96.84-VA
S-kNN500-LDA- 97.17 97.58 96.50 96.77 94.22 89.51 93.01 95.56 94.35 93.95 97.74 95.06-pID
S-kNN500-LDA- 97.84 98.92 97.17 97.04 97.84 97.98 96.23 96.50 94.75 94.35 97.71 95.94-VA
S-kNN
TABLE IIIPERFORMANCE WITH LDA USING KNN AND S-KNN CLASSIFIERS WITH NO. OF DYNEMES 340 AND 500 TRAINED BY ORTHOGONAL VIEW ANGLES
180 , 1080 & 1620 (CASIA B)
Training and Rank-1 Angle Person ID-Rank - 1 Accuracy(%) with DifferentTesting Sets Classification S and K with Rank - N Classification124 Subjects Accuracy where N is as follows
K and S Testing Rank-1 1 2 3 4 5 6 7 8 9 10 11Sets Sample Angle
Accu. %K=[1], 6660 6366 64.09 64.09 64.81 64.86 64.83 64.87 64.90 64.89 64.87 64.86 64.81
S=[2, 3, 4, 5, 6] (95.58)K=[1, 3] 5321 5118 78.81 78.18 79.57 79.64 79.74 79.75 79.75 79.79 79.81 79.39 79.92
S=[2, 4, 5, 6] (96.18)K=[1, 3, 5] 3991 3861 87.59 87.59 88.37 88.49 88.62 88.67 88.79 88.82 88.79 88.82 88.84S=[2, 4, 6] (96.73)
K=[1, 3, 5, 6], 2675 2592 91.25 91.25 92.07 92.26 92.29 92.33 92.37 92.33 92.33 92.33 92.29S=[2, 4], /2341 (96.89) /92.39 /92.39 /92.95 /92.99 93.03 93.07 /93.07 93.07 /93.07 /93.07 93.07124/104 /2287Subjects (97.68)
K=[1, 2, 3, 1329 1290 93.00 93.00 93.22 93.52 93.60 93.82 93.82 93.90 93.90 93.90 93.905, 6],S=[4] (97.07)
TABLE IVRANK-1 ACCURACY OF PERSON IDENTIFICATION WITH DIFFERENT SETS OF K AND S WITH RANK-N CLASSIFIER FOR ORTHOGONAL VIEWS 180 , 1080
& 1620 (CASIA B)
Fig. 7. Testing Accuracy of Angle Classifier for angle 1800
in the Table V. It can be seen that, our approach gives slightlyimproved performance over this method.
In [39], the correlation motion analysis for each point inGEI is done across the views and the sparse regression iscarried out with the help of correlation coefficient. Once theregression GEI features across any view-angle is obtained, theview classifier estimates the angle of test gait sequence walked
in any direction. This classifier is based on the GEI featuresprojected on the PCA and later PCA transformed featuresare used in constructing LDA subspace. Using projection oftraining images in LDA subspace to compare with that oftest images, angle is estimated. This step is similar to anglebased classifier used in our algorithm, with only differenceof using dynemes histogram as a features in place of GEIfeatures and using LDA subspace directly instead in PCAtransformed space. In this approach, sparse regressive GEIdata corresponding to the estimated angle refined by ROIselection based on motion correlation is used in classifier afterprojecting it on PCA. The Euclidean distance as a similaritymeasure, is used in the classifier for identifying the person. Wehave compared our approach with this method reported in [39].To be fair with comparison, we used first 24 classes to makethe dynemes model and remaining 100 classes used for view-angle classification and person identification as specified intheir work. Figure 7 shows testing accuracy of angle classifierfor angle 1800. From the results it can be seen that, ourapproach outperforms almost at every place. The variant of this
JOURNAL OF LATEX CLASS FILES, VOL. , NO. , JANUARY 7
Training Testing Testing Accuracy(%) with S=[2, 4] with view angle as followswith Accuracy
K=[1, 3, with5, 6] with (S=[2, 4])124 Sub.
Correct % Accu. 00 180 360 540 720 900 1080 1260 1440 1620 1800
Method [37] - 90.72 87.9 96.37 94.35 87.1 84.68 91.94 97.18 88.31 87.9 97.18 85.08Proposed Method 2425 91.25 94.67 95.93 92.68 95.49 86.53 73.06 84.08 95.85 95.78 92.85 97.13
TABLE VCOMPARISON WITH METHOD [37]
Training Testing Testing Accuracy(%) with S=[2, 4] with view angle as follows Avg. Accu.(%)with Accuracy
K=[1, 3, with5, 6] with (S=[2, 4])124 Sub.
Correct % Accu. 00 180 360 540 720 900 1080 1260 1440 1620 1800
Method [39] - 90.5 88 95 88 91 90.5-pID90 91 91 98 99 91 93 94 92 93 91 94-VA
Proposed 1971 92.22 91.41 94.94 95.45 95.91 92.38 77.15 85.27 95.87 96.82 93.26 95.91 92.22-pIDMethod
98.86 98.98 96.96 95.42 98.98 94.41 94.41 100 97.35 94.81 98.46 97.22-VA
TABLE VICOMPARISON WITH METHOD [39]
work is also presented in [38] using different type of regressionmethod to select the optimized feature representation.
In [2], authors proposed the framework for person identifi-cation based on various activities like; jump in place, wave onehand, jump forward, run, walk (gait). Although, we focusedon gait activity only. The features extracted in [2] are thehistogram of dynemes (centroid of clusters) calculated andaccumulated from each of the frame throughout the videosequence. This algorithm doesn’t need to calculate the gaitcycle and thus it is shift invariant in time. Two subspacesare created using LDA from the dynemes histogram features.One for subject class and another for view-angle. The kNNclassifier with centroid is applied to each of the view of probesubject to decide its view angle and its subject class. These twolabels obtained from N camera views are fed to the BayesianFramework to obtain final output in terms of person class. It isimportant to mention here that our feature extraction methodis very much adopted from this work because of its shift-invariant property. It can also be used for continuous personidentification. However, the classification strategy used in ourapproach is hard than the one used in [2]. We comparedour algorithm with the results provided in this paper. Theexperiment includes the 5 sample instances as training andtesting is done on remaining one instance as mentioned in [2].The recognition accuracy is reported in this paper is 93.27%,while our approach gives the accuracy of 94.19%. This showsthe slight improvement can be gained with our approach.
VI. CONCLUSION
We have explored the view-invariant gait recognition sys-tem which use three orthogonal views of gait signature forthe person identification. It is observed that, training withorthogonal views becomes very effective in multi-view gaitrecognition. Another proposed mechanism of selective kNN
(s-kNN) to fuse the two classifiers have been successful in im-proving the gait recognition accuracy. Initially, we performedexperiment considering orthogonal angles 00, 90 and 1800. Itis observed that, the recognition accuracy decreases abruptlyif test instance of a particular view angle not included intraining. The testing accuracy for non-orthogonal view anglewas also infer. Next, we use optimized view angle frameworkwith orthogonal view angles 180,1080 and 1620 for training.Various experiments were performed considering 340 and 500dynemes for kNN and s-kNN classifier. We got significantlyimproved results even for non-orthogonal view angles. Wereport 97.07% maximum rank-1 angle classification accuracyand 93% maximum rank-1 person identification with differentsets of K and S for rank N s-kNN classification. It is observedthat s-kNN perform better than kNN in pID (person identifi-cation) and VA (view angle accuracy).
ACKNOWLEDGMENT
Portions of the research in this paper use the CASIAGait Database collected by Institute of Automation, ChineseAcademy of Sciences. The authors are grateful to anonymousreviewers for their critical suggestions and comments whichgreatly helped in improving the quality and presentation ofthe paper. Authors are also grateful to Prof. Yogesh RatnakarVispute for proof reading of the paper.
REFERENCES
[1] M. Savvides, K. Ricanek, D. L. Woodard, and G. Dozier, “UnconstrainedBiometric Identification: Emerging Technologies,” Computer, vol. 43,pp. 56–62, 2010.
[2] A. Iosifidis, A. Tefas, and I. Pitas, “Activity-Based Person Identificationusing Fuzzy Representation and Discriminant Learning,” IEEE Transac-tions on Information Forensics and Security, vol. 7, no. 2, pp. 530–542,2012.
[3] Liang Wang, Tieniu Tan, Weiming Hu, and Huazhong Ning, “AutomaticGait Recognition Based on Statistical Shape Analysis,” IEEE Transac-tions on Image Processing, vol. 12, no. 9, pp. 1120–1131, 2003.
JOURNAL OF LATEX CLASS FILES, VOL. , NO. , JANUARY 6
Training Testing % Accuracy with S=[1, 2, 3, 4, 5, 6] with view angles as follows Testingwith with
K=[1, 3, Non-Ortho.5, 6] with Views with124 Sub. S=[1 to 6]
00 180 360 540 720 900 1080 1260 1440 1620 1800 Avg.%340-LDA- 95.83 96.23 95.56 94.62 87.76 85.61 87.09 92.33 93.81 93.27 95.56 92.52
kNN500-LDA- 95.16 96.37 96.63 95.29 88.97 85.88 89.65 94.48 94.48 93.95 96.10 93.36
kNN340-LDA- 97.58 97.31 96.10 96.63 94.62 89.65 91.66 95.43 94.48 93.27 96.77 94.85-pID
S-kNN340-LDA- 97.84 98.25 97.44 97.17 97.71 97.58 6.10 96.50 94.75 94.35 97.58 96.84-VA
S-kNN500-LDA- 97.17 97.58 96.50 96.77 94.22 89.51 93.01 95.56 94.35 93.95 97.74 95.06-pID
S-kNN500-LDA- 97.84 98.92 97.17 97.04 97.84 97.98 96.23 96.50 94.75 94.35 97.71 95.94-VA
S-kNN
TABLE IIIPERFORMANCE WITH LDA USING KNN AND S-KNN CLASSIFIERS WITH NO. OF DYNEMES 340 AND 500 TRAINED BY ORTHOGONAL VIEW ANGLES
180 , 1080 & 1620 (CASIA B)
Training and Rank-1 Angle Person ID-Rank - 1 Accuracy(%) with DifferentTesting Sets Classification S and K with Rank - N Classification124 Subjects Accuracy where N is as follows
K and S Testing Rank-1 1 2 3 4 5 6 7 8 9 10 11Sets Sample Angle
Accu. %K=[1], 6660 6366 64.09 64.09 64.81 64.86 64.83 64.87 64.90 64.89 64.87 64.86 64.81
S=[2, 3, 4, 5, 6] (95.58)K=[1, 3] 5321 5118 78.81 78.18 79.57 79.64 79.74 79.75 79.75 79.79 79.81 79.39 79.92
S=[2, 4, 5, 6] (96.18)K=[1, 3, 5] 3991 3861 87.59 87.59 88.37 88.49 88.62 88.67 88.79 88.82 88.79 88.82 88.84S=[2, 4, 6] (96.73)
K=[1, 3, 5, 6], 2675 2592 91.25 91.25 92.07 92.26 92.29 92.33 92.37 92.33 92.33 92.33 92.29S=[2, 4], /2341 (96.89) /92.39 /92.39 /92.95 /92.99 93.03 93.07 /93.07 93.07 /93.07 /93.07 93.07124/104 /2287Subjects (97.68)
K=[1, 2, 3, 1329 1290 93.00 93.00 93.22 93.52 93.60 93.82 93.82 93.90 93.90 93.90 93.905, 6],S=[4] (97.07)
TABLE IVRANK-1 ACCURACY OF PERSON IDENTIFICATION WITH DIFFERENT SETS OF K AND S WITH RANK-N CLASSIFIER FOR ORTHOGONAL VIEWS 180 , 1080
& 1620 (CASIA B)
Fig. 7. Testing Accuracy of Angle Classifier for angle 1800
in the Table V. It can be seen that, our approach gives slightlyimproved performance over this method.
In [39], the correlation motion analysis for each point inGEI is done across the views and the sparse regression iscarried out with the help of correlation coefficient. Once theregression GEI features across any view-angle is obtained, theview classifier estimates the angle of test gait sequence walked
in any direction. This classifier is based on the GEI featuresprojected on the PCA and later PCA transformed featuresare used in constructing LDA subspace. Using projection oftraining images in LDA subspace to compare with that oftest images, angle is estimated. This step is similar to anglebased classifier used in our algorithm, with only differenceof using dynemes histogram as a features in place of GEIfeatures and using LDA subspace directly instead in PCAtransformed space. In this approach, sparse regressive GEIdata corresponding to the estimated angle refined by ROIselection based on motion correlation is used in classifier afterprojecting it on PCA. The Euclidean distance as a similaritymeasure, is used in the classifier for identifying the person. Wehave compared our approach with this method reported in [39].To be fair with comparison, we used first 24 classes to makethe dynemes model and remaining 100 classes used for view-angle classification and person identification as specified intheir work. Figure 7 shows testing accuracy of angle classifierfor angle 1800. From the results it can be seen that, ourapproach outperforms almost at every place. The variant of this
JOURNAL OF LATEX CLASS FILES, VOL. , NO. , JANUARY 7
Training Testing Testing Accuracy(%) with S=[2, 4] with view angle as followswith Accuracy
K=[1, 3, with5, 6] with (S=[2, 4])124 Sub.
Correct % Accu. 00 180 360 540 720 900 1080 1260 1440 1620 1800
Method [37] - 90.72 87.9 96.37 94.35 87.1 84.68 91.94 97.18 88.31 87.9 97.18 85.08Proposed Method 2425 91.25 94.67 95.93 92.68 95.49 86.53 73.06 84.08 95.85 95.78 92.85 97.13
TABLE VCOMPARISON WITH METHOD [37]
Training Testing Testing Accuracy(%) with S=[2, 4] with view angle as follows Avg. Accu.(%)with Accuracy
K=[1, 3, with5, 6] with (S=[2, 4])124 Sub.
Correct % Accu. 00 180 360 540 720 900 1080 1260 1440 1620 1800
Method [39] - 90.5 88 95 88 91 90.5-pID90 91 91 98 99 91 93 94 92 93 91 94-VA
Proposed 1971 92.22 91.41 94.94 95.45 95.91 92.38 77.15 85.27 95.87 96.82 93.26 95.91 92.22-pIDMethod
98.86 98.98 96.96 95.42 98.98 94.41 94.41 100 97.35 94.81 98.46 97.22-VA
TABLE VICOMPARISON WITH METHOD [39]
work is also presented in [38] using different type of regressionmethod to select the optimized feature representation.
In [2], authors proposed the framework for person identifi-cation based on various activities like; jump in place, wave onehand, jump forward, run, walk (gait). Although, we focusedon gait activity only. The features extracted in [2] are thehistogram of dynemes (centroid of clusters) calculated andaccumulated from each of the frame throughout the videosequence. This algorithm doesn’t need to calculate the gaitcycle and thus it is shift invariant in time. Two subspacesare created using LDA from the dynemes histogram features.One for subject class and another for view-angle. The kNNclassifier with centroid is applied to each of the view of probesubject to decide its view angle and its subject class. These twolabels obtained from N camera views are fed to the BayesianFramework to obtain final output in terms of person class. It isimportant to mention here that our feature extraction methodis very much adopted from this work because of its shift-invariant property. It can also be used for continuous personidentification. However, the classification strategy used in ourapproach is hard than the one used in [2]. We comparedour algorithm with the results provided in this paper. Theexperiment includes the 5 sample instances as training andtesting is done on remaining one instance as mentioned in [2].The recognition accuracy is reported in this paper is 93.27%,while our approach gives the accuracy of 94.19%. This showsthe slight improvement can be gained with our approach.
VI. CONCLUSION
We have explored the view-invariant gait recognition sys-tem which use three orthogonal views of gait signature forthe person identification. It is observed that, training withorthogonal views becomes very effective in multi-view gaitrecognition. Another proposed mechanism of selective kNN
(s-kNN) to fuse the two classifiers have been successful in im-proving the gait recognition accuracy. Initially, we performedexperiment considering orthogonal angles 00, 90 and 1800. Itis observed that, the recognition accuracy decreases abruptlyif test instance of a particular view angle not included intraining. The testing accuracy for non-orthogonal view anglewas also infer. Next, we use optimized view angle frameworkwith orthogonal view angles 180,1080 and 1620 for training.Various experiments were performed considering 340 and 500dynemes for kNN and s-kNN classifier. We got significantlyimproved results even for non-orthogonal view angles. Wereport 97.07% maximum rank-1 angle classification accuracyand 93% maximum rank-1 person identification with differentsets of K and S for rank N s-kNN classification. It is observedthat s-kNN perform better than kNN in pID (person identifi-cation) and VA (view angle accuracy).
ACKNOWLEDGMENT
Portions of the research in this paper use the CASIAGait Database collected by Institute of Automation, ChineseAcademy of Sciences. The authors are grateful to anonymousreviewers for their critical suggestions and comments whichgreatly helped in improving the quality and presentation ofthe paper. Authors are also grateful to Prof. Yogesh RatnakarVispute for proof reading of the paper.
REFERENCES
[1] M. Savvides, K. Ricanek, D. L. Woodard, and G. Dozier, “UnconstrainedBiometric Identification: Emerging Technologies,” Computer, vol. 43,pp. 56–62, 2010.
[2] A. Iosifidis, A. Tefas, and I. Pitas, “Activity-Based Person Identificationusing Fuzzy Representation and Discriminant Learning,” IEEE Transac-tions on Information Forensics and Security, vol. 7, no. 2, pp. 530–542,2012.
[3] Liang Wang, Tieniu Tan, Weiming Hu, and Huazhong Ning, “AutomaticGait Recognition Based on Statistical Shape Analysis,” IEEE Transac-tions on Image Processing, vol. 12, no. 9, pp. 1120–1131, 2003.

View-Invariant Person Identification by OrthogonalView Gait Signature and Fusion of Classifiers
INFOCOMMUNICATIONS JOURNAL
SEPTEMBER 2017 • VOLUME IX • NUMBER 3 15
JOURNAL OF LATEX CLASS FILES, VOL. , NO. , JANUARY 7
Training Testing Testing Accuracy(%) with S=[2, 4] with view angle as followswith Accuracy
K=[1, 3, with5, 6] with (S=[2, 4])124 Sub.
Correct % Accu. 00 180 360 540 720 900 1080 1260 1440 1620 1800
Method [37] - 90.72 87.9 96.37 94.35 87.1 84.68 91.94 97.18 88.31 87.9 97.18 85.08Proposed Method 2425 91.25 94.67 95.93 92.68 95.49 86.53 73.06 84.08 95.85 95.78 92.85 97.13
TABLE VCOMPARISON WITH METHOD [37]
Training Testing Testing Accuracy(%) with S=[2, 4] with view angle as follows Avg. Accu.(%)with Accuracy
K=[1, 3, with5, 6] with (S=[2, 4])124 Sub.
Correct % Accu. 00 180 360 540 720 900 1080 1260 1440 1620 1800
Method [39] - 90.5 88 95 88 91 90.5-pID90 91 91 98 99 91 93 94 92 93 91 94-VA
Proposed 1971 92.22 91.41 94.94 95.45 95.91 92.38 77.15 85.27 95.87 96.82 93.26 95.91 92.22-pIDMethod
98.86 98.98 96.96 95.42 98.98 94.41 94.41 100 97.35 94.81 98.46 97.22-VA
TABLE VICOMPARISON WITH METHOD [39]
work is also presented in [38] using different type of regressionmethod to select the optimized feature representation.
In [2], authors proposed the framework for person identifi-cation based on various activities like; jump in place, wave onehand, jump forward, run, walk (gait). Although, we focusedon gait activity only. The features extracted in [2] are thehistogram of dynemes (centroid of clusters) calculated andaccumulated from each of the frame throughout the videosequence. This algorithm doesn’t need to calculate the gaitcycle and thus it is shift invariant in time. Two subspacesare created using LDA from the dynemes histogram features.One for subject class and another for view-angle. The kNNclassifier with centroid is applied to each of the view of probesubject to decide its view angle and its subject class. These twolabels obtained from N camera views are fed to the BayesianFramework to obtain final output in terms of person class. It isimportant to mention here that our feature extraction methodis very much adopted from this work because of its shift-invariant property. It can also be used for continuous personidentification. However, the classification strategy used in ourapproach is hard than the one used in [2]. We comparedour algorithm with the results provided in this paper. Theexperiment includes the 5 sample instances as training andtesting is done on remaining one instance as mentioned in [2].The recognition accuracy is reported in this paper is 93.27%,while our approach gives the accuracy of 94.19%. This showsthe slight improvement can be gained with our approach.
VI. CONCLUSION
We have explored the view-invariant gait recognition sys-tem which use three orthogonal views of gait signature forthe person identification. It is observed that, training withorthogonal views becomes very effective in multi-view gaitrecognition. Another proposed mechanism of selective kNN
(s-kNN) to fuse the two classifiers have been successful in im-proving the gait recognition accuracy. Initially, we performedexperiment considering orthogonal angles 00, 90 and 1800. Itis observed that, the recognition accuracy decreases abruptlyif test instance of a particular view angle not included intraining. The testing accuracy for non-orthogonal view anglewas also infer. Next, we use optimized view angle frameworkwith orthogonal view angles 180,1080 and 1620 for training.Various experiments were performed considering 340 and 500dynemes for kNN and s-kNN classifier. We got significantlyimproved results even for non-orthogonal view angles. Wereport 97.07% maximum rank-1 angle classification accuracyand 93% maximum rank-1 person identification with differentsets of K and S for rank N s-kNN classification. It is observedthat s-kNN perform better than kNN in pID (person identifi-cation) and VA (view angle accuracy).
ACKNOWLEDGMENT
Portions of the research in this paper use the CASIAGait Database collected by Institute of Automation, ChineseAcademy of Sciences. The authors are grateful to anonymousreviewers for their critical suggestions and comments whichgreatly helped in improving the quality and presentation ofthe paper. Authors are also grateful to Prof. Yogesh RatnakarVispute for proof reading of the paper.
REFERENCES
[1] M. Savvides, K. Ricanek, D. L. Woodard, and G. Dozier, “UnconstrainedBiometric Identification: Emerging Technologies,” Computer, vol. 43,pp. 56–62, 2010.
[2] A. Iosifidis, A. Tefas, and I. Pitas, “Activity-Based Person Identificationusing Fuzzy Representation and Discriminant Learning,” IEEE Transac-tions on Information Forensics and Security, vol. 7, no. 2, pp. 530–542,2012.
[3] Liang Wang, Tieniu Tan, Weiming Hu, and Huazhong Ning, “AutomaticGait Recognition Based on Statistical Shape Analysis,” IEEE Transac-tions on Image Processing, vol. 12, no. 9, pp. 1120–1131, 2003.
JOURNAL OF LATEX CLASS FILES, VOL. , NO. , JANUARY 6
Training Testing % Accuracy with S=[1, 2, 3, 4, 5, 6] with view angles as follows Testingwith with
K=[1, 3, Non-Ortho.5, 6] with Views with124 Sub. S=[1 to 6]
00 180 360 540 720 900 1080 1260 1440 1620 1800 Avg.%340-LDA- 95.83 96.23 95.56 94.62 87.76 85.61 87.09 92.33 93.81 93.27 95.56 92.52
kNN500-LDA- 95.16 96.37 96.63 95.29 88.97 85.88 89.65 94.48 94.48 93.95 96.10 93.36
kNN340-LDA- 97.58 97.31 96.10 96.63 94.62 89.65 91.66 95.43 94.48 93.27 96.77 94.85-pID
S-kNN340-LDA- 97.84 98.25 97.44 97.17 97.71 97.58 6.10 96.50 94.75 94.35 97.58 96.84-VA
S-kNN500-LDA- 97.17 97.58 96.50 96.77 94.22 89.51 93.01 95.56 94.35 93.95 97.74 95.06-pID
S-kNN500-LDA- 97.84 98.92 97.17 97.04 97.84 97.98 96.23 96.50 94.75 94.35 97.71 95.94-VA
S-kNN
TABLE IIIPERFORMANCE WITH LDA USING KNN AND S-KNN CLASSIFIERS WITH NO. OF DYNEMES 340 AND 500 TRAINED BY ORTHOGONAL VIEW ANGLES
180 , 1080 & 1620 (CASIA B)
Training and Rank-1 Angle Person ID-Rank - 1 Accuracy(%) with DifferentTesting Sets Classification S and K with Rank - N Classification124 Subjects Accuracy where N is as follows
K and S Testing Rank-1 1 2 3 4 5 6 7 8 9 10 11Sets Sample Angle
Accu. %K=[1], 6660 6366 64.09 64.09 64.81 64.86 64.83 64.87 64.90 64.89 64.87 64.86 64.81
S=[2, 3, 4, 5, 6] (95.58)K=[1, 3] 5321 5118 78.81 78.18 79.57 79.64 79.74 79.75 79.75 79.79 79.81 79.39 79.92
S=[2, 4, 5, 6] (96.18)K=[1, 3, 5] 3991 3861 87.59 87.59 88.37 88.49 88.62 88.67 88.79 88.82 88.79 88.82 88.84S=[2, 4, 6] (96.73)
K=[1, 3, 5, 6], 2675 2592 91.25 91.25 92.07 92.26 92.29 92.33 92.37 92.33 92.33 92.33 92.29S=[2, 4], /2341 (96.89) /92.39 /92.39 /92.95 /92.99 93.03 93.07 /93.07 93.07 /93.07 /93.07 93.07124/104 /2287Subjects (97.68)
K=[1, 2, 3, 1329 1290 93.00 93.00 93.22 93.52 93.60 93.82 93.82 93.90 93.90 93.90 93.905, 6],S=[4] (97.07)
TABLE IVRANK-1 ACCURACY OF PERSON IDENTIFICATION WITH DIFFERENT SETS OF K AND S WITH RANK-N CLASSIFIER FOR ORTHOGONAL VIEWS 180 , 1080
& 1620 (CASIA B)
Fig. 7. Testing Accuracy of Angle Classifier for angle 1800
in the Table V. It can be seen that, our approach gives slightlyimproved performance over this method.
In [39], the correlation motion analysis for each point inGEI is done across the views and the sparse regression iscarried out with the help of correlation coefficient. Once theregression GEI features across any view-angle is obtained, theview classifier estimates the angle of test gait sequence walked
in any direction. This classifier is based on the GEI featuresprojected on the PCA and later PCA transformed featuresare used in constructing LDA subspace. Using projection oftraining images in LDA subspace to compare with that oftest images, angle is estimated. This step is similar to anglebased classifier used in our algorithm, with only differenceof using dynemes histogram as a features in place of GEIfeatures and using LDA subspace directly instead in PCAtransformed space. In this approach, sparse regressive GEIdata corresponding to the estimated angle refined by ROIselection based on motion correlation is used in classifier afterprojecting it on PCA. The Euclidean distance as a similaritymeasure, is used in the classifier for identifying the person. Wehave compared our approach with this method reported in [39].To be fair with comparison, we used first 24 classes to makethe dynemes model and remaining 100 classes used for view-angle classification and person identification as specified intheir work. Figure 7 shows testing accuracy of angle classifierfor angle 1800. From the results it can be seen that, ourapproach outperforms almost at every place. The variant of this
JOURNAL OF LATEX CLASS FILES, VOL. , NO. , JANUARY 7
Training Testing Testing Accuracy(%) with S=[2, 4] with view angle as followswith Accuracy
K=[1, 3, with5, 6] with (S=[2, 4])124 Sub.
Correct % Accu. 00 180 360 540 720 900 1080 1260 1440 1620 1800
Method [37] - 90.72 87.9 96.37 94.35 87.1 84.68 91.94 97.18 88.31 87.9 97.18 85.08Proposed Method 2425 91.25 94.67 95.93 92.68 95.49 86.53 73.06 84.08 95.85 95.78 92.85 97.13
TABLE VCOMPARISON WITH METHOD [37]
Training Testing Testing Accuracy(%) with S=[2, 4] with view angle as follows Avg. Accu.(%)with Accuracy
K=[1, 3, with5, 6] with (S=[2, 4])124 Sub.
Correct % Accu. 00 180 360 540 720 900 1080 1260 1440 1620 1800
Method [39] - 90.5 88 95 88 91 90.5-pID90 91 91 98 99 91 93 94 92 93 91 94-VA
Proposed 1971 92.22 91.41 94.94 95.45 95.91 92.38 77.15 85.27 95.87 96.82 93.26 95.91 92.22-pIDMethod
98.86 98.98 96.96 95.42 98.98 94.41 94.41 100 97.35 94.81 98.46 97.22-VA
TABLE VICOMPARISON WITH METHOD [39]
work is also presented in [38] using different type of regressionmethod to select the optimized feature representation.
In [2], authors proposed the framework for person identifi-cation based on various activities like; jump in place, wave onehand, jump forward, run, walk (gait). Although, we focusedon gait activity only. The features extracted in [2] are thehistogram of dynemes (centroid of clusters) calculated andaccumulated from each of the frame throughout the videosequence. This algorithm doesn’t need to calculate the gaitcycle and thus it is shift invariant in time. Two subspacesare created using LDA from the dynemes histogram features.One for subject class and another for view-angle. The kNNclassifier with centroid is applied to each of the view of probesubject to decide its view angle and its subject class. These twolabels obtained from N camera views are fed to the BayesianFramework to obtain final output in terms of person class. It isimportant to mention here that our feature extraction methodis very much adopted from this work because of its shift-invariant property. It can also be used for continuous personidentification. However, the classification strategy used in ourapproach is hard than the one used in [2]. We comparedour algorithm with the results provided in this paper. Theexperiment includes the 5 sample instances as training andtesting is done on remaining one instance as mentioned in [2].The recognition accuracy is reported in this paper is 93.27%,while our approach gives the accuracy of 94.19%. This showsthe slight improvement can be gained with our approach.
VI. CONCLUSION
We have explored the view-invariant gait recognition sys-tem which use three orthogonal views of gait signature forthe person identification. It is observed that, training withorthogonal views becomes very effective in multi-view gaitrecognition. Another proposed mechanism of selective kNN
(s-kNN) to fuse the two classifiers have been successful in im-proving the gait recognition accuracy. Initially, we performedexperiment considering orthogonal angles 00, 90 and 1800. Itis observed that, the recognition accuracy decreases abruptlyif test instance of a particular view angle not included intraining. The testing accuracy for non-orthogonal view anglewas also infer. Next, we use optimized view angle frameworkwith orthogonal view angles 180,1080 and 1620 for training.Various experiments were performed considering 340 and 500dynemes for kNN and s-kNN classifier. We got significantlyimproved results even for non-orthogonal view angles. Wereport 97.07% maximum rank-1 angle classification accuracyand 93% maximum rank-1 person identification with differentsets of K and S for rank N s-kNN classification. It is observedthat s-kNN perform better than kNN in pID (person identifi-cation) and VA (view angle accuracy).
ACKNOWLEDGMENT
Portions of the research in this paper use the CASIAGait Database collected by Institute of Automation, ChineseAcademy of Sciences. The authors are grateful to anonymousreviewers for their critical suggestions and comments whichgreatly helped in improving the quality and presentation ofthe paper. Authors are also grateful to Prof. Yogesh RatnakarVispute for proof reading of the paper.
REFERENCES
[1] M. Savvides, K. Ricanek, D. L. Woodard, and G. Dozier, “UnconstrainedBiometric Identification: Emerging Technologies,” Computer, vol. 43,pp. 56–62, 2010.
[2] A. Iosifidis, A. Tefas, and I. Pitas, “Activity-Based Person Identificationusing Fuzzy Representation and Discriminant Learning,” IEEE Transac-tions on Information Forensics and Security, vol. 7, no. 2, pp. 530–542,2012.
[3] Liang Wang, Tieniu Tan, Weiming Hu, and Huazhong Ning, “AutomaticGait Recognition Based on Statistical Shape Analysis,” IEEE Transac-tions on Image Processing, vol. 12, no. 9, pp. 1120–1131, 2003.

View-Invariant Person Identification by OrthogonalView Gait Signature and Fusion of Classifiers
SEPTEMBER 2017 • VOLUME IX • NUMBER 316
INFOCOMMUNICATIONS JOURNAL
JOURNAL OF LATEX CLASS FILES, VOL. , NO. , JANUARY 8
[4] L. Wang, H. Ning, T. Tan, and W. Hu, “Fusion of Static and DynamicBody Biometrics for Gait Recognition,” IEEE Transactions on Circuitsand Systems for Video Technology, vol. 14, no. 2, pp. 149–158, 2004.
[5] J. Han and B. Bhanu, “Individual Recognition using Gait Energy Im-age.” IEEE Transactions on Pattern Analysis and Machine Intelligence,vol. 28, no. 2, pp. 316–322, 2006.
[6] S. H. S. Hong, H. L. H. Lee, and E. K. E. Kim, “Fusion of Multiple GaitCycles for Human Identification,” 2009 ICCAS-SICE, pp. 3171–3175,2009.
[7] H. Z. H. Zhang and Z. L. Z. Liu, “Gait Representation and Recogni-tion Using Haar Wavelet and Radon Transform,” WASE InternationalConference on Information Engineering, vol. 1, pp. 83–86, 2009.
[8] T. Amin and D. Hatzinakos, “Wavelet Analysis of Cyclic Human GaitFor Recognition,” Sixteenth International Conference on Digital SignalProcessing, pp. 1–6, 2009.
[9] H. Su and G. Y. Chen, “A New Method of Gait Recognition Independentof View Angle,” International Conference on Machine Learning andCybernetics, ICMLC, vol. 6, pp. 3091–3096, 2010.
[10] K. Moustakas, D. Tzovaras, and G. Stavropoulos, “Gait RecognitionUsing Geometric Features and Soft Biometrics,” IEEE Signal ProcessingLetters, vol. 17, no. 4, pp. 367–370, 2010.
[11] G. M. Imad Rida, Xudong Jiang, “Human Body Part Selection byGroup Lasso of MotionforModel-FreeGaitRecognition ,” IEEE SignalProcessing Letters, vol. 23, no. 1, pp. 154–158, 2016.
[12] S. A. Niyogi and E. H. Adelson, “Analyzing and Recognizing WalkingFigures in XYT,” Conference on Computer Vision and Pattern Recog-nition, CVPR, pp. 469–474, 1994.
[13] D. K. Wagg and M. S. Nixon, “On Automated Model-based Extractionand Analysis of Gait,” Sixth IEEE International Conference on Auto-matic Face and Gesture Recognition, pp. 11–16, 2004.
[14] L. Lee and W. E. L. Grimson, “Gait Analysis for Recognition andClassification,” Proceedings of Fifth IEEE International Conference onAutomatic Face Gesture Recognition, pp. 734–742, 2002.
[15] N. V. Boulgouris, “Model-based Human Gait Recognition using Fusionof Features,” IEEE International Conference on Acoustics Speech andSignal Processing (2009), pp. 1469–1472, 2009.
[16] H. L. Worapan Kusakunniran, Qiang Wu and J. Zhang1, “Multiple ViewsGait Recognition using View Transformation Model Based on OptimizedGait Energy Image ,” In Proc. 12th IEEE International Conference onComputer Vision, pp. 1058–1064, 2009.
[17] ——, “Support Vector Regression for Multi-View Gait Recognitionbased on Local Motion Feature Selection ,” In Proc. IEEE Conferenceon Computer Vision and pattern Recognition, pp. 974–981, 2010.
[18] ——, “Gait Recognition Under Various Viewing Angles Based onCorrelated Motion Regression ,” IEEE Transaction on Circuits andSystems for Video Technology, vol. 22, no. 6, pp. 966–980, 2012.
[19] H. L. Worapan Kusakunniran, Qiang Wu and J. Zhang, “Cross-viewand Multi-view Gait Recognitions based on View Transformation Modelusing Multi-Layer Perceptron ,” Pattern Recognition Letters, vol. 33,no. 7, pp. 882–889, 2012.
[20] M. Goffredo, I. Bouchrika, J. N. Carter, and M. S. Nixon, “Self-Calibrating View-Invariant Gait Biometrics.” IEEE Transactions onSystems Man and Cybernetics: Part B Cybernetics, vol. 40, no. 4, pp.997–1008, 2010.
[21] N. Liu, J. Lu, and Y. P. Tan, “Joint Subspace Learning for View-InvariantGait Recognition,” IEEE Signal Processing Letters, vol. 18, no. 7, pp.431–434, 2011.
[22] W. Kusakunniran, Q. Wu, J. Zhang, and H. Li, “A New View-InvariantFeature for Cross-View Gait Recognition,” IEEE Transaction on Infor-mation Forensic and Security, vol. 8, no. 10, pp. 1642–1653, 2013.
[23] S. Jia, L. Wang, and X. Li, “View-Invariant Gait Authentication Based onSilhouette Contours Analysis and View Estimation,” IEEE/CAA Journalof Autometica Sinica, vol. 2, no. 2, pp. 226–232, 2015.
[24] T. Y. Z. L. Xianglei Xing, Kejun Wang, “Complete Canonical Correla-tion Analysis With Application to Multi-View Gait Recognition,” PatternRecognition, Elsevier B. V., no. 50, pp. 107–117, 2016.
[25] W. Zeng and C. Wang, “View- Invariant Gait Recognition Via Determin-istic Learning,” Neurocomputing, Elsevier B.V., no. 175, pp. 324–335,2016.
[26] T. T. Sruti Das Choudhury, “Robust View-Invariant Multiscale GaitRecognition ,” Pattern Recognition Letters, vol. 48, no. 3, pp. 798–811,2015.
[27] N. Gkalelis, A. Tefas, and I. Pitas, “Combining Fuzzy Vector Quan-tization with Linear Discriminant Analysis for Continuous HumanMovement Recognition,” IEEE Transactions on Circuits and Systemsfor Video Technology, vol. 18, no. 11, pp. 1511–1521, 2008.
[28] M. Zhu and A. Martinez, “Subclass Discriminant Analysis,” IEEETransactions on Pattern Analysis and Machine Intelligence, vol. 28,no. 8, pp. 1274 –1286, 2006.
[29] N. Karayiannis and P.-I. Pai, “Fuzzy Vector Quantization Algorithmsand Their Application in Image Compression,” IEEE Transactions onImage Processing, vol. 4, no. 9, pp. 1193 –1201, 1995.
[30] A. Iosifidis, N. Nikolaidis, and I. Pitas, “Movement Recognition Ex-ploiting Multi-View Information,” IEEE International Workshop onMultimedia Signal Processing (MMSP), 2010, pp. 427 –431, 2010.
[31] A. Iosifidis, A. Tefas, and I. Pitas, “Person Specific Activity Recognitionusing Fuzzy Learning and Discriminant Analysis,” Euripean SignalProcessing Conference (EUSIPCO), 2011.
[32] A. Iosifidis, A. Tefas, N. Nikolaidis, and I. Pitas, “Multi-view HumanMovement Recognition based on Fuzzy Distances and Linear Discrim-inant Analysis,” Computer Vision and Image Understanding, vol. 116,no. 3, pp. 347 – 360, 2012.
[33] J. Lu, J. Hu, X. Zhou, and Y. Shang, “Activity-based Person Identifi-cation using Sparse Coding and Discriminative Metric Learning,” 20thACM international conference on Multimedia, pp. 1061–1064, 2012.
[34] J. Yang, K. Yu, Y. Gong, and T. Huang, “Linear Spatial Pyramid Match-ing using Sparse Coding for Image Classification,” IEEE Conference onComputer Vision and Pattern Recognition, 2009, pp. 1794–1801, 2009.
[35] H. Lee, A. Battle, R. Raina, and A. Y. Ng, “Efficient Sparse CodingAlgorithms,” Advances in Neural Information Processing Systems, pp.801–808, 2007.
[36] N. Gkalelis, A. Tefas, and I. Pitas, “Human Identification from HumanMovements,” 16th IEEE International Conference on Image Processing(ICIP), 2009, pp. 2585 –2588, 2009.
[37] N. Liu and Y.-P. Tan, “View Invariant Gait Recognition,” IEEE Interna-tional Conference on Acoustics Speech and Signal Processing (ICASSP),pp. 1410–1413, 2010.
[38] S. Zheng, J. Zhang, K. Huang, R. He, and T. Tan, “Robust ViewTransformation Model for Gait Recognition,” 18th IEEE InternationalConference on Image Processing (ICIP), pp. 2073–2076, 2011.
[39] W. Kusakunniran, Q. Wu, J. Zhang, and H. Li, “Gait Recognition UnderVarious Viewing Angles Based on Correlated Motion Regression,” IEEETransactions on Circuits and Systems for Video Technology, vol. 22,no. 6, pp. 966–980, 2012.
[40] S. Zheng, J. Zhang, K. Huang, R. He, and T. Tan, “Robust ViewTransformation Model for Gait Recognition,” International Conferenceon Image Processing(ICIP), 2011.
Sagar Arun More was born in Maharashtra, India.He received B.E. degree in Electronics from theNorth Maharashtra University, Jalgaon, India, in2000 and the M. E. degree in Electronics from SantGadage Baba Amravati University, Amravati, India,in 2008. He is currently pursuing Ph.D. from NorthMaharashtra University Jalgaon. He current researchinterests include image and video processing, bio-metrics.
Pramod Jagan Deore was born in Maharashtra,India. He received the B. E. degree in Electronicsfrom the North Maharashtra University, Jalgaon,India, in 1997.He received the M. E. and Ph.D.degrees from SGGS Institute of Engineering andTechnology, Swami Ramanand Teerth MarathwadaUniversity, Nanded, in 1999 and 2007 respectively.He is Professor of Electronics and Telecommunica-tion Department at the R. C. Patel Institute of Tech-nology, Shirpur, India. His research interests includeInterval arithmetic operations applications in robust
control, Image processing, and Bio-medical signal processing, Microwavecircuits and antennas etc. He has published 40 papers in National/InternationalConferences/Journals and he has Co-authored two books. He is life memberof ISTE.
Sagar Arun More was born in Maharashtra, India. He received B.E. degree in Electronics from the North Maharashtra University, Jalgaon, India, in 2000 and the M. E. degree in Electronics from Sant Gadage Baba Amravati University, Amravati, India, in 2008. He is currently pursuing Ph.D. from North Maharashtra University Jalgaon. He current research interests include image and video processing, biometrics.
Pramod Jagan Deore was born in Maharashtra, India. He received the B. E. degree in Electronics from the North Maharashtra University, Jalgaon, India, in 1997.He received the M. E. and Ph.D. degrees from SGGS Institute of Engineering and Technology, Swami Ramanand Teerth Marathwada University, Nanded, in 1999 and 2007 respectively.He is Professor of Electronics and Telecommunication Department at the R. C. Patel Institute of Technology, Shirpur, India. His research interests include Interval arithmetic operations applications in robust control,
Image processing, and Bio-medical signal processing, Microwave circuits and antennas etc. He has published 40 papers in National/International Conferences/Journals and he has Co-authored two books. He is life member of ISTE.
JOURNAL OF LATEX CLASS FILES, VOL. , NO. , JANUARY 8
[4] L. Wang, H. Ning, T. Tan, and W. Hu, “Fusion of Static and DynamicBody Biometrics for Gait Recognition,” IEEE Transactions on Circuitsand Systems for Video Technology, vol. 14, no. 2, pp. 149–158, 2004.
[5] J. Han and B. Bhanu, “Individual Recognition using Gait Energy Im-age.” IEEE Transactions on Pattern Analysis and Machine Intelligence,vol. 28, no. 2, pp. 316–322, 2006.
[6] S. H. S. Hong, H. L. H. Lee, and E. K. E. Kim, “Fusion of Multiple GaitCycles for Human Identification,” 2009 ICCAS-SICE, pp. 3171–3175,2009.
[7] H. Z. H. Zhang and Z. L. Z. Liu, “Gait Representation and Recogni-tion Using Haar Wavelet and Radon Transform,” WASE InternationalConference on Information Engineering, vol. 1, pp. 83–86, 2009.
[8] T. Amin and D. Hatzinakos, “Wavelet Analysis of Cyclic Human GaitFor Recognition,” Sixteenth International Conference on Digital SignalProcessing, pp. 1–6, 2009.
[9] H. Su and G. Y. Chen, “A New Method of Gait Recognition Independentof View Angle,” International Conference on Machine Learning andCybernetics, ICMLC, vol. 6, pp. 3091–3096, 2010.
[10] K. Moustakas, D. Tzovaras, and G. Stavropoulos, “Gait RecognitionUsing Geometric Features and Soft Biometrics,” IEEE Signal ProcessingLetters, vol. 17, no. 4, pp. 367–370, 2010.
[11] G. M. Imad Rida, Xudong Jiang, “Human Body Part Selection byGroup Lasso of MotionforModel-FreeGaitRecognition ,” IEEE SignalProcessing Letters, vol. 23, no. 1, pp. 154–158, 2016.
[12] S. A. Niyogi and E. H. Adelson, “Analyzing and Recognizing WalkingFigures in XYT,” Conference on Computer Vision and Pattern Recog-nition, CVPR, pp. 469–474, 1994.
[13] D. K. Wagg and M. S. Nixon, “On Automated Model-based Extractionand Analysis of Gait,” Sixth IEEE International Conference on Auto-matic Face and Gesture Recognition, pp. 11–16, 2004.
[14] L. Lee and W. E. L. Grimson, “Gait Analysis for Recognition andClassification,” Proceedings of Fifth IEEE International Conference onAutomatic Face Gesture Recognition, pp. 734–742, 2002.
[15] N. V. Boulgouris, “Model-based Human Gait Recognition using Fusionof Features,” IEEE International Conference on Acoustics Speech andSignal Processing (2009), pp. 1469–1472, 2009.
[16] H. L. Worapan Kusakunniran, Qiang Wu and J. Zhang1, “Multiple ViewsGait Recognition using View Transformation Model Based on OptimizedGait Energy Image ,” In Proc. 12th IEEE International Conference onComputer Vision, pp. 1058–1064, 2009.
[17] ——, “Support Vector Regression for Multi-View Gait Recognitionbased on Local Motion Feature Selection ,” In Proc. IEEE Conferenceon Computer Vision and pattern Recognition, pp. 974–981, 2010.
[18] ——, “Gait Recognition Under Various Viewing Angles Based onCorrelated Motion Regression ,” IEEE Transaction on Circuits andSystems for Video Technology, vol. 22, no. 6, pp. 966–980, 2012.
[19] H. L. Worapan Kusakunniran, Qiang Wu and J. Zhang, “Cross-viewand Multi-view Gait Recognitions based on View Transformation Modelusing Multi-Layer Perceptron ,” Pattern Recognition Letters, vol. 33,no. 7, pp. 882–889, 2012.
[20] M. Goffredo, I. Bouchrika, J. N. Carter, and M. S. Nixon, “Self-Calibrating View-Invariant Gait Biometrics.” IEEE Transactions onSystems Man and Cybernetics: Part B Cybernetics, vol. 40, no. 4, pp.997–1008, 2010.
[21] N. Liu, J. Lu, and Y. P. Tan, “Joint Subspace Learning for View-InvariantGait Recognition,” IEEE Signal Processing Letters, vol. 18, no. 7, pp.431–434, 2011.
[22] W. Kusakunniran, Q. Wu, J. Zhang, and H. Li, “A New View-InvariantFeature for Cross-View Gait Recognition,” IEEE Transaction on Infor-mation Forensic and Security, vol. 8, no. 10, pp. 1642–1653, 2013.
[23] S. Jia, L. Wang, and X. Li, “View-Invariant Gait Authentication Based onSilhouette Contours Analysis and View Estimation,” IEEE/CAA Journalof Autometica Sinica, vol. 2, no. 2, pp. 226–232, 2015.
[24] T. Y. Z. L. Xianglei Xing, Kejun Wang, “Complete Canonical Correla-tion Analysis With Application to Multi-View Gait Recognition,” PatternRecognition, Elsevier B. V., no. 50, pp. 107–117, 2016.
[25] W. Zeng and C. Wang, “View- Invariant Gait Recognition Via Determin-istic Learning,” Neurocomputing, Elsevier B.V., no. 175, pp. 324–335,2016.
[26] T. T. Sruti Das Choudhury, “Robust View-Invariant Multiscale GaitRecognition ,” Pattern Recognition Letters, vol. 48, no. 3, pp. 798–811,2015.
[27] N. Gkalelis, A. Tefas, and I. Pitas, “Combining Fuzzy Vector Quan-tization with Linear Discriminant Analysis for Continuous HumanMovement Recognition,” IEEE Transactions on Circuits and Systemsfor Video Technology, vol. 18, no. 11, pp. 1511–1521, 2008.
[28] M. Zhu and A. Martinez, “Subclass Discriminant Analysis,” IEEETransactions on Pattern Analysis and Machine Intelligence, vol. 28,no. 8, pp. 1274 –1286, 2006.
[29] N. Karayiannis and P.-I. Pai, “Fuzzy Vector Quantization Algorithmsand Their Application in Image Compression,” IEEE Transactions onImage Processing, vol. 4, no. 9, pp. 1193 –1201, 1995.
[30] A. Iosifidis, N. Nikolaidis, and I. Pitas, “Movement Recognition Ex-ploiting Multi-View Information,” IEEE International Workshop onMultimedia Signal Processing (MMSP), 2010, pp. 427 –431, 2010.
[31] A. Iosifidis, A. Tefas, and I. Pitas, “Person Specific Activity Recognitionusing Fuzzy Learning and Discriminant Analysis,” Euripean SignalProcessing Conference (EUSIPCO), 2011.
[32] A. Iosifidis, A. Tefas, N. Nikolaidis, and I. Pitas, “Multi-view HumanMovement Recognition based on Fuzzy Distances and Linear Discrim-inant Analysis,” Computer Vision and Image Understanding, vol. 116,no. 3, pp. 347 – 360, 2012.
[33] J. Lu, J. Hu, X. Zhou, and Y. Shang, “Activity-based Person Identifi-cation using Sparse Coding and Discriminative Metric Learning,” 20thACM international conference on Multimedia, pp. 1061–1064, 2012.
[34] J. Yang, K. Yu, Y. Gong, and T. Huang, “Linear Spatial Pyramid Match-ing using Sparse Coding for Image Classification,” IEEE Conference onComputer Vision and Pattern Recognition, 2009, pp. 1794–1801, 2009.
[35] H. Lee, A. Battle, R. Raina, and A. Y. Ng, “Efficient Sparse CodingAlgorithms,” Advances in Neural Information Processing Systems, pp.801–808, 2007.
[36] N. Gkalelis, A. Tefas, and I. Pitas, “Human Identification from HumanMovements,” 16th IEEE International Conference on Image Processing(ICIP), 2009, pp. 2585 –2588, 2009.
[37] N. Liu and Y.-P. Tan, “View Invariant Gait Recognition,” IEEE Interna-tional Conference on Acoustics Speech and Signal Processing (ICASSP),pp. 1410–1413, 2010.
[38] S. Zheng, J. Zhang, K. Huang, R. He, and T. Tan, “Robust ViewTransformation Model for Gait Recognition,” 18th IEEE InternationalConference on Image Processing (ICIP), pp. 2073–2076, 2011.
[39] W. Kusakunniran, Q. Wu, J. Zhang, and H. Li, “Gait Recognition UnderVarious Viewing Angles Based on Correlated Motion Regression,” IEEETransactions on Circuits and Systems for Video Technology, vol. 22,no. 6, pp. 966–980, 2012.
[40] S. Zheng, J. Zhang, K. Huang, R. He, and T. Tan, “Robust ViewTransformation Model for Gait Recognition,” International Conferenceon Image Processing(ICIP), 2011.
Sagar Arun More was born in Maharashtra, India.He received B.E. degree in Electronics from theNorth Maharashtra University, Jalgaon, India, in2000 and the M. E. degree in Electronics from SantGadage Baba Amravati University, Amravati, India,in 2008. He is currently pursuing Ph.D. from NorthMaharashtra University Jalgaon. He current researchinterests include image and video processing, bio-metrics.
Pramod Jagan Deore was born in Maharashtra,India. He received the B. E. degree in Electronicsfrom the North Maharashtra University, Jalgaon,India, in 1997.He received the M. E. and Ph.D.degrees from SGGS Institute of Engineering andTechnology, Swami Ramanand Teerth MarathwadaUniversity, Nanded, in 1999 and 2007 respectively.He is Professor of Electronics and Telecommunica-tion Department at the R. C. Patel Institute of Tech-nology, Shirpur, India. His research interests includeInterval arithmetic operations applications in robust
control, Image processing, and Bio-medical signal processing, Microwavecircuits and antennas etc. He has published 40 papers in National/InternationalConferences/Journals and he has Co-authored two books. He is life memberof ISTE.

Live face detection method based on local binary pattern and bandelet
INFOCOMMUNICATIONS JOURNAL
SEPTEMBER 2017 • VOLUME IX • NUMBER 3 17
JOURNAL OF LATEX CLASS FILES, VOL. , NO. , JANUARY 8
[4] L. Wang, H. Ning, T. Tan, and W. Hu, “Fusion of Static and DynamicBody Biometrics for Gait Recognition,” IEEE Transactions on Circuitsand Systems for Video Technology, vol. 14, no. 2, pp. 149–158, 2004.
[5] J. Han and B. Bhanu, “Individual Recognition using Gait Energy Im-age.” IEEE Transactions on Pattern Analysis and Machine Intelligence,vol. 28, no. 2, pp. 316–322, 2006.
[6] S. H. S. Hong, H. L. H. Lee, and E. K. E. Kim, “Fusion of Multiple GaitCycles for Human Identification,” 2009 ICCAS-SICE, pp. 3171–3175,2009.
[7] H. Z. H. Zhang and Z. L. Z. Liu, “Gait Representation and Recogni-tion Using Haar Wavelet and Radon Transform,” WASE InternationalConference on Information Engineering, vol. 1, pp. 83–86, 2009.
[8] T. Amin and D. Hatzinakos, “Wavelet Analysis of Cyclic Human GaitFor Recognition,” Sixteenth International Conference on Digital SignalProcessing, pp. 1–6, 2009.
[9] H. Su and G. Y. Chen, “A New Method of Gait Recognition Independentof View Angle,” International Conference on Machine Learning andCybernetics, ICMLC, vol. 6, pp. 3091–3096, 2010.
[10] K. Moustakas, D. Tzovaras, and G. Stavropoulos, “Gait RecognitionUsing Geometric Features and Soft Biometrics,” IEEE Signal ProcessingLetters, vol. 17, no. 4, pp. 367–370, 2010.
[11] G. M. Imad Rida, Xudong Jiang, “Human Body Part Selection byGroup Lasso of MotionforModel-FreeGaitRecognition ,” IEEE SignalProcessing Letters, vol. 23, no. 1, pp. 154–158, 2016.
[12] S. A. Niyogi and E. H. Adelson, “Analyzing and Recognizing WalkingFigures in XYT,” Conference on Computer Vision and Pattern Recog-nition, CVPR, pp. 469–474, 1994.
[13] D. K. Wagg and M. S. Nixon, “On Automated Model-based Extractionand Analysis of Gait,” Sixth IEEE International Conference on Auto-matic Face and Gesture Recognition, pp. 11–16, 2004.
[14] L. Lee and W. E. L. Grimson, “Gait Analysis for Recognition andClassification,” Proceedings of Fifth IEEE International Conference onAutomatic Face Gesture Recognition, pp. 734–742, 2002.
[15] N. V. Boulgouris, “Model-based Human Gait Recognition using Fusionof Features,” IEEE International Conference on Acoustics Speech andSignal Processing (2009), pp. 1469–1472, 2009.
[16] H. L. Worapan Kusakunniran, Qiang Wu and J. Zhang1, “Multiple ViewsGait Recognition using View Transformation Model Based on OptimizedGait Energy Image ,” In Proc. 12th IEEE International Conference onComputer Vision, pp. 1058–1064, 2009.
[17] ——, “Support Vector Regression for Multi-View Gait Recognitionbased on Local Motion Feature Selection ,” In Proc. IEEE Conferenceon Computer Vision and pattern Recognition, pp. 974–981, 2010.
[18] ——, “Gait Recognition Under Various Viewing Angles Based onCorrelated Motion Regression ,” IEEE Transaction on Circuits andSystems for Video Technology, vol. 22, no. 6, pp. 966–980, 2012.
[19] H. L. Worapan Kusakunniran, Qiang Wu and J. Zhang, “Cross-viewand Multi-view Gait Recognitions based on View Transformation Modelusing Multi-Layer Perceptron ,” Pattern Recognition Letters, vol. 33,no. 7, pp. 882–889, 2012.
[20] M. Goffredo, I. Bouchrika, J. N. Carter, and M. S. Nixon, “Self-Calibrating View-Invariant Gait Biometrics.” IEEE Transactions onSystems Man and Cybernetics: Part B Cybernetics, vol. 40, no. 4, pp.997–1008, 2010.
[21] N. Liu, J. Lu, and Y. P. Tan, “Joint Subspace Learning for View-InvariantGait Recognition,” IEEE Signal Processing Letters, vol. 18, no. 7, pp.431–434, 2011.
[22] W. Kusakunniran, Q. Wu, J. Zhang, and H. Li, “A New View-InvariantFeature for Cross-View Gait Recognition,” IEEE Transaction on Infor-mation Forensic and Security, vol. 8, no. 10, pp. 1642–1653, 2013.
[23] S. Jia, L. Wang, and X. Li, “View-Invariant Gait Authentication Based onSilhouette Contours Analysis and View Estimation,” IEEE/CAA Journalof Autometica Sinica, vol. 2, no. 2, pp. 226–232, 2015.
[24] T. Y. Z. L. Xianglei Xing, Kejun Wang, “Complete Canonical Correla-tion Analysis With Application to Multi-View Gait Recognition,” PatternRecognition, Elsevier B. V., no. 50, pp. 107–117, 2016.
[25] W. Zeng and C. Wang, “View- Invariant Gait Recognition Via Determin-istic Learning,” Neurocomputing, Elsevier B.V., no. 175, pp. 324–335,2016.
[26] T. T. Sruti Das Choudhury, “Robust View-Invariant Multiscale GaitRecognition ,” Pattern Recognition Letters, vol. 48, no. 3, pp. 798–811,2015.
[27] N. Gkalelis, A. Tefas, and I. Pitas, “Combining Fuzzy Vector Quan-tization with Linear Discriminant Analysis for Continuous HumanMovement Recognition,” IEEE Transactions on Circuits and Systemsfor Video Technology, vol. 18, no. 11, pp. 1511–1521, 2008.
[28] M. Zhu and A. Martinez, “Subclass Discriminant Analysis,” IEEETransactions on Pattern Analysis and Machine Intelligence, vol. 28,no. 8, pp. 1274 –1286, 2006.
[29] N. Karayiannis and P.-I. Pai, “Fuzzy Vector Quantization Algorithmsand Their Application in Image Compression,” IEEE Transactions onImage Processing, vol. 4, no. 9, pp. 1193 –1201, 1995.
[30] A. Iosifidis, N. Nikolaidis, and I. Pitas, “Movement Recognition Ex-ploiting Multi-View Information,” IEEE International Workshop onMultimedia Signal Processing (MMSP), 2010, pp. 427 –431, 2010.
[31] A. Iosifidis, A. Tefas, and I. Pitas, “Person Specific Activity Recognitionusing Fuzzy Learning and Discriminant Analysis,” Euripean SignalProcessing Conference (EUSIPCO), 2011.
[32] A. Iosifidis, A. Tefas, N. Nikolaidis, and I. Pitas, “Multi-view HumanMovement Recognition based on Fuzzy Distances and Linear Discrim-inant Analysis,” Computer Vision and Image Understanding, vol. 116,no. 3, pp. 347 – 360, 2012.
[33] J. Lu, J. Hu, X. Zhou, and Y. Shang, “Activity-based Person Identifi-cation using Sparse Coding and Discriminative Metric Learning,” 20thACM international conference on Multimedia, pp. 1061–1064, 2012.
[34] J. Yang, K. Yu, Y. Gong, and T. Huang, “Linear Spatial Pyramid Match-ing using Sparse Coding for Image Classification,” IEEE Conference onComputer Vision and Pattern Recognition, 2009, pp. 1794–1801, 2009.
[35] H. Lee, A. Battle, R. Raina, and A. Y. Ng, “Efficient Sparse CodingAlgorithms,” Advances in Neural Information Processing Systems, pp.801–808, 2007.
[36] N. Gkalelis, A. Tefas, and I. Pitas, “Human Identification from HumanMovements,” 16th IEEE International Conference on Image Processing(ICIP), 2009, pp. 2585 –2588, 2009.
[37] N. Liu and Y.-P. Tan, “View Invariant Gait Recognition,” IEEE Interna-tional Conference on Acoustics Speech and Signal Processing (ICASSP),pp. 1410–1413, 2010.
[38] S. Zheng, J. Zhang, K. Huang, R. He, and T. Tan, “Robust ViewTransformation Model for Gait Recognition,” 18th IEEE InternationalConference on Image Processing (ICIP), pp. 2073–2076, 2011.
[39] W. Kusakunniran, Q. Wu, J. Zhang, and H. Li, “Gait Recognition UnderVarious Viewing Angles Based on Correlated Motion Regression,” IEEETransactions on Circuits and Systems for Video Technology, vol. 22,no. 6, pp. 966–980, 2012.
[40] S. Zheng, J. Zhang, K. Huang, R. He, and T. Tan, “Robust ViewTransformation Model for Gait Recognition,” International Conferenceon Image Processing(ICIP), 2011.
Sagar Arun More was born in Maharashtra, India.He received B.E. degree in Electronics from theNorth Maharashtra University, Jalgaon, India, in2000 and the M. E. degree in Electronics from SantGadage Baba Amravati University, Amravati, India,in 2008. He is currently pursuing Ph.D. from NorthMaharashtra University Jalgaon. He current researchinterests include image and video processing, bio-metrics.
Pramod Jagan Deore was born in Maharashtra,India. He received the B. E. degree in Electronicsfrom the North Maharashtra University, Jalgaon,India, in 1997.He received the M. E. and Ph.D.degrees from SGGS Institute of Engineering andTechnology, Swami Ramanand Teerth MarathwadaUniversity, Nanded, in 1999 and 2007 respectively.He is Professor of Electronics and Telecommunica-tion Department at the R. C. Patel Institute of Tech-nology, Shirpur, India. His research interests includeInterval arithmetic operations applications in robust
control, Image processing, and Bio-medical signal processing, Microwavecircuits and antennas etc. He has published 40 papers in National/InternationalConferences/Journals and he has Co-authored two books. He is life memberof ISTE.
Live Face Detection Method Based on Local Binary Pattern and Bandelet
Haiqing Liu, Shuhua Hao, Yuancheng Li, Xiang Li and Jie Ma
Abstract—Face recognition system is exposed to video replay
attacks and photo spoofing attacks along with the extensive use of identity authentication technology. Spoofing attack happens when an attacker tries to disguise as a legitimate user with permissions to spoof authentication system by replaying the recorded videos of legitimate users or utilizing the printed photos of legitimate users. Inspired by the differences between image acquisition and playback, printing properties, and light emission models, this paper proposes a live face detection method based on local binary pattern and Bandelet. The replayed video images and the printed face images usually contain characteristics that are easy to be detected by texture detection and frequency domain analysis. The proposed method analyzes the differences between live faces and photo faces in texture, at the same time it utilizes Bandelet to analyze face images with multi-scale analysis and extracts the high-frequency sub band coefficients as feature vectors to train Extreme Learning Machine (ELM) to classify and recognize. The algorithm is verified on the public CASIA_FASD, print-attack and replay-attack datasets, well known Face Anti-Spoofing Databases, and the experimental results show that the method reduces the computational complexity and improves the detection accuracy.
Index Terms—liveness detection; Bandelet transform; replay attack; authentication technology
I. INTRODUCTION N recent years, biometric authentication has attracted more and more attention, such as the safety assessment and
vulnerability assessment. As a convenient user authentication technology, face recognition only needs regular cameras and a face detection application, so it has been widely applied to various scenarios under the efforts of many researchers. To give some examples, we can mention entrance guard systems, access security checks, criminal detection, the banking system, etc. However, face recognition system detects human faces through the analysis of the tactic flat images, so the system is easy to be spoofed by replayed videos or printed photos. In a real application scenario, the identity authentication system mainly faces three common spoofing methods [1].
1) Photo spoofing [2]: It is one of the most convenient
This work was supported in part by the Scientific Research Foundation
for the Returned Overseas Chinese Scholars, State Education Ministry ([2013]693).
All the authors come from the school of Control and Computer Engineering in North China Electric Power University.
Haiqing Liu (email: [email protected]), Shuhua Hao (email: [email protected] (new), [email protected] (old)) . Yuancheng Li (Corresponding author, Email: [email protected]).
spoofing methods to access the photos of legitimate users. The spoofer bends and rotates the printed photos in front of image acquisition devices to simulate the real legitimate users, which can spoof the authentication system.
2) Video spoofing [3]: The video of legitimate users is a more threatening spoofing tool, and it can be acquired by the secret cameras. Compared with photos, videos have characteristics of head movements, facial expressions, blink, etc. and their effects are similar to the real human faces.
3) 3D model spoofing: Make a 3D model for the human faces of legitimate users, which can simulate the blink, talking, head movements of real people [2-4]. Compared with the photo spoofing and video spoofing, 3D model spoofing is more threatening, but forging the live 3D model is more difficult. So, photo spoofing and video spoofing are the most used methods of identity authentication spoofing.
In this paper, our goal is to use a better algorithm to distinguish between real and fake faces. We propose a novel live face detection method, based on local binary pattern and Bandelet that extracts texture features from living bodies and photos, and then trains ELM classifier to identify authenticity. Finally, the result is verified on the public CASIA_FASD database, print-attack and replay-attack databases. Our experimental results show that the proposed algorithm performs well on all datasets.
The contribution of this article can be summarized as follows. We proposed a fusion method of LBP and Bandelet algorithm for countering spoof attacks in face recognition. We optimize the basic LBP and Bandelet algorithm to extract the features from face image respectively. Then we fuse the features and put them into the ELM classifier for training and learning. Our method finally is verified and evaluated on public CASIA-FASD, print-attack and replay-attack datasets, and the results show that the proposed approach outperforms the other methods in spoof detection.
The rest of this paper is organized as follows: Section II presents related works about face spoofing detection. Section III introduces the details of our live face detection method, the local binary pattern, Bandelet decomposition, and the ELM classifier. Section IV shows our experimental results. Finally, we conclude the paper in section V.
II. RELATED WORKS Currently, many scholars in China and the rest of the world
are committed to the study of the liveness detection problem, and there are already many live detection methods that are presented in the international conferences and journal articles. Presently, the live detection methods applied to face recognition mainly include the following categories:
Live Face Detection Method Based on Local Binary Pattern and Bandelet
Haiqing Liu, Shuhua Hao, Yuancheng Li*
I
Abstract—Face recognition system is exposed to video replay
attacks and photo spoofing attacks along with the extensive use of identity authentication technology. Spoofing attack happens when an attacker tries to disguise as a legitimate user with permissions to spoof authentication system by replaying the recorded videos of legitimate users or utilizing the printed photos of legitimate users. Inspired by the differences between image acquisition and playback, printing properties, and light emission models, this paper proposes a live face detection method based on local binary pattern and Bandelet. The replayed video images and the printed face images usually contain characteristics that are easy to be detected by texture detection and frequency domain analysis. The proposed method analyzes the differences between live faces and photo faces in texture, at the same time it utilizes Bandelet to analyze face images with multi-scale analysis and extracts the high-frequency sub band coefficients as feature vectors to train Extreme Learning Machine (ELM) to classify and recognize. The algorithm is verified on the public CASIA_FASD, print-attack and replay-attack datasets, well known Face Anti-Spoofing Databases, and the experimental results show that the method reduces the computational complexity and improves the detection accuracy.
Index Terms—liveness detection; Bandelet transform; replay attack; authentication technology
I. INTRODUCTION N recent years, biometric authentication has attracted more and more attention, such as the safety assessment and
vulnerability assessment. As a convenient user authentication technology, face recognition only needs regular cameras and a face detection application, so it has been widely applied to various scenarios under the efforts of many researchers. To give some examples, we can mention entrance guard systems, access security checks, criminal detection, the banking system, etc. However, face recognition system detects human faces through the analysis of the tactic flat images, so the system is easy to be spoofed by replayed videos or printed photos. In a real application scenario, the identity authentication system mainly faces three common spoofing methods [1].
1) Photo spoofing [2]: It is one of the most convenient
This work was supported in part by the Scientific Research Foundation
for the Returned Overseas Chinese Scholars, State Education Ministry ([2013]693).
All the authors come from the school of Control and Computer Engineering in North China Electric Power University.
Haiqing Liu (email: [email protected]), Shuhua Hao (email: [email protected] (new), [email protected] (old)) . Yuancheng Li (Corresponding author, Email: [email protected]).
spoofing methods to access the photos of legitimate users. The spoofer bends and rotates the printed photos in front of image acquisition devices to simulate the real legitimate users, which can spoof the authentication system.
2) Video spoofing [3]: The video of legitimate users is a more threatening spoofing tool, and it can be acquired by the secret cameras. Compared with photos, videos have characteristics of head movements, facial expressions, blink, etc. and their effects are similar to the real human faces.
3) 3D model spoofing: Make a 3D model for the human faces of legitimate users, which can simulate the blink, talking, head movements of real people [2-4]. Compared with the photo spoofing and video spoofing, 3D model spoofing is more threatening, but forging the live 3D model is more difficult. So, photo spoofing and video spoofing are the most used methods of identity authentication spoofing.
In this paper, our goal is to use a better algorithm to distinguish between real and fake faces. We propose a novel live face detection method, based on local binary pattern and Bandelet that extracts texture features from living bodies and photos, and then trains ELM classifier to identify authenticity. Finally, the result is verified on the public CASIA_FASD database, print-attack and replay-attack databases. Our experimental results show that the proposed algorithm performs well on all datasets.
The contribution of this article can be summarized as follows. We proposed a fusion method of LBP and Bandelet algorithm for countering spoof attacks in face recognition. We optimize the basic LBP and Bandelet algorithm to extract the features from face image respectively. Then we fuse the features and put them into the ELM classifier for training and learning. Our method finally is verified and evaluated on public CASIA-FASD, print-attack and replay-attack datasets, and the results show that the proposed approach outperforms the other methods in spoof detection.
The rest of this paper is organized as follows: Section II presents related works about face spoofing detection. Section III introduces the details of our live face detection method, the local binary pattern, Bandelet decomposition, and the ELM classifier. Section IV shows our experimental results. Finally, we conclude the paper in section V.
II. RELATED WORKS Currently, many scholars in China and the rest of the world
are committed to the study of the liveness detection problem, and there are already many live detection methods that are presented in the international conferences and journal articles. Presently, the live detection methods applied to face recognition mainly include the following categories:
Live Face Detection Method Based on Local Binary Pattern and Bandelet
Haiqing Liu, Shuhua Hao, Yuancheng Li*
I IN recent years, biometric authentication has attracted more and more attention, such as the safety assessment and
vulnerability assessment. As a convenient user authentication technology, face recognition only needs regular cameras and a face detection application, so it has been widely applied to various scenarios under the efforts of many researchers. To give some examples, we can mention entrance guard systems, access security checks, criminal detection, the banking system, etc. However, face recognition system detects human faces through the analysis of the tactic flat images, so the system is easy to be spoofed by replayed videos or printed photos. In a real application scenario, the identity authentication system mainly faces three common spoofing methods [1]. 1) Photo spoofing [2]: It is one of the most convenient spoofing methods to access the photos of legitimate users. The spoofer bends and rotates the printed photos in front of
Abstract —Face recognition system is exposed to video replay attacks and photo spoofing attacks along with the extensive use of identity authentication technology. Spoofing attack happens when an attacker tries to disguise as a legitimate user with permissions to spoof authentication system by replaying the recorded videos of legitimate users or utilizing the printed photos of legitimate users. Inspired by the differences between image acquisition and playback, printing properties, and light emission models, this paper proposes a live face detection method based on local binary pattern and Bandelet. The replayed video images and the printed face images usually contain characteristics that are easy to be detected by texture detection and frequency domain analysis. The proposed method analyzes the differences between live faces and photo faces in texture, at the same time it utilizes Bandelet to analyze face images with multi-scale analysis and extracts the high-frequency sub band coefficients as feature vectors to train Extreme Learning Machine (ELM) to classify and recognize. The algorithm is verified on the public CASIA_FASD, print-attack and replay-attack datasets, well known Face Anti-Spoofing Databases, and the experimental results show that the method reduces the computational complexity and improves the detection accuracy.
Index Terms—liveness detection; Bandelet transform; replay attack; authentication technology
I. IntroductIon
Abstract—Face recognition system is exposed to video replay
attacks and photo spoofing attacks along with the extensive use of identity authentication technology. Spoofing attack happens when an attacker tries to disguise as a legitimate user with permissions to spoof authentication system by replaying the recorded videos of legitimate users or utilizing the printed photos of legitimate users. Inspired by the differences between image acquisition and playback, printing properties, and light emission models, this paper proposes a live face detection method based on local binary pattern and Bandelet. The replayed video images and the printed face images usually contain characteristics that are easy to be detected by texture detection and frequency domain analysis. The proposed method analyzes the differences between live faces and photo faces in texture, at the same time it utilizes Bandelet to analyze face images with multi-scale analysis and extracts the high-frequency sub band coefficients as feature vectors to train Extreme Learning Machine (ELM) to classify and recognize. The algorithm is verified on the public CASIA_FASD, print-attack and replay-attack datasets, well known Face Anti-Spoofing Databases, and the experimental results show that the method reduces the computational complexity and improves the detection accuracy.
Index Terms—liveness detection; Bandelet transform; replay attack; authentication technology
I. INTRODUCTION N recent years, biometric authentication has attracted more and more attention, such as the safety assessment and
vulnerability assessment. As a convenient user authentication technology, face recognition only needs regular cameras and a face detection application, so it has been widely applied to various scenarios under the efforts of many researchers. To give some examples, we can mention entrance guard systems, access security checks, criminal detection, the banking system, etc. However, face recognition system detects human faces through the analysis of the tactic flat images, so the system is easy to be spoofed by replayed videos or printed photos. In a real application scenario, the identity authentication system mainly faces three common spoofing methods [1].
1) Photo spoofing [2]: It is one of the most convenient
This work was supported in part by the Scientific Research Foundation
for the Returned Overseas Chinese Scholars, State Education Ministry ([2013]693).
All the authors come from the school of Control and Computer Engineering in North China Electric Power University.
Haiqing Liu (email: [email protected]), Shuhua Hao (email: [email protected] (new), [email protected] (old)) . Yuancheng Li (Corresponding author, Email: [email protected]).
spoofing methods to access the photos of legitimate users. The spoofer bends and rotates the printed photos in front of image acquisition devices to simulate the real legitimate users, which can spoof the authentication system.
2) Video spoofing [3]: The video of legitimate users is a more threatening spoofing tool, and it can be acquired by the secret cameras. Compared with photos, videos have characteristics of head movements, facial expressions, blink, etc. and their effects are similar to the real human faces.
3) 3D model spoofing: Make a 3D model for the human faces of legitimate users, which can simulate the blink, talking, head movements of real people [2-4]. Compared with the photo spoofing and video spoofing, 3D model spoofing is more threatening, but forging the live 3D model is more difficult. So, photo spoofing and video spoofing are the most used methods of identity authentication spoofing.
In this paper, our goal is to use a better algorithm to distinguish between real and fake faces. We propose a novel live face detection method, based on local binary pattern and Bandelet that extracts texture features from living bodies and photos, and then trains ELM classifier to identify authenticity. Finally, the result is verified on the public CASIA_FASD database, print-attack and replay-attack databases. Our experimental results show that the proposed algorithm performs well on all datasets.
The contribution of this article can be summarized as follows. We proposed a fusion method of LBP and Bandelet algorithm for countering spoof attacks in face recognition. We optimize the basic LBP and Bandelet algorithm to extract the features from face image respectively. Then we fuse the features and put them into the ELM classifier for training and learning. Our method finally is verified and evaluated on public CASIA-FASD, print-attack and replay-attack datasets, and the results show that the proposed approach outperforms the other methods in spoof detection.
The rest of this paper is organized as follows: Section II presents related works about face spoofing detection. Section III introduces the details of our live face detection method, the local binary pattern, Bandelet decomposition, and the ELM classifier. Section IV shows our experimental results. Finally, we conclude the paper in section V.
II. RELATED WORKS Currently, many scholars in China and the rest of the world
are committed to the study of the liveness detection problem, and there are already many live detection methods that are presented in the international conferences and journal articles. Presently, the live detection methods applied to face recognition mainly include the following categories:
Live Face Detection Method Based on Local Binary Pattern and Bandelet
Haiqing Liu, Shuhua Hao, Yuancheng Li*
I

Live face detection method based on local binary pattern and bandelet
SEPTEMBER 2017 • VOLUME IX • NUMBER 318
INFOCOMMUNICATIONS JOURNAL
A. Image quality analysis based methods As an example of image quality analysis method, D. Gong
et al. proposed a new feature descriptor called common encoding model for heterogeneous face recognition, which is able to capture common discriminant information, such as the large modality gap [5]. I. Kim proposed a novel approach to robustly find the spoofing faces using the highlight removal effect, which is based on the reflection information. Because the spoofed face image is recaptured by a camera, it has additional light information [6]. D. Wen et al. proposed an efficient and rather robust face spoof detection algorithm based on image distortion analysis (IDA). Four different features (specular reflection, blurriness, chromatic moment, and color diversity) are extracted to form the IDA feature vector [7]. M. Uzair et al. proposed a hyperspectral face recognition algorithm using a spatiospectral covariance for band fusion and partial least square regression for classification. Moreover, they extended 13 existing face recognition techniques, for the first time, to perform hyperspectral face recognition [8]. Galbally et al. extracted 25 features from an image such as peak signal-to-noise ratio and structural similarity index to detect subtle image quality [9]. Karubgaru et al. solved the feature extracted method by "increasing" the data available from the original image using several preprocesses, such as, image mirroring, colour and edges information [10].
B. Move option based methods Shervin et al. proposed a multiscale dynamic texture
descriptor based on binarized statistical image features on three orthogonal planes (MBSIF-TOP) that is effective in detecting spoofing attacks and showing promising performances compared with existing alternatives [11]. Pan et al. have conducted live detection by blink actions [12]. Santosh T et al. have proposed a classification pipeline consisting of DMD, local binary patterns (LBPs), and support vector machines (SVMs) with a histogram intersection kernel. A unique property of DMD is its ability to conveniently represent the temporal information of the entire video as a single image with the same dimensions as those images contained in the video [13]. W. Yin et al. explored the issue of face anti-spoofing with good performance in accuracy by utilizing optical flow vector on two types of attacks: photos and videos shown on high-resolution electronic screens. The key idea is to calculate the displacement of the optical flow vector between two successive frames of a face video and obtain a displacement sum of a certain number of frames [14]. Many scholars were studying video sequences and dynamic descriptors that were extracted from video sequences [15-16]. Besides, Zhang Yu et al. improved the Piecewise Aggregate Approximation (PAA) method, and proposed a Hierarchical Clustering technique (HC-PAA) [17].
C. Texture based methods N. Werghi et al. presented a novel approach for fusing
shape and texture local binary patterns (LBPs) on a mesh for 3D face recognition. Using a recently proposed framework, they computed LBP directly on the face mesh surface, then they construct a grid of the regions on the facial surface that can accommodate global and partial descriptions [18]. K.
Patel et al. analyzed the image distortion of the print and replay attacks using different: 1) intensity channels (R, G, B, and grayscale); 2) image regions (entire image, detected face, or facial component between nose and chin); and 3) feature descriptors. They developed an efficient face spoof detection system on an Android smartphone. Their studies of Android face spoof detection system involving 20 participants showed that the proposed approach worked very well in real application scenarios [19]. Pereira et al. applied a local binary pattern (LBP) to the X-Y,X-T and Y-T dimensions to analyze the texture of time and space [20]. T. Edmunds et al. proposed an original approach was that the fake face detection process occurs after the face identification process. Having access to enrollment data of each client, it becomes possible to estimate the exposure transformation between a test sample and its enrollment counterpart [21].
Table I Comparative of different face spoof detection methods
Type Mechanism Strengths Limitations Image quality analysis [5-10]
Image quality analysis of different attack image
Good generalization ability Fast response
Different classifiers needed for different spoof attacks
Move option [11-17]
Get the dynamic description in the video sequence
Good generalization ability
Slow response High computational complexity
Texture [18-21]
Analyze image static texture information
Fast response Low computational complexity
Vulnerable to the variations in acquisition conditions
Although much work has been directed towards tackling
issues related to face spoofing detection, there is still significant room for improvement for anti-spoofing methods in face recognition [22]. Table I shows some advantages and disadvantages of the three methods listed in this article. In this paper, we proposed live face detection method based on local binary pattern and Bandelet. This method doesn’t need users’ active cooperation, so it has certain concealment. At the same time, the dimensions of extracted features are not high, while it reduces the time and the algorithm complexity.
III. LIVE FACE DETECTION METHOD BASED ON MULTISCALE ANALYSIS
It could be very difficult for us to distinguish the live faces in the photos accurately with our eyes, as shown in Figure I. In fact, live faces are complicated non-rigid 3D objects, while photo faces or video faces are flat rigid objects, so they can differ in light reflection and shadow. Photo faces usually contain the defects of printing quality, and this difference can be detected well by utilizing texture details.
A. Local Binary Pattern Local binary pattern is a kind of operator used to describe
the local texture features of images. Obviously, its function is feature extraction, and the extracted features are the texture features of images and they are local texture features. As show in Figure II, the original LBP operator is defined in the window of 3x3 pixels. The window’s center pixel is regarded as a threshold and is compared with the grey values of eight adjacent pixels. If the surrounding pixel value is greater than

Live face detection method based on local binary pattern and bandelet
INFOCOMMUNICATIONS JOURNAL
SEPTEMBER 2017 • VOLUME IX • NUMBER 3 19
(a)
(b)
(c)
Figure I. Live faces in the CASIA database (a), photo faces (b) and video faces (c).
the center pixel value, then the position of this pixel is marked as 1, otherwise is marked as 0. In this case, eight points in a 3x3 window can produce an 8-bit unsigned number, and then the LBP value of this window can be obtained to reflect the texture information of this area.
After the original LBP was brought up, researchers increasingly proposed various improvements and optimizations to get an LBP operator where there are P sampling points in the circular area with R in radius: LBP
uniform pattern, LBP rotation invariant pattern, LBP equivalent pattern, etc.
Figure II. The processing of LBP
Apparently, the above extracted LBP operator can get an LBP code in each pixel. Then, the obtained original LBP features are still an image after extracting the original LBP operator from an image. However, the objects in this image have been converted to secondary features, which cannot be directly applied to the discriminant analysis. We can see that this feature is closely relevant to the position information from the above analysis. So it can have a considerable deviation due to non-aligned positions if we directly conduct discriminant analysis on this feature of two images. Later, the researchers found that an image can be divided into several sub areas and LBP features are extracted from each pixel in each sub area, and then, statistical histograms of LBP features are established in each sub area. In this way, each sub area can be described by a statistical histogram. The whole image is composed of several statistical histograms. For example, an image with 100x100 pixels is divided into 100 sub areas with 10x10 pixels, and the size of each sub area is 10x10 pixels. LBP features are extracted from each pixel in each sub area, and then, statistical histograms are established. In this way, the image has 10x10 sub areas and 10x10 statistical histograms. This image can be described by these 10x10 statistical histograms. After that, we can judge the similarity between two images by various similarity measure functions.
At present, the LBP local texture extraction operator has been successfully applied to fingerprint recognition, character recognition, face recognition, license plate recognition and other fields.
B. Bandelet Decomposition The main idea of constructing Bandelet transform [23] is to
define geometric features in images as a vector field, rather than a set of common edges. And the vector field denotes the local regularity direction of gray value variations in an image spatial structure. Bandelet base is not predetermined, and it is chosen according to the optimization of final application results. A. Lutz et al. proposed the quick search method of the optimal base in Bandelet variation.
For geometric regularity images, geometric flows are parallel within a local scope. The wavelet transform is essentially the convolution of wavelet function and the original image, and the wavelet function can be regarded as the fuzzy kernel in this sense, so wavelet transform has a smoothing effect on the original image. This smoothing effect makes the image to has the regularity of direction that is vertical with the geometric flow, and it makes that the positioning of geometric flow doesn’t need to be strictly
A. Image quality analysis based methods As an example of image quality analysis method, D. Gong
et al. proposed a new feature descriptor called common encoding model for heterogeneous face recognition, which is able to capture common discriminant information, such as the large modality gap [5]. I. Kim proposed a novel approach to robustly find the spoofing faces using the highlight removal effect, which is based on the reflection information. Because the spoofed face image is recaptured by a camera, it has additional light information [6]. D. Wen et al. proposed an efficient and rather robust face spoof detection algorithm based on image distortion analysis (IDA). Four different features (specular reflection, blurriness, chromatic moment, and color diversity) are extracted to form the IDA feature vector [7]. M. Uzair et al. proposed a hyperspectral face recognition algorithm using a spatiospectral covariance for band fusion and partial least square regression for classification. Moreover, they extended 13 existing face recognition techniques, for the first time, to perform hyperspectral face recognition [8]. Galbally et al. extracted 25 features from an image such as peak signal-to-noise ratio and structural similarity index to detect subtle image quality [9]. Karubgaru et al. solved the feature extracted method by "increasing" the data available from the original image using several preprocesses, such as, image mirroring, colour and edges information [10].
B. Move option based methods Shervin et al. proposed a multiscale dynamic texture
descriptor based on binarized statistical image features on three orthogonal planes (MBSIF-TOP) that is effective in detecting spoofing attacks and showing promising performances compared with existing alternatives [11]. Pan et al. have conducted live detection by blink actions [12]. Santosh T et al. have proposed a classification pipeline consisting of DMD, local binary patterns (LBPs), and support vector machines (SVMs) with a histogram intersection kernel. A unique property of DMD is its ability to conveniently represent the temporal information of the entire video as a single image with the same dimensions as those images contained in the video [13]. W. Yin et al. explored the issue of face anti-spoofing with good performance in accuracy by utilizing optical flow vector on two types of attacks: photos and videos shown on high-resolution electronic screens. The key idea is to calculate the displacement of the optical flow vector between two successive frames of a face video and obtain a displacement sum of a certain number of frames [14]. Many scholars were studying video sequences and dynamic descriptors that were extracted from video sequences [15-16]. Besides, Zhang Yu et al. improved the Piecewise Aggregate Approximation (PAA) method, and proposed a Hierarchical Clustering technique (HC-PAA) [17].
C. Texture based methods N. Werghi et al. presented a novel approach for fusing
shape and texture local binary patterns (LBPs) on a mesh for 3D face recognition. Using a recently proposed framework, they computed LBP directly on the face mesh surface, then they construct a grid of the regions on the facial surface that can accommodate global and partial descriptions [18]. K.
Patel et al. analyzed the image distortion of the print and replay attacks using different: 1) intensity channels (R, G, B, and grayscale); 2) image regions (entire image, detected face, or facial component between nose and chin); and 3) feature descriptors. They developed an efficient face spoof detection system on an Android smartphone. Their studies of Android face spoof detection system involving 20 participants showed that the proposed approach worked very well in real application scenarios [19]. Pereira et al. applied a local binary pattern (LBP) to the X-Y,X-T and Y-T dimensions to analyze the texture of time and space [20]. T. Edmunds et al. proposed an original approach was that the fake face detection process occurs after the face identification process. Having access to enrollment data of each client, it becomes possible to estimate the exposure transformation between a test sample and its enrollment counterpart [21].
Table I Comparative of different face spoof detection methods
Type Mechanism Strengths Limitations Image quality analysis [5-10]
Image quality analysis of different attack image
Good generalization ability Fast response
Different classifiers needed for different spoof attacks
Move option [11-17]
Get the dynamic description in the video sequence
Good generalization ability
Slow response High computational complexity
Texture [18-21]
Analyze image static texture information
Fast response Low computational complexity
Vulnerable to the variations in acquisition conditions
Although much work has been directed towards tackling
issues related to face spoofing detection, there is still significant room for improvement for anti-spoofing methods in face recognition [22]. Table I shows some advantages and disadvantages of the three methods listed in this article. In this paper, we proposed live face detection method based on local binary pattern and Bandelet. This method doesn’t need users’ active cooperation, so it has certain concealment. At the same time, the dimensions of extracted features are not high, while it reduces the time and the algorithm complexity.
III. LIVE FACE DETECTION METHOD BASED ON MULTISCALE ANALYSIS
It could be very difficult for us to distinguish the live faces in the photos accurately with our eyes, as shown in Figure I. In fact, live faces are complicated non-rigid 3D objects, while photo faces or video faces are flat rigid objects, so they can differ in light reflection and shadow. Photo faces usually contain the defects of printing quality, and this difference can be detected well by utilizing texture details.
A. Local Binary Pattern Local binary pattern is a kind of operator used to describe
the local texture features of images. Obviously, its function is feature extraction, and the extracted features are the texture features of images and they are local texture features. As show in Figure II, the original LBP operator is defined in the window of 3x3 pixels. The window’s center pixel is regarded as a threshold and is compared with the grey values of eight adjacent pixels. If the surrounding pixel value is greater than
(a)
(b)
(c)
Figure I. Live faces in the CASIA database (a), photo faces (b) and video faces (c).
the center pixel value, then the position of this pixel is marked as 1, otherwise is marked as 0. In this case, eight points in a 3x3 window can produce an 8-bit unsigned number, and then the LBP value of this window can be obtained to reflect the texture information of this area.
After the original LBP was brought up, researchers increasingly proposed various improvements and optimizations to get an LBP operator where there are P sampling points in the circular area with R in radius: LBP
uniform pattern, LBP rotation invariant pattern, LBP equivalent pattern, etc.
Figure II. The processing of LBP
Apparently, the above extracted LBP operator can get an LBP code in each pixel. Then, the obtained original LBP features are still an image after extracting the original LBP operator from an image. However, the objects in this image have been converted to secondary features, which cannot be directly applied to the discriminant analysis. We can see that this feature is closely relevant to the position information from the above analysis. So it can have a considerable deviation due to non-aligned positions if we directly conduct discriminant analysis on this feature of two images. Later, the researchers found that an image can be divided into several sub areas and LBP features are extracted from each pixel in each sub area, and then, statistical histograms of LBP features are established in each sub area. In this way, each sub area can be described by a statistical histogram. The whole image is composed of several statistical histograms. For example, an image with 100x100 pixels is divided into 100 sub areas with 10x10 pixels, and the size of each sub area is 10x10 pixels. LBP features are extracted from each pixel in each sub area, and then, statistical histograms are established. In this way, the image has 10x10 sub areas and 10x10 statistical histograms. This image can be described by these 10x10 statistical histograms. After that, we can judge the similarity between two images by various similarity measure functions.
At present, the LBP local texture extraction operator has been successfully applied to fingerprint recognition, character recognition, face recognition, license plate recognition and other fields.
B. Bandelet Decomposition The main idea of constructing Bandelet transform [23] is to
define geometric features in images as a vector field, rather than a set of common edges. And the vector field denotes the local regularity direction of gray value variations in an image spatial structure. Bandelet base is not predetermined, and it is chosen according to the optimization of final application results. A. Lutz et al. proposed the quick search method of the optimal base in Bandelet variation.
For geometric regularity images, geometric flows are parallel within a local scope. The wavelet transform is essentially the convolution of wavelet function and the original image, and the wavelet function can be regarded as the fuzzy kernel in this sense, so wavelet transform has a smoothing effect on the original image. This smoothing effect makes the image to has the regularity of direction that is vertical with the geometric flow, and it makes that the positioning of geometric flow doesn’t need to be strictly
Local binary pattern is a kind of operator used to describe the local texture features of images. Obviously, its function is feature extraction, and the extracted features are the texture features of images and they are local texture features. As show in Figure II, the original LBP operator is defined in the window of 3x3 pixels. The window’s center pixel is regarded as a threshold and is compared with the grey values of eight adjacent pixels. If the surrounding pixel value is greater than the center pixel value, then the position of this pixel is marked as 1, otherwise is marked as 0. In this case, eight points in a
3x3 window can produce an 8-bit unsigned number, and then the LBP value of this window can be obtained to reflect the texture information of this area. After the original LBP was brought up, researchers increasingly proposed various improvements and optimizations to get an LBP operator where there are P sampling points in the circular area with R in radius: LBP uniform pattern, LBP rotation invariant pattern, LBP equivalent pattern, etc.
Apparently, the above extracted LBP operator can get an LBP code in each pixel. Then, the obtained original LBP features are still an image after extracting the original LBP operator from an image. However, the objects in this image have been converted to secondary features, which cannot be directly applied to the discriminant analysis. We can see that this feature is closely relevant to the position information from the above analysis. So it can have a considerable deviation due to non-aligned positions if we directly conduct discriminant analysis on this feature of two images. Later, the researchers found that an image can be divided into several sub areas and LBP features are extracted from each pixel in each sub area, and then, statistical histograms of LBP features are established in each sub area. In this way, each sub area can be described by a statistical histogram. The whole image is composed of several statistical histograms. For example, an image with 100x100 pixels is divided into 100 sub areas with 10x10 pixels, and the size of each sub area is 10x10 pixels. LBP features are extracted from each pixel in each sub area, and then, statistical histograms are established. In this way, the image has 10x10 sub areas and 10x10 statistical histograms. This image can be described by these 10x10 statistical histograms. After that, we can judge the similarity between two images by various similarity measure functions. At present, the LBP local texture extraction operator has been successfully applied to fingerprint recognition, character recognition, face recognition, license plate recognition and other fields.
(a)
(b)
(c)
Figure I. Live faces in the CASIA database (a), photo faces (b) and video faces (c).
the center pixel value, then the position of this pixel is marked as 1, otherwise is marked as 0. In this case, eight points in a 3x3 window can produce an 8-bit unsigned number, and then the LBP value of this window can be obtained to reflect the texture information of this area.
After the original LBP was brought up, researchers increasingly proposed various improvements and optimizations to get an LBP operator where there are P sampling points in the circular area with R in radius: LBP
uniform pattern, LBP rotation invariant pattern, LBP equivalent pattern, etc.
Figure II. The processing of LBP
Apparently, the above extracted LBP operator can get an LBP code in each pixel. Then, the obtained original LBP features are still an image after extracting the original LBP operator from an image. However, the objects in this image have been converted to secondary features, which cannot be directly applied to the discriminant analysis. We can see that this feature is closely relevant to the position information from the above analysis. So it can have a considerable deviation due to non-aligned positions if we directly conduct discriminant analysis on this feature of two images. Later, the researchers found that an image can be divided into several sub areas and LBP features are extracted from each pixel in each sub area, and then, statistical histograms of LBP features are established in each sub area. In this way, each sub area can be described by a statistical histogram. The whole image is composed of several statistical histograms. For example, an image with 100x100 pixels is divided into 100 sub areas with 10x10 pixels, and the size of each sub area is 10x10 pixels. LBP features are extracted from each pixel in each sub area, and then, statistical histograms are established. In this way, the image has 10x10 sub areas and 10x10 statistical histograms. This image can be described by these 10x10 statistical histograms. After that, we can judge the similarity between two images by various similarity measure functions.
At present, the LBP local texture extraction operator has been successfully applied to fingerprint recognition, character recognition, face recognition, license plate recognition and other fields.
B. Bandelet Decomposition The main idea of constructing Bandelet transform [23] is to
define geometric features in images as a vector field, rather than a set of common edges. And the vector field denotes the local regularity direction of gray value variations in an image spatial structure. Bandelet base is not predetermined, and it is chosen according to the optimization of final application results. A. Lutz et al. proposed the quick search method of the optimal base in Bandelet variation.
For geometric regularity images, geometric flows are parallel within a local scope. The wavelet transform is essentially the convolution of wavelet function and the original image, and the wavelet function can be regarded as the fuzzy kernel in this sense, so wavelet transform has a smoothing effect on the original image. This smoothing effect makes the image to has the regularity of direction that is vertical with the geometric flow, and it makes that the positioning of geometric flow doesn’t need to be strictly

Live face detection method based on local binary pattern and bandelet
accurate, being allowed to have a certain deviation. In view of the difficulties of accurate positioning of image edge line, this regularity makes it convenient to position geometric flow rapidly.
Image segmentation adopts the binary segmentation method which Donoho adopted in wedgelet. Firstly, a square image is equally divided into 4 sub areas, and then, each sub area is equally divided into 4 sub areas in the next layer of segmentation, until the size of sub areas at the bottom layer reaches the minimum preset. The segmentation result can be shown by quadtree; each sub area corresponds to one node of the quadtree, as shown in Figure III. When the width of an image is 1, and the width of the sub area is (1/2)-n, the depth of the quadtree node corresponding to the sub area is n.
20
21 22
23
6
4
29
28
30
124
125 126
127
64
20 21 22 23 28 29 30
124 125 126 127
Figure III. Binary tree decomposition diagram
C. The Proposed Live Face Detection Method As for texture feature detection, this paper proposes a live
face detection method based on LBP and Bandelet to solve this problem. The flowchart of this method is shown in Figure IV.
Step 1 Convert the face image to be detected into a grayscale image, remove the redundant color information and keep the texture information.
Step 2 Extract the local binary pattern features and statistical features of high-frequency coefficients in Bandelet transform from the converted grayscale image.
The process of getting local binary pattern features is:
1) Divide the detected window into several sub areas (for example, the size of every sub area is 16x16 pixels). 2) Compare every pixel in the sub areas with its eight neighborhood pixels (upper left, left middle, lower left, upper right, etc.), which can be carried out in accordance with the clockwise or counter-clockwise order. 3) If the surrounding pixel value is greater than the center pixel value, then the position of this pixel is marked as 1, otherwise, is marked as 0. In this case, an 8-bit binary number is obtained and converted to a decimal number to be as the feature of this area. 4) Establish histograms for every sub area. 5) At this time, the histograms can be normalized. 6) Have all the histograms of sub areas connected in series, and then the features of the detected window are obtained.
The detected face image
Converted into grayscale image
Grayscale compression Bandelet decomposition
Extract LBP features Extract high-frequency coefficients
Features fusion
ELM cassification detection
Whether Live Face
Figure IV. Flowchart of live face detection method based on LBP and
Bandelet.
The process of getting statistical features of high-frequency coefficients in Bandelet transform is: 1) Input: grayscale image, quantization threshold T. 2) Conduct 2D wavelet transform on the image, orthogonal
and biorthogonal wavelet transform can be used. 3) Establish quadtree segmentation for each sub band
respectively, and get the best geometric flow directions of segmentation areas.
4) Conduct Bandelet transforms on each Bandelet area and get Bandelet coefficients.
5) Arrange Bandelet coefficients into matrix form according to a particular way.
6) Output: quadtree, the best geometric flow direction, Bandelet coefficients.
D. Extreme Learning Machine We have conducted a statistical analysis and classification
of the above two kinds of features. In this paper, basic ELM is adopted as the classifier. ELM, proposed by Guangbin Huang [24], is an algorithm to solve the single hidden layer neural networks. Under the condition of ensuring learning accuracy, the most obvious feature of ELM is to run faster than traditional learning algorithms for the traditional neural networks, especially for single-hidden layer feed forward neural networks (SLFN). ELM is a new type of fast learning algorithm, for the single-hidden layer neural network, and it can initialize the input weights and bias randomly to get the corresponded output weights.
For a single hidden layer neural network (as shown in Fig. 3), assume that there are N random samples ),( i itX ,
where mTimiii
nTniiii RttttRwxxX ,,,,],,,[ 21,2,1, . n is the
dimension of each feature vector X and m is the length of output vector t(m is 1 here because face detection is a binary
SEPTEMBER 2017 • VOLUME IX • NUMBER 320
INFOCOMMUNICATIONS JOURNAL
For geometric regularity images, geometric flows are parallel within a local scope. The wavelet transform is essentially the convolution of wavelet function and the original image, and the wavelet function can be regarded as the fuzzy kernel in this sense, so wavelet transform has a smoothing effect on the original image. This smoothing effect makes the image to has the regularity of direction that is vertical with the geometric flow, and it makes that the positioning of geometric flow doesn’t need to be strictly accurate, being allowed to have a certain deviation. In view of the difficulties of accurate positioning of image edge line, this regularity makes it convenient to position geometric flow rapidly.

Live face detection method based on local binary pattern and bandelet
accurate, being allowed to have a certain deviation. In view of the difficulties of accurate positioning of image edge line, this regularity makes it convenient to position geometric flow rapidly.
Image segmentation adopts the binary segmentation method which Donoho adopted in wedgelet. Firstly, a square image is equally divided into 4 sub areas, and then, each sub area is equally divided into 4 sub areas in the next layer of segmentation, until the size of sub areas at the bottom layer reaches the minimum preset. The segmentation result can be shown by quadtree; each sub area corresponds to one node of the quadtree, as shown in Figure III. When the width of an image is 1, and the width of the sub area is (1/2)-n, the depth of the quadtree node corresponding to the sub area is n.
20
21 22
23
6
4
29
28
30
124
125 126
127
64
20 21 22 23 28 29 30
124 125 126 127
Figure III. Binary tree decomposition diagram
C. The Proposed Live Face Detection Method As for texture feature detection, this paper proposes a live
face detection method based on LBP and Bandelet to solve this problem. The flowchart of this method is shown in Figure IV.
Step 1 Convert the face image to be detected into a grayscale image, remove the redundant color information and keep the texture information.
Step 2 Extract the local binary pattern features and statistical features of high-frequency coefficients in Bandelet transform from the converted grayscale image.
The process of getting local binary pattern features is:
1) Divide the detected window into several sub areas (for example, the size of every sub area is 16x16 pixels). 2) Compare every pixel in the sub areas with its eight neighborhood pixels (upper left, left middle, lower left, upper right, etc.), which can be carried out in accordance with the clockwise or counter-clockwise order. 3) If the surrounding pixel value is greater than the center pixel value, then the position of this pixel is marked as 1, otherwise, is marked as 0. In this case, an 8-bit binary number is obtained and converted to a decimal number to be as the feature of this area. 4) Establish histograms for every sub area. 5) At this time, the histograms can be normalized. 6) Have all the histograms of sub areas connected in series, and then the features of the detected window are obtained.
The detected face image
Converted into grayscale image
Grayscale compression Bandelet decomposition
Extract LBP features Extract high-frequency coefficients
Features fusion
ELM cassification detection
Whether Live Face
Figure IV. Flowchart of live face detection method based on LBP and
Bandelet.
The process of getting statistical features of high-frequency coefficients in Bandelet transform is: 1) Input: grayscale image, quantization threshold T. 2) Conduct 2D wavelet transform on the image, orthogonal
and biorthogonal wavelet transform can be used. 3) Establish quadtree segmentation for each sub band
respectively, and get the best geometric flow directions of segmentation areas.
4) Conduct Bandelet transforms on each Bandelet area and get Bandelet coefficients.
5) Arrange Bandelet coefficients into matrix form according to a particular way.
6) Output: quadtree, the best geometric flow direction, Bandelet coefficients.
D. Extreme Learning Machine We have conducted a statistical analysis and classification
of the above two kinds of features. In this paper, basic ELM is adopted as the classifier. ELM, proposed by Guangbin Huang [24], is an algorithm to solve the single hidden layer neural networks. Under the condition of ensuring learning accuracy, the most obvious feature of ELM is to run faster than traditional learning algorithms for the traditional neural networks, especially for single-hidden layer feed forward neural networks (SLFN). ELM is a new type of fast learning algorithm, for the single-hidden layer neural network, and it can initialize the input weights and bias randomly to get the corresponded output weights.
For a single hidden layer neural network (as shown in Fig. 3), assume that there are N random samples ),( i itX ,
where mTimiii
nTniiii RttttRwxxX ,,,,],,,[ 21,2,1, . n is the
dimension of each feature vector X and m is the length of output vector t(m is 1 here because face detection is a binary
accurate, being allowed to have a certain deviation. In view of the difficulties of accurate positioning of image edge line, this regularity makes it convenient to position geometric flow rapidly.
Image segmentation adopts the binary segmentation method which Donoho adopted in wedgelet. Firstly, a square image is equally divided into 4 sub areas, and then, each sub area is equally divided into 4 sub areas in the next layer of segmentation, until the size of sub areas at the bottom layer reaches the minimum preset. The segmentation result can be shown by quadtree; each sub area corresponds to one node of the quadtree, as shown in Figure III. When the width of an image is 1, and the width of the sub area is (1/2)-n, the depth of the quadtree node corresponding to the sub area is n.
20
21 22
23
6
4
29
28
30
124
125 126
127
64
20 21 22 23 28 29 30
124 125 126 127
Figure III. Binary tree decomposition diagram
C. The Proposed Live Face Detection Method As for texture feature detection, this paper proposes a live
face detection method based on LBP and Bandelet to solve this problem. The flowchart of this method is shown in Figure IV.
Step 1 Convert the face image to be detected into a grayscale image, remove the redundant color information and keep the texture information.
Step 2 Extract the local binary pattern features and statistical features of high-frequency coefficients in Bandelet transform from the converted grayscale image.
The process of getting local binary pattern features is:
1) Divide the detected window into several sub areas (for example, the size of every sub area is 16x16 pixels). 2) Compare every pixel in the sub areas with its eight neighborhood pixels (upper left, left middle, lower left, upper right, etc.), which can be carried out in accordance with the clockwise or counter-clockwise order. 3) If the surrounding pixel value is greater than the center pixel value, then the position of this pixel is marked as 1, otherwise, is marked as 0. In this case, an 8-bit binary number is obtained and converted to a decimal number to be as the feature of this area. 4) Establish histograms for every sub area. 5) At this time, the histograms can be normalized. 6) Have all the histograms of sub areas connected in series, and then the features of the detected window are obtained.
The detected face image
Converted into grayscale image
Grayscale compression Bandelet decomposition
Extract LBP features Extract high-frequency coefficients
Features fusion
ELM cassification detection
Whether Live Face
Figure IV. Flowchart of live face detection method based on LBP and
Bandelet.
The process of getting statistical features of high-frequency coefficients in Bandelet transform is: 1) Input: grayscale image, quantization threshold T. 2) Conduct 2D wavelet transform on the image, orthogonal
and biorthogonal wavelet transform can be used. 3) Establish quadtree segmentation for each sub band
respectively, and get the best geometric flow directions of segmentation areas.
4) Conduct Bandelet transforms on each Bandelet area and get Bandelet coefficients.
5) Arrange Bandelet coefficients into matrix form according to a particular way.
6) Output: quadtree, the best geometric flow direction, Bandelet coefficients.
D. Extreme Learning Machine We have conducted a statistical analysis and classification
of the above two kinds of features. In this paper, basic ELM is adopted as the classifier. ELM, proposed by Guangbin Huang [24], is an algorithm to solve the single hidden layer neural networks. Under the condition of ensuring learning accuracy, the most obvious feature of ELM is to run faster than traditional learning algorithms for the traditional neural networks, especially for single-hidden layer feed forward neural networks (SLFN). ELM is a new type of fast learning algorithm, for the single-hidden layer neural network, and it can initialize the input weights and bias randomly to get the corresponded output weights.
For a single hidden layer neural network (as shown in Fig. 3), assume that there are N random samples ),( i itX ,
where mTimiii
nTniiii RttttRwxxX ,,,,],,,[ 21,2,1, . n is the
dimension of each feature vector X and m is the length of output vector t(m is 1 here because face detection is a binary
INFOCOMMUNICATIONS JOURNAL
SEPTEMBER 2017 • VOLUME IX • NUMBER 3 21
classification problem, and ti is 0 or 1).A single hidden layer
Output neuron
L hidden Neurons
N Input neurons
1 i L
n1
Figure V. SLFN: additive hidden nodes.
neural network with L hidden nodes can be expressed as:
,N,1,j,ObXWgβ jijiiL
1i (1)
in this formulation, xf is active function,
Tniiii wwwW ,2,1, ,,, is the weight of the input, i is the
weight of the output, ib is the bias of the ith transient node.
ji XW represents the inner-product of iW and jX .
The target of Single layer neural network is to minimize the error of the output, which can be represented as
0||||1 jjNj to , (2)
there are some ii W, and
ib that are qualified for
NjtbXWg jijiiLi ,,1,1 , (3)
which can be represented by a matrix TH , (4) where H is the output of the transient node, βis the weight
of output, and T is the expected value of output.
lnLNL
LL
N
LLL
bXWgbXWg
bXWgbXWg
XXbbWWH
1
11
111
111 ,,,,,,,,
mL
T
T
1
1
,
mN
T
T
T
TT
1
1
(5)
In order to train a single transient layer network, ii bW ˆ,ˆ and
i
TbHTbWH ibWii
,wminˆˆ,ˆ,,
(6)
where, L,,1i . The inference process above can be summarized as the following minimize loss function.
2)0
(1 jijii tbXWg
iL
jN
E
(7)
Some traditional algorithms based on gradient descent methods can be used to solve this problem, but the basic learning algorithm based on gradient needs to adjust all the parameters in the process of iteration. As opposed to this, in the ELM algorithm, once the input weights and hidden layer
bias are randomly determined, the output matrix H of hidden layer is only determined. Training a single hidden layer neural network can be transformed into solving a linear system and the output weights can be determined.
IV. EXPERIMENTAL RESULTS In order to test the algorithm's ability to identify live faces
and fake faces, we use the public face database CASIA_FASD, print-attack and replay attack to test.
A. Print-attack Dataset The print-attack dataset contains a short video of valid
access and spoof attacks to 50 different identities. The spoof attack that is emphasized in this dataset is print attack only, whereby an impostor presents a printed photograph of the targeted identity in order to falsify the access to a face biometric authentication system. This dataset includes two different scenarios: (i) controlled background (the background is uniform) and (ii) adverse background (a non-uniform background). These scenarios provide a valid simulation of the attack environment. Table II shows the number of video in the print-attack dataset.
Table II. Number of videos in the print-attack dataset Type Train Develop Test Total Real-access 60 60 80 200 Phone-attack 90+90 90+90 120+120 200+200 Table-attack 240 240 320 800
B. Replay-Attack Dataset The replay-attack dataset consists of 200 videos of valid
access (with 375 frames each), and 1000 videos of attack attempts (with 240 frames each). As shown in Table III, the dataset is divided into three partitions, namely development, training and testing set. The development set is used for estimating the threshold value and training set is used for estimating any model parameters.
Table III Number of videos in the replay-attack dataset
Type Train Develop Test Total Live 60 60 80 200 Print-attack 30+30 30+30 40+40 100+100 Phone-attack 60+60 60+60 80+80 200+200 Table-attack 60+60 60+60 80+80 200+200 Table-attack 360 360 480 1200
Each of these sets is generated by a video gallery of 15 clients for development and training, and 20 clients for testing. This means that the training and testing sets are disjoint and completely independent of each other.
C. CASIA-FASD dataset Compared to other live face detection databases, CASIA-
FASD database contains more abundant real face and fake face sample types. As shown in Table IV, there were a total of 50 people registered in the database. Each registered person corresponded to 12 face video sequences, including three real face videos and nine fake face videos. Three real face videos were collected by a low-quality USB webcam, a high-quality

Live face detection method based on local binary pattern and bandelet
USB webcam and a webcam of model Sony NEX-5respectively.
All the videos in the database were collected in an uncontrolled environment, and the background areas were complex and changeable. In order to fully consider different ways of attack, fake face sample types were more abundant in the database. First, high-resolution images of each target face were displayed on different media, including common A4 printing papers, glossy photo papers, and a high-resolution display frequency. After that, the face eye area printed on A4 papers was removed to simulate the blink attack method. The database was divided into training set and testing set, where the training set is composed of 240 video sequences from 20 targets and the test set is composed of 360 video sequences from other 30 targets. Take the rest samples which never participated in the training as the test set and the image numbers of train set and test set are shown in Tab. 1. We took the remaining samples, which never participated in the tarining, as the test set. The details of the test set and the training set are shown in Table IV.
Table IV Face images of train set and test set in CASIA database
In order to test the validity of the algorithm, this paper extracts LBP features of real and fake faces and wavelet features to classify and train ELM. Its detection accuracy is shown in Table V. This paper also adds the Bandelet features to LBP features and tests its detection accuracy for real and fake faces, as also shown in Table V.
From Table V, we can see that with the local binary pattern as the basic features, combined with Bandelet analysis, has an effect on the detection accuracy on CASIA dataset. It is noticed that using Bandelet analysis increases the feature dimension, which leads to improvement in the detection accuracy of the system significantly, from 93.87% to 97.97%; although the basic LBP features are easy to compute, its feature dimension 59 is greater than 12 under the analysis of LBP in comparison with Bandelet, which increases the system cost. The detection accuracy of LBP features which adds Bandelet analysis is 97.97%, and it is significantly greater than the detection accuracy of basic LBP features at 93.87%.
Table V. Comparison of LBP in combination with Bandelet features and other features
Where TP denotes the detection accuracy of positive samples and TN denotes the detection accuracy of negative samples.
Compared with ALL LBPV and Uniform LBPV, LBP features under the analysis of Bandelet have obvious advantages. It reduces the feature dimensions and complexity of the algorithm, and at the same time it improves the detection accuracy. The detection accuracy of the proposed method declines, but the algorithm complexity reduces significantly compared with gray-level co-occurrence matrix and wavelet features. Therefore, reducing the algorithm complexity, while maintaining the detection accuracy, will be our future research focus.
Also, we compare the other method in Table V, Gray-level co-occurrence matrix and DOG methods has also been widely used in the extraction of image texture. Compared with the text algorithm, the size of DOG is too large and the computational complexity is large. Although the dimensions of co-occurrence gray matrix are small, the accuracy is not high.
Next, we compare the performance of LBP, Bandelet and Bandelet-LBP on three datasets. The images in Fig.8 show the ROC curves of Bandelet-LBP, LBP and Bandelet. The performance of proposed algorithm is better than the base LBP and Bandelet on three dataset. Figure VIa shows the overall performance when trained and tested on CASIA dataset. Figure VIb shows the overall performance when trained and tested on print-attack dataset. Figure VIc shows the performance on replay-attack dataset. In these three datasets, the Bandelet-LBP features perform the best, and our method is more robust on three datasets than LBP and Bandelet features.
Quality Size
Train dataLiveness
face
Spoof face
Bend Cut Video
high 640×480 20 20 20 20medium 480×640 20 20 20 20
low 920×1080 20 20 20 20Total 60 60 60 60
Test dataLiveness
faceSpoof face
Bend cut video
high 640×480 30 30 30 30
medium 480×640 30 30 30 30
low 920×1080 30 30 30 30
Total 90 90 90 90
Samples TP TN Detection accuracy
Feature dimensio
nsBasic LBP features 93.55% 94.06% 93.87% 59
Gray-level co-occurrence
matrix
96.44% 91.13% 94.27% 8
All LBPV 91.84% 86.39% 88.03% 256
Uniform LBPV 88.13% 86.25% 86.95% 59
DoG (Curvature Driven Diffusions)
97.7% 512
LBP in combination with Bandelet
96.03% 95.88% 97.97% 12
(a)
(b)
(c)
Figure VI Comparison of ROC curves of different algorithm on three datasets. (a) print-attack dataset (b) CASIA dataset (c) replay-attack dataset.
V. CONCLUSION
This paper proposed a live face detection method based on Bandelet analysis under the analysis of texture feature differences among live faces, photo faces, and video faces. This method conducts a Bandelet analysis on grayscale images of faces and extracts local binary pattern features based on the Bandelet analysis. The feature of the image is obtained by divided into 100 blocks and set the weight value, which can enhance the important characteristics of the image
and reduce the noise impact. Finally, the characteristics of the two algorithms are fused, and the learning and classification are entered into ELM. Experimental results show that the algorithm can reduce the computational complexity and improve the detection accuracy. But in practical applications, there are many interference factors to be considered, such as the influence of illumination condition and high-resolution cameras which are used to shoot face photos and videos. This will be in the focus of our future research.
REFERENCES
[1] Z. Boulkenafet, J. Komulainen, A. Hadid, "Face Spoofing Detection Using Colour Texture Analysis", IEEE Transactions on Information Forensics and Security,2016, pp. 1818-1830.
[2] W. Kim, S. Suh, J. Han, "Face Liveness Detection From a Single Image via Diffusion Speed Model" IEEE Transaction on Image Processing, 2015, pp. 2456-246.
[3] D.F. Smith, A. William, B.C. Lovell. Face Recognition on Consumer Devices: Reflections on Replay Attacks. Information Forensics and Security IEEE Transaction on. 2015, pp. 736-745.
[4] N. Erdogmus, S. Marcel, Spoofing Face Recognition With 3D Masks. IEEE transactions on information forensics and security, 2014, pp 1084-1097.
[5] D. Gong, Z. Li, W.L. Huang, X.L. Li, D. Tao. Heterogeneous Face Recognition: A Common Encoding Feature Discriminant Approach. IEEE Transaction on circuits and system for video technology. 2017. pp. 2079-2089.
[6] I. Kim, J. Ahn, D. Kim, Face Spoofing Detection with Highlight Removal Effect and Distortions. IEEE International Conference on Systems. 2016. pp. 1-6.
[7] D. Wen, H. Han, A.K. Jain. Face Spoof Detection With Image Distortion Analysis. IEEE Transaction on forensics and security. 2015.pp. 746-761.
[8] M. Uzair, A. Mahmood, A. Mian. Hyperspectral Face Recognition With Spatiospectral Information Fusion and PLS Regression. IEEE Transactions on image processing. 2015. pp. 1127-1137.
[9] J. Galbally, S. Marcel, J. Fierrez, Image Quality Assessment for Fake Biometric Detection: Application to Iris, Fingerprint and Face Recognition, IEEE Transactions on Image Processing, 23 (2014) 710-724.
[10] S. Karungaru, M. Fukumi, N. Akamatsu. Face recognition in colour images using neural networks and genetic algorithms. International Journal of Computational Intelligence and Applications, 2005, pp 55-67.
[11] S.R. Arashloo, J. Kittler, W. Christmas, Face Spoofing Detection Based on Multiple Descriptor Fusion Using Multiscale Dynamic Binarized Statistical Image Features, IEEE Transaction on information and security, 2015, pp. 2396-2407.
[12] G. Pan, L. Sun, Z. Wu, S. Lao, Eyeblink-based Anti-Spoofing in Face Recognition from a Generic Web camera, in IEEE International Conference on Computer Vision, 2007, pp. 1-8.
[13] Santosh T, Norman P, David W, et al. Detection of Face Spoofing Using Visual Dynamics. IEEE Transaction on Information Forensics and Security. 2015. pp. 762-777.
[14] W. Yin, Y. Ming, L. Tian. A face anti-spoofing method based on the optical flow field. 2016 IEEE 13th International Conference on Signal Processing (ICSP). 2016. pp. 1333-1337.
[15] A. Pinto, H. Pedrini, W.R. Schwartz, A. Rocha, Face Spoofing Detection Through Visual Codebooks of Spectral Temporal Cubes. 2015. pp. 4726-4740.
[16] W. Paier, M. Kettern, A. Hilsmann, P. Eisert, A Hybrid Approach for Facial Performance Analysis and Editing. IEEE Transaction on circuits and system for video technology. 2017. pp. 784-797.
[17] Z. Yu, G. Michael, B. Chris, C. Jun, X. Yong. Hybrid hierarchical clustering-piecewise aggregate approximation, with applications. International Journal of Computational Intelligence and Applications. 2016. p 165019(26 pp).
[18] N. Werghi, C. Tortorici, S. Berretti, A. D. Bimbo. Boosting 3D LBP-Based Face Recognition by Fusing Shape and Texture Descriptors on the Mesh. 2016. pp. 964-979.
[19] K. Patel, H. Han, A.K. Jain, Secure Face Unlock: Spoof Detection on Smartphones. IEEE Transaction on information and security. 2016. pp. 2268-2283.
From Table V, we can see that with the local binary pattern as the basic features, combined with Bandelet analysis, has an effect on the detection accuracy on CASIA dataset. It is noticed that using Bandelet analysis increases the feature dimension, which leads to improvement in the detection accuracy of the system significantly, from 93.87% to 97.97%; although the basic LBP features are easy to compute, its feature dimension 59 is greater than 12 under the analysis of LBP in comparison with Bandelet, which increases the system cost. The detection accuracy of LBP features which adds Bandelet analysis is 97.97%, and it is significantly greater than the detection accuracy of basic LBP features at 93.87%.
Compared with ALL LBPV and Uniform LBPV, LBP features under the analysis of Bandelet have obvious advantages. It reduces the feature dimensions and complexity of the algorithm, and at the same time it improves the detection accuracy. The detection accuracy of the proposed method declines, but the algorithm complexity reduces significantly compared with gray-level co-occurrence matrix and wavelet features. Therefore, reducing the algorithm complexity, while maintaining the detection accuracy, will be our future research focus. Also, we compare the other method in Table V, Gray-level co-occurrence matrix and DOG methods has also been widely used in the extraction of image texture. Compared with the text algorithm, the size of DOG is too large and the computational complexity is large. Although the dimensions of co-occurrence gray matrix are small, the accuracy is not high. Next, we compare the performance of LBP, Bandelet and Bandelet-LBP on three datasets. The images in Fig.8 show the ROC curves of Bandelet-LBP, LBP and Bandelet. The performance of proposed algorithm is better than the base LBP and Bandelet on three dataset. Figure VIa shows the overall performance when trained and tested on CASIA dataset. Figure VIb shows the overall performance when trained and tested on print-attack dataset. Figure VIc shows the performance on replay-attack dataset. In these three datasets, the Bandelet-LBP features perform the best, and our method is more robust on three datasets than LBP and Bandelet features.
SEPTEMBER 2017 • VOLUME IX • NUMBER 322
INFOCOMMUNICATIONS JOURNAL
Each of these sets is generated by a video gallery of 15 clients for development and training, and 20 clients for testing.This means that the training and testing sets are disjoint and completely independent of each other.
C. CASIA-FASD dataset Compared to other live face detection databases, CASIA-FASD database contains more abundant real face and fake face sample types. As shown in Table IV, there were a total of 50 people registered in the database. Each registered person corresponded to 12 face video sequences, including three real face videos and nine fake face videos. Three real face videos were collected by a low-quality USB webcam, a high-quality USB webcam and a webcam of model Sony NEX-5 respectively. All the videos in the database were collected in an uncontrolled environment, and the background areas were complex and changeable. In order to fully consider different ways of attack, fake face sample types were more abundant in the database. First, high-resolution images of each target face were displayed on different media, including common A4 printing papers, glossy photo papers, and a high-resolution display frequency. After that, the face eye area printed on A4 papers was removed to simulate the blink attack method. The database was divided into training set and testing set, where the training set is composed of 240 video sequences from 20 targets and the test set is composed of 360 video sequences from other 30 targets. Take the rest samples which never participated in the training as the test set and the image numbers of train set and test set are shown in Tab. 1. We took the remaining samples, which never participated in the tarining, as the test set. The details of the test set and the training set are shown in Table IV.
In order to test the validity of the algorithm, this paper extracts LBP features of real and fake faces and wavelet features to classify and train ELM. Its detection accuracy is shown in Table V. This paper also adds the Bandelet features to LBP features and tests its detection accuracy for real and fake faces, as also shown in Table V.

Live face detection method based on local binary pattern and bandelet
USB webcam and a webcam of model Sony NEX-5respectively.
All the videos in the database were collected in an uncontrolled environment, and the background areas were complex and changeable. In order to fully consider different ways of attack, fake face sample types were more abundant in the database. First, high-resolution images of each target face were displayed on different media, including common A4 printing papers, glossy photo papers, and a high-resolution display frequency. After that, the face eye area printed on A4 papers was removed to simulate the blink attack method. The database was divided into training set and testing set, where the training set is composed of 240 video sequences from 20 targets and the test set is composed of 360 video sequences from other 30 targets. Take the rest samples which never participated in the training as the test set and the image numbers of train set and test set are shown in Tab. 1. We took the remaining samples, which never participated in the tarining, as the test set. The details of the test set and the training set are shown in Table IV.
Table IV Face images of train set and test set in CASIA database
In order to test the validity of the algorithm, this paper extracts LBP features of real and fake faces and wavelet features to classify and train ELM. Its detection accuracy is shown in Table V. This paper also adds the Bandelet features to LBP features and tests its detection accuracy for real and fake faces, as also shown in Table V.
From Table V, we can see that with the local binary pattern as the basic features, combined with Bandelet analysis, has an effect on the detection accuracy on CASIA dataset. It is noticed that using Bandelet analysis increases the feature dimension, which leads to improvement in the detection accuracy of the system significantly, from 93.87% to 97.97%; although the basic LBP features are easy to compute, its feature dimension 59 is greater than 12 under the analysis of LBP in comparison with Bandelet, which increases the system cost. The detection accuracy of LBP features which adds Bandelet analysis is 97.97%, and it is significantly greater than the detection accuracy of basic LBP features at 93.87%.
Table V. Comparison of LBP in combination with Bandelet features and other features
Where TP denotes the detection accuracy of positive samples and TN denotes the detection accuracy of negative samples.
Compared with ALL LBPV and Uniform LBPV, LBP features under the analysis of Bandelet have obvious advantages. It reduces the feature dimensions and complexity of the algorithm, and at the same time it improves the detection accuracy. The detection accuracy of the proposed method declines, but the algorithm complexity reduces significantly compared with gray-level co-occurrence matrix and wavelet features. Therefore, reducing the algorithm complexity, while maintaining the detection accuracy, will be our future research focus.
Also, we compare the other method in Table V, Gray-level co-occurrence matrix and DOG methods has also been widely used in the extraction of image texture. Compared with the text algorithm, the size of DOG is too large and the computational complexity is large. Although the dimensions of co-occurrence gray matrix are small, the accuracy is not high.
Next, we compare the performance of LBP, Bandelet and Bandelet-LBP on three datasets. The images in Fig.8 show the ROC curves of Bandelet-LBP, LBP and Bandelet. The performance of proposed algorithm is better than the base LBP and Bandelet on three dataset. Figure VIa shows the overall performance when trained and tested on CASIA dataset. Figure VIb shows the overall performance when trained and tested on print-attack dataset. Figure VIc shows the performance on replay-attack dataset. In these three datasets, the Bandelet-LBP features perform the best, and our method is more robust on three datasets than LBP and Bandelet features.
Quality Size
Train dataLiveness
face
Spoof face
Bend Cut Video
high 640×480 20 20 20 20medium 480×640 20 20 20 20
low 920×1080 20 20 20 20Total 60 60 60 60
Test dataLiveness
faceSpoof face
Bend cut video
high 640×480 30 30 30 30
medium 480×640 30 30 30 30
low 920×1080 30 30 30 30
Total 90 90 90 90
Samples TP TN Detection accuracy
Feature dimensio
nsBasic LBP features 93.55% 94.06% 93.87% 59
Gray-level co-occurrence
matrix
96.44% 91.13% 94.27% 8
All LBPV 91.84% 86.39% 88.03% 256
Uniform LBPV 88.13% 86.25% 86.95% 59
DoG (Curvature Driven Diffusions)
97.7% 512
LBP in combination with Bandelet
96.03% 95.88% 97.97% 12
(a)
(b)
(c)
Figure VI Comparison of ROC curves of different algorithm on three datasets. (a) print-attack dataset (b) CASIA dataset (c) replay-attack dataset.
V. CONCLUSION
This paper proposed a live face detection method based on Bandelet analysis under the analysis of texture feature differences among live faces, photo faces, and video faces. This method conducts a Bandelet analysis on grayscale images of faces and extracts local binary pattern features based on the Bandelet analysis. The feature of the image is obtained by divided into 100 blocks and set the weight value, which can enhance the important characteristics of the image
and reduce the noise impact. Finally, the characteristics of the two algorithms are fused, and the learning and classification are entered into ELM. Experimental results show that the algorithm can reduce the computational complexity and improve the detection accuracy. But in practical applications, there are many interference factors to be considered, such as the influence of illumination condition and high-resolution cameras which are used to shoot face photos and videos. This will be in the focus of our future research.
REFERENCES
[1] Z. Boulkenafet, J. Komulainen, A. Hadid, "Face Spoofing Detection Using Colour Texture Analysis", IEEE Transactions on Information Forensics and Security,2016, pp. 1818-1830.
[2] W. Kim, S. Suh, J. Han, "Face Liveness Detection From a Single Image via Diffusion Speed Model" IEEE Transaction on Image Processing, 2015, pp. 2456-246.
[3] D.F. Smith, A. William, B.C. Lovell. Face Recognition on Consumer Devices: Reflections on Replay Attacks. Information Forensics and Security IEEE Transaction on. 2015, pp. 736-745.
[4] N. Erdogmus, S. Marcel, Spoofing Face Recognition With 3D Masks. IEEE transactions on information forensics and security, 2014, pp 1084-1097.
[5] D. Gong, Z. Li, W.L. Huang, X.L. Li, D. Tao. Heterogeneous Face Recognition: A Common Encoding Feature Discriminant Approach. IEEE Transaction on circuits and system for video technology. 2017. pp. 2079-2089.
[6] I. Kim, J. Ahn, D. Kim, Face Spoofing Detection with Highlight Removal Effect and Distortions. IEEE International Conference on Systems. 2016. pp. 1-6.
[7] D. Wen, H. Han, A.K. Jain. Face Spoof Detection With Image Distortion Analysis. IEEE Transaction on forensics and security. 2015.pp. 746-761.
[8] M. Uzair, A. Mahmood, A. Mian. Hyperspectral Face Recognition With Spatiospectral Information Fusion and PLS Regression. IEEE Transactions on image processing. 2015. pp. 1127-1137.
[9] J. Galbally, S. Marcel, J. Fierrez, Image Quality Assessment for Fake Biometric Detection: Application to Iris, Fingerprint and Face Recognition, IEEE Transactions on Image Processing, 23 (2014) 710-724.
[10] S. Karungaru, M. Fukumi, N. Akamatsu. Face recognition in colour images using neural networks and genetic algorithms. International Journal of Computational Intelligence and Applications, 2005, pp 55-67.
[11] S.R. Arashloo, J. Kittler, W. Christmas, Face Spoofing Detection Based on Multiple Descriptor Fusion Using Multiscale Dynamic Binarized Statistical Image Features, IEEE Transaction on information and security, 2015, pp. 2396-2407.
[12] G. Pan, L. Sun, Z. Wu, S. Lao, Eyeblink-based Anti-Spoofing in Face Recognition from a Generic Web camera, in IEEE International Conference on Computer Vision, 2007, pp. 1-8.
[13] Santosh T, Norman P, David W, et al. Detection of Face Spoofing Using Visual Dynamics. IEEE Transaction on Information Forensics and Security. 2015. pp. 762-777.
[14] W. Yin, Y. Ming, L. Tian. A face anti-spoofing method based on the optical flow field. 2016 IEEE 13th International Conference on Signal Processing (ICSP). 2016. pp. 1333-1337.
[15] A. Pinto, H. Pedrini, W.R. Schwartz, A. Rocha, Face Spoofing Detection Through Visual Codebooks of Spectral Temporal Cubes. 2015. pp. 4726-4740.
[16] W. Paier, M. Kettern, A. Hilsmann, P. Eisert, A Hybrid Approach for Facial Performance Analysis and Editing. IEEE Transaction on circuits and system for video technology. 2017. pp. 784-797.
[17] Z. Yu, G. Michael, B. Chris, C. Jun, X. Yong. Hybrid hierarchical clustering-piecewise aggregate approximation, with applications. International Journal of Computational Intelligence and Applications. 2016. p 165019(26 pp).
[18] N. Werghi, C. Tortorici, S. Berretti, A. D. Bimbo. Boosting 3D LBP-Based Face Recognition by Fusing Shape and Texture Descriptors on the Mesh. 2016. pp. 964-979.
[19] K. Patel, H. Han, A.K. Jain, Secure Face Unlock: Spoof Detection on Smartphones. IEEE Transaction on information and security. 2016. pp. 2268-2283.
V. conclusIon
This paper proposed a live face detection method based on Bandelet analysis under the analysis of texture feature differences among live faces, photo faces, and video faces. This method conducts a Bandelet analysis on grayscale images of faces and extracts local binary pattern features based on the Bandelet
analysis. The feature of the image is obtained by divided into 100 blocks and set the weight value, which can enhance the important characteristics of the image and reduce the noise impact. Finally, the characteristics of the two algorithms are fused, and the learning and classification are entered into ELM. Experimental results show that the algorithm can reduce the computational complexity and improve the detection accuracy. But in practical applications, there are many interference factors to be considered, such as the influence of illumination condition and high-resolution cameras which are used to shoot face photos and videos. This will be in the focus of our future research.
(a)
(b)
(c)
Figure VI Comparison of ROC curves of different algorithm on three datasets. (a) print-attack dataset (b) CASIA dataset (c) replay-attack dataset.
V. CONCLUSION
This paper proposed a live face detection method based on Bandelet analysis under the analysis of texture feature differences among live faces, photo faces, and video faces. This method conducts a Bandelet analysis on grayscale images of faces and extracts local binary pattern features based on the Bandelet analysis. The feature of the image is obtained by divided into 100 blocks and set the weight value, which can enhance the important characteristics of the image
and reduce the noise impact. Finally, the characteristics of the two algorithms are fused, and the learning and classification are entered into ELM. Experimental results show that the algorithm can reduce the computational complexity and improve the detection accuracy. But in practical applications, there are many interference factors to be considered, such as the influence of illumination condition and high-resolution cameras which are used to shoot face photos and videos. This will be in the focus of our future research.
REFERENCES
[1] Z. Boulkenafet, J. Komulainen, A. Hadid, "Face Spoofing Detection Using Colour Texture Analysis", IEEE Transactions on Information Forensics and Security,2016, pp. 1818-1830.
[2] W. Kim, S. Suh, J. Han, "Face Liveness Detection From a Single Image via Diffusion Speed Model" IEEE Transaction on Image Processing, 2015, pp. 2456-246.
[3] D.F. Smith, A. William, B.C. Lovell. Face Recognition on Consumer Devices: Reflections on Replay Attacks. Information Forensics and Security IEEE Transaction on. 2015, pp. 736-745.
[4] N. Erdogmus, S. Marcel, Spoofing Face Recognition With 3D Masks. IEEE transactions on information forensics and security, 2014, pp 1084-1097.
[5] D. Gong, Z. Li, W.L. Huang, X.L. Li, D. Tao. Heterogeneous Face Recognition: A Common Encoding Feature Discriminant Approach. IEEE Transaction on circuits and system for video technology. 2017. pp. 2079-2089.
[6] I. Kim, J. Ahn, D. Kim, Face Spoofing Detection with Highlight Removal Effect and Distortions. IEEE International Conference on Systems. 2016. pp. 1-6.
[7] D. Wen, H. Han, A.K. Jain. Face Spoof Detection With Image Distortion Analysis. IEEE Transaction on forensics and security. 2015.pp. 746-761.
[8] M. Uzair, A. Mahmood, A. Mian. Hyperspectral Face Recognition With Spatiospectral Information Fusion and PLS Regression. IEEE Transactions on image processing. 2015. pp. 1127-1137.
[9] J. Galbally, S. Marcel, J. Fierrez, Image Quality Assessment for Fake Biometric Detection: Application to Iris, Fingerprint and Face Recognition, IEEE Transactions on Image Processing, 23 (2014) 710-724.
[10] S. Karungaru, M. Fukumi, N. Akamatsu. Face recognition in colour images using neural networks and genetic algorithms. International Journal of Computational Intelligence and Applications, 2005, pp 55-67.
[11] S.R. Arashloo, J. Kittler, W. Christmas, Face Spoofing Detection Based on Multiple Descriptor Fusion Using Multiscale Dynamic Binarized Statistical Image Features, IEEE Transaction on information and security, 2015, pp. 2396-2407.
[12] G. Pan, L. Sun, Z. Wu, S. Lao, Eyeblink-based Anti-Spoofing in Face Recognition from a Generic Web camera, in IEEE International Conference on Computer Vision, 2007, pp. 1-8.
[13] Santosh T, Norman P, David W, et al. Detection of Face Spoofing Using Visual Dynamics. IEEE Transaction on Information Forensics and Security. 2015. pp. 762-777.
[14] W. Yin, Y. Ming, L. Tian. A face anti-spoofing method based on the optical flow field. 2016 IEEE 13th International Conference on Signal Processing (ICSP). 2016. pp. 1333-1337.
[15] A. Pinto, H. Pedrini, W.R. Schwartz, A. Rocha, Face Spoofing Detection Through Visual Codebooks of Spectral Temporal Cubes. 2015. pp. 4726-4740.
[16] W. Paier, M. Kettern, A. Hilsmann, P. Eisert, A Hybrid Approach for Facial Performance Analysis and Editing. IEEE Transaction on circuits and system for video technology. 2017. pp. 784-797.
[17] Z. Yu, G. Michael, B. Chris, C. Jun, X. Yong. Hybrid hierarchical clustering-piecewise aggregate approximation, with applications. International Journal of Computational Intelligence and Applications. 2016. p 165019(26 pp).
[18] N. Werghi, C. Tortorici, S. Berretti, A. D. Bimbo. Boosting 3D LBP-Based Face Recognition by Fusing Shape and Texture Descriptors on the Mesh. 2016. pp. 964-979.
[19] K. Patel, H. Han, A.K. Jain, Secure Face Unlock: Spoof Detection on Smartphones. IEEE Transaction on information and security. 2016. pp. 2268-2283.
INFOCOMMUNICATIONS JOURNAL
SEPTEMBER 2017 • VOLUME IX • NUMBER 3 23

Live face detection method based on local binary pattern and bandelet
Haiqing LIU, acquired engineering PHD degree in Computer Application Technology from Wuhan University on December 2001. She went to WPI (Worcester Polytechnics Institute) in USA as a visiting scholar for 1 year since April 2004. She was employed as an associate professor and master’s supervisor by Wuhan University since October 2002, and transferred to Control and Computer Engineering Academy in NCEPU (North China Electric Power University) later in May 2005. She has been engaged in research
and development work related to Software Engineering, Database and Artificial Intelligence since 1988.
Shuhua HAO, master degree candidate in North China Electric Power University, Beijing, China. Her research interests include power system and spooling face recognition.
Yuancheng Li, received the Ph.D. degree from University of Science and Technology of China, Hefei, China, in 2003. From 2004 to 2005, he was a postdoctoral research fellow in the Digital Media Lab, Beihang University, Beijing, China. Since 2005, he has been with the North China Electric Power University, where he is a professor and the Dean of the Institute of Smart Grid and Information Security. From 2009 to 2010, he was a postdoctoral research fellow in the Cyber Security Lab, college
of information science and technology of Pennsylvania State University, Pennsylvania, USA.
(a)
(b)
(c)
Figure VI Comparison of ROC curves of different algorithm on three datasets. (a) print-attack dataset (b) CASIA dataset (c) replay-attack dataset.
V. CONCLUSION
This paper proposed a live face detection method based on Bandelet analysis under the analysis of texture feature differences among live faces, photo faces, and video faces. This method conducts a Bandelet analysis on grayscale images of faces and extracts local binary pattern features based on the Bandelet analysis. The feature of the image is obtained by divided into 100 blocks and set the weight value, which can enhance the important characteristics of the image
and reduce the noise impact. Finally, the characteristics of the two algorithms are fused, and the learning and classification are entered into ELM. Experimental results show that the algorithm can reduce the computational complexity and improve the detection accuracy. But in practical applications, there are many interference factors to be considered, such as the influence of illumination condition and high-resolution cameras which are used to shoot face photos and videos. This will be in the focus of our future research.
REFERENCES
[1] Z. Boulkenafet, J. Komulainen, A. Hadid, "Face Spoofing Detection Using Colour Texture Analysis", IEEE Transactions on Information Forensics and Security,2016, pp. 1818-1830.
[2] W. Kim, S. Suh, J. Han, "Face Liveness Detection From a Single Image via Diffusion Speed Model" IEEE Transaction on Image Processing, 2015, pp. 2456-246.
[3] D.F. Smith, A. William, B.C. Lovell. Face Recognition on Consumer Devices: Reflections on Replay Attacks. Information Forensics and Security IEEE Transaction on. 2015, pp. 736-745.
[4] N. Erdogmus, S. Marcel, Spoofing Face Recognition With 3D Masks. IEEE transactions on information forensics and security, 2014, pp 1084-1097.
[5] D. Gong, Z. Li, W.L. Huang, X.L. Li, D. Tao. Heterogeneous Face Recognition: A Common Encoding Feature Discriminant Approach. IEEE Transaction on circuits and system for video technology. 2017. pp. 2079-2089.
[6] I. Kim, J. Ahn, D. Kim, Face Spoofing Detection with Highlight Removal Effect and Distortions. IEEE International Conference on Systems. 2016. pp. 1-6.
[7] D. Wen, H. Han, A.K. Jain. Face Spoof Detection With Image Distortion Analysis. IEEE Transaction on forensics and security. 2015.pp. 746-761.
[8] M. Uzair, A. Mahmood, A. Mian. Hyperspectral Face Recognition With Spatiospectral Information Fusion and PLS Regression. IEEE Transactions on image processing. 2015. pp. 1127-1137.
[9] J. Galbally, S. Marcel, J. Fierrez, Image Quality Assessment for Fake Biometric Detection: Application to Iris, Fingerprint and Face Recognition, IEEE Transactions on Image Processing, 23 (2014) 710-724.
[10] S. Karungaru, M. Fukumi, N. Akamatsu. Face recognition in colour images using neural networks and genetic algorithms. International Journal of Computational Intelligence and Applications, 2005, pp 55-67.
[11] S.R. Arashloo, J. Kittler, W. Christmas, Face Spoofing Detection Based on Multiple Descriptor Fusion Using Multiscale Dynamic Binarized Statistical Image Features, IEEE Transaction on information and security, 2015, pp. 2396-2407.
[12] G. Pan, L. Sun, Z. Wu, S. Lao, Eyeblink-based Anti-Spoofing in Face Recognition from a Generic Web camera, in IEEE International Conference on Computer Vision, 2007, pp. 1-8.
[13] Santosh T, Norman P, David W, et al. Detection of Face Spoofing Using Visual Dynamics. IEEE Transaction on Information Forensics and Security. 2015. pp. 762-777.
[14] W. Yin, Y. Ming, L. Tian. A face anti-spoofing method based on the optical flow field. 2016 IEEE 13th International Conference on Signal Processing (ICSP). 2016. pp. 1333-1337.
[15] A. Pinto, H. Pedrini, W.R. Schwartz, A. Rocha, Face Spoofing Detection Through Visual Codebooks of Spectral Temporal Cubes. 2015. pp. 4726-4740.
[16] W. Paier, M. Kettern, A. Hilsmann, P. Eisert, A Hybrid Approach for Facial Performance Analysis and Editing. IEEE Transaction on circuits and system for video technology. 2017. pp. 784-797.
[17] Z. Yu, G. Michael, B. Chris, C. Jun, X. Yong. Hybrid hierarchical clustering-piecewise aggregate approximation, with applications. International Journal of Computational Intelligence and Applications. 2016. p 165019(26 pp).
[18] N. Werghi, C. Tortorici, S. Berretti, A. D. Bimbo. Boosting 3D LBP-Based Face Recognition by Fusing Shape and Texture Descriptors on the Mesh. 2016. pp. 964-979.
[19] K. Patel, H. Han, A.K. Jain, Secure Face Unlock: Spoof Detection on Smartphones. IEEE Transaction on information and security. 2016. pp. 2268-2283.
[20] T.D.F. Pereira, J. Komulainen, A. Anjos, J.M.D. Martino, A. Hadid, M. Pietikäinen, S. Marcel, Face liveness detection using dynamic texture, Eurasip Journal on Image & Video Processing, 2014 (2014) 1-15.
[21] T. Edmunds, A. Caplier, Fake Face Detection Based on Radiometric Distortions. IEEE Conference Publications. 2016, pp, 1-6.
[22] Z. Akhtar, C. Micheloni and G. L. Foresti, "Biometric Liveness Detection: Challenges and Research Opportunities," in IEEE Security & Privacy, vol. 13, no. 5, pp. 63-72, Sept.-Oct. 2015.
[23] A. Lutz, K. Grace; N. Messer. Bandelet transformation based image registration. 2015 IEEE Applied Imagery Pattern Recognition Workshop (AIPR). 2015. pp. 1-6.
[24] L.L.C. Kasun, H. Zhou, G.B. Huang, and C.M.Vong, “Representational Learning with Extreme Learning Machine for Big Data”, IEEE Intelligent Systems, 2013, pp. 31-34.
Haiqing LIU, acquired engineering PHD degree in Computer Application Technology from Wuhan University on December 2001. She went to WPI (Worcester Polytechnics Institute) in USA as a visiting scholar for 1 year since April 2004. She was employed as an associate professor and master’s
supervisor by Wuhan University since October 2002, and transferred to Control and Computer Engineering Academy in NCEPU (North China Electric Power University) later in May 2005. She has been engaged in research and development work related to Software Engineering, Database and Artificial Intelligence since 1988.
Shuhua HAO, master degree candidate in North China Electric Power University, Beijing, China. Her research interests include power system and spooling face recognition.
Yuancheng Li, received the Ph.D. degree from University of Science and Technology of China, Hefei, China, in 2003. From 2004 to 2005, he was a postdoctoral research fellow in the Digital Media Lab, Beihang University, Beijing, China. Since 2005, he has been with the North China Electric Power University, where he is a professor and the Dean of
the Institute of Smart Grid and Information Security. From 2009 to 2010, he was a postdoctoral research fellow in the Cyber Security Lab, college of information science and technology of Pennsylvania State University, Pennsylvania, USA.
SEPTEMBER 2017 • VOLUME IX • NUMBER 324
INFOCOMMUNICATIONS JOURNAL
INFOCOMMUNICATIONS JOURNAL, VOL. ??, NO. ?, FEBRUARY 2017 1
Extension of RFID Based Indoor LocalizationSystems With Smart Tags
Tamas Helfenbein, Roland Kiraly, Marton Torocsik, Emil Toth and Sandor Kiraly
Abstract—The indoor localization problem is a method of iden-tifying and finding position (co-ordinates) of requested objectsin a well defined area of interest (AoI) in buildings. Besideidentification, localization is an important task in several com-plex industrial environments. Assigning unique Radio FrequencyIDentifier (RFID) tags to the objects both the identification andthe localization problem can be solved.
In this paper, RFID based indoor localization systems, meth-ods, and protocols are analysed. A novel Smart Tag platformcalled Blackforest with integrated self localization capabilities isintroduced. This device can be in either transmitter or receiverrole to ensure fast prototyping of localization environments.Higher temporal positioning possibilities and sensor fusion tech-niques are introduced using the BlackForest nodes. The radio-frequency (RF) characteristcs of the device were analyzed anda localization system was built using Blackforrest nodes. Thelocalization architecture, methods and system configurations aredescribed. After calibration, the suitable accuracy of RFIDindoor localization using BlackForest Smart Tags is proven inan indoor office scenario.
A hierarchical localization protocol stack is introduced inorder to extend existing indoor RFID localization systems usingintelligent and co-operative antenna systems with novel Smart-Tags.
Index Terms—Indoor localization, Self Localization, SmartTag, RFID
I. INTRODUCTION
Radio Frequency IDentification (RFID) is an advancedand emerging technology to identify objects based on radiofrequency signal transmission and/or reception. Therefore,RFID systems are frequently used to help information systemsmanage objects in difficult and/or large environments. Besidesidentification of the tagged object, determining the location isone of the most important and also the most challenging tasks.RFID systems typically consist of readers with antennas andRFID transponders. The reader-antenna pairs and the tags canbe fixed (deployed) or mobile. We are focusing on systems
T. Helfenbein is with Research Lab, Chebio Ltd., e-mail:[email protected]
R. Kiraly is with Institute of Mathemathics and Informatics, Es-zterhazy Karoly University of Applied Sciences, e-mail: [email protected]
M. Torocsik is with the Institute for Infocommunication Technolo-gies, Bay Zoltan Nonprofit Ltd. For Applied Research, e-mail: [email protected]
E. Toth is with the Institute for Infocommunication Technologies, BayZoltan Nonprofit Ltd. For Applied Research, e-mail: [email protected]
S. Kiraly is with the Institute of Mathemathics and Informatics, Es-zterhazy Karoly University of Applied Sciences, e-mail: [email protected]
The RFID research project was supported by the European Union and theState of Hungary, co-financed by the European Social Fund in the frameworkof TAMOP-4.2.2.C-11/1/KONV-2012-0014.
that have an infrastructure consisting of fixed reader-antennapairs and mobile tags on the objects that need to be localized.Mobile readers are not excluded from the system, but are notnecessarily parts of the infrastructure. In our research, threetypes of system architectures can be distinguished, namelySmart Reader Network (SRN), Smart Tag (ST) and Hybridarchitectures.
The SRN architecture consists of intelligent reader-antennapairs connected to a network or a computer server and inexpen-sive (e.g. passive UHF RFID) tags. In this system architecture,localization is made by the intelligent infrastructure (ambientintelligence) and location information is generated on theinfrastructure side. In the ST system, intelligent, active RFIDtags are used with (almost) traditional reader-antenna pairs. Inthis case, self-localization has to be done by the tag and the(self) location information is generated on the tag side. In thehybrid solution, concept SRN and ST are combined.
In conclusion, the article details our practical results inRFID based localization solutions. The prototype of a newgeneration of Smart Transponder is described in Section III,that is capable of self-localization based on information ob-tained from RFID antennas. Our ideas on hybrid applicationsand the combination of RFID systems with other technologiesare also detailed. The self-localizing transponder and thecon-nected middleware resting on mathematical foundations can beused with significantly greater precision for indoor localizationthan current devices.
In the following section, we analyse the RFID basedlocalization methods, systems and our previous works inSection II. Introducing the novel self localization concept isfollowed by the description of hardware prototype of SmartTag called BlackForest and localization methods in SectionIII. The results and measurements are demonstrated in officeenvironments in Section IV.
Localization methods are based on principles, models, mea-surements, and evaluation methods. A principle is a plan thatdetermines what parameters to model, measure, and evaluate.[1][2] In case of multilateration (or trilateration) we haveto determine distances using measurements and models, thusthe position can be estimated from the best candidates forintersection of spheres or circles. In case of triangulation wehave to determine angles and estimate position using the bestcandidates for intersection of directions given by the angles.We can also calculate position from distance differences usingthe best candidates for intersection of paraboloids.
Modelling is an important part of a localization system.Based on the principle, the environment and the given hard-ware devices we can assume different types of antenna models,

Extension of RFID Based Indoor LocalizationSystems With Smart Tags
INFOCOMMUNICATIONS JOURNAL
SEPTEMBER 2017 • VOLUME IX • NUMBER 3 25
Extension of RFID Based Indoor LocalizationSystems With Smart Tags
Tamás Helfenbein, Roland Király, Márton Töröcsik, Emil Tóth and Sándor Király
INFOCOMMUNICATIONS JOURNAL, VOL. ??, NO. ?, FEBRUARY 2017 1
Extension of RFID Based Indoor LocalizationSystems With Smart Tags
Tamas Helfenbein, Roland Kiraly, Marton Torocsik, Emil Toth and Sandor Kiraly
Abstract—The indoor localization problem is a method of iden-tifying and finding position (co-ordinates) of requested objectsin a well defined area of interest (AoI) in buildings. Besideidentification, localization is an important task in several com-plex industrial environments. Assigning unique Radio FrequencyIDentifier (RFID) tags to the objects both the identification andthe localization problem can be solved.
In this paper, RFID based indoor localization systems, meth-ods, and protocols are analysed. A novel Smart Tag platformcalled Blackforest with integrated self localization capabilities isintroduced. This device can be in either transmitter or receiverrole to ensure fast prototyping of localization environments.Higher temporal positioning possibilities and sensor fusion tech-niques are introduced using the BlackForest nodes. The radio-frequency (RF) characteristcs of the device were analyzed anda localization system was built using Blackforrest nodes. Thelocalization architecture, methods and system configurations aredescribed. After calibration, the suitable accuracy of RFIDindoor localization using BlackForest Smart Tags is proven inan indoor office scenario.
A hierarchical localization protocol stack is introduced inorder to extend existing indoor RFID localization systems usingintelligent and co-operative antenna systems with novel Smart-Tags.
Index Terms—Indoor localization, Self Localization, SmartTag, RFID
I. INTRODUCTION
Radio Frequency IDentification (RFID) is an advancedand emerging technology to identify objects based on radiofrequency signal transmission and/or reception. Therefore,RFID systems are frequently used to help information systemsmanage objects in difficult and/or large environments. Besidesidentification of the tagged object, determining the location isone of the most important and also the most challenging tasks.RFID systems typically consist of readers with antennas andRFID transponders. The reader-antenna pairs and the tags canbe fixed (deployed) or mobile. We are focusing on systems
T. Helfenbein is with Research Lab, Chebio Ltd., e-mail:[email protected]
R. Kiraly is with Institute of Mathemathics and Informatics, Es-zterhazy Karoly University of Applied Sciences, e-mail: [email protected]
M. Torocsik is with the Institute for Infocommunication Technolo-gies, Bay Zoltan Nonprofit Ltd. For Applied Research, e-mail: [email protected]
E. Toth is with the Institute for Infocommunication Technologies, BayZoltan Nonprofit Ltd. For Applied Research, e-mail: [email protected]
S. Kiraly is with the Institute of Mathemathics and Informatics, Es-zterhazy Karoly University of Applied Sciences, e-mail: [email protected]
The RFID research project was supported by the European Union and theState of Hungary, co-financed by the European Social Fund in the frameworkof TAMOP-4.2.2.C-11/1/KONV-2012-0014.
that have an infrastructure consisting of fixed reader-antennapairs and mobile tags on the objects that need to be localized.Mobile readers are not excluded from the system, but are notnecessarily parts of the infrastructure. In our research, threetypes of system architectures can be distinguished, namelySmart Reader Network (SRN), Smart Tag (ST) and Hybridarchitectures.
The SRN architecture consists of intelligent reader-antennapairs connected to a network or a computer server and inexpen-sive (e.g. passive UHF RFID) tags. In this system architecture,localization is made by the intelligent infrastructure (ambientintelligence) and location information is generated on theinfrastructure side. In the ST system, intelligent, active RFIDtags are used with (almost) traditional reader-antenna pairs. Inthis case, self-localization has to be done by the tag and the(self) location information is generated on the tag side. In thehybrid solution, concept SRN and ST are combined.
In conclusion, the article details our practical results inRFID based localization solutions. The prototype of a newgeneration of Smart Transponder is described in Section III,that is capable of self-localization based on information ob-tained from RFID antennas. Our ideas on hybrid applicationsand the combination of RFID systems with other technologiesare also detailed. The self-localizing transponder and thecon-nected middleware resting on mathematical foundations can beused with significantly greater precision for indoor localizationthan current devices.
In the following section, we analyse the RFID basedlocalization methods, systems and our previous works inSection II. Introducing the novel self localization concept isfollowed by the description of hardware prototype of SmartTag called BlackForest and localization methods in SectionIII. The results and measurements are demonstrated in officeenvironments in Section IV.
Localization methods are based on principles, models, mea-surements, and evaluation methods. A principle is a plan thatdetermines what parameters to model, measure, and evaluate.[1][2] In case of multilateration (or trilateration) we haveto determine distances using measurements and models, thusthe position can be estimated from the best candidates forintersection of spheres or circles. In case of triangulation wehave to determine angles and estimate position using the bestcandidates for intersection of directions given by the angles.We can also calculate position from distance differences usingthe best candidates for intersection of paraboloids.
Modelling is an important part of a localization system.Based on the principle, the environment and the given hard-ware devices we can assume different types of antenna models,

Extension of RFID Based Indoor LocalizationSystems With Smart Tags
SEPTEMBER 2017 • VOLUME IX • NUMBER 326
INFOCOMMUNICATIONS JOURNAL
INFOCOMMUNICATIONS JOURNAL, VOL. ??, NO. ?, FEBRUARY 2017 2
propagation models, kinematic models, and error models thatcan be used to refine measurements and create perceptionfrom the measured data. The result of the measurement isthe input of our models; thus, the measured parameters mustbe determined using the models and the selected principle.
Using triangulation we can measure the phase differenceof arrival (PoA), angle of arrival1 (AoA), or the angle ofdeparture2 (AoD). Using multilateration we can measure thetime of arrival3 (ToA) or the received signal strength (RSS).In the case of distance difference, we can measure the timedifference of arrival4(TDoA).
Evaluation is typically an optimisation using the measureddata and given models. Fingerprinting is a widely used methodfor evaluation that means we have to measure signal pa-rameters offline at different locations. Using the measuredsignal parameters we can infer to the best candidate from (orbetween) the recorded points.
II. RELATED WORKS
The ”You are here” (YAH) map is a basic type of localiza-tion system. Using acoustic, visual, or radio-frequency (RF)landmarks one can determine its location close to the land-mark. It can be used by humans or machines. The landmarkscan be QR codes or - in our case - NFC tags for instance.Fingerprinting based on a received signal strength indicator(RSSI) is often used for RFID localization [3] together withdifferent types of classification and machine learning methods[4][5].
Models based on RSSI and Probabilistic Localization Algo-rithm (PLA) are also used together [6]. Propagation and pathloss are modelled, and using the probabilistic distribution ofthe RSSI, location can be estimated by a Bayesian localizationscheme. Data analysis methods like multidimensional scaling(MDS) can be used to locate active RFID tags based on RSSmeasurements [7]. Phase difference (PoA) estimation usingmultiple antennas is often used to locate RFID tags [8][9].PoA can be augmented with other methods. At the readerside, reference tags and different reader output power settingstrategies can be used to locate a tag. [10][11]
RFID tags can be modified or extended with other technolo-gies to achieve the best results. Hybrid systems use acoustic[12], visual [13][14], or inertial sensor data [15]. SimultaneousLocalization and Mapping (SLAM) methods can be used todetermine the location of mobile readers and RFID tags.Typically, additional geometric information is needed [16]. Amodified tag called ”sense-a-tag” can measure backscatteringin the near field and save this kind of location information
1Angle of arrival (AoA) measurement is a method for determining thedirection of propagation of a radio-frequency wave incident on an antennaarray. AoA determines the direction by measuring the Time Difference ofArrival (TDoA) at individual elements of the array.
2Angle of Departure measurement is done when the transmitter transmitsthrough multiple antennas and the receiver resolves the angle of signaldeparture based on the received signals.
3ToA the travel time of a radio signal from a single transmitter to a remotesingle receiver.
4TDoA is the time differences between received signals measured withmultiple antennas. Each measurement defines a hyperboloid of possiblelocations of the transmitter.
[17]. Using an RFID reader and normal RFID tags placed onknown locations, the system can track ”sense-a-tags” attachedto the objects.
In our previous work, a novel antenna design and a localiza-tion concept were defined [19]. The novel device was calledan “Nodding antenna”, that can change its characteristics and”look” to 6 directions in space with different output power. Us-ing this, the RFID localization can be extended beyond the areacovered by the RFID reader system. The novel concept calledLocation on Tag (LoT) is a Smart Reader Network (SRN)based localization protocol that uses the limited memory ofthe passive RFID transponder to store location information.The Smart Readers can determine the position of the tag andthen write this current position into a circular list defined inthe tag memory. The path of the tags which are travellingwith this information can be reconstructed by other SmartReaders. A mathematical framework was developed to recoverthe possible path of moving RFID transponders in indoorenvironments [20][21]. This framework is suitable in caseswhen the tag becomes unreadable or enters into an uncoveredarea.
III. SELF LOCALIZATION METHODS AND THE HARDWAREPROTOTYPE
The Smart Tag (ST) RFID localization architecture is theinside out version of the SRN solution. In this case, tag self-localization is done onboard using an almost typical readerinfrastructure to estimate the own position of the tag in areference coordinate system.
The components of this ST system can be seen in Figure1. The system consists of multiple readers/transmitters withknown positions and IDs. These reader parameters should betransmitted to the Smart Tag. Using distance and/or angleestimations, Smart Tag can determine its position (usingtrilateration, triangulation or probability based methods). Inthe following sections we describe the requirements of com-ponents, measurements, methods, and the hardware/softwarecomponents of the Smart Tag localization system architecture.
To calculate the position the Smart Tag has to measuredistances or angles. We decided to measure the signal strengthindicator (RSSI) of the readers in real time. This can lead todistance estimation or angle calculation (in the case of objectrotating). The reader-antenna pairs have to be distinguished;therefore, the reader-antennas are broadcasting unique ID-s.Methods require the coordinates of the antennas for positionestimation; thus, the antenna ID-Coordinate pairs should betransmitted to the tag memory. Smart Tags have to executecomplex algorithms onboard, thus one needs enough memoryand computational capacity. Active (or semipassive) ones haveto be used, since an external power supply of the tag is needed.
The input signal for RSS based localization is sufferingfrom artifacts caused by filtering that is typically made bythe consumer RF receiver circuit/device to filter out dynamicchanges to produce more stable (and repeatable) RSS values.A method that uses propagation models can take advantage ofthe low level (raw) RSS signal but cannot deal with a signalthat is filtered and has low temporal resolution. Moreover, we
INFOCOMMUNICATIONS JOURNAL, VOL. ??, NO. ?, FEBRUARY 2017 3
designed a universal device to measure RSS values directly inour experiments. The device called BlackForest can monitorRF channels from an SMA5 antenna connector in real timefrom 100MHz to 1GHz with 1Hz resolution and mix it downto a 200-40000Hz baseband. The I and Q signal can beprocessed by analog-digital converters (ADs) of an audio cardsince I and Q signals are available on a 3.5mm stereo audiojack connector. The received sensitivity is adjustable from0 to 60 dB and the modulation method is also selectablefrom the list of ASK6, OOK7, BPSK8, FM9 and FSK10. Forfurther experiments and localization method evaluation, theBlackForest device has a 3D gyroscope and an accelerometer.
To have a complete system, BlackForest can also transmit(Rx and Tx adjustable with jumper), and the transmissionfrequency is also adjustable. The panel is supplied by external5V, the other components are supplied via LDO11 moduleswith 3.3V and 2.4V regulated outputs.
The transmission and the received functionality make Black-Forest a universal platform to evaluate experimental local-ization methods without a large amount of deployable, fixedRFID reader-antenna pairs. Furthermore, it is possible toanalyse different situations, system configurations, and scales.In a current setup, the readers are BlackForest-Tx nodes andthe node that is being localized is a BlackForest-Rx node andit is connected to a sound card in a PC. The transmissionfrequency is in the 868 MHz band, the frequency of channeln is 868MHz + n ∗ 1KHz. We identify reader nodes usingfrequency division multiplexing (FDM), which means thateach reader transmits signals at different frequencies. Thereceived signal strength at a given reader frequency means adistance candidate with error factors such as path attenuation.Localization methods can take into account these error factorsusing propagation models and/or mapping. Using the Black-Forest hardware, our goal is to analyze the applicability ofdifferent propagation models for RFID localization solutionsin different environments.
The arrangement of the infrastructure is also an importantpart of our research, therefore we were considering differentoptimization methods to find optimal positions of the readers(beacons) in a given environment. To ensure a higher spa-tial and temporal quality of RFID localization, transpondershave to be extended with sensors that can measure relativedisplacement and rotation of the tag between RF localizationmeasurements or in areas that are not covered by readers.
5SMA (SubMiniature version A) connectors are semi-precision coaxial RFconnectors.
6Amplitude-Shift Keying is a form of amplitude modulation that representsdigital data as variations in the amplitude of a carrier wave.
7On-Off Keying denotes the simplest form of Amplitude-Shift Keying(ASK) modulation that represents digital data at the presence or absence ofa carrier wave.
8Binary Phase-Shift Keying is the simplest variant of Phase-Shift Keyingand conveys data by switching the phase of a reference signal.
9Frequency Modulation is the encoding of information in a carrier waveby varying the instantaneous frequency of the wave.
10Frequency-Shift Keying is a frequency modulation scheme in whichdigital information is transmitted through discrete frequency changes of acarrier signal
11A low-dropout or LDO regulator is a DC linear voltage regulator thatcan regulate the output voltage even when the supply voltage is very close tothe output voltage.
Fig. 1. BlackForest Smart Tag localization arrangement
Inertial sensors like the accelerometer and gyroscope can helpto increase the temporal resolution of the localization. There-fore, we designed BlackForest to be able to measure 3 axes ofacceleration and angular velocity using an accelerometer and agyroscope IC. After choosing the sensors, we considered highlevel sensor fusion methods to increase the quality of the RFlocalization using the inertial measurements.
The basic BlackForest positioning system (Figure 1) con-sists of at least 3 BlackForest as transmitters: T1, T2, T3 andat least one BlackForest Smart Tag as an active receiver:SmartTag. The transmitters T1, T2, T3 are configured asRFID transmitters (Tx nodes) and the receiver SmartTagis configured as a receiver node (Rx node). Transmittersare arranged in a nodes of a triangle on a plane, thus, thepositioning area is the area covered by at least 3 transmitters.This can be seen in Figure 2.
Fig. 2. BlackForest transmitter coverages
To locate the BlackForest SmartTag, we use a log distancepath loss model (LDPL). This expresses a relationship betweenthe received signal strength (RSS) and the distance from thetransmitter [22].
Prx = Ptx − Pref − 10α log d−Xσ (1)
Here, Prx is the power of received signal (RSS), Ptx is thetransmitter output power, Pref is the received signal powerat the reference distance (1m), d is the unknown distance

Extension of RFID Based Indoor LocalizationSystems With Smart Tags
INFOCOMMUNICATIONS JOURNAL
SEPTEMBER 2017 • VOLUME IX • NUMBER 3 27
INFOCOMMUNICATIONS JOURNAL, VOL. ??, NO. ?, FEBRUARY 2017 2
propagation models, kinematic models, and error models thatcan be used to refine measurements and create perceptionfrom the measured data. The result of the measurement isthe input of our models; thus, the measured parameters mustbe determined using the models and the selected principle.
Using triangulation we can measure the phase differenceof arrival (PoA), angle of arrival1 (AoA), or the angle ofdeparture2 (AoD). Using multilateration we can measure thetime of arrival3 (ToA) or the received signal strength (RSS).In the case of distance difference, we can measure the timedifference of arrival4(TDoA).
Evaluation is typically an optimisation using the measureddata and given models. Fingerprinting is a widely used methodfor evaluation that means we have to measure signal pa-rameters offline at different locations. Using the measuredsignal parameters we can infer to the best candidate from (orbetween) the recorded points.
II. RELATED WORKS
The ”You are here” (YAH) map is a basic type of localiza-tion system. Using acoustic, visual, or radio-frequency (RF)landmarks one can determine its location close to the land-mark. It can be used by humans or machines. The landmarkscan be QR codes or - in our case - NFC tags for instance.Fingerprinting based on a received signal strength indicator(RSSI) is often used for RFID localization [3] together withdifferent types of classification and machine learning methods[4][5].
Models based on RSSI and Probabilistic Localization Algo-rithm (PLA) are also used together [6]. Propagation and pathloss are modelled, and using the probabilistic distribution ofthe RSSI, location can be estimated by a Bayesian localizationscheme. Data analysis methods like multidimensional scaling(MDS) can be used to locate active RFID tags based on RSSmeasurements [7]. Phase difference (PoA) estimation usingmultiple antennas is often used to locate RFID tags [8][9].PoA can be augmented with other methods. At the readerside, reference tags and different reader output power settingstrategies can be used to locate a tag. [10][11]
RFID tags can be modified or extended with other technolo-gies to achieve the best results. Hybrid systems use acoustic[12], visual [13][14], or inertial sensor data [15]. SimultaneousLocalization and Mapping (SLAM) methods can be used todetermine the location of mobile readers and RFID tags.Typically, additional geometric information is needed [16]. Amodified tag called ”sense-a-tag” can measure backscatteringin the near field and save this kind of location information
1Angle of arrival (AoA) measurement is a method for determining thedirection of propagation of a radio-frequency wave incident on an antennaarray. AoA determines the direction by measuring the Time Difference ofArrival (TDoA) at individual elements of the array.
2Angle of Departure measurement is done when the transmitter transmitsthrough multiple antennas and the receiver resolves the angle of signaldeparture based on the received signals.
3ToA the travel time of a radio signal from a single transmitter to a remotesingle receiver.
4TDoA is the time differences between received signals measured withmultiple antennas. Each measurement defines a hyperboloid of possiblelocations of the transmitter.
[17]. Using an RFID reader and normal RFID tags placed onknown locations, the system can track ”sense-a-tags” attachedto the objects.
In our previous work, a novel antenna design and a localiza-tion concept were defined [19]. The novel device was calledan “Nodding antenna”, that can change its characteristics and”look” to 6 directions in space with different output power. Us-ing this, the RFID localization can be extended beyond the areacovered by the RFID reader system. The novel concept calledLocation on Tag (LoT) is a Smart Reader Network (SRN)based localization protocol that uses the limited memory ofthe passive RFID transponder to store location information.The Smart Readers can determine the position of the tag andthen write this current position into a circular list defined inthe tag memory. The path of the tags which are travellingwith this information can be reconstructed by other SmartReaders. A mathematical framework was developed to recoverthe possible path of moving RFID transponders in indoorenvironments [20][21]. This framework is suitable in caseswhen the tag becomes unreadable or enters into an uncoveredarea.
III. SELF LOCALIZATION METHODS AND THE HARDWAREPROTOTYPE
The Smart Tag (ST) RFID localization architecture is theinside out version of the SRN solution. In this case, tag self-localization is done onboard using an almost typical readerinfrastructure to estimate the own position of the tag in areference coordinate system.
The components of this ST system can be seen in Figure1. The system consists of multiple readers/transmitters withknown positions and IDs. These reader parameters should betransmitted to the Smart Tag. Using distance and/or angleestimations, Smart Tag can determine its position (usingtrilateration, triangulation or probability based methods). Inthe following sections we describe the requirements of com-ponents, measurements, methods, and the hardware/softwarecomponents of the Smart Tag localization system architecture.
To calculate the position the Smart Tag has to measuredistances or angles. We decided to measure the signal strengthindicator (RSSI) of the readers in real time. This can lead todistance estimation or angle calculation (in the case of objectrotating). The reader-antenna pairs have to be distinguished;therefore, the reader-antennas are broadcasting unique ID-s.Methods require the coordinates of the antennas for positionestimation; thus, the antenna ID-Coordinate pairs should betransmitted to the tag memory. Smart Tags have to executecomplex algorithms onboard, thus one needs enough memoryand computational capacity. Active (or semipassive) ones haveto be used, since an external power supply of the tag is needed.
The input signal for RSS based localization is sufferingfrom artifacts caused by filtering that is typically made bythe consumer RF receiver circuit/device to filter out dynamicchanges to produce more stable (and repeatable) RSS values.A method that uses propagation models can take advantage ofthe low level (raw) RSS signal but cannot deal with a signalthat is filtered and has low temporal resolution. Moreover, we
INFOCOMMUNICATIONS JOURNAL, VOL. ??, NO. ?, FEBRUARY 2017 3
designed a universal device to measure RSS values directly inour experiments. The device called BlackForest can monitorRF channels from an SMA5 antenna connector in real timefrom 100MHz to 1GHz with 1Hz resolution and mix it downto a 200-40000Hz baseband. The I and Q signal can beprocessed by analog-digital converters (ADs) of an audio cardsince I and Q signals are available on a 3.5mm stereo audiojack connector. The received sensitivity is adjustable from0 to 60 dB and the modulation method is also selectablefrom the list of ASK6, OOK7, BPSK8, FM9 and FSK10. Forfurther experiments and localization method evaluation, theBlackForest device has a 3D gyroscope and an accelerometer.
To have a complete system, BlackForest can also transmit(Rx and Tx adjustable with jumper), and the transmissionfrequency is also adjustable. The panel is supplied by external5V, the other components are supplied via LDO11 moduleswith 3.3V and 2.4V regulated outputs.
The transmission and the received functionality make Black-Forest a universal platform to evaluate experimental local-ization methods without a large amount of deployable, fixedRFID reader-antenna pairs. Furthermore, it is possible toanalyse different situations, system configurations, and scales.In a current setup, the readers are BlackForest-Tx nodes andthe node that is being localized is a BlackForest-Rx node andit is connected to a sound card in a PC. The transmissionfrequency is in the 868 MHz band, the frequency of channeln is 868MHz + n ∗ 1KHz. We identify reader nodes usingfrequency division multiplexing (FDM), which means thateach reader transmits signals at different frequencies. Thereceived signal strength at a given reader frequency means adistance candidate with error factors such as path attenuation.Localization methods can take into account these error factorsusing propagation models and/or mapping. Using the Black-Forest hardware, our goal is to analyze the applicability ofdifferent propagation models for RFID localization solutionsin different environments.
The arrangement of the infrastructure is also an importantpart of our research, therefore we were considering differentoptimization methods to find optimal positions of the readers(beacons) in a given environment. To ensure a higher spa-tial and temporal quality of RFID localization, transpondershave to be extended with sensors that can measure relativedisplacement and rotation of the tag between RF localizationmeasurements or in areas that are not covered by readers.
5SMA (SubMiniature version A) connectors are semi-precision coaxial RFconnectors.
6Amplitude-Shift Keying is a form of amplitude modulation that representsdigital data as variations in the amplitude of a carrier wave.
7On-Off Keying denotes the simplest form of Amplitude-Shift Keying(ASK) modulation that represents digital data at the presence or absence ofa carrier wave.
8Binary Phase-Shift Keying is the simplest variant of Phase-Shift Keyingand conveys data by switching the phase of a reference signal.
9Frequency Modulation is the encoding of information in a carrier waveby varying the instantaneous frequency of the wave.
10Frequency-Shift Keying is a frequency modulation scheme in whichdigital information is transmitted through discrete frequency changes of acarrier signal
11A low-dropout or LDO regulator is a DC linear voltage regulator thatcan regulate the output voltage even when the supply voltage is very close tothe output voltage.
Fig. 1. BlackForest Smart Tag localization arrangement
Inertial sensors like the accelerometer and gyroscope can helpto increase the temporal resolution of the localization. There-fore, we designed BlackForest to be able to measure 3 axes ofacceleration and angular velocity using an accelerometer and agyroscope IC. After choosing the sensors, we considered highlevel sensor fusion methods to increase the quality of the RFlocalization using the inertial measurements.
The basic BlackForest positioning system (Figure 1) con-sists of at least 3 BlackForest as transmitters: T1, T2, T3 andat least one BlackForest Smart Tag as an active receiver:SmartTag. The transmitters T1, T2, T3 are configured asRFID transmitters (Tx nodes) and the receiver SmartTagis configured as a receiver node (Rx node). Transmittersare arranged in a nodes of a triangle on a plane, thus, thepositioning area is the area covered by at least 3 transmitters.This can be seen in Figure 2.
Fig. 2. BlackForest transmitter coverages
To locate the BlackForest SmartTag, we use a log distancepath loss model (LDPL). This expresses a relationship betweenthe received signal strength (RSS) and the distance from thetransmitter [22].
Prx = Ptx − Pref − 10α log d−Xσ (1)
Here, Prx is the power of received signal (RSS), Ptx is thetransmitter output power, Pref is the received signal powerat the reference distance (1m), d is the unknown distance

Extension of RFID Based Indoor LocalizationSystems With Smart Tags
SEPTEMBER 2017 • VOLUME IX • NUMBER 328
INFOCOMMUNICATIONS JOURNAL
INFOCOMMUNICATIONS JOURNAL, VOL. ??, NO. ?, FEBRUARY 2017 4
from the transmitter to the receiver node, α is an exponentialmodel parameter and X is the term for further attenuation. Themeasurements can be done in multiple coordinates at differentdistances from the transmitters.
From these measurements, the model parameters (α,X) canbe estimated by using a nonlinear fitting method. In thiscase, the Levenberg–Marquardt algorithm12 was chosen tocalculate the parameters of the LDPL models. Transmitters canbroadcast their positions, IDs and the calibrated attenuationparameters, thus, these parameters are downloaded to the tag.
For a transmitter, the distance can be estimated using thefollowing formula:
d = 10−Prx−Poffset
10α (2)
where Poffset = Ptx − Pref .Once LDPL models are calibrated properly, the transmitter
can estimate the position by building a possibility map fromthe measured values and transmitter coordinates and LDPLparameters.
The transmitters are communicating their IDs (Ti),coordinates(xi, yi) and model parameters (Pi), therefore,when the SmartTag arrives into the positioning area itregisters these values into its memory:
D ={(T1, P1, x1, y1),
(T2, P2, x2, y2), (T3, P3, x3, y3)}(3)
BlackForest receiver node SmartTag measures RSS valuesfor each visible Ti transmitters and registers them with thetransmitter coordinates as measurements:
M ={(M1, P1, x1, y1),
(M2, P2, x2, y2), (M3, P3, x3, y3)}(4)
Possibility map onboard estimation is a hard task for embed-ded systems, therefore, the calculation is done in an equidistantgrid of NxM points over the positioning area. Possibilitiesfrom an individual distance measurement based on the LDPLmodel is represented as a Gaussian along a circle with theempiricaly set σ = 2.5m parameter. The maximum possibilityvalue can be chosen as SmartTag position candidate.
The transmitters are broadcasting multiple LDPL modelparameters depending on the context. This is formed in theattenuation parameter X . Typically, the parameters can bedetermined for each rooms in the building to model the atten-uation of the walls between the transmitter and the SmartTagnode. Since the tag can test multiple configurations of themodel parameters (depending on the room) for a measurementset , the best candidate with the highest possibility can bechosen.
Previous position and inertial sensor measurements overtime was used both as selectors for Area of Interest (AoI) andby filtering the current probablity map. A 2D Gaussian filter13
with σ = 2m was chosen and was used at the point that was
12The Levenberg–Marquardt algorithm is used to solve non-linear leastsquares problems. These minimization problems arise especially in leastsquares curve fitting.
13Gaussian filter is a filter whose impulse response is a Gaussian function(or an approximation to it).
estimated from of the previous locations and intertial sensormeasurements using an Extended Kalman Filter (EKF)14 [23].
An extended version of the BlackForest node (EBF) wasdeveloped with a 2D linear square array of 4 antennas. Thearray is capable of Angle of Arrival (AoA) measurements. Theestimation of the angles was done using the ESPRIT method[24][25]. Alternatively, the position with lower accuracy canbe calculated from these directions only, using the non-linearoptimization proposed in [26]. Although we used the directionsfrom the AoA measurements to futher filter the probabilitymap using multiple one-dimensional Gaussian filters with theempirically set σ = 1.5m parameter along the given direction.
The novel tag can be used in the previously developed RFIDlocalization system: Location on Tag (LoT) concept [19] waseasily adapted to the system since the location is determinedat the tag side.
To enhance the possibility of finding the location of thetag, all of the methods can be integrated in one system. SmartTag can determine and store its location and this data canbe sent to the readers. In this case, the reader can determinethe validity of the location of the Smart Tag. If it fails, thefollowing methods are performed.
In case of the Smart Reader localization method usingLoT [19], the locations (path) are in the tag memory. SmartReaders execute the defined LoT algorithms to determinethe path of the tag if the tag is in the covered area. If itis known that the tag is in the area but it cannot be readfor a while (e.g. because it is temporarily in an uncoveredarea), its position can still be estimated using the mathematicalframework (see in [20], [21]). Using these three methods,location can be determined or estimated in all cases and bya discrete time. This combination of localization methods issuitable for various indoor and outdoor localization tasks.
IV. RESULTS
BlackForrest receiver node measures RSS values utilizing868MHz frequency and −15dBm output power at the trans-mitter node. An Anritsu MT8222A BTS Master device wasplaced at different distances from the transmitter node. Theresults can be seen in Figure 4.
On the second floor of a typical office building (includingwalls) a room measuring 40m x 30m was chosen as the local-ization area. Positioning measurements using the LDPL modelwas started with the model calibration process (Figure 3).We measured RSS for different distances from the transmitterand fitted a model using the Levenberg–Marquardt algorithm(LMA).
We used 3 BlackForest nodes as transmitters and oneBlackForest SmartTag receiver node at the position X = 138and Y = 170. This arrangement is shown in Figure 5.
The framework can calculate the possibility of the tagposition in a co-ordinate. This can be visualized for a set ofmeasurement as a probability map. A calculated possibilitymap is shown in Figure 6. The maximum possibility is at the
14Kalman filtering is an algorithm that uses a series of measurementsobserved over time, containing statistical noise and other inaccuracies, andproduces estimates of unknown variables.
INFOCOMMUNICATIONS JOURNAL, VOL. ??, NO. ?, FEBRUARY 2017 5
Fig. 3. Measured RSS values at different distances (blue) used for calibrationand the fitted model (green)
Fig. 4. Measured and theoretical RSS values
coordinates X = 116 and Y = 144. For this measurement,RSS based the localization error is 3, 41m.
After the previous location based and DoA filtering process,estimation ended in X = 130 and Y = 166, thus, the overalllocalization error is 0.89m. These results can be seen in Figure7 and 8.
After single measurements, multiple measurements weredone and also multiple nodes were placed in the positioningarea. We measured 20 samples at different locations. Weused 2, 5 and 10 receiver nodes to analyze the effect of themultinode environment to the positioning accuracy. We foundthat the accuracy did not suffer of additional errors due to theincrease of the number of the SmartTags. The average resultscan be seen on Table I.
TABLE IPOSITIONING ERROR IN MULTINODE ENVIRONMENT
Number of SmartTags Average positioning error
1 0.92m
2 0.76m
5 0.87m
10 0.94m
Fig. 5. System arrangement: reference coordinate system (blue), Smart Tag(green), transmitter nodes (red)
Fig. 6. Possibility map in the resolution of 10 cm
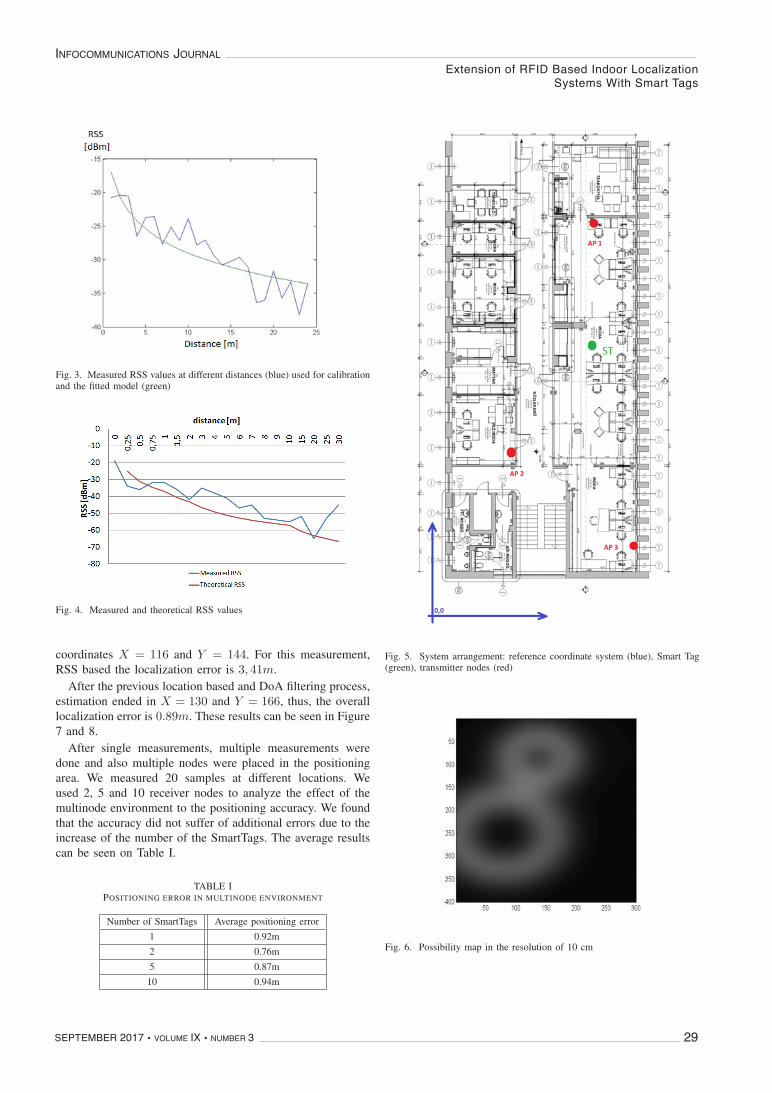
Extension of RFID Based Indoor LocalizationSystems With Smart Tags
INFOCOMMUNICATIONS JOURNAL
SEPTEMBER 2017 • VOLUME IX • NUMBER 3 29
INFOCOMMUNICATIONS JOURNAL, VOL. ??, NO. ?, FEBRUARY 2017 4
from the transmitter to the receiver node, α is an exponentialmodel parameter and X is the term for further attenuation. Themeasurements can be done in multiple coordinates at differentdistances from the transmitters.
From these measurements, the model parameters (α,X) canbe estimated by using a nonlinear fitting method. In thiscase, the Levenberg–Marquardt algorithm12 was chosen tocalculate the parameters of the LDPL models. Transmitters canbroadcast their positions, IDs and the calibrated attenuationparameters, thus, these parameters are downloaded to the tag.
For a transmitter, the distance can be estimated using thefollowing formula:
d = 10−Prx−Poffset
10α (2)
where Poffset = Ptx − Pref .Once LDPL models are calibrated properly, the transmitter
can estimate the position by building a possibility map fromthe measured values and transmitter coordinates and LDPLparameters.
The transmitters are communicating their IDs (Ti),coordinates(xi, yi) and model parameters (Pi), therefore,when the SmartTag arrives into the positioning area itregisters these values into its memory:
D ={(T1, P1, x1, y1),
(T2, P2, x2, y2), (T3, P3, x3, y3)}(3)
BlackForest receiver node SmartTag measures RSS valuesfor each visible Ti transmitters and registers them with thetransmitter coordinates as measurements:
M ={(M1, P1, x1, y1),
(M2, P2, x2, y2), (M3, P3, x3, y3)}(4)
Possibility map onboard estimation is a hard task for embed-ded systems, therefore, the calculation is done in an equidistantgrid of NxM points over the positioning area. Possibilitiesfrom an individual distance measurement based on the LDPLmodel is represented as a Gaussian along a circle with theempiricaly set σ = 2.5m parameter. The maximum possibilityvalue can be chosen as SmartTag position candidate.
The transmitters are broadcasting multiple LDPL modelparameters depending on the context. This is formed in theattenuation parameter X . Typically, the parameters can bedetermined for each rooms in the building to model the atten-uation of the walls between the transmitter and the SmartTagnode. Since the tag can test multiple configurations of themodel parameters (depending on the room) for a measurementset , the best candidate with the highest possibility can bechosen.
Previous position and inertial sensor measurements overtime was used both as selectors for Area of Interest (AoI) andby filtering the current probablity map. A 2D Gaussian filter13
with σ = 2m was chosen and was used at the point that was
12The Levenberg–Marquardt algorithm is used to solve non-linear leastsquares problems. These minimization problems arise especially in leastsquares curve fitting.
13Gaussian filter is a filter whose impulse response is a Gaussian function(or an approximation to it).
estimated from of the previous locations and intertial sensormeasurements using an Extended Kalman Filter (EKF)14 [23].
An extended version of the BlackForest node (EBF) wasdeveloped with a 2D linear square array of 4 antennas. Thearray is capable of Angle of Arrival (AoA) measurements. Theestimation of the angles was done using the ESPRIT method[24][25]. Alternatively, the position with lower accuracy canbe calculated from these directions only, using the non-linearoptimization proposed in [26]. Although we used the directionsfrom the AoA measurements to futher filter the probabilitymap using multiple one-dimensional Gaussian filters with theempirically set σ = 1.5m parameter along the given direction.
The novel tag can be used in the previously developed RFIDlocalization system: Location on Tag (LoT) concept [19] waseasily adapted to the system since the location is determinedat the tag side.
To enhance the possibility of finding the location of thetag, all of the methods can be integrated in one system. SmartTag can determine and store its location and this data canbe sent to the readers. In this case, the reader can determinethe validity of the location of the Smart Tag. If it fails, thefollowing methods are performed.
In case of the Smart Reader localization method usingLoT [19], the locations (path) are in the tag memory. SmartReaders execute the defined LoT algorithms to determinethe path of the tag if the tag is in the covered area. If itis known that the tag is in the area but it cannot be readfor a while (e.g. because it is temporarily in an uncoveredarea), its position can still be estimated using the mathematicalframework (see in [20], [21]). Using these three methods,location can be determined or estimated in all cases and bya discrete time. This combination of localization methods issuitable for various indoor and outdoor localization tasks.
IV. RESULTS
BlackForrest receiver node measures RSS values utilizing868MHz frequency and −15dBm output power at the trans-mitter node. An Anritsu MT8222A BTS Master device wasplaced at different distances from the transmitter node. Theresults can be seen in Figure 4.
On the second floor of a typical office building (includingwalls) a room measuring 40m x 30m was chosen as the local-ization area. Positioning measurements using the LDPL modelwas started with the model calibration process (Figure 3).We measured RSS for different distances from the transmitterand fitted a model using the Levenberg–Marquardt algorithm(LMA).
We used 3 BlackForest nodes as transmitters and oneBlackForest SmartTag receiver node at the position X = 138and Y = 170. This arrangement is shown in Figure 5.
The framework can calculate the possibility of the tagposition in a co-ordinate. This can be visualized for a set ofmeasurement as a probability map. A calculated possibilitymap is shown in Figure 6. The maximum possibility is at the
14Kalman filtering is an algorithm that uses a series of measurementsobserved over time, containing statistical noise and other inaccuracies, andproduces estimates of unknown variables.
INFOCOMMUNICATIONS JOURNAL, VOL. ??, NO. ?, FEBRUARY 2017 5
Fig. 3. Measured RSS values at different distances (blue) used for calibrationand the fitted model (green)
Fig. 4. Measured and theoretical RSS values
coordinates X = 116 and Y = 144. For this measurement,RSS based the localization error is 3, 41m.
After the previous location based and DoA filtering process,estimation ended in X = 130 and Y = 166, thus, the overalllocalization error is 0.89m. These results can be seen in Figure7 and 8.
After single measurements, multiple measurements weredone and also multiple nodes were placed in the positioningarea. We measured 20 samples at different locations. Weused 2, 5 and 10 receiver nodes to analyze the effect of themultinode environment to the positioning accuracy. We foundthat the accuracy did not suffer of additional errors due to theincrease of the number of the SmartTags. The average resultscan be seen on Table I.
TABLE IPOSITIONING ERROR IN MULTINODE ENVIRONMENT
Number of SmartTags Average positioning error
1 0.92m
2 0.76m
5 0.87m
10 0.94m
Fig. 5. System arrangement: reference coordinate system (blue), Smart Tag(green), transmitter nodes (red)
Fig. 6. Possibility map in the resolution of 10 cm
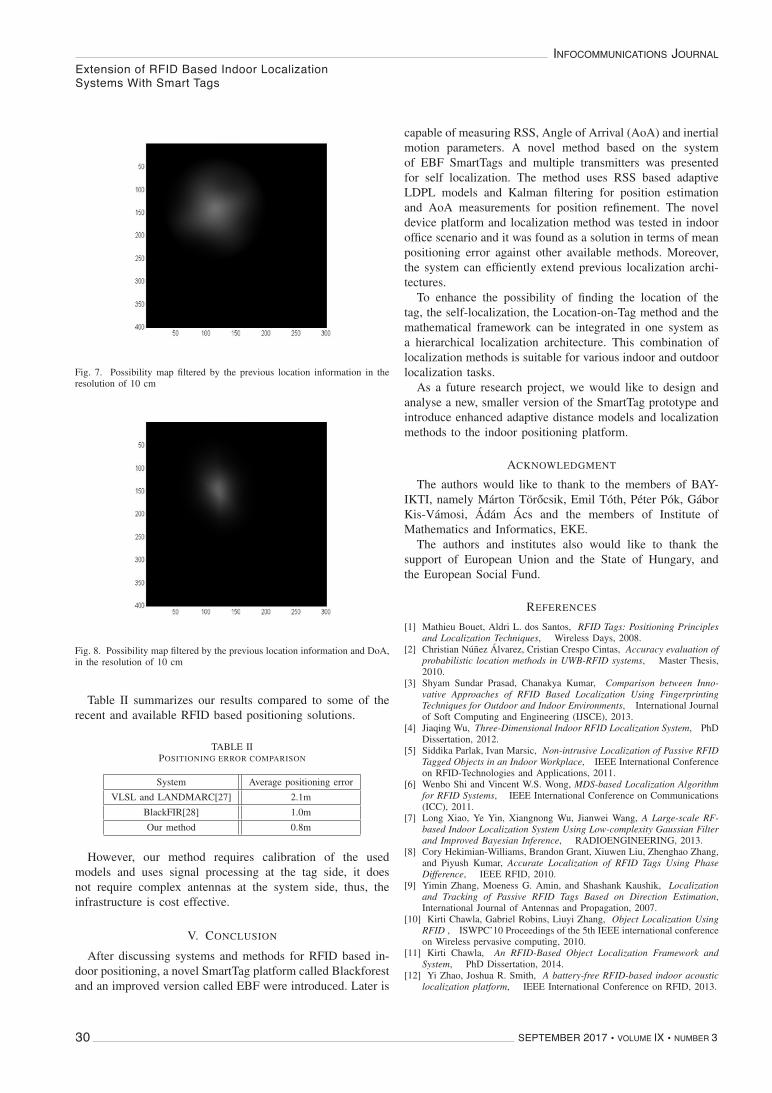
Extension of RFID Based Indoor LocalizationSystems With Smart Tags
SEPTEMBER 2017 • VOLUME IX • NUMBER 330
INFOCOMMUNICATIONS JOURNAL
INFOCOMMUNICATIONS JOURNAL, VOL. ??, NO. ?, FEBRUARY 2017 6
Fig. 7. Possibility map filtered by the previous location information in theresolution of 10 cm
Fig. 8. Possibility map filtered by the previous location information and DoA,in the resolution of 10 cm
Table II summarizes our results compared to some of therecent and available RFID based positioning solutions.
TABLE IIPOSITIONING ERROR COMPARISON
System Average positioning error
VLSL and LANDMARC[27] 2.1m
BlackFIR[28] 1.0m
Our method 0.8m
However, our method requires calibration of the usedmodels and uses signal processing at the tag side, it doesnot require complex antennas at the system side, thus, theinfrastructure is cost effective.
V. CONCLUSION
After discussing systems and methods for RFID based in-door positioning, a novel SmartTag platform called Blackforestand an improved version called EBF were introduced. Later is
capable of measuring RSS, Angle of Arrival (AoA) and inertialmotion parameters. A novel method based on the systemof EBF SmartTags and multiple transmitters was presentedfor self localization. The method uses RSS based adaptiveLDPL models and Kalman filtering for position estimationand AoA measurements for position refinement. The noveldevice platform and localization method was tested in indooroffice scenario and it was found as a solution in terms of meanpositioning error against other available methods. Moreover,the system can efficiently extend previous localization archi-tectures.
To enhance the possibility of finding the location of thetag, the self-localization, the Location-on-Tag method and themathematical framework can be integrated in one system asa hierarchical localization architecture. This combination oflocalization methods is suitable for various indoor and outdoorlocalization tasks.
As a future research project, we would like to design andanalyse a new, smaller version of the SmartTag prototype andintroduce enhanced adaptive distance models and localizationmethods to the indoor positioning platform.
ACKNOWLEDGMENT
The authors would like to thank to the members of BAY-IKTI, namely Marton Torocsik, Emil Toth, Peter Pok, GaborKis-Vamosi, Adam Acs and the members of Institute ofMathematics and Informatics, EKE.
The authors and institutes also would like to thank thesupport of European Union and the State of Hungary, andthe European Social Fund.
REFERENCES
[1] Mathieu Bouet, Aldri L. dos Santos, RFID Tags: Positioning Principlesand Localization Techniques, Wireless Days, 2008.
[2] Christian Nunez Alvarez, Cristian Crespo Cintas, Accuracy evaluation ofprobabilistic location methods in UWB-RFID systems, Master Thesis,2010.
[3] Shyam Sundar Prasad, Chanakya Kumar, Comparison between Inno-vative Approaches of RFID Based Localization Using FingerprintingTechniques for Outdoor and Indoor Environments, International Journalof Soft Computing and Engineering (IJSCE), 2013.
[4] Jiaqing Wu, Three-Dimensional Indoor RFID Localization System, PhDDissertation, 2012.
[5] Siddika Parlak, Ivan Marsic, Non-intrusive Localization of Passive RFIDTagged Objects in an Indoor Workplace, IEEE International Conferenceon RFID-Technologies and Applications, 2011.
[6] Wenbo Shi and Vincent W.S. Wong, MDS-based Localization Algorithmfor RFID Systems, IEEE International Conference on Communications(ICC), 2011.
[7] Long Xiao, Ye Yin, Xiangnong Wu, Jianwei Wang, A Large-scale RF-based Indoor Localization System Using Low-complexity Gaussian Filterand Improved Bayesian Inference, RADIOENGINEERING, 2013.
[8] Cory Hekimian-Williams, Brandon Grant, Xiuwen Liu, Zhenghao Zhang,and Piyush Kumar, Accurate Localization of RFID Tags Using PhaseDifference, IEEE RFID, 2010.
[9] Yimin Zhang, Moeness G. Amin, and Shashank Kaushik, Localizationand Tracking of Passive RFID Tags Based on Direction Estimation,International Journal of Antennas and Propagation, 2007.
[10] Kirti Chawla, Gabriel Robins, Liuyi Zhang, Object Localization UsingRFID , ISWPC’10 Proceedings of the 5th IEEE international conferenceon Wireless pervasive computing, 2010.
[11] Kirti Chawla, An RFID-Based Object Localization Framework andSystem, PhD Dissertation, 2014.
[12] Yi Zhao, Joshua R. Smith, A battery-free RFID-based indoor acousticlocalization platform, IEEE International Conference on RFID, 2013.
INFOCOMMUNICATIONS JOURNAL, VOL. ??, NO. ?, FEBRUARY 2017 7
[13] Songmin Jia, Jinbuo Sheng and Kunikatsu Takase, Development ofLocalization Method of Mobile Robot with RFID Technology and StereoVision, Computer Vision, ISBN 978-953-7619-21-3, 2008.
[14] Younes Raoui, El Houssine Bouyakhf, Michel Devy, Fakhita Regragui,Metrical Mapping and Self Localization with RFID Technology and VisualLandmarks, Applied Mathematical Sciences, Vol. 5, 2011.
[15] Alessio Levratti, Matteo Bonaiuti, Cristian Secchi, Cesare Fantuzzi, AnInertial/RFID Based Localization Method for Autonomous Lawnmowers,10th IFAC Symposium on Robot Control, 2012.
[16] Dirk Hahnel, Wolfram Burgard, Dieter Fox, Ken Fishkin, MatthaiPhilipose, Mapping and Localization with RFID Technology, ICRA’04. 2004 IEEE International Conference on Robotics and Automation,2004.
[17] Akshay Athalye, Vladimir Savic, Miodrag Bolic, Petar M. Djuric, NovelSemi-Passive RFID System for Indoor Localization, IEEE SensorsJournal, 2013.
[18] Intelliflex On-Demand Data Visibilty - Intelliflex Readers,http://www.intelleflex.com/Products.asp
[19] Roland Kiraly, Tamas Helfenbein, Sandor Kiraly, Emod Kovacs andTamas Balla, Novel concepts and devices in RFID based indoorlocalization using Smart Reader Networks and Intelligent Antennas,Infocommunications Journal, Volume IX. Number 2., 2017.
[20] Zoltan Ruzsab, Zsolt Parisekb, Roland Kiraly, Tibor Tomacs, TamasSzakacs, Henrik Hajagos, Build a mathematic based RFID localizationframework, Annales Mathematicas et Informaticae 44 (2015), selectedpapers Selected papers of the 9th International Conference on AppliedInformatics ISSN 1787-5021 (Print) ISSN 1787-6117 (Online) 165-176
[21] Szakacs Tamas, Ruzsa Zoltan, Kiraly Roland, Parisek Zsolt,Mathematics-based localizaion framework, Networkshop 2014, ISBN:978-963-88335-5-6, 2014.
[22] Scott Y. Seidel, Theodore S. Rappaport, 914 MHz Path Loss PredictionModels for Indoor Wireless Communications in Multifloored Buildings,IEEE Transactions on Antennas and Propagation, Vol. 40, No. 2, 1992.
[23] Simon Lynen, Markus W. Achtelik, Stephan Weiss, Margarita Chli,Roland Siegwart, A robust and modular multi-sensor fusion approachapplied to MAV navigation, IEEE/RSJ International Conference onIntelligent Robots and Systems (IROS), 2013
[24] Konstantinos Papakonstantinou, Dirk Slock, ESPRIT-Based Estimationof Location and Motion Dependent Parameters, Vehicular TechnologyConference, 2009. VTC Spring 2009. IEEE 69th
[25] S. Al-Jazzar, J. Caffery ESPRIT-based joint AOA/delay estimation forCDMA systems, Wireless Communications and Networking Conference,2004. WCNC. 2004 IEEE
[26] Helfenbein Tamas, Toth Andras Laser-Based Mobile Robot PositioningSystem, ROBOTICS’08, VISION IN ROBOTICS. Brasov, 2008, pp.323-330.
[27] Kun-Ming Yu, Ming-Gong Lee, Hung-Nien Hsieh, Wu-Cheng Lai Im-plementation of an RFID-Based Virtual Signal Mechanism for an IndoorLocation Sensing System, Journal of Internet Technology, 02.2013
[28] Fraunhofer IIS BLACKFIR Adaptive Localization Technologies,https://www.iis.fraunhofer.de/en/ff/lv/lok.html Visited:2017.10.15
Tamas Helfenbein received the M.Sc. degree fromthe Budapest University of Technology and Eco-nomics (BME) in 2008. Between 2006 and 2008,he worked on the research and development ofinformation and database systems of large datasets atthe Research Institute of Physics (KFKI), HungarianAcademy of Sciences (HAS). From 2006, he is alecturer of database and information systems coursesat Forrai School. Between 2008 and 2011, duringhe was attended the doctoral school of BME, heworked as a scholar researcher at the Bay Zoltan
Foundation for Applied Research (BZAKA). At the foundation and theuniversity, he participated in several international research and developmentprojects on machine vision, image processing, wireless sensor systems andambient intelligence. From 2008, he teaches laboratory measurement practicesat the university. From 2008-2014, he was working as a lead researcher at theInstitute of Infocommunications Technology, Bay Zoltan Nonprofit Ltd. forApplied Research (BAY-IKTI), and currently, he is working as a researcherat Chebio Ltd. and focuses on embedded systems, wireless sensor networks,image processing, and machine vision as main research areas.
Roland Kiraly In 2002 he graduated from Es-zterhazy Karoly University of Applied Sciences asan ICT teacher. He gained his MSc in 2005 atVeszprem University. He attended his PhD course atthe Institute of Informatics at ELTE University andobtained doctorate in 2015. He has been teaching atEszterhazy Karoly College since 2002, now he is anassociate professor of the Institute of Mathematicsand Informatics. Between 2006 – 2012, he was amember of a research team dealing with RefactoringErlang Programs at ELTE Univerity. In 2011, he
was appointed the Secretary of the Magyar Rektori Tanacs Informatikaies Tudomanyos Bizottsag. Since 2013, he has been the head of the EKFRFID/NFC research team. This research focuses on the RFID/NFC technolo-gies and Future Internet. In 2007, 2008 and 2009 – he received scolarshipat Eotvos Lorand University – Institute of Informatics IKKK. In 2013 and2014, he received Jedlik Anyos Doctoral Scolarship for research activities.This research was supported by the European Union and the State of Hungary,co-financed by the European Social Fund in the framework of TAMOP 4.2.4.A/2-11-1-2012-0001 National Excellence Program.
Marton Torocsik has a Master’s degree in ElectricalEngineering, which he earned at Obuda University.His thesis work was in Phase-locked Loop tech-nique. Currently he works at Bay Zoltan NonprofitLtd. for Applied Research as a researcher, and worksin the field of RFID and RF based localisation.
Emil Toth received the M.Sc. degree as an electricalengineer from the Budapest University of Technol-ogy and Economics (BME) in 2013. During theM.Sc. studies his main research field was radar tech-nology, especially Synthetic-aperture radar (SAR)and X band imaging. His thesis dealt with SARimaging of the International Space Station. Since2013 he works at the Bay Zoltan Nonprofit Ltd.for Applied Research as a researcher. He contributedwith signal processing expertise in several projectsrelated to the field of RF-based localization, the
design and implementation of localization algorithms. Currently he workson developing mobile-based localization technologies.
Sandor Kiraly in 1995 he graduated from the Uni-versity of Debrecen as an ICT teacher. He attendedhis PhD course at the Institute of Informatics at theUniversity of Debrecen and obtained doctorate in2013. He has been teaching at Eszterhazy KarolyCollege since 2010, now he is an associate professorof the Institute of Mathematics and Informatics.Since 2013, he has been working as a researcherin the EKF RFID/NFC research team. This researchfocuses on the RFID/NFC technologies and FutureInternet.

Extension of RFID Based Indoor LocalizationSystems With Smart Tags
INFOCOMMUNICATIONS JOURNAL
SEPTEMBER 2017 • VOLUME IX • NUMBER 3 31
INFOCOMMUNICATIONS JOURNAL, VOL. ??, NO. ?, FEBRUARY 2017 6
Fig. 7. Possibility map filtered by the previous location information in theresolution of 10 cm
Fig. 8. Possibility map filtered by the previous location information and DoA,in the resolution of 10 cm
Table II summarizes our results compared to some of therecent and available RFID based positioning solutions.
TABLE IIPOSITIONING ERROR COMPARISON
System Average positioning error
VLSL and LANDMARC[27] 2.1m
BlackFIR[28] 1.0m
Our method 0.8m
However, our method requires calibration of the usedmodels and uses signal processing at the tag side, it doesnot require complex antennas at the system side, thus, theinfrastructure is cost effective.
V. CONCLUSION
After discussing systems and methods for RFID based in-door positioning, a novel SmartTag platform called Blackforestand an improved version called EBF were introduced. Later is
capable of measuring RSS, Angle of Arrival (AoA) and inertialmotion parameters. A novel method based on the systemof EBF SmartTags and multiple transmitters was presentedfor self localization. The method uses RSS based adaptiveLDPL models and Kalman filtering for position estimationand AoA measurements for position refinement. The noveldevice platform and localization method was tested in indooroffice scenario and it was found as a solution in terms of meanpositioning error against other available methods. Moreover,the system can efficiently extend previous localization archi-tectures.
To enhance the possibility of finding the location of thetag, the self-localization, the Location-on-Tag method and themathematical framework can be integrated in one system asa hierarchical localization architecture. This combination oflocalization methods is suitable for various indoor and outdoorlocalization tasks.
As a future research project, we would like to design andanalyse a new, smaller version of the SmartTag prototype andintroduce enhanced adaptive distance models and localizationmethods to the indoor positioning platform.
ACKNOWLEDGMENT
The authors would like to thank to the members of BAY-IKTI, namely Marton Torocsik, Emil Toth, Peter Pok, GaborKis-Vamosi, Adam Acs and the members of Institute ofMathematics and Informatics, EKE.
The authors and institutes also would like to thank thesupport of European Union and the State of Hungary, andthe European Social Fund.
REFERENCES
[1] Mathieu Bouet, Aldri L. dos Santos, RFID Tags: Positioning Principlesand Localization Techniques, Wireless Days, 2008.
[2] Christian Nunez Alvarez, Cristian Crespo Cintas, Accuracy evaluation ofprobabilistic location methods in UWB-RFID systems, Master Thesis,2010.
[3] Shyam Sundar Prasad, Chanakya Kumar, Comparison between Inno-vative Approaches of RFID Based Localization Using FingerprintingTechniques for Outdoor and Indoor Environments, International Journalof Soft Computing and Engineering (IJSCE), 2013.
[4] Jiaqing Wu, Three-Dimensional Indoor RFID Localization System, PhDDissertation, 2012.
[5] Siddika Parlak, Ivan Marsic, Non-intrusive Localization of Passive RFIDTagged Objects in an Indoor Workplace, IEEE International Conferenceon RFID-Technologies and Applications, 2011.
[6] Wenbo Shi and Vincent W.S. Wong, MDS-based Localization Algorithmfor RFID Systems, IEEE International Conference on Communications(ICC), 2011.
[7] Long Xiao, Ye Yin, Xiangnong Wu, Jianwei Wang, A Large-scale RF-based Indoor Localization System Using Low-complexity Gaussian Filterand Improved Bayesian Inference, RADIOENGINEERING, 2013.
[8] Cory Hekimian-Williams, Brandon Grant, Xiuwen Liu, Zhenghao Zhang,and Piyush Kumar, Accurate Localization of RFID Tags Using PhaseDifference, IEEE RFID, 2010.
[9] Yimin Zhang, Moeness G. Amin, and Shashank Kaushik, Localizationand Tracking of Passive RFID Tags Based on Direction Estimation,International Journal of Antennas and Propagation, 2007.
[10] Kirti Chawla, Gabriel Robins, Liuyi Zhang, Object Localization UsingRFID , ISWPC’10 Proceedings of the 5th IEEE international conferenceon Wireless pervasive computing, 2010.
[11] Kirti Chawla, An RFID-Based Object Localization Framework andSystem, PhD Dissertation, 2014.
[12] Yi Zhao, Joshua R. Smith, A battery-free RFID-based indoor acousticlocalization platform, IEEE International Conference on RFID, 2013.
INFOCOMMUNICATIONS JOURNAL, VOL. ??, NO. ?, FEBRUARY 2017 7
[13] Songmin Jia, Jinbuo Sheng and Kunikatsu Takase, Development ofLocalization Method of Mobile Robot with RFID Technology and StereoVision, Computer Vision, ISBN 978-953-7619-21-3, 2008.
[14] Younes Raoui, El Houssine Bouyakhf, Michel Devy, Fakhita Regragui,Metrical Mapping and Self Localization with RFID Technology and VisualLandmarks, Applied Mathematical Sciences, Vol. 5, 2011.
[15] Alessio Levratti, Matteo Bonaiuti, Cristian Secchi, Cesare Fantuzzi, AnInertial/RFID Based Localization Method for Autonomous Lawnmowers,10th IFAC Symposium on Robot Control, 2012.
[16] Dirk Hahnel, Wolfram Burgard, Dieter Fox, Ken Fishkin, MatthaiPhilipose, Mapping and Localization with RFID Technology, ICRA’04. 2004 IEEE International Conference on Robotics and Automation,2004.
[17] Akshay Athalye, Vladimir Savic, Miodrag Bolic, Petar M. Djuric, NovelSemi-Passive RFID System for Indoor Localization, IEEE SensorsJournal, 2013.
[18] Intelliflex On-Demand Data Visibilty - Intelliflex Readers,http://www.intelleflex.com/Products.asp
[19] Roland Kiraly, Tamas Helfenbein, Sandor Kiraly, Emod Kovacs andTamas Balla, Novel concepts and devices in RFID based indoorlocalization using Smart Reader Networks and Intelligent Antennas,Infocommunications Journal, Volume IX. Number 2., 2017.
[20] Zoltan Ruzsab, Zsolt Parisekb, Roland Kiraly, Tibor Tomacs, TamasSzakacs, Henrik Hajagos, Build a mathematic based RFID localizationframework, Annales Mathematicas et Informaticae 44 (2015), selectedpapers Selected papers of the 9th International Conference on AppliedInformatics ISSN 1787-5021 (Print) ISSN 1787-6117 (Online) 165-176
[21] Szakacs Tamas, Ruzsa Zoltan, Kiraly Roland, Parisek Zsolt,Mathematics-based localizaion framework, Networkshop 2014, ISBN:978-963-88335-5-6, 2014.
[22] Scott Y. Seidel, Theodore S. Rappaport, 914 MHz Path Loss PredictionModels for Indoor Wireless Communications in Multifloored Buildings,IEEE Transactions on Antennas and Propagation, Vol. 40, No. 2, 1992.
[23] Simon Lynen, Markus W. Achtelik, Stephan Weiss, Margarita Chli,Roland Siegwart, A robust and modular multi-sensor fusion approachapplied to MAV navigation, IEEE/RSJ International Conference onIntelligent Robots and Systems (IROS), 2013
[24] Konstantinos Papakonstantinou, Dirk Slock, ESPRIT-Based Estimationof Location and Motion Dependent Parameters, Vehicular TechnologyConference, 2009. VTC Spring 2009. IEEE 69th
[25] S. Al-Jazzar, J. Caffery ESPRIT-based joint AOA/delay estimation forCDMA systems, Wireless Communications and Networking Conference,2004. WCNC. 2004 IEEE
[26] Helfenbein Tamas, Toth Andras Laser-Based Mobile Robot PositioningSystem, ROBOTICS’08, VISION IN ROBOTICS. Brasov, 2008, pp.323-330.
[27] Kun-Ming Yu, Ming-Gong Lee, Hung-Nien Hsieh, Wu-Cheng Lai Im-plementation of an RFID-Based Virtual Signal Mechanism for an IndoorLocation Sensing System, Journal of Internet Technology, 02.2013
[28] Fraunhofer IIS BLACKFIR Adaptive Localization Technologies,https://www.iis.fraunhofer.de/en/ff/lv/lok.html Visited:2017.10.15
Tamas Helfenbein received the M.Sc. degree fromthe Budapest University of Technology and Eco-nomics (BME) in 2008. Between 2006 and 2008,he worked on the research and development ofinformation and database systems of large datasets atthe Research Institute of Physics (KFKI), HungarianAcademy of Sciences (HAS). From 2006, he is alecturer of database and information systems coursesat Forrai School. Between 2008 and 2011, duringhe was attended the doctoral school of BME, heworked as a scholar researcher at the Bay Zoltan
Foundation for Applied Research (BZAKA). At the foundation and theuniversity, he participated in several international research and developmentprojects on machine vision, image processing, wireless sensor systems andambient intelligence. From 2008, he teaches laboratory measurement practicesat the university. From 2008-2014, he was working as a lead researcher at theInstitute of Infocommunications Technology, Bay Zoltan Nonprofit Ltd. forApplied Research (BAY-IKTI), and currently, he is working as a researcherat Chebio Ltd. and focuses on embedded systems, wireless sensor networks,image processing, and machine vision as main research areas.
Roland Kiraly In 2002 he graduated from Es-zterhazy Karoly University of Applied Sciences asan ICT teacher. He gained his MSc in 2005 atVeszprem University. He attended his PhD course atthe Institute of Informatics at ELTE University andobtained doctorate in 2015. He has been teaching atEszterhazy Karoly College since 2002, now he is anassociate professor of the Institute of Mathematicsand Informatics. Between 2006 – 2012, he was amember of a research team dealing with RefactoringErlang Programs at ELTE Univerity. In 2011, he
was appointed the Secretary of the Magyar Rektori Tanacs Informatikaies Tudomanyos Bizottsag. Since 2013, he has been the head of the EKFRFID/NFC research team. This research focuses on the RFID/NFC technolo-gies and Future Internet. In 2007, 2008 and 2009 – he received scolarshipat Eotvos Lorand University – Institute of Informatics IKKK. In 2013 and2014, he received Jedlik Anyos Doctoral Scolarship for research activities.This research was supported by the European Union and the State of Hungary,co-financed by the European Social Fund in the framework of TAMOP 4.2.4.A/2-11-1-2012-0001 National Excellence Program.
Marton Torocsik has a Master’s degree in ElectricalEngineering, which he earned at Obuda University.His thesis work was in Phase-locked Loop tech-nique. Currently he works at Bay Zoltan NonprofitLtd. for Applied Research as a researcher, and worksin the field of RFID and RF based localisation.
Emil Toth received the M.Sc. degree as an electricalengineer from the Budapest University of Technol-ogy and Economics (BME) in 2013. During theM.Sc. studies his main research field was radar tech-nology, especially Synthetic-aperture radar (SAR)and X band imaging. His thesis dealt with SARimaging of the International Space Station. Since2013 he works at the Bay Zoltan Nonprofit Ltd.for Applied Research as a researcher. He contributedwith signal processing expertise in several projectsrelated to the field of RF-based localization, the
design and implementation of localization algorithms. Currently he workson developing mobile-based localization technologies.
Sandor Kiraly in 1995 he graduated from the Uni-versity of Debrecen as an ICT teacher. He attendedhis PhD course at the Institute of Informatics at theUniversity of Debrecen and obtained doctorate in2013. He has been teaching at Eszterhazy KarolyCollege since 2010, now he is an associate professorof the Institute of Mathematics and Informatics.Since 2013, he has been working as a researcherin the EKF RFID/NFC research team. This researchfocuses on the RFID/NFC technologies and FutureInternet.
Tamás Helfenbein received the M.Sc. degree from the Budapest University of Technology and Economics (BME) in 2008. Between 2006 and 2008, he worked on the research and development of information and database systems of large datasets at the Research Institute of Physics (KFKI), Hungarian Academy of Sciences (HAS). From 2006, he is a lecturer of database and information systems courses at Forrai School. Between 2008 and 2011, during he was attended the doctoral school of BME, he
worked as a scholar researcher at the Bay Zoltán Foundation for Applied Research (BZAKA). At the foundation and the university, he participated in several international research and development projects on machine vision, image processing, wireless sensor systems and ambient intelligence. From 2008, he teaches laboratory measurement practices at the university. From 2008-2014, he was working as a lead researcher at the Institute of Infocommunications Technology, Bay Zoltán Nonprofit Ltd. for Applied Research (BAY-IKTI), and currently, he is working as a researcher at Chebio Ltd. and focuses on embedded systems, wireless sensor networks, image processing, and machine vision as main research areas.
Roland Király In 2002 he graduated from Eszterházy Károly University as an ICT teacher. He gained his MSc in 2005 at Veszprém University. He attended his PhD course at the Institute of Informatics at ELTE University and obtained doctorate in 2015. He has been teaching at Eszterházy Károly University since 2002, now he is an associate professor of the Institute of Mathematics and Informatics. Between 2006 – 2012, he was a member of a
research team dealing with Refactoring Erlang Programs at ELTE Univerity. In 2011, he was appointed the Secretary of the Magyar Rektori Tanács Informatikai és Tudományos Bizottság. Since 2013, he has been the head of the EKF RFID/NFC research team. This research focuses on the RFID/NFC technologies and Future Internet. In 2007, 2008 and 2009 – he received scolarship at Eötvös Lóránd University – Institute of Informatics IKKK. In 2013 and 2014, he received Jedlik Ányos Doctoral Scolarship for research activities. This research was supported by the European Union and the State of Hungary, co-financed by the European Social Fund in the framework of TÁMOP 4.2.4. A/2-11-1-2012-0001 National Excellence Program.
Márton Törőcsik has a Master’s degree in Electrical Engineering, which he earned at Óbuda University. His thesis work was in Phase-locked Loop technique. Currently he works at Bay Zoltán Nonprofit Ltd. for Applied Research as a researcher, and works in the field of RFID and RF based localisation.
Emil Tóth received the M.Sc. degree as an electrical engineer from the Budapest University of Technology and Economics (BME) in 2013. During the M.Sc. studies his main research field was radar technology, especially Synthetic-aperture radar (SAR) and X band imaging. His thesis dealt with SAR imaging of the International Space Station. Since 2013 he works at the Bay Zoltán Nonprofit Ltd. for Applied Research as a researcher. He contributed with signal processing expertise in
several projects related to the field of RF-based localization, the design and implementation of localization algorithms. Currently he works on developing mobile-based localization technologies.
Sándor Király in 1995 he graduated from the University of Debrecen as an ICT teacher. He attended his PhD course at the Institute of Informatics at the University of Debrecen and obtained doctorate in 2013. He has been teaching at Eszterházy Károly College since 2010, now he is an associate professor of the Institute of Mathematics and Informatics. Since 2013, he has been working as a researcher in the EKF RFID/NFC research team. This research focuses on the RFID/NFC technologies and Future Internet.

Call for Papers
SEPTEMBER 2017 • VOLUME IX • NUMBER 332
INFOCOMMUNICATIONS JOURNAL
CS DSPBiennial since 1998
2018N
18-20 July 2018 | Budapest, HungaryDanubius Health Spa Resort Margitsziget****
11th IEEE/IET International Symposium on Communication Systems, Networksand Digital Signal Processing
Budapest welcomes the opportunity to host the 11th International Symposium on Communication Systems, Networks, and Digital Signal Processing.
The aim of CSNDSP 2018 is to serve as a forum for the exchange of ideas among engineers, scientists and young researchers from all over the world on advances in communication systems, communications networks and digital signal processing and to provide a focus for future research and developments.
Budapest is a city of water and spas, rendered magical by the Danube River connecting the nations and people of Europe. Hilly landscapes, long history, pleasant climate, rich cultural events, and music prove that the city is indeed a pearl of the Danube. An excellent venue in a peaceful environment and conference hotels are awaiting the guests. Budapest is one of the nicest cities in Europe, easy to reach, and famous for its hospitality, fine food, tasty drinks, and many historical and cultural sites of interest.
We wish you a pleasant and fruitful stay in Budapest during the conference.
The Hungarian Organising Committee
Invitation
- Communications Systems and Theory - DSP - Communications Protocols - Networks & Network Management - Photonics - Wireless Networks - Special Topic
The full list of our topics is available at the official website:
Main topics - Eszter Udvary - Zsolt Kollár - Barna Csuka - Lajos Nagy - Gergely Mészáros - Zoltán Szalay
Local Organising Committee
- Prof. Z. Ghassemlooy Northumbria University, UK Chairman
- Prof. Anthony C. Boucouvalas University of Peloponnese, Tripoli, Greece
- Prof. R. A. Carrasco Newcastle University, UK
- Prof. E. Leitgeb Graz University of Technology, Austria
- Prof. M. D. Logothetis University of Patras, Greece
- Dr. Wai Pang Ng Northumbria University, UK
- Prof. Stanislav Zvanovec Czech Technical University in Prague, Czech Republic
Steering Committeehttp://csndsp2018.com
Important datesFull Paper (for review) due 12 February 2018
Notification of acceptance starts 15 April 2018
Camera ready paper ends 20 May 2018
Organised by:
For further information please visit
http://csndsp2018.com

Call for PapersINFOCOMMUNICATIONS JOURNAL
SEPTEMBER 2017 • VOLUME IX • NUMBER 3 33
ACM SIGCOMM 2018 Budapest, Hungary, August 20-24, 2018
Call for Papers The ACM SIGCOMM 2018 conference seeks papers describing significant research contributions to the field of data communication networks and networked systems. SIGCOMM’18 takes a broad view of networking research. This includes new ideas relating to (but not limited to) mobile, wide-area, data-center, home, and enterprise networks using a variety of link technologies (wired, wireless, visual, and acoustic), as well as social networks and network architecture. It encompasses all aspects of networks and networked systems, including packet-processing hardware and software, virtualization, mobility, sensors, provisioning and resource management, performance, energy consumption, topology, robustness and security, measurement, diagnosis, verification, privacy, economics and evolution, interactions with applications, internet-of-things, novel applications of machine learning to networking, and usability of underlying networking technologies.
We want SIGCOMM'18 to be daring and emphasize novelty and creativity. The more novel the concept, the harder it can be to fully develop or evaluate all aspects, and the review process will take this into account. We encourage authors to discuss not only the benefits but also the limitations of their ideas.
Unlike in previous years, SIGCOMM’18 will not have a separate experience track. However, we do encourage the submission of experience papers that provide detailed technical insight into real-world deployments of novel networking technologies and systems.
In addition to the main conference, SIGCOMM 2018 will have a series of co-located workshops, tutorials, poster and demo sessions, a travel grant program, and conference best paper and SIGCOMM awards.
Submissions SIGCOMM is a highly selective conference where papers report novel results typically substantiated by experimentation, deployment, simulation, or analysis. Submissions should be in two-column, 10-point format, and can be up to 12 pages in length with as many additional pages as necessary for references. Detailed submission instructions can be found on the conference web site.
Ethical Concerns Authors must as part of the submission process attest that their work complies with all applicable ethical standards of their home institution(s), including, but not limited to privacy policies and policies on experiments involving humans. Note that submitting research for approval by one’s institution’s ethics review body is necessary, but not sufficient – in cases where the PC has concerns about the ethics of the work in a submission, the PC will have its own discussion of the ethics of that work. The PC takes a broad view of what constitutes an ethical concern, and authors agree to be available at any time during the review process to rapidly respond to queries from the PC chairs regarding ethical standards.
Important Dates ● Abstract submission: Wednesday, January 24, 2018 ● Paper submission: Wednesday, January 31, 2018 ● Reviews returned to authors: Friday May 11, 2018 ● Technical program: August 20 - 24, 2018
Sponsors

SEPTEMBER 2017 • VOLUME IX • NUMBER 334
INFOCOMMUNICATIONS JOURNALCall for Papers
Organized by Supported by Technical Sponsor
Organizing Committee General Chairs • Adel Ben Mnaouer (Canadian University of Dubai, UAE) • Mario Gerla (UCLA, USA) • Catherine Rosenberg (University of Waterloo, Canada)
TPC Chair • Nadjib Achir (University of Paris 13, France) • Megumi Kaneko (National Institute of Informatics, Japan) Keynotes Chair • Raouf Boutaba (University of Waterloo, Canada) Track 1 Chairs: 5G and Beyond • Rolland Vida (Budapest University, Hungary) • Michele Nogueira (UFPR, Brazil) • Thierry Gayraud (LAAS, France) Track 2 Chairs: Wireless Communications • Luis Costa (Federal University of Rio de Janeiro, Brazil) • Marc St-Hilaire (Carleton University, Canada) • Yacine Ghamri Doudane (University of La Rochelle, France)
Track 3 Chairs: Ad Hoc, Sensor, Vehicular and Delay Tolerant Networks • Manuel Ricardo (University of Porto, Portugal) • Claudio Palazzi (University degli Studi di Padova, Italy)
Track 4 Chairs: Wireless Models and Simulations • Carlos T. Calafate (Universitat Politecnica de Valencia, Spain) • André-Luc Beylot (Université de Toulouse, France) • Khaled Boussetta (University of Paris 13, France) Track 5 Chairs: Mobile Networking and Computing • Juan-Carlos Cano (Universitat Politecnica de Valencia, Spain) • Nadjib Aitsaad (ESIEE Paris, France) • Rui Campos (INESC TEC, Portugal) Publicity Chairs: • Miguel Elias Mitre Campista (UFRJ, Brazil) • Soufiene Djahel (University College Dublin, Ireland) • Abduhalim Dandoush (ESM, France)
Overall Arrangements • Aziza Lounis (DNAC, France)
Authors should submit their papers online through the EDAS conference management system: http://edas.info/N23963 Submissions must be limited to 6 double-‐column pages (maximum of 2 additional pages allowed -‐ 8 pages in total – with over-‐length page fee) and must follow the IEEE Manuscript template for conference proceedings: IEEE Manuscript template. All submitted papers will be judged based on their originality, technical and/or research content, correctness, relevance to conference, contributions, and readability. Submitted papers will be peer-‐reviewed by the international technical program committee. Accepted and presented papers will be published in the conference proceedings.
All accepted and presented papers will be submitted for publication in IEEE Xplore Digital Library
Paper Submission – November 7, 2017 Acceptance notification – January 15, 2018 Camera ready – February 15, 2018
April 3 – 5, 2018
Dubai, UAE
http://www.wireless-days.com
For more information visit: http://www.wireless-days.com

INFOCOMMUNICATIONS JOURNAL
SEPTEMBER 2017 • VOLUME IX • NUMBER 3 35
Call for Papers
The third edition of Cloudification of the Internet of Things 2018 (CIoT’18) is a conference focusing on the challenges of the Internets of Things while considering the whole end-to-end architecture based on 5G and Cloud solutions. In fact, the 5G network will absorb the billions of flows generated by things while considering the requested QoS and the cohabitation of M2M, M2H and H2M flows. Then, the flows will be processed in data centers and SaaS (applications) can exploit the generated knowledge. The main objective of CIoT’18 is to address all the challenges of IoT systems from the sensors/machines to the end-users attached to the Cloud while considering the 5G network connecting both sides: IoT and Cloud domains. The conference covers all research and novel papers tackling but not limited to:
Instructions for submission The authors are invited to submit high-quality original technical papers for presentation at the conference and publication in the CIoT’18 Proceedings. All final submissions should be written in English. The paper length is 6 pages (10-point font). One or two additional pages can be accepted without any extra charges. Standard IEEE conference templates for LaTeX formats are found at here: http://www.ieee.org/conferences_events/conferences/publishing/templates.html At least one author of each accepted presentation must register to the conference and present the paper. All papers must be submitted in electronic form through the EDAS web site at https://edas.info/N23586 by the deadline. All the accepted papers will be published in IEEE Xplore. The three best CIoT’18 papers will be invited to submit extended versions of their papers to Annals of Telecommunications with a fast review process. Annals of Telecommunications is published by Springer, and indexed in ISI and Scopus Databases.
The impact factor of Annals of Telecommunications in 2016 is 1.412 You will find additional information on our web site at: www.ciot-conference.org
• 5G cellular networks (3GPP, ETSI, IEEE, etc.) • Slicing solutions • Cloud/ Fog solutions • Software Defined Network (SDN) for IoT/5G/Cloud • Network Function Virtualization (NFV) for IoT/5G/Cloud • Architecture and protocols for IoT/5G/Cloud • Green communication for IoT/5G/Cloud • Centralized and distributed systems for IoT/5G/Cloud • Management system for IoT/5G/Cloud • Security for IoT/5G/Cloud • Routing/MAC for IoT/5G/Cloud • Big data for IoT/5G/Cloud • Testbed and experimental platforms for IoT/5G/Cloud • etc.
Important Dates
Paper submission deadline: February 2, 2018 Acceptance Notification: March 30, 2018 Camera Ready: April 13, 2018
Sponsorship requests are in progress
General Chairs • Blondia Chris (University of Antwerp, Belgium) • Nadjib Aitsaadi (ESIEE Paris, France) • Harry Perros (NCSU, USA)
TPC Co-Chairs • Hassnaa Moustafa (Intel Labs, USA) • Ilhem Fajjari (Orange Labs, France)
Keynotes Chair: • Filip De Turck (Ghent University-imec, Belgium)
Tutorials Co-Chairs • Mohamed Faten Zhani (École de technologie
supérieure, Canada) • Walter Cerroni (University of Bologna, Italy)
Demonstration Co-Chairs • Marc-Oliver Pahl (TUM, Germany) • Alberto Schaeffer-Filho (UFRGS, Brazil)
Steering Committee • Guy Pujolle (UPMC, France) • Raouf Boutaba (University of Waterloo,
Canada) • Harry Perros (NCSU, USA) • Yutaka Takahashi (Kyoto University, Japan) • Nadjib Aitsaadi (ESIEE Paris, France) • Nathalie Mitton (INRIA, France)
Publicity Chairs • Abdulhalim Dandoush (ESME Sudria, France)
• Yazid Lyazidi (UPMC, France)
Organization Committee Chair • Aziza Lounis (DNAC, France)
Technical Sponsor Sponsors Organized by
Keynote Speakers
Henning Schulzrinne (Columbia University, US) Raouf Boutaba (University of Waterloo, Canada) Thierry Coupaye (Orange Labs, France)
www.ciot-conference.org

Guidelines for our Authors
SEPTEMBER 2017 • VOLUME IX • NUMBER 336
INFOCOMMUNICATIONS JOURNALINFOCOMMUNICATIONS JOURNAL
40 JUNE 2015 • VOLUME VII • NUMBER 2
Guidelines for our Authors
Guidelines for our Authors
Format of the manuscripts
Original manuscripts and final versions of papersshould be submitted in IEEE format according to theformatting instructions available on
http://www.ieee.org/publications_standards/publications/authors/authors_journals.html#sect2,
“Template and Instructions on How to Create YourPaper”.
Length of the manuscripts
The length of papers in the aforementioned formatshould be 6-8 journal pages. Wherever appropriate, include 1-2 figures or tablesper journal page.
Paper structure
Papers should follow the standard structure, consist-ing of Introduction (the part of paper numbered by“1”), and Conclusion (the last numbered part) andseveral Sections in between. The Introduction should introduce the topic, tell whythe subject of the paper is important, summarize thestate of the art with references to existing worksand underline the main innovative results of the pa-per. The Introduction should conclude with outliningthe structure of the paper.
Accompanying parts
Papers should be accompanied by an Abstract and afew index terms (Keywords). For the final version of ac-cepted papers, please send the short cvs and photosof the authors as well.
Authors
In the title of the paper, authors are listed in the or-der given in the submitted manuscript. Their full affili-ations and e-mail addresses will be given in a foot-note on the first page as shown in the template. Nodegrees or other titles of the authors are given. Mem-berships of IEEE, HTE and other professional socie-ties will be indicated so please supply this information.When submitting the manuscript, one of the authorsshould be indicated as corresponding author provid-ing his/her postal address, fax number and telephonenumber for eventual correspondence and communi-cation with the Editorial Board.
References
References should be listed at the end of the paperin the IEEE format, see below:
a) Last name of author or authors and first name orinitials, or name of organization
b) Title of article in quotation marks c) Title of periodical in full and set in italics d) Volume, number, and, if available, part e) First and last pages of article f) Date of issue
[11] Boggs, S.A. and Fujimoto, N., “Techniques andinstrumentation for measurement of transients ingas-insulated switchgear,” IEEE Transactions onElectrical Installation, vol. ET-19, no. 2, pp.87–92,April 1984.
Format of a book reference:
[26] Peck, R.B., Hanson, W.E., and Thornburn, T.H., Foundation Engineering, 2nd ed. New York:McGraw-Hill, 1972, pp.230–292.
All references should be referred by the correspond-ing numbers in the text.
Figures
Figures should be black-and-white, clear, and drawnby the authors. Do not use figures or pictures down-loaded from the Internet. Figures and pictures shouldbe submitted also as separate files. Captions are ob-ligatory. Within the text, references should be madeby figure numbers, e.g. “see Fig. 2.” When using figures from other printed materials, ex-act references and note on copyright should be in-cluded. Obtaining the copyright is the responsibilityof authors.
Contact address
Authors are requested to send their manuscripts viaelectronic mail or on an electronic medium such as aCD by mail to the Editor-in-Chief:
Csaba A. SzaboDepartment of Networked Systems and ServicesBudapest University of Technology and Economics2 Magyar Tudosok krt.Budapest, 1117 [email protected]
InfocomJ2015_2 2015.06.22 11:04 Page 40
Authors are requested to submit their papers elec-tronically via the EasyChair system. The link for sub-mission can be found on the journal’s website:www.infocommunications.hu/for-our-authorsIf you have any question about the journal or the submission process, please do not hesitate to con- tact us via e-mail:Rolland Vida – Editor-in-Chief:[email protected]Árpád Huszák – Associate Editor-in-Chief: [email protected]
INFOCOMMUNICATIONS JOURNAL
40 JUNE 2015 • VOLUME VII • NUMBER 2
Guidelines for our Authors
Guidelines for our Authors
Format of the manuscripts
Original manuscripts and final versions of papersshould be submitted in IEEE format according to theformatting instructions available on
http://www.ieee.org/publications_standards/publications/authors/authors_journals.html#sect2,
“Template and Instructions on How to Create YourPaper”.
Length of the manuscripts
The length of papers in the aforementioned formatshould be 6-8 journal pages. Wherever appropriate, include 1-2 figures or tablesper journal page.
Paper structure
Papers should follow the standard structure, consist-ing of Introduction (the part of paper numbered by“1”), and Conclusion (the last numbered part) andseveral Sections in between. The Introduction should introduce the topic, tell whythe subject of the paper is important, summarize thestate of the art with references to existing worksand underline the main innovative results of the pa-per. The Introduction should conclude with outliningthe structure of the paper.
Accompanying parts
Papers should be accompanied by an Abstract and afew index terms (Keywords). For the final version of ac-cepted papers, please send the short cvs and photosof the authors as well.
Authors
In the title of the paper, authors are listed in the or-der given in the submitted manuscript. Their full affili-ations and e-mail addresses will be given in a foot-note on the first page as shown in the template. Nodegrees or other titles of the authors are given. Mem-berships of IEEE, HTE and other professional socie-ties will be indicated so please supply this information.When submitting the manuscript, one of the authorsshould be indicated as corresponding author provid-ing his/her postal address, fax number and telephonenumber for eventual correspondence and communi-cation with the Editorial Board.
References
References should be listed at the end of the paperin the IEEE format, see below:
a) Last name of author or authors and first name orinitials, or name of organization
b) Title of article in quotation marks c) Title of periodical in full and set in italics d) Volume, number, and, if available, part e) First and last pages of article f) Date of issue
[11] Boggs, S.A. and Fujimoto, N., “Techniques andinstrumentation for measurement of transients ingas-insulated switchgear,” IEEE Transactions onElectrical Installation, vol. ET-19, no. 2, pp.87–92,April 1984.
Format of a book reference:
[26] Peck, R.B., Hanson, W.E., and Thornburn, T.H., Foundation Engineering, 2nd ed. New York:McGraw-Hill, 1972, pp.230–292.
All references should be referred by the correspond-ing numbers in the text.
Figures
Figures should be black-and-white, clear, and drawnby the authors. Do not use figures or pictures down-loaded from the Internet. Figures and pictures shouldbe submitted also as separate files. Captions are ob-ligatory. Within the text, references should be madeby figure numbers, e.g. “see Fig. 2.” When using figures from other printed materials, ex-act references and note on copyright should be in-cluded. Obtaining the copyright is the responsibilityof authors.
Contact address
Authors are requested to send their manuscripts viaelectronic mail or on an electronic medium such as aCD by mail to the Editor-in-Chief:
Csaba A. SzaboDepartment of Networked Systems and ServicesBudapest University of Technology and Economics2 Magyar Tudosok krt.Budapest, 1117 [email protected]
InfocomJ2015_2 2015.06.22 11:04 Page 40

Receive these Exclusive ComSoc BenefitsPLUS
A Full Year Subscription to IEEE Spectrum Magazine
We look forward to having you as a member of our distinguished communications community so
Join ComSoc Now!http://bit.ly/2yehHVW
JOIN TODAY as an Affiliate Member* for Only USD $127.95 (a savings of over $68)
Join ourCommunity!
Networking • Conference Discounts • Technical Publications • Volunteer
www.comsoc.org
Enjoy:
Valuable Discounts on Future IEEE ComSoc ConferencesSave on average USD $200 on ComSoc-sponsored conferences.
Free Subscriptions to Highly Ranked PublicationsReceive digital access to IEEE Communications Magazine, IEEE Communications Surveys and Tutorials, IEEE Journal of Lightwave Technology, IEEE/OSA Journal of Optical Communications and Networking, and IEEE RFID Virtual Journal.
IEEE ComSoc Training CoursesLearn from industry experts and earn IEEE Continuing Education Units (CEUs) or Professional Development Hours (PDHs).
Exclusive Events in Emerging TechnologiesAttend events held around the world on 5G, IoT, Fog Computing, SDN and more!
*Society a�liates are not IEEE members and are not entitled to any IEEE bene�ts or services that are reserved solely for IEEE members.

SCIENTIFIC ASSOCIATION FOR INFOCOMMUNICATIONS
Who we areFounded in 1949, the Scientific Association for Info-communications (formerly known as Scientific Society for Telecommunications) is a voluntary and autono-mous professional society of engineers and econo-mists, researchers and businessmen, managers and educational, regulatory and other professionals work-ing in the fields of telecommunications, broadcast-ing, electronics, information and media technologies in Hungary.
Besides its 1000 individual members, the Scientific Association for Infocommunications (in Hungarian: HÍRKÖZLÉSI ÉS INFORMATIKAI TUDOMÁNYOS EGYESÜLET, HTE) has more than 60 corporate members as well. Among them there are large companies and small-and-medi-um enterprises with industrial, trade, service-providing, research and development activities, as well as educa-tional institutions and research centers.
HTE is a Sister Society of the Institute of Electrical andElectronics Engineers, Inc. (IEEE) and the IEEE Communi-cations Society.
What we doHTE has a broad range of activities that aim to pro-mote the convergence of information and communi-cation technologies and the deployment of synergicapplications and services, to broaden the knowledgeand skills of our members, to facilitate the exchangeof ideas and experiences, as well as to integrate and
harmonize the professional opinions and standpointsderived from various group interests and market dy-namics.
To achieve these goals, we…
• contribute to the analysis of technical, economic, and social questions related to our field of compe-tence, and forward the synthesized opinion of our experts to scientific, legislative, industrial and edu-cational organizations and institutions;
• follow the national and international trends and results related to our field of competence, foster the professional and business relations between foreign and Hungarian companies and institutes;
• organize an extensive range of lectures, seminars, debates, conferences, exhibitions, company pres-entations, and club events in order to transfer and deploy scientific, technical and economic knowl-edge and skills;
• promote professional secondary and higher edu-cation and take active part in the development of professional education, teaching and training;
• establish and maintain relations with other domes-tic and foreign fellow associations, IEEE sister soci-eties;
• award prizes for outstanding scientific, education-al, managerial, commercial and/or societal activities and achievements in the fields of infocommunica-tion.
Contact informationPresident: GÁBOR MAGYAR, PhD • [email protected]
Secretary-General: ERZSÉBET BÁNKUTI • [email protected] Director: PÉTER NAGY • [email protected]
International Affairs: ROLLAND VIDA, PhD • [email protected]
Address: H-1051 Budapest, Bajcsy-Zsilinszky str. 12, HUNGARY, Room: 502Phone: +36 1 353 1027
E-mail: [email protected], Web: www.hte.hu