a budgetary analysis of nasa’s new vision for space ... a budgetary analysis of nasa’s new...
TRANSCRIPT
CONGRESS OF THE UNITED STATESCONGRESSIONAL BUDGET OFFICE
CBOSEPTEMBER 2004
A Budgetary Analysis of NASA’s
New Vision forSpace Exploration
CBO
A Budgetary Analysis of NASA’sNew Vision for Space Exploration
September 2004
A
S T U D Y
The Congress of the United States O Congressional Budget Office

Notes
Unless otherwise indicated, all dollar figures in this report are in 2005 dollars, and all years referred to are federal fiscal years, which run from October 1 to September 30.
Numbers in the text and tables may not add up to totals because of rounding.
The cover photo of the moon is by the National Aeronautics and Space Administration. The photo was taken on July 21, 1969, by the Apollo 11 astronauts after taking off from the moon on their return journey to the space ship Columbia prior to its return to Earth. This was the astronauts’ final sight of the moon before they began docking procedures with Columbia.
Preface
On January 14, 2004, President Bush announced a new vision for human and robotic space exploration that he named “A Renewed Spirit of Discovery.” The goal of those activities is to advance U.S. scientific, security, and economic interests through a robust exploration program in space. The National Aeronautics and Space Administration’s (NASA’s) budget request for fiscal year 2005, as well as a projected budget through 2020, included substantial changes relative to previous plans to reorient the agency’s programs to support the objectives of the exploration vision.
This Congressional Budget Office (CBO) study—prepared at the request of the Subcommit-tee on Science, Technology, and Space of the Senate Commerce, Science, and Transportation Committee—assesses the implications of the new vision for both the content of NASA’s future exploration programs and the funding that might be needed to execute them. The study also analyzes how NASA’s budget might be affected if costs for its proposed new pro-grams for space exploration grew as much as some of NASA’s program costs have grown in the past. Concluding the analysis is an examination of alternatives for the future of the space shut-tle program and the United States’ involvement in the International Space Station. In keeping with CBO’s mandate to provide objective, impartial analysis, this study makes no recommen-dations.
David Arthur, Adrienne Ramsay, and Robie Samanta Roy of CBO’s National Security Divi-sion wrote the report under the general supervision of J. Michael Gilmore. Kathy Gramp of CBO’s Budget Analysis Division, supervised by Kim Cawley, contributed to the analysis. Ade-bayo Adedeji reviewed the manuscript for factual accuracy. David Auerbach, Matthew Gold-berg, David Moore, and Elizabeth Robinson provided thoughtful comments on early drafts of the study, as did space consultant Dwayne Day, John Logsdon of George Washington Univer-sity, and former CBO intern Robbie Schingler. (The assistance of external reviewers implies no responsibility for the final product, which rests solely with CBO.) The authors are also grateful to analysts and officials from NASA for responding to many requests for information.
Leah Mazade edited the study, and Christine Bogusz proofread it. Maureen Costantino pre-pared the study for publication, and Lenny Skutnik printed the initial copies. Annette Kalicki prepared the electronic versions for CBO’s Web site (www.cbo.gov).
Douglas Holtz-EakinDirector
September 2004

Summary ix
1 NASA’s Current Five-Year Plan and Extended Budget Projection 1NASA’s New Direction 1Comparison of NASA’s Budget Requests for 2004 and 2005 2Funding for NASA’s Lunar Return Mission 4
2 Estimating Potential Cost Growth for NASA’s Exploration VisionUsing the Historical-Average Approach 9
The Risk of Cost Growth and Schedule Delays in TechnicalPrograms 9
Deriving Cost-Growth Risk Factors for NASA’s Programs 10The Budget for NASA’s Exploration Program with Historical
Cost Growth 10
3 Estimating Potential Costs for NASA’s Exploration VisionUsing Analogies with Past Missions 15
Cost Analogies for Programs to Return People to the Moon 15Cost Analogies for Robotic Missions to the Moon and Mars 21What Higher Costs in the Exploration Initiative Imply for NASA’s
Budget and Programming 22
4 Budgetary Implications of Alternative Decisions About the Shuttle Fleetand the International Space Station 27
NASA’s New Plans for Operating the Shuttle and the InternationalSpace Station 27
Implications of Alternative Plans for the Shuttle’s and the ISS’s Operations 31
Appendix: CBO’s Analysis of Cost Growth in NASA’s Programs 35
CONTENTS
vi A BUDGETARY ANALYSIS OF NASA’S NEW VISION FOR SPACE EXPLORATION
Tables
S-1. Examples of Projected Funding Changes Between NASA’s 2004 and 2005 Budget Plans xi
S-2. Budget Strategies for Addressing Potential Cost Increases in NASA’sExploration Missions xv
1-1. NASA’s 2005 Projection of Funding Needs for Activities Through 2020 4
1-2. Net Reallocations and Funding for New Programs in NASA’s 2005Budget Request 5
1-3. Differences Between NASA’s 2004 and 2005 Budget Requests,by Program 6
1-4. NASA’s Projected Budget for the First Human Return to the Moon,2005 Through 2020 7
2-1. Representative Sample of the Set of NASA’s Programs That CBOUsed to Calculate Cost-Growth Risk 10
2-2. Cost Growth in R&D Programs for Selected Types of Defense Systems 11
3-1. NASA’s Plans for Robotic Missions 26
A-1. Cross-Section of NASA’s Programs and Budgets 36
Figures
S-1. NASA’s Projected Budget Through 2020 After Adjusting forCost Escalation xii
S-2. Potential Increases in Funding Needed for NASA’s Exploration VisionThrough 2020 xiii
1-1. NASA’s Projected Budget Through 2020 3
1-2. CBO’s Recategorization of NASA’s Budget Projection Through 2020 8
2-1. Potential Increase in Funding Needed for NASA’s ExplorationVision withHistorical Average Cost Growth 12
3-1. Comparison of Actual and Proposed Costs for Lunar MissionsAnalogous to NASA’s Human Lunar Exploration Program 18
3-2. Potential Increase in Funding Needed for NASA’s Human LunarExploration Program Based on the Costs of the Apollo Program 23
3-3. Potential Increase in Funding Needed for NASA’s ProposedRobotic Support Missions Based on the Costs of Past RoboticMissions 24
CONTENTS vii
3-4. Potential Increase in Funding Needed for NASA’s Human LunarExploration and Robotic Support Missions Based on the Costsof Analogous Past Missions 25
4-1. Potential Additional Funding Needed to Extend Space ShuttleOperations Through 2017 32
A-1. Trends in the Costs of 72 NASA Programs 38
Boxes
S-1. NASA’s Initial Plans for Its New Exploration Mission x
3-1. Adjusting for Price Increases in Analyzing the Costs of NASA’s Programs 16
4-1. NASA’s Prior Plans for Research on the International Space Station 28

Summary
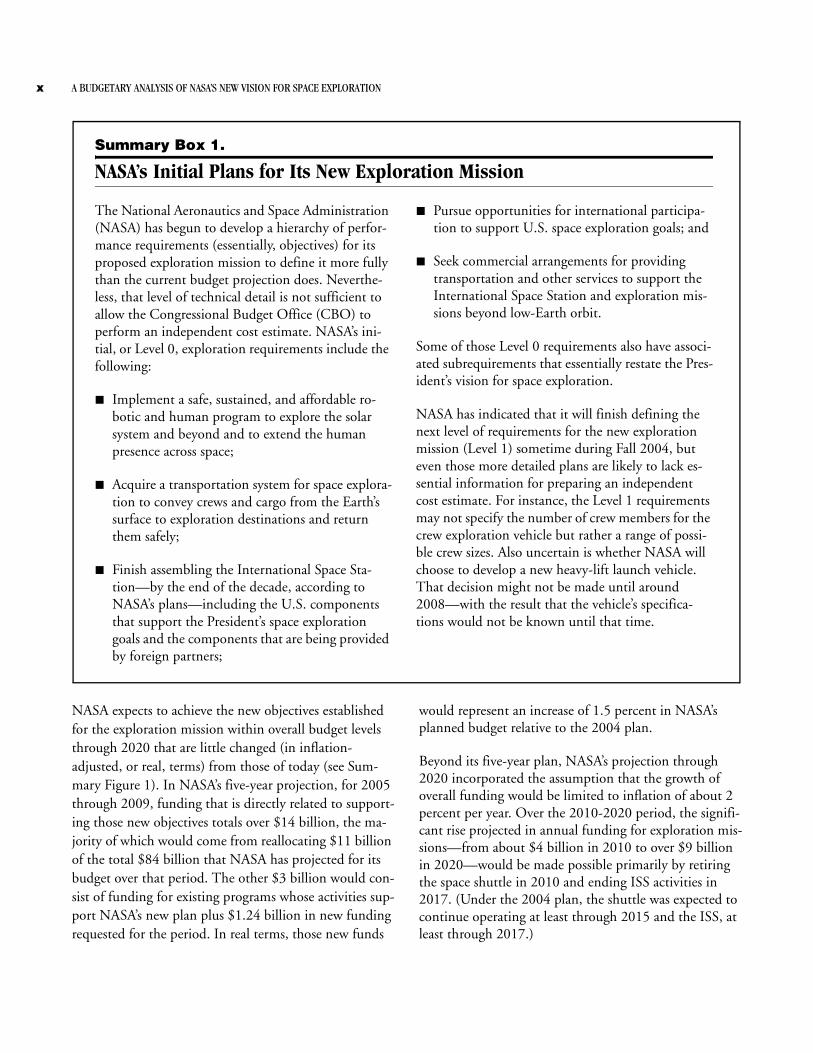
President Bush’s new vision for human and robotic exploration of the solar system, which he first articulated in January of this year, has shifted the main focus of the National Aeronautics and Space Administration (NASA) to, initially, returning people to the moon and, later, sending human missions to Mars and beyond. Following the President’s announcement, NASA released its budget request for fiscal year 2005 and its budget projection, which forecasts budgetary requirements through 2020. Relative to previous plans, that request and projection would significantly reorient the agency’s programs to achieve the goals of the space exploration vision.
This Congressional Budget Office (CBO) study assesses the implications that those plans might have for the con-tent and schedule of NASA’s future activities as well as the funding that might be needed to execute them. CBO de-veloped estimates of how the costs to carry out NASA’s plans for space exploration might differ from its current budget projection and then assessed potential budgetary or programmatic options that might be available to ad-dress such cost differences. In addition, CBO examined options for the continued operation of the space shuttle and the United States’ participation in the International Space Station (ISS), two programs that would be signifi-cantly affected by NASA’s proposed program changes.
NASA’s Budget Request forFiscal Year 2005To help describe its plans for implementing the Presi-dent’s vision for the nation’s space exploration program, NASA has projected its anticipated funding needs through 2020—11 years longer than the five-year projec-tion that usually accompanies its budget requests (see Summary Box 1). CBO’s analysis is based largely on that projection, which included the following elements:
B Completing construction of the International Space Station and retiring the space shuttle by 2010;
B Developing a new crew exploration vehicle (CEV) for human missions into space, with initial test flights car-ried out by 2008 and a first crewed mission no later than 2014;
B Relying on international partners for access to the ISS during the period between the shuttle’s retirement and the start of CEV operations;
B Resuming robotic missions to the moon starting around 2008 and continuing robotic missions to Mars; and
B Returning U.S. astronauts to the moon sometime dur-ing the 2015-2020 period. (NASA's projected budget incorporates the assumption that a first crewed lunar landing will occur in 2020 but does not include ex-plicit plans or schedules for establishing a lunar base or for sending astronauts to Mars. However, the agency proposes to allocate $2.2 billion during the 2018-2020 period to prepare for human missions be-yond the first human lunar return landing.)
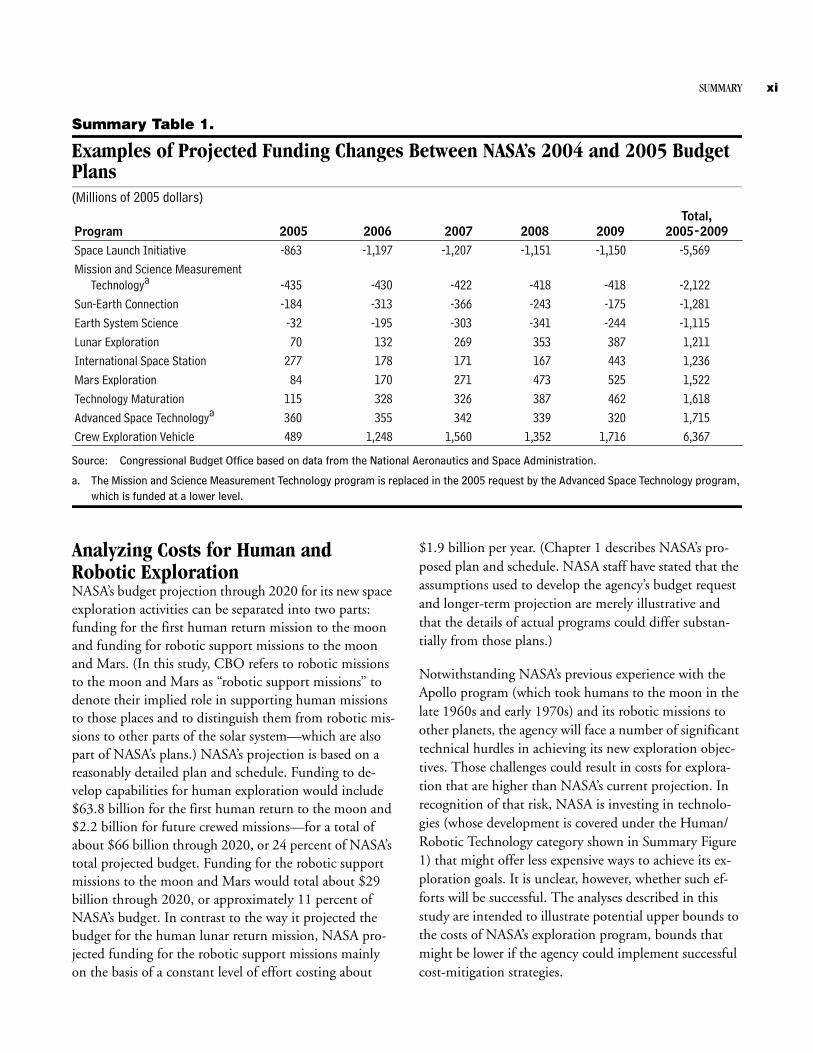
In realigning its activities to achieve those objectives, NASA has made significant changes relative to its budget request for 2004 and the associated five-year projection. For example, under the new plan, four existing programs will each experience cuts of more than $1 billion between 2005 and 2009 (see Summary Table 1). Six programs will receive additional funding of at least $1 billion; five of them are closely related to the new exploration initiative. The change for the sixth—an increase of $1.2 billion for the ISS—is intended to adjust NASA’s activities to reflect the reorientation of U.S. science research on the space station that it proposes to better support the new explora-tion mission. The funding is also meant to help the agency accommodate the proposed retirement of the space shuttle at least five years earlier than had previously been planned.
x A BUDGETARY ANALYSIS OF NASA’S NEW VISION FOR SPACE EXPLORATION
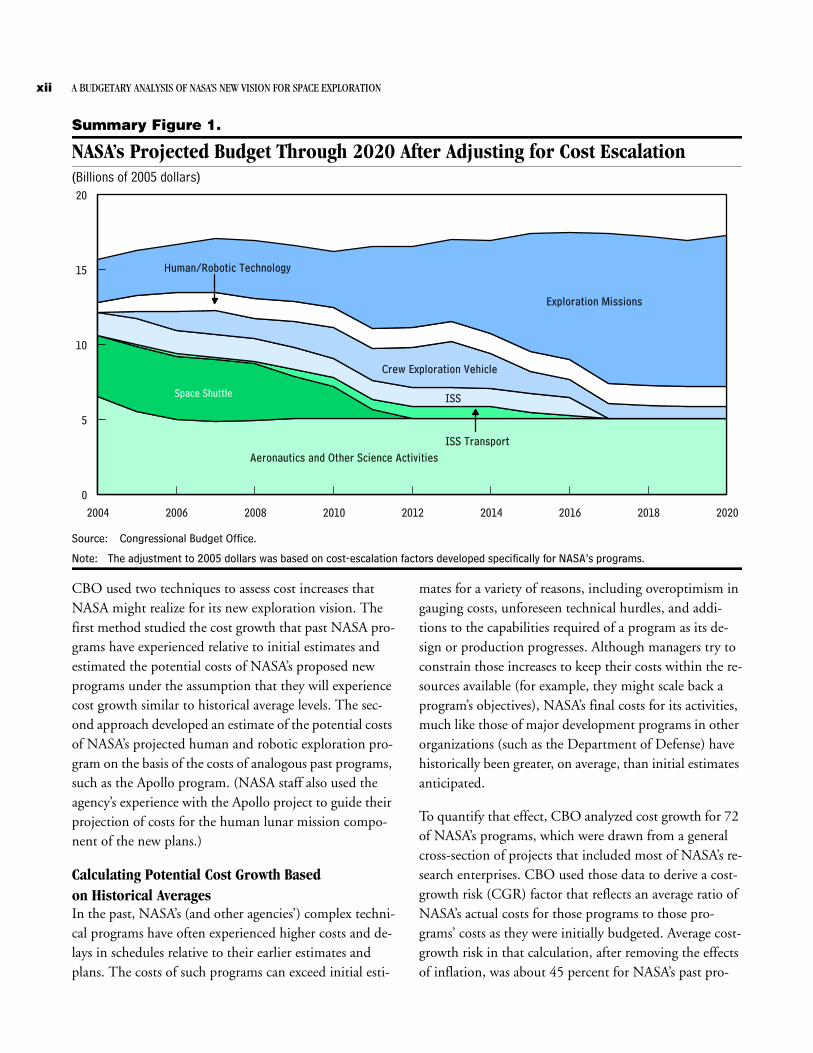
NASA expects to achieve the new objectives established for the exploration mission within overall budget levels through 2020 that are little changed (in inflation-adjusted, or real, terms) from those of today (see Sum-mary Figure 1). In NASA’s five-year projection, for 2005 through 2009, funding that is directly related to support-ing those new objectives totals over $14 billion, the ma-jority of which would come from reallocating $11 billion of the total $84 billion that NASA has projected for its budget over that period. The other $3 billion would con-sist of funding for existing programs whose activities sup-port NASA’s new plan plus $1.24 billion in new funding requested for the period. In real terms, those new funds
would represent an increase of 1.5 percent in NASA’s planned budget relative to the 2004 plan.
Beyond its five-year plan, NASA’s projection through 2020 incorporated the assumption that the growth of overall funding would be limited to inflation of about 2 percent per year. Over the 2010-2020 period, the signifi-cant rise projected in annual funding for exploration mis-sions—from about $4 billion in 2010 to over $9 billion in 2020—would be made possible primarily by retiring the space shuttle in 2010 and ending ISS activities in 2017. (Under the 2004 plan, the shuttle was expected to continue operating at least through 2015 and the ISS, at least through 2017.)
Summary Box 1.
NASA’s Initial Plans for Its New Exploration Mission
The National Aeronautics and Space Administration (NASA) has begun to develop a hierarchy of perfor-mance requirements (essentially, objectives) for its proposed exploration mission to define it more fully than the current budget projection does. Neverthe-less, that level of technical detail is not sufficient to allow the Congressional Budget Office (CBO) to perform an independent cost estimate. NASA’s ini-tial, or Level 0, exploration requirements include the following:
B Implement a safe, sustained, and affordable ro-botic and human program to explore the solar system and beyond and to extend the human presence across space;
B Acquire a transportation system for space explora-tion to convey crews and cargo from the Earth’s surface to exploration destinations and return them safely;
B Finish assembling the International Space Sta-tion—by the end of the decade, according to NASA’s plans—including the U.S. components that support the President’s space exploration goals and the components that are being provided by foreign partners;
B Pursue opportunities for international participa-tion to support U.S. space exploration goals; and
B Seek commercial arrangements for providing transportation and other services to support the International Space Station and exploration mis-sions beyond low-Earth orbit.
Some of those Level 0 requirements also have associ-ated subrequirements that essentially restate the Pres-ident’s vision for space exploration.
NASA has indicated that it will finish defining the next level of requirements for the new exploration mission (Level 1) sometime during Fall 2004, but even those more detailed plans are likely to lack es-sential information for preparing an independent cost estimate. For instance, the Level 1 requirements may not specify the number of crew members for the crew exploration vehicle but rather a range of possi-ble crew sizes. Also uncertain is whether NASA will choose to develop a new heavy-lift launch vehicle. That decision might not be made until around 2008—with the result that the vehicle’s specifica-tions would not be known until that time.
SUMMARY xi
Summary Table 1.
Examples of Projected Funding Changes Between NASA’s 2004 and 2005 Budget Plans(Millions of 2005 dollars)
Source: Congressional Budget Office based on data from the National Aeronautics and Space Administration.
a. The Mission and Science Measurement Technology program is replaced in the 2005 request by the Advanced Space Technology program, which is funded at a lower level.
Analyzing Costs for Human and Robotic ExplorationNASA’s budget projection through 2020 for its new space exploration activities can be separated into two parts: funding for the first human return mission to the moon and funding for robotic support missions to the moon and Mars. (In this study, CBO refers to robotic missions to the moon and Mars as “robotic support missions” to denote their implied role in supporting human missions to those places and to distinguish them from robotic mis-sions to other parts of the solar system—which are also part of NASA’s plans.) NASA’s projection is based on a reasonably detailed plan and schedule. Funding to de-velop capabilities for human exploration would include $63.8 billion for the first human return to the moon and $2.2 billion for future crewed missions—for a total of about $66 billion through 2020, or 24 percent of NASA’s total projected budget. Funding for the robotic support missions to the moon and Mars would total about $29 billion through 2020, or approximately 11 percent of NASA’s budget. In contrast to the way it projected the budget for the human lunar return mission, NASA pro-jected funding for the robotic support missions mainly on the basis of a constant level of effort costing about
$1.9 billion per year. (Chapter 1 describes NASA’s pro-posed plan and schedule. NASA staff have stated that the assumptions used to develop the agency’s budget request and longer-term projection are merely illustrative and that the details of actual programs could differ substan-tially from those plans.)
Notwithstanding NASA’s previous experience with the Apollo program (which took humans to the moon in the late 1960s and early 1970s) and its robotic missions to other planets, the agency will face a number of significant technical hurdles in achieving its new exploration objec-tives. Those challenges could result in costs for explora-tion that are higher than NASA’s current projection. In recognition of that risk, NASA is investing in technolo-gies (whose development is covered under the Human/Robotic Technology category shown in Summary Figure 1) that might offer less expensive ways to achieve its ex-ploration goals. It is unclear, however, whether such ef-forts will be successful. The analyses described in this study are intended to illustrate potential upper bounds to the costs of NASA’s exploration program, bounds that might be lower if the agency could implement successful cost-mitigation strategies.
Program 2005 2006 2007 2008 2009Total,
2005-2009Space Launch Initiative -863 -1,197 -1,207 -1,151 -1,150 -5,569Mission and Science Measurement
Technologya -435 -430 -422 -418 -418 -2,122Sun-Earth Connection -184 -313 -366 -243 -175 -1,281Earth System Science -32 -195 -303 -341 -244 -1,115Lunar Exploration 70 132 269 353 387 1,211International Space Station 277 178 171 167 443 1,236Mars Exploration 84 170 271 473 525 1,522Technology Maturation 115 328 326 387 462 1,618Advanced Space Technologya 360 355 342 339 320 1,715Crew Exploration Vehicle 489 1,248 1,560 1,352 1,716 6,367
xii A BUDGETARY ANALYSIS OF NASA’S NEW VISION FOR SPACE EXPLORATION
Summary Figure 1.
NASA’s Projected Budget Through 2020 After Adjusting for Cost Escalation(Billions of 2005 dollars)
Source: Congressional Budget Office.
Note: The adjustment to 2005 dollars was based on cost-escalation factors developed specifically for NASA’s programs.
CBO used two techniques to assess cost increases that NASA might realize for its new exploration vision. The first method studied the cost growth that past NASA pro-grams have experienced relative to initial estimates and estimated the potential costs of NASA’s proposed new programs under the assumption that they will experience cost growth similar to historical average levels. The sec-ond approach developed an estimate of the potential costs of NASA’s projected human and robotic exploration pro-gram on the basis of the costs of analogous past programs, such as the Apollo program. (NASA staff also used the agency’s experience with the Apollo project to guide their projection of costs for the human lunar mission compo-nent of the new plans.)
Calculating Potential Cost Growth Basedon Historical AveragesIn the past, NASA’s (and other agencies’) complex techni-cal programs have often experienced higher costs and de-lays in schedules relative to their earlier estimates and plans. The costs of such programs can exceed initial esti-
mates for a variety of reasons, including overoptimism in gauging costs, unforeseen technical hurdles, and addi-tions to the capabilities required of a program as its de-sign or production progresses. Although managers try to constrain those increases to keep their costs within the re-sources available (for example, they might scale back a program’s objectives), NASA’s final costs for its activities, much like those of major development programs in other organizations (such as the Department of Defense) have historically been greater, on average, than initial estimates anticipated.
To quantify that effect, CBO analyzed cost growth for 72 of NASA’s programs, which were drawn from a general cross-section of projects that included most of NASA’s re-search enterprises. CBO used those data to derive a cost-growth risk (CGR) factor that reflects an average ratio of NASA’s actual costs for those programs to those pro-grams’ costs as they were initially budgeted. Average cost-growth risk in that calculation, after removing the effects of inflation, was about 45 percent for NASA’s past pro-
2004 2006 2008 2010 2012 2014 2016 2018 2020
0
5
10
15
20
Aeronautics and Other Science Activities
Space Shuttle ISS
ISS Transport
Crew Exploration Vehicle
Exploration Missions
Human/Robotic Technology
SUMMARY xiii
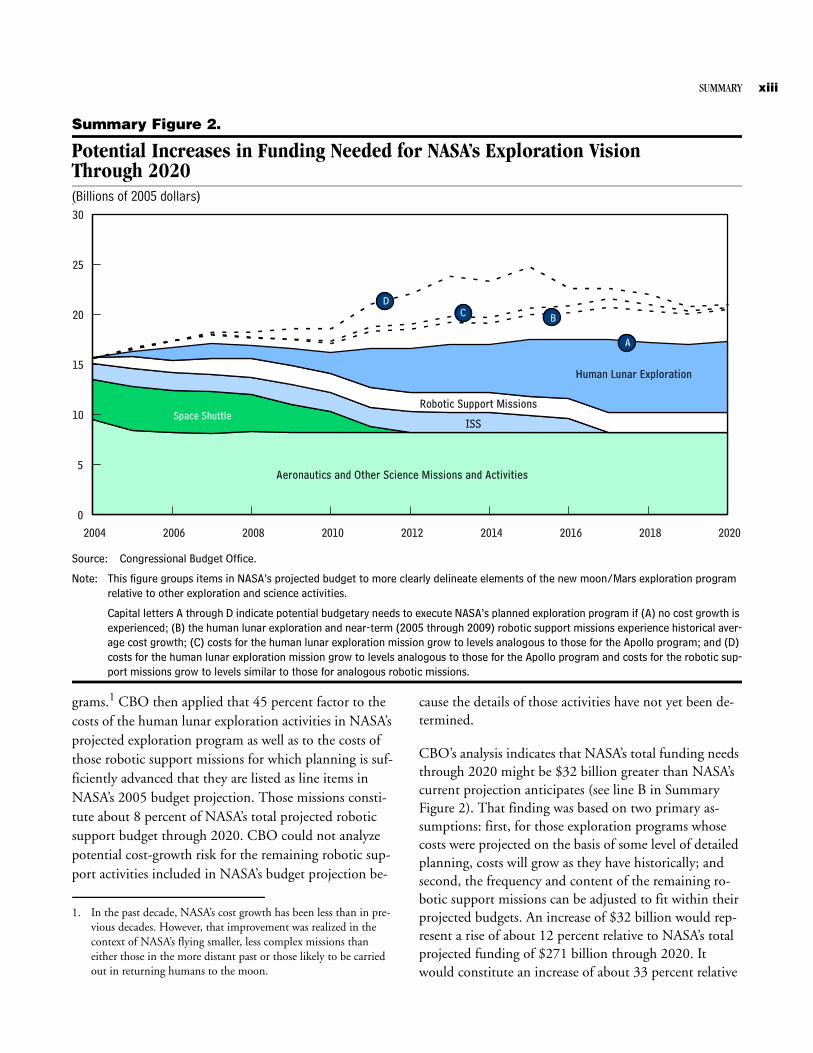
Summary Figure 2.
Potential Increases in Funding Needed for NASA’s Exploration VisionThrough 2020(Billions of 2005 dollars)So
Source: Congressional Budget Office.
Note: This figure groups items in NASA’s projected budget to more clearly delineate elements of the new moon/Mars exploration program relative to other exploration and science activities.
Capital letters A through D indicate potential budgetary needs to execute NASA’s planned exploration program if (A) no cost growth is experienced; (B) the human lunar exploration and near-term (2005 through 2009) robotic support missions experience historical aver-age cost growth; (C) costs for the human lunar exploration mission grow to levels analogous to those for the Apollo program; and (D) costs for the human lunar exploration mission grow to levels analogous to those for the Apollo program and costs for the robotic sup-port missions grow to levels similar to those for analogous robotic missions.
grams.1 CBO then applied that 45 percent factor to the costs of the human lunar exploration activities in NASA’s projected exploration program as well as to the costs of those robotic support missions for which planning is suf-ficiently advanced that they are listed as line items in NASA’s 2005 budget projection. Those missions consti-tute about 8 percent of NASA’s total projected robotic support budget through 2020. CBO could not analyze potential cost-growth risk for the remaining robotic sup-port activities included in NASA’s budget projection be-
cause the details of those activities have not yet been de-termined.
CBO’s analysis indicates that NASA’s total funding needs through 2020 might be $32 billion greater than NASA’s current projection anticipates (see line B in Summary Figure 2). That finding was based on two primary as-sumptions: first, for those exploration programs whose costs were projected on the basis of some level of detailed planning, costs will grow as they have historically; and second, the frequency and content of the remaining ro-botic support missions can be adjusted to fit within their projected budgets. An increase of $32 billion would rep-resent a rise of about 12 percent relative to NASA’s total projected funding of $271 billion through 2020. It would constitute an increase of about 33 percent relative
2004 2006 2008 2010 2012 2014 2016 2018 2020
0
5
10
15
20
25
30
Robotic Support Missions
Aeronautics and Other Science Missions and Activities
Space Shuttle
Human Lunar Exploration
ISS
A
BCD
1. In the past decade, NASA’s cost growth has been less than in pre-vious decades. However, that improvement was realized in the context of NASA’s flying smaller, less complex missions than either those in the more distant past or those likely to be carried out in returning humans to the moon.
xiv A BUDGETARY ANALYSIS OF NASA’S NEW VISION FOR SPACE EXPLORATION
to the $95 billion that NASA has projected for the explo-ration portion of its program over that same period.
Assessing Potential Cost Increases by Analogy with Past MissionsAs an alternative approach to the historical-average method of assessing potential costs, CBO compared NASA’s projected exploration activities and costs through 2020 with a notional program of similar missions that NASA has conducted in the past. CBO compared the most significant of NASA’s projected activities—the hu-man lunar exploration mission up through the first hu-man return landing sometime about 2020—with analo-gous programs that it constructed on the basis of the Apollo missions and several other plans for sending hu-mans to the moon or Mars that were proposed in the late 1980s and early 1990s but never executed.
In estimating the costs of those analogous programs, CBO included adjustments for cost escalation that NASA has experienced, which (as Chapter 3 discusses) has risen faster than general inflation over the past several decades. CBO also adjusted costs for differences in the programs’ content. For example, the Apollo program purchased enough spacecraft for several lunar landings. However, CBO’s analogy with Apollo, to be consistent with NASA’s current plans, is based on a single mission that takes place by 2020. CBO found that NASA’s projected funding for returning people to the moon—$63.8 billion out of a to-tal projected budget of $271 billion through 2020—falls at about the midpoint of the range of costs derived from this analysis of analogous programs. The least expensive lunar mission analogy would have had costs of $24 bil-lion, in CBO’s estimation; the Apollo analogy’s costs would have totaled $100 billion, and the most expensive analogy’s costs, $109 billion.
Using the analogies approach, CBO was also able to as-sess the potential implications of cost growth for all of NASA’s proposed robotic support missions—in contrast to the limited assessment possible under the historical CGR method described earlier. NASA has not defined the content of those robotic missions in detail (as would be required for the CGR analysis), but it has developed a proposed schedule for them—both for missions to the moon and missions to Mars. CBO used that schedule as a starting point to derive estimates of the potential costs for those missions. The costs for a robotic support mission to the moon were assumed to be the same as the cost of a Mars Exploration Rover (MER), or about $400 million.
For the robotic support missions to Mars, CBO devel-oped a high-cost estimate based on the assumption that most missions would have costs similar to the Viking missions to Mars, or about $4 billion each. Under those assumptions, the total costs for carrying out the proposed schedule of robotic support missions would be about $54 billion—$25 billion more than NASA’s projected fund-ing.
For purposes of comparison, CBO developed a lower-cost estimate incorporating the assumption that a greater number of the proposed missions to Mars—specifically, those that NASA identified as “Mars test-bed” mis-sions—would have costs similar to those for the MER (rather than the higher-cost Viking). In that analysis, costs for executing the proposed schedule of robotic sup-port missions total about $32 billion, or $3 billion higher than the level that NASA has projected. However, that MER-based analogy may not be a suitably close match with NASA’s proposed program. Although such MER-based missions might be adequate for some applications, more complicated—and hence more expensive—robotic activities could be needed to pave the way for eventual human exploration, especially to Mars.
If NASA’s costs for the exploration vision through 2020 were similar to the combined costs for the analogous Apollo program and the more expensive robotic support mission analogies, NASA would require a total of $61 bil-lion more in funding than its current projection specifies (see line D in Summary Figure 2). If its costs for robotic support missions were closer to those for the lower-cost robotic analogies, it would require $40 billion more. The former amount represents an increase of 23 percent over NASA’s total projected funding of $271 billion; the latter, an increase of 15 percent.
Implications for NASA’s Plans and Schedules of Higher-Than-Expected Costs for ExplorationNASA has a variety of programmatic options—in addi-tion to requesting larger budgets—to accommodate any cost increases that might arise in its new space exploration program (see Summary Table 2). CBO assessed the im-pact that two general approaches might have on NASA’s future budgets and mission schedules using the estimates of potential increases in costs derived from its historical average cost-growth and analogies methods:
SUMMARY xv
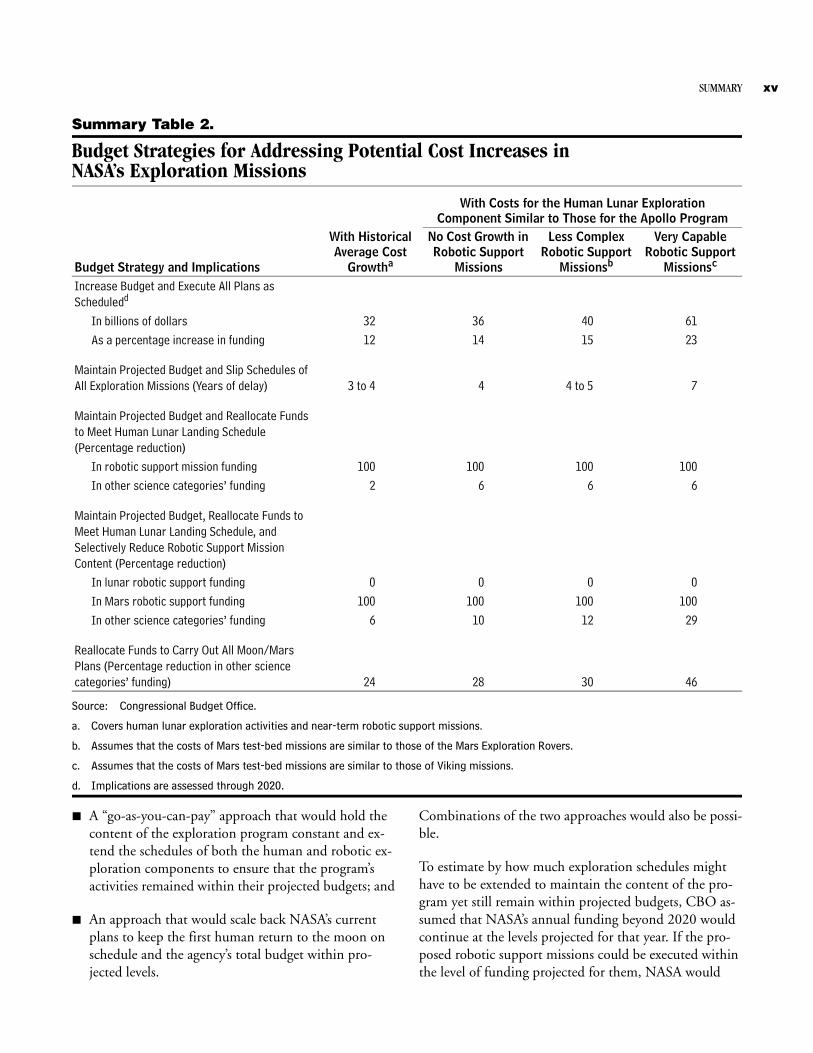
Summary Table 2.
Budget Strategies for Addressing Potential Cost Increases in NASA’s Exploration Missions
Source: Congressional Budget Office.
a. Covers human lunar exploration activities and near-term robotic support missions.
b. Assumes that the costs of Mars test-bed missions are similar to those of the Mars Exploration Rovers.
c. Assumes that the costs of Mars test-bed missions are similar to those of Viking missions.
d. Implications are assessed through 2020.
B A “go-as-you-can-pay” approach that would hold the content of the exploration program constant and ex-tend the schedules of both the human and robotic ex-ploration components to ensure that the program’s activities remained within their projected budgets; and
B An approach that would scale back NASA’s current plans to keep the first human return to the moon on schedule and the agency’s total budget within pro-jected levels.
Combinations of the two approaches would also be possi-ble.
To estimate by how much exploration schedules might have to be extended to maintain the content of the pro-gram yet still remain within projected budgets, CBO as-sumed that NASA’s annual funding beyond 2020 would continue at the levels projected for that year. If the pro-posed robotic support missions could be executed within the level of funding projected for them, NASA would
With Costs for the Human Lunar ExplorationComponent Similar to Those for the Apollo Program
Budget Strategy and Implications
With Historical Average Cost
Growtha
No Cost Growth in Robotic Support
Missions
Less Complex Robotic Support
Missionsb
Very Capable Robotic Support
Missionsc
Increase Budget and Execute All Plans as Scheduledd
In billions of dollars 32 36 40 61As a percentage increase in funding 12 14 15 23
Maintain Projected Budget and Slip Schedules of All Exploration Missions (Years of delay) 3 to 4 4 4 to 5 7
Maintain Projected Budget and Reallocate Funds to Meet Human Lunar Landing Schedule (Percentage reduction)
In robotic support mission funding 100 100 100 100In other science categories’ funding 2 6 6 6
Maintain Projected Budget, Reallocate Funds to Meet Human Lunar Landing Schedule, and Selectively Reduce Robotic Support Mission Content (Percentage reduction)
In lunar robotic support funding 0 0 0 0In Mars robotic support funding 100 100 100 100In other science categories’ funding 6 10 12 29
Reallocate Funds to Carry Out All Moon/Mars Plans (Percentage reduction in other science categories’ funding) 24 28 30 46
xvi A BUDGETARY ANALYSIS OF NASA’S NEW VISION FOR SPACE EXPLORATION
have to extend the schedule of the lunar exploration mis-sion by three to four years, CBO estimates, to cover cost increases of the magnitude of those estimated for the mis-sion using both the historical cost-growth method and the Apollo analogy (see the second row in Summary Ta-ble 2). That delay would result in a first crewed return to the moon in 2023 or 2024. Longer extensions would be needed if costs for the robotic support mission were also greater than projected. A schedule delay of up to seven years (putting the first return to the moon in about 2027) would be needed to cover CBO’s higher estimate of po-tential cost increases for the robotic support missions. The delay would be less—four to five years—under the assumption of lower-cost MER-like Mars test-bed mis-sions.
Such postponements might be lessened (or eliminated) if NASA could offset the potentially higher costs of its ex-ploration vision activities by reducing the activities’ con-tent or by reallocating funds from other areas of its bud-get. NASA staff contend that the agency’s plans for the robotic support missions are based on what they antici-pate will be achievable within the missions’ projected funding and not necessarily what they consider to be es-sential to support the human exploration component of the vision. By implication, those plans could be scaled back to compensate for higher costs. However, total pro-jected funding for robotic support missions is about $29 billion. To cover costs for human lunar exploration that CBO estimates could be from $32 billion (based on his-torical cost growth) to $36 billion (based on the Apollo analogy) higher than the current projection anticipates, NASA would, in addition to shifting the robotic support mission funding, have to reallocate some money from other areas in its budget. If that additional reallocation was drawn from the category of aeronautics and other sci-ence missions and activities, for example, 2 percent or 6 percent of that category’s projected funding would be needed to cover potential increases similar to those for CBO’s historical cost growth and Apollo analogy cases, respectively (see the third row in Summary Table 2).
But the total reallocation of funds from robotic support missions might not be possible if the knowledge or expe-rience obtained from those missions was necessary for re-turning humans to the moon. As an alternative, NASA could pay for potential cost increases by taking some money from the funds projected for robotic support mis-sions to Mars (and leaving funds for the missions to the moon intact) and the balance from aeronautics and other
science missions and activities (see the fourth row in Summary Table 2). In that instance, the funding needed from the aeronautics and other science category would range from $8 billion to $38 billion (or from 6 percent to 29 percent). The advantage of that approach is that it would maintain the planned robotic support missions to the moon, which are likely to be more important to the human lunar return program than robotic missions to Mars would be.
If NASA decided to maintain all of its planned robotic support missions, it could cover higher costs for both the human lunar and robotic support mission programs by reallocating funds entirely from those currently projected for aeronautics and other science missions and activities (see the fifth row in Summary Table 2). For CBO’s explo-ration cost cases, 24 percent to 46 percent of that cate-gory’s projected funding through 2020 would be needed.
Implications of Alternative Decisions About the Space Shuttle and the International Space StationCBO’s assessments incorporated the assumptions, which are also part of NASA’s current projection, that the space shuttle would be retired in 2010 and the United States would terminate its participation in the International Space Station’s operations by 2017. Some people argue, however, that the space shuttle should be retired immedi-ately to free up more funds in the near term for explora-tion and to avoid the potential safety risks identified since the loss of the shuttle Columbia. In CBO’s estimation, immediately retiring the shuttle and ending the United States’ involvement with the ISS offer potential savings of $39 billion to $43 billion from 2005 through 2020, de-pending on the costs of terminating the programs. If those savings were reallocated to exploration missions, the first human lunar return landing might be moved up by nearly four years, CBO estimates—that is, to 2016, compared with NASA’s projection of 2020. (That esti-mate is based on the assumptions that costs for the explo-ration vision do not increase relative to NASA’s projected amounts and that the maturation of technology and the missions’ overall design process can keep pace with such a schedule.)
However, immediately retiring the shuttle fleet would have significant operational ramifications for NASA (de-scribed more fully in Chapter 4), including:

SUMMARY xvii
B Effectively halting construction on the ISS and the United States’ failing to meet its international com-mitments for ISS construction and support (today, only the space shuttle has the capacity to carry many of the components and other equipment planned for the space station);
B Lessening or eliminating the capacity to conduct ISS research on the effects of long-duration spaceflight, an understanding of which might be important to the de-sign of extended space exploration missions;
B Increasing the time between U.S.-origin human space-flights from four years under current plans to nine years (unless the development of the crew exploration vehicle could be accelerated); and
B Closing the production lines for components of the shuttle (such as the external tank, the solid rocket boosters, and the main engines) that might be useful for future exploration systems.
Some observers have argued that the operations of the space shuttle and the ISS should continue to follow the path that NASA had laid out before the new exploration vision was unveiled, basing their argument on the appro-priateness of fully honoring commitments that the
United States has made to international partners as well as on the pure merits of the scientific experiments planned for the ISS. Under that approach, the United States would satisfy all of its commitments to ISS part-ners, there would be no gap in the United States’ access to space, and production capacity would be preserved for components of the shuttle that might be needed in the future.
If annual funding for operating the space shuttle re-mained at the average levels projected for 2005 through 2009, extending those operations to 2017 and continu-ing ISS-related activities could increase NASA’s budget requirements by $21 billion relative to its current projec-tion, CBO estimates. Securing that funding from the money currently allocated to exploration activities could mean postponing the first human lunar return landing by about two years, to 2022. That estimate, which does not take into account any of the cost growth discussed previ-ously, is based on reallocating funds within NASA’s bud-get. NASA staff have indicated, however, that the human lunar mission could slip by as much as one year for each year that the shuttle’s operations are extended, implying that human lunar efforts would be very limited until funds from retiring the shuttle became available.

1NASA’s Current Five-Year Plan
and Extended Budget Projection
Since the last landing on the moon in December 1972 by U.S. astronauts from the Apollo program, the National Aeronautics and Space Administration’s (NASA’s) manned spaceflight program has been prima-rily focused on operations in low-Earth orbit.1 Those ac-tivities have included the Skylab program in the late 1970s, the operations of the space shuttle beginning in 1981, and the current partnership for development and construction of the International Space Station (ISS). But on January 14, 2004, President Bush articulated a new vi-sion for a national program of space exploration and committed the United States to long-term human and robotic investigation beyond low-Earth orbit that would “extend humanity’s reach to the moon, Mars, and be-yond.”2 The President’s plan contains a number of ele-ments that once implemented will lead to significant changes in NASA’s programs. A key aspect of that plan is the initial goal of returning U.S. astronauts to the moon sometime between 2015 and 2020.
To begin to pursue those new objectives, NASA realigned the funding for its programs in its budget request for fis-cal year 2005 and its operating plan through 2009, and developed a projection of its budget for 2010 through 2020. In some instances, that realignment shifted money to the new space exploration mission from other NASA activities that are not relevant to the new mission’s goals. In other cases, new programs were created to develop par-ticular components needed for the new exploration plans.
NASA currently projects that it will be able to shift its fo-cus to the new initiative and carry it out without substan-tially changing its overall funding requirements from their previously projected levels. The rest of this chapter describes the program that NASA proposes and high-lights the major changes from its previous plans.
Despite the nation’s past success in the Apollo program, the challenges of a new lunar mission will be significant. Historically, the kind of complex technical programs nec-essary to carry out a space exploration initiative have been more costly than early program plans anticipated. Chap-ters 2 and 3 of this Congressional Budget Office (CBO) analysis present the results of two approaches to estimat-ing the potential costs that NASA could face—one based on historical average cost increases, the other on the costs associated with analogous programs—and the potential strategies that NASA could use to mitigate the effects of cost growth relative to its current plans. Another issue that confronts NASA as it takes up its new exploration mission is the future of the space shuttle and the United States’ involvement with the ISS. Chapter 4 explores some of the implications of alternative decisions about the scope and duration of those programs.
NASA’s New DirectionThe Administration’s plans for a new space exploration program include:
B Completing construction of the International Space Station by 2010 and then retiring the space shuttle;
B Beginning development of a new space vehicle for hu-man exploration—the crew exploration vehicle (CEV), which will transport astronauts between the Earth and the moon (a first crewed mission for the
C HAP TER
1. Objects in low-Earth orbit, which is a stepping-stone to travel beyond the Earth’s gravitational pull, are generally about 200 to 1,000 kilometers above the Earth’s surface.
2. The text of the President’s address, “A Renewed Spirit of Discovery,” can be found at www.whitehouse.gov/space/renewed_spirit.html.
2 A BUDGETARY ANALYSIS OF NASA’S NEW VISION FOR SPACE EXPLORATION
CEV in low-Earth orbit is planned for 2014 at the lat-est);
B Relying on international partners for access to the ISS between the shuttle’s retirement (according to plans, in about 2010) and the operational debut of the CEV (around 2014);
B Refocusing U.S. research carried out on the ISS to-ward the effects on humans of long-duration stays in space, to better understand and overcome the effects of prolonged spaceflight on astronauts’ health;
B Resuming robotic missions to the moon starting in approximately 2008 and expanding robotic missions to Mars and beyond; and
B Returning humans to the moon sometime during the 2015-2020 period and eventually sending people to Mars.
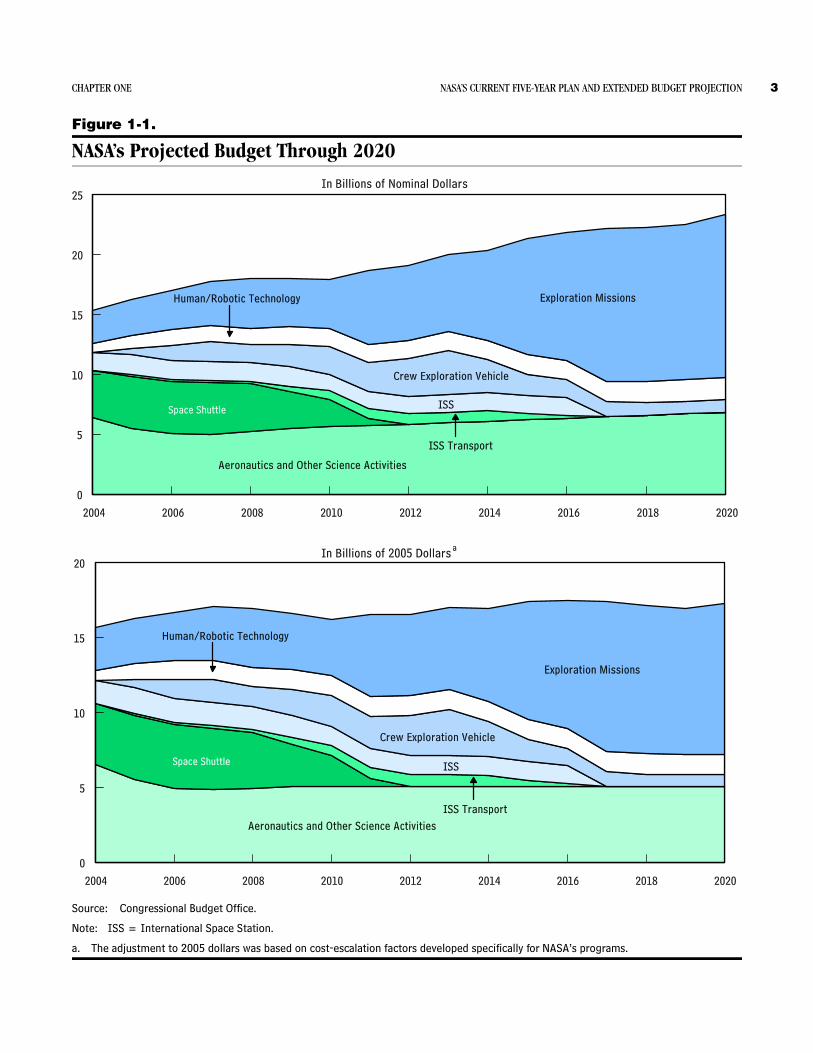
In light of those new plans, NASA’s budget projection through 2020 separates programs into several high-level categories that differ from the “enterprise” groupings used in past budget requests. The new categories are bet-ter aligned with the new exploration plans; they cover ex-ploration missions; human and robotic technology; the crew exploration vehicle; the International Space Station; ISS transport (for access to the space station via the flights of the United States’ international partners, such as Rus-sian Progress missions for cargo and Soyuz missions for crews); the space shuttle; and an aggregate category that takes in aeronautics and other science activities (see Fig-ure 1-1).3 The exploration missions category includes hu-man missions to the moon and robotic missions to the moon, Mars, and other destinations under the Solar Sys-tem Exploration and Astronomical Search for Origins programs.
Of NASA’s total projected budget of $271 billion through 2020, $100 billion has been allocated to the ex-ploration missions (see Table 1-1 on page 4). Between 2005 and 2009, funding for that category, which averages about $3.4 billion annually, is split between human ex-
ploration and robotic missions. Between 2010 and 2020, funding for the exploration missions category is projected to more than double—to about $7.5 billion per year—in anticipation of the first return mission to the moon. Much of that increase comes from retiring the shuttle fleet in 2010 and ending ISS-related operations in 2017.
In its projection for 2010 through 2020, NASA has as-sumed that overall growth in its budget will be limited to inflation (estimated at about 2 percent per year). After 2007, NASA’s budget projection shows that the agency has planned for essentially no real (inflation-adjusted) growth in its funding through 2020. However, NASA’s 2005 budget request is about 4 percent larger than its 2004 budget, and NASA’s plans for its 2006 and 2007 budgets incorporate annual increases of slightly more than 2 percent in real terms. Most of that growth was also incorporated in NASA’s 2004 budget plans, which pre-date the new exploration program—total funding for the five-year plan in the 2005 budget request is only 1.5 per-cent higher than funding for the five-year plan in the 2004 request.
Comparison of NASA’s Budget Requests for 2004 and 2005 In addition to the shifts in categories described above, NASA has also reallocated funds within its budget to fo-cus on its new mission. Funding proposed for 2005 to 2009 that is directly related to the space exploration pro-gram totals over $14 billion, the majority of which—about $10 billion—has been reallocated from other bud-get categories (see Table 1-2 on page 5). The other $4 bil-lion includes funding for existing programs whose mis-sions or content support the agency’s new plans and a total of $1.2 billion in new funding. In real terms, that increase would constitute growth of only 1.5 percent rela-tive to the five-year plan in NASA’s 2004 budget request. (In this analysis, CBO uses constant—that is, 2005—dollars rather than nominal dollars to distinguish be-tween the effects of inflation and funding that supports changes in the content of programs.)
CBO’s analysis of the differences between the five-year program plan contained in NASA’s budget request for 2004 and the plan from its request for 2005 showed that the planned annual budget reallocations would affect up
3. The details of NASA’s projected budget through 2020, as re-created by CBO in spreadsheet form (“NASA’s Budget Projection for Its Exploration Vision”), are available at www.cbo.gov.
CHAPTER ONE NASA’S CURRENT FIVE-YEAR PLAN AND EXTENDED BUDGET PROJECTION 3
Figure 1-1.
NASA’s Projected Budget Through 2020
Source: Congressional Budget Office.
Note: ISS = International Space Station.
a. The adjustment to 2005 dollars was based on cost-escalation factors developed specifically for NASA’s programs.
2004 2006 2008 2010 2012 2014 2016 2018 2020
0
5
10
15
20
25
Aeronautics and Other Science Activities
Space Shuttle ISS
Crew Exploration Vehicle
Exploration MissionsHuman/Robotic Technology
ISS Transport
In Billions of Nominal Dollars
2004 2006 2008 2010 2012 2014 2016 2018 2020
0
5
10
15
20
Aeronautics and Other Science Activities
Space Shuttle ISS
ISS Transport
Crew Exploration Vehicle
Exploration Missions
Human/Robotic Technology
In Billions of 2005 Dollars a
4 A BUDGETARY ANALYSIS OF NASA’S NEW VISION FOR SPACE EXPLORATION
Table 1-1.
NASA’s 2005 Projection of Funding Needs for Activities Through 2020(Billions of 2005 dollars)
Source: Congressional Budget Office based on data from the National Aeronautics and Space Administration.
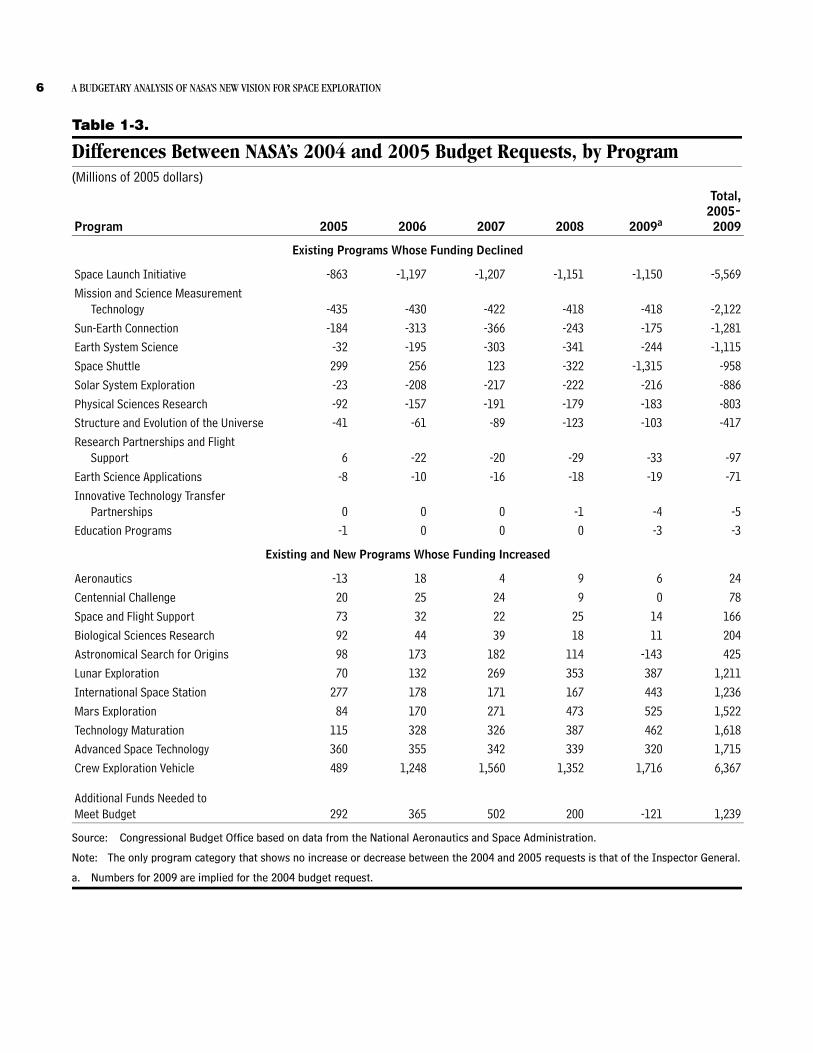
to about 18 percent of NASA’s total budget.4 Thus, many programs or activities would experience little or no change, although some programs would be canceled un-der the 2005 plan. In fact, the largest reduction, about $5.6 billion over the 2005-2009 period, results from can-celing the Space Launch Initiative, a program that was to develop the next generation of spacecraft to transport hu-mans and cargo to low-Earth orbit (see Table 1-3 on page 6). Other prominent programs whose funding would be significantly reduced under the 2005 plan are the Sun-Earth Connection (by $1.3 billion, or about 24 percent), Earth System Science (by $1.1 billion, or about 15 per-cent), and Solar System Exploration (by $886 million, or about 13 percent).5 The plan to retire the space shuttle in 2010 would reduce the shuttle’s budget by $958 million, or about 5 percent, during the 2005-2009 period. Most of the savings realized by retiring the shuttle early would accrue in the years beyond 2010.
Under the 2005 budget plan, some of NASA’s programs would receive increases in their funding to help support
the new exploration initiative. For example, over the 2005-2009 period, the Mars exploration programs would receive an additional $1.5 billion, and the ISS, an addi-tional $1.2 billion. The 2005 budget request also in-cluded money for the creation of the CEV program—at $6.4 billion, the new program with the highest cost through 2009—as well as $1.2 billion for new robotic lu-nar exploration.
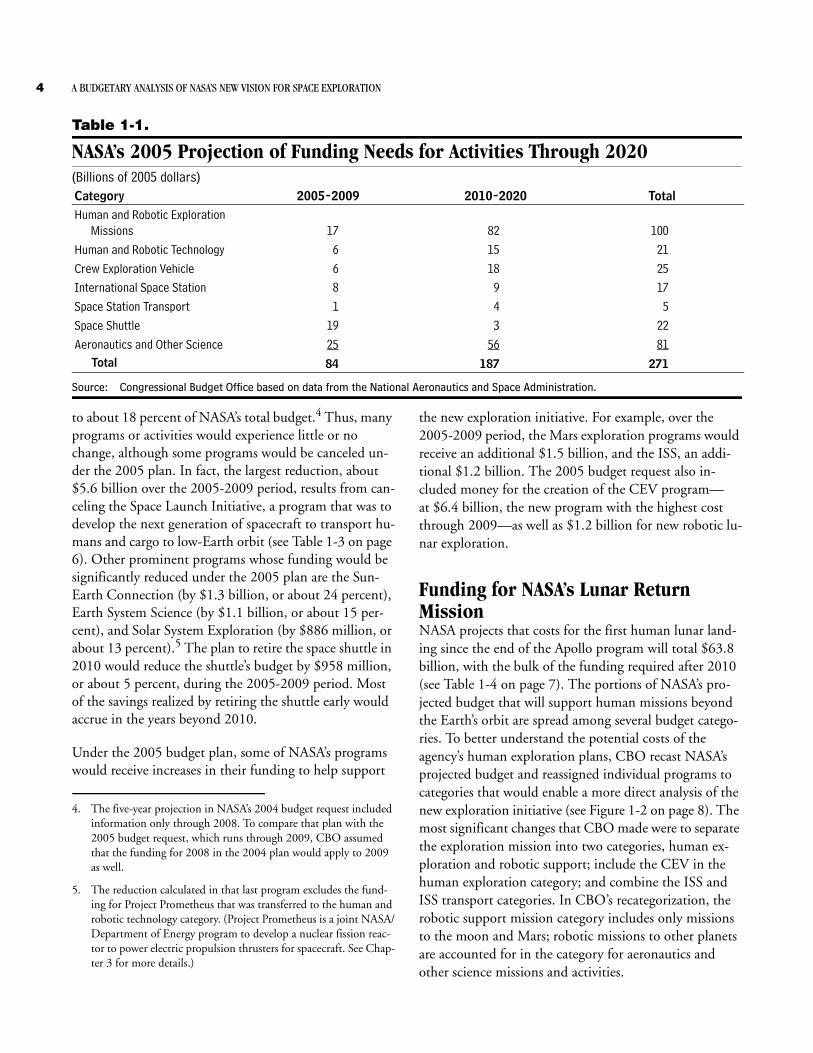
Funding for NASA’s Lunar ReturnMissionNASA projects that costs for the first human lunar land-ing since the end of the Apollo program will total $63.8 billion, with the bulk of the funding required after 2010 (see Table 1-4 on page 7). The portions of NASA’s pro-jected budget that will support human missions beyond the Earth’s orbit are spread among several budget catego-ries. To better understand the potential costs of the agency’s human exploration plans, CBO recast NASA’s projected budget and reassigned individual programs to categories that would enable a more direct analysis of the new exploration initiative (see Figure 1-2 on page 8). The most significant changes that CBO made were to separate the exploration mission into two categories, human ex-ploration and robotic support; include the CEV in the human exploration category; and combine the ISS and ISS transport categories. In CBO’s recategorization, the robotic support mission category includes only missions to the moon and Mars; robotic missions to other planets are accounted for in the category for aeronautics and other science missions and activities.
Category 2005-2009 2010-2020 TotalHuman and Robotic Exploration
Missions 17 82 100Human and Robotic Technology 6 15 21Crew Exploration Vehicle 6 18 25International Space Station 8 9 17Space Station Transport 1 4 5Space Shuttle 19 3 22Aeronautics and Other Science 25 56 81
Total 84 187 271
4. The five-year projection in NASA’s 2004 budget request included information only through 2008. To compare that plan with the 2005 budget request, which runs through 2009, CBO assumed that the funding for 2008 in the 2004 plan would apply to 2009 as well.
5. The reduction calculated in that last program excludes the fund-ing for Project Prometheus that was transferred to the human and robotic technology category. (Project Prometheus is a joint NASA/Department of Energy program to develop a nuclear fission reac-tor to power electric propulsion thrusters for spacecraft. See Chap-ter 3 for more details.)

CHAPTER ONE NASA’S CURRENT FIVE-YEAR PLAN AND EXTENDED BUDGET PROJECTION 5
Table 1-2.
Net Reallocations and Funding for New Programs in NASA’s 2005 Budget Request(Millions of 2005 dollars)
Source: Congressional Budget Office based on data from the National Aeronautics and Space Administration.
a. The value for 2009 is implied.
As Figure 1-2 shows, NASA has assumed that the funding needed to execute the robotic support missions to the moon and Mars and the aeronautics and other science missions and activities will remain constant through 2020 at their 2009 levels. In addition to robotic explora-tion missions to places other than the moon and Mars, the aeronautics and other science category includes earth science activities, biological and physical sciences pro-grams, aeronautics research, and public education efforts.
Three major components dominate the funding associ-ated with returning humans to the moon (that is, the “Human Lunar Exploration” category in Figure 1-2): the CEV, a lunar lander, and a new heavy-lift launch vehicle. For human spaceflight to the moon, the heavy-lift launch vehicle would carry into low-Earth orbit the lunar lander and an injection-stage rocket for subsequent propulsion. Once in orbit, the lunar lander and injection-stage rocket would dock with the CEV and its human crew. NASA expects to launch the CEV into orbit by using smaller rockets—such as one of the Department of Defense’s evolved expendable launch vehicles (EELVs).6 However, NASA staff have emphasized that the details of the mis-
sions on which their projections are based should be re-garded as illustrative. The actual characteristics of pro-grams will evolve over time, and future plans may differ from the assumptions underlying NASA’s current projec-tions. For example, a portion of NASA’s investments in human and robotic technology might yield new ap-proaches that could reduce the costs of exploration or al-low schedules to be accelerated. NASA’s projections for the costs of human lunar exploration did not take the po-tential for such advances into account.7
The Crew Exploration VehicleNASA based its projected costs for the CEV on estimates of the costs for the recently canceled orbital space plane (OSP) and the actual costs of designing, building, and testing the Apollo command/service module used for lu-nar flights from 1969 to 1972. NASA envisions building the CEV under a three-phase “spiral” development pro-gram.8 Estimated costs for the first- and second-spiral
2005 2006 2007 2008 2009Total,
2005-2009New Programs
Lunar Exploration 70 132 269 353 387 1,211Crew Exploration Vehicle 489 1,248 1,560 1,352 1,716 6,367Advanced Space Technology 360 355 342 339 320 1,715Technology Maturation 115 328 326 387 462 1,618Centennial Challenge 20 25 24 9 0 78
Total 1,053 2,088 2,521 2,440 2,885 10,988Net Reallocations from 2004 Budgeta -761 -1,723 -2,019 -2,240 -3,006 -9,749Amount Needed to Fund New Programs 292 365 502 200 -121 1,239
6. EELVs make up a family of rockets (including the Lockheed-Mar-tin Atlas 5 and Boeing Delta IV) that boost payloads into orbit. Individual EELVs can be tailored to lift specific payloads into their target orbits by changing the configuration of their main motors and strap-on solid boosters.
7. As an example of how technology investments could help reduce costs, in-orbit robotic docking technologies might eliminate the need for a heavy-lift launch vehicle because subcomponents of the exploration systems could be launched separately on smaller rock-ets and then assembled in orbit.
8. Spiral development is intended to reduce technical risk by pro-gressively building on previous versions of specific hardware—that is, incrementally adding capabilities to a system with each succes-sive version of it.
6 A BUDGETARY ANALYSIS OF NASA’S NEW VISION FOR SPACE EXPLORATION
Table 1-3.
Differences Between NASA’s 2004 and 2005 Budget Requests, by Program(Millions of 2005 dollars)
Source: Congressional Budget Office based on data from the National Aeronautics and Space Administration.
Note: The only program category that shows no increase or decrease between the 2004 and 2005 requests is that of the Inspector General.
a. Numbers for 2009 are implied for the 2004 budget request.
Program 2005 2006 2007 2008 2009a
Total,2005-2009
Existing Programs Whose Funding Declined
Space Launch Initiative -863 -1,197 -1,207 -1,151 -1,150 -5,569Mission and Science Measurement
Technology -435 -430 -422 -418 -418 -2,122Sun-Earth Connection -184 -313 -366 -243 -175 -1,281Earth System Science -32 -195 -303 -341 -244 -1,115Space Shuttle 299 256 123 -322 -1,315 -958Solar System Exploration -23 -208 -217 -222 -216 -886Physical Sciences Research -92 -157 -191 -179 -183 -803Structure and Evolution of the Universe -41 -61 -89 -123 -103 -417Research Partnerships and Flight
Support 6 -22 -20 -29 -33 -97Earth Science Applications -8 -10 -16 -18 -19 -71Innovative Technology Transfer
Partnerships 0 0 0 -1 -4 -5Education Programs -1 0 0 0 -3 -3
Existing and New Programs Whose Funding Increased
Aeronautics -13 18 4 9 6 24Centennial Challenge 20 25 24 9 0 78Space and Flight Support 73 32 22 25 14 166Biological Sciences Research 92 44 39 18 11 204Astronomical Search for Origins 98 173 182 114 -143 425Lunar Exploration 70 132 269 353 387 1,211International Space Station 277 178 171 167 443 1,236Mars Exploration 84 170 271 473 525 1,522Technology Maturation 115 328 326 387 462 1,618Advanced Space Technology 360 355 342 339 320 1,715Crew Exploration Vehicle 489 1,248 1,560 1,352 1,716 6,367
Additional Funds Needed toMeet Budget 292 365 502 200 -121 1,239

CHAPTER ONE NASA’S CURRENT FIVE-YEAR PLAN AND EXTENDED BUDGET PROJECTION 7
Table 1-4.
NASA’s Projected Budget for the First Human Return to the Moon,2005 Through 2020(Billions of 2005 dollars)
Source: Congressional Budget Office based on data from the National Aeronautics and Space Administration.
versions of the CEV, whose objective is to transport hu-mans to low-Earth orbit and the ISS, are based on esti-mates developed previously for the OSP; costs for the third-spiral version of the vehicle, which would be capa-ble of a human lunar mission, are based on those for the Apollo’s command/service module. The CEV program may also encompass a fourth spiral of development fo-cused on missions to Mars, but NASA’s projected budget through 2020 does not contain funding for that spiral.
Initial development of the CEV, including test flights, is expected to last from 2005 through 2014. The first CEV test—of a partially capable prototype—is planned for 2008; the first unmanned test of a fully capable unit is scheduled for 2011, and the first human flight, for 2014. NASA’s plans for both the test flights and the lunar mis-sion are based on using an EELV to boost the CEV into low-Earth orbit.
NASA’s projected funding covers the procurement of four operational vehicles for about $730 million each. Includ-ing research and development, testing, and operations, costs for the CEV through 2020 would total roughly $24.7 billion.
The Lunar LanderNASA estimated how much the lunar lander would cost on the basis of actual costs for the Apollo lunar module. NASA’s projected budget includes funds for a single fully capable lander, at an estimated unit cost of about $730 million; total costs through 2020 are estimated at about $13.4 billion. Development of the new lander is expected to begin in 2011. The development schedule calls for it to be ready in time to support a human lunar mission in 2020.
The Heavy-Lift Launch VehicleThe third major component that would support astro-nauts’ return to the moon is a new heavy-lift launch vehi-cle (defined as being capable of lifting a 100-metric-ton payload into low-Earth orbit). The vehicle would carry a smaller payload than that of the Saturn V rocket used by the Apollo program (the Saturn V’s payload was 120 met-ric tons).9 NASA projected the costs for the new launch vehicle on the basis of studies of space launch alternatives conducted at the Marshall Space Flight Center in the early 1990s. In addition to funding for developing the heavy-lift launch vehicle, the projection includes money for an injection-stage rocket that will propel the CEV and the lunar lander from their low-Earth orbit to the moon.
NASA’s projected budget incorporates the assumption that four heavy-lift launch vehicles, at a cost of about $1 billion each, and three injection-stage rockets, for $70 million each, would be needed to test the new systems and ultimately conduct the first human landing of the lu-nar return mission. Total costs for development and pro-curement of the launch vehicle and the injection-stage rockets are estimated to be about $18 billion.
Summarizing NASA’s Current Funding Plans for Its Lunar Return MissionCosts over the 2005-2009 budget period for the lunar re-turn mission would total $6.4 billion, NASA projects, all of which would be used to develop the CEV. Through 2020, total funding for human exploration would be
2005-2009 2010-2020 TotalCrew Exploration Vehicle 6.4 18.3 24.7Lunar Lander 0 13.4 13.4Heavy-Lift Launch Vehicle 0 17.9 17.9Operations 0 7.9 7.9
Total 6.4 57.5 63.8
9. For comparison, depending on the target orbit, the shuttle’s pay-load is approximately 24 metric tons, and a payload for a so-called EELV heavy would be approximately 23 metric tons.

8 A BUDGETARY ANALYSIS OF NASA’S NEW VISION FOR SPACE EXPLORATION
Figure 1-2.
CBO’s Recategorization of NASA’s Budget Projection Through 2020(Billions of 2005 dollars)
Source: Congressional Budget Office.
Note: The recategorization groups items in NASA’s projected budget to more clearly delineate elements of the new moon/Mars exploration program relative to other exploration and science activities.
a. The International Space Station (ISS) category includes ISS transport.
about $66 billion, in NASA’s estimation, which includes $2.2 billion between 2018 and 2020 for follow-on mis-sions after the first human lunar return landing. (The ex-act content of those missions is undetermined.) With the potential exception of those additional funds, NASA’s
budget projection through 2020 does not include explicit development and procurement of other systems that would be necessary for establishing a lunar outpost or for carrying out future human missions to Mars.
2004 2006 2008 2010 2012 2014 2016 2018 2020
0
5
10
15
20
25
Aeronautics and Other Science Missions and Activities
Space ShuttleISSa
Robotic Support Missions
Human Lunar Exploration
2Estimating Potential Cost Growth
for NASA’s Exploration VisionUsing the Historical-Average Approach
As Chapter 1 described, the National Aeronautics and Space Administration plans to fund the first steps in achieving the objectives of its lunar return mission during the 2005-2009 period mainly by shifting money from other programs within its budget. After that, through 2020, it expects to hold its budget nearly constant at the 2009 level (adjusted solely for annual inflation of about 2 percent). But the types of complex technical programs that are required to return U.S. astronauts to the moon routinely experience increases in costs and delays in schedules that might significantly alter those plans. This chapter discusses the Congressional Budget Office’s as-sessment of how NASA’s budgets and schedules could be affected if programs experienced cost growth similar to the average rise in the costs of NASA’s programs in the past. CBO’s findings suggest that if costs for the new ex-ploration mission grew to a similar degree, fulfilling the exploration mission’s objectives might require either add-ing about $32 billion to NASA’s budgets or extending the schedule for the lunar landing by three to four years. If the agency chose to meet potentially higher exploration costs by reallocating funds from aeronautics or other sci-ence programs, it might have to shift as much as 24 per-cent of those programs’ funding over the 2005-2020 pe-riod, in CBO’s estimation.
The Risk of Cost Growth and Schedule Delays in Technical Programs The costs of complex technical programs may rise above anticipated levels for a variety of reasons. Initial cost esti-mates may have been overly optimistic because problems with important features of the program were not fore-seen. Unexpected technical hurdles may develop, requir-ing more costly solutions than planners had anticipated
and causing schedule delays while solutions are sought. For example, the Navy’s F/A-18E fighter program was briefly delayed when the plane unexpectedly developed instability during low-speed maneuvers—a critical prob-lem for a fighter that must land on an aircraft carrier. If an inexpensive wing modification had not resolved the problem, a more extensive redesign of the wing might have been needed, the cost of the F/A-18E could have in-creased significantly, and its delivery to the fleet would probably have been delayed.
Cost growth and schedule delays are usually intertwined when they affect technical programs. A schedule delay re-sulting from an unexpected technical obstacle can in-crease costs because greater resources are needed to re-solve the problem. Alternatively, a pure cost increase arising from higher labor rates or more expensive raw ma-terials can result in delays if the program must be slowed down to stay within a constrained yearly budget. The rel-ative magnitude of these and similar effects is unique to any given program.
Changes in the performance required of a system, or “re-quirements creep,” can also contribute to cost growth, not only on their own but by forcing the redesign of components that have already been developed. The Army’s Comanche helicopter faced such problems. The weight of the helicopter grew as the capabilities required of it increased over time, and when its weight threatened the aircraft’s aerodynamic performance, previously com-pleted portions of the design had to be revisited. Work-ing in the opposite direction, requirements might be re-laxed to help mitigate cost growth. For example, a space probe might carry fewer sensors than originally planned to help the mission stay within budget.
C HAP TER
10 A BUDGETARY ANALYSIS OF NASA’S NEW VISION FOR SPACE EXPLORATION
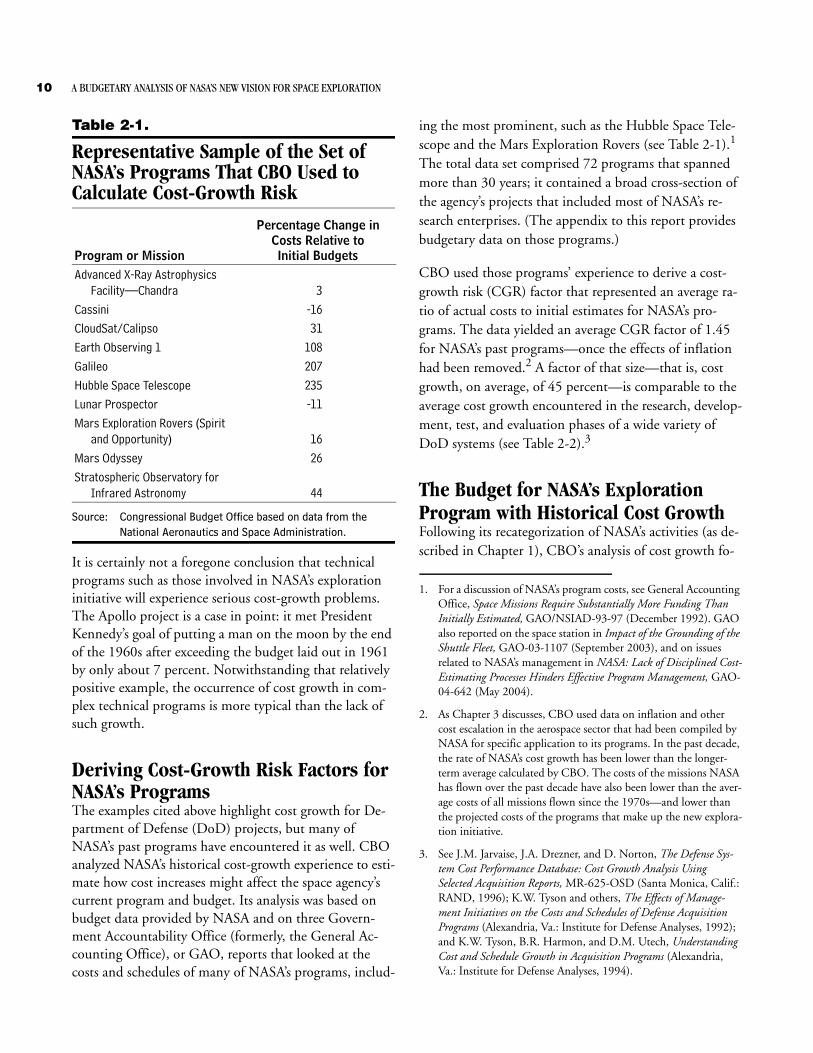
Table 2-1.
Representative Sample of the Set of NASA’s Programs That CBO Used toCalculate Cost-Growth Risk
Source: Congressional Budget Office based on data from the National Aeronautics and Space Administration.
It is certainly not a foregone conclusion that technical programs such as those involved in NASA’s exploration initiative will experience serious cost-growth problems. The Apollo project is a case in point: it met President Kennedy’s goal of putting a man on the moon by the end of the 1960s after exceeding the budget laid out in 1961 by only about 7 percent. Notwithstanding that relatively positive example, the occurrence of cost growth in com-plex technical programs is more typical than the lack of such growth.
Deriving Cost-Growth Risk Factors for NASA’s ProgramsThe examples cited above highlight cost growth for De-partment of Defense (DoD) projects, but many of NASA’s past programs have encountered it as well. CBO analyzed NASA’s historical cost-growth experience to esti-mate how cost increases might affect the space agency’s current program and budget. Its analysis was based on budget data provided by NASA and on three Govern-ment Accountability Office (formerly, the General Ac-counting Office), or GAO, reports that looked at the costs and schedules of many of NASA’s programs, includ-
ing the most prominent, such as the Hubble Space Tele-scope and the Mars Exploration Rovers (see Table 2-1).1 The total data set comprised 72 programs that spanned more than 30 years; it contained a broad cross-section of the agency’s projects that included most of NASA’s re-search enterprises. (The appendix to this report provides budgetary data on those programs.)
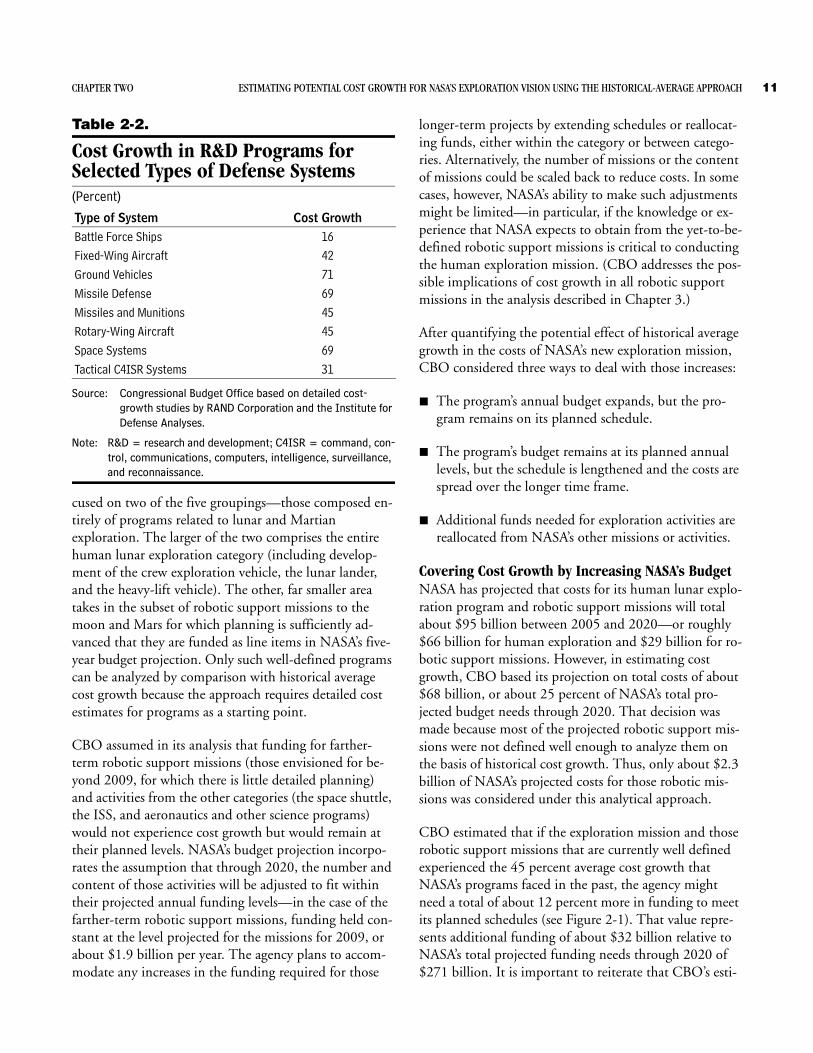
CBO used those programs’ experience to derive a cost-growth risk (CGR) factor that represented an average ra-tio of actual costs to initial estimates for NASA’s pro-grams. The data yielded an average CGR factor of 1.45 for NASA’s past programs—once the effects of inflation had been removed.2 A factor of that size—that is, cost growth, on average, of 45 percent—is comparable to the average cost growth encountered in the research, develop-ment, test, and evaluation phases of a wide variety of DoD systems (see Table 2-2).3
The Budget for NASA’s Exploration Program with Historical Cost GrowthFollowing its recategorization of NASA’s activities (as de-scribed in Chapter 1), CBO’s analysis of cost growth fo-
Program or Mission
Percentage Change in Costs Relative toInitial Budgets
Advanced X-Ray Astrophysics Facility—Chandra 3
Cassini -16CloudSat/Calipso 31Earth Observing 1 108Galileo 207Hubble Space Telescope 235Lunar Prospector -11Mars Exploration Rovers (Spirit
and Opportunity) 16Mars Odyssey 26Stratospheric Observatory for
Infrared Astronomy 44
1. For a discussion of NASA’s program costs, see General Accounting Office, Space Missions Require Substantially More Funding Than Initially Estimated, GAO/NSIAD-93-97 (December 1992). GAO also reported on the space station in Impact of the Grounding of the Shuttle Fleet, GAO-03-1107 (September 2003), and on issues related to NASA’s management in NASA: Lack of Disciplined Cost-Estimating Processes Hinders Effective Program Management, GAO-04-642 (May 2004).
2. As Chapter 3 discusses, CBO used data on inflation and other cost escalation in the aerospace sector that had been compiled by NASA for specific application to its programs. In the past decade, the rate of NASA’s cost growth has been lower than the longer-term average calculated by CBO. The costs of the missions NASA has flown over the past decade have also been lower than the aver-age costs of all missions flown since the 1970s—and lower than the projected costs of the programs that make up the new explora-tion initiative.
3. See J.M. Jarvaise, J.A. Drezner, and D. Norton, The Defense Sys-tem Cost Performance Database: Cost Growth Analysis Using Selected Acquisition Reports, MR-625-OSD (Santa Monica, Calif.: RAND, 1996); K.W. Tyson and others, The Effects of Manage-ment Initiatives on the Costs and Schedules of Defense Acquisition Programs (Alexandria, Va.: Institute for Defense Analyses, 1992); and K.W. Tyson, B.R. Harmon, and D.M. Utech, Understanding Cost and Schedule Growth in Acquisition Programs (Alexandria, Va.: Institute for Defense Analyses, 1994).
CHAPTER TWO ESTIMATING POTENTIAL COST GROWTH FOR NASA’S EXPLORATION VISION USING THE HISTORICAL-AVERAGE APPROACH 11
Table 2-2.
Cost Growth in R&D Programs for Selected Types of Defense Systems(Percent)
Source: Congressional Budget Office based on detailed cost-growth studies by RAND Corporation and the Institute for Defense Analyses.
Note: R&D = research and development; C4ISR = command, con-trol, communications, computers, intelligence, surveillance, and reconnaissance.
cused on two of the five groupings—those composed en-tirely of programs related to lunar and Martian exploration. The larger of the two comprises the entire human lunar exploration category (including develop-ment of the crew exploration vehicle, the lunar lander, and the heavy-lift vehicle). The other, far smaller area takes in the subset of robotic support missions to the moon and Mars for which planning is sufficiently ad-vanced that they are funded as line items in NASA’s five-year budget projection. Only such well-defined programs can be analyzed by comparison with historical average cost growth because the approach requires detailed cost estimates for programs as a starting point.
CBO assumed in its analysis that funding for farther-term robotic support missions (those envisioned for be-yond 2009, for which there is little detailed planning) and activities from the other categories (the space shuttle, the ISS, and aeronautics and other science programs) would not experience cost growth but would remain at their planned levels. NASA’s budget projection incorpo-rates the assumption that through 2020, the number and content of those activities will be adjusted to fit within their projected annual funding levels—in the case of the farther-term robotic support missions, funding held con-stant at the level projected for the missions for 2009, or about $1.9 billion per year. The agency plans to accom-modate any increases in the funding required for those
longer-term projects by extending schedules or reallocat-ing funds, either within the category or between catego-ries. Alternatively, the number of missions or the content of missions could be scaled back to reduce costs. In some cases, however, NASA’s ability to make such adjustments might be limited—in particular, if the knowledge or ex-perience that NASA expects to obtain from the yet-to-be-defined robotic support missions is critical to conducting the human exploration mission. (CBO addresses the pos-sible implications of cost growth in all robotic support missions in the analysis described in Chapter 3.)
After quantifying the potential effect of historical average growth in the costs of NASA’s new exploration mission, CBO considered three ways to deal with those increases:
B The program’s annual budget expands, but the pro-gram remains on its planned schedule.
B The program’s budget remains at its planned annual levels, but the schedule is lengthened and the costs are spread over the longer time frame.
B Additional funds needed for exploration activities are reallocated from NASA’s other missions or activities.
Covering Cost Growth by Increasing NASA’s BudgetNASA has projected that costs for its human lunar explo-ration program and robotic support missions will total about $95 billion between 2005 and 2020—or roughly $66 billion for human exploration and $29 billion for ro-botic support missions. However, in estimating cost growth, CBO based its projection on total costs of about $68 billion, or about 25 percent of NASA’s total pro-jected budget needs through 2020. That decision was made because most of the projected robotic support mis-sions were not defined well enough to analyze them on the basis of historical cost growth. Thus, only about $2.3 billion of NASA’s projected costs for those robotic mis-sions was considered under this analytical approach.
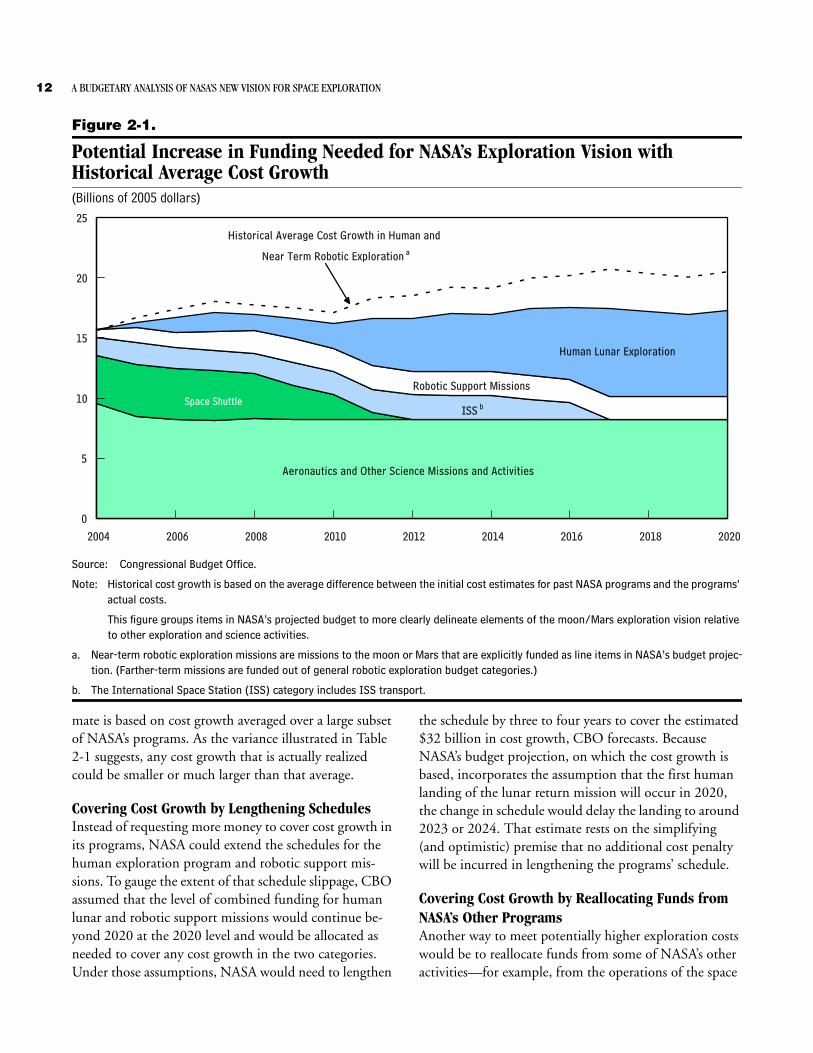
CBO estimated that if the exploration mission and those robotic support missions that are currently well defined experienced the 45 percent average cost growth that NASA’s programs faced in the past, the agency might need a total of about 12 percent more in funding to meet its planned schedules (see Figure 2-1). That value repre-sents additional funding of about $32 billion relative to NASA’s total projected funding needs through 2020 of $271 billion. It is important to reiterate that CBO’s esti-
Type of System Cost GrowthBattle Force Ships 16Fixed-Wing Aircraft 42Ground Vehicles 71Missile Defense 69Missiles and Munitions 45Rotary-Wing Aircraft 45Space Systems 69Tactical C4ISR Systems 31
12 A BUDGETARY ANALYSIS OF NASA’S NEW VISION FOR SPACE EXPLORATION
Figure 2-1.
Potential Increase in Funding Needed for NASA’s Exploration Vision withHistorical Average Cost Growth(Billions of 2005 dollars)
Source: Congressional Budget Office.
Note: Historical cost growth is based on the average difference between the initial cost estimates for past NASA programs and the programs’ actual costs.
This figure groups items in NASA’s projected budget to more clearly delineate elements of the moon/Mars exploration vision relative to other exploration and science activities.
a. Near-term robotic exploration missions are missions to the moon or Mars that are explicitly funded as line items in NASA’s budget projec-tion. (Farther-term missions are funded out of general robotic exploration budget categories.)
b. The International Space Station (ISS) category includes ISS transport.
mate is based on cost growth averaged over a large subset of NASA’s programs. As the variance illustrated in Table 2-1 suggests, any cost growth that is actually realized could be smaller or much larger than that average.
Covering Cost Growth by Lengthening SchedulesInstead of requesting more money to cover cost growth in its programs, NASA could extend the schedules for the human exploration program and robotic support mis-sions. To gauge the extent of that schedule slippage, CBO assumed that the level of combined funding for human lunar and robotic support missions would continue be-yond 2020 at the 2020 level and would be allocated as needed to cover any cost growth in the two categories. Under those assumptions, NASA would need to lengthen
the schedule by three to four years to cover the estimated $32 billion in cost growth, CBO forecasts. Because NASA’s budget projection, on which the cost growth is based, incorporates the assumption that the first human landing of the lunar return mission will occur in 2020, the change in schedule would delay the landing to around 2023 or 2024. That estimate rests on the simplifying (and optimistic) premise that no additional cost penalty will be incurred in lengthening the programs’ schedule.
Covering Cost Growth by Reallocating Funds from NASA’s Other ProgramsAnother way to meet potentially higher exploration costs would be to reallocate funds from some of NASA’s other activities—for example, from the operations of the space
2004 2006 2008 2010 2012 2014 2016 2018 2020
0
5
10
15
20
25
Aeronautics and Other Science Missions and Activities
Space ShuttleISS b
Robotic Support Missions
Human Lunar Exploration
Historical Average Cost Growth in Human and
Near Term Robotic Exploration a
CHAPTER TWO ESTIMATING POTENTIAL COST GROWTH FOR NASA’S EXPLORATION VISION USING THE HISTORICAL-AVERAGE APPROACH 13
shuttle and the International Space Station or the wide array of other research programs. Funds could also be freed up by reducing the content or frequency of the planned robotic support missions.
Implementing those strategies might present differing de-grees of difficulty for NASA. Because changes in the funding for the shuttle and the ISS could have interna-tional ramifications, the agency might be limited in its ability to reallocate those funds. (Alternative futures for the shuttle and the space station are discussed in Chapter 4.) NASA might find it easier to reallocate some of the funding (over $8 billion annually) for its aeronautics and other science activities. From 2005 to 2020, 24 percent of the funding for that budget category would be needed to cover the possible increase in exploration costs—$32 billion of a total projected $132 billion.
Alternatively, NASA could reduce the content and fre-quency of robotic support missions, essentially shifting some of those missions to the years after 2020 or elimi-
nating them from the plan altogether. To overcome the potential cost growth estimated under the historical-aver-age approach, however, NASA would probably still need to reallocate funds from other activities because total pro-jected funding for the robotic support mission (about $29 billion) would be insufficient to cover the potential cost growth in the human lunar exploration mission.
An intermediate solution would be to reallocate some of the needed funding from the robotic missions to Mars—thus preserving the lunar robotic missions, which are likely to be more important to initial human exploration activity—and the remainder from the aeronautics and other science missions category. Deferring or eliminating Mars robotic support missions as they are funded in the current projection could free up as much as $24 billion and only require an additional $8 billion from the aero-nautics category. Of course, that approach might post-pone the second and third steps of the new space explora-tion program—the as-yet-unscheduled progress to Mars and beyond.

3Estimating Potential Costs for NASA’s Exploration
Vision Using Analogies with Past Missions
The preceding chapter developed estimates of how the costs of the new space exploration program of the Na-tional Aeronautics and Space Administration might be affected if the program experienced cost growth equal to the average historical rise in costs that many of NASA’s past programs faced. A limitation of that approach is its applicability only to programs that are well defined. In the case of NASA’s projected funding through 2020 for the new exploration program, the missions that underlie nearly 30 percent of its budget are not yet spelled out. (The robotic support missions account for most of the program’s undefined content.) A way to assess the overall budgets that NASA has projected through 2020 that overcomes that limitation involves comparing those pro-jected amounts with the costs of programs or missions that are similar to or analogous with those planned for the new exploration initiative. Useful comparisons may also be made with the estimated costs of proposed but unimplemented missions that are similar to the human lunar exploration project.
Based on cost analogies that use the Apollo program and past robotic missions to Mars as their foundation, the Congressional Budget Office’s findings suggest that car-rying out the exploration mission may require either more funding or extended schedules—roughly an addi-tional $61 billion or a delay in the first lunar return land-ing of about seven years. Alternatively, if NASA chose to meet potentially higher exploration costs by reallocating money from the aeronautics or other science activities, it might have to shift as much as 46 percent of those pro-grams’ funding over the 2005-2020 period. Those results rest in part on the assumption that NASA’s proposed ro-botic missions to Mars have quite ambitious (and hence costly) objectives. Additional costs for the exploration vi-sion through 2020 would be reduced (dropping to about
$40 billion) if those missions were less ambitious or if some of them were deferred or simply not conducted.
Cost Analogies for Programs to Return People to the MoonCBO compared NASA’s projections of funding for hu-man lunar exploration with actual costs for the Apollo program that sent astronauts to the moon between 1969 and 1972 as well as with the estimated costs for three pro-posed lunar exploration projects: the 1989 Space Explo-ration Initiative (SEI), the 1992 First Lunar Outpost (FLO), and the 1993 Lunar Oxygen (LUNOX) program (which envisioned using lunar resources as propellant on the return mission). In each case, CBO took the relevant actual or estimated costs for a program, refined the anal-ogy (by dropping or adjusting some of the program’s ele-ments) so that it more closely matched NASA’s proposed program, and then adjusted the costs to express them in 2005 dollars. CBO based that adjustment on cost-escala-tion factors developed specifically for NASA’s programs, which incorporate the effects of general inflation plus ad-ditional cost growth particular to the aerospace sector. (Box 3-1 describes NASA’s price index and how CBO ap-plied it to develop the analogies’ costs.) For the SEI, FLO, and LUNOX analogies, which are based on esti-mated costs for proposed programs, CBO developed a range for each analogy’s cost estimate. The low end of the range equals the adjusted estimate expressed in 2005 dol-lars; for the high end of the range, CBO added the histor-ical average cost-growth risk factor of 45 percent (dis-cussed in Chapter 2). It did not apply the CGR factor to the Apollo program because those costs were actually in-curred, not estimated.
The funding that NASA estimates it requires for return-ing humans to the moon lies within the range of costs
C HAP TER
16 A BUDGETARY ANALYSIS OF NASA’S NEW VISION FOR SPACE EXPLORATION
Box 3-1.
Adjusting for Price Increases in Analyzing the Costs of NASA’s Programs
The Congressional Budget Office’s (CBO’s) analysis of the costs of programs related to the National Aeronautics and Space Administration’s (NASA’s) new exploration mission considered price increases both in computing the current-dollar costs of past and proposed programs and in projecting NASA’s budget requirements into the future. In the first case, it used NASA’s own price inflator to develop histori-cal expenditures for actual programs that NASA had conducted in the past and for programs that were proposed but never implemented. In the second, it chose to express future costs in constant dollars—specifically, in 2005 dollars—so as to directly com-pare projected future budget levels with those of the past.
NASA’s Price InflatorNASA’s budget analysts use a variety of methods to project the future costs of the agency’s programs. In many cases, those methods require NASA staff to es-timate the number of hours of labor and the quanti-ties of materials needed to develop, build, test, launch, and operate a proposed system. Analysts then “price out” those quantities by applying a price to each hour of labor and to each unit of materials (for example, one ton of aluminum).1 Estimates of the unit prices for the first, or base, year of a projec-tion period are relatively certain. But many of a pro-gram’s later expenditures are more difficult to predict because they will be incurred in a projection period’s
“out-years” (those following the base year) and are therefore subject to price increases. NASA staff apply a price inflator developed by the agency to estimate the dollars required to purchase labor or materials in future years.
Price inflators reflect the changes in price that are ex-pected to affect certain types of purchases. They are generally projections into the future of historical price indexes, such as the consumer price index or the gross domestic product (GDP) price index. Both of those measures gauge price changes for broad ranges of goods and services—in the former case, all purchases made by consumers; in the latter case, the net cost of all purchases in the economy less the cost of imports. NASA’s price index (from which NASA derives its inflator) is based on a much narrower range of goods and services that are purchased by the agency.
NASA has described the construction of its index—formally, the New Start Inflation Index—as follows:2
In the past, [the index] has been derived us-ing a weighted average of commercially available inflation indices that represent the “market basket” of goods and services that NASA purchases. As such, it is meant to re-flect price changes for the composite group of contractors, vendors, and suppliers with whom NASA deals.
1. Some cost elements—for example, overhead for a program office—may be estimated in purely dollar terms (versus physical units), often as a proportion of the costs associated with labor and materials.
2. Other details of the index’s construction are at www.jsc.nasa.gov/bu2/inflation/nasa/inflateNASA.html.
CHAPTER THREE ESTIMATING POTENTIAL COSTS FOR NASA’S EXPLORATION VISION USING ANALOGIES WITH PAST MISSIONS 17
Box 3-1.
Continued
As a result of recent discussions with OMB [the Administration’s Office of Management and Budget], we have decided to modify the way the out-years portion of the index is de-veloped. Instead of commercially available projections of future inflation, we will begin using OMB projections of future inflation. We are not changing the way we calculate the past-years portion of the index. It will continue to be based on actual inflation data we obtain from commercial sources. But this approach will make the out-years por-tion of the index consistent with OMB in-flation projections. In recent years the OMB projections and the commercial projections have been relatively close.
NASA’s New Start Inflation Index is thus a hybrid of multiple price indexes that have different sampling strategies and that update the underlying market bas-ket at different frequencies. The index is highly ger-mane to CBO’s analysis because it focuses on the particular subset of contractors, vendors, and suppli-ers most relevant to NASA. Over the 1960-2004 pe-riod, the growth rate of NASA’s price index on aver-age exceeded that of the GDP price index by more than 1 percentage point per year.
How CBO Applied NASA’s Inflation Index in Its AnalysisFor its analysis, CBO had to convert NASA’s histori-cal costs for selected past programs (and historical
cost estimates for selected past proposals) into the costs that would be incurred if those programs were executed today. CBO thus applied NASA’s New Start Inflation Index to convert all historical costs—both actual costs and the estimated costs of proposed programs—to 2005 dollars. CBO used NASA’s price index in its conversion because the cost estimates and budget projections that NASA developed for its new exploration mission were based on that index.
Inflation also had to be considered in projecting NASA’s future budgetary needs, and CBO chose to use constant dollars for those estimates. That is, fu-ture budgets are expressed as though the prices of goods and services that NASA purchases will remain constant at 2005 levels through 2020. Thus, for ex-ample, if NASA planned to keep the scope and tech-nical content of a particular program fixed during a future period, the constant-dollar cost of that pro-gram would remain fixed as well.
CBO’s use of constant dollars has two advantages. First, it avoids the uncertainty of having to guess what inflation will be in future years—both general inflation and NASA-specific cost increases, if any. Second, it allows CBO to directly compare the “buy-ing power” associated with historical and projected budget levels. Analysts can estimate then-year (that is, inflated) budgetary needs by applying a price in-flator of their choice to CBO's constant-dollar pro-jections.
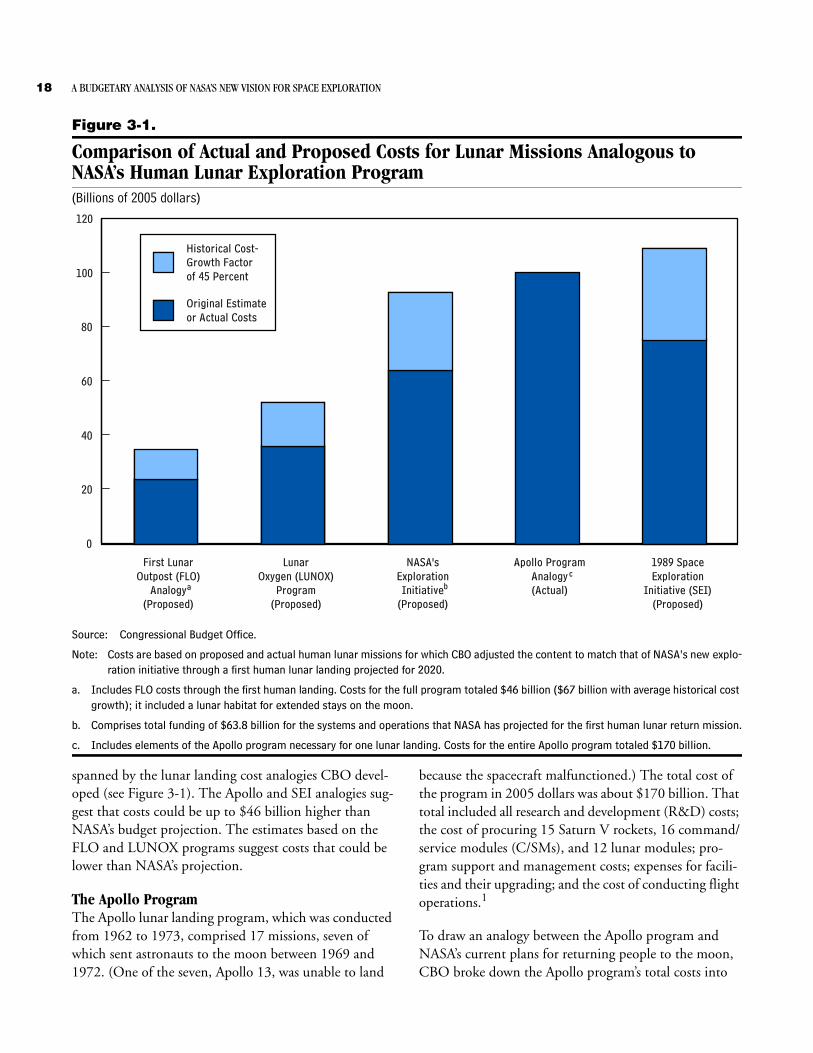
18 A BUDGETARY ANALYSIS OF NASA’S NEW VISION FOR SPACE EXPLORATION
Figure 3-1.
Comparison of Actual and Proposed Costs for Lunar Missions Analogous to NASA’s Human Lunar Exploration Program(Billions of 2005 dollars)
Source: Congressional Budget Office.
Note: Costs are based on proposed and actual human lunar missions for which CBO adjusted the content to match that of NASA’s new explo-ration initiative through a first human lunar landing projected for 2020.
a. Includes FLO costs through the first human landing. Costs for the full program totaled $46 billion ($67 billion with average historical cost growth); it included a lunar habitat for extended stays on the moon.
b. Comprises total funding of $63.8 billion for the systems and operations that NASA has projected for the first human lunar return mission.
c. Includes elements of the Apollo program necessary for one lunar landing. Costs for the entire Apollo program totaled $170 billion.
spanned by the lunar landing cost analogies CBO devel-oped (see Figure 3-1). The Apollo and SEI analogies sug-gest that costs could be up to $46 billion higher than NASA’s budget projection. The estimates based on the FLO and LUNOX programs suggest costs that could be lower than NASA’s projection.
The Apollo ProgramThe Apollo lunar landing program, which was conducted from 1962 to 1973, comprised 17 missions, seven of which sent astronauts to the moon between 1969 and 1972. (One of the seven, Apollo 13, was unable to land
because the spacecraft malfunctioned.) The total cost of the program in 2005 dollars was about $170 billion. That total included all research and development (R&D) costs; the cost of procuring 15 Saturn V rockets, 16 command/service modules (C/SMs), and 12 lunar modules; pro-gram support and management costs; expenses for facili-ties and their upgrading; and the cost of conducting flight operations.1
To draw an analogy between the Apollo program and NASA’s current plans for returning people to the moon, CBO broke down the Apollo program’s total costs into
First LunarOutpost (FLO)
Analogy(Proposed)
LunarOxygen (LUNOX)
Program(Proposed)
NASA'sExplorationInitiative
(Proposed)
Apollo ProgramAnalogy(Actual)
1989 SpaceExploration
Initiative (SEI)(Proposed)
0
20
40
60
80
100
120
Original Estimateor Actual Costs
Historical Cost-Growth Factorof 45 Percent
a
cb
CHAPTER THREE ESTIMATING POTENTIAL COSTS FOR NASA’S EXPLORATION VISION USING ANALOGIES WITH PAST MISSIONS 19
their individual program elements, thus forming two broad categories: overall program costs, which included costs for general R&D, facilities, and personnel; and the costs to develop and procure the Saturn V rockets and the Apollo spacecraft. CBO then reassembled the appropriate elements into a program that more closely resembled NASA’s plans through 2020—that is, one encompassing Apollo’s overall program costs, its component-specific R&D costs, and the procurement costs for four C/SMs, four Saturn V rockets, and one lunar module. The four rockets and the four C/SMs correspond to NASA’s no-tional plan for the exploration initiative consisting of three test flights (with a launch vehicle for each) plus the actual launch of the human lunar mission. As calculated on the basis of the Apollo components, the cost to return U.S. astronauts to the moon would be about $100 bil-lion, CBO estimates, or about 57 percent more than NASA’s budget projection of $63.8 billion.2
CBO’s construction of an analogy between the Apollo program’s costs and NASA’s budget projection does not take into account the potential impact on total costs of differences in the programs’ duration. For Apollo, the first lunar landing occurred about eight years after the program was established. For NASA’s current lunar ini-tiative, the assumption (reflected in NASA’s budget pro-jection) is that people will return to the moon approxi-mately 16 years from now, in 2020. The longer schedule for the new program could cause the total costs for the human lunar exploration mission to exceed those for CBO’s Apollo analogy because factors such as overhead and institutional costs tend to accrue over time as pro-grams continue to operate. Compressing NASA’s pro-jected costs of approximately $64 billion for the human lunar exploration mission into a schedule the length of the Apollo program’s would require an average of about $5 billion in additional funding annually through a first landing in 2013, CBO estimates.3
Advances in technology could reduce the costs of a re-prise of the Apollo program, but the magnitude of the potential reduction is unclear. Analyses of the historical costs of some of the Department of Defense’s programs indicate that technological breakthroughs may reduce the expense of producing selected components (in particular, electronic elements) of missiles and spacecraft. Notwith-standing that effect, new generations of defense equip-ment are generally more expensive than previous ones, in part because the newer equipment contains the latest technology rather than older components that could be purchased at reduced prices. Another factor arguing against a big reduction in costs is that NASA’s prelimi-nary estimate of $730 million for one crew exploration vehicle exceeds the $450 million average cost (in 2005 dollars) of an Apollo command/service module.
The Space Exploration Initiative AnalogyIn July 1989, on the 20th anniversary of the first Apollo lunar landing, President George H. W. Bush proposed a new program of human exploration of space and said that the United States should return to the moon on a perma-nent basis and send astronauts to Mars. The program be-came known as the Space Exploration Initiative. Earlier that month, NASA had completed an estimate for an ex-tensive lunar and Mars human exploration program last-ing from 1991 to 2020 and consisting of two major parts. The first phase was to be an initial human lunar landing in 2001, followed by the establishment and operation of a lunar base. The second phase was designed to include an initial human landing on Mars in 2016, with a subse-quent base there as well. Total costs for the program were estimated by NASA at $455 billion in 1989 dollars. Ad-justed to 2005 dollars, those costs would range from $711 billion to $1.04 trillion (if cost growth was in-cluded).
After the President unveiled the SEI, NASA conducted what became known as the 90-Day Study to further re-fine technical approaches and cost estimates for carrying out the new space exploration proposal. Although the de-tails of that study were different from the more extensive report that had been completed earlier in July, the cost
1. Program management costs include, for example, the salaries of NASA employees who oversee the program. Costs for program support include other overhead charges (such as those for the use of NASA facilities), data analysis costs, and any other expenses associated with supporting the program.
2. The estimated costs for the Apollo analogy would be lower—that is, about $66 billion—if they were based on GDP cost inflators instead of inflators specific to NASA’s purchasing experience (see Box 3-1).
3. That estimate assumes that no change in total costs arises as a result of compressing the schedule for the lunar return mission. Although that kind of schedule acceleration could reduce institu-tional costs, it could also lead to increased costs if, for example, problems cropped up as a result of insufficient time being avail-able for developing and integrating new technologies.
20 A BUDGETARY ANALYSIS OF NASA’S NEW VISION FOR SPACE EXPLORATION
estimates for the two assessments were similar: total pro-gram costs varied from $471 billion to $541 billion in 1991 dollars, or from $775 billion to $1.1 trillion in 2005 dollars. Those costs were expected to accrue over a 30-year program. Because the information available to CBO from the 90-Day Study lacked the level of detail necessary to accurately construct a single lunar landing analogy, CBO developed an analogy based on NASA’s more detailed July 1989 study.
In broad terms, the SEI consisted of three components: returning people to the moon, establishing an extended presence there (a moon base), and sending astronauts on to Mars. CBO’s SEI analogy included costs related only to the first of those components. The SEI estimate for the lunar-return component included costs for the necessary space vehicles and lunar landers (including those for test-ing), a Shuttle-C class launch vehicle capable of carrying a payload of 68 metric tons into low-Earth orbit, and costs for operations, program management, and facili-ties.4 CBO’s estimate of the costs for the lunar return component of the SEI totaled about 10 percent of the proposal’s overall costs—$75 billion, or $110 billion with historical cost growth. Those totals are similar to those for the Apollo analogy (see Figure 3-1).
The First Lunar Outpost AnalogyIn the early 1990s, NASA conducted a number of studies focused on astronauts’ return to the moon, one of which—a program to establish a “First Lunar Out-post”—has recently attracted renewed interest.5 Con-ducted in 1992, the study postulated a lunar return in 2005 with a four-person crew using an expendable crew capsule (similar to the one used in the Apollo program) that was connected to a lunar lander. The FLO program required a new heavy-lift launch vehicle—the proposal included development of an expendable rocket derived from the Saturn V with a payload capacity of 240 metric tons to low-Earth orbit. Upon reaching the moon, the as-tronauts were to occupy a lunar habitat module that had been brought there by a robotic lander.
The program’s estimated cost was $25 billion in 1993 dollars; it covered three heavy-lift launch vehicles, one crew capsule and lander, two cargo landers, and a habitat module and support systems. It did not, however, include program support and management. To create a program analogous with NASA’s current plans, CBO included launchers and spacecraft that matched those of the new exploration initiative, removed the cost of the proposed habitat module, and added an estimate of program sup-port and management costs (40 percent of the other costs).6 Those adjustments yielded costs for the analogy ranging from about $24 billion to $35 billion if historical cost growth is included—considerably lower than those for CBO’s previous analogies and NASA’s current projec-tion of costs for the lunar return mission.
The Lunar Oxygen AnalogyIn 1993, a NASA study proposed another approach to lu-nar missions known as Lunar Oxygen. LUNOX postu-lated a lunar landing in 2005 and sought to reduce costs by producing liquid oxygen on the moon, thereby reduc-ing the amount of propellant lifted into low-Earth orbit and hence the size and cost of the launch vehicle. Key components of the approach were a Shuttle-C class launch vehicle with a payload capacity of 80 metric tons to low-Earth orbit, a piloted lander for the crew, an unpi-loted lander for cargo, and a lunar-surface oxygen pro-duction facility with associated infrastructure, including nuclear power systems and telerobotic loaders and haulers for moving raw materials to the facility. Total program costs were estimated at $19.6 billion (in 1993 dollars) for seven missions to the moon (six with cargo and one with a crew). Again, however, program support and manage-ment costs were not included. Adding those elements and adjusting for inflation and cost-growth risk yielded a range of costs for this analogy of $36 billion to $52 bil-lion (in 2005 dollars).
Unlike some of CBO’s other analogy constructions, the one it created using the LUNOX proposal included all of that program’s components. Although only one of the seven LUNOX missions was expected to carry people, the other six were necessary to establish the infrastructure to support the astronauts’ landing and return to earth. Con-sequently, to make the program analogous with NASA’s
4. The Shuttle-C concept envisions using the space shuttle’s solid rocket boosters and main tank but replacing the orbiter with a simpler cargo-carrying spacecraft.
5. Statement by Michael Griffin, then President and Chief Operat-ing Officer, In-Q-Tel, before the House Science Committee, March 10, 2004.
6. That figure is NASA’s estimate of program support and manage-ment costs and is based on a number of programs, including Apollo.
CHAPTER THREE ESTIMATING POTENTIAL COSTS FOR NASA’S EXPLORATION VISION USING ANALOGIES WITH PAST MISSIONS 21
plans, CBO had to include the other six missions’ costs in its analysis.
Cost Analogies for Robotic Missions to the Moon and MarsThe series of robotic missions to the moon and Mars that forms part of NASA’s exploration vision was intended to help gain knowledge and experience that may be needed to support human exploration. Some of those proposed missions have been explicitly defined, but most are much less specific. CBO developed cost analogies using past ro-botic planetary probes to analyze the budgetary implica-tions of higher costs for robotic missions to the moon and Mars as well as for the Jupiter Icy Moons Orbiter (JIMO) program. (JIMO was included because it is the center-piece of NASA’s plans to develop new nuclear power and electric propulsion technologies that may be critical for powering a lunar base or for sending astronauts to Mars.) CBO based its assessment on the schedule of missions that NASA has proposed for the exploration vision (the Exploration Roadmap) and the agency’s preliminary plans for what it hopes those missions might accomplish.
The Lunar Robotic Mission AnalogyNASA’s 2005 five-year plan contains a line item for lunar exploration totaling $1.2 billion through 2009; most of the activities associated with that budget category are in-tended to help pave the way for the human exploration missions that NASA plans to begin in 2020.7 CBO as-sumed that near-term robotic missions would be exe-cuted with NASA’s projected funding. Over the longer term, CBO estimated the potential costs of robotic mis-sions by considering the cost of analogous past missions. Within the funding it has projected for those missions, NASA hopes to launch a robotic lunar mission each year between 2010 and 2020. CBO assumed that those lunar probes would be rovers similar to the two Mars Explora-tion Rovers, or MERs (Spirit and Opportunity), that ex-plored the Martian surface in 2004. The cost of each MER, including launch and operations support, is ap-proximately $400 million, CBO estimates.8
The Mars Robotic Mission AnalogyIn addition to the lunar missions outlined in NASA’s five-year projection and the Exploration Roadmap, the agency has planned a number of robotic support missions to Mars. As with the near-term lunar missions, CBO as-sumed that the Phoenix lander mission, planned for 2007; the Mars Science Laboratory mission, for 2009; and the Mars Telesat program, for around 2009, could be carried out within NASA’s projected funding level of about $2.2 billion. Just beyond 2009, NASA currently plans two missions to Mars—a Scout and a test bed for various technologies to be used on Mars—which are both projected to be launched in 2011. NASA has proposed that after 2009, two robotic missions be executed every 18 months between 2014 and 2020, for a total of seven. Current plans are that they will include a sample return mission, two additional Scouts, an additional laboratory mission, and three more test beds.
CBO identified several past NASA missions that might serve as cost analogies with those future plans. As a pro-gram analogous to the robotic Mars sample return mis-sion proposed for 2014 and the Mars field lab proposed for 2018, CBO chose the Viking missions to Mars of the 1970s. The Viking program consisted of two missions, each of which had an orbiter and a lander. Its primary ob-jectives were to gather high-resolution imagery of Mars, characterize the structure and composition of the Mar-tian atmosphere and surface, and search for evidence of life—activities that are likely to be similar to those of the proposed future robotic missions. CBO assumed that the Viking program’s costs—$3.5 billion to $4.5 billion for each orbiter and lander pair—would be suitably analo-gous to the costs of the missions proposed for the new initiative. CBO also selected the Viking program as an analogy for the less well defined Mars test-bed missions after 2010. As an alternative, CBO also considered a case
7. According to NASA staff, that funding includes about $700 mil-lion to launch a lunar orbiter in about 2008 and a robotic lunar probe in approximately 2009. It also comprises about $500 mil-lion in near-term funding for future missions.
8. Some people might argue that considering the MERs to be analo-gous to other lunar and Mars rovers might result in overly pessi-mistic results because of the accelerated development of the MERs. A recent article (Michael Dornheim, “Can $$$ Buy Time?” Aviation Week & Space Technology, May 26, 2003, p. 56) quoted $480 million as the estimated cost of a rover—CBO used $400 million in its analysis—and a development period roughly four years shorter than the historical norm. However, whether an extended development span would have resulted in lower program costs is not clear. In many instances, longer development periods can result in larger budgets because of the need to sustain pro-grams’ overhead costs.
22 A BUDGETARY ANALYSIS OF NASA’S NEW VISION FOR SPACE EXPLORATION
that included less capable Mars test-bed missions with costs similar to the MERs ($400 million).
The Jupiter Icy Moons OrbiterAccording to NASA’s current plans, JIMO will be a mis-sion to the three planet-sized moons of Jupiter—Callisto, Ganymede, and Europa. The mission is expected to ex-tensively investigate the Jovian moons’ composition, his-tory, and potential for sustaining life. A propulsion sys-tem to provide the energy required for a spacecraft to move to and from the various orbits of the moons is a particular challenge in this mission. The capabilities of standard chemical propulsion systems are too limited, and the effectiveness of solar-powered electric propulsion systems is restricted by the great distances from the sun in the outer solar system. The JIMO program has therefore proposed the use of electric propulsion thrusters powered by a nuclear fission reactor, which is being developed through a joint NASA/Department of Energy program called Project Prometheus. CBO included JIMO as a mission relevant to human exploration because its new nuclear energy and electric propulsion technologies could be needed for the exploration initiative, both as a poten-tial source of power for human bases on the moon and Mars and for propulsion of human or cargo missions to Mars. Although those activities would probably occur af-ter 2020, work on them could be required in the preced-ing years to maintain continuity in the exploration pro-gram after the first astronauts returned to the moon.
To date, there is no historical NASA mission that is di-rectly analogous to JIMO. Consequently, much as with the human lunar mission analogies described earlier, CBO constructed an analogy by modifying the character-istics of a past program to better fit JIMO’s expected fea-tures. It used the development costs of the Cassini space-craft as a starting point—although JIMO is expected to be more complex and to add a dimension of cost and technical risk that will be difficult to foresee. (The devel-opment and use of a fission reactor represents new tech-nology for space exploration.) CBO nevertheless selected Cassini because it is a large and complex deep-space probe that is the most recently successful (thus far). CBO scaled the relative costs for Cassini and JIMO on the basis of spacecraft weight after correcting for such factors as the significantly different propulsion concepts.9 That ap-proach resulted in a cost estimate of around $10 billion for JIMO, which is on a par with costs recently cited in the literature.10
What Higher Costs in the Exploration Initiative Imply for NASA’s Budget and Programming The analogies that CBO has constructed apply to human exploration programs and to the robotic programs that are intended to support human exploration. NASA has projected that those two sets of activities will cost about $95 billion, or 35 percent of its budget, between 2005 and 2020. To assess the potential annual impact on NASA’s budget of higher costs for those activities, CBO used the Apollo analogy (adjusted to 2005 dollars) be-cause it is based on actual cost experience. As discussed earlier, the cost of the Apollo program is about 57 per-cent ($36 billion) higher than the projected cost of the first human lunar landing component of the new explora-tion mission. (Figure 3-2 shows CBO’s estimate of how those higher costs would affect NASA’s projected annual funding needs for human lunar exploration.) Funding commensurate with the costs of the Apollo analogy could reach a peak annual value of about $11.5 billion in 2017, or more than $4 billion higher than NASA’s projection.
To assess the budgetary effects of higher costs for the ro-botic support missions, CBO applied its analysis of his-torical analogies to NASA’s proposed schedule of those missions through 2020. Although NASA has not yet de-fined the content and cost of many of the missions, its budget projection through 2020 incorporates the as-sumption that their funding will remain constant at about $1.9 billion per year—the level reached in 2009, the last year of NASA’s detailed mission plans. As with the human exploration missions, analogous robotic mis-sions of the past that CBO has examined suggest poten-tially greater costs for the support missions than NASA expects—costs that would peak in 2015 and that could add as much as roughly $4.7 billion annually to NASA’s projection (see Figure 3-3). In CBO’s estimation, NASA could require as much as $25 billion in additional fund-ing during the 2005-2020 period to meet its robotic sup-port mission schedule as currently planned.
9. Cassini weighed 2 metric tons. NASA staff ’s very preliminary esti-mate of JIMO’s weight is 25 metric tons.
10. Andrew Lawler, “NASA Hopes Bigger Is Better for Planned Mis-sion to Jupiter,” Science, vol. 303 (January 30, 2004), pp. 614-615.
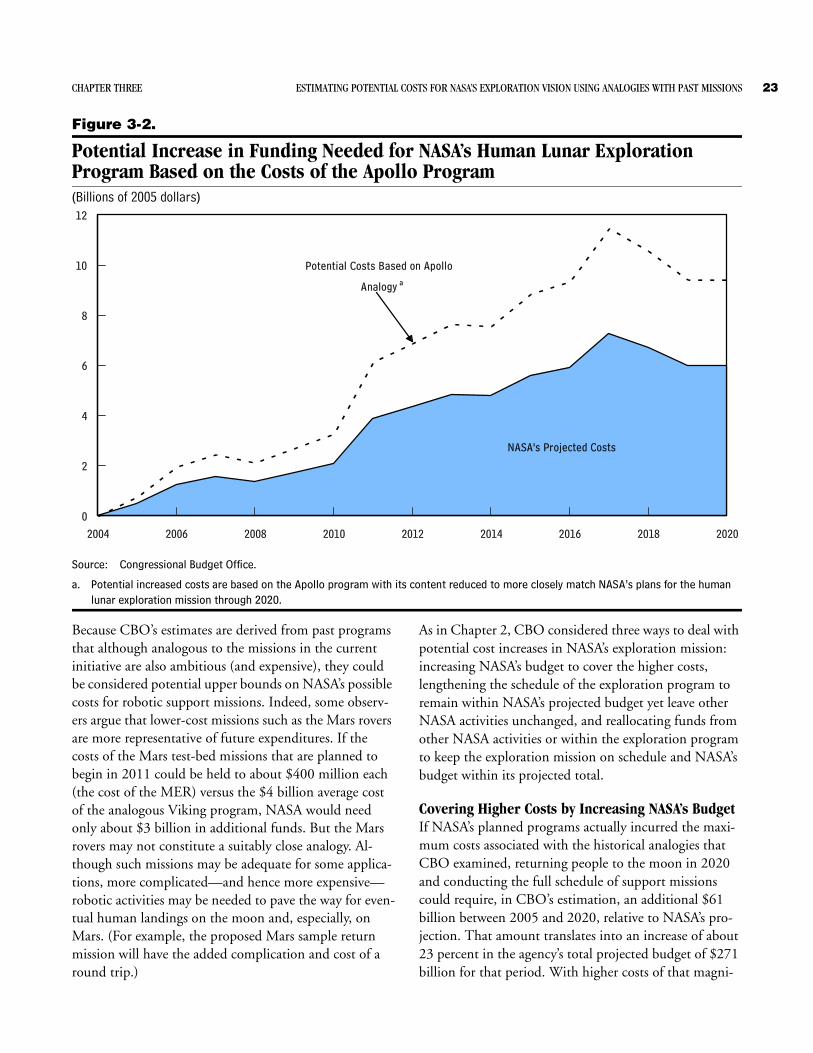
CHAPTER THREE ESTIMATING POTENTIAL COSTS FOR NASA’S EXPLORATION VISION USING ANALOGIES WITH PAST MISSIONS 23
Figure 3-2.
Potential Increase in Funding Needed for NASA’s Human Lunar ExplorationProgram Based on the Costs of the Apollo Program(Billions of 2005 dollars)
Source: Congressional Budget Office.
a. Potential increased costs are based on the Apollo program with its content reduced to more closely match NASA’s plans for the human lunar exploration mission through 2020.
Because CBO’s estimates are derived from past programs that although analogous to the missions in the current initiative are also ambitious (and expensive), they could be considered potential upper bounds on NASA’s possible costs for robotic support missions. Indeed, some observ-ers argue that lower-cost missions such as the Mars rovers are more representative of future expenditures. If the costs of the Mars test-bed missions that are planned to begin in 2011 could be held to about $400 million each (the cost of the MER) versus the $4 billion average cost of the analogous Viking program, NASA would need only about $3 billion in additional funds. But the Mars rovers may not constitute a suitably close analogy. Al-though such missions may be adequate for some applica-tions, more complicated—and hence more expensive—robotic activities may be needed to pave the way for even-tual human landings on the moon and, especially, on Mars. (For example, the proposed Mars sample return mission will have the added complication and cost of a round trip.)
As in Chapter 2, CBO considered three ways to deal with potential cost increases in NASA’s exploration mission: increasing NASA’s budget to cover the higher costs, lengthening the schedule of the exploration program to remain within NASA’s projected budget yet leave other NASA activities unchanged, and reallocating funds from other NASA activities or within the exploration program to keep the exploration mission on schedule and NASA’s budget within its projected total.
Covering Higher Costs by Increasing NASA’s BudgetIf NASA’s planned programs actually incurred the maxi-mum costs associated with the historical analogies that CBO examined, returning people to the moon in 2020 and conducting the full schedule of support missions could require, in CBO’s estimation, an additional $61 billion between 2005 and 2020, relative to NASA’s pro-jection. That amount translates into an increase of about 23 percent in the agency’s total projected budget of $271 billion for that period. With higher costs of that magni-
2004 2006 2008 2010 2012 2014 2016 2018 2020
0
2
4
6
8
10
12
Potential Costs Based on Apollo
Analogy a
NASA's Projected Costs
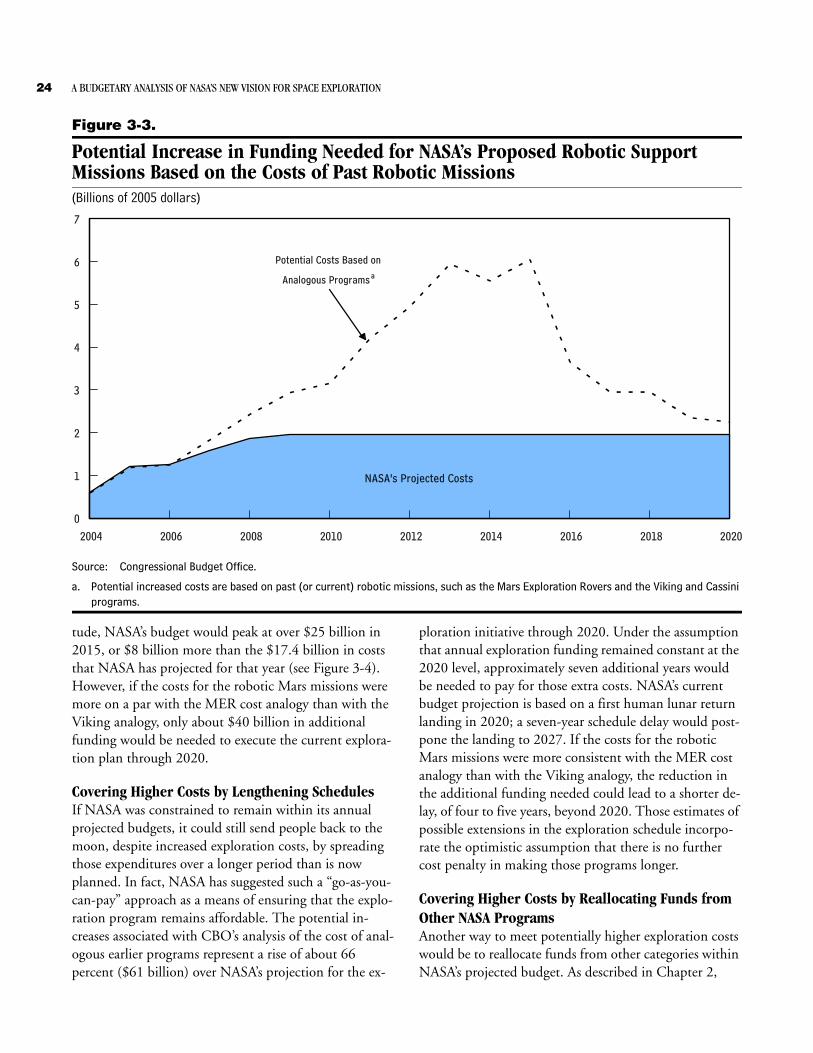
24 A BUDGETARY ANALYSIS OF NASA’S NEW VISION FOR SPACE EXPLORATION
Figure 3-3.
Potential Increase in Funding Needed for NASA’s Proposed Robotic SupportMissions Based on the Costs of Past Robotic Missions(Billions of 2005 dollars)
Source: Congressional Budget Office.
a. Potential increased costs are based on past (or current) robotic missions, such as the Mars Exploration Rovers and the Viking and Cassini programs.
tude, NASA’s budget would peak at over $25 billion in 2015, or $8 billion more than the $17.4 billion in costs that NASA has projected for that year (see Figure 3-4). However, if the costs for the robotic Mars missions were more on a par with the MER cost analogy than with the Viking analogy, only about $40 billion in additional funding would be needed to execute the current explora-tion plan through 2020.
Covering Higher Costs by Lengthening SchedulesIf NASA was constrained to remain within its annual projected budgets, it could still send people back to the moon, despite increased exploration costs, by spreading those expenditures over a longer period than is now planned. In fact, NASA has suggested such a “go-as-you-can-pay” approach as a means of ensuring that the explo-ration program remains affordable. The potential in-creases associated with CBO’s analysis of the cost of anal-ogous earlier programs represent a rise of about 66 percent ($61 billion) over NASA’s projection for the ex-
ploration initiative through 2020. Under the assumption that annual exploration funding remained constant at the 2020 level, approximately seven additional years would be needed to pay for those extra costs. NASA’s current budget projection is based on a first human lunar return landing in 2020; a seven-year schedule delay would post-pone the landing to 2027. If the costs for the robotic Mars missions were more consistent with the MER cost analogy than with the Viking analogy, the reduction in the additional funding needed could lead to a shorter de-lay, of four to five years, beyond 2020. Those estimates of possible extensions in the exploration schedule incorpo-rate the optimistic assumption that there is no further cost penalty in making those programs longer.
Covering Higher Costs by Reallocating Funds from Other NASA ProgramsAnother way to meet potentially higher exploration costs would be to reallocate funds from other categories within NASA’s projected budget. As described in Chapter 2,
2004 2006 2008 2010 2012 2014 2016 2018 2020
0
1
2
3
4
5
6
7
Potential Costs Based on
Analogous Programs a
NASA's Projected Costs

CHAPTER THREE ESTIMATING POTENTIAL COSTS FOR NASA’S EXPLORATION VISION USING ANALOGIES WITH PAST MISSIONS 25
Figure 3-4.
Potential Increase in Funding Needed for NASA’s Human Lunar Exploration and Robotic Support Missions Based on the Costs of Analogous Past Missions(Billions of 2005 dollars)
Source: Congressional Budget Office.
Note: This figure groups items in NASA’s projected budget to more clearly delineate elements of the moon/Mars exploration vision relative to other exploration and science activities.
a. The International Space Station (ISS) category includes ISS transport.
NASA could reallocate more than $8 billion from the projected annual funding for aeronautics and other sci-ence missions and activities. But over the 2005-2020 pe-riod, 46 percent of total aeronautics and other science funding ($61 billion out of a total $132 billion projected by NASA) would be needed to cover the potential in-crease in exploration costs that CBO estimated using the Viking cost analogy for robotic missions. (That fraction might be 30 percent, or $40 billion out of $132 billion, if the costs for the Mars test beds were more analogous to those for the MER analogy than to those for the Viking.)
Under NASA’s current plans, the frequency of robotic missions is scheduled to decrease in the future. However, if exploration costs do rise beyond their projected levels, NASA may be forced to cut back those missions even fur-ther. The number of robotic missions other than explora-tion support missions to the moon or Mars is already slated to drop from 17 between 2005 and 2009 to 10
(plus possibly some as yet undetermined missions) be-tween 2010 and 2014 (see Table 3-1). The number drops again, to six, between 2015 and 2019—again, with addi-tional missions possible though not yet determined. A re-duction in funding of more than 40 percent to accommo-date higher costs in lunar exploration activities would probably force additional cuts in those numbers.
As an alternative, NASA could essentially reallocate funds within the exploration vision programs by reducing the content and frequency of robotic support missions. The funding for robotic support missions in NASA’s budget projection is about 54 percent of the estimated funding that would be required if costs were similar to the analo-gous robotic missions carried out under the Viking pro-gram. That suggests that the content or frequency of those missions would have to be reduced by 46 percent to remain within NASA’s projected budgets—that is, the
2004 2006 2008 2010 2012 2014 2016 2018 2020
0
5
10
15
20
25
30
Aeronautics and Other Science Missions and Activities
Space ShuttleISS a
Robotic Support Missions
Human Lunar Exploration
Potential Additional Costs for Human LunarExploration and Robotic Support Missions
Based on Analogous Past Missions
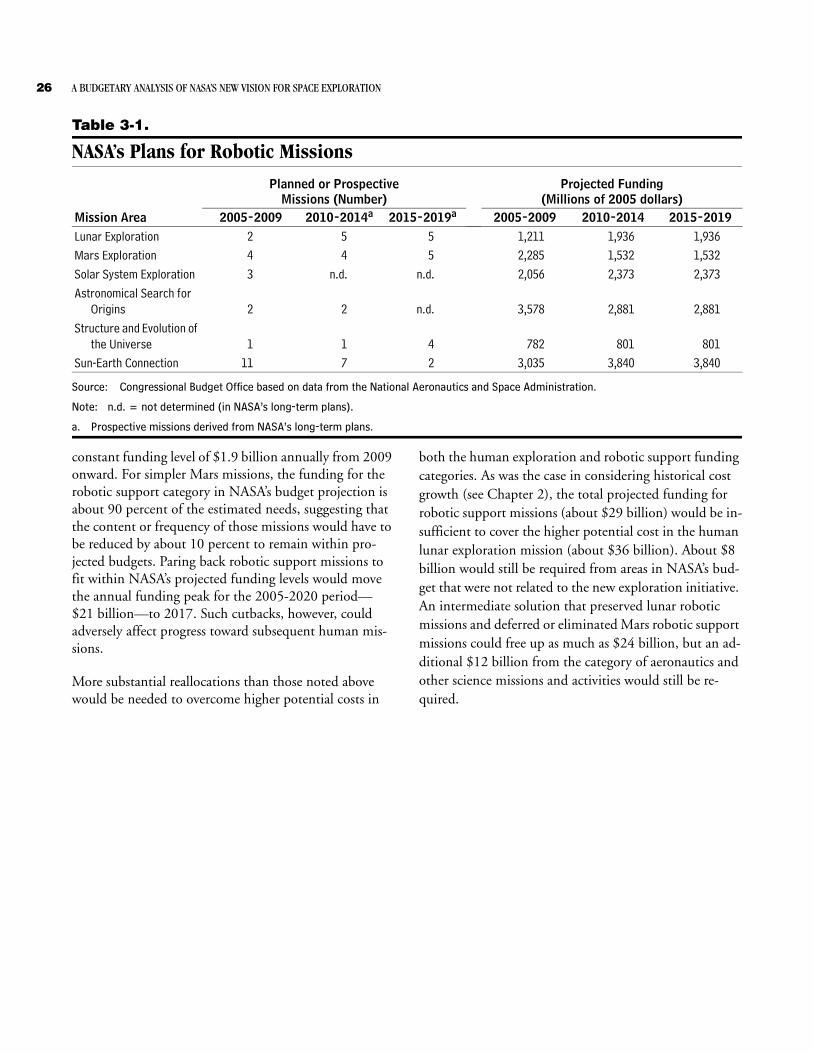
26 A BUDGETARY ANALYSIS OF NASA’S NEW VISION FOR SPACE EXPLORATION
Table 3-1.
NASA’s Plans for Robotic Missions
Source: Congressional Budget Office based on data from the National Aeronautics and Space Administration.
Note: n.d. = not determined (in NASA’s long-term plans).
a. Prospective missions derived from NASA’s long-term plans.
constant funding level of $1.9 billion annually from 2009 onward. For simpler Mars missions, the funding for the robotic support category in NASA’s budget projection is about 90 percent of the estimated needs, suggesting that the content or frequency of those missions would have to be reduced by about 10 percent to remain within pro-jected budgets. Paring back robotic support missions to fit within NASA’s projected funding levels would move the annual funding peak for the 2005-2020 period—$21 billion—to 2017. Such cutbacks, however, couldadversely affect progress toward subsequent human mis-sions.
More substantial reallocations than those noted above would be needed to overcome higher potential costs in
both the human exploration and robotic support funding categories. As was the case in considering historical cost growth (see Chapter 2), the total projected funding for robotic support missions (about $29 billion) would be in-sufficient to cover the higher potential cost in the human lunar exploration mission (about $36 billion). About $8 billion would still be required from areas in NASA’s bud-get that were not related to the new exploration initiative. An intermediate solution that preserved lunar robotic missions and deferred or eliminated Mars robotic support missions could free up as much as $24 billion, but an ad-ditional $12 billion from the category of aeronautics and other science missions and activities would still be re-quired.
Planned or ProspectiveMissions (Number)
Projected Funding(Millions of 2005 dollars)
Mission Area 2005-2009 2010-2014a 2015-2019a 2005-2009 2010-2014 2015-2019Lunar Exploration 2 5 5 1,211 1,936 1,936Mars Exploration 4 4 5 2,285 1,532 1,532Solar System Exploration 3 n.d. n.d. 2,056 2,373 2,373Astronomical Search for
Origins 2 2 n.d. 3,578 2,881 2,881Structure and Evolution of
the Universe 1 1 4 782 801 801Sun-Earth Connection 11 7 2 3,035 3,840 3,840

4Budgetary Implications of Alternative Decisions About the Shuttle Fleet and the International Space Station
The International Space Station has been the center-piece of the National Aeronautics and Space Administra-tion’s human spaceflight program since its first modules were launched and joined in orbit in 1998. The ISS is still being assembled; it depends on NASA’s other crewed spaceflight system, the space shuttle, for its construction and operation. Before the loss of the shuttle Columbia in 2003, NASA planned to keep the ISS in operation at least through 2020 and to use the shuttle to transport crew, experiments, and cargo to the station until 2017 and pos-sibly beyond. As part of its realignment toward the new exploration mission, NASA revised its plans for the shut-tle and the ISS. Although the new policy calls for retiring the shuttle in 2010 and ending operations on the ISS in 2017, uncertainty remains about both the duration and scope of the shuttle’s and the ISS’s future activities as NASA continues to evaluate the implications of the Co-lumbia tragedy and the financial demands of the agency's new priorities for human space exploration.
Decisions about the future of the shuttle and the ISS will have a big impact on NASA’s budget. A total of $5.5 bil-lion was appropriated for the two programs for 2004, ac-counting for over one-third of the agency’s total funding. If NASA continued to fully operate both programs through 2020, spending could remain near that level; by implication, total costs for sustaining the ISS and the shuttle could reach nearly $90 billion over the period. Under its new plan, however, NASA would retire the shuttle after completing construction of the ISS—which the agency hopes will occur in 2010—and end support for the space station in 2017. Such a policy would shorten shuttle operations by several years and end the United States’ involvement with the ISS at the earliest time envisioned in previous plans. Under the plan, spending for the ISS and the shuttle would total $44 bil-lion from 2005 to 2016.
Some observers disagree with NASA’s approach to the shuttle and the ISS and have recommended alternative plans. Some people think that the two programs should be terminated immediately, both because of safety issues and because funds would be freed up in the near term to support the activities of the exploration vision. Other people argue that the shuttle’s and the ISS’s operations should continue according to the plans made before the new exploration program was unveiled—on the grounds of fully honoring commitments made to international partners as well as on the pure merits of the scientific ex-periments planned for the ISS (see Box 4-1).
This chapter assesses the implications—both budgetary and operational—of alternative decisions about the fate of the shuttle and the ISS. An approach that retired the shuttle and discontinued U.S. involvement in the ISS in 2005 could offer savings of as much as $39 billion to $43 billion relative to NASA’s current budget projection. Conversely, an alternative that maintained the shuttle and ISS programs at levels similar to those planned before the advent of the new exploration mission could require up to $24 billion more in funding.
NASA’s New Plans for Operating the Shuttle and the International Space StationThe future of the shuttle and the ISS that NASA de-scribed in planning documents before the loss of Colum-bia was quite different from the plan put forth in the agency’s budget request for 2005 and its longer-term pro-jection, through 2020. Before the Columbia accident, NASA had expected the shuttle orbiters to remain in ser-vice through 2015 and perhaps beyond 2020 and had planned to finish several major milestones for the ISS,
C HAP TER

28 A BUDGETARY ANALYSIS OF NASA’S NEW VISION FOR SPACE EXPLORATION
including U.S. Core Complete (when U.S.-built modules and components would be operational) in 2004 and In-ternational Partner (IP) Core Complete (when modules and components built by international partners would be operational) in 2006. NASA revised that schedule after the accident; its new goal was to finish U.S. Core Com-plete by 2006 and IP Core Complete some time in 2009. Logistical and support missions to the ISS via the shuttle would continue for another year under NASA’s revised schedule until the shuttle’s retirement in 2010. Origi-nally, NASA had planned to operate the ISS for 10 years after construction was completed, which suggested that
operations would continue until about 2020. The agency and its international partners planned to evaluate the space station’s long-term future—whether to decommis-sion it or extend its service life—in about 2017.
NASA’s new intention to limit the duration and scope of the shuttle’s and the ISS’s operations reflects both pro-grammatic and funding considerations. The two pro-grams are not primary components of the current explo-ration initiative because their operations are limited to low-Earth orbit. However, NASA expects to use the ISS for research that supports its new mission, completing
Box 4-1.
NASA’s Prior Plans for Research on the International Space Station
The International Space Station (ISS) is an interna-tional research facility composed of modules contrib-uted by the United States and its partners—includ-ing Canada, the European Space Agency, Japan, and Russia—that are now being assembled in low-Earth orbit. The ISS was developed to serve as a laboratory for a broad range of research requiring environments found in space (for example, the nearly gravity-free environment known as microgravity). As a result of the President’s new exploration vision, however, U.S. research on the ISS will probably be more narrowly focused than was originally planned, with a shift to studies primarily on topics related to long-duration human spaceflight.
Science experiments are currently conducted on the U.S.-built module Destiny, which contains a number of facilities provided both by the United States and by several of its international partners. Destiny in-cludes a human medical research facility, a cell- cultivation system, a materials science laboratory, a muscle-atrophy research and exercise system, and a percutaneous electrical muscle stimulator. In addi-tion to research in the Destiny science module, the Russians have provided long-duration exposure facili-ties on the exterior of their service module.
Past Experiments on the ISS Since October 2000, there have been nine expedi-tions to the ISS (at this writing, the latest mission is
in progress). Their crews have conducted more than 67 days of experiments and operations related to ap-proximately 80 scientific investigations. According to the National Aeronautics and Space Administration (NASA), the general objectives associated with the various experiments are:
B Ensuring the survival of people traveling far from Earth (for example, by investigating the effect of prolonged spaceflight on human skeletal muscle, the effects on pulmonary function of extra-vehicular activity and long-term exposure to mi-crogravity, and the risk of developing renal stones during spaceflight);
B Expanding people’s understanding of natural laws and enriching their lives on Earth (through stud-ies of such phenomena as skeletal development in embryonic quail, crystallization of the next gener-ation of octarellins (a kind of protein), use of NASA’s bioreactor to study cell-cycle regulation, and the mechanisms of the metastasis of colon cancer in microgravity);
B Creating technology to support expeditions by the next generation of explorers (through, for in-stance, research on microgravity’s impact on plant seed-to-seed production, experiments on in-space soldering, and development of a generic biopro-cessing apparatus for plants); and
CHAPTER FOUR BUDGETARY IMPLICATIONS OF ALTERNATIVE DECISIONS ABOUT THE SHUTTLE FLEET AND THE INTERNATIONAL SPACE STATION 29
construction and operating the station on a more limited basis through 2016. Shuttle operations would stop once construction of the ISS was completed—in 2010, NASA expects—but the United States and its international part-ners would still have to transport the crews and cargo needed to maintain the ISS and the experiments that would continue to be performed. NASA expects to use Russian Soyuz capsules to transport astronauts to and from the ISS from 2011 through 2014, after which it is planning to deploy the new crew exploration vehicle. Russian Progress vehicles and the autonomous transfer
vehicle being developed by the European Space Agency would be used to transport cargo.
NASA’s current plan would keep the shuttle operational until at least 2010 because only it and its crews can de-liver and assemble core ISS components. For example, the shuttle is the only vehicle that has the payload capac-ity and volume to initially lift and then carry many of the modules and replacement components for the ISS. Even the largest versions of the Department of Defense’s un-manned evolved expendable launch vehicle rockets lack a sufficiently large payload fairing to accommodate many
Box 4-1.
Continued
B Observing the Earth (through the Crew Earth Observations program, experiments with long-duration high-definition TV camcorders, and education-oriented payloads).
Of those scientific studies, about one-fourth were de-voted to human spaceflight and more than half to the physical and biological sciences. The remainder fo-cused on technology and Earth observation.
NASA’s Plans for Future ISS Research Before Its Shift in Mission In 2002, NASA commissioned a study by an external Research Maximization and Prioritization (REMAP) Task Force to evaluate the relative importance of the ISS research programs that NASA had proposed. The REMAP study divided those proposed ISS efforts into four categories—medical, medical/biological, bi-ological, and physical—and assigned the individual programs within each category priority levels of be-tween one (indicating a top priority) and four. Exam-ples of top-priority research included studies on radi-ation health (in the medical science category), advanced life support (in the medical/biological sci-ence category), environmental monitoring and con-trol (in the biological science category), and energy conversion (in the physical science category). Some of the lower-priority topics that the task force identi-fied were human factors engineering (second-level
priority in the medical science category; radiation protection (a third-level priority in the physical sci-ence category), and evolutionary biology (a fourth-level priority in the medical/biological science cate-gory).
In addition to ranking NASA’s research proposals for the ISS, the task force considered the importance of various components of the space station that it deemed necessary for the ISS’s effectiveness as a “science-driven” program. The elements it identified that were planned (but not yet launched and assem-bled in orbit) were, specifically, a centrifuge, the labo-ratory module developed by the European Space Agency (ESA), and the Japanese module, with its ex-posed “porch.” The centrifuge, which was to be built by the Japanese and housed in the U.S.-built Centri-fuge Accommodation Module, was essential for con-ducting microgravity experiments. The ESA labora-tory module, Columbus, offered such capabilities as a biolab, a physiology component, and a fluid sciences laboratory. Japan’s Kibo module was expected to pro-vide facilities for research in materials science, cell bi-ology, fluid physics, and protein crystallization—as well as a laboratory freezer. In addition, the Kibo module was to provide an external “porch” that would allow long-duration exposure experiments and also house an X-ray astronomy package and equip-ment for a laser communications demonstration.
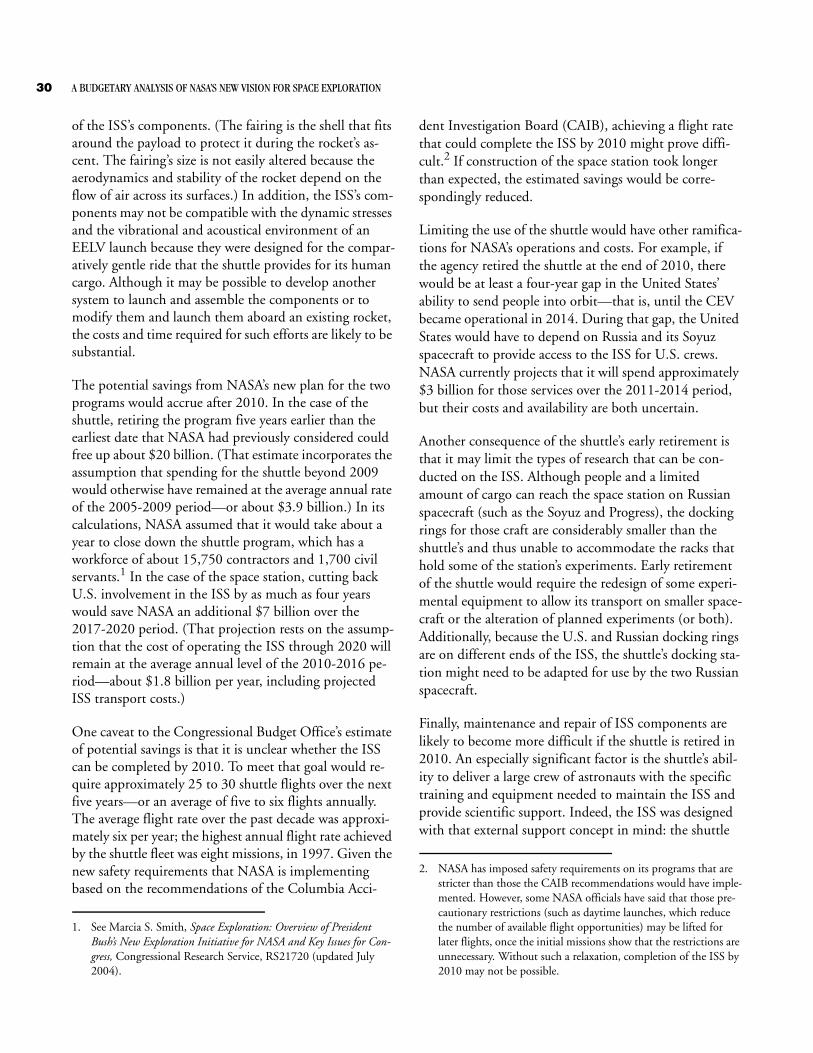
30 A BUDGETARY ANALYSIS OF NASA’S NEW VISION FOR SPACE EXPLORATION
of the ISS’s components. (The fairing is the shell that fits around the payload to protect it during the rocket’s as-cent. The fairing’s size is not easily altered because the aerodynamics and stability of the rocket depend on the flow of air across its surfaces.) In addition, the ISS’s com-ponents may not be compatible with the dynamic stresses and the vibrational and acoustical environment of an EELV launch because they were designed for the compar-atively gentle ride that the shuttle provides for its human cargo. Although it may be possible to develop another system to launch and assemble the components or to modify them and launch them aboard an existing rocket, the costs and time required for such efforts are likely to be substantial.
The potential savings from NASA’s new plan for the two programs would accrue after 2010. In the case of the shuttle, retiring the program five years earlier than the earliest date that NASA had previously considered could free up about $20 billion. (That estimate incorporates the assumption that spending for the shuttle beyond 2009 would otherwise have remained at the average annual rate of the 2005-2009 period—or about $3.9 billion.) In its calculations, NASA assumed that it would take about a year to close down the shuttle program, which has a workforce of about 15,750 contractors and 1,700 civil servants.1 In the case of the space station, cutting back U.S. involvement in the ISS by as much as four years would save NASA an additional $7 billion over the 2017-2020 period. (That projection rests on the assump-tion that the cost of operating the ISS through 2020 will remain at the average annual level of the 2010-2016 pe-riod—about $1.8 billion per year, including projected ISS transport costs.)
One caveat to the Congressional Budget Office’s estimate of potential savings is that it is unclear whether the ISS can be completed by 2010. To meet that goal would re-quire approximately 25 to 30 shuttle flights over the next five years—or an average of five to six flights annually. The average flight rate over the past decade was approxi-mately six per year; the highest annual flight rate achieved by the shuttle fleet was eight missions, in 1997. Given the new safety requirements that NASA is implementing based on the recommendations of the Columbia Acci-
dent Investigation Board (CAIB), achieving a flight rate that could complete the ISS by 2010 might prove diffi-cult.2 If construction of the space station took longer than expected, the estimated savings would be corre-spondingly reduced.
Limiting the use of the shuttle would have other ramifica-tions for NASA’s operations and costs. For example, if the agency retired the shuttle at the end of 2010, there would be at least a four-year gap in the United States’ ability to send people into orbit—that is, until the CEV became operational in 2014. During that gap, the United States would have to depend on Russia and its Soyuz spacecraft to provide access to the ISS for U.S. crews. NASA currently projects that it will spend approximately $3 billion for those services over the 2011-2014 period, but their costs and availability are both uncertain.
Another consequence of the shuttle’s early retirement is that it may limit the types of research that can be con-ducted on the ISS. Although people and a limited amount of cargo can reach the space station on Russian spacecraft (such as the Soyuz and Progress), the docking rings for those craft are considerably smaller than the shuttle’s and thus unable to accommodate the racks that hold some of the station’s experiments. Early retirement of the shuttle would require the redesign of some experi-mental equipment to allow its transport on smaller space-craft or the alteration of planned experiments (or both). Additionally, because the U.S. and Russian docking rings are on different ends of the ISS, the shuttle’s docking sta-tion might need to be adapted for use by the two Russian spacecraft.
Finally, maintenance and repair of ISS components are likely to become more difficult if the shuttle is retired in 2010. An especially significant factor is the shuttle’s abil-ity to deliver a large crew of astronauts with the specific training and equipment needed to maintain the ISS and provide scientific support. Indeed, the ISS was designed with that external support concept in mind: the shuttle
1. See Marcia S. Smith, Space Exploration: Overview of President Bush’s New Exploration Initiative for NASA and Key Issues for Con-gress, Congressional Research Service, RS21720 (updated July 2004).
2. NASA has imposed safety requirements on its programs that are stricter than those the CAIB recommendations would have imple-mented. However, some NASA officials have said that those pre-cautionary restrictions (such as daytime launches, which reduce the number of available flight opportunities) may be lifted for later flights, once the initial missions show that the restrictions are unnecessary. Without such a relaxation, completion of the ISS by 2010 may not be possible.
CHAPTER FOUR BUDGETARY IMPLICATIONS OF ALTERNATIVE DECISIONS ABOUT THE SHUTTLE FLEET AND THE INTERNATIONAL SPACE STATION 31
was expected to transport scientific experiments to and from Earth and enable the refurbishment of critical equipment (for example, the control momentum gyro-scopes that stabilize the ISS’s flight in its orbit).
Implications of Alternative Plans for the Shuttle’s and the ISS’s Operations CBO assessed the operational and budgetary implications of two different plans that span extremes of support for the shuttle and the ISS. They range from the immediate termination of both programs to the continuation of sup-port for the two activities at levels similar to those planned before the advent of the new exploration vision. The first alternative would retire the shuttle and discon-tinue U.S. involvement in the ISS in 2005. Savings from such a plan would total $39 billion to $43 billion, relative to NASA’s current budget projection; the funding needed to implement the plan would be the costs of ter-minating the programs. The second alternative would maintain the shuttle and ISS programs at levels similar to those planned before NASA’s shift in focus. As much as $73 billion in funding could be required to carry out that plan. Relative to NASA’s budget projection, that alterna-tive would require up to $24 billion more in funding.
Alternative 1: Retire the Shuttle and End Involve-ment with the ISS in 2005Of the two alternatives, immediately retiring the shuttle and ending the United States’ involvement with the ISS offer the greatest potential savings. NASA’s projection of costs for the two programs’ operations from 2005 through 2020 totals about $44 billion; shuttle operations through 2010 account for about $22 billion of that amount. However, once the costs of suddenly terminat-ing the programs are taken into consideration, savings are reduced. For example, when NASA canceled the Space Launch Initiative, its 2005 budget request noted the pro-gram’s termination but also asked for $261 million—or about 26 percent of the previous year’s funding—to shut down the program. In the case of the shuttle and the ISS, termination costs equal to 26 percent of the previous year’s funding for the two programs would total $1.4billion.
Yet the costs for terminating the shuttle and the ISS are likely to be higher than those for the Space Launch Initia-tive because the shuttle and the ISS are mature efforts, with much more established infrastructures that will have
to be deactivated. Under a more pessimistic assumption, the costs for terminating the shuttle’s and the space sta-tion’s operations in 2005 could be about $5.5 billion—that is, if the costs equaled the previous year’s funding. Within that estimated range ($1.4 billion to $5.5 bil-lion), NASA’s potential savings, relative to its 2005 bud-get projection, would be between $39 billion and $43 billion.
The potential savings from the early termination of the shuttle and the ISS programs could be used in several ways. By reallocating those savings to the exploration ini-tiative, NASA might be able to move up the first human lunar return landing by nearly four years, to around 2016. (That estimate assumes that the required technol-ogy maturation and overall design process could keep pace with the added funding and that NASA’s exploration programs experienced no cost growth.) Alternatively, NASA could use about $10 billion of the projected sav-ings to restore the funds that the 2005 budget projection cut from the agency’s science missions—programs such as Solar System Exploration, Astronomical Search for Ori-gins, Structure and Evolution of the Universe, and the Sun-Earth Connection. That approach would leave $33 billion (if the high end of the range of savings was used for the calculation) for exploration or other projects.
Although this alternative would offer the most savings, it would also have the biggest operational ramifications for the United States’ human spaceflight program. Retiring the shuttle fleet in 2005 would keep the United States from meeting its international commitments for con-struction and support of the ISS. It would also increase the gap in U.S. astronauts’ access to space from four years to nine years—unless NASA could speed up development of the CEV. Moreover, to fully realize the savings offered by this alternative would require closing the production lines for some of the shuttle’s components, such as the ex-ternal tank, the solid rocket boosters, and the main en-gines. That would make it more difficult to use those sys-tems or derivatives of them in future launch vehicles, as some people have proposed. In particular, closing the production lines would affect a recent proposal for devel-oping a cargo-carrying version of the shuttle’s launch sys-tem—the Shuttle-C class launch vehicle. That approach has been seen as a low-cost path to a new launcher with heavy-lift capability—a feature that may be required for lunar exploration missions as well as for human missions to Mars.
32 A BUDGETARY ANALYSIS OF NASA’S NEW VISION FOR SPACE EXPLORATION
Figure 4-1.
Potential Additional Funding Needed to Extend Space Shuttle Operations Through 2017(Billions of 2005 dollars)
Source: Congressional Budget Office.
Note: This figure groups items in NASA’s projected budget to more clearly delineate elements of the moon/Mars exploration vision relative to other exploration and science activities.
a. The International Space Station (ISS) category includes ISS transport.
Alternative 2: Support the Shuttle’s and the ISS’s Operations Until 2017Under this alternative, the United States would continue to operate the shuttle and maintain its participation in the ISS through 2017, the time at which the space sta-tion’s future was slated to be reevaluated under NASA’s previous plans. Because this option is similar to NASA’s previous plan for the two programs, it has no negative op-erational ramifications relative to that approach. Under this alternative, the United States would satisfy its com-mitments to the ISS, there would be no gap in U.S. astro-nauts’ access to space, and shuttle production lines that might be needed for future exploration systems would be preserved.
Continued operating costs for the shuttle as well as the potential costs involved in its recertification would have substantial implications for NASA’s projected budgets.3 Under the assumption that annual funding for the shut-
tle’s operations remained at the average level cited in NASA’s budget projection for the 2005-2009 period, the agency would need an additional $21 billion in total be-tween 2010 and 2017 (see Figure 4-1). That estimate in-corporates the assumption that the funding included in
2004 2006 2008 2010 2012 2014 2016 2018 2020
0
5
10
15
20
25Potential Additional Costs forExtending Shuttle Operations
Robotic Support Missions
Aeronautics and Other Science Missions and Activities
Space Shuttle
Human Lunar Exploration
ISS a
3. The concept of “recertification” has been mentioned by both NASA (prior to the Columbia accident) and the CAIB as a condi-tion for the shuttle’s continued operation past 2010. However, the requirements to be met in recertifying the shuttle fleet have not been defined by either NASA or the CAIB, which makes the cost of the process difficult to estimate. As part of NASA’s current program, the orbiter undergoes an orbiter maintenance and modi-fication (OMM) review every eight flights or every three years. (The OMM is a detailed inspection of the orbiter’s structure, elec-tronics, and other systems to ensure that there is no degradation or damage.) An OMM typically takes from three months to a year to complete and costs $60 million to $120 million per vehicle. However, to recertify the shuttles could require more extensive work and expense than an OMM review would.

CHAPTER FOUR BUDGETARY IMPLICATIONS OF ALTERNATIVE DECISIONS ABOUT THE SHUTTLE FLEET AND THE INTERNATIONAL SPACE STATION 33
NASA’s budget projection for alternative ISS transport—over $5 billion—would not be needed for that purpose if the shuttle continued to operate until 2017. If NASA re-allocated funding from its exploration program to con-tinue flying the shuttle through that year, the first human lunar return landing might have to be postponed by about two years, to 2022—and that estimate does not take into account any of the cost growth discussed earlier. NASA staff have indicated that the first human lunar landing could slip by as much as a year for every year that the shuttle’s operations were extended because substantial work on components of the human lunar mission (such
as the lander and the heavy-lift launch vehicle) might not begin until the shuttle had been retired.
The assumption under this alternative that the shuttle’s funding would remain at pre-2009 levels through 2017 might be pessimistic. It might be possible to reduce the annual rate of shuttle flights after construction of the space station was completed in 2010 and after alternative spacecraft, such as the CEV, were available for missions to the ISS that did not require the shuttle’s cargo capacity. A large portion of the shuttle’s budget, however, is used to fund the infrastructure that supports its operation. A re-duction in the rate of flights would have little impact on that portion of the shuttle’s budget.

CBO’s Analysis of Cost Growthin NASA’s Programs
On the basis of budget data provided by the Na-tional Aeronautics and Space Administration (NASA), the Congressional Budget Office (CBO) estimates that average growth in the costs of a set of 72 programs exe-cuted by NASA since 1977 has been about 45 percent, excluding the effects of inflation. (Schedules for programs can lengthen relative to initial plans, requiring costs to be budgeted over a longer period than anticipated. In its es-timates, CBO removed the approximate portion of cost growth that derived from the need to budget for price in-flation when programs ran longer than originally planned.) Table A-1 lists the programs that CBO consid-ered; it presents their initially budgeted and final actual (or most recent) budgeted costs and the difference be-tween them (as a percentage change). The average per-centage rise in actual budgeted costs for the 72-program set—52 percent—exceeded CBO’s estimate of growth because actual budgeted costs include increases forinflation.
Owing to a lack of data, CBO could not analyze the rea-sons that costs for NASA’s programs have grown or de-clined. The data that CBO had available was the funding for NASA’s programs that various Administrations had proposed in successive budget requests. Those requests are made after Administration staff decide whether to change a program’s schedule or content (for example, by eliminating sensors or other capabilities on a satellite that had been part of previous plans). Such decisions may oc-cur for a variety of reasons, including the need to prevent a program’s costs from exceeding established targets. An analysis of budgetary data alone cannot reveal the basis for those choices, nor does it permit analysts to separate cost growth that arises as a result of lengthened schedules from cost increases that occur for other reasons.
As a comparison, CBO computed cost growth for the same set of 72 programs (again, removing the effects of inflation) as a dollar-weighted average, with each pro-gram’s contribution to the average proportional to its to-tal cost. That calculation yielded a larger average cost
growth—about 60 percent—suggesting that NASA’s more expensive, and possibly more complex, programs tend to experience greater cost growth than less expensive ones. However, given the lack of information about the specific reasons underlying changes in costs, analysts computed cost-growth estimates for the exploration pro-grams discussed in Chapter 2 on the basis of the arith-metic-mean growth in costs for the set of NASA’s 72programs—that is, 45 percent.
There is uncertainty in CBO’s estimates of the potential for cost growth in NASA’s proposed exploration pro-grams for several reasons. For example, CBO’s analysis of historical cost growth in NASA’s programs removed the effects of inflation only approximately, basing the adjust-ment on the average annual inflation and spending that occurred when each program was conducted. CBO used that approximate approach because detailed year-by-year budget data were not readily available for all of the pro-grams that CBO studied. In addition, the cost growth ex-perienced by NASA’s past programs varied considerably. Although it averaged 52 percent (before adjusting for in-flation), growth in budgeted costs for the 72 programs ranged from -25 percent to 274 percent (see Table A-1).
Another source of the uncertainty in CBO’s estimates stems from the steady decline in average cost growth in NASA’s programs over the past 30 years. In the 72-program set, average cost growth fell from 140 percent in the 1970s to about 20 percent in 2000 (see Figure A-1). That drop might lead some observers to conclude that CBO’s use of overall average growth since the 1970s over-estimated the potential for cost growth in the new explo-ration vision. But the average cost of NASA’s programs has also fallen, declining from about $3.5 billion in the 1980s to about $500 million in the 1990s. Because the projected costs of the programs that NASA must execute to return to the moon range well into many billions of dollars, the agency’s recent experience with lower levels of cost growth may not be applicable to the new exploration initiative.
APP ENDIX

36 A BUDGETARY ANALYSIS OF NASA’S NEW VISION FOR SPACE EXPLORATION
Table A-1.
Cross-Section of NASA’s Programs and Budgets(Millions of nominal dollars)
Continued
Year ofInitial Budget
435.0 1,544.9 255 1977260.1 501.7 93 1977276.2 902.3 227 1978196.0 168.9 -14 1979183.8 557.1 203 1981
97.5 159.7 64 1982575.3 615.1 7 1982
Satellite 354.0 498.0 41 1983107.4 85.9 -20 1984
Satellite I-M 554.6 1,241.0 124 1984322.8 463.2 43 1984
40.7 152.2 274 1984306.0 511.1 67 1985100.4 200.4 100 1985317.0 453.2 43 1986371.0 766.5 107 1986
Satellite Ground Terminal 341.4 532.0 56 1986269.0 370.0 38 1986
Research Program 221.0 326.0 48 19872,100.0 1,800.0 -14 1987
17,682.0 32,878.0 86 1987321.3 401.5 25 1987159.0 302.0 90 1988334.0 458.1 37 1988
1,978.0 3,251.8 64 198932.5 42.9 32 1989
Satellite/Transition Region and Coronal Explorer/Wide Field Infrared Explorer 140.0 212.7 52 1989
1,410.0 1,617.8 15 19901,436.4 1,375.9 -4 1990
109.2 194.2 78 19901,078.7 1,226.5 14 1991
218.8 246.0 12 1991591.7 993.0 68 1992201.7 210.1 4 1992707.6 706.1 0 1993
87.1 76.9 -12 1993135.5 108.5 -20 1994
Upper Atmosphere Research SatelliteAdvanced Communications Technology
Extreme Ultraviolet Explorer
GalileoUlyssesGamma Ray ObservatoryCosmic Background Explorer
Hubble Space Telescope
Most Recent Initial
Land Remote Sensing Satellite-D
Geospatial Operational Environmental
MagellanTethered Satellite SystemMars ObserverNASA ScatterometerFourier Transform SpectrometerOrbital Maneuvering Vehicle
Tracking and Data Relay Satellite-7
Second Tracking and Data Relay
Collaborative Solar-Terrestrial
Space Shuttle EndeavourSpace StationTopography ExperimentAeroassist Flight ExperimentGlobal Geospatial Science ProgramAdvanced Solid Rocket MotorFast Auroral Snapshot Explorer
Alternative TurbopumpMultifunction Electronics Display Subsystem
Submillimeter Wave Astronomy
Advanced X-Ray Astrophysics FacilityCassiniX-Ray Timing Explorer
Earth Observing System, Aura SatelliteLarge Throat Main Combustion ChamberAdvanced Composition Explorer
ChangePercentage
Budget Budget
Earth Observing System, Terra SatelliteTropical Rainfall Measuring Mission
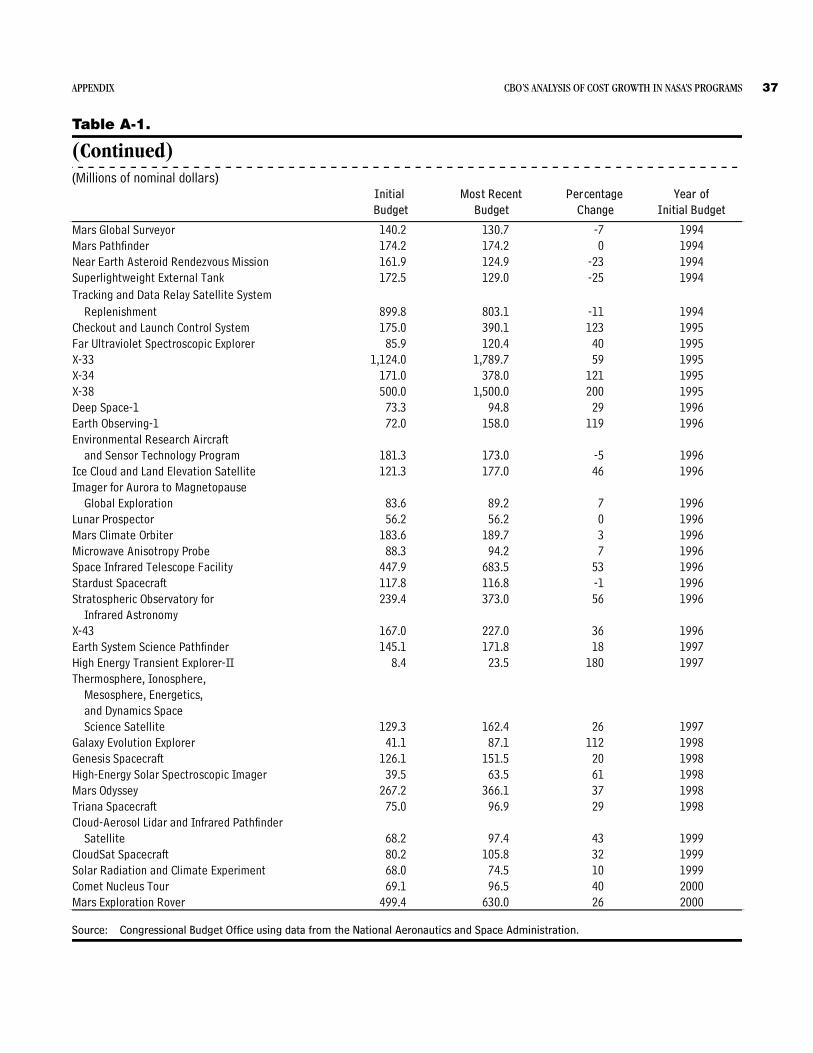
APPENDIX CBO’S ANALYSIS OF COST GROWTH IN NASA’S PROGRAMS 37
Table A-1.
(Continued)(Millions of nominal dollars)
Source: Congressional Budget Office using data from the National Aeronautics and Space Administration.
Year ofInitial Budget
140.2 130.7 -7 1994174.2 174.2 0 1994161.9 124.9 -23 1994172.5 129.0 -25 1994
Replenishment 899.8 803.1 -11 1994175.0 390.1 123 1995
85.9 120.4 40 19951,124.0 1,789.7 59 1995
171.0 378.0 121 1995500.0 1,500.0 200 1995
73.3 94.8 29 199672.0 158.0 119 1996
and Sensor Technology Program 181.3 173.0 -5 1996121.3 177.0 46 1996
Global Exploration 83.6 89.2 7 199656.2 56.2 0 1996
183.6 189.7 3 199688.3 94.2 7 1996
447.9 683.5 53 1996117.8 116.8 -1 1996239.4 373.0 56 1996
Infrared Astronomy167.0 227.0 36 1996145.1 171.8 18 1997
8.4 23.5 180 1997
Mesosphere, Energetics, and Dynamics Space Science Satellite 129.3 162.4 26 1997
41.1 87.1 112 1998126.1 151.5 20 1998
39.5 63.5 61 1998267.2 366.1 37 1998
75.0 96.9 29 1998
Satellite 68.2 97.4 43 199980.2 105.8 32 199968.0 74.5 10 199969.1 96.5 40 2000
499.4 630.0 26 2000
Near Earth Asteroid Rendezvous MissionSuperlightweight External TankTracking and Data Relay Satellite System
Checkout and Launch Control SystemFar Ultraviolet Spectroscopic ExplorerX-33X-34
Mars Climate Orbiter
Space Infrared Telescope Facility
X-38Deep Space-1Earth Observing-1
Ice Cloud and Land Elevation Satellite
Environmental Research Aircraft
Imager for Aurora to Magnetopause
Lunar Prospector
Microwave Anisotropy Probe
CloudSat Spacecraft
Stratospheric Observatory for Stardust Spacecraft
X-43Earth System Science Pathfinder
Cloud-Aerosol Lidar and Infrared Pathfinder
High Energy Transient Explorer-II
Galaxy Evolution ExplorerGenesis Spacecraft
Thermosphere, Ionosphere,
Solar Radiation and Climate ExperimentComet Nucleus TourMars Exploration Rover
Budget Budget Change
High-Energy Solar Spectroscopic ImagerMars OdysseyTriana Spacecraft
Mars Pathfinder
Initial Most Recent Percentage
Mars Global Surveyor
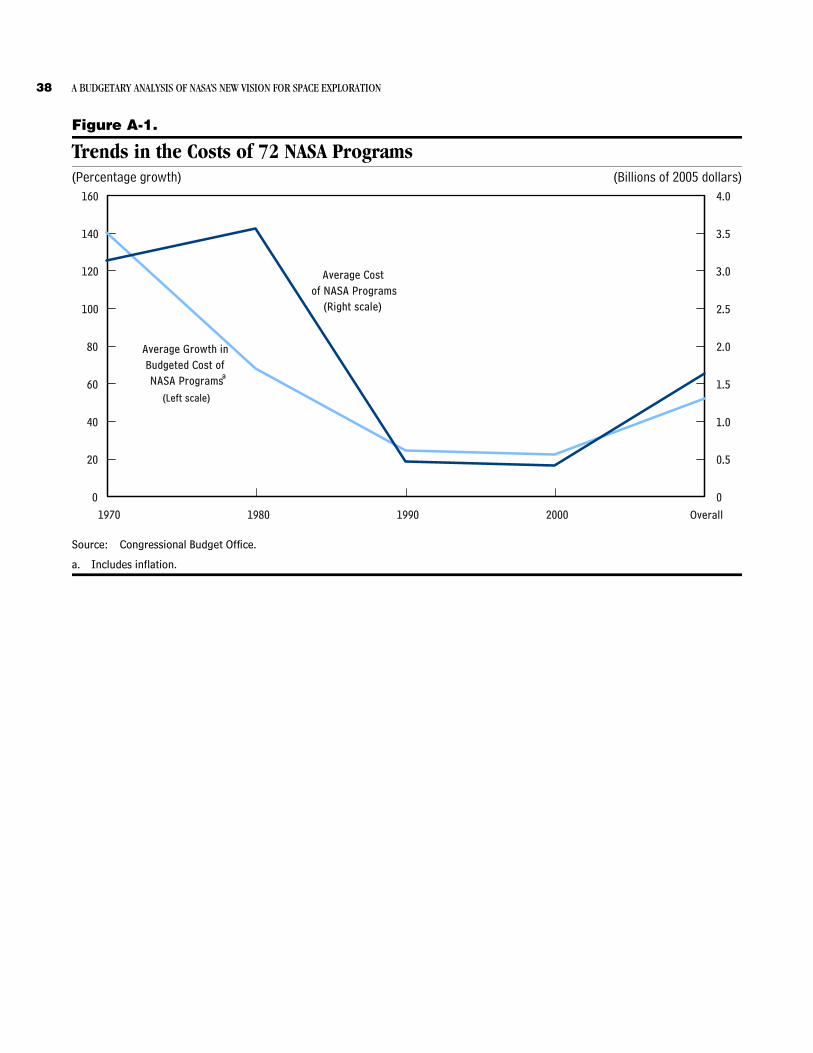
38 A BUDGETARY ANALYSIS OF NASA’S NEW VISION FOR SPACE EXPLORATION
Figure A-1.
Trends in the Costs of 72 NASA Programs(Percentage growth) (Billions of 2005 dollars)
Source: Congressional Budget Office.
a. Includes inflation.
1970 1980 1990 2000 Overall
0
20
40
60
80
100
120
140
160
0.0
0.5
1.0
1.5
2.0
2.5
3.0
3.5
4.0
Average Growth inBudgeted Cost ofNASA Programs
(Left scale)
Average Costof NASA Programs
(Right scale)
a

2004 2005 2006 2007 2008 2009 2010 2011 2012 2013 2014 2015 2016 2017 2018 2019 2020
EXPLORATION, SCIENCE, AND AERONAUTICS 7,982.0 7,760.0 7,715.4 7,989.4 8,369.4 8,379.0 8,379.1 8,379.1 8,379.1 8,379.1 8,379.1 8,379.1 8,379.1 8,379.1 8,379.1 8,379.1 8,379.1
SPACE SCIENCE 4,048.2 4,138.3 4,317.5 4,711.1 5,191.2 5,125.4 5,125.4 5,125.4 5,125.4 5,125.4 5,125.4 5,125.4 5,125.4 5,125.4 5,125.4 5,125.4 5,125.4
SOLAR SYSTEM EXPLORATION (SSE) 1,948.1 1,947.9 2,020.6 2,424.3 2,778.5 2,881.5 2,881.5 2,881.5 2,881.5 2,881.5 2,881.5 2,881.5 2,881.5 2,881.5 2,881.5 2,881.5 2,881.5
ASTRONOMICAL SEARCH FOR ORIGINS (ASO) 916.2 1,066.8 1,173.0 1,163.4 1,111.9 854.3 854.3 854.3 854.3 854.3 854.3 854.3 854.3 854.3 854.3 854.3 854.3
STRUCTURE & EVOLUTION OF THE UNIVERSE 413.9 377.7 357.8 367.2 399.9 420.8 420.8 420.8 420.8 420.8 420.8 420.8 420.8 420.8 420.8 420.8 420.8
SUN-EARTH CONNECTION (SEC) 770.0 745.9 766.1 756.2 900.8 968.7 968.7 968.7 968.7 968.7 968.7 968.7 968.7 968.7 968.7 968.7 968.7
EARTH SCIENCE 1,644.5 1,485.4 1,362.4 1,313.3 1,263.3 1,358.4 1,358.4 1,358.4 1,358.4 1,358.4 1,358.4 1,358.4 1,358.4 1,358.4 1,358.4 1,358.4 1,358.4
EARTH SYSTEM SCIENCE 1,551.9 1,408.5 1,286.9 1,239.0 1,190.7 1,287.3 1,287.3 1,287.3 1,287.3 1,287.3 1,287.3 1,287.3 1,287.3 1,287.3 1,287.3 1,287.3 1,287.3
EARTH SCIENCE APPLICATIONS 92.6 76.9 75.5 74.3 72.6 71.2 71.2 71.2 71.2 71.2 71.2 71.2 71.2 71.2 71.2 71.2 71.2
BIOLOGICAL AND PHYSICAL ENTERPRISE 1,004.3 1,048.6 931.4 900.7 884.9 870.1 870.1 870.1 870.1 870.1 870.1 870.1 870.1 870.1 870.1 870.1 870.1
BIOLOGICAL SCIENCES RESEARCH 375.1 491.5 488.7 476.2 469.8 462.9 462.9 462.9 462.9 462.9 462.9 462.9 462.9 462.9 462.9 462.9 462.9
PHYSICAL SCIENCES RESEARCH 364.1 300.1 215.7 201.4 197.5 193.7 193.7 193.7 193.7 193.7 193.7 193.7 193.7 193.7 193.7 193.7 193.7
RESEARCH PARTNERSHIPS & FLIGHT SUPT 265.0 257.0 227.0 223.2 217.6 213.6 213.6 213.6 213.6 213.6 213.6 213.6 213.6 213.6 213.6 213.6 213.6
AERONAUTICS 1,054.4 919.2 938.0 900.5 870.5 868.2 868.2 868.2 868.2 868.2 868.2 868.2 868.2 868.2 868.2 868.2 868.2
EDUCATION ENTERPRISE 230.7 168.5 166.1 163.8 159.5 157.0 157.0 157.0 157.0 157.0 157.0 157.0 157.0 157.0 157.0 157.0 157.0
EXPLORATION CAPABILITIES 7,666.5 8,517.1 8,937.1 9,088.4 8,542.6 8,212.1 7,800.6 8,168.6 8,159.2 8,632.4 8,565.2 9,034.4 9,097.9 9,032.4 8,772.5 8,564.5 8,876.4
EXPLORATION SYSTEMS 1,677.7 1,843.1 2,540.0 2,824.4 2,654.8 3,052.0 3,415.9 5,235.4 5,703.3 6,191.9 6,139.9 6,950.9 7,262.8 8,614.5 8,354.6 8,146.6 8,458.5
HUMAN AND ROBOTIC TECHNOLOGY 692.5 1,093.7 1,292.3 1,264.9 1,303.3 1,336.4 1,336.4 1,336.4 1,336.4 1,336.4 1,336.4 1,336.4 1,336.4 1,336.4 1,336.4 1,336.4 1,336.4
TRANSPORTATION SYSTEMS 985.2 749.4 1,247.7 1,559.5 1,351.5 1,715.5 2,079.5 3,899.0 4,366.8 4,855.5 4,803.5 5,614.5 5,926.4 7,278.1 7,018.1 6,810.2 7,122.1
SPACE FLIGHT 5,548.6 6,181.9 5,970.8 5,851.6 5,459.3 4,742.2 3,966.9 2,515.3 2,038.1 2,022.6 2,007.4 1,665.6 1,417.1 0.0 0.0 0.0 0.0
SPACE STATION 1,527.1 1,862.7 1,729.3 1,709.2 1,672.5 1,949.0 1,889.3 1,965.3 2,038.1 2,022.6 2,007.4 1,665.6 1,417.1 0.0 0.0 0.0 0.0
SPACE SHUTTLE 4,021.5 4,319.2 4,241.5 4,142.4 3,786.8 2,793.2 2,077.6 550.0 0.0 0.0 0.0 0.0 0.0 0.0 0.0 0.0 0.0
SPACE & FLIGHT SUPPORT 440.2 492.1 426.3 412.4 428.5 417.9 417.9 417.9 417.9 417.9 417.9 417.9 417.9 417.9 417.9 417.9 417.9
INSPECTOR GENERAL 27.6 27.6 28.3 28.8 29.2 29.7 29.7 29.7 29.7 29.7 29.7 29.7 29.7 29.7 29.7 29.7 29.7
AGENCY TOTAL 15,676.2 16,304.7 16,680.8 17,106.6 16,941.3 16,620.8 16,209.4 16,577.4 16,568.0 17,041.2 16,974.0 17,443.2 17,506.6 17,441.2 17,181.2 16,973.3 17,285.2