pdf blosum scoring matrices - columbia university · identity in ungapped sequence alignment)...
TRANSCRIPT

BLOSUM Scoring Matrices
• BLOck SUbstitution Matrix
• Based on comparisons of Blocks of sequences derived from the Blocks database
• The Blocks database contains multiply aligned ungapped segments corresponding to themost highly conserved regions of proteins (local alignment versus global alignment)
• BLOSUM matrices are derived from blocks whose alignment corresponds to theBLOSUM-,matrix number (e.g. BLOSUM 62 is derived from Blocks containing >62%identity in ungapped sequence alignment)
• BLOSUM 62 is the default matrix for the standard protein BLAST program

BLOSUM Background
• Prosite data base: “dictionary of sites and patterns in proteins”; linked to Swiss-Protdatabase
• Goal is to identify “biologically significant” patterns in protein families (withspecial emphasis on those regions thought to be important to protein function)
• Tries to find good “discriminators” that emphasize reliable identification of knownfamily members while excluding known non-members
• Prosite patterns: signature “motifs”
• Example: Helicase proteins
• involved in unwinding and opening of DNA strands in preparation for transcription
• “Werner’s syndrome”: mutation in helicase causes affected individuals to age at aan accelerated rate
• Hundreds of helicases from different organisms have been sequenced; much ofwhat we know about how they work comes from computer-assisted analysis ofthese sequences

BLOSUM Background (continued)
• Motifs: features conserved across all sequences from a family (e.g., helicases) or acrossdifferent subsets of them
• These motifs can be used to search protein/DNA databases to discover previouslyunknown members
• “Family” typically defined by function: helicases share in common the property ofhelping to unwind DNA
By finding new helicases and asking what they have in common, we can betterunderstand their mechanics
• One helicase pattern motif:
[&H][&A]D[DE]xn[TSN]x4[QK]Gx7[&A] (“regular expression”)
where & = any aa from I L V M F Y Wx = anythingxn= any sequence of n amino acids
BLOSUM Background (continued)
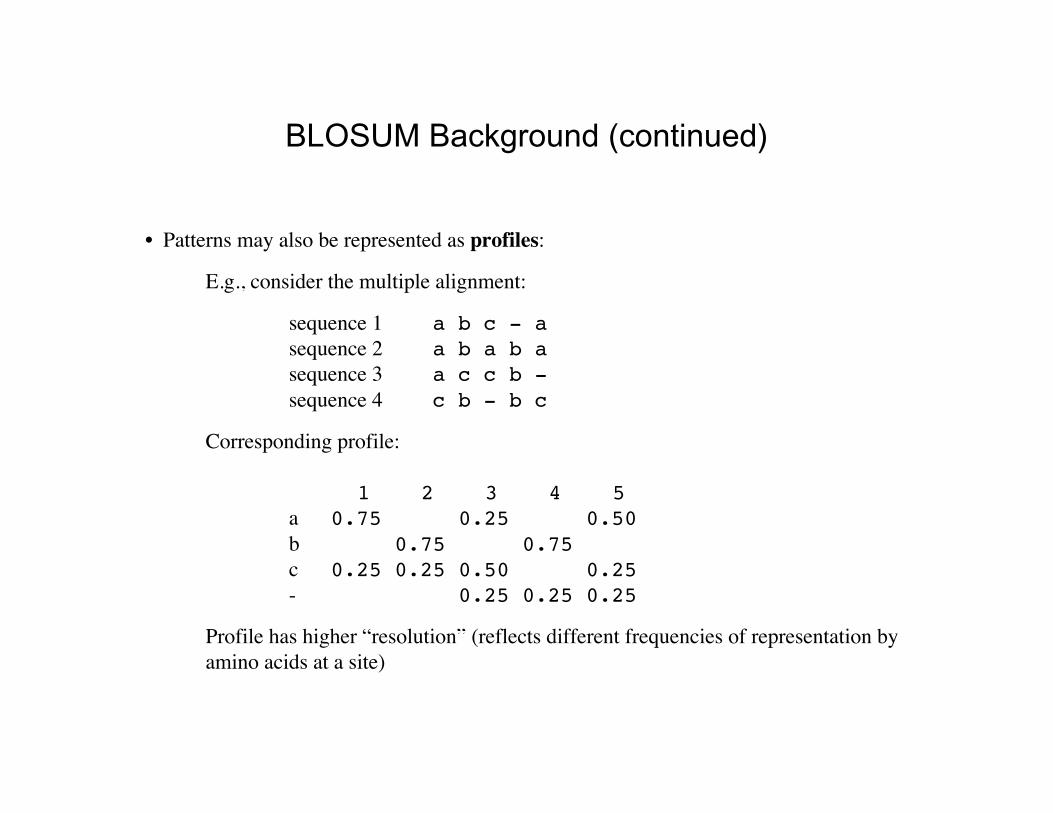
• Patterns may also be represented as profiles:
E.g., consider the multiple alignment:
sequence 1 a b c - asequence 2 a b a b asequence 3 a c c b -sequence 4 c b - b c
Corresponding profile:
1 2 3 4 5a 0.75 0.25 0.50b 0.75 0.75c 0.25 0.25 0.50 0.25
- 0.25 0.25 0.25
Profile has higher “resolution” (reflects different frequencies of representation byamino acids at a site)

AABCD---BBCDADABCD-A-BBCBBBBBCDBA-BCCAAAAACDC-DCBCDBCCBADB-DBBDCCAAACA---BBCCC
BLOSUM Background (continued)
Why blocks?• Need to have a multiple alignment; easier to align with similar sequences• Don’t want insertions and deletions to complicate estimation of substitution
probabilities• Interested in detecting conserved regions of protein sequences, so restrict attention to
these regions when computing the scoring matrix
Henikoff and Henikoff (1991) developed a database of “blocks” based on sequences withshared motifs (>2,000 blocks of aligned sequence segments from >500 groups of relatedproteins)
E.g.:

1. Count pair frequencies for each pair of amino acids i and j, for each column k of eachblock:
E.g., 1st column is AACABA
AA 4 4 4(4-1)/2 = 6AB 4 1 (4)(1) = 4AC 4 1 (4)(1) = 4BB 1 1 (1)(1-1)/2 = 0BC 1 1 (1)(1) = 1CC 1 1 (1)(1-1)/2 = 0
i.e., for “like” comparisons,
for “unlike” comparisons,
where ni = the number of times residue i was observed in the column
Just as with the PAM matrix, we will compute the BLOSUM score as the (log) ratio of theobserved probability of substitution of one amino acid by another divided by theprobability expected purely due to chance. First the numerator:
Calculating a BLOSUM Matrix
€
cii(k ) =
ni2
€
cij(k )
€
cij(k ) = nin j
€
cij(k )

AABCD---BBCDADABCD-A-BBCBBBBBCDBA-BCCAAAAACDC-DCBCDBCCBADB-DBBDCCAAACA---BBCCC
2. Sum the scores for each columns across columns:
Calculating a BLOSUM Matrix (continued)
€
cij = cij(k )
k∑
3. Normalize the pair frequencies so they will sum to 1:
€
T = ciji≥ j∑ = w n(n −1)
2
qij =cijT
where w = number of columnsn = number of sequences
For previous example, qAB calculation across columns is:
€
qAB =4 + 8 + 0 + 0 + 0 + 0 + 0
7 (6)(5)2
=12105

Now, we will calculate the denominator of the odds ratio.
4. Calculate the expected probability of occurrence of the ith residue in an (i,j) pair:
Calculating a BLOSUM Matrix (continued)
€
pi = qii +qij2j≠ i
∑
5. The desired denominator is the expected frequency for each pair (assumingindependence):
€
eii = pi2
€
eij = 2pi p j (i ≠ j)
6. Each entry for (i,j) in the log odds matrix is then equal to qij/eij
7. Log odds ratio:
€
sij = log2qijeij
8. Value stored for BLOSUM = 2 sij, rounded to nearest integer (“half bit” units)

sequence 1 A A Isequence 2 S A Lsequence 3 T A Lsequence 4 T A Vsequence 5 A A L
Example BLOSUM matrix calculation
Matrix of cij values:
€
T = cij = 3 (5)(4)2
i≥ j∑ = 30
€
A I L S T VA 1+10I 0L 3 3S 2 0T 4 2 1V 1 3 0

Example BLOSUM matrix calculation (continued)
Matrix of qij values:
€
pA = 11+62
30 =14 30 = 0.466
pI = 0 +42
30 = 2 30 = 0.066
pL = 3+62
30 = 6 30 = 0.2
pS = 0 +42
30 = 2 30 = 0.066
pT = 1+62
30 = 4 30 = 0.133
pV = 0 +42
30 = 2 30 = 0.066
€
A I L S T VA 11
30I 0L 3
303
30S 2
30 0 0T 4
302
301
30V 1
303
30 0
€
A I L S T VA 0.366 I 0 0L 0 0.1 0.1S 0.066 0 0T 0.133 0 0 0.066 0.033 V 0 0.033 0.1 0 0 0
=
Vector of pi values:

Example BLOSUM matrix calculation (continued)
Matrix of eij values:
€
A I L S T V
A 1430( )
2
I 2 1430( ) 2
30( ) 230( )
2
L 2 1430( ) 6
30( ) 2 230( ) 6
30( ) 630( )
2
S 2 1430( ) 2
30( ) 2 230( ) 2
30( ) 2 630( ) 2
30( ) 230( )
2
T 2 1430( ) 4
30( ) 2 230( ) 4
30( ) 2 630( ) 4
30( ) 2 230( ) 4
30( ) 430( )
2
V 2 1430( ) 2
30( ) 2 230( ) 2
30( ) 2 630( ) 2
30( ) 2 230( ) 2
30( ) 2 430( ) 2
30( ) 230( )
2

Example BLOSUM matrix calculation (continued)
Log odds ratio:
e.g.,
€
sAA = log20.366 14
30( )2 = log21.6837 = 0.7516
BLOSUM value for AA =
€
round(2 ⋅ 0.7516) = 2
€
A I L S T VA 2I ? ?L ? 4 3S 0 ? ? ?T 0 ? ? 4 2V ? 4 4 ? ? ?
Full matrix:
Note: undefined values result from unobserved pairs (would ordinarily not happen with real data)

Dealing with sequence redundancy
(slide from Michael Gribskov)
E.g., for BLOSUM-80, group sequences that are >80% similar

Relative entropy
Equivalent PAM and BLOSUMmatrices based on relative entropy
PAM100 ==> Blosum90PAM120 ==> Blosum80PAM160 ==> Blosum60PAM200 ==> Blosum52PAM250 ==> Blosum45
€
H = qijsiji≥ j∑
“Average information per residue pair”
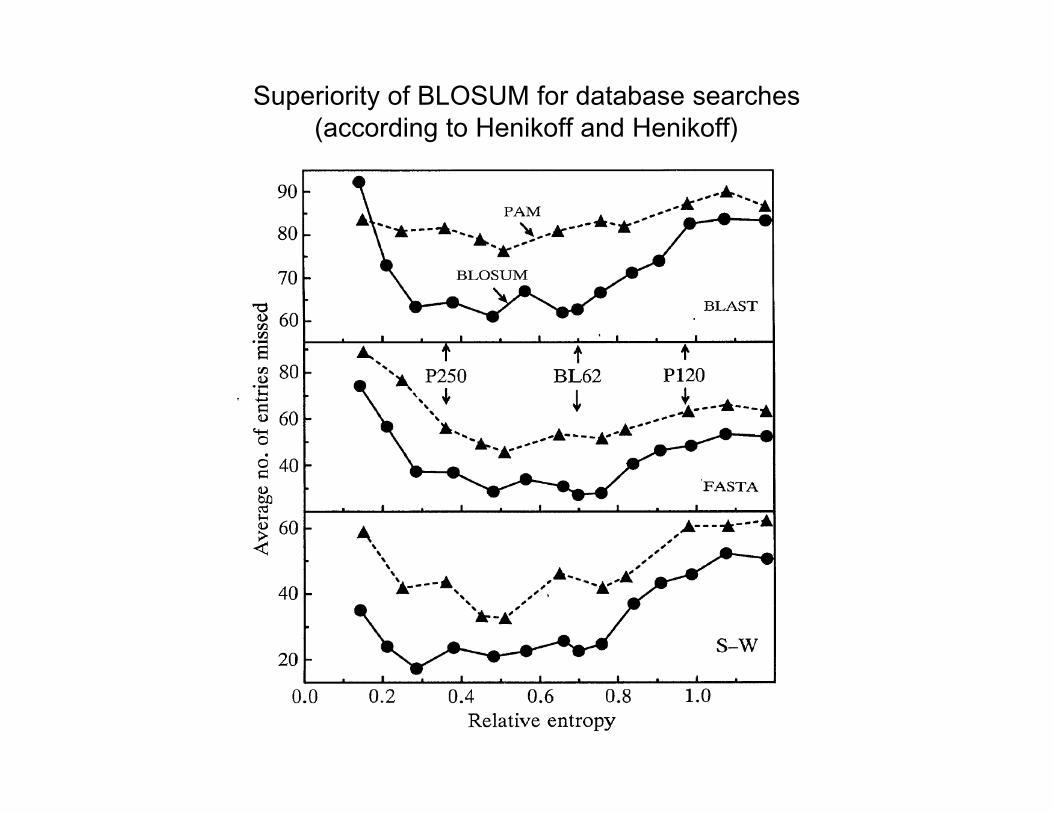
Superiority of BLOSUM for database searches(according to Henikoff and Henikoff)

PAM versus BLOSUM
PAM properties:• Based on an explicit evolutionary model• Assumes that more distant changes are reflection of
repeated short-term changes, and therefore can workover a wide range of divergences
PAM limitations:• Assumptions of model clearly violated• Each position is context dependent
• Rates of substitution vary across and within proteins• Local 3-D environments vary
• Rare changes more prone to sampling error (changes insimilar sequences occur at sites that are less constrained)

PAM versus BLOSUM
BLOSUM properties:• Not based on an explicit evolutionary model; purely
empirically derived• Based on sequence comparisons covering a broad range
of divergences
BLOSUM limitations:• Restricted to a subset of conserved domains• Implied “star-tree” model of evolution: closeness of
relationship ignored

PAM versus BLOSUM
Below diagonal: BLOSUM 62Above diagonal: BLOSUM 62 - PAM 160