pdf (638 kb) - iopscience
TRANSCRIPT

Journal of Physics Conference Series
OPEN ACCESS
Broad emission lines A tool for studying nuclei ofactive galaxiesTo cite this article Dragana Ili et al 2012 J Phys Conf Ser 397 012050
View the article online for updates and enhancements
You may also likePhysical properties of the broad line regionin active galactic nucleiDragana Ili Luka Popovi Stefano Ciroi etal
-
The Extreme Red Excess in BlazarUltraviolet Broad Emission LinesBrian Punsly Paola Marziani MarcoBerton et al
-
A broad absorption line outflow associatedwith the broad emission line region in thequasar SDSS J07513335+1345483Bo Liu Hong-Yan Zhou Xin-Wen Shu etal
-
Recent citationsVirilization of the Broad Line Region inActive Galactic Nucleimdashconnectionbetween shifts and widths of broademission linesS Joni et al
-
Supermassive black holes and spectralemission linesD Ili and L Popovi
-
This content was downloaded from IP address 81198135198 on 26122021 at 0109
Broad emission lines A tool for studying nuclei of
active galaxies
Dragana Ilic
1
Luka
ˇ
C Popovic
2
Alla I Shapovalova
3
Alexander N
Burenkov
3
Wolfram Kollatschny
4
Andjelka Kovacevic
1
Vahram
Chavushyan
5
Giovanni La Mura
6
and Piero Rafanelli
6
1 Department of Astronomy Faculty of Mathematics University of Belgrade Serbia2 Astronomical Observatory Volgina 7 11060 Belgrade Serbia3 Special Astrophysical Observatory of the Russian AS Nizhnij Arkhyz Karachaevo-Cherkesia 369167 Russia4 Institut fuer Astrophysik Georg-August-Universitaet Goettingen Germany5 Instituto Nacional de Astrofisica Optica y Electronica Apartado Postal 51-216 72000Puebla Mexico6 Dipartimento di Fisica e Astronomia Universita di Padova Vicolo dellrsquoOsservatorio I-35122Padova Italy
E-mail dilicmatfbgacrs
Abstract Active galactic nuclei (AGNs) are objects hosting in their center a super-massiveblack hole (SMBH) with an accretion disk surrounded by gas and dust The mass of an SMBHcan be derived from the dynamics of the gas gravitationally bounded to the SMBH This isthe case for the broad line region (BLR) ie a photoionized gas in the vicinity of an SMBHthat emits broad emission lines (BELs) which properties can be used to estimate the mass ofthe SMBH In spite of a number of papers devoted to the BLR research its true nature is notwell known Therefore it is still important to investigate the BLR structure (size geometryphysics etc) where one of the aims is to better constrain the mass of the SMBH in the centerof AGNs The BELs are the only signatures of the BLR physics and geometry They can beclearly identified in AGN spectra and they often show complex profiles Their fluxes profilesand ratios can provide much information about the BLR geometry and physics Moreover theBELs and continuum flux are very often varying in AGNs Therefore an investigation of theBEL flux and profile variability during a long period is another useful tool for mapping thegeometrical and dynamical structure of the BLR In this review we present and discuss sometools and techniques for studying the structure of the BLR using broad emission line properties
1 Introduction
One of the important problem of active galactic nucleus (AGN) investigations is the mostaccurate estimation of the mass of the super-massive black hole (SMBH) in the center of anAGN A direct determination of an SMBH mass is possible from dynamical methods (virialtheorem) based on observations of the kinematics of stars orbiting around the SMBH In thecase of an AGN the SMBH mass can be derived from the dynamics of the gas gravitationallybounded to the SMBH The intensive broad emission lines (BELs) visible in the spectrumof Seyfert 1 galaxies and quasars (commonly called type 1 AGN) originate relatively closeto the central power source ie in the broad line region (BLR) The BLR is in the strong
XXI International Conference on Spectral Line Shapes (ICSLS 2012) IOP PublishingJournal of Physics Conference Series 397 (2012) 012050 doi1010881742-65963971012050
Published under licence by IOP Publishing Ltd 1
interaction with the radiation field produced by the central engine and is under the influenceof the gravitational field of the SMBH thus can be used to determine the SMBH mass usingthe virial theorem (see eg Gaskell 1988) Therefore investigations of the BLR structure (sizegeometry physics etc) are very important and for this the analysis of the BELs properties(flux profiles widths etc) is needed
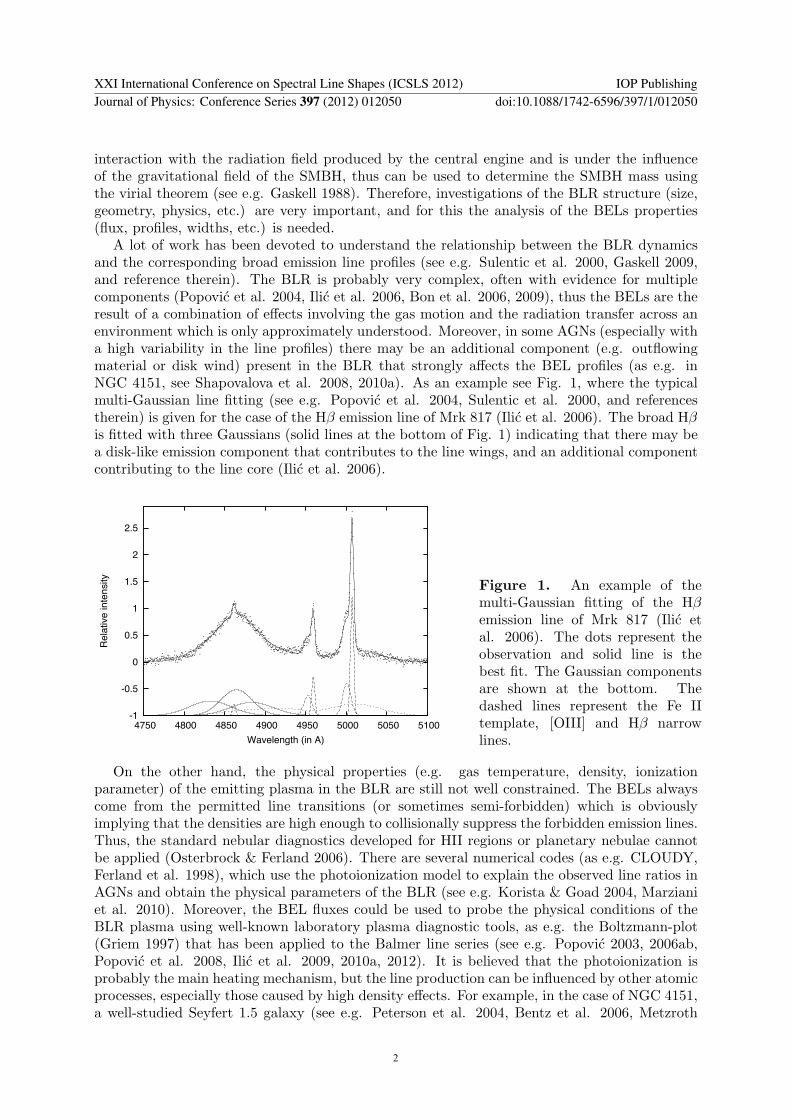
A lot of work has been devoted to understand the relationship between the BLR dynamicsand the corresponding broad emission line profiles (see eg Sulentic et al 2000 Gaskell 2009and reference therein) The BLR is probably very complex often with evidence for multiplecomponents (Popovic et al 2004 Ilic et al 2006 Bon et al 2006 2009) thus the BELs are theresult of a combination of eAEligects involving the gas motion and the radiation transfer across anenvironment which is only approximately understood Moreover in some AGNs (especially witha high variability in the line profiles) there may be an additional component (eg outflowingmaterial or disk wind) present in the BLR that strongly aAEligects the BEL profiles (as eg inNGC 4151 see Shapovalova et al 2008 2010a) As an example see Fig 1 where the typicalmulti-Gaussian line fitting (see eg Popovic et al 2004 Sulentic et al 2000 and referencestherein) is given for the case of the HOslash emission line of Mrk 817 (Ilic et al 2006) The broad HOslashis fitted with three Gaussians (solid lines at the bottom of Fig 1) indicating that there may bea disk-like emission component that contributes to the line wings and an additional componentcontributing to the line core (Ilic et al 2006)
-1
-05
0
05
1
15
2
25
4750 4800 4850 4900 4950 5000 5050 5100
Rel
ativ
e in
tens
ity
Wavelength (in A)
Figure 1 An example of themulti-Gaussian fitting of the HOslashemission line of Mrk 817 (Ilic etal 2006) The dots represent theobservation and solid line is thebest fit The Gaussian componentsare shown at the bottom Thedashed lines represent the Fe IItemplate [OIII] and HOslash narrowlines
On the other hand the physical properties (eg gas temperature density ionizationparameter) of the emitting plasma in the BLR are still not well constrained The BELs alwayscome from the permitted line transitions (or sometimes semi-forbidden) which is obviouslyimplying that the densities are high enough to collisionally suppress the forbidden emission linesThus the standard nebular diagnostics developed for HII regions or planetary nebulae cannotbe applied (Osterbrock amp Ferland 2006) There are several numerical codes (as eg CLOUDYFerland et al 1998) which use the photoionization model to explain the observed line ratios inAGNs and obtain the physical parameters of the BLR (see eg Korista amp Goad 2004 Marzianiet al 2010) Moreover the BEL fluxes could be used to probe the physical conditions of theBLR plasma using well-known laboratory plasma diagnostic tools as eg the Boltzmann-plot(Griem 1997) that has been applied to the Balmer line series (see eg Popovic 2003 2006abPopovic et al 2008 Ilic et al 2009 2010a 2012) It is believed that the photoionization isprobably the main heating mechanism but the line production can be influenced by other atomicprocesses especially those caused by high density eAEligects For example in the case of NGC 4151a well-studied Seyfert 15 galaxy (see eg Peterson et al 2004 Bentz et al 2006 Metzroth
XXI International Conference on Spectral Line Shapes (ICSLS 2012) IOP PublishingJournal of Physics Conference Series 397 (2012) 012050 doi1010881742-65963971012050
2
et al 2006 Shapovalova et al 2008 etc) during one observed period the line fluxes are notcorrelating with the continuum flux and are saturating at higher continuum fluxes indicatinga presence of a non-radiatevly heated region in the BLR or more ionizing to optical flux ratiothan expected for a typical AGN (Shapovalova et al 2008)
Moreover the BELs of AGNs often exhibit variability which is assumed to be caused byvariation in the ionizing continuum strength and by dynamic evolution of the BLR gas on longtimescales A long-term optical spectral monitoring of the nucleus of some AGNs has revealeda time lag in the response of the broad emission lines relative to flux changes in the continuum(see eg Wanders and Peterson 1996 Kollatschny amp Dietrich 1997 Peterson 2008) that isused as a tool for determination of the size of the BLR Nowadays this method is called thereverberation mapping technique (Blandford amp McKee 1982) and has motivated and initiatednumerous monitoring campaigns (see eg the international ldquoAGN Watchrdquo campaign Peterson1999)
In this paper we will present some methods to study the physics and kinematics of the BLRusing the emission lines and their properties (fluxes profiles variability) especially we willpresent some results based on our long-term optical spectral monitoring campaign of a sampleof type 1 AGN (Shapovalova et al 2004 2009 2010b 2012)
2 Line fluxes Plasma diagnostics of the BLR
The physical properties of the BLR are diplusmncult to estimate directly from the BELs that arebasically the only signature of the BLR The plasma conditions in the BLR are more closerto the conditions in stellar atmospheres than in gaseous nebulae (Osterbrock amp Ferland 2006)that we deduce from the presence or absence of some emission lines The temperatures oughtto be less than 35 000 K since at higher temperatures the observed Fe II (that is sometimeseven remarkably strong) would be eAEligectively suppressed by the collisional ionization to Fe IIIOn the other hand the electron density should be in the range 108cmdeg3 lt n
e
lt 1014cmdeg3 inorder to suppress the emission of broad forbidden lines while still allowing for the presence ofpermitted and semi-forbidden ones
There are couple of methods how to determine the BLR physical properties using onlyobservations of the BELs (Laor 2006 Marziani et al 2001 Popovic 2003 2006) Marzianiet al (2001) found using the CLOUDY photoionization computation that the ratio betweenUV emission lines Si III] prod1892 and C III] prod1909 is a good density diagnostic in the densityrange 95 lt log n
e
lt 12 Also Laor (2006) considered electron scattering influence on the lineshapes and determined the physical parameters (the electron density and optical depth) of theBLR by fitting the emission lines that have exponential wings in the case of the low luminosityAGN NGC 4395 However the problem of these direct methods for BLR diagnostics is thatthey are observationally constrained for either needing the UV observations or detecting BELswith strong exponential line wings
Popovic (2003 2006) suggested that the Boltzmann-plot (BP) method already well known tolaboratory diagnostics of a high density plasma (Griem 1997) might be exploited to probe theBLR of some AGNs (see also Ilic et al 2006 La Mura et al 2007 Popovic et al 2008) The BPmethod uses the fluxes from one line transition series (as eg hydrogen Balmer line series) andthe atomic parameters of the corresponding line series to estimate the excitation temperatureof the BLR plasma from the slope A of the line fluxes (normalized to the corresponding lineatomic parameters) versus the energy of the upper level (Griem 1997 Popovic 2003 2006)A = log
10
(e)kTexc
ordm 5040Texc
For example in case of NGC 5548 the BLR temperature wasestimated using the BP applied to the Balmer lines observed from 1996 to 2004 (Popovic et al2008) and a high correlation between the variation of the optical AGN continuum and the BPtemperature is found The advantage of the BP method compared to the other BLR plasmadiagnostics methods that use BELs is that it requires only the measured Balmer line fluxes
XXI International Conference on Spectral Line Shapes (ICSLS 2012) IOP PublishingJournal of Physics Conference Series 397 (2012) 012050 doi1010881742-65963971012050
3
to estimate the excitation temperature But one has to consider some possible drawbacksconcerning the use of complex BELs to infer the BLR physical properties which in generalappear in all methods (see Ilic et al 2006 for discussion)
Recently Ilic et al (2012) investigated for what physical conditions the BP can be applied tothe BLR plasma diagnostics using the hydrogen Balmer line series obtained in three diAEligerentways with the CLOUDY spectral synthesis code (Ferland et al 1998) from the recombinationtheory (Storey amp Hummer 1995) and from the Sloan Digital Sky Survey (SDSS) database (LaMura et al 2007) It was shown that the plasma temperatures can be estimated using the BPapplied on the hydrogen Balmer line series in the case of a high density BLR ie the electrondensity is n
e
ordf 1014cmdeg3 (Ilic et al 2012) Moreover for these cases the electron temperaturecan be estimated from the BP excitation temperature Fig 2 presents the BP temperature asa function of the electron temperature for cases when the BP fitting error is less than 10Clearly there is a relation between these two temperatures especially for the electron densityof 1014cmdeg3 (open circles in Fig 2)
10000
20000
30000
40000
50000
5000 10000 15000 20000 25000 30000
T BP
[K]
Te [K]
TBP=3133+106Te
ne=1014
ne=1013-14
nelt1013
g(x)
Figure 2 BP temperature plottedagainst the electron temperaturefor the case when the BP fitting-error is sum 10 Open circles are forthe electron density of 1014cmdeg3open squares for 1013 sum n
e
lt1014cmdeg3 and full circles for n
e
lt1013cmdeg3 The linear best-fittingof the cases with n
e
= 1014cmdeg3
is given with the dashed line Thesolid line marks the T
BP
= 30000 K(Ilic et al 2012)
3 Line profiles BLR geometry
The analysis of the BEL profiles (widths shapes asymmetries and bumps) is a powerful toolto study the kinematics and geometry of the BLR (see eg Sulentic et al 2000 Popovic et al2004 Gaskell 2009) As noticed in the Introduction the BEL profiles are usually very complexshowing a non-Gaussian shape with some characteristic features (eg asymmetries or bumps)implying that the BLR is most likely a complex region that cannot be explained in terms of asimple single-region model So far there are numerous geometrical models proposed to explainthe kinematics and geometry of the BLR (eg biconical ejection disk wind combination ofthe disk-like and spherical component etc) and we still have no self-consistent model thatwould explain the kinematics of the BLR in all AGNs (Peterson 2006) For example there areindications that the BLR kinematics may be related to outflows and jets originating from a closevicinity of the supermassive black hole and accretion disk (eg Arshakian et al 2010) Thusone of the proposed models assumes that the BELs originate in an accelerating outflow aAEligectedby the gravitational field of the SMBH and this model has been tested for several AGNs asNGC 4151 or Mrk 668 (see Ilic et al 2008 2010b)
On the other hand the Keplerian accretion disk model of the BLR has been often proposedto explain the BEL double-peaked profiles (see eg Chen et al 1989 Chen amp Halpern 1989
XXI International Conference on Spectral Line Shapes (ICSLS 2012) IOP PublishingJournal of Physics Conference Series 397 (2012) 012050 doi1010881742-65963971012050
4
Eracleous amp Halpern 1994 2003 Popovic 2006b Popovic et al 2002 2004 Kollatschny ampBischoAElig 2002 Bon et al 2006 2009 etc) The fraction of AGNs that clearly shows double-peaked profiles and thus the evidence of the disk-like geometry is small and statisticallyinsignificant (eg Strateva et al 2003) But the presence of double-peaked lines is not requiredas a necessary condition for the existence of a disk-like geometry in the BLR In the case ofsingle-peaked lines it could be that either the parameters of the disk (eg the inclination) aresuch that one observes single-peaked lines (eg Popovic et al 2004 Ilic et al 2006) or theemission of the disk is masked by the emission of another emission line region (see eg Popovic etal 2002 2004 Bon et al 2006 2009 Ilic et al 2006 and references therein) The last proposedcase is the so-called two-component model (see Popovic 2006b for a review) One possibility ofthe two-component model is to have a disk region where the line-wings are originating and anadditional spherical component which is producing the line core and whose kinematics can bedescribed with an isotropic velocity distribution (Popovic et al 2004 Bon et al 2009) Anotherimportant model is a disk-like region with the disk wind that can also produce single-peakedBELs observed in most of AGNs (see eg Murray amp Chang 1997 Flohic et al 2012 andreferences therein)
Finally one should consider BEL profile fittings with cautions as the same line profile can bemodeled with more than one model For an example in Fig 3 we present the BEL profiles ofAGN Mrk 817 fitted with two diAEligerent models (Ilic et al 2006) The BLR of Mrk 817 mightbe composed from either disc-like+spherical regions (left panel Fig 3) or from two sphericalregions having diAEligerent velocity distributions (right panel Fig 3)
-1
-05
0
05
1
-002 -001 0 001 002
Rel
ativ
e in
tens
ity
Velocity [in c]
-1
-05
0
05
1
-002 -001 0 001 002
Rel
ativ
e in
tens
ity
Velocity [in c]
Figure 3 The averaged broad profile of the HAElig and HOslash emission lines of Mrk 817 fitted withthe two-component model disk plus additional component (left) The broad profile of the HOslashemission line fitted with only two Gaussian components (right) For details about the modelssee Ilic et al (2006)
4 Line variability Long-term optical monitoring campaign
The long-term optical monitoring campaign consisted from coordinated internationalobservations of a sample of type 1 AGN constantly carried out at four telescopes of Russiaand Mexico during the period 1996ndash2012 The main aim of the campaign is to monitor thevariability of BELs in the optical domain (spectral ranges near HAElig and HOslash) and continuumand investigate the structure (physics and kinematics) of the BLR in type 1 AGN
The used instruments are the 6-m and 1-m telescopes of SAO RAS the 21-m telescope ofINAOE (Cananea Mexico) and the 21 m telescope of OAN-SPM (Baja California Mexico)
XXI International Conference on Spectral Line Shapes (ICSLS 2012) IOP PublishingJournal of Physics Conference Series 397 (2012) 012050 doi1010881742-65963971012050
5
High quality spectra (SN gt 50) around HAElig and HOslash wavelength region (spectral range 4000-8000A the resolution 3-15A) were obtained with long-slit spectrographs equipped with a CCDFor details on data acquisitions data reduction and calibration see Sahpovalova at al (20082010b) The sample of observed AGNs contains well-known and studied objects NGC 5548NGC 4151 3C3903 Ark 564 and Arp 102B So far the results of this campaign have beenpresented and published in a number of papers (for more details see eg Shapovalova et al2001 2004 2008 2009 2010ab 2011 2012 Popovic et al 2008 2011 Ilic 2007 Jovanovic etal 2010) Here we present in more details results obtained for 3C3903 and Ark 564
41 The case of 3C3903
One of the monitored AGN is a radio-galaxy 3C3903 showing double-peaked broad emissionlines The observations of 3C 3903 were performed from 1995 to 2007 The results of theseinvestigations were published in Shapovalova et al (2001 2010b) Popovic et al 2011 andJovanovic et al (2010) The double-peaked HAElig and HOslash lines clearly indicate a disk-likegeometry of the BLR But the variations in line profiles show that there is an additional emissioncomponent contributing to the line core that is originating in the region diAEligerent then the disk(see the mean and rms HAElig spectra in Fig 4 and for more details see Fig 12 in Shapovalovaet al 2010b) This additional component could be also explained as an extra emission comingfrom the perturbation in an accretion disk (Jovanovic et al 2010)
0
500
1000
1500
2000
-15000 -10000 -5000 0 5000 10000 15000
Rel
ativ
e in
tens
ity
Velocity [km s-1]
Hα totalmean
rms
Figure 4 Mean and rms spectraof the HAElig line of 3C3903 fromthe whole monitoring period (1995ndash2007) (Shapovalova et al 2010b)
Fig 5 gives the light curves of the continuum flux (top) and the flux of the broad componentof the HOslash line (bottom) Both light curves have similar behavior but the cross-correlationanalysis gives that the HOslash flux is delayed for ordf 95 days (Shapovalova et al 2010b) We canbasically divide the monitoring period into two period I - until 2002 and period II - after 2002when there is a clear outburst seen in both light curves (red vertical line in Fig 5)
One of the interesting results comes from the analysis of the line emission profiles fromdiAEligerent epochs ie the line fluxes of diAEligerent line segments Line profiles were divided alongthe velocity scale into nine line segments (see Table 2 in Popovic et al 2011) where eg linesegments -4 and -3 represent together the blue wing flux and line segments 4 and 3 the redwing We focus on the analysis of the line wings since for them the emission of the accretiondisk is contributing the most (Fig 6) Using the disk model for the line profiles we have shownthat the change in the line profile wings in the period I (full circles) can be explained if thelocation of the disk emitting the broad lines is shifted along the accretion disk (blue line with
XXI International Conference on Spectral Line Shapes (ICSLS 2012) IOP PublishingJournal of Physics Conference Series 397 (2012) 012050 doi1010881742-65963971012050
6
1
2
3
4
50000 51000 52000 53000 54000
F(Hβ)
broa
d
JD-2400000
1
2
3
4
5 1996 1998 2000 2002 2004 2006 2008
F cnt
(510
0A)
Figure 5 Light curves of thecontinuum (top) and broad HOslash(bottom) The continuum flux isin 10deg15erg cmdeg2 sdeg1 Adeg1 and lineflux in 10deg13erg cmdeg2 sdeg1 The redline divides the monitoring periodinto two periods (Shapovalova et al2010b)
open circles) from Rinn
= 250Rg
to Rinn
= 550Rg
(Fig 6) In period II (open squares) theposition of the emitting part of the disk is fixed (see for more details Popovic et al 2011)
0
05
1
15
2
25
05 1 15 2 25
Flux
of (
-4) +
(-3)
Fl
ux o
f (0)
Flux of (4) + (3) Flux of (0)
Hβ I periodHβ II period
Hβ 2001-2002Hβ model
Hβ model blueshifted -300kmsHβ model blueshifted -850kms
Figure 6 The blue-wing flux(two blue line segments -4 and-3) vs the red-wing (two redline segments +4 and +3) bothnormalized to the central linesegment flux Observations inperiod I are denoted with fullcircles in period II with opensquares while observations from2001ndash2002 are also marked withopen triangles The notation ofeach curve is given in the upperright corner (Popovic et al 2011)
42 The case of Ark 564
In the following section we will present in more details the latest research and results obtainedfor the narrow-line Seyfert 1 galaxy Ark 564 The observations of this AGN were performedfrom 1999 to 2010 (for details see Shapovalova et al 2012) One of the reasons why narrow-lineSeyfert 1 (NLS1) galaxies are interesting is the prominent emission of Fe II in the optical bandaround the HOslash line (Fig 7) that is clearly visible due to the relatively small width of theemission lines in this type of AGNs From the multi-Gaussian fitting of the wavelength range of4000ndash5600 A and the analysis of the Gaussian line widths and shifts we have shown that the
XXI International Conference on Spectral Line Shapes (ICSLS 2012) IOP PublishingJournal of Physics Conference Series 397 (2012) 012050 doi1010881742-65963971012050
7
optical Fe II lines of this AGN are coming from the intermediate line region (Shapovalova et al2012) as suggested before (see Kovacevic et al 2010 and references therein)
0
200
400
600
800
1000
1200
1400
1600
1800
2000
4000 4200 4400 4600 4800 5000 5200 5400 5600
Flux
Wavelength [A]
He II 4686
Hγ 4340
[OIII] 4363Hδ 4101
Fe II 2728
Fe II 3738
Fe II 42 Fe II 4849
Nov 23 2001
Figure 7 The Fe II emissionaround the HOslash line for the NLS1galaxy Ark 564 Strong emissionlines are labeled as well as theFe II multiplets (Shapovalova et al2012)
During the monitoring period the mean continuum and lines fluxes are weakly varying asthe decrease of only ordf20-30 (see light curves in Fig 5 in Shapovalova et al 2012) from thebeginning (1999) to the end of the monitoring campaign (2010) was detected Also in the lightcurves five flare-like events (two prominent and three possible) lasting ordf1-3 days were detected
One obtained result is particularly intriguing It was observed that there is almost nocorrelation between the HAElig and HOslash line fluxes (Fig 8) Such behavior is unexpected ifphotoionization by the central continuum source would be the main mechanism responsiblefor the production of both lines The lack of correlation could indicate very complex physicalprocesses in the line forming region ie beside the photoionization some additional physicalprocesses may be present
6
7
8
9
10
11
12
13
14
16 18 2 22 24 26 28 3 32 34
F(Hα
) tot
F(Hβ)tot
r=040P0=053E-02
Figure 8 The HAElig as a function ofthe HOslash line flux The correlationcoeplusmncient and the correspondingP-value are given in the upperleft corner Data obtained withdiAEligerent telescopes are marked withdiAEligerent symbols diamonds - 6min Russia circles - 1m Zeiss inRussia triangles - 21m GHO inMexico squares - 21m SPM inMexico (Shapovalova et al 2012)
5 Conclusions
In this paper we present some methods and tools how to investigate the plasma properties of theBLR in AGNs using the broad emission line parameters (eg line fluxes ratios widths profilesvariability) Especially we present the possibilities to use the long-term optical monitoring
XXI International Conference on Spectral Line Shapes (ICSLS 2012) IOP PublishingJournal of Physics Conference Series 397 (2012) 012050 doi1010881742-65963971012050
8
campaigns of variable AGNs in constraining the physics and structure of the BLR and givesome of the findings in two special objects Here we outline our important conclusions
i) We show that the Boltzmann-plot method can be exploited for the BLR plasma diagnosticsas it gives constraints to both the temperature and density of the BLR
ii) The kinematics and geometry of the BLR is complex and most often there are contributionof more sub-regions with diAEligerent geometrymotions to the total line profile One possibility isthat the BEL profiles can be described with the two-component model where the disk-like regionemission is contributing to the line wings and an additional spherical component is producingthe line core
iii) The BLR physics is also complex and there are most likely other ionization mechanismresponsible for the line production apart from the photoionization
All of these findings should be taken into account when using the parameters of the BLR forthe estimates of the mass of the supermassive black hole in the center of an AGN and thus theinvestigations of the BLR properties are still in the top of the astrophysical research
Acknowledgments
This work was supported by the Ministry of Education and Science of the Republic of Serbiathrough the project ldquoAstrophysical Spectroscopy of Extragalactic Objectsrdquo (176001) L CP W K and D I are grateful to the Alexander von Humboldt foundation for support in theframe of program ldquoResearch Group Linkagerdquo
References
Arshakian T G Leon-Tavares J Lobanov A P et al 2010 MNRAS 401 1231Bentz M C Denney K D Cackett E M et al 2006 ApJ 651 775Blandford R D and McKee C F 1982 ApJ 255 419Bon E Popovic L C Gavrilovic N La Mura G and Mediavilla E 2009 MNRAS 400 924Bon E Popovic L C Ilic D and Mediavilla E 2006 New Astronomy Review 50 716Chen K Halpern J P and Filippenko AV 1989 ApJ 339 742Chen K and Halpern J P 1989 ApJ 344 115Eracleous M and Halpern J P 1994 ApJS 90 1Eracleous M and Halpern J P 2003 ApJ 599 886Ferland G J Korista K T Verner D A Ferguson J W Kingdon J B and Verner E M 1998 PASP 110 761Flohic H M L G Eracleous M and Bogdanovic T 2012 ApJ 753 133Gaskell C M 1988 ApJ 325 114Gaskell C M 2009 New Astronomy Review 53 140Griem H R 1997 Principles of plasma spectroscopy (Cambridge Cambridge University Press)Ilic D 2007 Ser Astron J 175 15Ilic D Kovacevic J and Popovic L C 2009 New Astronomy Review 53 149Ilic D Popovic L C Bon E Mediavilla E and Chavushyan V H 2006 MNRAS 371 1610Ilic D Popovic L C La Mura G Ciroi S and Rafanelli P 2010a Journal of Physics Conference Series 257 012034Ilic D Popovic L C La Mura G Ciroi S and Rafanelli P 2012 AampA 543 142Ilic D Popovic L C Leon-Tavares J et al 2008 Memorie della Societa Astronomica Italiana 79 1105Ilic D Popovic L C Shapovalova A I et al 2010b Memorie della Societa Astronomica Italiana Supplementi 15 166Jovanovic P Popovic L C Stalevski M and Shapovalova A I 2010 ApJ 718 168Kollatschny W and BischoAElig K 2002 AampA 386 L19Kollatschny W and Dietrich M 1997 AampA 323 5Korista K T and Goad M R 2004 ApJ 606 749Kovacevic J Popovic L C and Dimitrijevic M S 2010 ApJS 189 15La Mura G Popovic L C Ciroi S Rafanelli P and Ilic D 2007 ApJ 671 104Laor A 2006 ApJ 643 112Murray N and Chiang J 1997 ApJ 474 91Marziani P Sulentic J W Negrete C A Dultzin D Zamfir S and Bachev R 2010 MNRAS 409 1033Metzroth K G Onken C A and Peterson B M 2006 ApJ 647 901Osterbrock D E and Ferland G J 2006 Astrophysics of Gaseous Nebulae and Active Galactic Nuclei (2nd ed)
(Sausalito California University Science Books)
XXI International Conference on Spectral Line Shapes (ICSLS 2012) IOP PublishingJournal of Physics Conference Series 397 (2012) 012050 doi1010881742-65963971012050
9
Peterson M B 1999 Structure and Kinematics of Quasar Broad Line Regions (ASP Conference Series) 175 49Peterson M B 2008 New Astron Rev 52 240Peterson B M Ferrarese L Gilbert K M et al 2004 ApJ 613 682Popovic L C 2003 ApJ 599 140Popovic L C 2006a ApJ 650 1217 (an Erratum)Popovic L C 2006b SerAJ 173 1Popovic L C Mediavilla E G Bon E and Ilic D 2004 AampA 423 909Popovic L C Mediavlilla E G Kubicela A and Jovanovic P 2002 AampA 390 473Popovic L C Shapovalova A I Chavushyan V H Ilic D Burenkov A N Mercado A Ciroi S and Bochkarev N G
2008 PASJ 61 1Popovic L C Shapovalova A I Ilic D et al 2011 AampA 528 130Shapovalova A I Burenkov A N Carrasco L et al 2001 AampA 376 775Shapovalova A I Doroshenko V T Bochkarev N G et al 2004 AampA 422 925Shapovalova A I Popovic L C Collin S et al 2008 AampA 486 99SShapovalova A I Popovic L C Bochkarev N G et al 2009 New Astronomy Review 53 191Shapovalova A I Popovic L C Burenkov A N et al 2010a AampA 509 106Shapovalova A I Popovic L C Burenkov A N et al 2010b AampA 517 42Shapovalova A I Popovic L C Burenkov A N et al 2012 ApJS 202 10Shapovalova A I Popovic L C Ilic D et al 2011 Baltic Astronomy 20 476Storey P J and Hummer D G 1995 MNRAS 272 41Strateva I V Strauss M A Hao L et al 2003 ApJ 126 1720Sulentic J W Marziani P and Dultzin-Hacyan D 2000 ARAampA 38 521Wanders I and Peterson B M 1996 ApJ 466 174
XXI International Conference on Spectral Line Shapes (ICSLS 2012) IOP PublishingJournal of Physics Conference Series 397 (2012) 012050 doi1010881742-65963971012050
10
Broad emission lines A tool for studying nuclei of
active galaxies
Dragana Ilic
1
Luka
ˇ
C Popovic
2
Alla I Shapovalova
3
Alexander N
Burenkov
3
Wolfram Kollatschny
4
Andjelka Kovacevic
1
Vahram
Chavushyan
5
Giovanni La Mura
6
and Piero Rafanelli
6
1 Department of Astronomy Faculty of Mathematics University of Belgrade Serbia2 Astronomical Observatory Volgina 7 11060 Belgrade Serbia3 Special Astrophysical Observatory of the Russian AS Nizhnij Arkhyz Karachaevo-Cherkesia 369167 Russia4 Institut fuer Astrophysik Georg-August-Universitaet Goettingen Germany5 Instituto Nacional de Astrofisica Optica y Electronica Apartado Postal 51-216 72000Puebla Mexico6 Dipartimento di Fisica e Astronomia Universita di Padova Vicolo dellrsquoOsservatorio I-35122Padova Italy
E-mail dilicmatfbgacrs
Abstract Active galactic nuclei (AGNs) are objects hosting in their center a super-massiveblack hole (SMBH) with an accretion disk surrounded by gas and dust The mass of an SMBHcan be derived from the dynamics of the gas gravitationally bounded to the SMBH This isthe case for the broad line region (BLR) ie a photoionized gas in the vicinity of an SMBHthat emits broad emission lines (BELs) which properties can be used to estimate the mass ofthe SMBH In spite of a number of papers devoted to the BLR research its true nature is notwell known Therefore it is still important to investigate the BLR structure (size geometryphysics etc) where one of the aims is to better constrain the mass of the SMBH in the centerof AGNs The BELs are the only signatures of the BLR physics and geometry They can beclearly identified in AGN spectra and they often show complex profiles Their fluxes profilesand ratios can provide much information about the BLR geometry and physics Moreover theBELs and continuum flux are very often varying in AGNs Therefore an investigation of theBEL flux and profile variability during a long period is another useful tool for mapping thegeometrical and dynamical structure of the BLR In this review we present and discuss sometools and techniques for studying the structure of the BLR using broad emission line properties
1 Introduction
One of the important problem of active galactic nucleus (AGN) investigations is the mostaccurate estimation of the mass of the super-massive black hole (SMBH) in the center of anAGN A direct determination of an SMBH mass is possible from dynamical methods (virialtheorem) based on observations of the kinematics of stars orbiting around the SMBH In thecase of an AGN the SMBH mass can be derived from the dynamics of the gas gravitationallybounded to the SMBH The intensive broad emission lines (BELs) visible in the spectrumof Seyfert 1 galaxies and quasars (commonly called type 1 AGN) originate relatively closeto the central power source ie in the broad line region (BLR) The BLR is in the strong
XXI International Conference on Spectral Line Shapes (ICSLS 2012) IOP PublishingJournal of Physics Conference Series 397 (2012) 012050 doi1010881742-65963971012050
Published under licence by IOP Publishing Ltd 1
interaction with the radiation field produced by the central engine and is under the influenceof the gravitational field of the SMBH thus can be used to determine the SMBH mass usingthe virial theorem (see eg Gaskell 1988) Therefore investigations of the BLR structure (sizegeometry physics etc) are very important and for this the analysis of the BELs properties(flux profiles widths etc) is needed
A lot of work has been devoted to understand the relationship between the BLR dynamicsand the corresponding broad emission line profiles (see eg Sulentic et al 2000 Gaskell 2009and reference therein) The BLR is probably very complex often with evidence for multiplecomponents (Popovic et al 2004 Ilic et al 2006 Bon et al 2006 2009) thus the BELs are theresult of a combination of eAEligects involving the gas motion and the radiation transfer across anenvironment which is only approximately understood Moreover in some AGNs (especially witha high variability in the line profiles) there may be an additional component (eg outflowingmaterial or disk wind) present in the BLR that strongly aAEligects the BEL profiles (as eg inNGC 4151 see Shapovalova et al 2008 2010a) As an example see Fig 1 where the typicalmulti-Gaussian line fitting (see eg Popovic et al 2004 Sulentic et al 2000 and referencestherein) is given for the case of the HOslash emission line of Mrk 817 (Ilic et al 2006) The broad HOslashis fitted with three Gaussians (solid lines at the bottom of Fig 1) indicating that there may bea disk-like emission component that contributes to the line wings and an additional componentcontributing to the line core (Ilic et al 2006)
-1
-05
0
05
1
15
2
25
4750 4800 4850 4900 4950 5000 5050 5100
Rel
ativ
e in
tens
ity
Wavelength (in A)
Figure 1 An example of themulti-Gaussian fitting of the HOslashemission line of Mrk 817 (Ilic etal 2006) The dots represent theobservation and solid line is thebest fit The Gaussian componentsare shown at the bottom Thedashed lines represent the Fe IItemplate [OIII] and HOslash narrowlines
On the other hand the physical properties (eg gas temperature density ionizationparameter) of the emitting plasma in the BLR are still not well constrained The BELs alwayscome from the permitted line transitions (or sometimes semi-forbidden) which is obviouslyimplying that the densities are high enough to collisionally suppress the forbidden emission linesThus the standard nebular diagnostics developed for HII regions or planetary nebulae cannotbe applied (Osterbrock amp Ferland 2006) There are several numerical codes (as eg CLOUDYFerland et al 1998) which use the photoionization model to explain the observed line ratios inAGNs and obtain the physical parameters of the BLR (see eg Korista amp Goad 2004 Marzianiet al 2010) Moreover the BEL fluxes could be used to probe the physical conditions of theBLR plasma using well-known laboratory plasma diagnostic tools as eg the Boltzmann-plot(Griem 1997) that has been applied to the Balmer line series (see eg Popovic 2003 2006abPopovic et al 2008 Ilic et al 2009 2010a 2012) It is believed that the photoionization isprobably the main heating mechanism but the line production can be influenced by other atomicprocesses especially those caused by high density eAEligects For example in the case of NGC 4151a well-studied Seyfert 15 galaxy (see eg Peterson et al 2004 Bentz et al 2006 Metzroth
XXI International Conference on Spectral Line Shapes (ICSLS 2012) IOP PublishingJournal of Physics Conference Series 397 (2012) 012050 doi1010881742-65963971012050
2
et al 2006 Shapovalova et al 2008 etc) during one observed period the line fluxes are notcorrelating with the continuum flux and are saturating at higher continuum fluxes indicatinga presence of a non-radiatevly heated region in the BLR or more ionizing to optical flux ratiothan expected for a typical AGN (Shapovalova et al 2008)
Moreover the BELs of AGNs often exhibit variability which is assumed to be caused byvariation in the ionizing continuum strength and by dynamic evolution of the BLR gas on longtimescales A long-term optical spectral monitoring of the nucleus of some AGNs has revealeda time lag in the response of the broad emission lines relative to flux changes in the continuum(see eg Wanders and Peterson 1996 Kollatschny amp Dietrich 1997 Peterson 2008) that isused as a tool for determination of the size of the BLR Nowadays this method is called thereverberation mapping technique (Blandford amp McKee 1982) and has motivated and initiatednumerous monitoring campaigns (see eg the international ldquoAGN Watchrdquo campaign Peterson1999)
In this paper we will present some methods to study the physics and kinematics of the BLRusing the emission lines and their properties (fluxes profiles variability) especially we willpresent some results based on our long-term optical spectral monitoring campaign of a sampleof type 1 AGN (Shapovalova et al 2004 2009 2010b 2012)
2 Line fluxes Plasma diagnostics of the BLR
The physical properties of the BLR are diplusmncult to estimate directly from the BELs that arebasically the only signature of the BLR The plasma conditions in the BLR are more closerto the conditions in stellar atmospheres than in gaseous nebulae (Osterbrock amp Ferland 2006)that we deduce from the presence or absence of some emission lines The temperatures oughtto be less than 35 000 K since at higher temperatures the observed Fe II (that is sometimeseven remarkably strong) would be eAEligectively suppressed by the collisional ionization to Fe IIIOn the other hand the electron density should be in the range 108cmdeg3 lt n
e
lt 1014cmdeg3 inorder to suppress the emission of broad forbidden lines while still allowing for the presence ofpermitted and semi-forbidden ones
There are couple of methods how to determine the BLR physical properties using onlyobservations of the BELs (Laor 2006 Marziani et al 2001 Popovic 2003 2006) Marzianiet al (2001) found using the CLOUDY photoionization computation that the ratio betweenUV emission lines Si III] prod1892 and C III] prod1909 is a good density diagnostic in the densityrange 95 lt log n
e
lt 12 Also Laor (2006) considered electron scattering influence on the lineshapes and determined the physical parameters (the electron density and optical depth) of theBLR by fitting the emission lines that have exponential wings in the case of the low luminosityAGN NGC 4395 However the problem of these direct methods for BLR diagnostics is thatthey are observationally constrained for either needing the UV observations or detecting BELswith strong exponential line wings
Popovic (2003 2006) suggested that the Boltzmann-plot (BP) method already well known tolaboratory diagnostics of a high density plasma (Griem 1997) might be exploited to probe theBLR of some AGNs (see also Ilic et al 2006 La Mura et al 2007 Popovic et al 2008) The BPmethod uses the fluxes from one line transition series (as eg hydrogen Balmer line series) andthe atomic parameters of the corresponding line series to estimate the excitation temperatureof the BLR plasma from the slope A of the line fluxes (normalized to the corresponding lineatomic parameters) versus the energy of the upper level (Griem 1997 Popovic 2003 2006)A = log
10
(e)kTexc
ordm 5040Texc
For example in case of NGC 5548 the BLR temperature wasestimated using the BP applied to the Balmer lines observed from 1996 to 2004 (Popovic et al2008) and a high correlation between the variation of the optical AGN continuum and the BPtemperature is found The advantage of the BP method compared to the other BLR plasmadiagnostics methods that use BELs is that it requires only the measured Balmer line fluxes
XXI International Conference on Spectral Line Shapes (ICSLS 2012) IOP PublishingJournal of Physics Conference Series 397 (2012) 012050 doi1010881742-65963971012050
3
to estimate the excitation temperature But one has to consider some possible drawbacksconcerning the use of complex BELs to infer the BLR physical properties which in generalappear in all methods (see Ilic et al 2006 for discussion)
Recently Ilic et al (2012) investigated for what physical conditions the BP can be applied tothe BLR plasma diagnostics using the hydrogen Balmer line series obtained in three diAEligerentways with the CLOUDY spectral synthesis code (Ferland et al 1998) from the recombinationtheory (Storey amp Hummer 1995) and from the Sloan Digital Sky Survey (SDSS) database (LaMura et al 2007) It was shown that the plasma temperatures can be estimated using the BPapplied on the hydrogen Balmer line series in the case of a high density BLR ie the electrondensity is n
e
ordf 1014cmdeg3 (Ilic et al 2012) Moreover for these cases the electron temperaturecan be estimated from the BP excitation temperature Fig 2 presents the BP temperature asa function of the electron temperature for cases when the BP fitting error is less than 10Clearly there is a relation between these two temperatures especially for the electron densityof 1014cmdeg3 (open circles in Fig 2)
10000
20000
30000
40000
50000
5000 10000 15000 20000 25000 30000
T BP
[K]
Te [K]
TBP=3133+106Te
ne=1014
ne=1013-14
nelt1013
g(x)
Figure 2 BP temperature plottedagainst the electron temperaturefor the case when the BP fitting-error is sum 10 Open circles are forthe electron density of 1014cmdeg3open squares for 1013 sum n
e
lt1014cmdeg3 and full circles for n
e
lt1013cmdeg3 The linear best-fittingof the cases with n
e
= 1014cmdeg3
is given with the dashed line Thesolid line marks the T
BP
= 30000 K(Ilic et al 2012)
3 Line profiles BLR geometry
The analysis of the BEL profiles (widths shapes asymmetries and bumps) is a powerful toolto study the kinematics and geometry of the BLR (see eg Sulentic et al 2000 Popovic et al2004 Gaskell 2009) As noticed in the Introduction the BEL profiles are usually very complexshowing a non-Gaussian shape with some characteristic features (eg asymmetries or bumps)implying that the BLR is most likely a complex region that cannot be explained in terms of asimple single-region model So far there are numerous geometrical models proposed to explainthe kinematics and geometry of the BLR (eg biconical ejection disk wind combination ofthe disk-like and spherical component etc) and we still have no self-consistent model thatwould explain the kinematics of the BLR in all AGNs (Peterson 2006) For example there areindications that the BLR kinematics may be related to outflows and jets originating from a closevicinity of the supermassive black hole and accretion disk (eg Arshakian et al 2010) Thusone of the proposed models assumes that the BELs originate in an accelerating outflow aAEligectedby the gravitational field of the SMBH and this model has been tested for several AGNs asNGC 4151 or Mrk 668 (see Ilic et al 2008 2010b)
On the other hand the Keplerian accretion disk model of the BLR has been often proposedto explain the BEL double-peaked profiles (see eg Chen et al 1989 Chen amp Halpern 1989
XXI International Conference on Spectral Line Shapes (ICSLS 2012) IOP PublishingJournal of Physics Conference Series 397 (2012) 012050 doi1010881742-65963971012050
4
Eracleous amp Halpern 1994 2003 Popovic 2006b Popovic et al 2002 2004 Kollatschny ampBischoAElig 2002 Bon et al 2006 2009 etc) The fraction of AGNs that clearly shows double-peaked profiles and thus the evidence of the disk-like geometry is small and statisticallyinsignificant (eg Strateva et al 2003) But the presence of double-peaked lines is not requiredas a necessary condition for the existence of a disk-like geometry in the BLR In the case ofsingle-peaked lines it could be that either the parameters of the disk (eg the inclination) aresuch that one observes single-peaked lines (eg Popovic et al 2004 Ilic et al 2006) or theemission of the disk is masked by the emission of another emission line region (see eg Popovic etal 2002 2004 Bon et al 2006 2009 Ilic et al 2006 and references therein) The last proposedcase is the so-called two-component model (see Popovic 2006b for a review) One possibility ofthe two-component model is to have a disk region where the line-wings are originating and anadditional spherical component which is producing the line core and whose kinematics can bedescribed with an isotropic velocity distribution (Popovic et al 2004 Bon et al 2009) Anotherimportant model is a disk-like region with the disk wind that can also produce single-peakedBELs observed in most of AGNs (see eg Murray amp Chang 1997 Flohic et al 2012 andreferences therein)
Finally one should consider BEL profile fittings with cautions as the same line profile can bemodeled with more than one model For an example in Fig 3 we present the BEL profiles ofAGN Mrk 817 fitted with two diAEligerent models (Ilic et al 2006) The BLR of Mrk 817 mightbe composed from either disc-like+spherical regions (left panel Fig 3) or from two sphericalregions having diAEligerent velocity distributions (right panel Fig 3)
-1
-05
0
05
1
-002 -001 0 001 002
Rel
ativ
e in
tens
ity
Velocity [in c]
-1
-05
0
05
1
-002 -001 0 001 002
Rel
ativ
e in
tens
ity
Velocity [in c]
Figure 3 The averaged broad profile of the HAElig and HOslash emission lines of Mrk 817 fitted withthe two-component model disk plus additional component (left) The broad profile of the HOslashemission line fitted with only two Gaussian components (right) For details about the modelssee Ilic et al (2006)
4 Line variability Long-term optical monitoring campaign
The long-term optical monitoring campaign consisted from coordinated internationalobservations of a sample of type 1 AGN constantly carried out at four telescopes of Russiaand Mexico during the period 1996ndash2012 The main aim of the campaign is to monitor thevariability of BELs in the optical domain (spectral ranges near HAElig and HOslash) and continuumand investigate the structure (physics and kinematics) of the BLR in type 1 AGN
The used instruments are the 6-m and 1-m telescopes of SAO RAS the 21-m telescope ofINAOE (Cananea Mexico) and the 21 m telescope of OAN-SPM (Baja California Mexico)
XXI International Conference on Spectral Line Shapes (ICSLS 2012) IOP PublishingJournal of Physics Conference Series 397 (2012) 012050 doi1010881742-65963971012050
5
High quality spectra (SN gt 50) around HAElig and HOslash wavelength region (spectral range 4000-8000A the resolution 3-15A) were obtained with long-slit spectrographs equipped with a CCDFor details on data acquisitions data reduction and calibration see Sahpovalova at al (20082010b) The sample of observed AGNs contains well-known and studied objects NGC 5548NGC 4151 3C3903 Ark 564 and Arp 102B So far the results of this campaign have beenpresented and published in a number of papers (for more details see eg Shapovalova et al2001 2004 2008 2009 2010ab 2011 2012 Popovic et al 2008 2011 Ilic 2007 Jovanovic etal 2010) Here we present in more details results obtained for 3C3903 and Ark 564
41 The case of 3C3903
One of the monitored AGN is a radio-galaxy 3C3903 showing double-peaked broad emissionlines The observations of 3C 3903 were performed from 1995 to 2007 The results of theseinvestigations were published in Shapovalova et al (2001 2010b) Popovic et al 2011 andJovanovic et al (2010) The double-peaked HAElig and HOslash lines clearly indicate a disk-likegeometry of the BLR But the variations in line profiles show that there is an additional emissioncomponent contributing to the line core that is originating in the region diAEligerent then the disk(see the mean and rms HAElig spectra in Fig 4 and for more details see Fig 12 in Shapovalovaet al 2010b) This additional component could be also explained as an extra emission comingfrom the perturbation in an accretion disk (Jovanovic et al 2010)
0
500
1000
1500
2000
-15000 -10000 -5000 0 5000 10000 15000
Rel
ativ
e in
tens
ity
Velocity [km s-1]
Hα totalmean
rms
Figure 4 Mean and rms spectraof the HAElig line of 3C3903 fromthe whole monitoring period (1995ndash2007) (Shapovalova et al 2010b)
Fig 5 gives the light curves of the continuum flux (top) and the flux of the broad componentof the HOslash line (bottom) Both light curves have similar behavior but the cross-correlationanalysis gives that the HOslash flux is delayed for ordf 95 days (Shapovalova et al 2010b) We canbasically divide the monitoring period into two period I - until 2002 and period II - after 2002when there is a clear outburst seen in both light curves (red vertical line in Fig 5)
One of the interesting results comes from the analysis of the line emission profiles fromdiAEligerent epochs ie the line fluxes of diAEligerent line segments Line profiles were divided alongthe velocity scale into nine line segments (see Table 2 in Popovic et al 2011) where eg linesegments -4 and -3 represent together the blue wing flux and line segments 4 and 3 the redwing We focus on the analysis of the line wings since for them the emission of the accretiondisk is contributing the most (Fig 6) Using the disk model for the line profiles we have shownthat the change in the line profile wings in the period I (full circles) can be explained if thelocation of the disk emitting the broad lines is shifted along the accretion disk (blue line with
XXI International Conference on Spectral Line Shapes (ICSLS 2012) IOP PublishingJournal of Physics Conference Series 397 (2012) 012050 doi1010881742-65963971012050
6
1
2
3
4
50000 51000 52000 53000 54000
F(Hβ)
broa
d
JD-2400000
1
2
3
4
5 1996 1998 2000 2002 2004 2006 2008
F cnt
(510
0A)
Figure 5 Light curves of thecontinuum (top) and broad HOslash(bottom) The continuum flux isin 10deg15erg cmdeg2 sdeg1 Adeg1 and lineflux in 10deg13erg cmdeg2 sdeg1 The redline divides the monitoring periodinto two periods (Shapovalova et al2010b)
open circles) from Rinn
= 250Rg
to Rinn
= 550Rg
(Fig 6) In period II (open squares) theposition of the emitting part of the disk is fixed (see for more details Popovic et al 2011)
0
05
1
15
2
25
05 1 15 2 25
Flux
of (
-4) +
(-3)
Fl
ux o
f (0)
Flux of (4) + (3) Flux of (0)
Hβ I periodHβ II period
Hβ 2001-2002Hβ model
Hβ model blueshifted -300kmsHβ model blueshifted -850kms
Figure 6 The blue-wing flux(two blue line segments -4 and-3) vs the red-wing (two redline segments +4 and +3) bothnormalized to the central linesegment flux Observations inperiod I are denoted with fullcircles in period II with opensquares while observations from2001ndash2002 are also marked withopen triangles The notation ofeach curve is given in the upperright corner (Popovic et al 2011)
42 The case of Ark 564
In the following section we will present in more details the latest research and results obtainedfor the narrow-line Seyfert 1 galaxy Ark 564 The observations of this AGN were performedfrom 1999 to 2010 (for details see Shapovalova et al 2012) One of the reasons why narrow-lineSeyfert 1 (NLS1) galaxies are interesting is the prominent emission of Fe II in the optical bandaround the HOslash line (Fig 7) that is clearly visible due to the relatively small width of theemission lines in this type of AGNs From the multi-Gaussian fitting of the wavelength range of4000ndash5600 A and the analysis of the Gaussian line widths and shifts we have shown that the
XXI International Conference on Spectral Line Shapes (ICSLS 2012) IOP PublishingJournal of Physics Conference Series 397 (2012) 012050 doi1010881742-65963971012050
7
optical Fe II lines of this AGN are coming from the intermediate line region (Shapovalova et al2012) as suggested before (see Kovacevic et al 2010 and references therein)
0
200
400
600
800
1000
1200
1400
1600
1800
2000
4000 4200 4400 4600 4800 5000 5200 5400 5600
Flux
Wavelength [A]
He II 4686
Hγ 4340
[OIII] 4363Hδ 4101
Fe II 2728
Fe II 3738
Fe II 42 Fe II 4849
Nov 23 2001
Figure 7 The Fe II emissionaround the HOslash line for the NLS1galaxy Ark 564 Strong emissionlines are labeled as well as theFe II multiplets (Shapovalova et al2012)
During the monitoring period the mean continuum and lines fluxes are weakly varying asthe decrease of only ordf20-30 (see light curves in Fig 5 in Shapovalova et al 2012) from thebeginning (1999) to the end of the monitoring campaign (2010) was detected Also in the lightcurves five flare-like events (two prominent and three possible) lasting ordf1-3 days were detected
One obtained result is particularly intriguing It was observed that there is almost nocorrelation between the HAElig and HOslash line fluxes (Fig 8) Such behavior is unexpected ifphotoionization by the central continuum source would be the main mechanism responsiblefor the production of both lines The lack of correlation could indicate very complex physicalprocesses in the line forming region ie beside the photoionization some additional physicalprocesses may be present
6
7
8
9
10
11
12
13
14
16 18 2 22 24 26 28 3 32 34
F(Hα
) tot
F(Hβ)tot
r=040P0=053E-02
Figure 8 The HAElig as a function ofthe HOslash line flux The correlationcoeplusmncient and the correspondingP-value are given in the upperleft corner Data obtained withdiAEligerent telescopes are marked withdiAEligerent symbols diamonds - 6min Russia circles - 1m Zeiss inRussia triangles - 21m GHO inMexico squares - 21m SPM inMexico (Shapovalova et al 2012)
5 Conclusions
In this paper we present some methods and tools how to investigate the plasma properties of theBLR in AGNs using the broad emission line parameters (eg line fluxes ratios widths profilesvariability) Especially we present the possibilities to use the long-term optical monitoring
XXI International Conference on Spectral Line Shapes (ICSLS 2012) IOP PublishingJournal of Physics Conference Series 397 (2012) 012050 doi1010881742-65963971012050
8
campaigns of variable AGNs in constraining the physics and structure of the BLR and givesome of the findings in two special objects Here we outline our important conclusions
i) We show that the Boltzmann-plot method can be exploited for the BLR plasma diagnosticsas it gives constraints to both the temperature and density of the BLR
ii) The kinematics and geometry of the BLR is complex and most often there are contributionof more sub-regions with diAEligerent geometrymotions to the total line profile One possibility isthat the BEL profiles can be described with the two-component model where the disk-like regionemission is contributing to the line wings and an additional spherical component is producingthe line core
iii) The BLR physics is also complex and there are most likely other ionization mechanismresponsible for the line production apart from the photoionization
All of these findings should be taken into account when using the parameters of the BLR forthe estimates of the mass of the supermassive black hole in the center of an AGN and thus theinvestigations of the BLR properties are still in the top of the astrophysical research
Acknowledgments
This work was supported by the Ministry of Education and Science of the Republic of Serbiathrough the project ldquoAstrophysical Spectroscopy of Extragalactic Objectsrdquo (176001) L CP W K and D I are grateful to the Alexander von Humboldt foundation for support in theframe of program ldquoResearch Group Linkagerdquo
References
Arshakian T G Leon-Tavares J Lobanov A P et al 2010 MNRAS 401 1231Bentz M C Denney K D Cackett E M et al 2006 ApJ 651 775Blandford R D and McKee C F 1982 ApJ 255 419Bon E Popovic L C Gavrilovic N La Mura G and Mediavilla E 2009 MNRAS 400 924Bon E Popovic L C Ilic D and Mediavilla E 2006 New Astronomy Review 50 716Chen K Halpern J P and Filippenko AV 1989 ApJ 339 742Chen K and Halpern J P 1989 ApJ 344 115Eracleous M and Halpern J P 1994 ApJS 90 1Eracleous M and Halpern J P 2003 ApJ 599 886Ferland G J Korista K T Verner D A Ferguson J W Kingdon J B and Verner E M 1998 PASP 110 761Flohic H M L G Eracleous M and Bogdanovic T 2012 ApJ 753 133Gaskell C M 1988 ApJ 325 114Gaskell C M 2009 New Astronomy Review 53 140Griem H R 1997 Principles of plasma spectroscopy (Cambridge Cambridge University Press)Ilic D 2007 Ser Astron J 175 15Ilic D Kovacevic J and Popovic L C 2009 New Astronomy Review 53 149Ilic D Popovic L C Bon E Mediavilla E and Chavushyan V H 2006 MNRAS 371 1610Ilic D Popovic L C La Mura G Ciroi S and Rafanelli P 2010a Journal of Physics Conference Series 257 012034Ilic D Popovic L C La Mura G Ciroi S and Rafanelli P 2012 AampA 543 142Ilic D Popovic L C Leon-Tavares J et al 2008 Memorie della Societa Astronomica Italiana 79 1105Ilic D Popovic L C Shapovalova A I et al 2010b Memorie della Societa Astronomica Italiana Supplementi 15 166Jovanovic P Popovic L C Stalevski M and Shapovalova A I 2010 ApJ 718 168Kollatschny W and BischoAElig K 2002 AampA 386 L19Kollatschny W and Dietrich M 1997 AampA 323 5Korista K T and Goad M R 2004 ApJ 606 749Kovacevic J Popovic L C and Dimitrijevic M S 2010 ApJS 189 15La Mura G Popovic L C Ciroi S Rafanelli P and Ilic D 2007 ApJ 671 104Laor A 2006 ApJ 643 112Murray N and Chiang J 1997 ApJ 474 91Marziani P Sulentic J W Negrete C A Dultzin D Zamfir S and Bachev R 2010 MNRAS 409 1033Metzroth K G Onken C A and Peterson B M 2006 ApJ 647 901Osterbrock D E and Ferland G J 2006 Astrophysics of Gaseous Nebulae and Active Galactic Nuclei (2nd ed)
(Sausalito California University Science Books)
XXI International Conference on Spectral Line Shapes (ICSLS 2012) IOP PublishingJournal of Physics Conference Series 397 (2012) 012050 doi1010881742-65963971012050
9
Peterson M B 1999 Structure and Kinematics of Quasar Broad Line Regions (ASP Conference Series) 175 49Peterson M B 2008 New Astron Rev 52 240Peterson B M Ferrarese L Gilbert K M et al 2004 ApJ 613 682Popovic L C 2003 ApJ 599 140Popovic L C 2006a ApJ 650 1217 (an Erratum)Popovic L C 2006b SerAJ 173 1Popovic L C Mediavilla E G Bon E and Ilic D 2004 AampA 423 909Popovic L C Mediavlilla E G Kubicela A and Jovanovic P 2002 AampA 390 473Popovic L C Shapovalova A I Chavushyan V H Ilic D Burenkov A N Mercado A Ciroi S and Bochkarev N G
2008 PASJ 61 1Popovic L C Shapovalova A I Ilic D et al 2011 AampA 528 130Shapovalova A I Burenkov A N Carrasco L et al 2001 AampA 376 775Shapovalova A I Doroshenko V T Bochkarev N G et al 2004 AampA 422 925Shapovalova A I Popovic L C Collin S et al 2008 AampA 486 99SShapovalova A I Popovic L C Bochkarev N G et al 2009 New Astronomy Review 53 191Shapovalova A I Popovic L C Burenkov A N et al 2010a AampA 509 106Shapovalova A I Popovic L C Burenkov A N et al 2010b AampA 517 42Shapovalova A I Popovic L C Burenkov A N et al 2012 ApJS 202 10Shapovalova A I Popovic L C Ilic D et al 2011 Baltic Astronomy 20 476Storey P J and Hummer D G 1995 MNRAS 272 41Strateva I V Strauss M A Hao L et al 2003 ApJ 126 1720Sulentic J W Marziani P and Dultzin-Hacyan D 2000 ARAampA 38 521Wanders I and Peterson B M 1996 ApJ 466 174
XXI International Conference on Spectral Line Shapes (ICSLS 2012) IOP PublishingJournal of Physics Conference Series 397 (2012) 012050 doi1010881742-65963971012050
10
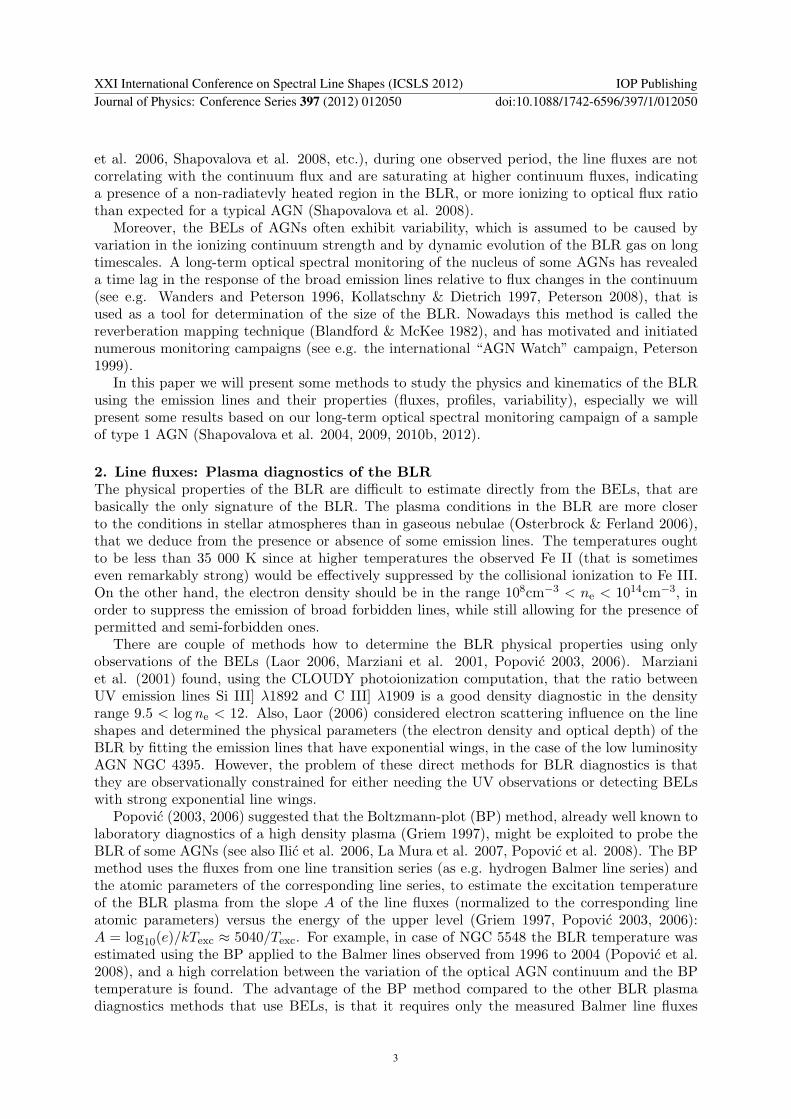
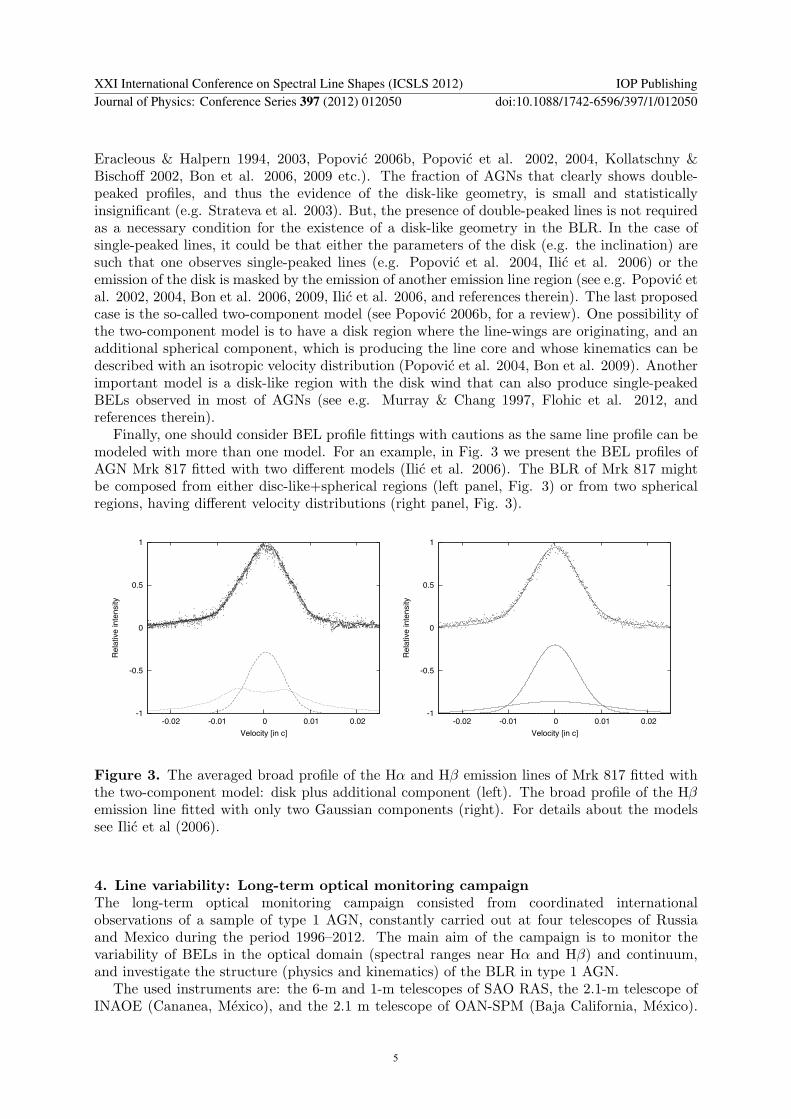
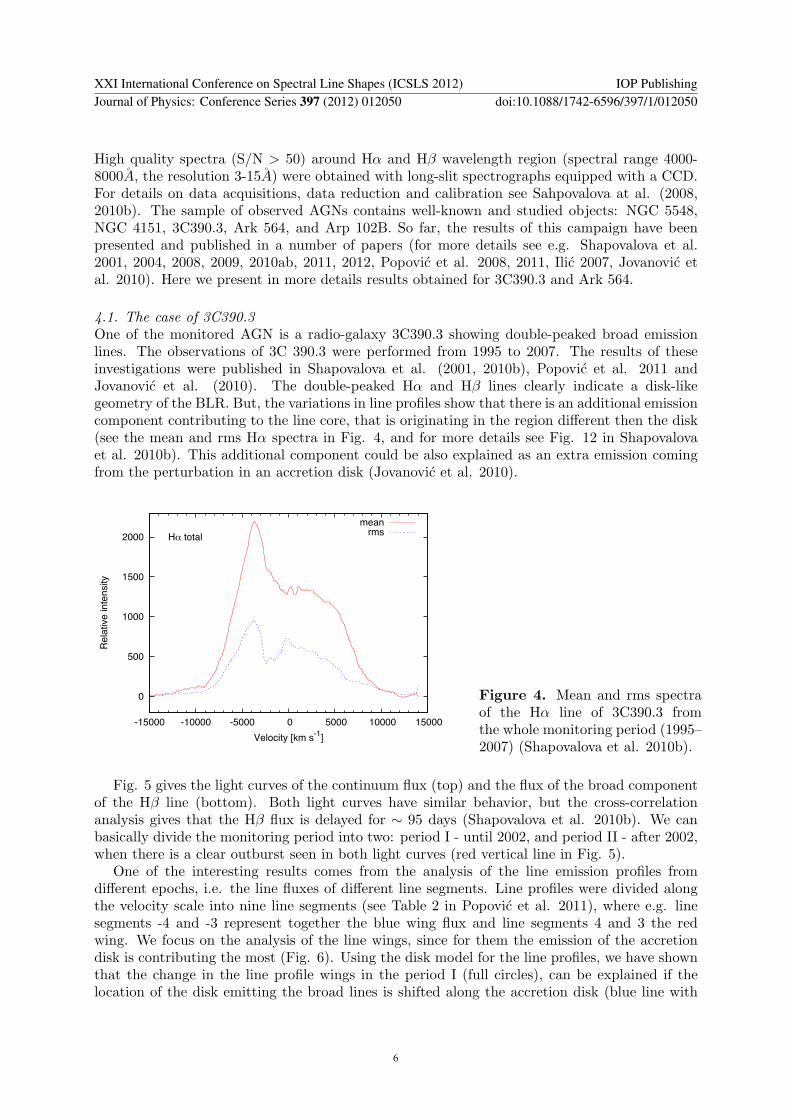
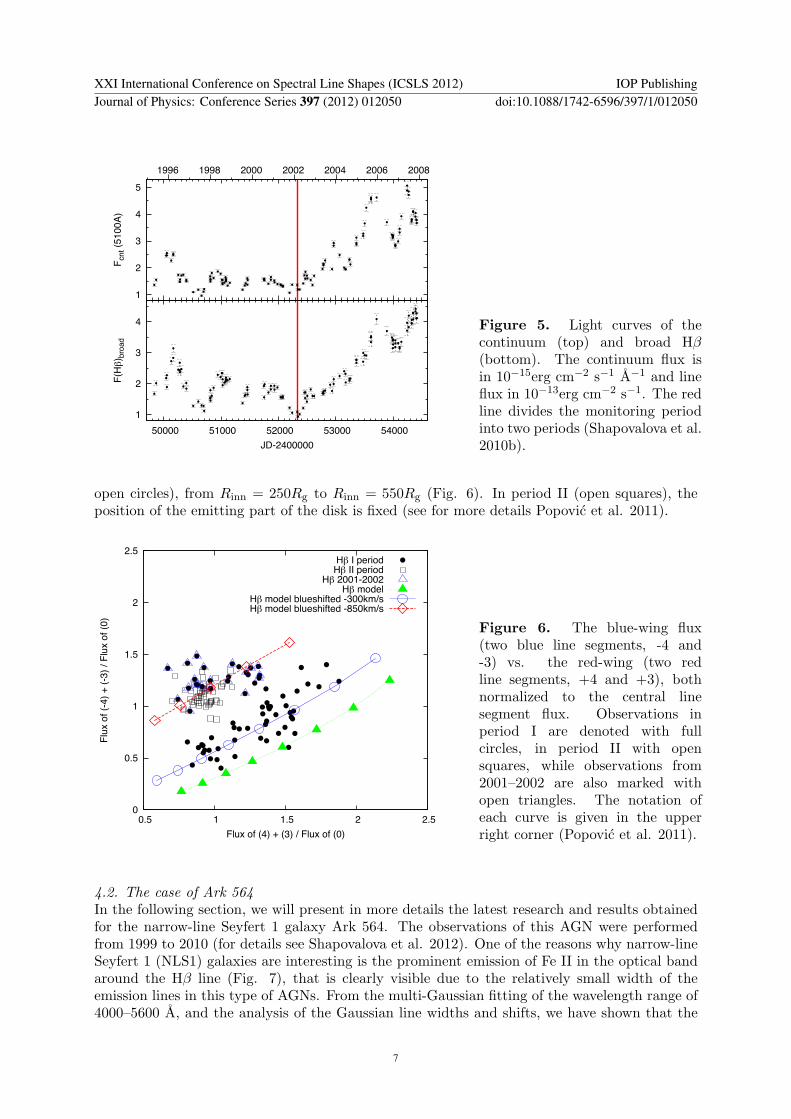
1
2
3
4
50000 51000 52000 53000 54000
F(Hβ)
broa
d
JD-2400000
1
2
3
4
5 1996 1998 2000 2002 2004 2006 2008
F cnt
(510
0A)
Figure 5 Light curves of thecontinuum (top) and broad HOslash(bottom) The continuum flux isin 10deg15erg cmdeg2 sdeg1 Adeg1 and lineflux in 10deg13erg cmdeg2 sdeg1 The redline divides the monitoring periodinto two periods (Shapovalova et al2010b)
open circles) from Rinn
= 250Rg
to Rinn
= 550Rg
(Fig 6) In period II (open squares) theposition of the emitting part of the disk is fixed (see for more details Popovic et al 2011)
0
05
1
15
2
25
05 1 15 2 25
Flux
of (
-4) +
(-3)
Fl
ux o
f (0)
Flux of (4) + (3) Flux of (0)
Hβ I periodHβ II period
Hβ 2001-2002Hβ model
Hβ model blueshifted -300kmsHβ model blueshifted -850kms
Figure 6 The blue-wing flux(two blue line segments -4 and-3) vs the red-wing (two redline segments +4 and +3) bothnormalized to the central linesegment flux Observations inperiod I are denoted with fullcircles in period II with opensquares while observations from2001ndash2002 are also marked withopen triangles The notation ofeach curve is given in the upperright corner (Popovic et al 2011)
42 The case of Ark 564
In the following section we will present in more details the latest research and results obtainedfor the narrow-line Seyfert 1 galaxy Ark 564 The observations of this AGN were performedfrom 1999 to 2010 (for details see Shapovalova et al 2012) One of the reasons why narrow-lineSeyfert 1 (NLS1) galaxies are interesting is the prominent emission of Fe II in the optical bandaround the HOslash line (Fig 7) that is clearly visible due to the relatively small width of theemission lines in this type of AGNs From the multi-Gaussian fitting of the wavelength range of4000ndash5600 A and the analysis of the Gaussian line widths and shifts we have shown that the
XXI International Conference on Spectral Line Shapes (ICSLS 2012) IOP PublishingJournal of Physics Conference Series 397 (2012) 012050 doi1010881742-65963971012050
7
optical Fe II lines of this AGN are coming from the intermediate line region (Shapovalova et al2012) as suggested before (see Kovacevic et al 2010 and references therein)
0
200
400
600
800
1000
1200
1400
1600
1800
2000
4000 4200 4400 4600 4800 5000 5200 5400 5600
Flux
Wavelength [A]
He II 4686
Hγ 4340
[OIII] 4363Hδ 4101
Fe II 2728
Fe II 3738
Fe II 42 Fe II 4849
Nov 23 2001
Figure 7 The Fe II emissionaround the HOslash line for the NLS1galaxy Ark 564 Strong emissionlines are labeled as well as theFe II multiplets (Shapovalova et al2012)
During the monitoring period the mean continuum and lines fluxes are weakly varying asthe decrease of only ordf20-30 (see light curves in Fig 5 in Shapovalova et al 2012) from thebeginning (1999) to the end of the monitoring campaign (2010) was detected Also in the lightcurves five flare-like events (two prominent and three possible) lasting ordf1-3 days were detected
One obtained result is particularly intriguing It was observed that there is almost nocorrelation between the HAElig and HOslash line fluxes (Fig 8) Such behavior is unexpected ifphotoionization by the central continuum source would be the main mechanism responsiblefor the production of both lines The lack of correlation could indicate very complex physicalprocesses in the line forming region ie beside the photoionization some additional physicalprocesses may be present
6
7
8
9
10
11
12
13
14
16 18 2 22 24 26 28 3 32 34
F(Hα
) tot
F(Hβ)tot
r=040P0=053E-02
Figure 8 The HAElig as a function ofthe HOslash line flux The correlationcoeplusmncient and the correspondingP-value are given in the upperleft corner Data obtained withdiAEligerent telescopes are marked withdiAEligerent symbols diamonds - 6min Russia circles - 1m Zeiss inRussia triangles - 21m GHO inMexico squares - 21m SPM inMexico (Shapovalova et al 2012)
5 Conclusions
In this paper we present some methods and tools how to investigate the plasma properties of theBLR in AGNs using the broad emission line parameters (eg line fluxes ratios widths profilesvariability) Especially we present the possibilities to use the long-term optical monitoring
XXI International Conference on Spectral Line Shapes (ICSLS 2012) IOP PublishingJournal of Physics Conference Series 397 (2012) 012050 doi1010881742-65963971012050
8
campaigns of variable AGNs in constraining the physics and structure of the BLR and givesome of the findings in two special objects Here we outline our important conclusions
i) We show that the Boltzmann-plot method can be exploited for the BLR plasma diagnosticsas it gives constraints to both the temperature and density of the BLR
ii) The kinematics and geometry of the BLR is complex and most often there are contributionof more sub-regions with diAEligerent geometrymotions to the total line profile One possibility isthat the BEL profiles can be described with the two-component model where the disk-like regionemission is contributing to the line wings and an additional spherical component is producingthe line core
iii) The BLR physics is also complex and there are most likely other ionization mechanismresponsible for the line production apart from the photoionization
All of these findings should be taken into account when using the parameters of the BLR forthe estimates of the mass of the supermassive black hole in the center of an AGN and thus theinvestigations of the BLR properties are still in the top of the astrophysical research
Acknowledgments
This work was supported by the Ministry of Education and Science of the Republic of Serbiathrough the project ldquoAstrophysical Spectroscopy of Extragalactic Objectsrdquo (176001) L CP W K and D I are grateful to the Alexander von Humboldt foundation for support in theframe of program ldquoResearch Group Linkagerdquo
References
Arshakian T G Leon-Tavares J Lobanov A P et al 2010 MNRAS 401 1231Bentz M C Denney K D Cackett E M et al 2006 ApJ 651 775Blandford R D and McKee C F 1982 ApJ 255 419Bon E Popovic L C Gavrilovic N La Mura G and Mediavilla E 2009 MNRAS 400 924Bon E Popovic L C Ilic D and Mediavilla E 2006 New Astronomy Review 50 716Chen K Halpern J P and Filippenko AV 1989 ApJ 339 742Chen K and Halpern J P 1989 ApJ 344 115Eracleous M and Halpern J P 1994 ApJS 90 1Eracleous M and Halpern J P 2003 ApJ 599 886Ferland G J Korista K T Verner D A Ferguson J W Kingdon J B and Verner E M 1998 PASP 110 761Flohic H M L G Eracleous M and Bogdanovic T 2012 ApJ 753 133Gaskell C M 1988 ApJ 325 114Gaskell C M 2009 New Astronomy Review 53 140Griem H R 1997 Principles of plasma spectroscopy (Cambridge Cambridge University Press)Ilic D 2007 Ser Astron J 175 15Ilic D Kovacevic J and Popovic L C 2009 New Astronomy Review 53 149Ilic D Popovic L C Bon E Mediavilla E and Chavushyan V H 2006 MNRAS 371 1610Ilic D Popovic L C La Mura G Ciroi S and Rafanelli P 2010a Journal of Physics Conference Series 257 012034Ilic D Popovic L C La Mura G Ciroi S and Rafanelli P 2012 AampA 543 142Ilic D Popovic L C Leon-Tavares J et al 2008 Memorie della Societa Astronomica Italiana 79 1105Ilic D Popovic L C Shapovalova A I et al 2010b Memorie della Societa Astronomica Italiana Supplementi 15 166Jovanovic P Popovic L C Stalevski M and Shapovalova A I 2010 ApJ 718 168Kollatschny W and BischoAElig K 2002 AampA 386 L19Kollatschny W and Dietrich M 1997 AampA 323 5Korista K T and Goad M R 2004 ApJ 606 749Kovacevic J Popovic L C and Dimitrijevic M S 2010 ApJS 189 15La Mura G Popovic L C Ciroi S Rafanelli P and Ilic D 2007 ApJ 671 104Laor A 2006 ApJ 643 112Murray N and Chiang J 1997 ApJ 474 91Marziani P Sulentic J W Negrete C A Dultzin D Zamfir S and Bachev R 2010 MNRAS 409 1033Metzroth K G Onken C A and Peterson B M 2006 ApJ 647 901Osterbrock D E and Ferland G J 2006 Astrophysics of Gaseous Nebulae and Active Galactic Nuclei (2nd ed)
(Sausalito California University Science Books)
XXI International Conference on Spectral Line Shapes (ICSLS 2012) IOP PublishingJournal of Physics Conference Series 397 (2012) 012050 doi1010881742-65963971012050
9
Peterson M B 1999 Structure and Kinematics of Quasar Broad Line Regions (ASP Conference Series) 175 49Peterson M B 2008 New Astron Rev 52 240Peterson B M Ferrarese L Gilbert K M et al 2004 ApJ 613 682Popovic L C 2003 ApJ 599 140Popovic L C 2006a ApJ 650 1217 (an Erratum)Popovic L C 2006b SerAJ 173 1Popovic L C Mediavilla E G Bon E and Ilic D 2004 AampA 423 909Popovic L C Mediavlilla E G Kubicela A and Jovanovic P 2002 AampA 390 473Popovic L C Shapovalova A I Chavushyan V H Ilic D Burenkov A N Mercado A Ciroi S and Bochkarev N G
2008 PASJ 61 1Popovic L C Shapovalova A I Ilic D et al 2011 AampA 528 130Shapovalova A I Burenkov A N Carrasco L et al 2001 AampA 376 775Shapovalova A I Doroshenko V T Bochkarev N G et al 2004 AampA 422 925Shapovalova A I Popovic L C Collin S et al 2008 AampA 486 99SShapovalova A I Popovic L C Bochkarev N G et al 2009 New Astronomy Review 53 191Shapovalova A I Popovic L C Burenkov A N et al 2010a AampA 509 106Shapovalova A I Popovic L C Burenkov A N et al 2010b AampA 517 42Shapovalova A I Popovic L C Burenkov A N et al 2012 ApJS 202 10Shapovalova A I Popovic L C Ilic D et al 2011 Baltic Astronomy 20 476Storey P J and Hummer D G 1995 MNRAS 272 41Strateva I V Strauss M A Hao L et al 2003 ApJ 126 1720Sulentic J W Marziani P and Dultzin-Hacyan D 2000 ARAampA 38 521Wanders I and Peterson B M 1996 ApJ 466 174
XXI International Conference on Spectral Line Shapes (ICSLS 2012) IOP PublishingJournal of Physics Conference Series 397 (2012) 012050 doi1010881742-65963971012050
10
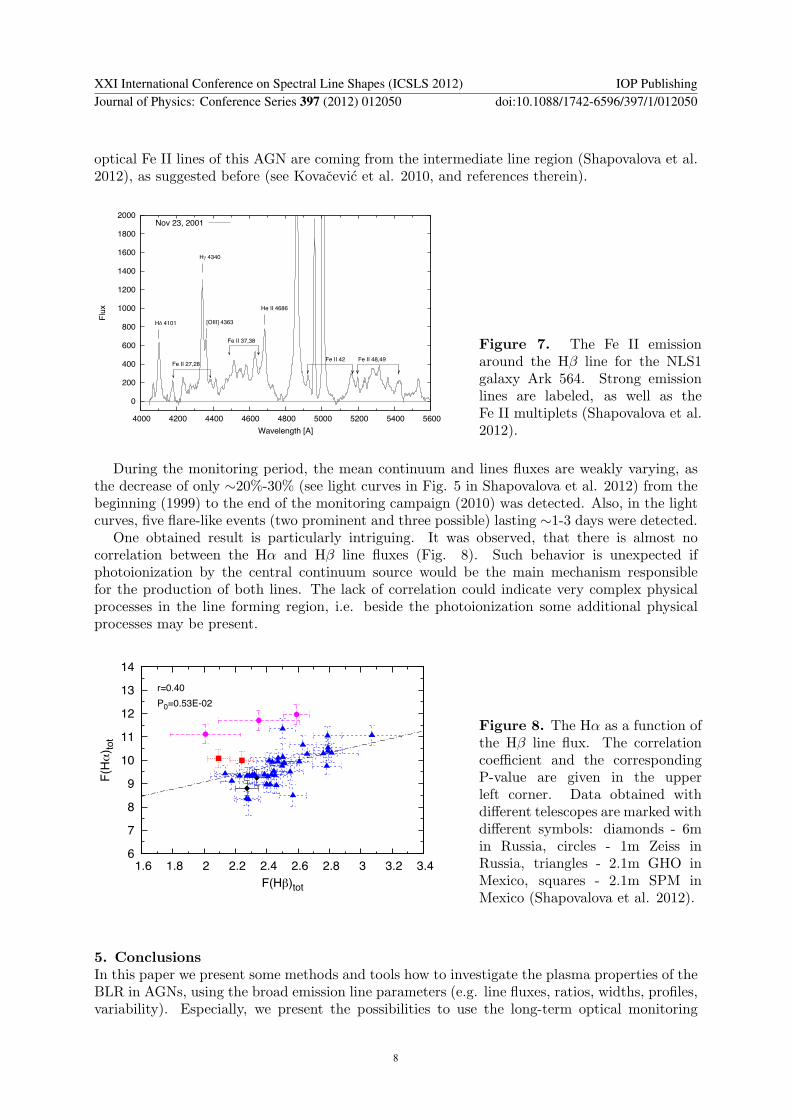