pdf - 2.87 mb - rainforest alliance
TRANSCRIPT
www.snvredd.comSNV REDD+a
The Feasibility of Carbon Financing for Improved Forest Management at Loc Bac State Operating Company, Lam Dong Province, Vietnam
Adam Gibbon, Vanessa Evans, Langlang Tata Buana, Nguyen The Chien, Lai Tung Quan, Nguyen Trung Thong and Richard McNallyDecember 2011
Supported by:
www.snvredd.comSNV REDD+
Acknowledgements
This report was prepared by Rainforest Alliance in close collaboration with SNV Netherlands Development Organisation. The study team is grateful to the welcoming Loc Bac State Owned Company who hosted very valuable group discussions, interviews and field visits. We would like to thank Mr Mai Huu Chanh, Director; Phan Van Kim, Vice Director; Nguyen Minh Tri, Head of Technical Division; Nguyen Van Loc; Dinh Van Nam; and Ha Huy Bao, technical staff of Loc Bac SOC, for their information sharing and interviews. We appreciate Dr. Nguyen Chi Thanh, Director of Forest and Wetland Research Center; Dr Vien Ngoc Nam, University of Agriculture and Forestry Ho Chi Minh; and Tran Van Dung, Senior Consultant in forest inventory and planning from Southern Sub Forest Inventory and Planning Institute (Sub-FIPI) for sharing their expertise. In addition, we thank James Halperin and Jeff Hayward for their useful comments.
The Rainforest Alliance (RA) works to conserve biodiversity and ensure sustainable livelihoods by transforming land-use practices, business practices and consumer behavior. Based in New York City, with offices throughout the United States and worldwide, the Rainforest Alliance works with people whose livelihoods depend on the land, helping them transform the way they grow food, harvest wood and host travelers. From large multinational corporations to small, community-based cooperatives, the organisation involves businesses and consumers worldwide in its efforts to bring responsibly produced goods and services to a global marketplace where the demand for sustainability is growing steadily.
SNV Netherlands Development Organisation is an international development organisation of Dutch origin with over 40 years of experience. SNV currently works in 32 countries in Africa, Asia, Latin America and the Balkans, with an increasing presence of national advisors in-country.SNV supports national and local actors within government, civil society and the private sector to find and implement local solutions to social and economic development challenges. The organisation stimulates and sets the framework for the poor to strengthen their capacities and escape poverty. SNV does this by facilitating knowledge development, brokering, networking and advocacy at national and international level. Partnerships with other development agencies and the private sector are key to SNV’s approach.
Adam [email protected] Winchester House 259-269 Old Marylebone Road London NW1 5RA, UK Tel: +44 (0)207 170 4130 www.rainforest-alliance.org
Richard [email protected] 6th Floor, Building B, La Thanh Hotel, 218 Doi Can, Ba Dinh, Hanoi, Vietnam www.snvredd.org
This study was made possible due to the generous support of IKEA Supply AG.
www.snvredd.comSNV REDD+
Table of Contents
Page
List of Tables, Boxes, Maps and Figures iAbbreviations iiExecutive Summary iiiObjective v
1 Introduction 1
2 Vietnam and REDD+ 2 2.1 Forests in Vietnam 2 2.2 REDD+ in Vietnam 3
3 The Project Area: Loc Bac SOC 7
4 The Steps to Determine Feasibility 11 4.1 Step 1 - Determine the baseline scenario 12 4.2 Step 2 - Analysis of options for the project scenario 16 4.3 Step 3 - Determination of additionality 18 4.4 Step 4 - Calculation of GHG emissions associated with the baseline and project scenario 20 4.5 Step 5 - Determination of the net GHG benefit using the carbon model 25 4.6 Step 6 - Accounting for leakage 29 4.7 Step 7 - Accounting for non-permanence 29 4.8 Step 8 - Calculation of financial implications of the project scenarios 31 4.9 Step 9 - Further considerations of land tenure and government approval 38 4.10 Step 10 - Comparison to CCB Standard 38
5 Conclusions 41
6 References 43 Annex 1: Loc Bac biodiversity data 44
www.snvredd.comSNV REDD+i www.snvredd.comSNV REDD+i
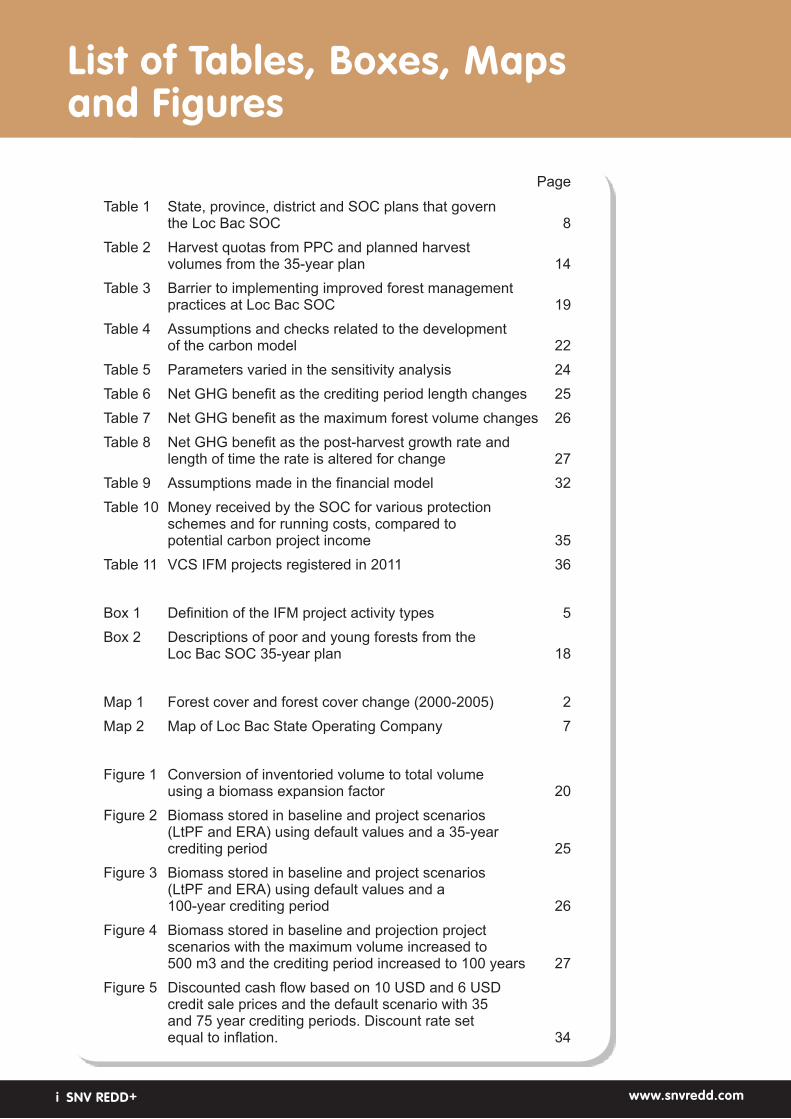
List of Tables, Boxes, Maps and Figures
Page
Table 1 State, province, district and SOC plans that govern the Loc Bac SOC 8Table 2 Harvest quotas from PPC and planned harvest volumes from the 35-year plan 14Table 3 Barrier to implementing improved forest management practices at Loc Bac SOC 19Table 4 Assumptions and checks related to the development of the carbon model 22Table 5 Parameters varied in the sensitivity analysis 24Table 6 Net GHG benefit as the crediting period length changes 25Table 7 Net GHG benefit as the maximum forest volume changes 26Table 8 Net GHG benefit as the post-harvest growth rate and length of time the rate is altered for change 27Table 9 Assumptions made in the financial model 32Table 10 Money received by the SOC for various protection schemes and for running costs, compared to potential carbon project income 35Table 11 VCS IFM projects registered in 2011 36
Box 1 Definition of the IFM project activity types 5Box 2 Descriptions of poor and young forests from the Loc Bac SOC 35-year plan 18 Map 1 Forest cover and forest cover change (2000-2005) 2Map 2 Map of Loc Bac State Operating Company 7
Figure 1 Conversion of inventoried volume to total volume using a biomass expansion factor 20Figure 2 Biomass stored in baseline and project scenarios (LtPF and ERA) using default values and a 35-year crediting period 25Figure 3 Biomass stored in baseline and project scenarios (LtPF and ERA) using default values and a 100-year crediting period 26Figure 4 Biomass stored in baseline and projection project scenarios with the maximum volume increased to 500 m3 and the crediting period increased to 100 years 27Figure 5 Discounted cash flow based on 10 USD and 6 USD credit sale prices and the default scenario with 35 and 75 year crediting periods. Discount rate set equal to inflation. 34
www.snvredd.comSNV REDD+ii
Abbreviations
AFOLU Agriculture, Forest and Land Use
CCB Climate, Community and Biodiversity
CDM Clean Development Mechanism
DARD Department of Agriculture and Rural Development
ERA Extended Rotation Length
FAO Food and Agriculture Organization of the United Nations
GHG Greenhouse Gas
HCVF High Conservation Value Forest
IFM Improved Forest Management
KBA Key Biodiversity Area
LtHP/ LPtHP Low Productivity to High Productivity Forest
LtPF Logged to Protected Forest
MARD Ministry of Agriculture and Rural Development
MODIS Moderate Resolution Imaging Spectroradiometer
MRV Monitoring, Reporting and Verification
PES Payments for environmental services
PPC Provincial Peoples Council
REDD Reducing emissions from deforestation and forest degradation in developing countries
REDD+ Reducing emissions from deforestation and forest degradation and the role of conservation of forest carbon stocks, sustainable management of forests and enhancement of forest carbon stocks in developing countries
RIL Reduced Impact Logging
SEDP Socio-economic Development Plan
SFEs State Forest Enterprises
SOC State Operating Company
VCS Verified Carbon Standard
VCU Verified Carbon Units
FCPF World Bank Forest Carbon Partnership Fund
www.snvredd.comSNV REDD+iii SNV REDD+iii www.snvredd.com
Executive Summary
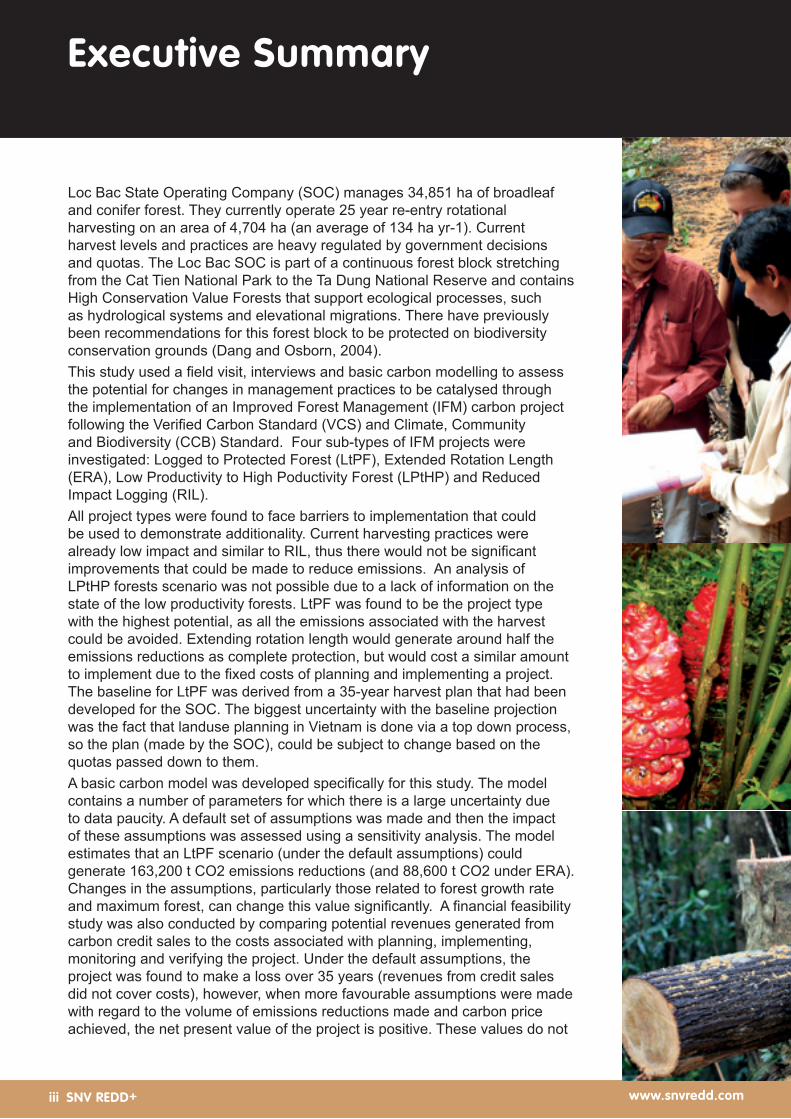
Loc Bac State Operating Company (SOC) manages 34,851 ha of broadleaf and conifer forest. They currently operate 25 year re-entry rotational harvesting on an area of 4,704 ha (an average of 134 ha yr-1). Current harvest levels and practices are heavy regulated by government decisions and quotas. The Loc Bac SOC is part of a continuous forest block stretching from the Cat Tien National Park to the Ta Dung National Reserve and contains High Conservation Value Forests that support ecological processes, such as hydrological systems and elevational migrations. There have previously been recommendations for this forest block to be protected on biodiversity conservation grounds (Dang and Osborn, 2004).This study used a field visit, interviews and basic carbon modelling to assess the potential for changes in management practices to be catalysed through the implementation of an Improved Forest Management (IFM) carbon project following the Verified Carbon Standard (VCS) and Climate, Community and Biodiversity (CCB) Standard. Four sub-types of IFM projects were investigated: Logged to Protected Forest (LtPF), Extended Rotation Length (ERA), Low Productivity to High Poductivity Forest (LPtHP) and Reduced Impact Logging (RIL).All project types were found to face barriers to implementation that could be used to demonstrate additionality. Current harvesting practices were already low impact and similar to RIL, thus there would not be significant improvements that could be made to reduce emissions. An analysis of LPtHP forests scenario was not possible due to a lack of information on the state of the low productivity forests. LtPF was found to be the project type with the highest potential, as all the emissions associated with the harvest could be avoided. Extending rotation length would generate around half the emissions reductions as complete protection, but would cost a similar amount to implement due to the fixed costs of planning and implementing a project. The baseline for LtPF was derived from a 35-year harvest plan that had been developed for the SOC. The biggest uncertainty with the baseline projection was the fact that landuse planning in Vietnam is done via a top down process, so the plan (made by the SOC), could be subject to change based on the quotas passed down to them.A basic carbon model was developed specifically for this study. The model contains a number of parameters for which there is a large uncertainty due to data paucity. A default set of assumptions was made and then the impact of these assumptions was assessed using a sensitivity analysis. The model estimates that an LtPF scenario (under the default assumptions) could generate 163,200 t CO2 emissions reductions (and 88,600 t CO2 under ERA). Changes in the assumptions, particularly those related to forest growth rate and maximum forest, can change this value significantly. A financial feasibility study was also conducted by comparing potential revenues generated from carbon credit sales to the costs associated with planning, implementing, monitoring and verifying the project. Under the default assumptions, the project was found to make a loss over 35 years (revenues from credit sales did not cover costs), however, when more favourable assumptions were made with regard to the volume of emissions reductions made and carbon price achieved, the net present value of the project is positive. These values do not

www.snvredd.comSNV REDD+iv SNV REDD+iv www.snvredd.com
include lost revenues associated with reduced harvesting. The values also do not capture the positive biodiversity and community benefits that could accrue. It is concluded that the concept of an LtPF project with a SOC is worth pursuing further. Key next steps involve gathering more data about the forest dynamics with and without harvesting, and canvassing the political support for this type of land management scenario within the current SOC reform process currently ongoing in Vietnam.
www.snvredd.comSNV REDD+v www.snvredd.comSNV REDD+v
The purpose of this collaboration between SNV and the Rainforest Alliance is to assess the technical and financial feasibility of the development of an improved forest management carbon project at the Loc Bac SOC (State Owned Company), in Lam Dong province, Vietnam. The Verified Carbon Standard (VCS) and the Climate, Community and Biodiversity (CCB) Standard will be used as standards against which the project potential is assessed.
Objective
www.snvredd.comSNV REDD+1
Introduction 1
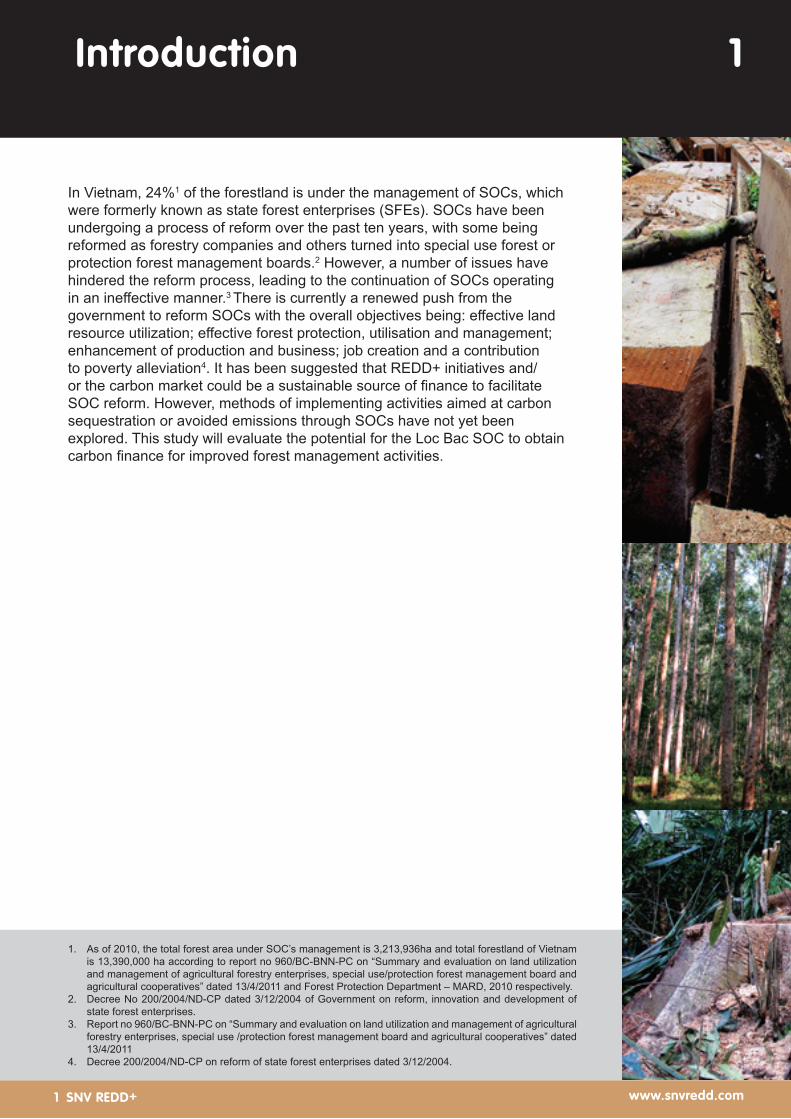
In Vietnam, 24%1 of the forestland is under the management of SOCs, which were formerly known as state forest enterprises (SFEs). SOCs have been undergoing a process of reform over the past ten years, with some being reformed as forestry companies and others turned into special use forest or protection forest management boards.2 However, a number of issues have hindered the reform process, leading to the continuation of SOCs operating in an ineffective manner.3 There is currently a renewed push from the government to reform SOCs with the overall objectives being: effective land resource utilization; effective forest protection, utilisation and management; enhancement of production and business; job creation and a contribution to poverty alleviation4. It has been suggested that REDD+ initiatives and/or the carbon market could be a sustainable source of finance to facilitate SOC reform. However, methods of implementing activities aimed at carbon sequestration or avoided emissions through SOCs have not yet been explored. This study will evaluate the potential for the Loc Bac SOC to obtain carbon finance for improved forest management activities.
1. As of 2010, the total forest area under SOC’s management is 3,213,936ha and total forestland of Vietnam is 13,390,000 ha according to report no 960/BC-BNN-PC on “Summary and evaluation on land utilization and management of agricultural forestry enterprises, special use/protection forest management board and agricultural cooperatives” dated 13/4/2011 and Forest Protection Department – MARD, 2010 respectively.
2. Decree No 200/2004/ND-CP dated 3/12/2004 of Government on reform, innovation and development of state forest enterprises.
3. Report no 960/BC-BNN-PC on “Summary and evaluation on land utilization and management of agricultural forestry enterprises, special use /protection forest management board and agricultural cooperatives” dated 13/4/2011
4. Decree 200/2004/ND-CP on reform of state forest enterprises dated 3/12/2004.
www.snvredd.comSNV REDD+2 www.snvredd.comSNV REDD+2
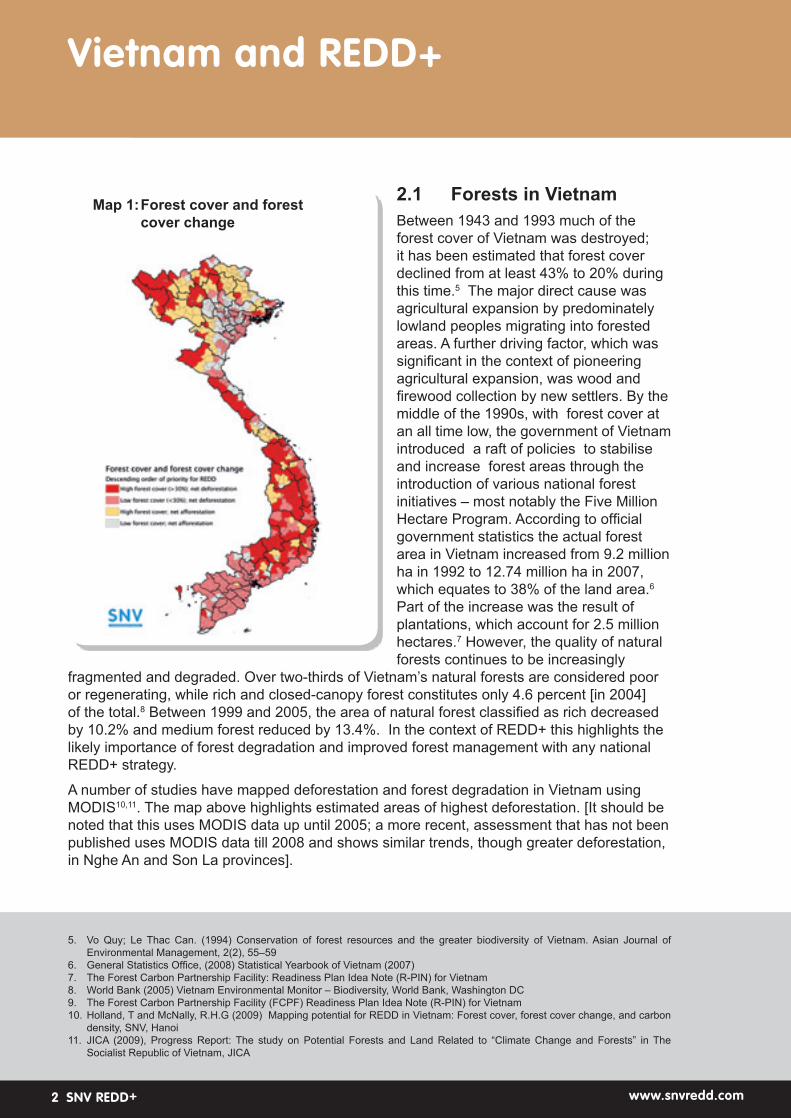
2.1 Forests in VietnamBetween 1943 and 1993 much of the forest cover of Vietnam was destroyed; it has been estimated that forest cover declined from at least 43% to 20% during this time.5 The major direct cause was agricultural expansion by predominately lowland peoples migrating into forested areas. A further driving factor, which was significant in the context of pioneering agricultural expansion, was wood and firewood collection by new settlers. By the middle of the 1990s, with forest cover at an all time low, the government of Vietnam introduced a raft of policies to stabilise and increase forest areas through the introduction of various national forest initiatives – most notably the Five Million Hectare Program. According to official government statistics the actual forest area in Vietnam increased from 9.2 million ha in 1992 to 12.74 million ha in 2007, which equates to 38% of the land area.6 Part of the increase was the result of plantations, which account for 2.5 million hectares.7 However, the quality of natural forests continues to be increasingly
fragmented and degraded. Over two-thirds of Vietnam’s natural forests are considered poor or regenerating, while rich and closed-canopy forest constitutes only 4.6 percent [in 2004] of the total.8 Between 1999 and 2005, the area of natural forest classified as rich decreased by 10.2% and medium forest reduced by 13.4%. In the context of REDD+ this highlights the likely importance of forest degradation and improved forest management with any national REDD+ strategy.
A number of studies have mapped deforestation and forest degradation in Vietnam using MODIS10,11. The map above highlights estimated areas of highest deforestation. [It should be noted that this uses MODIS data up until 2005; a more recent, assessment that has not been published uses MODIS data till 2008 and shows similar trends, though greater deforestation, in Nghe An and Son La provinces].
Vietnam and REDD+
5. Vo Quy; Le Thac Can. (1994) Conservation of forest resources and the greater biodiversity of Vietnam. Asian Journal of Environmental Management, 2(2), 55–59
6. General Statistics Office, (2008) Statistical Yearbook of Vietnam (2007)7. The Forest Carbon Partnership Facility: Readiness Plan Idea Note (R-PIN) for Vietnam8. World Bank (2005) Vietnam Environmental Monitor – Biodiversity, World Bank, Washington DC9. The Forest Carbon Partnership Facility (FCPF) Readiness Plan Idea Note (R-PIN) for Vietnam10. Holland, T and McNally, R.H.G (2009) Mapping potential for REDD in Vietnam: Forest cover, forest cover change, and carbon
density, SNV, Hanoi11. JICA (2009), Progress Report: The study on Potential Forests and Land Related to “Climate Change and Forests” in The
Socialist Republic of Vietnam, JICA
Map 1: Forest cover and forest cover change
www.snvredd.comSNV REDD+3
2.2 REDD+ in Vietnam Vietnam has already been active in the field of REDD+. In order to activate REDD+ activities in the country, at the proposal of the VNFOREST [Decision No. 2614/QĐ-BNN- LN, dated 16/09/2009], the National Network and Technical Working Group for REDD+ were established. The National Network is chaired by the Director General of VNFOREST and co-chaired by an international development partner [Norwegian Embassy]. The National Network and Technical Working Group are open to all organisations to participate. As part of the discussions under the REDD+ Technical Working Group, it was decided to establish four sub Technical Working Groups: Monitoring, Reporting and Verification (MRV); Benefit Distribution Systems; Local Implementation; Governance and Safeguards. Each sub Technical Working Group meets regularly and is co-chaired by an international organisation.
On 07 January 2011, with the approval of the Prime Minister of Vietnam, the Minister of the Ministry of Agriculture and Rural Development signed Decision 39/QD-BNN-TCCB on the establishment of the Steering Committee for Implementation of the Initiative on REDD+ in Vietnam. Members of the steering committee will include representatives from relevant ministries and ministerial level agencies, including the Office of the Government, Ministry of Natural Resources and the Environment, Ministry of Planning and Investment, Ministry of Finance, Ministry of Science and Technology, Ministry of Foreign Affairs and the National Committee for Ethnic Minorities. As part of this Decision, the Vietnam REDD+ office was established. This was a major step forward in the introduction of REDD+ in Vietnam.
Currently, the National REDD+ program is being drafted. A number of early drafts are available, although they are going through an extensive review process. The hope is that Prime Ministerial Decree will support the National REDD+ Program, which is due to be finalized in 2012.
In Vietnam, there are a number of ongoing donor supported initiatives with respect to REDD+. Key bilateral donor agencies involved include JICA, the Embassy of Finland, the Norwegian Embassy, GiZ and USAID (in design). Vietnam was the first UN-REDD Programme supported country. Phase I began in 2008 and will be completed by the end of 2011. The program had two main outputs: improved institutional and technical capacity to implement REDD+; and improved capacity to manage REDD and provide other payments for ecological services at the provincial and district level. There is expected to be a second phase that will establish and make operational the National REDD+ Program with piloting to begin in four or five provinces. This will include actual payments to communities. The Phase II document is currently being finalized.
Vietnam is also supported under the World Bank Forest Carbon Partnership Fund (FCPF). The Readiness Preparation Proposal has been accepted by the Participants Committee of the FCPF and is awaiting internal permissions. The expectation is that activities under the RPP will commence in 2012.
There is also interest in REDD+ from NGOs and the private sector. SNV, Winrock International, ICRAF, FFI and WWF all have field level interventions.
2
www.snvredd.comSNV REDD+4 www.snvredd.comSNV REDD+4
Alongside developments at the international level under the UNFCCC, there has been steady growth in the voluntary carbon market, the market in which buyers purchase carbon credits from projects despite not being under any regulatory obligation to do so. In response to market demands for assurances of quality, a number of voluntary standards have emerged. Each has their own niche: the Verified Carbon Standard12 (VCS) focuses on carbon accounting; the Climate Community and Biodiversity Alliance Standard13(CCB) considers the wider potential benefits of a carbon project; Plan Vivo14 is tailored to small-scale community based projects; CarbonFix15 is designed for tree planting projects; and the Climate Action Reserve16, which is a north American based standard, focuses on carbon accounting. Some standards (VCS, CCB and Plan Vivo) require that as well as following the requirements of the standard, technical methodologies which calculate the emissions reductions must also be followed for the technical elements of the project. Each standard has a different range of projects it allows, such as tree planting, avoided deforestation and improved forest management.
Since production forest constitutes 98.1% of Loc Bac SOC’s area, the carbon project type that is most applicable is Improved Forest Management (IFM). Improved forest management projects entail making improvements in places where business as usual operations do not involve deforestation, but do involve emissions related to the management of forests. IFM projects are currently only eligible in the voluntary carbon market under the Verified Carbon Standard (VCS), the Climate Action Reserve (CAR) and Plan Vivo.
The VCS standard however, is globally applicable and has methodologies that are suitable for large scale commercial operations. Therefore, only the VCS standard will be considered further in this study.
The VCS defines improved forest management as follows,
“Eligible IFM activities are those that increase carbon sequestration and/or reduce GHG emissions on forest lands managed for wood products such as sawtimber, pulpwood and fuelwood by increasing biomass carbon stocks through improving forest management practices. The baseline and project scenarios for the project area shall qualify as forests remaining as forests, such as set out in the IPCC 2006 Guidelines on National GHG Inventories, and the project area shall be designated, sanctioned or approved for wood product management by a national or local regulatory body (e.g. as logging concessions or plantations).” (VCS AFOLU Requirements, 4.2.3)
Within the project type of IFM there are four subcategories: Reduced Impact Logging (RIL), Logged to Protected Forest (LtPF), Extending Rotation Age/Cutting Cycle (ERA) and converting Low Productive to High Productive Forest (LtHP). The definitions of these subcategories can be found in Box 1.
12. www.v-c-s.org13. www.climate-standards.org14. www.planvivo.org15. www.carbonfix.info 16. www.climateactionreserve.org
www.snvredd.comSNV REDD+5
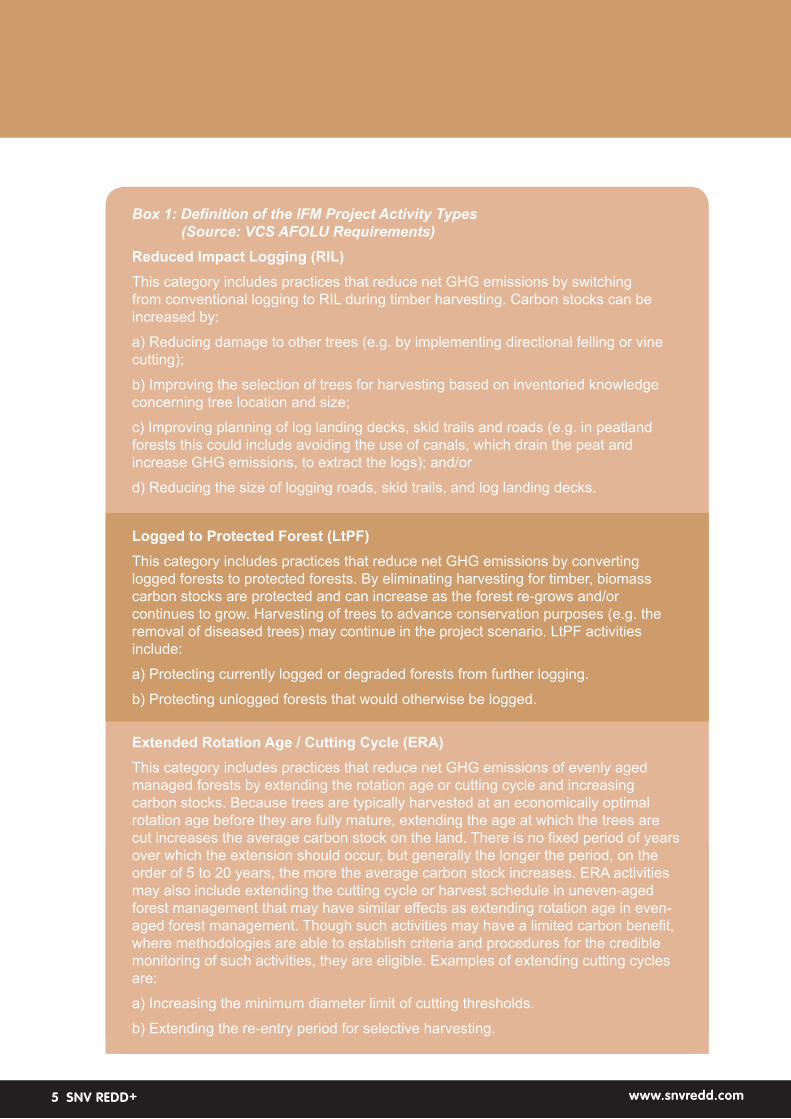
Box 1: Definition of the IFM Project Activity Types (Source: VCS AFOLU Requirements)Reduced Impact Logging (RIL)This category includes practices that reduce net GHG emissions by switching from conventional logging to RIL during timber harvesting. Carbon stocks can be increased by:
a) Reducing damage to other trees (e.g. by implementing directional felling or vine cutting);
b) Improving the selection of trees for harvesting based on inventoried knowledge concerning tree location and size;
c) Improving planning of log landing decks, skid trails and roads (e.g. in peatland forests this could include avoiding the use of canals, which drain the peat and increase GHG emissions, to extract the logs); and/or
d) Reducing the size of logging roads, skid trails, and log landing decks.
Logged to Protected Forest (LtPF) This category includes practices that reduce net GHG emissions by converting logged forests to protected forests. By eliminating harvesting for timber, biomass carbon stocks are protected and can increase as the forest re-grows and/or continues to grow. Harvesting of trees to advance conservation purposes (e.g. the removal of diseased trees) may continue in the project scenario. LtPF activities include:
a) Protecting currently logged or degraded forests from further logging.
b) Protecting unlogged forests that would otherwise be logged.
Extended Rotation Age / Cutting Cycle (ERA)This category includes practices that reduce net GHG emissions of evenly aged managed forests by extending the rotation age or cutting cycle and increasing carbon stocks. Because trees are typically harvested at an economically optimal rotation age before they are fully mature, extending the age at which the trees are cut increases the average carbon stock on the land. There is no fixed period of years over which the extension should occur, but generally the longer the period, on the order of 5 to 20 years, the more the average carbon stock increases. ERA activities may also include extending the cutting cycle or harvest schedule in uneven-aged forest management that may have similar effects as extending rotation age in even-aged forest management. Though such activities may have a limited carbon benefit, where methodologies are able to establish criteria and procedures for the credible monitoring of such activities, they are eligible. Examples of extending cutting cycles are:
a) Increasing the minimum diameter limit of cutting thresholds.
b) Extending the re-entry period for selective harvesting.
www.snvredd.comSNV REDD+6 www.snvredd.comSNV REDD+6
The VCS requires that in addition to following the standard, a project must use an approved methodology to define the baseline, select carbon pools, demonstrate additionality, calculate the carbon benefits and design a monitoring plan. There are currently three methodologies for IFM projects approved by the VCS that are applicable to SOCs (VM0003, VM0005 and VM0010).
An IFM carbon project developed by a SOC would preferably utilise one of these methodologies, as developing a new methodology or requesting a deviation from an existing methodology can be costly and time consuming.
Low-Productive to High-Productive Forest (LtHP)This category includes practices that increase carbon sequestration by converting low-productivity forests to high-productivity forests. Carbon stocks can be increased by improving the stocking density of low-productivity forests, noting the following:
a) Low-productivity forests usually satisfy one of the following conditions:
i) They qualify as forest as defined by the host country for its UNFCCC national inventory accounting, but do not contain much timber of commercial value.
ii) They are in a state of arrested succession, where regeneration is inhibited for extended periods of time, following either a catastrophic natural event to which the forest is maladapted thus causing massive mortality, or on-going human-induced disturbance, for example uncharacteristically severe fire or widespread flooding, animal grazing, or burning.
iii) They have a very slow growth rate or low crown cover.
b) Improving the stocking density of low-productivity forests can be achieved through the following activities:
i) Introducing other tree species with higher timber value or growth rates.
ii) Adopting enrichment planting to increase the density of trees.
iii) Adopting other forest management techniques to increase carbon stocks (e.g. fertilization or liming).
www.snvredd.comSNV REDD+7
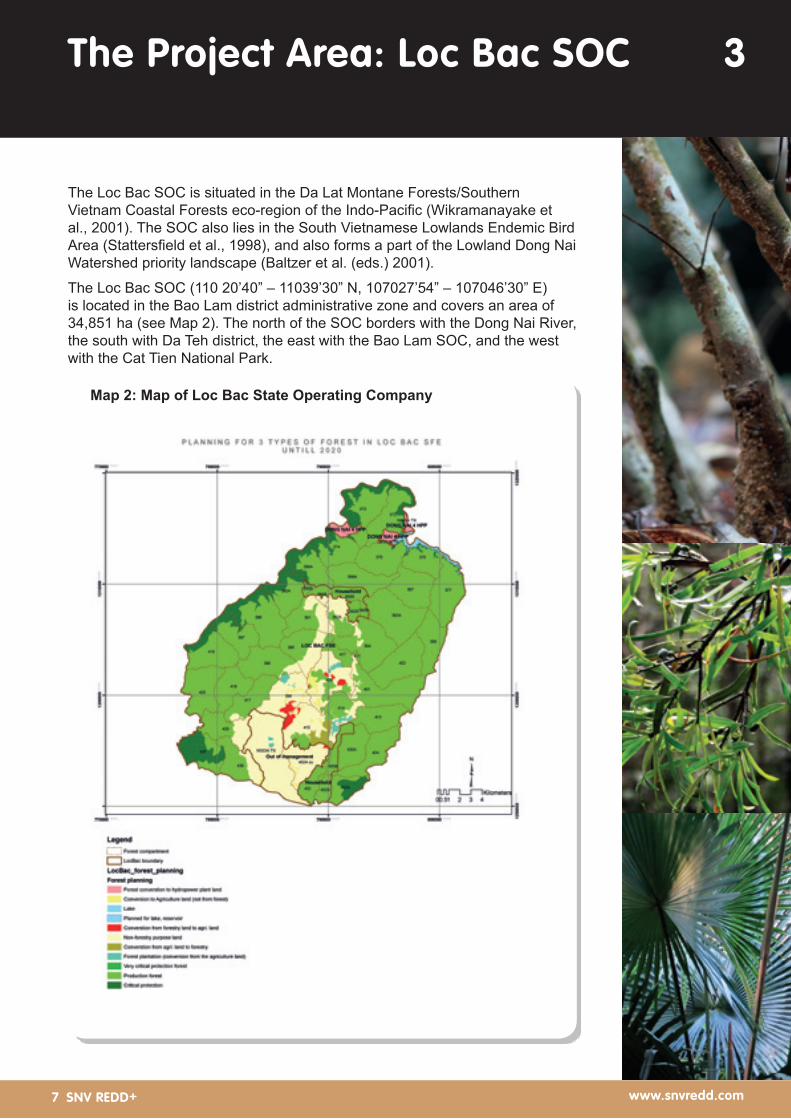
The Loc Bac SOC is situated in the Da Lat Montane Forests/Southern Vietnam Coastal Forests eco-region of the Indo-Pacific (Wikramanayake et al., 2001). The SOC also lies in the South Vietnamese Lowlands Endemic Bird Area (Stattersfield et al., 1998), and also forms a part of the Lowland Dong Nai Watershed priority landscape (Baltzer et al. (eds.) 2001).
The Loc Bac SOC (110 20’40” – 11039’30” N, 107027’54” – 107046’30” E) is located in the Bao Lam district administrative zone and covers an area of 34,851 ha (see Map 2). The north of the SOC borders with the Dong Nai River, the south with Da Teh district, the east with the Bao Lam SOC, and the west with the Cat Tien National Park.
The Project Area: Loc Bac SOC 3
Map 2: Map of Loc Bac State Operating Company
www.snvredd.comSNV REDD+8 SNV REDD+8 www.snvredd.com
Level Planning Document Notes
Sta
te(V
ietn
am)
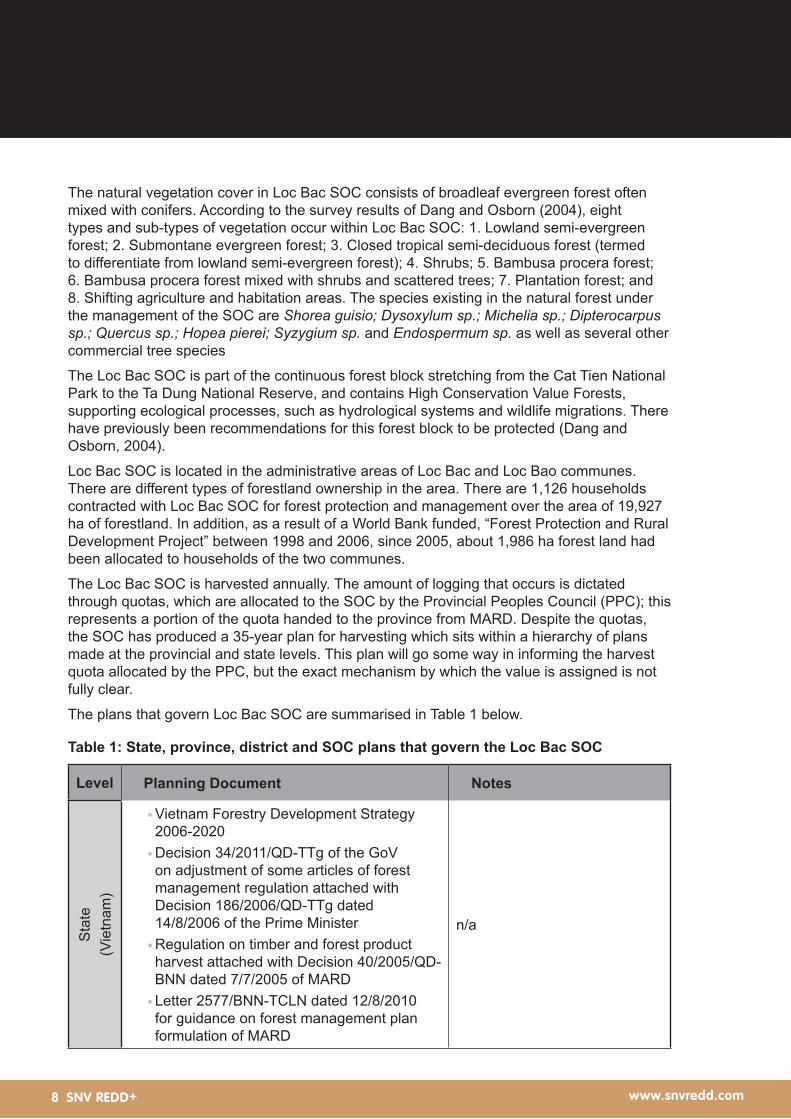
•Vietnam Forestry Development Strategy 2006-2020
•Decision 34/2011/QD-TTg of the GoV on adjustment of some articles of forest management regulation attached with Decision 186/2006/QD-TTg dated 14/8/2006 of the Prime Minister
•Regulation on timber and forest product harvest attached with Decision 40/2005/QD-BNN dated 7/7/2005 of MARD
•Letter 2577/BNN-TCLN dated 12/8/2010 for guidance on forest management plan formulation of MARD
n/a
The natural vegetation cover in Loc Bac SOC consists of broadleaf evergreen forest often mixed with conifers. According to the survey results of Dang and Osborn (2004), eight types and sub-types of vegetation occur within Loc Bac SOC: 1. Lowland semi-evergreen forest; 2. Submontane evergreen forest; 3. Closed tropical semi-deciduous forest (termed to differentiate from lowland semi-evergreen forest); 4. Shrubs; 5. Bambusa procera forest; 6. Bambusa procera forest mixed with shrubs and scattered trees; 7. Plantation forest; and 8. Shifting agriculture and habitation areas. The species existing in the natural forest under the management of the SOC are Shorea guisio; Dysoxylum sp.; Michelia sp.; Dipterocarpus sp.; Quercus sp.; Hopea pierei; Syzygium sp. and Endospermum sp. as well as several other commercial tree species
The Loc Bac SOC is part of the continuous forest block stretching from the Cat Tien National Park to the Ta Dung National Reserve, and contains High Conservation Value Forests, supporting ecological processes, such as hydrological systems and wildlife migrations. There have previously been recommendations for this forest block to be protected (Dang and Osborn, 2004).
Loc Bac SOC is located in the administrative areas of Loc Bac and Loc Bao communes. There are different types of forestland ownership in the area. There are 1,126 households contracted with Loc Bac SOC for forest protection and management over the area of 19,927 ha of forestland. In addition, as a result of a World Bank funded, “Forest Protection and Rural Development Project” between 1998 and 2006, since 2005, about 1,986 ha forest land had been allocated to households of the two communes.
The Loc Bac SOC is harvested annually. The amount of logging that occurs is dictated through quotas, which are allocated to the SOC by the Provincial Peoples Council (PPC); this represents a portion of the quota handed to the province from MARD. Despite the quotas, the SOC has produced a 35-year plan for harvesting which sits within a hierarchy of plans made at the provincial and state levels. This plan will go some way in informing the harvest quota allocated by the PPC, but the exact mechanism by which the value is assigned is not fully clear.
The plans that govern Loc Bac SOC are summarised in Table 1 below.
Table 1: State, province, district and SOC plans that govern the Loc Bac SOC
www.snvredd.comSNV REDD+9 SNV REDD+9 www.snvredd.com
Level Planning Document Notes
Pro
vinc
e(L
am D
ong)
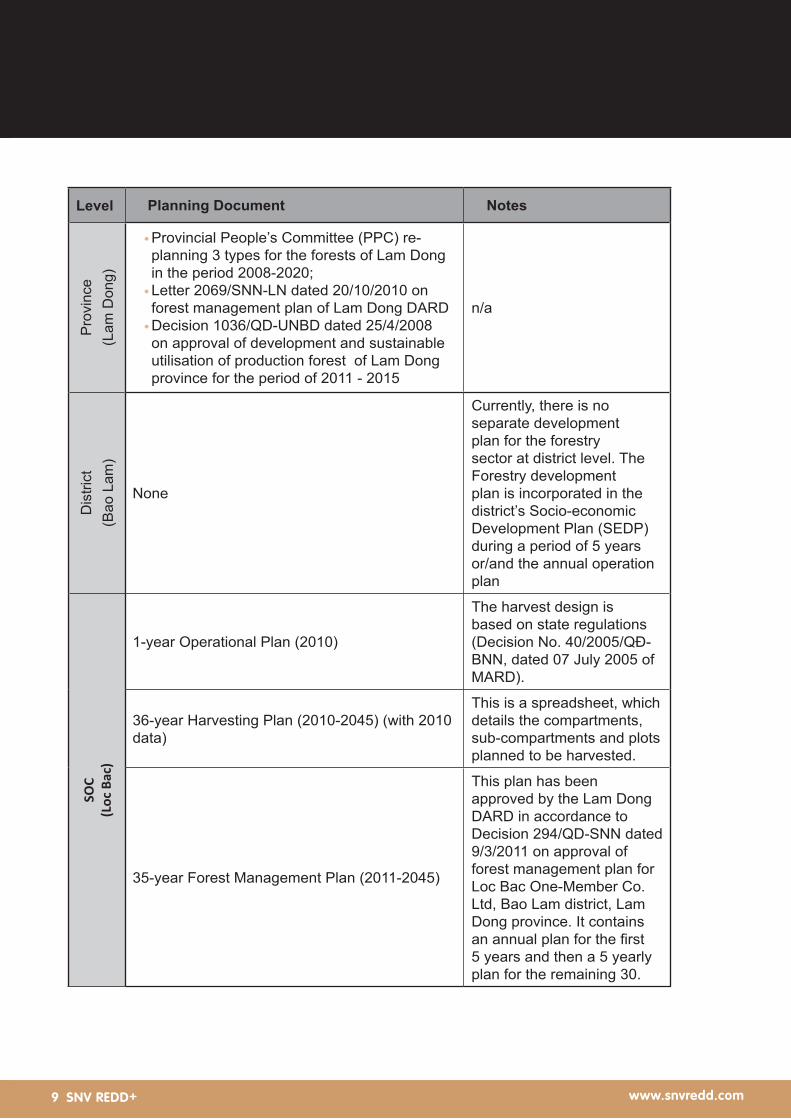
•Provincial People’s Committee (PPC) re-planning 3 types for the forests of Lam Dong in the period 2008-2020;
•Letter 2069/SNN-LN dated 20/10/2010 on forest management plan of Lam Dong DARD
•Decision 1036/QD-UNBD dated 25/4/2008 on approval of development and sustainable utilisation of production forest of Lam Dong province for the period of 2011 - 2015
n/a
Dis
trict
(Bao
Lam
)
None
Currently, there is no separate development plan for the forestry sector at district level. The Forestry development plan is incorporated in the district’s Socio-economic Development Plan (SEDP) during a period of 5 years or/and the annual operation plan
SOC
(Loc
Bac
)
1-year Operational Plan (2010)
The harvest design is based on state regulations (Decision No. 40/2005/QĐ-BNN, dated 07 July 2005 of MARD).
36-year Harvesting Plan (2010-2045) (with 2010 data)
This is a spreadsheet, which details the compartments, sub-compartments and plots planned to be harvested.
35-year Forest Management Plan (2011-2045)
This plan has been approved by the Lam Dong DARD in accordance to Decision 294/QD-SNN dated 9/3/2011 on approval of forest management plan for Loc Bac One-Member Co. Ltd, Bao Lam district, Lam Dong province. It contains an annual plan for the first 5 years and then a 5 yearly plan for the remaining 30.

www.snvredd.comSNV REDD+10 SNV REDD+10 www.snvredd.com
The Loc Bac SOC’s major functions include forest protection and management, forestland utilisation and plantation; forest and forest land allocation; forest extension according to the guidance of the appropriate authorities and technical agencies (PPC and DARD). Another important task of the Loc Bac SOC is to formulate harvesting plans and assist the PPC in organising tenders and monitoring logging activities of selected harvesting contractors. The Loc Bac SOC itself can also act a harvesting contractor that will then conduct logging activities according to the law of Vietnam.
www.snvredd.comSNV REDD+11
In order to determine the feasibility of implementing an Improved Forest Management project, a step wise approach was followed.
Step 1 - Determine the baseline scenario The ‘without project’ or ‘business as usual’ scenario was determined in order to create a baseline from which improvements in forest management could be measured against. Specific requirements from the VCS standard on how this must be done were followed.
Step 2 - Analysis of options for the project scenarioReduced Impact Logging (RIL), Converting Logged to Protected Forest (LtPF), Extending Rotation Age (ERA) and Converting Low to High Productivity Forest were all analysed qualitatively for their potential to be implemented and lead to emissions reductions.
Step 3 - Determination of additionality A barrier analysis was conducted to determine whether or not the project scenarios selected would occur without carbon finance, and thus determine their additionality.
Step 4 - Calculation of GHG emissions associated with the baseline and project scenarioA simple carbon model was developed that modeled the carbon stocks in the harvested area over the project lifetime. The model was based on data from Loc Bac’s 35-year plan. Carbon stocks were calculated under the baseline and project scenarios. A sensitivity analysis was conducted on key parameters in the model.
Step 5 - Determination of the net GHG benefit using the carbon model The model outputs were used to determine the net GHG benefit of the project scenarios compared to the baseline.
Step 6 - Accounting for leakage A high level leakage assessment was conducted to determine the risk of the project scenario triggering increased emissions outside the project area.
Step 7 - Accounting for non-permanence In accordance with the VCS non-permanence risk assessment requirements, the project scenarios were assessed for their internal, external and natural risks in order to estimate the percentage of credits that would need to be deposited in the VCS’s risk buffer account.
Step 8 - Calculation of financial implications of the project scenarios A simple financial model, driven by the outputs of the carbon model, was developed to estimate the revenues and costs associated with the project. The net present value of the project scenario was calculated.
Step 9 - Further considerations of land tenure and government approval Further consideration was given to the issues of land tenure and government approval given their importance to the success of any project at Loc Bac SOC.
Step 10 - Comparison to CCB Standard Analysis was conducted to see the potential challenges the project would face if it were to also seek validation and verification under the Climate, Community and Biodiversity Standard.
The Steps to Determine 4Feasibility
www.snvredd.comSNV REDD+12 www.snvredd.comSNV REDD+12
This feasibility study was carried out from the 24-29 July 2001, on the grounds of the Loc Bac SOC and in Ho Chi Minh City, Vietnam. The study team consisted of Adam Gibbon, Langlang Tata Buana and Vanessa Evans from Rainforest Alliance, and Nguyen The Chien, Lai Tung Quan, Nguyen Trung Thong and Richard McNally from SNV Vietnam.
Input was also received from:
•Mr Phan Van Kim (Vice Director), Mr Nguyen Minh Tri (Head of Technical Division), Mr Ha Duy Bao (technical staff), Mr Nguyen Van Loc (Forest Protection Officer), Mr Dinh Van Nam (Forest Protection Officer) and all of Loc Bac SOC, regarding Business as Usual SOC management.
•Dr Nguyen Chi Thanh (Director, Forest and Wetland Research Centre), regarding necessary approvals and the forestry planning process.
•Mr. Dung, a senior consultant in forest inventory and planning from Southern Sub Forest Inventory and Planning Institute (FIPI), regarding our first impressions from the field visit
•Dr Vien Ngoc Nam, University of Agriculture and Forestry and Ho Chi Minh City, an expert in carbon accounting, agriculture and forestry, regarding the best default values to use for the carbon model.
4.1 Step 1 - Determine the baseline scenario For a forest carbon project to be able to claim carbon credits, project developers need to justify that the project has resulted in verifiable GHG emissions reductions. These are calculated by assessing the difference between the actual project GHG emissions/sequestration and those which would have occurred without the project, in what baseline scenario.
Baseline scenario in the VCSThe VCS has three rules that IFM projects must follow to construct a baseline:
“1) Documented evidence of the project proponent’s operating history, such as five or more years of management records, to provide evidence of normal historical practices. Management records may include, inter alia, data on timber cruise volumes, length of roads and skid trails, inventory levels, and harvest levels within the project area. Where the project proponent (and implementing partner, if applicable) is a new owner or management entity with no history of logging practices in the project region, the baseline shall reflect the local common practices and legal requirements. However, if the common practice is unsustainable and unsustainable practices contravene the mission of the new owner or management entity, then a sustainable baseline is the minimum that can be adopted. Where the project proponent (including an entity with a conservation or sustainability mission) takes over ownership or management of a property specifically to stop logging or reduce the impact of logging to reduce forest management emissions, then the project baseline may be based on the projected management plans of the previous property owners and/or operators (ie, the baseline shall represent what would have most likely occurred in the absence of the project).
2) Adherence to the legal requirements for forest management and land use in the area unless verifiable evidence is provided demonstrating that common practice in the area does not adhere to such requirements.
www.snvredd.comSNV REDD+13
3) Baseline environmental management practices shall not be set below (i.e., be less environmentally robust than) those commonly considered a minimum standard among similar landowners in the area. For example, where common practice exceeds minimum legal practice, the baseline cannot be the minimum legal requirement and the baseline scenario shall, at a minimum, be based on common practice.” (VCS AFOLU Requirements, 4.4.5)
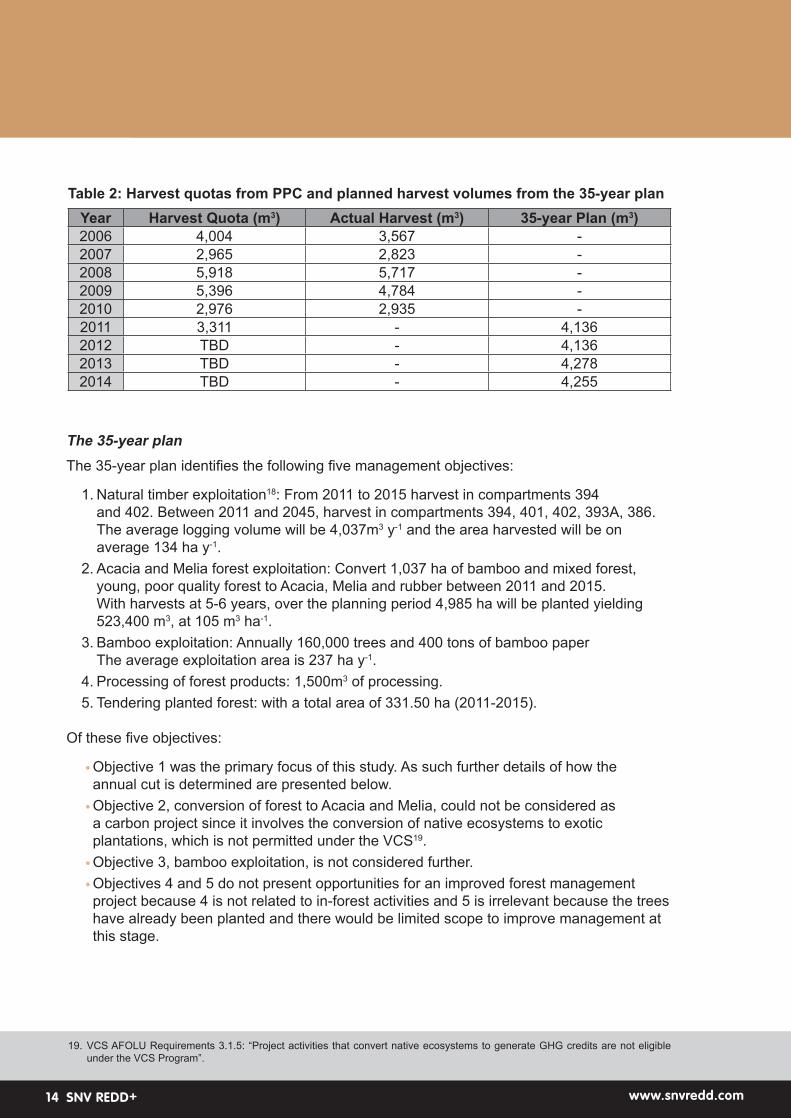
With regards to criteria (1), historical data is available from the 35-year plan. These records show that harvest levels have fluctuated over the last 5 years and that the actual harvest is always close to the harvest quota (see Table 2).
With regards to criteria (2) and (3), the fact that logging is strictly controlled by governmental regulations ensures that legal requirements and environmental practices are met. The recently issued regulation of the Vietnam Government for harvesting practices focused mainly on management of harvesting activities. At the provincial level, the Agriculture and Rural Development Department directly manages and monitors the activities of the provincial SOCs and logging companies. At the provincial and district level, the Forest Protection Department is responsible for supervising harvesting processes.
In addition to following the VCS standard rules, a project must follow an approved methodology to generate the baseline scenario. A full assessment of this step is not conducted here, however, it is thought that the 35-year plan in combination with the evidence of past harvests would be sufficient to establish the baseline. The largest unknown variable is the extent to which the 35-year plans harvests are modified based on the annual quota received from the PPC. It may be that this uncertainty will diminish in the future because within the “Vietnam’s Forest Protection and Development Plan, 2011-202017”, which MARD submitted to the Prime Minister for approval in August 2011, it is proposed that the Government of Vietnam abolish the harvest quota from natural forest (but it is not clear when). SOCs would then decide on the harvest volume according to their own Sustainable Forest Management Plan, which will be approved by competent authorities. In the future there may therefore be more certainty about long-term planned harvest volumes.
Since the annual activities in the 35-year plan are very similar from year to year, it was decided that this plan, in conjunction with the 5 year harvesting schedule, was suitable for projecting management in the short to near term. A site visit to an area harvested in 2009 confirmed that management was being conducted according to the plans. Whilst the projections which follow extend out as far as 70 years, it is understood that the projections would require revising every 10 years according to VCS rules.
17. Submitted letter No. 2307/TTr-BNN-TCLN issued on 11 August 201118. Based on historical inventories this will be made up of 8-12 tree/ha, with an average of 30 m3 ha-1 harvested. The main
species to be harvested are Alstonia scholaris, Anisoptera costata,Michelia mediocris Dipterocarpus Syzygium zeylanicum, Ternstroemia, Hopea sp, Calophyllum,and Shorea guiso.
www.snvredd.comSNV REDD+14 www.snvredd.comSNV REDD+14
The 35-year planThe 35-year plan identifies the following five management objectives:
1. Natural timber exploitation18: From 2011 to 2015 harvest in compartments 394 and 402. Between 2011 and 2045, harvest in compartments 394, 401, 402, 393A, 386. The average logging volume will be 4,037m3 y-1 and the area harvested will be on average 134 ha y-1.
2. Acacia and Melia forest exploitation: Convert 1,037 ha of bamboo and mixed forest, young, poor quality forest to Acacia, Melia and rubber between 2011 and 2015. With harvests at 5-6 years, over the planning period 4,985 ha will be planted yielding 523,400 m3, at 105 m3 ha-1.
3. Bamboo exploitation: Annually 160,000 trees and 400 tons of bamboo paper The average exploitation area is 237 ha y-1.
4. Processing of forest products: 1,500m3 of processing.5. Tendering planted forest: with a total area of 331.50 ha (2011-2015).
Of these five objectives:
•Objective 1 was the primary focus of this study. As such further details of how the annual cut is determined are presented below.
•Objective 2, conversion of forest to Acacia and Melia, could not be considered as a carbon project since it involves the conversion of native ecosystems to exotic plantations, which is not permitted under the VCS19.
•Objective 3, bamboo exploitation, is not considered further.•Objectives 4 and 5 do not present opportunities for an improved forest management project because 4 is not related to in-forest activities and 5 is irrelevant because the trees have already been planted and there would be limited scope to improve management at this stage.
Table 2: Harvest quotas from PPC and planned harvest volumes from the 35-year planYear Harvest Quota (m3) Actual Harvest (m3) 35-year Plan (m3)2006 4,004 3,567 -2007 2,965 2,823 -2008 5,918 5,717 -2009 5,396 4,784 -2010 2,976 2,935 -2011 3,311 - 4,1362012 TBD - 4,1362013 TBD - 4,2782014 TBD - 4,255
19. VCS AFOLU Requirements 3.1.5: “Project activities that convert native ecosystems to generate GHG credits are not eligible under the VCS Program”.
www.snvredd.comSNV REDD+15
Description of annual harvest operationsEvery year, after the PPC gives the Loc Bac SOC their harvest quota, the SOC signs a contract with the consultation company (Lam Dong Agriculture and Forestry Consultation Company) to formulate a harvesting design document (annual operation plan).20
The activities carried out by the consultation company include conducting a forest inventory, conducting tree marking in the field, and designing skid trails and log landing locations.
The forest inventory used data from various sources, such as an annual forest monitoring map, three forest category planning maps, and a SPOT 5 Image. The consultant team also conducted ground truthing to verify forest and forest land status.
The consultation company also provides a harvest map (scale 1/5.000, 20m contours) of the harvest area, which is used during the harvesting operation. Upon completing all of the activities (which usually occur during March/April), the company delivers all the necessary documents to the SOC, which are then sent to DARD and submitted for approval from the PPC. When the SOC receives approval of the annual plan with a specific harvesting quota from the PPC, it organizes a tender for harvesting contractors. The chosen contractor or the SOC itself (if selected) then conducts harvesting activities in the designated compartments. The activities include road construction, logging, skidding and hauling. The harvesting period of the SOC is usually from September to March during the area’s dry season.
A site visit was conducted to an area logged in 2009 because the area harvested in 2010 was deemed inaccessible. Overall, the observations made were consistent with the harvest being executed according to the plan with relatively low impacts on the surrounding forest.
The roads (hauling and skidding) were constructed using a Komatsu D53 Bulldozer and were found to be the standard four meters in width, which is the maximum skidding road permitted based on the principals of RIL. However, there is no evidence that culverts and drainage were ever made in the logging road or harvesting area. This accelerates leaching/soil erosion, as evident during the field observation. It is apparent that road decommissioning had not been conducted by the SOC and as a result, erosion was high and evidence of illegal logging was found in the logging area. Felling was conducted according to RIL principals (e.g. directional felling according to a fishbone system, stump height, following diameter limit of felled tree, no traces of other trees being harmed by felling operation and marking of trees to be harvested seem clear and noticeable by the logger). The site visit confirmed that the impact of logging, especially for surrounding trees and the canopy, is relatively small when compared to conventional logging. This indicates that the harvesting intensity of the area is small and does not have a high impact on the ecological aspects of the forest. Based on interviews and observation, it became apparent that the SOC used a Komatsu D53 or TDT4 instead of a skidder to skid the logs outside of the harvesting site; this has negative impacts compared to a skidder. It needs to be noted, however, that forest sanitation21 conducted by the SOC seemed high. The map of the harvesting site seemed to be consistent with actual conditions in the field.
20. The harvesting intensity is regulated by Decision 40; For evergreen broadleaved forests the prescribed harvesting intensity is based on standing volume as follows: from 91 - 150 m3 ha-1, an intensity of 18 - 23%; from 151 - 200 m3 ha-1, intensity from 24 - 28%; from 201 - 300 m3 ha-1, intensity from 29 - 33%; over 300 m3 ha-1, intensity from 34 - 38%; The minimum diameter for harvesting is 40 cm, and for dry dipterocarp forest 35 cm).
21. Forest sanitation after harvesting: felling damage trees and removing salvageable volume.
www.snvredd.comSNV REDD+16 www.snvredd.comSNV REDD+16
ConclusionThe baseline considered for this study will be a continuation of harvesting according to the quotas from the PPC and planned harvest volumes from the 35-year plan, because the field evidence indicated the plans have been followed to date and there are no other alternative ways of projecting logging in the area.
4.2 Step 2 - Analysis of options for the project scenarioAs discussed above, there are four different types of IFM activities eligible under the VCS and they will each be considered in the context of the Loc Bac SOC:
Reduced Impact Logging (RIL)Reduced impact logging can be defined as, “intensively planned and carefully controlled timber harvesting conducted by trained workers in ways that minimize the deleterious impacts of logging” (Putz et al., 2008). RIL encompasses many aspects of forest harvesting operations, including pre-harvest inventory and planning, selection and marking of merchantable trees, designing infrastructure, felling, extracting and hauling logs, and post -harvest operations and assessments. At the Loc Bac SOC, observations in the field and interviews with staff revealed that harvesting practices already largely met the definition of reduced impact logging. There was potential for improvement with regards to improving the use of culverts and drainage on roads to reduce erosion, requiring environmental assessments to be done post-harvest, and road decommissioning but overall, it was determined that only minimal improvements were needed. The MARD heavily regulates harvesting practices, with decisions such as 40/2005/QĐ-BNN, dated 07 July 2005, which regulates practices for harvesting timber and other forest products not allowing high impact.
Logged to Protected Forest (LtPF)Ceasing harvest operations in all or part of the productive forest area would lead to emissions reductions since emissions associated with harvesting would be eliminated. Felling a tree of a given biomass would not immediately result in emissions equal to that biomass. A portion of the tree would end up as a wood product, which would subsequently store carbon until the end of its useful life and its decay. Off-cuts from the production of wood products could end up as secondary products, be burned, or end up decaying. Biomass left in the forest (branches, leaves, bark, etc.) would decay over time, permeating the soil and then the atmosphere. This complex flow of carbon through various stores is often simplified in carbon accounting. It is assumed that all carbon is immediately released into the atmosphere, except that which is put into long-term storage as wood products (>100 years).
The cessation of logging has been suggested before as a pathway for Loc Bac SOC. In 2004, Cat Tien National Park, WWF and Koninkrijk der Nederlanden conducted a survey of the areas surrounding Cat Tien National Park (Nguyen Xuan and Osborn, 2004) and put forward a recommendation to convert Loc Bac SOC to the status of Nature Reserve in order to support and extend the protection of Cat Tien National Park. A second option was also presented which involved the SOC continuing extraction, but increased the current amount of protection forest designated for watershed protection, soil erosion prevention, species protection and the protection of rare habitats. The management board of the SOC reported that the area remaining after such re-designation would render the SOC operations infeasible. Therefore, only a complete conversion to a Nature Reserve, or carrying on with business as usual practices, were considered viable options. Whilst the exact decision-
www.snvredd.comSNV REDD+17
making process is not known, the observed practices confirm that the continuation of the SOC’s operations was the option chosen.
Extending Rotation Age/Cutting Cycle (ERA)The current rotation cycle of 35 years is in accordance with MARD’s Decision 40/2005/QĐ-BNN, dated 07 July 2005 on the regulation of harvesting timber and other forest products. Extending the cutting cycle would allow trees more time to grow before harvesting, increasing average volume and thus the average carbon stock held in the forest over time.
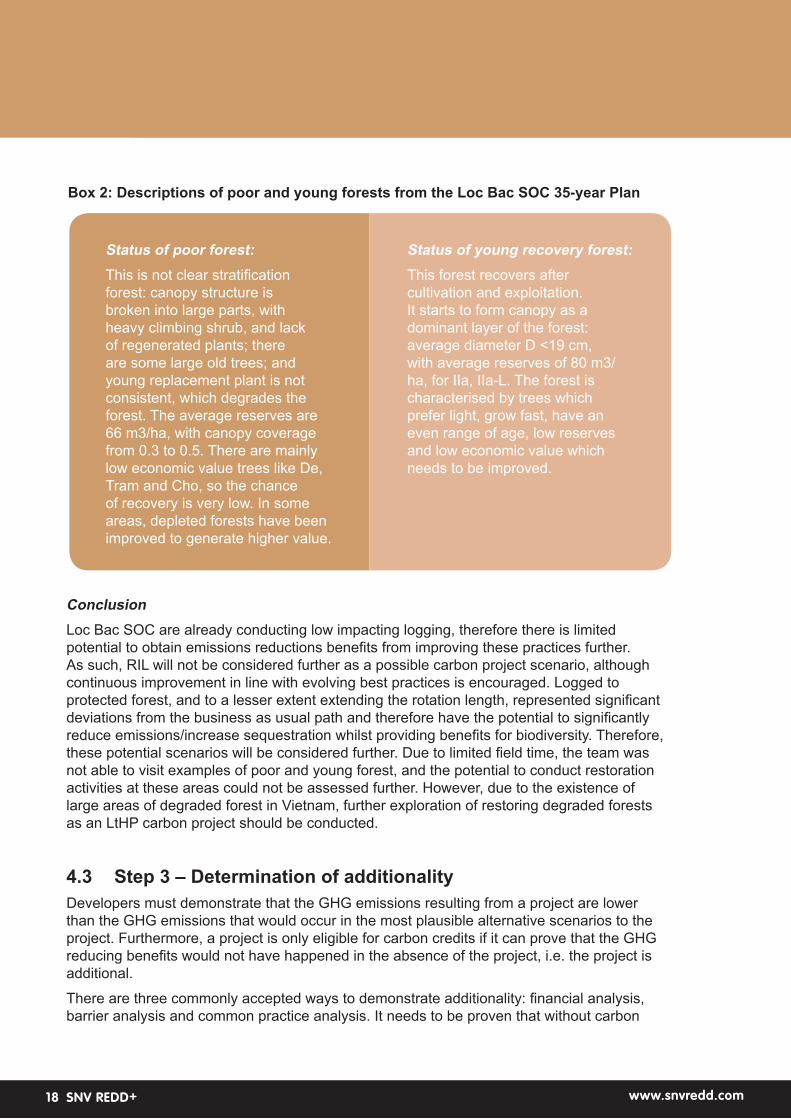
Converting Low Productive to High Productive Forest (LtHP)Of the 27,430 ha of natural forest under the control of Loc Bac SOC, only 4,921 (17%) is classed as rich (Average reserves: 205 m3/ha) or medium (160 m3/ha) forest. Of the remaining forest, 3,085 (11%) is classed as poor (66 m3/ha), 10,659 ha (37%) is classed as young (80 m3/ha) and 8,765 ha (30%) is classed as a mix of bamboo and timber (7 m3/ha). Young and poor forest types would be of most interest for improved productivity. Box 2 below provides a more detailed description of their characteristics.
www.snvredd.comSNV REDD+18 www.snvredd.comSNV REDD+18
ConclusionLoc Bac SOC are already conducting low impacting logging, therefore there is limited potential to obtain emissions reductions benefits from improving these practices further. As such, RIL will not be considered further as a possible carbon project scenario, although continuous improvement in line with evolving best practices is encouraged. Logged to protected forest, and to a lesser extent extending the rotation length, represented significant deviations from the business as usual path and therefore have the potential to significantly reduce emissions/increase sequestration whilst providing benefits for biodiversity. Therefore, these potential scenarios will be considered further. Due to limited field time, the team was not able to visit examples of poor and young forest, and the potential to conduct restoration activities at these areas could not be assessed further. However, due to the existence of large areas of degraded forest in Vietnam, further exploration of restoring degraded forests as an LtHP carbon project should be conducted.
4.3 Step 3 – Determination of additionalityDevelopers must demonstrate that the GHG emissions resulting from a project are lower than the GHG emissions that would occur in the most plausible alternative scenarios to the project. Furthermore, a project is only eligible for carbon credits if it can prove that the GHG reducing benefits would not have happened in the absence of the project, i.e. the project is additional.
There are three commonly accepted ways to demonstrate additionality: financial analysis, barrier analysis and common practice analysis. It needs to be proven that without carbon
Status of poor forest: This is not clear stratification forest: canopy structure is broken into large parts, with heavy climbing shrub, and lack of regenerated plants; there are some large old trees; and young replacement plant is not consistent, which degrades the forest. The average reserves are 66 m3/ha, with canopy coverage from 0.3 to 0.5. There are mainly low economic value trees like De, Tram and Cho, so the chance of recovery is very low. In some areas, depleted forests have been improved to generate higher value.
Status of young recovery forest: This forest recovers after cultivation and exploitation. It starts to form canopy as a dominant layer of the forest: average diameter D <19 cm, with average reserves of 80 m3/ha, for IIa, IIa-L. The forest is characterised by trees which prefer light, grow fast, have an even range of age, low reserves and low economic value which needs to be improved.
Box 2: Descriptions of poor and young forests from the Loc Bac SOC 35-year Plan
www.snvredd.comSNV REDD+19
financing, the project would not be financially attractive to investors. This statement should be consolidated by demonstrating that there are barriers to the development of the project in this location, such as institutional or technological barriers, local traditions, ecological conditions, land tenure, etc.; or by illustrating that the project activities are not common practice. If the project cannot demonstrate financial additionality, it must demonstrate that the project faces significant barriers and is not common practice.
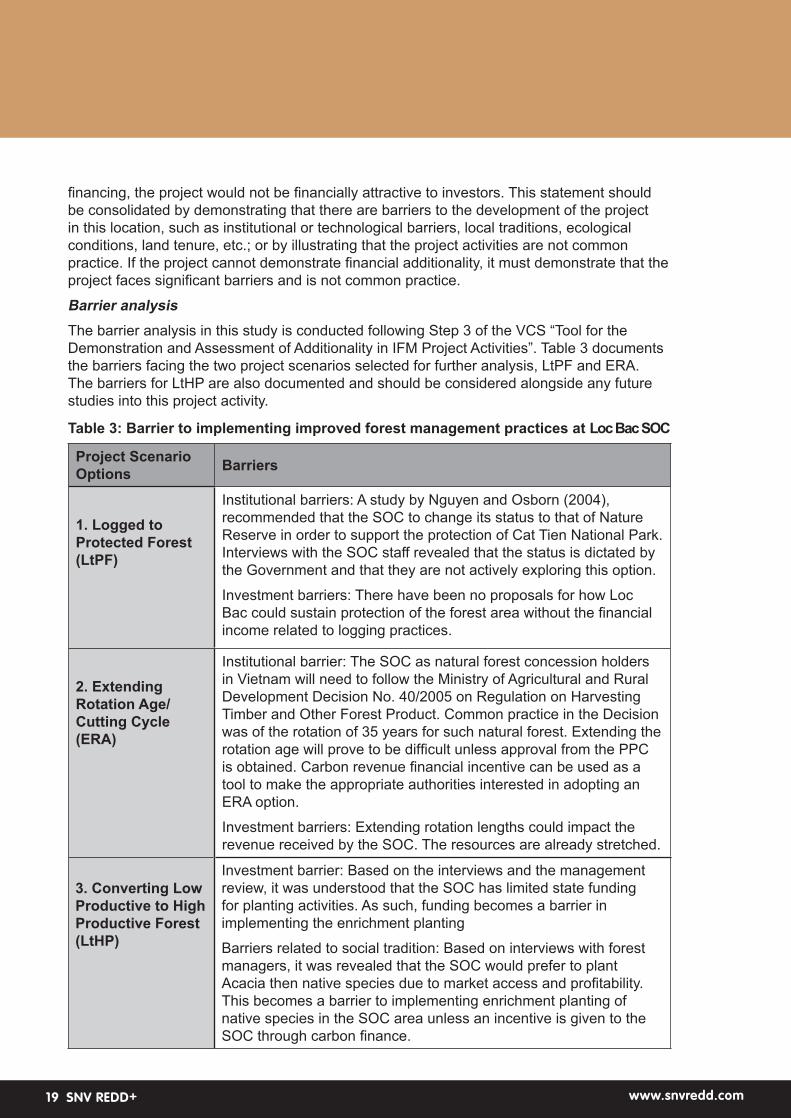
Barrier analysisThe barrier analysis in this study is conducted following Step 3 of the VCS “Tool for the Demonstration and Assessment of Additionality in IFM Project Activities”. Table 3 documents the barriers facing the two project scenarios selected for further analysis, LtPF and ERA. The barriers for LtHP are also documented and should be considered alongside any future studies into this project activity.
Table 3: Barrier to implementing improved forest management practices at Loc Bac SOC
Project Scenario Options Barriers
1. Logged to Protected Forest (LtPF)
Institutional barriers: A study by Nguyen and Osborn (2004), recommended that the SOC to change its status to that of Nature Reserve in order to support the protection of Cat Tien National Park. Interviews with the SOC staff revealed that the status is dictated by the Government and that they are not actively exploring this option.
Investment barriers: There have been no proposals for how Loc Bac could sustain protection of the forest area without the financial income related to logging practices.
2. Extending Rotation Age/Cutting Cycle (ERA)
Institutional barrier: The SOC as natural forest concession holders in Vietnam will need to follow the Ministry of Agricultural and Rural Development Decision No. 40/2005 on Regulation on Harvesting Timber and Other Forest Product. Common practice in the Decision was of the rotation of 35 years for such natural forest. Extending the rotation age will prove to be difficult unless approval from the PPC is obtained. Carbon revenue financial incentive can be used as a tool to make the appropriate authorities interested in adopting an ERA option.
Investment barriers: Extending rotation lengths could impact the revenue received by the SOC. The resources are already stretched.
3. Converting Low Productive to High Productive Forest (LtHP)
Investment barrier: Based on the interviews and the management review, it was understood that the SOC has limited state funding for planting activities. As such, funding becomes a barrier in implementing the enrichment planting
Barriers related to social tradition: Based on interviews with forest managers, it was revealed that the SOC would prefer to plant Acacia then native species due to market access and profitability. This becomes a barrier to implementing enrichment planting of native species in the SOC area unless an incentive is given to the SOC through carbon finance.
www.snvredd.comSNV REDD+20 www.snvredd.comSNV REDD+20
As described above, all alternative management options identified for the SOC face barriers to implementation. Furthermore it should be noted that pine, Acacia, rubber, and coffee plantations were observed in the Lam Dong province landscape. These commercial plantations are generally more profitable, illustrating that this is the most likely scenario to be adopted by the PPC as a change of policy, especially as it would provide an extra source of employment for the communities around the SOC. This adds an extra barrier to the adoption of IFM practices in the Loc Bac SOC and contributes to the argument that a carbon project employing the scenarios presented above would be additional.
ConclusionThe barrier analysis demonstrates that all options for alternative management considered for this study are faced with two or more barriers and would thus be additional according to the VCS rules.
4.4 Step 4 – Calculation of GHG emissions associated with the baseline and project scenarioIn order to determine the GHG emissions from baseline harvesting activities and a protection or extended rotation length project scenario a simple carbon model was developed in Excel. The steps taken to develop this model are explained below.
Step 4.1 Modelling the baseline scenarioUnderlying data
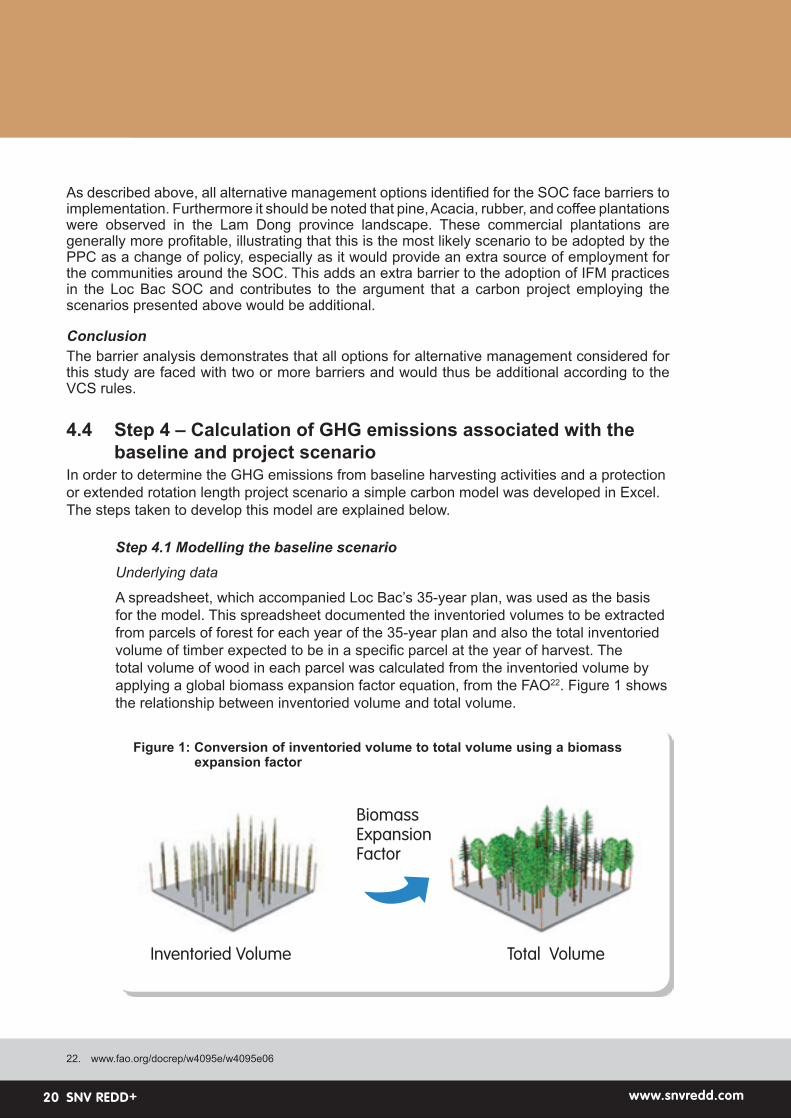
A spreadsheet, which accompanied Loc Bac’s 35-year plan, was used as the basis for the model. This spreadsheet documented the inventoried volumes to be extracted from parcels of forest for each year of the 35-year plan and also the total inventoried volume of timber expected to be in a specific parcel at the year of harvest. The total volume of wood in each parcel was calculated from the inventoried volume by applying a global biomass expansion factor equation, from the FAO22. Figure 1 shows the relationship between inventoried volume and total volume.
22. www.fao.org/docrep/w4095e/w4095e06
Figure 1: Conversion of inventoried volume to total volume using a biomass expansion factor
BiomassExpansionFactor
InventoriedVolume TotalVolume
www.snvredd.comSNV REDD+21
23. http://www.fao.org/docrep/w4095e/w4095e06
Total volume was converted to biomass using a mean wood density value from Asian forests of 0.57 t d.m m3, sourced from the FAO23. The 2011 standing volume (and also biomass) was back-calculated from the volume expected to be present at the year of harvest in the plan. In most cases this was 164 m3 ha-1 which equates to 116 t C ha-1.
Modelling the carbon storage in the forest over time
The change in biomass within each parcel was modelled over a 100 year period based on the following assumptions:
• There is an annual growth rate of 2.6% per annum.
• Stands could reach a maximum volume of 294 m3 ha-1, which equates to 117 t C ha-1.
• When a parcel was due to be harvested according to the plan, the inventoried volume removed was multiplied by a biomass expansion factor of 1.74 to calculate total volume. The value of 1.74 was used because it represents the lowest biomass expansion factor that was derived from the FAO formula.
• The 35-year plan was repeated three times to allow the model to extend to 100 years.
• The model also allowed for there to be a period of accelerated or suppressed growth following a harvest event, to factor in possible impacts of harvesting on stand growth rates.
The following conservative simplifications were made:
• Only the above ground tree carbon was considered. This is a conservative simplification because it is likely that other pools would decrease in the baseline relative to the project scenarios. The above ground tree carbon pool will be by far the most significant pool, and therefore was the only one considered.
• Damage to surrounding trees was ignored.
Accounting for harvested wood productsOne further simplifying assumption of the model is the presumption that all harvested biomass was immediately released into the atmosphere as CO2. This is a simplification because in reality a harvested tree is divided up into many components (some left in the forest, some removed during processing, some ending up as a product), all of which take different amounts of time to decay. VCS rules require that the flow of wood into harvested wood products is modelled, so that the carbon stored long term in the products can be conservatively accounted for and not incorrectly assumed to have been emitted into the atmosphere. The portion of emissions stored as harvested wood products for 100 years was calculated using estimates of on the proportion of harvested timber which ends up in specific wood product categories and decay rates from the approve VCS methodology VM00010 (using data from
www.snvredd.comSNV REDD+22 www.snvredd.comSNV REDD+22
Winjum et al., 2008). It was conservatively assumed that all harvested timber was converted to saw timber (the product which stores the most carbon). Performing the calculations based on these assumptions resulted in 1% of the carbon being stored in products after 100 years.
It should be noted that the model only covers the areas due to be harvested. This is an area of 4,704 ha (an average of 134 ha yr-1), and it is only a sub-set of Loc Bac’s total area of 34,851 ha.
The model, whilst a simplification, broadly follows the VCS approved methodology VM00011 (See section 3.2.1.2.1 ‘Carbon in the merchantable logs using wood density method’) to calculate the carbon extracted due to logging and VM00010 to calculate the harvested wood products (See Equation 7).
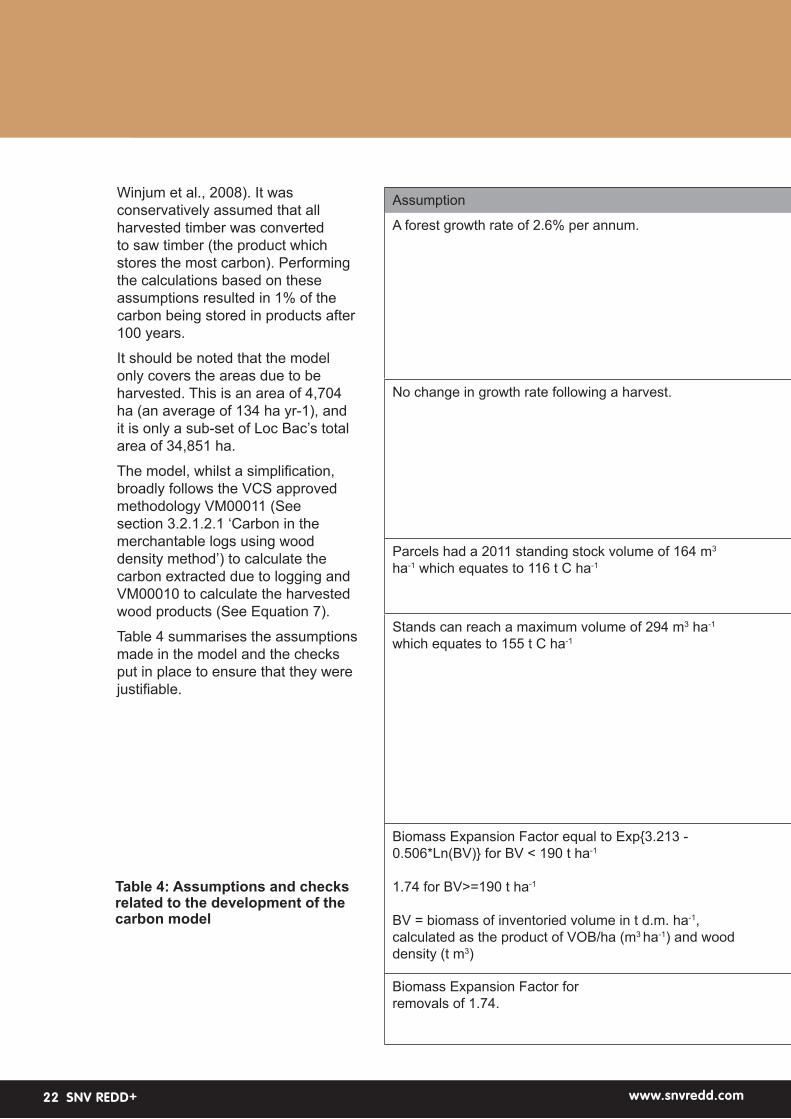
Table 4 summarises the assumptions made in the model and the checks put in place to ensure that they were justifiable.
Table 4: Assumptions and checks related to the development of the carbon model
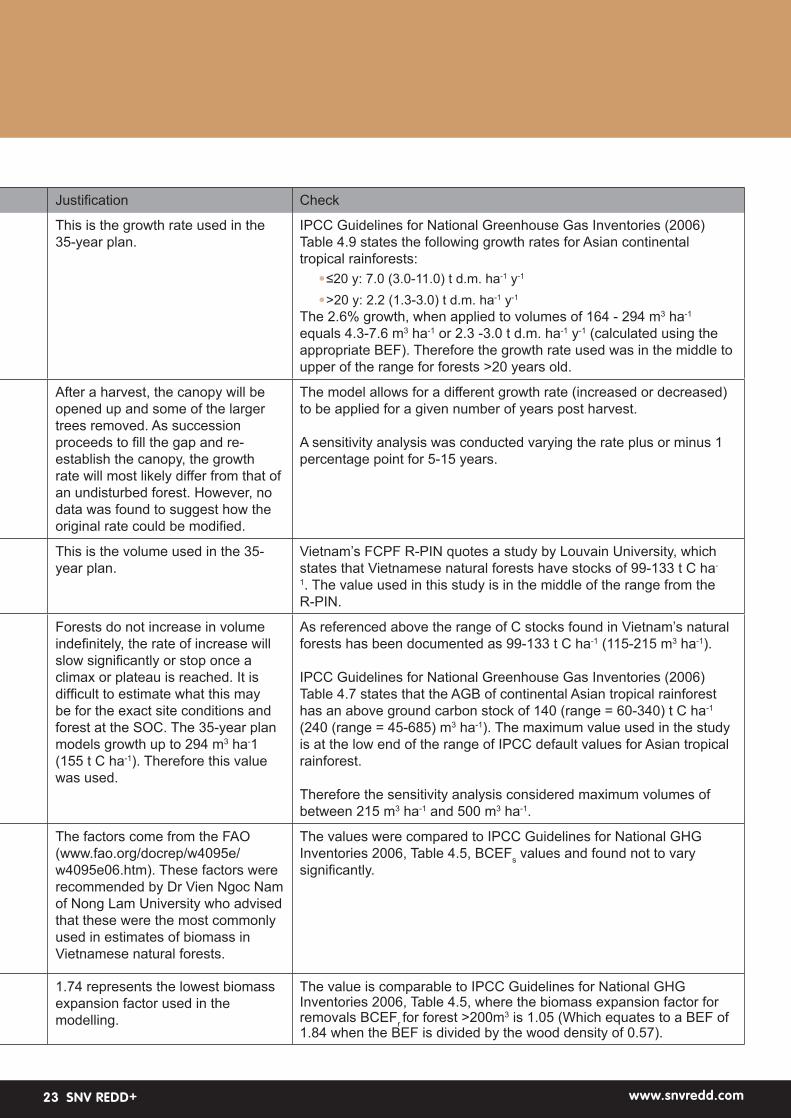
Assumption Justification Check
A forest growth rate of 2.6% per annum. This is the growth rate used in the 35-year plan.
IPCC Guidelines for National Greenhouse Gas Inventories (2006) Table 4.9 states the following growth rates for Asian continental tropical rainforests:
•≤20 y: 7.0 (3.0-11.0) t d.m. ha-1 y-1 •>20 y: 2.2 (1.3-3.0) t d.m. ha-1 y-1
The 2.6% growth, when applied to volumes of 164 - 294 m3 ha-1 equals 4.3-7.6 m3 ha-1 or 2.3 -3.0 t d.m. ha-1 y-1 (calculated using the appropriate BEF). Therefore the growth rate used was in the middle to upper of the range for forests >20 years old.
No change in growth rate following a harvest. After a harvest, the canopy will be opened up and some of the larger trees removed. As succession proceeds to fill the gap and re-establish the canopy, the growth rate will most likely differ from that of an undisturbed forest. However, no data was found to suggest how the original rate could be modified.
The model allows for a different growth rate (increased or decreased) to be applied for a given number of years post harvest.
A sensitivity analysis was conducted varying the rate plus or minus 1 percentage point for 5-15 years.
Parcels had a 2011 standing stock volume of 164 m3 ha-1 which equates to 116 t C ha-1
This is the volume used in the 35-year plan.
Vietnam’s FCPF R-PIN quotes a study by Louvain University, which states that Vietnamese natural forests have stocks of 99-133 t C ha-
1. The value used in this study is in the middle of the range from the R-PIN.
Stands can reach a maximum volume of 294 m3 ha-1 which equates to 155 t C ha-1
Forests do not increase in volume indefinitely, the rate of increase will slow significantly or stop once a climax or plateau is reached. It is difficult to estimate what this may be for the exact site conditions and forest at the SOC. The 35-year plan models growth up to 294 m3 ha-1 (155 t C ha-1). Therefore this value was used.
As referenced above the range of C stocks found in Vietnam’s natural forests has been documented as 99-133 t C ha-1 (115-215 m3 ha-1).
IPCC Guidelines for National Greenhouse Gas Inventories (2006) Table 4.7 states that the AGB of continental Asian tropical rainforest has an above ground carbon stock of 140 (range = 60-340) t C ha-1 (240 (range = 45-685) m3 ha-1). The maximum value used in the study is at the low end of the range of IPCC default values for Asian tropical rainforest.
Therefore the sensitivity analysis considered maximum volumes of between 215 m3 ha-1 and 500 m3 ha-1.
Biomass Expansion Factor equal to Exp{3.213 - 0.506*Ln(BV)} for BV < 190 t ha-1
1.74 for BV>=190 t ha-1
BV = biomass of inventoried volume in t d.m. ha-1, calculated as the product of VOB/ha (m3 ha-1) and wood density (t m3)
The factors come from the FAO (www.fao.org/docrep/w4095e/w4095e06.htm). These factors were recommended by Dr Vien Ngoc Nam of Nong Lam University who advised that these were the most commonly used in estimates of biomass in Vietnamese natural forests.
The values were compared to IPCC Guidelines for National GHG Inventories 2006, Table 4.5, BCEFs values and found not to vary significantly.
Biomass Expansion Factor for removals of 1.74.
1.74 represents the lowest biomass expansion factor used in the modelling.
The value is comparable to IPCC Guidelines for National GHG Inventories 2006, Table 4.5, where the biomass expansion factor for removals BCEFr for forest >200m3 is 1.05 (Which equates to a BEF of 1.84 when the BEF is divided by the wood density of 0.57).
www.snvredd.comSNV REDD+23
Assumption Justification Check
A forest growth rate of 2.6% per annum. This is the growth rate used in the 35-year plan.
IPCC Guidelines for National Greenhouse Gas Inventories (2006) Table 4.9 states the following growth rates for Asian continental tropical rainforests:
•≤20 y: 7.0 (3.0-11.0) t d.m. ha-1 y-1 •>20 y: 2.2 (1.3-3.0) t d.m. ha-1 y-1
The 2.6% growth, when applied to volumes of 164 - 294 m3 ha-1 equals 4.3-7.6 m3 ha-1 or 2.3 -3.0 t d.m. ha-1 y-1 (calculated using the appropriate BEF). Therefore the growth rate used was in the middle to upper of the range for forests >20 years old.
No change in growth rate following a harvest. After a harvest, the canopy will be opened up and some of the larger trees removed. As succession proceeds to fill the gap and re-establish the canopy, the growth rate will most likely differ from that of an undisturbed forest. However, no data was found to suggest how the original rate could be modified.
The model allows for a different growth rate (increased or decreased) to be applied for a given number of years post harvest.
A sensitivity analysis was conducted varying the rate plus or minus 1 percentage point for 5-15 years.
Parcels had a 2011 standing stock volume of 164 m3 ha-1 which equates to 116 t C ha-1
This is the volume used in the 35-year plan.
Vietnam’s FCPF R-PIN quotes a study by Louvain University, which states that Vietnamese natural forests have stocks of 99-133 t C ha-
1. The value used in this study is in the middle of the range from the R-PIN.
Stands can reach a maximum volume of 294 m3 ha-1 which equates to 155 t C ha-1
Forests do not increase in volume indefinitely, the rate of increase will slow significantly or stop once a climax or plateau is reached. It is difficult to estimate what this may be for the exact site conditions and forest at the SOC. The 35-year plan models growth up to 294 m3 ha-1 (155 t C ha-1). Therefore this value was used.
As referenced above the range of C stocks found in Vietnam’s natural forests has been documented as 99-133 t C ha-1 (115-215 m3 ha-1).
IPCC Guidelines for National Greenhouse Gas Inventories (2006) Table 4.7 states that the AGB of continental Asian tropical rainforest has an above ground carbon stock of 140 (range = 60-340) t C ha-1 (240 (range = 45-685) m3 ha-1). The maximum value used in the study is at the low end of the range of IPCC default values for Asian tropical rainforest.
Therefore the sensitivity analysis considered maximum volumes of between 215 m3 ha-1 and 500 m3 ha-1.
Biomass Expansion Factor equal to Exp{3.213 - 0.506*Ln(BV)} for BV < 190 t ha-1
1.74 for BV>=190 t ha-1
BV = biomass of inventoried volume in t d.m. ha-1, calculated as the product of VOB/ha (m3 ha-1) and wood density (t m3)
The factors come from the FAO (www.fao.org/docrep/w4095e/w4095e06.htm). These factors were recommended by Dr Vien Ngoc Nam of Nong Lam University who advised that these were the most commonly used in estimates of biomass in Vietnamese natural forests.
The values were compared to IPCC Guidelines for National GHG Inventories 2006, Table 4.5, BCEFs values and found not to vary significantly.
Biomass Expansion Factor for removals of 1.74.
1.74 represents the lowest biomass expansion factor used in the modelling.
The value is comparable to IPCC Guidelines for National GHG Inventories 2006, Table 4.5, where the biomass expansion factor for removals BCEFr for forest >200m3 is 1.05 (Which equates to a BEF of 1.84 when the BEF is divided by the wood density of 0.57).
www.snvredd.comSNV REDD+24 www.snvredd.comSNV REDD+24
Step 4.2 Modelling the project scenariosFor the project scenario of no logging (LtPF), the harvest events were removed from the model, while everything else (growth rates and maximum volumes) remained the same. To model an extended rotation length, it was assumed that the harvests were spread out over a two-year period, in effect doubling the rotation cycle to 70 years.
Step 4.3 Calculation of the net GHG benefit of implementing the project scenariosIn order to calculate the net GHG benefit of implementing the project scenarios in any given year, the carbon stored in the forest each year under the baseline scenario (plus the carbon stored in harvested wood products) was subtracted from that stored under the project scenario. The difference constituted extra carbon that was in the atmosphere. Due to the fluctuations in carbon and atmospheric stocks associated with projects that involve harvesting, or the avoidance of harvesting, the VCS has a rule which states, “projects with harvesting activities shall not be issued GHG credits above the long-term average GHG benefit maintained by the project” (VCS AFOLU Requirements 3.1.8). Therefore, the long term average benefit was calculated from the annual benefits over the project lifetime.
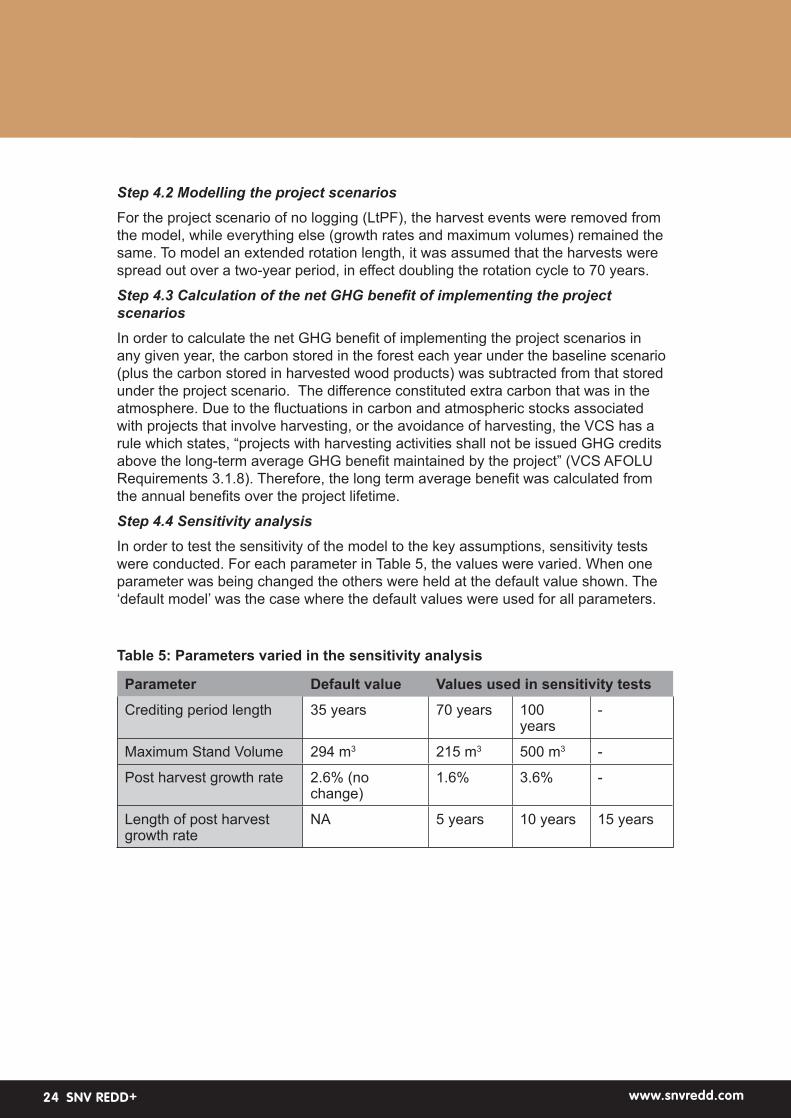
Step 4.4 Sensitivity analysisIn order to test the sensitivity of the model to the key assumptions, sensitivity tests were conducted. For each parameter in Table 5, the values were varied. When one parameter was being changed the others were held at the default value shown. The ‘default model’ was the case where the default values were used for all parameters.
Table 5: Parameters varied in the sensitivity analysis
Parameter Default value Values used in sensitivity tests
Crediting period length 35 years 70 years 100 years
-
Maximum Stand Volume 294 m3 215 m3 500 m3 -
Post harvest growth rate 2.6% (no change)
1.6% 3.6% -
Length of post harvest growth rate
NA 5 years 10 years 15 years
www.snvredd.comSNV REDD+25
4.5 Step5-DeterminationofthenetGHGbenefitusingthecarbonmodel
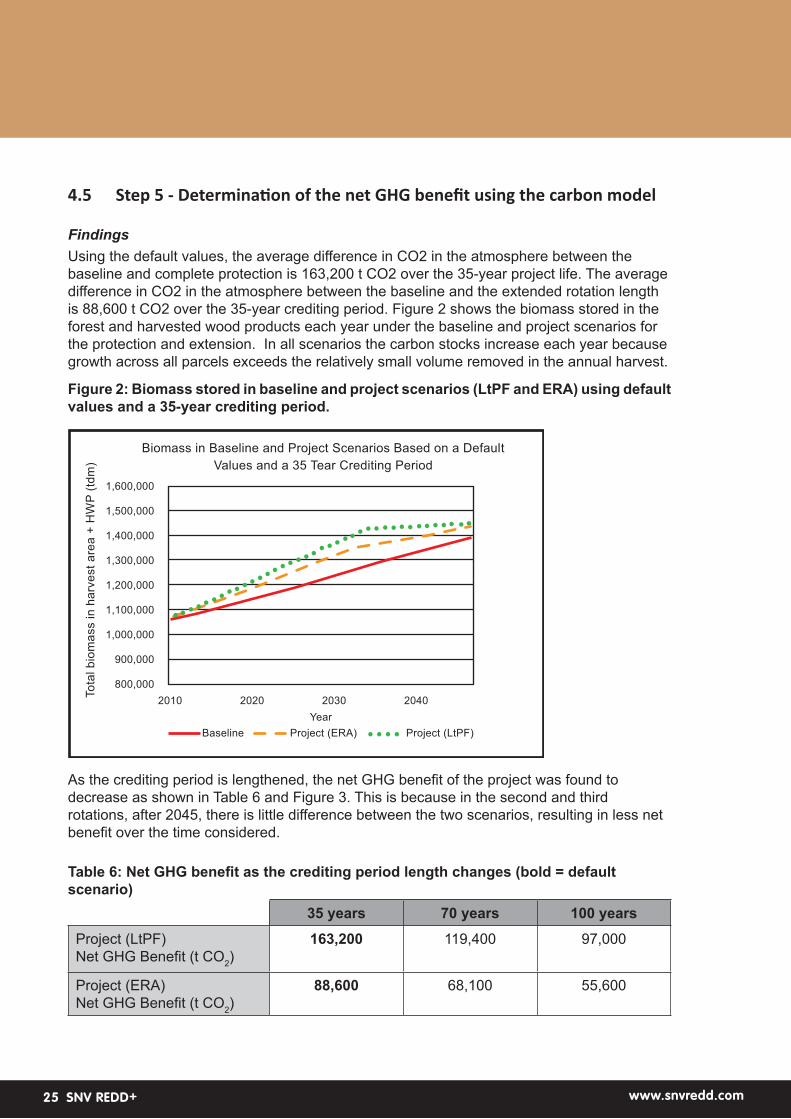
FindingsUsing the default values, the average difference in CO2 in the atmosphere between the baseline and complete protection is 163,200 t CO2 over the 35-year project life. The average difference in CO2 in the atmosphere between the baseline and the extended rotation length is 88,600 t CO2 over the 35-year crediting period. Figure 2 shows the biomass stored in the forest and harvested wood products each year under the baseline and project scenarios for the protection and extension. In all scenarios the carbon stocks increase each year because growth across all parcels exceeds the relatively small volume removed in the annual harvest.
Figure 2: Biomass stored in baseline and project scenarios (LtPF and ERA) using default values and a 35-year crediting period.
Biomass in Baseline and Project Scenarios Based on a Default
Values and a 35 Tear Crediting Period
1,600,000
1,500,000
1,400,000
1,300,000
1,200,000
1,100,000
1,000,000
900,000
800,000
2010 2020 2030
Year
2040 To
tal b
iom
ass in
ha
rve
st
are
a +
HW
P (
tdm
)
Baseline Project (ERA) Project (LtPF)
As the crediting period is lengthened, the net GHG benefit of the project was found to decrease as shown in Table 6 and Figure 3. This is because in the second and third rotations, after 2045, there is little difference between the two scenarios, resulting in less net benefit over the time considered.
Table 6: Net GHG benefit as the crediting period length changes (bold = default scenario)
35 years 70 years 100 years
Project (LtPF)Net GHG Benefit (t CO2)
163,200 119,400 97,000
Project (ERA)Net GHG Benefit (t CO2)
88,600 68,100 55,600
www.snvredd.comSNV REDD+26 www.snvredd.comSNV REDD+26
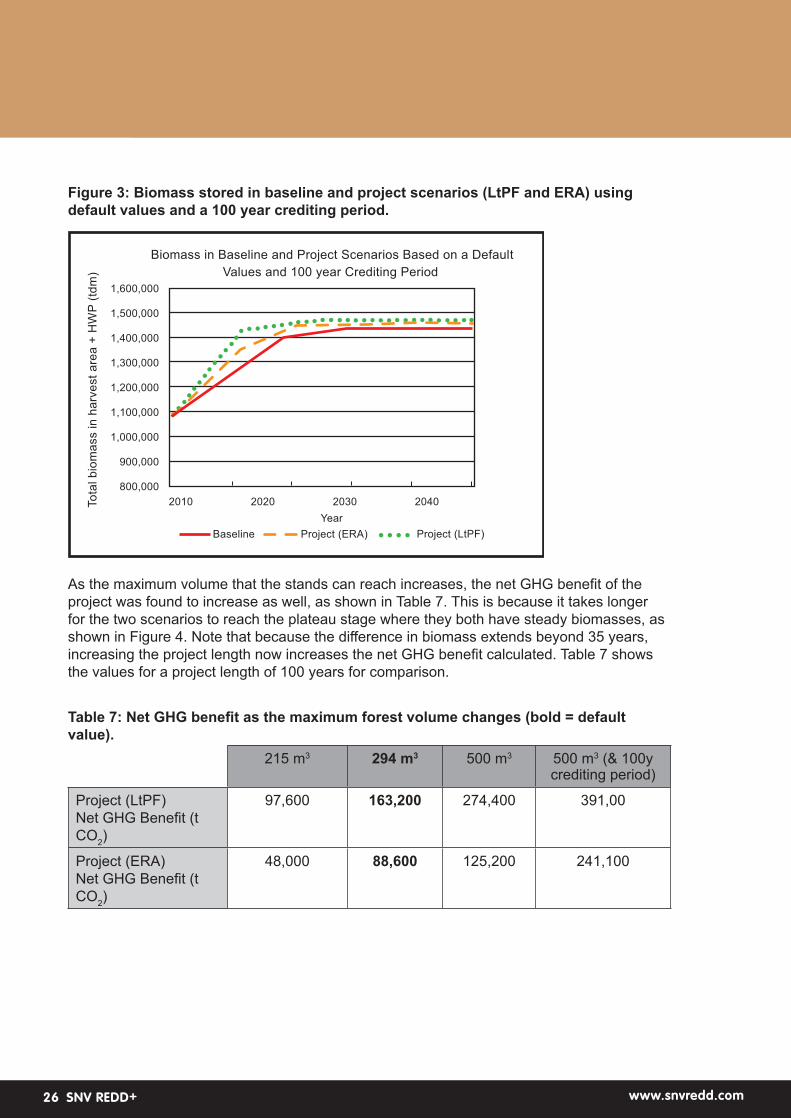
Figure 3: Biomass stored in baseline and project scenarios (LtPF and ERA) using default values and a 100 year crediting period.
Biomass in Baseline and Project Scenarios Based on a Default
Values and 100 year Crediting Period
To
tal b
iom
ass in
ha
rve
st
are
a +
HW
P (
tdm
)
1,600,000
1,500,000
1,400,000
1,300,000
1,200,000
1,100,000
1,000,000
900,000
800,000
2010 2020 2030
Year
2040
Baseline Project (ERA) Project (LtPF)
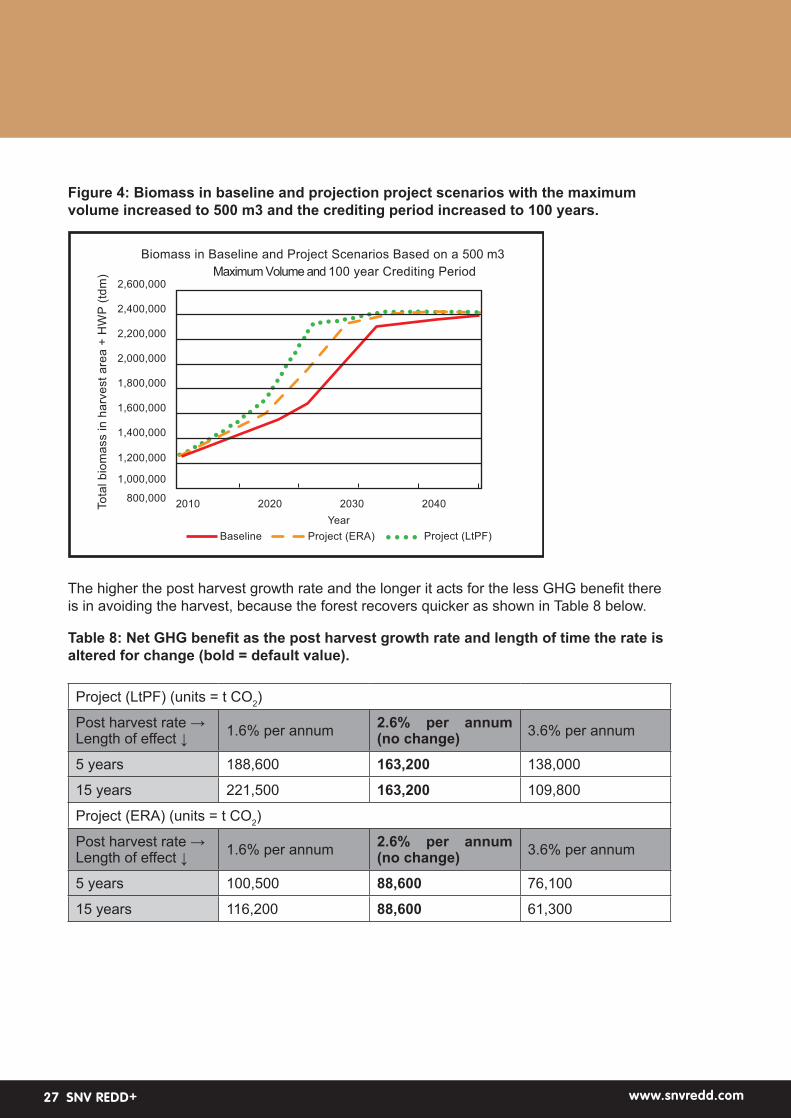
As the maximum volume that the stands can reach increases, the net GHG benefit of the project was found to increase as well, as shown in Table 7. This is because it takes longer for the two scenarios to reach the plateau stage where they both have steady biomasses, as shown in Figure 4. Note that because the difference in biomass extends beyond 35 years, increasing the project length now increases the net GHG benefit calculated. Table 7 shows the values for a project length of 100 years for comparison.
Table 7: Net GHG benefit as the maximum forest volume changes (bold = default value).
215 m3 294 m3 500 m3 500 m3 (& 100y crediting period)
Project (LtPF)Net GHG Benefit (t CO2)
97,600 163,200 274,400 391,00
Project (ERA)Net GHG Benefit (t CO2)
48,000 88,600 125,200 241,100
www.snvredd.comSNV REDD+27
Figure 4: Biomass in baseline and projection project scenarios with the maximum volume increased to 500 m3 and the crediting period increased to 100 years.
Biomass in Baseline and Project Scenarios Based on a 500 m3
Maximum Volume and 100 year Crediting Period
To
tal b
iom
ass in
ha
rve
st
are
a +
HW
P (
tdm
)
2,600,000
2,400,000
2,200,000
2,000,000
1,800,000
1,600,000
1,400,000
1,200,000
800,0002010 2020 2030
Year
2040
Baseline Project (ERA)
1,000,000
Project (LtPF)
The higher the post harvest growth rate and the longer it acts for the less GHG benefit there is in avoiding the harvest, because the forest recovers quicker as shown in Table 8 below.
Table 8: Net GHG benefit as the post harvest growth rate and length of time the rate is altered for change (bold = default value).
Project (LtPF) (units = t CO2)
Post harvest rate →Length of effect ↓ 1.6% per annum 2.6% per annum
(no change) 3.6% per annum
5 years 188,600 163,200 138,000
15 years 221,500 163,200 109,800
Project (ERA) (units = t CO2)
Post harvest rate →Length of effect ↓ 1.6% per annum 2.6% per annum
(no change) 3.6% per annum
5 years 100,500 88,600 76,100
15 years 116,200 88,600 61,300
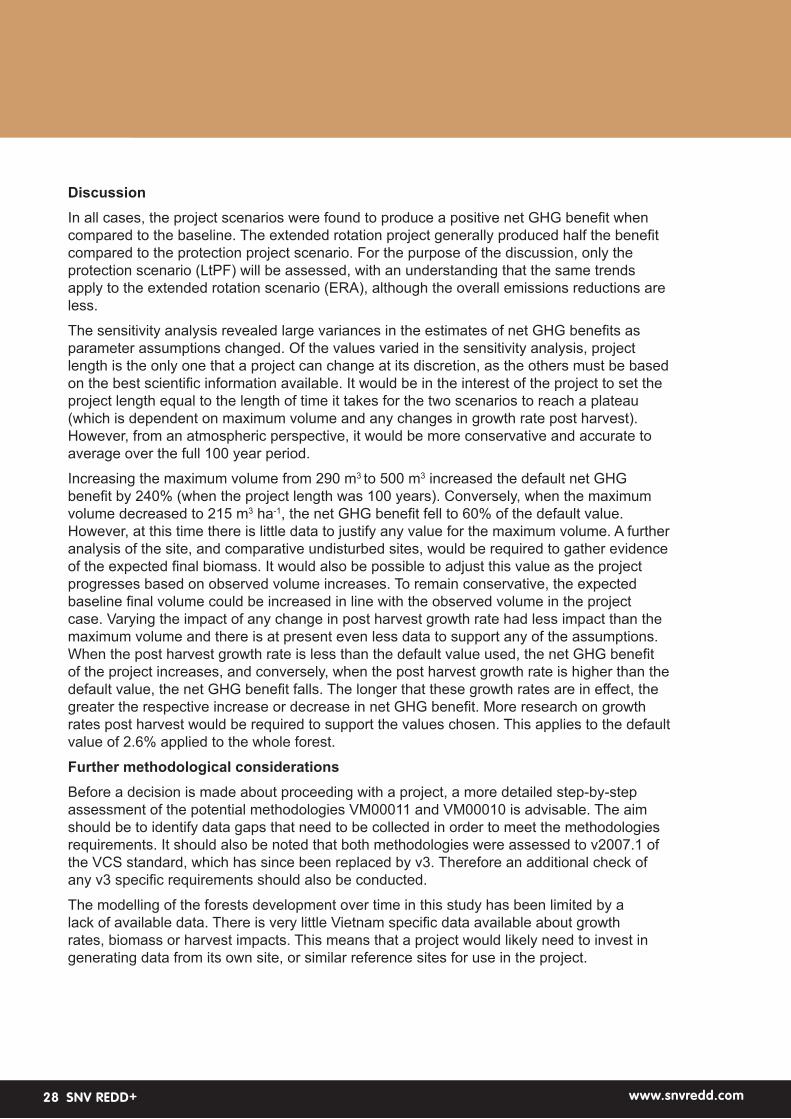
www.snvredd.comSNV REDD+28 www.snvredd.comSNV REDD+28
DiscussionIn all cases, the project scenarios were found to produce a positive net GHG benefit when compared to the baseline. The extended rotation project generally produced half the benefit compared to the protection project scenario. For the purpose of the discussion, only the protection scenario (LtPF) will be assessed, with an understanding that the same trends apply to the extended rotation scenario (ERA), although the overall emissions reductions are less.
The sensitivity analysis revealed large variances in the estimates of net GHG benefits as parameter assumptions changed. Of the values varied in the sensitivity analysis, project length is the only one that a project can change at its discretion, as the others must be based on the best scientific information available. It would be in the interest of the project to set the project length equal to the length of time it takes for the two scenarios to reach a plateau (which is dependent on maximum volume and any changes in growth rate post harvest). However, from an atmospheric perspective, it would be more conservative and accurate to average over the full 100 year period.
Increasing the maximum volume from 290 m3 to 500 m3 increased the default net GHG benefit by 240% (when the project length was 100 years). Conversely, when the maximum volume decreased to 215 m3 ha-1, the net GHG benefit fell to 60% of the default value. However, at this time there is little data to justify any value for the maximum volume. A further analysis of the site, and comparative undisturbed sites, would be required to gather evidence of the expected final biomass. It would also be possible to adjust this value as the project progresses based on observed volume increases. To remain conservative, the expected baseline final volume could be increased in line with the observed volume in the project case. Varying the impact of any change in post harvest growth rate had less impact than the maximum volume and there is at present even less data to support any of the assumptions. When the post harvest growth rate is less than the default value used, the net GHG benefit of the project increases, and conversely, when the post harvest growth rate is higher than the default value, the net GHG benefit falls. The longer that these growth rates are in effect, the greater the respective increase or decrease in net GHG benefit. More research on growth rates post harvest would be required to support the values chosen. This applies to the default value of 2.6% applied to the whole forest.
Further methodological considerationsBefore a decision is made about proceeding with a project, a more detailed step-by-step assessment of the potential methodologies VM00011 and VM00010 is advisable. The aim should be to identify data gaps that need to be collected in order to meet the methodologies requirements. It should also be noted that both methodologies were assessed to v2007.1 of the VCS standard, which has since been replaced by v3. Therefore an additional check of any v3 specific requirements should also be conducted.
The modelling of the forests development over time in this study has been limited by a lack of available data. There is very little Vietnam specific data available about growth rates, biomass or harvest impacts. This means that a project would likely need to invest in generating data from its own site, or similar reference sites for use in the project.
www.snvredd.comSNV REDD+29
4.6 Step 6 – Accounting for leakageUnder the VCS, the net GHG emissions reductions made within a project area do not equal the number of carbon credits that can be claimed by a project. Two main deductions must be made when converting the net emissions reductions to saleable Verified Carbon Units (VCUs). The first is a deduction for leakage and the second is a deduction for the permanence buffer (see Step 7).
Leakage occurs from carbon projects when actions to reduce emissions within the project area lead to an increase in emissions outside of the project area. In projects where harvesting volumes are reduced, leakage can occur when the logging agents move to another area that would otherwise not have been logged (known as activity shifting leakage), or alternatively when agents elsewhere in the timber market make up for the reduced supply by increasing supply (known as market leakage). In Vietnam, since the timber market is heavily regulated through quotas passed down from the central Government, the project could be designed in a way that provides assurance that reductions in supply from one SOC do not result in increased quotas elsewhere. Getting this assurance in practice, however, may be difficult. International leakage, with demand being met from other countries, may be a possibility, although under VCS rules it does not need to be considered. For the purpose of this study, it is assumed that the leakage risk could be managed. However, if assurances from the Government could not be sourced, then the market leakage deduction could be between 20% and 70% of net emissions reductions. Deductions at the high or medium ends of that range would almost certainly render the project infeasible.
Therefore, for the purpose of the financial model 20% leakage was assumed.
4.7 Step 7 – Accounting for non-permanenceThere is a risk that even if a project is successful in preventing emissions from logging in the short term, the carbon stored in the trees could be released at some point in the future due to unauthorized or unplanned logging, deforestation, fire, pest, etc. This possibility is known as the risk of non-permanence. The VCS’s approach to handling non-permanence is to require each project to conduct a non-permanence risk assessment and then deposit a certain percentage of credits into a pooled buffer account based on the risk rating they receive. These credits can be recovered to some extent by a project over time, subject to performance and maintenance/improvement of the project’s risk rating. Therefore, the more risky a project is perceived to be, the more buffer credits it must surrender, which may impact financial viability. Buffer contributions are typically 10-40% of credits issued.
The following preliminary risk assessment follows the VCS “AFOLU Non-Permanence Risk Tool, Version 3, 2011”.
Internal risksProject Management: The Loc Bac SOC achieves a low risk rating for this category because it is a natural forest, has a low encroachment rate by outside actors and has a management team with significant experience in forestry and maintaining a presence on the site. This risk rating could be improved by having a project management team with experience in developing AFOLU projects, and by the development of an adaptive management plan for the SOC.
www.snvredd.comSNV REDD+30 www.snvredd.comSNV REDD+30
Financial Viability and Opportunity Costs: These sections could not be assessed due to a lack of available information on the profitability of current operations.
Project Longevity: The Loc Bac SOC is required by the PPC to continue its activities, thus this section would achieve a low risk rating if the PPC approved the conversion of the SOC into a carbon project. It must be noted that a project with longevity of less than 30 years, would fail the risk assessment and would not be eligible for crediting.
External risksLand Tenure: The project activity is considered higher risk as the land is government owned and the SOC only has a lease for their activities. However, this is compensated by the lack of disputes over land tenure and ownership. Overall, the project has a low risk rating in this category, but could be further improved by having a legally binding commitment to continue management practices that protect carbon stocks over the length of the project’s crediting period.Community Engagement: There are no households living within the project area and the only households depending on the project area (for firewood and NTFP collection) are Loc Bac and Loc Bao. This predisposes the project to a low risk rating for this category, as only these 2 communes would have to be consulted about the project. Having the project certified under the CCB Standards, and thereby demonstrating its net positive impact on communities, could further reduce the risk rating.Political Risk: The project obtains a low risk rating as it is in a country with an established DNA, has a registered CDM A/R project and is in the process of implementing REDD+ Readiness and other activities. However, this is counteracted by a medium risk rating for governance due to the governance score average over the last 5 years of 0.48.
Natural risksThe project obtains a low risk rating in this category because the area is a natural forest and thus has a low risk of pest and disease outbreaks. Furthermore, the likelihood of extreme weather and geological events is also low. Based on the Forest Protection Department (MARD) 2010 Annual Report, there were only two cases of fires, which affected only 26 ha of natural forest, in the Lam Dong province.
ConclusionOverall, based on the information available, the Loc Bac SOC appears to be a low risk carbon project.
The values that were determined for the different risk categories summed to an overall risk factor of 4 for the Loc Bac SOC. However, the risk factor for several categories could not be estimated due to a lack of available data, especially regarding the financial viability, the opportunity cost of the project and the potential for community engagement. Regardless of the global risk rating a project achieved, for the purposes of VCS the minimum risk rating must be 10%. To determine the number of buffer credits that must be deposited in the AFOLU pooled buffer account, the overall risk rating shall be converted to a percentage (e.g. an overall risk rating of 35 converts to 35%) and this percentage is multiplied by the net change in the project’s carbon stocks.
Therefore, based on the analysis above, a value of 10% was used in the financial calculations for the project.
www.snvredd.comSNV REDD+31
4.8 Step 8 - Calculation of financial implications of the project scenarios
Once the net emissions reductions from the project scenario had been calculated and deductions for leakage and non-permanence made, the revenues from potential carbon credit sales was estimated.
Step 8.1 Calculating project scenario revenuesRevenue from VCU sales
The financial model made deductions for leakage and permanence, and then multiplied the VCUs earned by the price that was expected to be received. Price information for VCUs from forestry projects is difficult to obtain due to the scarcity of verified projects and the many ways in which deals around the sales of credits can be constructed. For example, the simplest way is to sell a credit after it has been created, however this can leave projects with a funding gap. As such, credits often can be forward sold at a discounted rate, which reflects the expected date of delivery and perceived risk. Buyers also expect a discount when buying large volumes of VCUs. The average volume weighted price of a carbon credit from an improved forest management project in 2010 was 6 USD per ton (Hamilton et al, 2011). Whilst registration as a VCS project would be expected to increase the value of any credits derived, this is hard to quantify since the range of prices paid for VCU credits is 1 - 30 USD. For the purpose of this assessment, it is assumed that a price of 6 USD per VCU could be achieved. An optimistic scenario of 10 USD per VCU was also considered, in the hope that demand for credits increases or that the project would be able to market the credits well. The model also applies sales tax and registration fees to credits.
For the purpose of this study, financial analysis was only conducted on the LtPF protection scenario. ERA scenario is very similar in terms of costs, but would achieve approximately half of the credits.
Step 8.2 Calculating project scenario costsIndicative costs of a project
A carbon project would impose four main types of costs on the developers (the SOC). Firstly, there is the lost income from logging activities and processing. Secondly, there are the costs associated with implementing any additional necessary activities, such as forest protection. Thirdly, there are the costs associated with building and running a carbon project (project design, inventory, validation, verification, monitoring). Finally, there are market transaction costs (brokerage, marketing, insurance, etc.).
It is understood from discussions with the SOC management that due to the way the SOC operates as a manager of the land, rather than as the harvester, little profit is made from the harvesting operations. The SOC’s allotted harvesting quota is divided into packages, which are put out to tender. The SOC can bid on these tenders, but is not often successful. The SOC makes no profit on tenders won by other logging
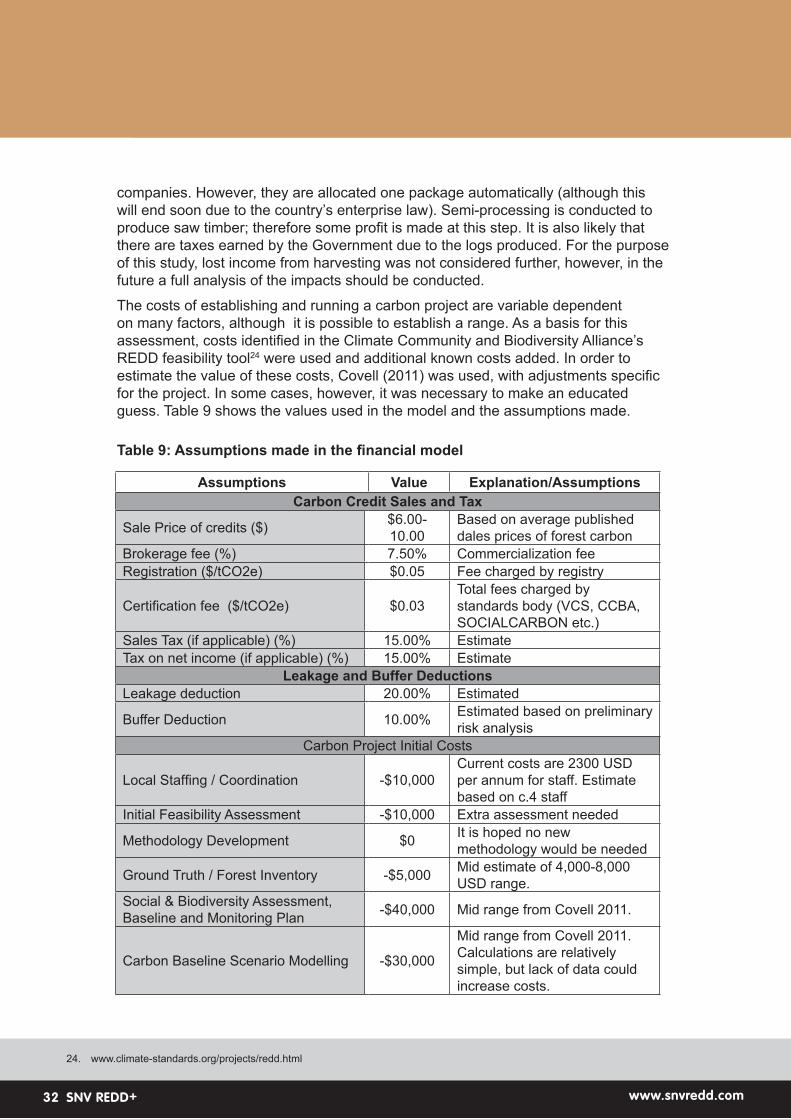
www.snvredd.comSNV REDD+32 www.snvredd.comSNV REDD+32
Assumptions Value Explanation/AssumptionsCarbon Credit Sales and Tax
Sale Price of credits ($) $6.00-10.00
Based on average published dales prices of forest carbon
Brokerage fee (%) 7.50% Commercialization feeRegistration ($/tCO2e) $0.05 Fee charged by registry
Certification fee ($/tCO2e) $0.03Total fees charged by standards body (VCS, CCBA, SOCIALCARBON etc.)
Sales Tax (if applicable) (%) 15.00% EstimateTax on net income (if applicable) (%) 15.00% Estimate
Leakage and Buffer DeductionsLeakage deduction 20.00% Estimated
Buffer Deduction 10.00% Estimated based on preliminary risk analysis
Carbon Project Initial Costs
Local Staffing / Coordination -$10,000Current costs are 2300 USD per annum for staff. Estimate based on c.4 staff
Initial Feasibility Assessment -$10,000 Extra assessment needed
Methodology Development $0 It is hoped no new methodology would be needed
Ground Truth / Forest Inventory -$5,000 Mid estimate of 4,000-8,000 USD range.
Social & Biodiversity Assessment, Baseline and Monitoring Plan -$40,000 Mid range from Covell 2011.
Carbon Baseline Scenario Modelling -$30,000
Mid range from Covell 2011. Calculations are relatively simple, but lack of data could increase costs.
companies. However, they are allocated one package automatically (although this will end soon due to the country’s enterprise law). Semi-processing is conducted to produce saw timber; therefore some profit is made at this step. It is also likely that there are taxes earned by the Government due to the logs produced. For the purpose of this study, lost income from harvesting was not considered further, however, in the future a full analysis of the impacts should be conducted.
The costs of establishing and running a carbon project are variable dependent on many factors, although it is possible to establish a range. As a basis for this assessment, costs identified in the Climate Community and Biodiversity Alliance’s REDD feasibility tool24 were used and additional known costs added. In order to estimate the value of these costs, Covell (2011) was used, with adjustments specific for the project. In some cases, however, it was necessary to make an educated guess. Table 9 shows the values used in the model and the assumptions made.
Table 9: Assumptions made in the financial model
24. www.climate-standards.org/projects/redd.html
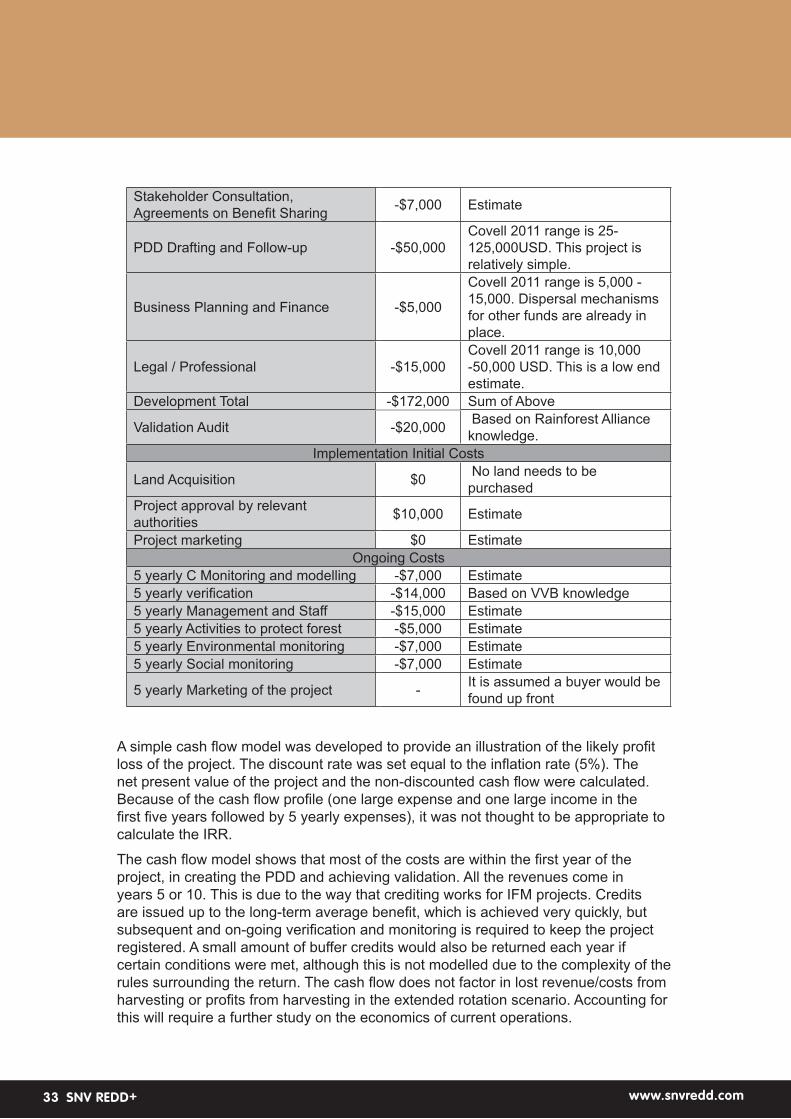
www.snvredd.comSNV REDD+33
Stakeholder Consultation, Agreements on Benefit Sharing -$7,000 Estimate
PDD Drafting and Follow-up -$50,000Covell 2011 range is 25-125,000USD. This project is relatively simple.
Business Planning and Finance -$5,000
Covell 2011 range is 5,000 - 15,000. Dispersal mechanisms for other funds are already in place.
Legal / Professional -$15,000Covell 2011 range is 10,000 -50,000 USD. This is a low end estimate.
Development Total -$172,000 Sum of Above
Validation Audit -$20,000 Based on Rainforest Alliance knowledge.
Implementation Initial Costs
Land Acquisition $0 No land needs to be purchased
Project approval by relevant authorities $10,000 Estimate
Project marketing $0 EstimateOngoing Costs
5 yearly C Monitoring and modelling -$7,000 Estimate5 yearly verification -$14,000 Based on VVB knowledge5 yearly Management and Staff -$15,000 Estimate5 yearly Activities to protect forest -$5,000 Estimate5 yearly Environmental monitoring -$7,000 Estimate5 yearly Social monitoring -$7,000 Estimate
5 yearly Marketing of the project - It is assumed a buyer would be found up front
A simple cash flow model was developed to provide an illustration of the likely profit loss of the project. The discount rate was set equal to the inflation rate (5%). The net present value of the project and the non-discounted cash flow were calculated. Because of the cash flow profile (one large expense and one large income in the first five years followed by 5 yearly expenses), it was not thought to be appropriate to calculate the IRR.
The cash flow model shows that most of the costs are within the first year of the project, in creating the PDD and achieving validation. All the revenues come in years 5 or 10. This is due to the way that crediting works for IFM projects. Credits are issued up to the long-term average benefit, which is achieved very quickly, but subsequent and on-going verification and monitoring is required to keep the project registered. A small amount of buffer credits would also be returned each year if certain conditions were met, although this is not modelled due to the complexity of the rules surrounding the return. The cash flow does not factor in lost revenue/costs from harvesting or profits from harvesting in the extended rotation scenario. Accounting for this will require a further study on the economics of current operations.
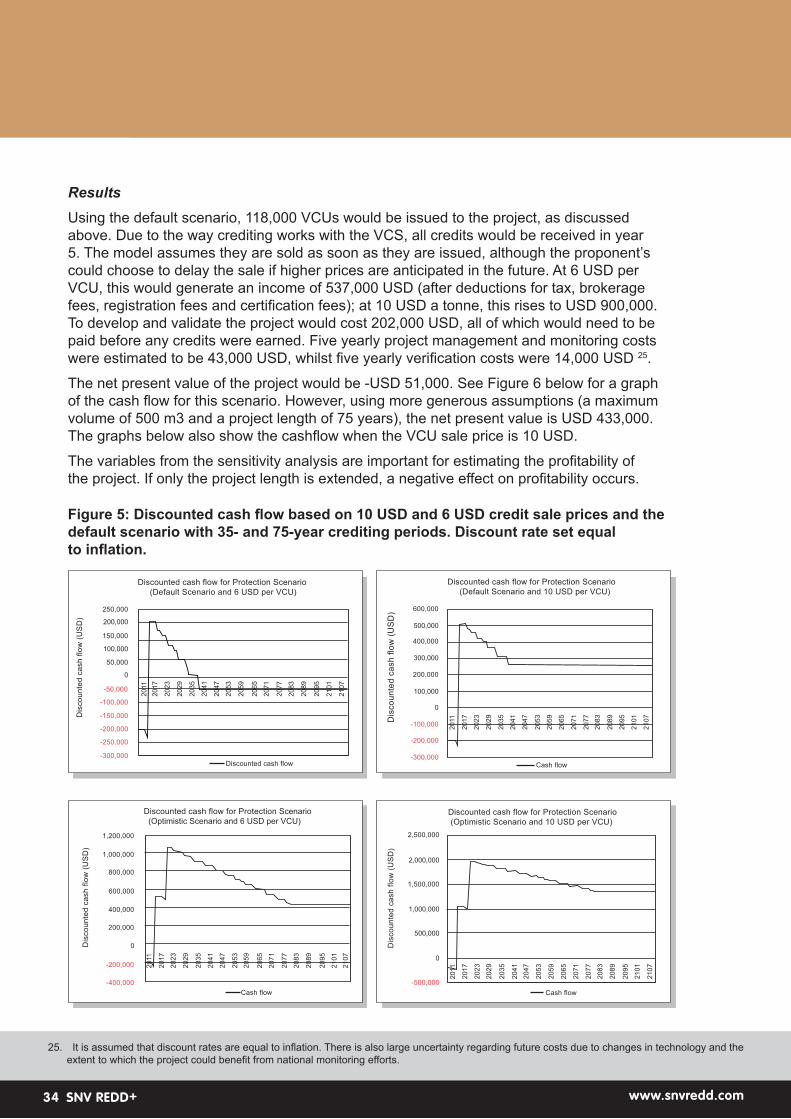
www.snvredd.comSNV REDD+34 www.snvredd.comSNV REDD+34
ResultsUsing the default scenario, 118,000 VCUs would be issued to the project, as discussed above. Due to the way crediting works with the VCS, all credits would be received in year 5. The model assumes they are sold as soon as they are issued, although the proponent’s could choose to delay the sale if higher prices are anticipated in the future. At 6 USD per VCU, this would generate an income of 537,000 USD (after deductions for tax, brokerage fees, registration fees and certification fees); at 10 USD a tonne, this rises to USD 900,000. To develop and validate the project would cost 202,000 USD, all of which would need to be paid before any credits were earned. Five yearly project management and monitoring costs were estimated to be 43,000 USD, whilst five yearly verification costs were 14,000 USD 25.
The net present value of the project would be -USD 51,000. See Figure 6 below for a graph of the cash flow for this scenario. However, using more generous assumptions (a maximum volume of 500 m3 and a project length of 75 years), the net present value is USD 433,000. The graphs below also show the cashflow when the VCU sale price is 10 USD.
The variables from the sensitivity analysis are important for estimating the profitability of the project. If only the project length is extended, a negative effect on profitability occurs.
25. It is assumed that discount rates are equal to inflation. There is also large uncertainty regarding future costs due to changes in technology and the extent to which the project could benefit from national monitoring efforts.
Discounted cash flow for Protection Scenario
(Default Scenario and 6 USD per VCU)
Dis
co
un
ted
ca
sh
flo
w (
US
D)
250,000
200,000
150,000
100,000
50,000
-150,000
-200,000
Discounted cash flow
20
17
20
11
20
23
20
29
20
35
20
41
20
53
20
65
20
59
20
47
20
71
20
77
20
83
21
07
21
01
20
89
20
95
0
-100,000
-50,000
-300,000
-250,000
Discounted cash flow for Protection Scenario
(Default Scenario and 10 USD per VCU)
Dis
co
un
ted
ca
sh
flo
w (
US
D) 600,000
500,000
400,000
300,000
200,000
-100,000
-200,000
Cash flow
20
17
20
11
20
23
20
29
20
35
20
41
20
53
20
65
20
59
20
47
20
71
20
77
20
83
21
07
21
01
20
89
20
95
100,000
-300,000
0
Discounted cash flow for Protection Scenario
(Optimistic Scenario and 6 USD per VCU)
Dis
co
un
ted
ca
sh
flo
w (
US
D)
1,200,000
1,000,000
800,000
600,000
400,000
200,000
0
-200,000
-400,000
Cash flow
20
17
20
11
20
23
20
29
20
35
20
41
20
53
20
65
20
59
20
47
20
71
20
77
20
83
21
07
21
01
20
89
20
95
Discounted cash flow for Protection Scenario
(Optimistic Scenario and 10 USD per VCU)
Dis
co
un
ted
ca
sh
flo
w (
US
D)
2,500,000
2,000,000
1,500,000
1,000,000
Cash flow
20
17
20
11
20
23
20
29
20
35
20
41
20
53
20
65
20
59
20
47
20
71
20
77
20
83
21
07
21
01
20
89
20
95
-500,000
0
500,000
Figure 5: Discounted cash flow based on 10 USD and 6 USD credit sale prices and the default scenario with 35- and 75-year crediting periods. Discount rate set equal to inflation.
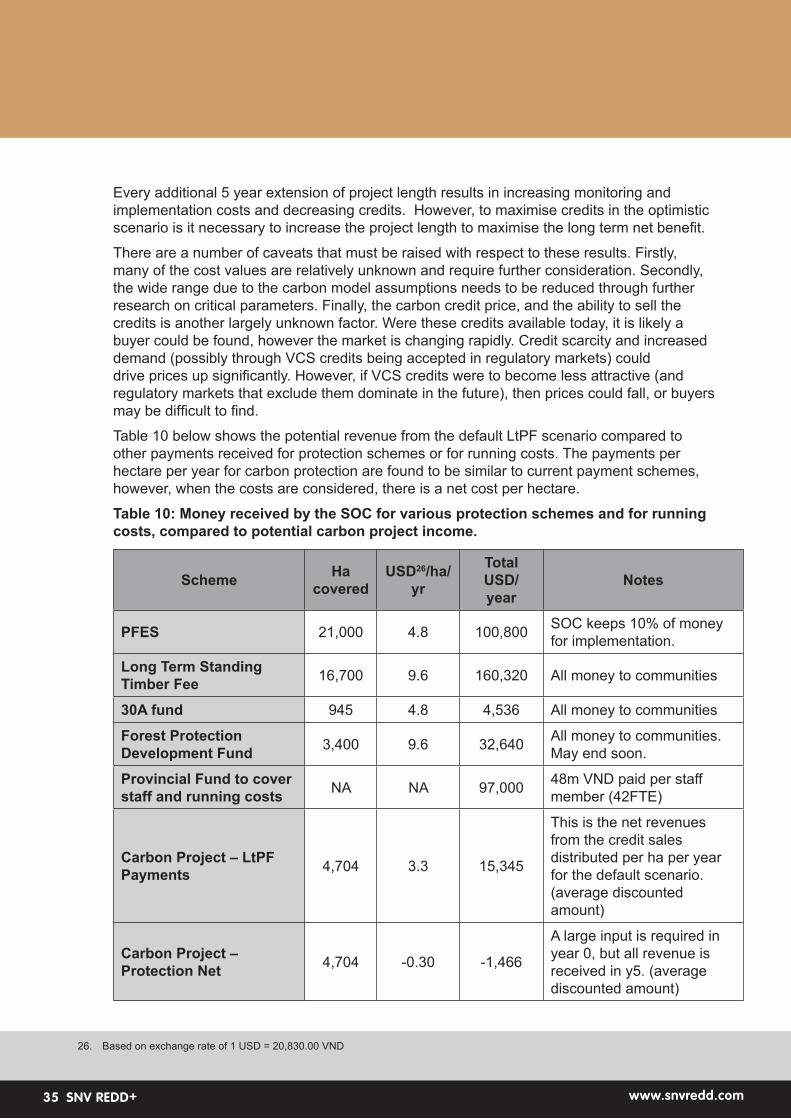
www.snvredd.comSNV REDD+35
Every additional 5 year extension of project length results in increasing monitoring and implementation costs and decreasing credits. However, to maximise credits in the optimistic scenario is it necessary to increase the project length to maximise the long term net benefit.
There are a number of caveats that must be raised with respect to these results. Firstly, many of the cost values are relatively unknown and require further consideration. Secondly, the wide range due to the carbon model assumptions needs to be reduced through further research on critical parameters. Finally, the carbon credit price, and the ability to sell the credits is another largely unknown factor. Were these credits available today, it is likely a buyer could be found, however the market is changing rapidly. Credit scarcity and increased demand (possibly through VCS credits being accepted in regulatory markets) could drive prices up significantly. However, if VCS credits were to become less attractive (and regulatory markets that exclude them dominate in the future), then prices could fall, or buyers may be difficult to find.
Table 10 below shows the potential revenue from the default LtPF scenario compared to other payments received for protection schemes or for running costs. The payments per hectare per year for carbon protection are found to be similar to current payment schemes, however, when the costs are considered, there is a net cost per hectare.
Table 10: Money received by the SOC for various protection schemes and for running costs, compared to potential carbon project income.
Scheme Ha covered
USD26/ha/yr
Total USD/ year
Notes
PFES 21,000 4.8 100,800 SOC keeps 10% of money for implementation.
Long Term Standing Timber Fee 16,700 9.6 160,320 All money to communities
30A fund 945 4.8 4,536 All money to communities
Forest Protection Development Fund 3,400 9.6 32,640 All money to communities.
May end soon.
Provincial Fund to cover staff and running costs NA NA 97,000 48m VND paid per staff
member (42FTE)
Carbon Project – LtPF Payments 4,704 3.3 15,345
This is the net revenues from the credit sales distributed per ha per year for the default scenario. (average discounted amount)
Carbon Project – Protection Net 4,704 -0.30 -1,466
A large input is required in year 0, but all revenue is received in y5. (average discounted amount)
26. Based on exchange rate of 1 USD = 20,830.00 VND
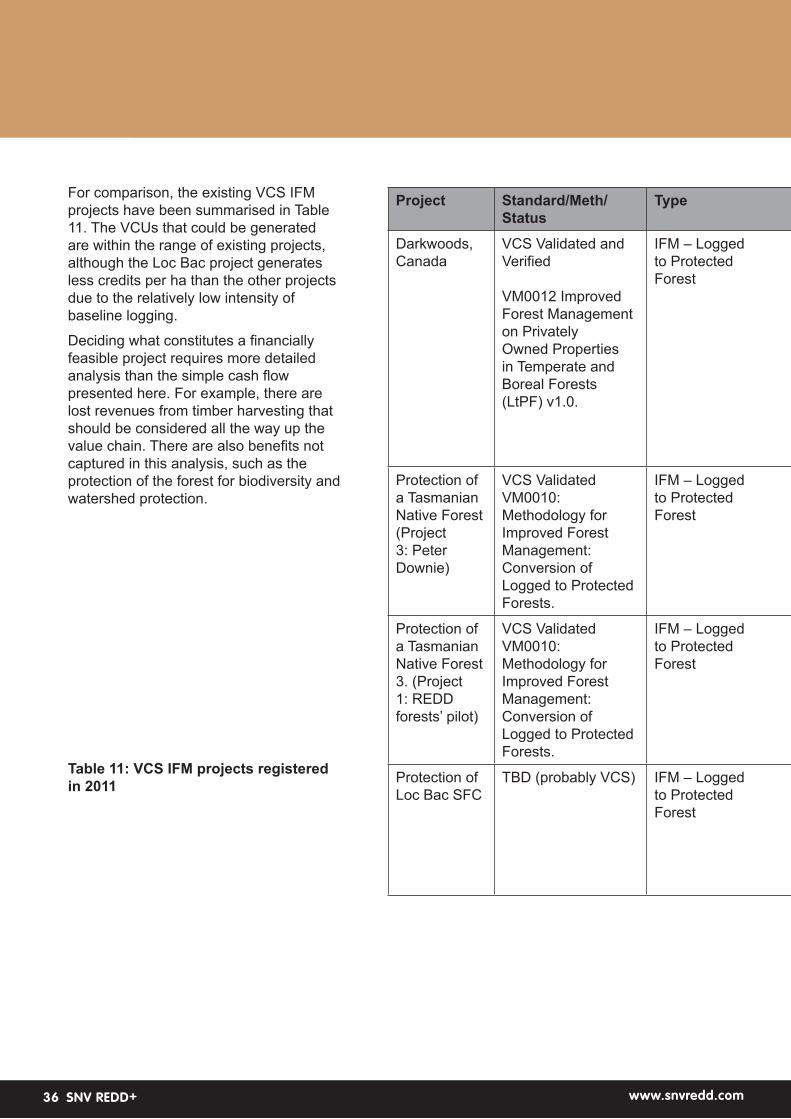
www.snvredd.comSNV REDD+36 www.snvredd.comSNV REDD+36
For comparison, the existing VCS IFM projects have been summarised in Table 11. The VCUs that could be generated are within the range of existing projects, although the Loc Bac project generates less credits per ha than the other projects due to the relatively low intensity of baseline logging.
Deciding what constitutes a financially feasible project requires more detailed analysis than the simple cash flow presented here. For example, there are lost revenues from timber harvesting that should be considered all the way up the value chain. There are also benefits not captured in this analysis, such as the protection of the forest for biodiversity and watershed protection.
Table 11: VCS IFM projects registered in 2011
Project Standard/Meth/Status
Type Area Baseline Scenario Project Scenario Credits
Darkwoods, Canada
VCS Validated and Verified
VM0012 Improved Forest Management on Privately Owned Properties in Temperate and Boreal Forests (LtPF) v1.0.
IFM – Logged to Protected Forest
54,792 ha Private Land
Sale to logging company, then 15 year depletion rate harvesting regime with harvest levels in at 250,000 – 325,000m3/year for 15 years, followed by a short (1-2 year) potential gap before ongoing lower harvest levels resume (Av 74,000m3/year). Regrowth modelled. HWP Considered.
Protection for logging, management related logging only. 10,000m3/year
12.5million VCUs over 100 years.275k VCUs per year for first 20 years.22k VCUs per year thereafter.
Protection of a Tasmanian Native Forest(Project 3: Peter Downie)
VCS ValidatedVM0010: Methodology for Improved ForestManagement: Conversion of Logged to Protected Forests.
IFM – Logged to Protected Forest
7,666 haPrivate Land
Clearing of 120 ha or thinning of c.400 ha each year. Regrowth modelled. HWP Considered.
Protection. 859,444 VCUs over 25 years. 35,000 VCU each year
Protection of a TasmanianNative Forest3. (Project 1: REDD forests’ pilot)
VCS ValidatedVM0010: Methodology for Improved ForestManagement: Conversion of Logged to Protected Forests.
IFM – Logged to Protected Forest
865 haPrivate Land
Selective logging every 5 years of an area of 135-209ha removing 56-117 m3 ha-1
123 895 VCUs over 25 years, 4956 a year.
Protection of Loc Bac SFC
TBD (probably VCS) IFM – Logged to Protected Forest
4,074 Selective logging of c.180ha annually, removing a total of c5,000 m3. Regrowth modelled. HWP considered.
Protection. Default = 118,000 VCUs over 35 years (all received in year 5)
Max stand voumel of 500m3 = 349,000 VCUs over 75 years (received by year 10)
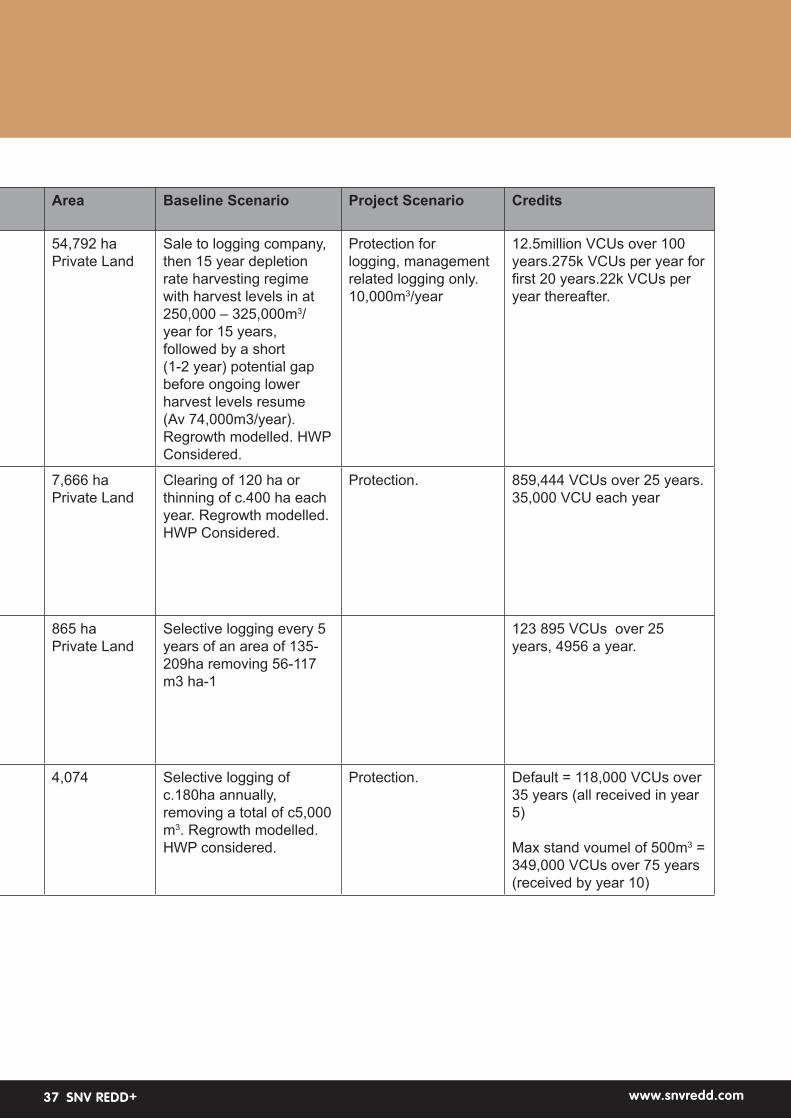
www.snvredd.comSNV REDD+37
Project Standard/Meth/Status
Type Area Baseline Scenario Project Scenario Credits
Darkwoods, Canada
VCS Validated and Verified
VM0012 Improved Forest Management on Privately Owned Properties in Temperate and Boreal Forests (LtPF) v1.0.
IFM – Logged to Protected Forest
54,792 ha Private Land
Sale to logging company, then 15 year depletion rate harvesting regime with harvest levels in at 250,000 – 325,000m3/year for 15 years, followed by a short (1-2 year) potential gap before ongoing lower harvest levels resume (Av 74,000m3/year). Regrowth modelled. HWP Considered.
Protection for logging, management related logging only. 10,000m3/year
12.5million VCUs over 100 years.275k VCUs per year for first 20 years.22k VCUs per year thereafter.
Protection of a Tasmanian Native Forest(Project 3: Peter Downie)
VCS ValidatedVM0010: Methodology for Improved ForestManagement: Conversion of Logged to Protected Forests.
IFM – Logged to Protected Forest
7,666 haPrivate Land
Clearing of 120 ha or thinning of c.400 ha each year. Regrowth modelled. HWP Considered.
Protection. 859,444 VCUs over 25 years. 35,000 VCU each year
Protection of a TasmanianNative Forest3. (Project 1: REDD forests’ pilot)
VCS ValidatedVM0010: Methodology for Improved ForestManagement: Conversion of Logged to Protected Forests.
IFM – Logged to Protected Forest
865 haPrivate Land
Selective logging every 5 years of an area of 135-209ha removing 56-117 m3 ha-1
123 895 VCUs over 25 years, 4956 a year.
Protection of Loc Bac SFC
TBD (probably VCS) IFM – Logged to Protected Forest
4,074 Selective logging of c.180ha annually, removing a total of c5,000 m3. Regrowth modelled. HWP considered.
Protection. Default = 118,000 VCUs over 35 years (all received in year 5)
Max stand voumel of 500m3 = 349,000 VCUs over 75 years (received by year 10)
www.snvredd.comSNV REDD+38 www.snvredd.comSNV REDD+38
4.9 Step 9 - Further considerations of land tenure and government approval
Land tenure Land tenure is a non-permanence category assessed during the risk assessment. However in the case of Vietnam, land tenure requires consideration, as the Government is the owner of the land, allocating it as land-use certificates to entities for forest and forestland protection, management and utilisation. In projects where land tenure is held by the government the permanence of the carbon sequestered can be impacted by a change of policy. However, in this case where the project proponent is also the Government, it is hoped that policies would be made in alignment with the project.
Government approvalAs mentioned previously, the amount of logging that occurs on the SOC is dictated through quotas, which are allocated by the Provincial People’s Committee (PPC). Thus any change in quotas in the case of the Logged to Protected Forest and the Extension of Rotation Age scenario would have to be approved by the PPC on top of being approved by the management of the SOC. The quotas allocated by the PCC, which are derived from quotas handed over to them from MARD, imply that the implementation of a carbon emission reduction project on the SOC would have to stem from a national government policy.
4.10 Step 10 - Comparison to CCB Standard
The CCB Standard is a project design standard providing rules and guidance to encourage effective integration of social and environmental impacts in land-based carbon projects. To achieve conformance under the CCB Standard, projects must demonstrate that they provide net community and biodiversity benefits, as well as GHGs emissions reductions increased sequestration (see Annex 1). The CCB Standard is not a GHG accounting standard, thus it is often combined with other standards, such as the VCS. CCB certification is now widely accepted as a requirement for carbon generating projects. This is because buyers are mainly interested in credits with co-benefits and forest carbon projects that take the participatory approach required by the CCB have reduced risks in the long term.
For the purpose of this study, we have considered issues related to carbon sequestration under the VCS analysis above, thus with respect to the CCB Standard, we focused particularly on the following issues:
CommunityCCB Standard requirements: The CCB Standard requires the generation of net positive impacts on the social and economic well-being of communities, the equitable division of cost and benefits between community members, the maintenance or enhancement of HCVs in the project zone and a monitoring plan.
www.snvredd.comSNV REDD+39
Project strength: There are two communities within the Loc Bac SOC: Loc Bac and Loc Bao, which were present before the formation of the SOC and own their agricultural land through the governmental Red Book. There is some documented encroachment into the forest by the communities for agricultural expansion, but the resolution process is straightforward as the SOC alerts local authorities when needed to address the issue. Most often, the result is that the communities are fined. It is likely that any project would need to better engage these communities and involve them in the planning so that community needs are met without the issuing of fines. The communities’ proximity to the SOC does bring them benefits in terms of economic opportunities. The Provincial Poverty Alleviation Program provides funding for Acacia planting. The communities are leased land free of charge by the SOC and subsidized 5,000,000 VND per/ha for Acacia planting for the 1st year and 2,000,000 VND per/ha for the 2nd year. After 5 to 6 years, the communities are free to harvest and retain full benefit for this. 40% of the total population is involved in the scheme and priority is given to the poorest households. It is planned that the SOC will lease 1,500 ha to the communities from 2010 to 2015 under this scheme. Bringing direct benefits to the poorest households would qualify the project as ‘Gold Level for extraordinary community benefits’ under the CCB Standards if the project is within a country ranked as low human development or in an administrative area in which at least 50% of the population is below the national poverty line. Vietnam is considered a medium human development country27 (ranking 116 globally), however, the Bao Lam district where the Loc Bac SOC is situated has 50-60% of its population under the national poverty line, which would be a qualifying factor (Swinkels and Turk, 2007). Apart from this program, the SOC benefits the communities by directly employing the men and women to stop forest fires, collect NTFPs to prevent forest fires in the dry season, or clean forests. All the households also have a contract with the SOC for the protection of 20-30 ha of forest. The SOC engages with the communities through several yearly meetings regarding harvesting, forest fires and forest protection.
•Project opportunities: The project could build on and improve the payment distribution mechanisms already established and bring them closer into the decision making process for the project design.
Biodiversity
•CCB Standard requirements: The CCB Standard requires the generation of net positive impacts within the project zone, including maintenance or enhancement of HCVs, mitigation of negative impacts on biodiversity outside the project zone and a monitoring plan.
•Project strength: No planting occurs as part of the SOC harvesting operations and the forest is left to
27. UNDP, 2010. HDI Index. Available from: http://hdr.undp.org/en/media/Lets-Talk-HD-HDI_2010.pdf
www.snvredd.comSNV REDD+40 www.snvredd.comSNV REDD+40
regenerate naturally and thus does not pose a threat to biodiversity outside the project zone. These characteristics help the Loc Bac SOC meet the biodiversity requirements of the CCB Standards. The SOC is adjacent to the Cat Tien National Park and it can be assumed that it would contain similar unique biological characteristics. The SOC could qualify as ‘Gold level for extraordinary biodiversity benefits’ as the biodiversity assessment conducted (Dang and Osborne, 2004) demonstrates that there are several species of vascular plants, trees, mammals, reptiles and amphibians within the project site that are endangered or critically endangered according to the IUCN Red List. The study also demonstrates that there are a number of endemic tree species within the project area that meet the Key Biodiversity Area (KBA) irreplaceability criteria (Dang and Osborn, 2004) (Annex 3).
•Project opportunities: The Loc Bac SOC has not been assessed for HCVF. This would have to be carried out to meet the CCB Standards biodiversity requirements. Monitoring could then be able to demonstrate the biodiversity benefit of decreased disturbance. The decrease in road frequency could result in decreased opportunities for poaching. However, the leakage associated with any decreases in biodiversity would need to be assessed and addressed.
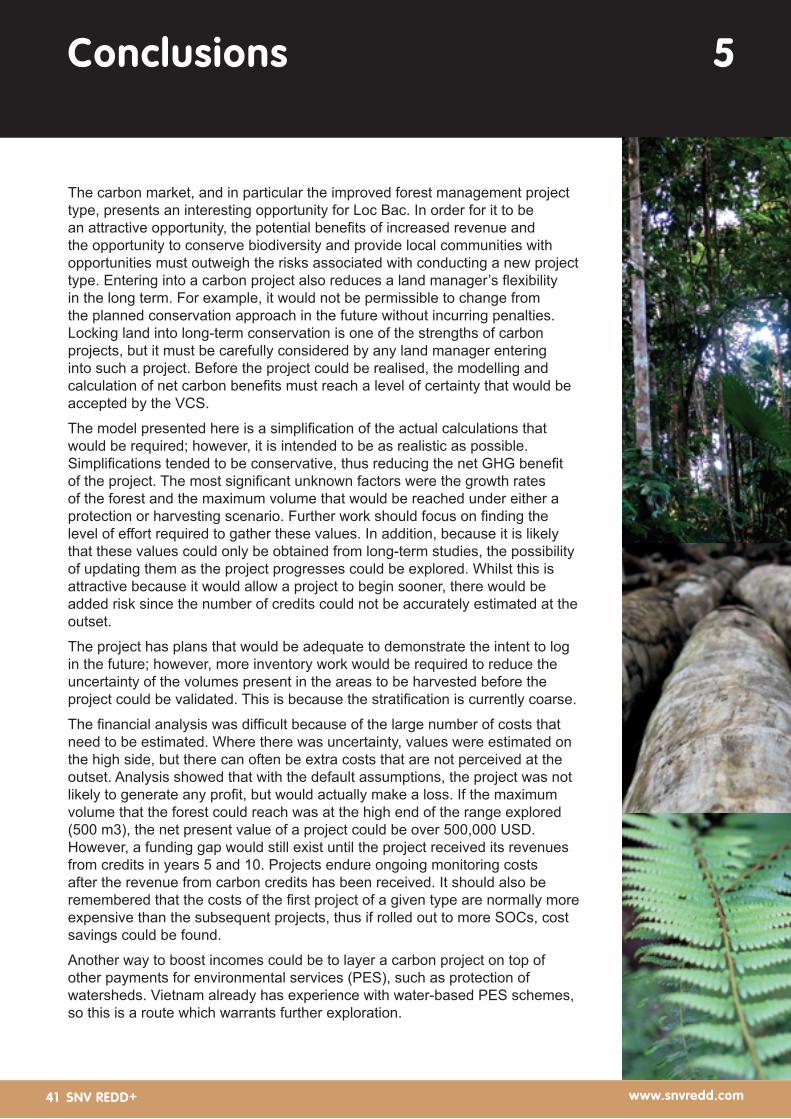
www.snvredd.comSNV REDD+41
The carbon market, and in particular the improved forest management project type, presents an interesting opportunity for Loc Bac. In order for it to be an attractive opportunity, the potential benefits of increased revenue and the opportunity to conserve biodiversity and provide local communities with opportunities must outweigh the risks associated with conducting a new project type. Entering into a carbon project also reduces a land manager’s flexibility in the long term. For example, it would not be permissible to change from the planned conservation approach in the future without incurring penalties. Locking land into long-term conservation is one of the strengths of carbon projects, but it must be carefully considered by any land manager entering into such a project. Before the project could be realised, the modelling and calculation of net carbon benefits must reach a level of certainty that would be accepted by the VCS.
The model presented here is a simplification of the actual calculations that would be required; however, it is intended to be as realistic as possible. Simplifications tended to be conservative, thus reducing the net GHG benefit of the project. The most significant unknown factors were the growth rates of the forest and the maximum volume that would be reached under either a protection or harvesting scenario. Further work should focus on finding the level of effort required to gather these values. In addition, because it is likely that these values could only be obtained from long-term studies, the possibility of updating them as the project progresses could be explored. Whilst this is attractive because it would allow a project to begin sooner, there would be added risk since the number of credits could not be accurately estimated at the outset.
The project has plans that would be adequate to demonstrate the intent to log in the future; however, more inventory work would be required to reduce the uncertainty of the volumes present in the areas to be harvested before the project could be validated. This is because the stratification is currently coarse.
The financial analysis was difficult because of the large number of costs that need to be estimated. Where there was uncertainty, values were estimated on the high side, but there can often be extra costs that are not perceived at the outset. Analysis showed that with the default assumptions, the project was not likely to generate any profit, but would actually make a loss. If the maximum volume that the forest could reach was at the high end of the range explored (500 m3), the net present value of a project could be over 500,000 USD. However, a funding gap would still exist until the project received its revenues from credits in years 5 and 10. Projects endure ongoing monitoring costs after the revenue from carbon credits has been received. It should also be remembered that the costs of the first project of a given type are normally more expensive than the subsequent projects, thus if rolled out to more SOCs, cost savings could be found.
Another way to boost incomes could be to layer a carbon project on top of other payments for environmental services (PES), such as protection of watersheds. Vietnam already has experience with water-based PES schemes, so this is a route which warrants further exploration.
Conclusions 5
www.snvredd.comSNV REDD+42 SNV REDD+42 www.snvredd.com
Despite facing challenges of getting local/regional volume and growth data, calculating leakage and getting the necessary approval and long term commitment, there do not appear to be any other hurdles that could prevent a project from occurring. The current engagement with the local communities in monitoring activities could be expanded under a carbon project and the rich biodiversity of the forest and its surroundings would make the project a good candidate for the CCB standard. The most important step is to be certain that the project’s goals align with the goals of land managers within the Government’s planning system as well as the needs of the local people impacted by the project.
In order to provide more certainty to this feasibility analysis, the following areas should be researched further:
•The feasibility of getting the necessary approvals from the various tiers of Government involved in land use planning decisions.
•The current volume, growth rate and expected maximum volume of the forest.
•Analysis into the likely impact of reducing logging on local jobs, tax revenues, SOC profitability and logging elsewhere (leakage).
•The costs of implementing and monitoring the project.
•The number of similar SOCs that this model could be scaled to include.
•Data gathering and research into the potential for a low productive to high productivity project type centred on rehabilitating degraded forests.
•The possibility of bundling carbon with other payment for environmental services schemes.
www.snvredd.comSNV REDD+43
Baltzer, M.C., Nguyen Thi Dao, and Shore, R.C. eds. 2001. Towards a Vision for Biodiversity Conservation in the Forests of the Lower Mekong Ecoregion Complex. WWF Indochina/WWF US, Hanoi and Washington D.C.Covell, Phil. Business Guidance: Forest Carbon Marketing and Finance. In Building Forest Carbon Projects, Johannes Ebeling and Jacob Olander (eds.). Washington, DC: Forest Trends, 2011.Dang, N.X. and Osborn, T., 2004. A Biological and Socio-economic Assessment of the Loc Bac State Forestry Enterprise, Lam Dong province, Vietnam. Cat Tien National Park Conservation Project. Ecosecurities, 2010. The forest carbon offsetting report 2010. Available from: http://www.ecosecurities.com/Standalone/Forest_carbon_offsetting_report_2010/default.aspxFCPF (Forest Carbon Partnership Facility), 2008. Vietnam Readiness plan idea note (R-PIN). Available from: http://www.forestcarbonpartnership.org/fcp/sites/forestcarbonpartnership.org/files/Documents/PDF/Vietnam_FCPF_R-PIN_0.pdfPeters-Stanley, M., Hamilton, K., Marcello, T., and Sjardin, M., 2010. State of the Carbon Markets 2010. Ecosystems Marketplace.Putz, F.E., Sist, P., Fredericksen, T., Dykstra, D.P., 2008. Reduced-Impact Logging : Challenges and Opportunities. Forest Ecology and Management, 256 (7) : 1427-1433. Available from: http://ddr.nal.usda.gov/bitstream/10113/21098/1/IND44101442.pdfR-PIN, 2008. The Forest Carbon Partnership Facility Readiness Plan Idea Note for Vietnam.Stattersfield, A. J., Crosby, M. J., A. J. and Wege, D. C., 1998. Endemic Bird Areas of the world: Priorities for Biodiversity Conservation. Cambridge, UK: BirdLife International.Swinkels, R. and Turk, C., 2007. Poverty Mapping in Vietnam. World Bank. Available from: http://siteresources.worldbank.org/INTPGI/Resources/342674-1092157888460/493860-1192739384563/10412-14_p261-286.pdfThai Van Trung, 1978. Forest Vegetation of Vietnam. Science and Technology Publishing House, Hanoi.WBI (World Bank Institute), 2010. Worldwide Governance Indicators, Country Data Report for Vietnam, 1996-2009. Available from: http://info.worldbank.org/governance/wgi/pdf/c234.pdfWikramanayake, E.D., Dinerstein, E., Loucks, C., Olsen, D., Morrison, J., Lamoreux, J., McKnight, M., and Hedao, P., 2001. Terrestrial Ecoregions of the Indo-Pacific: A Conservation Assessment. Island Press: Washington D.C.Winjum, J.K., Brown, S., and Schlamadinger, B., 1998. Forest harvests and wood products: sources and sinks of atmospheric carbon dioxide. Forest Science 44: 272-284.
References 6
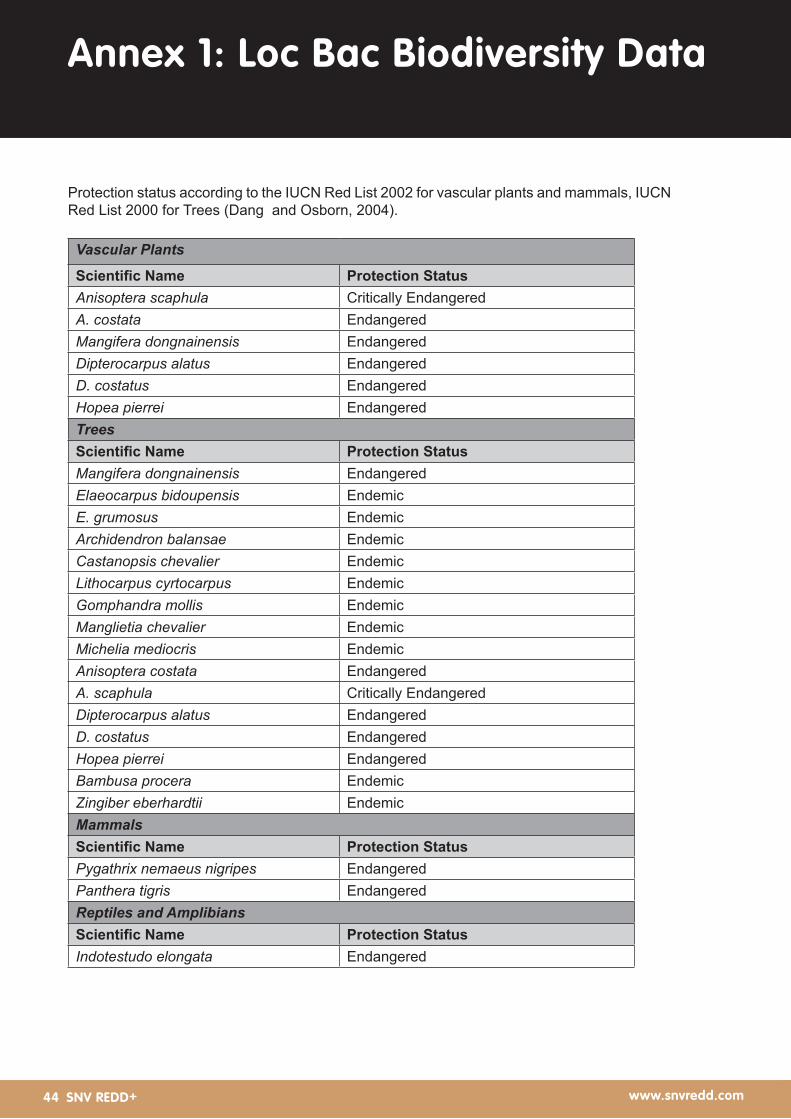
www.snvredd.comSNV REDD+44 SNV REDD+44 www.snvredd.com
Protection status according to the IUCN Red List 2002 for vascular plants and mammals, IUCN Red List 2000 for Trees (Dang and Osborn, 2004).
Vascular Plants
Scientific Name Protection StatusAnisoptera scaphula Critically EndangeredA. costata EndangeredMangifera dongnainensis EndangeredDipterocarpus alatus EndangeredD. costatus EndangeredHopea pierrei EndangeredTreesScientific Name Protection StatusMangifera dongnainensis EndangeredElaeocarpus bidoupensis EndemicE. grumosus EndemicArchidendron balansae EndemicCastanopsis chevalier EndemicLithocarpus cyrtocarpus EndemicGomphandra mollis EndemicManglietia chevalier EndemicMichelia mediocris EndemicAnisoptera costata EndangeredA. scaphula Critically EndangeredDipterocarpus alatus EndangeredD. costatus EndangeredHopea pierrei EndangeredBambusa procera EndemicZingiber eberhardtii EndemicMammalsScientific Name Protection StatusPygathrix nemaeus nigripes EndangeredPanthera tigris EndangeredReptiles and AmplibiansScientific Name Protection StatusIndotestudo elongata Endangered
Annex 1: Loc Bac Biodiversity Data

www.snvredd.comSNV REDD+45 SNV REDD+45 www.snvredd.com

www.snvredd.comSNV REDD+46 SNV REDD+46 www.snvredd.com

www.snvredd.comSNV REDD+47 SNV REDD+47 www.snvredd.com
SNV REDD+ www.snvredd.com
SNV-Netherlands Development OrganisationREDD+ Programme6thfloor,BuildingB,LaThanhHotel218DoiCanStreet,BaDinh,HaNoi,VietnamTel:84438463791/2Fax:84438463794Email:[email protected]