pd-l1 expression as a potential predictive biomarker -...
TRANSCRIPT
Paolo A. Ascierto, MDUOC Melanoma, Immunoterapia Oncologica e Terapie InnovativeIstituto Nazionale Tumori – Fondazione “G. Pascale”, Napoli, Italy
PD-L1 expression as a potential predictive biomarker
PD-L1 expression as a potential predictive biomarker

Disclosures• Employment or Leadership Position: None • Consultant/Advisory Role: Bristol-Myers Squibb,
Roche-Genentech, Merck Sharp & Dohme, Ventana, Novartis, Amgen, Array
• Stock Ownership: None • Honoraria: None• Research Funding: Bristol-Myers Squibb, Roche-
Genentech, Ventana, Array • Expert Testimony: None• Other Remuneration: None

PD-L1 expression as a potential predictive biomarker
The ideal predicitve biomarkers should be able to predict the patients who can havea benefit from a treatment, from thosewho cannot have such a benefit.
In other words can be useful for patientselection.
PD-L1 expression as a potential predictive biomarker: considerations
a) Immunological (not molecular) marker

PD-L1 expression as a potential predictive biomarker: considerations
a) Immunological (not molecular) markerb) Dynamic and inducible markers (IFN,
RT, etc.)

PD-L1 expression as a potential predictive biomarker: considerations
a) Immunological (not molecular) markerb) Dynamic and inducible markers (IFN,
RT, etc.) c) Topographical distributions in the
tumor
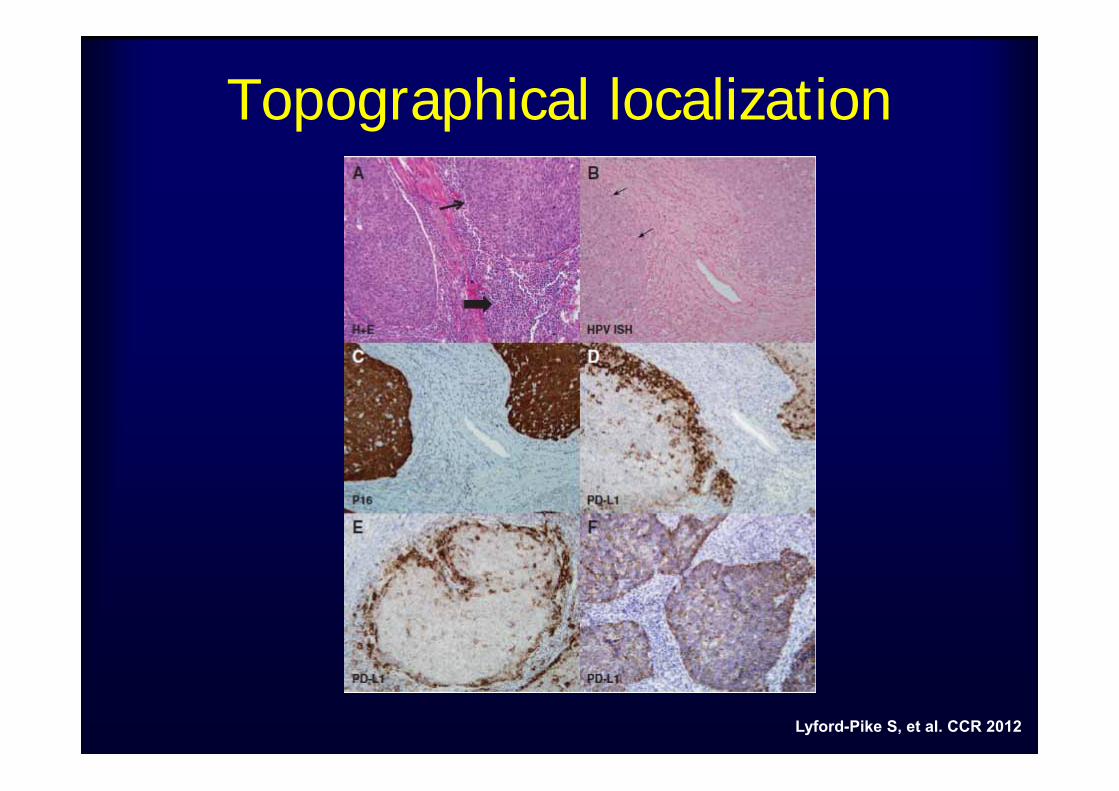
Topographical localization
Lyford-Pike S, et al. CCR 2012
PD-L1 expression as a potential predictive biomarker: considerations
a) Immunological (not molecular) markerb) Dynamic and inducible markers (IFN,
RT, etc.) c) Topographical distributions in the
tumord) Different antibodies used in IHC

PD-L1 expression as a potential predictive biomarker: considerations
a) Immunological (not molecular) markerb) Dynamic and inducible markers (IFN,
RT, etc.) c) Topographical distributions in the
tumord) Different antibodies used in IHCe) Different cut-off and scoring system
used
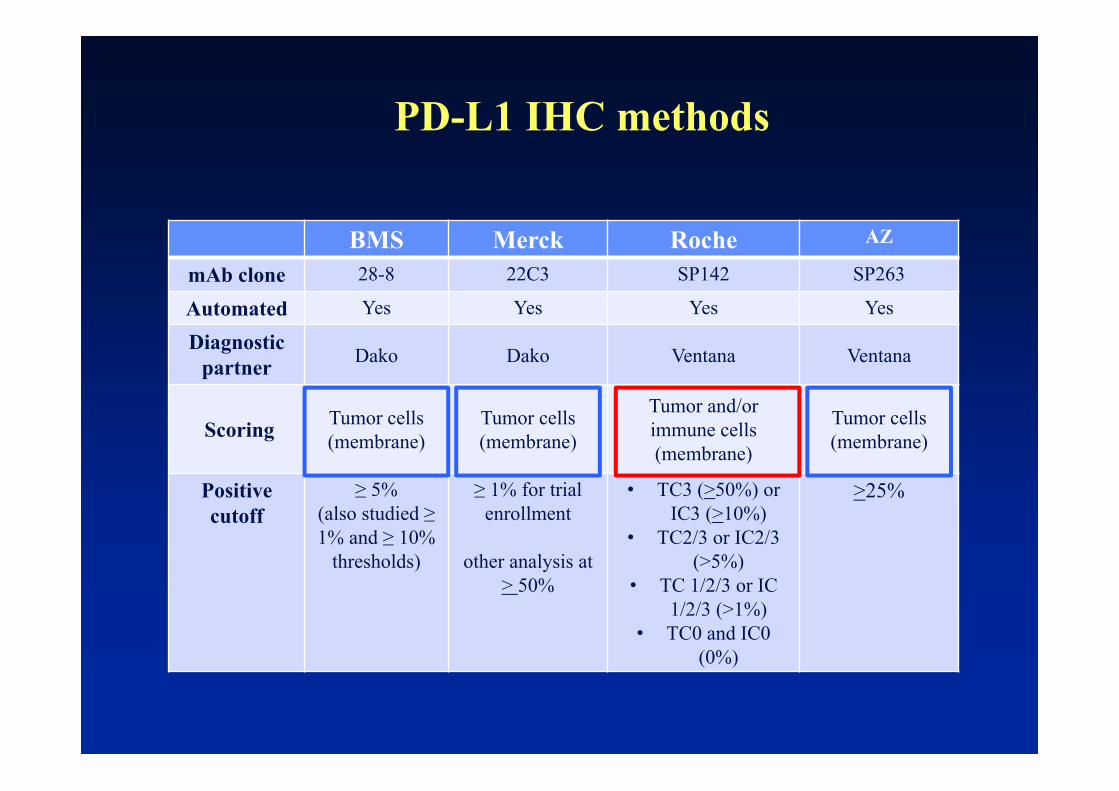
BMS Merck Roche AZ
mAb clone 28-8 22C3 SP142 SP263
Automated Yes Yes Yes Yes
Diagnostic partner Dako Dako Ventana Ventana
Scoring Tumor cells(membrane)
Tumor cells (membrane)
Tumor and/orimmune cells (membrane)
Tumor cells (membrane)
Positive cutoff
≥ 5%(also studied ≥ 1% and ≥ 10%
thresholds)
≥ 1% for trial enrollment
other analysis at > 50%
• TC3 (>50%) or IC3 (>10%)
• TC2/3 or IC2/3 (>5%)
• TC 1/2/3 or IC 1/2/3 (>1%)
• TC0 and IC0 (0%)
>25%
PD-L1 IHC methods
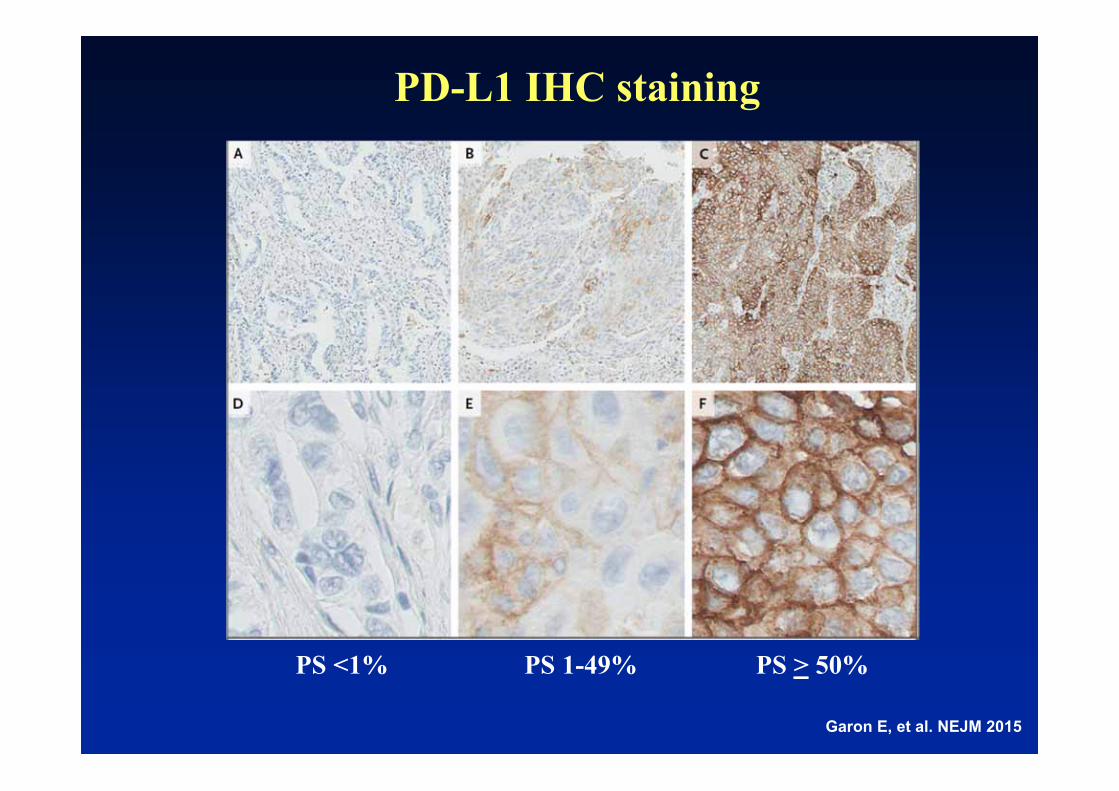
PD-L1 IHC staining
Garon E, et al. NEJM 2015
PS <1% PS 1-49% PS > 50%

NSCLC
Melanoma
RCC
**2 pts still under evaluation
42 pts include 18 MEL, 10 NSCLC, 7 CRC, 5 RCC, and 2 CRPC.
Correlation of PD-L1 expression in pretreatment tumor biopsies with clinical outcomes
Association Between Pretreatment Tumor PD-L1 Expression and Clinical Response
Response Status
PD-L1 Positive no. (%)
PD-L1 Negativeno. (%)
Totalno. (%)
CR/PR 9 (36) 0 9 (21)
Non responder 16* (64) 17 (100) 33 (79)
All Patients 25 17 42
Topalian S, et al. NEJM 2012;366:2443-2454.
Prop
ortio
n of patients
p=0.006
0
0,2
0,4
0,6
0,8
1
PD‐L1(+) PD‐L1(‐)
PD‐L1(+)PD‐L1(‐)9/25
16*/25
17/17
0/17† analysis not pre-planned and based on subset of subjects'.
†
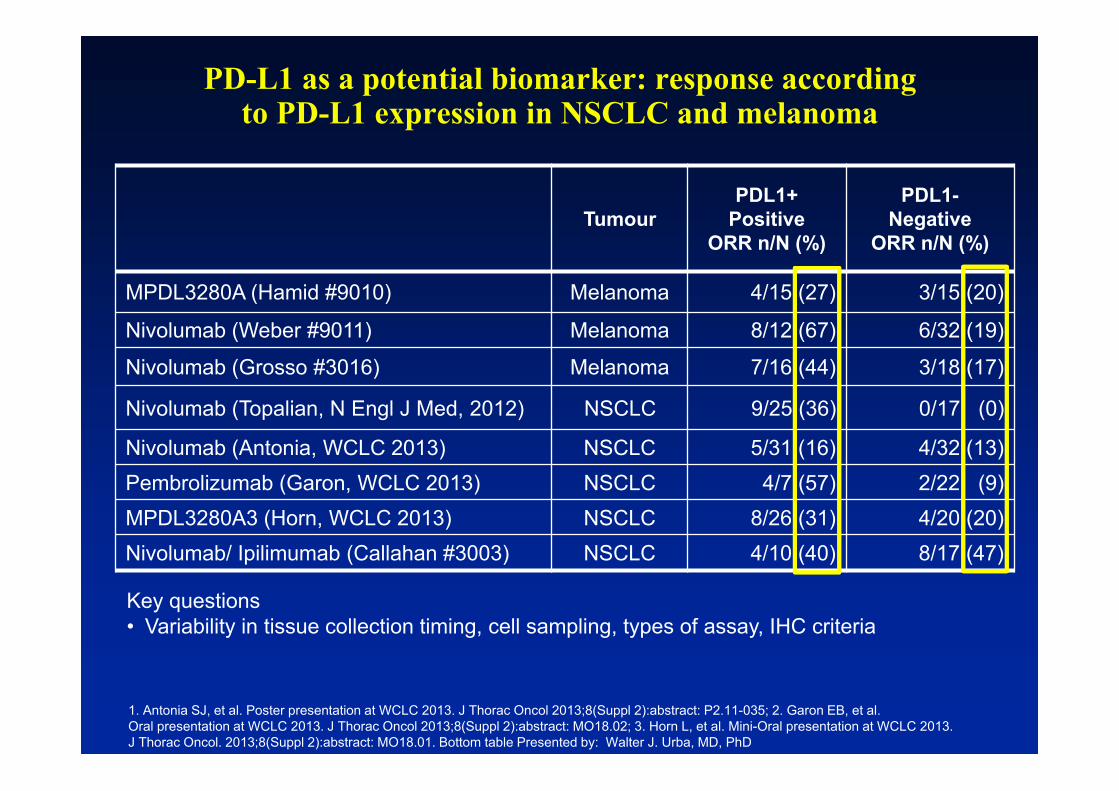
PD-L1 as a potential biomarker: response accordingto PD-L1 expression in NSCLC and melanoma
1. Antonia SJ, et al. Poster presentation at WCLC 2013. J Thorac Oncol 2013;8(Suppl 2):abstract: P2.11-035; 2. Garon EB, et al. Oral presentation at WCLC 2013. J Thorac Oncol 2013;8(Suppl 2):abstract: MO18.02; 3. Horn L, et al. Mini-Oral presentation at WCLC 2013. J Thorac Oncol. 2013;8(Suppl 2):abstract: MO18.01. Bottom table Presented by: Walter J. Urba, MD, PhD
TumourPDL1+
PositiveORR n/N (%)
PDL1-Negative
ORR n/N (%)
MPDL3280A (Hamid #9010) Melanoma 4/15 (27) 3/15 (20)
Nivolumab (Weber #9011) Melanoma 8/12 (67) 6/32 (19)
Nivolumab (Grosso #3016) Melanoma 7/16 (44) 3/18 (17)
Nivolumab (Topalian, N Engl J Med, 2012) NSCLC 9/25 (36) 0/17 (0)
Nivolumab (Antonia, WCLC 2013) NSCLC 5/31 (16) 4/32 (13)Pembrolizumab (Garon, WCLC 2013) NSCLC 4/7 (57) 2/22 (9)MPDL3280A3 (Horn, WCLC 2013) NSCLC 8/26 (31) 4/20 (20)Nivolumab/ Ipilimumab (Callahan #3003) NSCLC 4/10 (40) 8/17 (47)
Key questions• Variability in tissue collection timing, cell sampling, types of assay, IHC criteria

CA209-037: Tumor Burden Change by PD-L1 Status
Max
imum
Cha
nge
from
B
asel
ine
in T
arge
t Les
ion
(%)
PD-L1+
PD-L1-
Nivolumab ICCORR* 44%
ORR* 20%
ORR* 9%
ORR* 13%
*ORR among treated patients in the ORR population
100
75
50
25
0
-25
-50
-75
-100
Patients
100
75
50
25
0
-25
-50
-75
-100Confirmed respondersTruncated to 100%
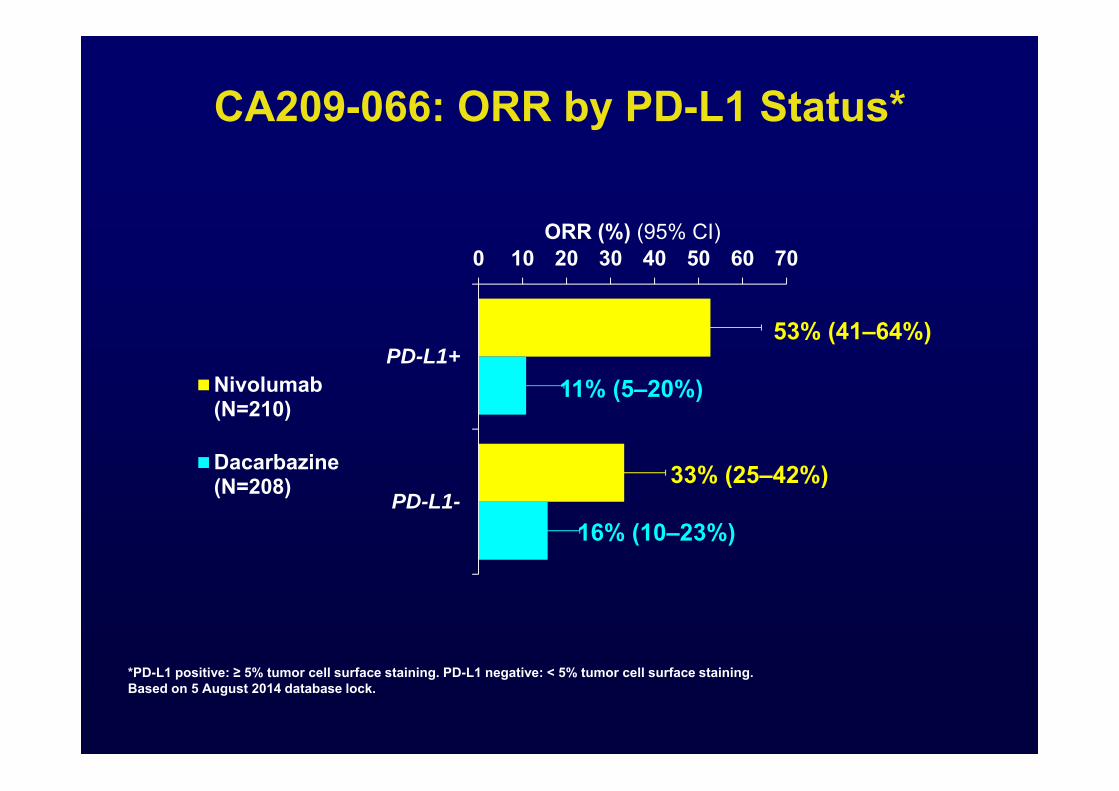
CA209-066: ORR by PD-L1 Status*
*PD-L1 positive: ≥ 5% tumor cell surface staining. PD-L1 negative: < 5% tumor cell surface staining.Based on 5 August 2014 database lock.
0 10 20 30 40 50 60 70
PD-L1+
PD-L1-
ORR (%) (95% CI)
Nivolumab(N=210)
Dacarbazine(N=208)
53% (41–64%)
11% (5–20%)
33% (25–42%)
16% (10–23%)

CA209-066: OS by PD-L1 Status*
Improved OS irrespective of PD-L1 status100
90
80
70
60
0
50
40
30
20
10
0 3 6 9 12 15 18Months
Nivolumab PD-L1+
Dacarbazine PD-L1+
Nivolumab PD-L1-
Dacarbazine PD-L1-
Patients at RiskDacarbazine PD-L1-Nivolumab PD-L1-Dacarbazine PD-L1+Nivolumab PD-L1+
7412874126
6910864107
56884478
39633052
18261111
1712
0000
Patie
nts
Surv
ivin
g (%
)
1-Yr OS% (95% CI)
82.1 (69.6–89.8)67.8 (58.3–75.7)52.7 (37.7–65.7)37.4 (26.4–48.3)
Patients who died,
n/NMedian OS mo (95% CI)
Nivolumab PD-L1+ 11/74 NRNivolumab PD-L1- 37/128 NRDacarbazine PD-L1+ 29/74 12.4 (9.2–NR)
Dacarbazine PD-L1- 64/126 10.2 (7.6–
11.8)
*PD-L1 positive: ≥ 5% tumor cell surface staining. PD-L1 negative: < 5% tumor cell surface staining. NR = not reached.Based on 5 August 2014 database lock.

Is PD-L1 status useful for selecting patients for treatment in melanoma?
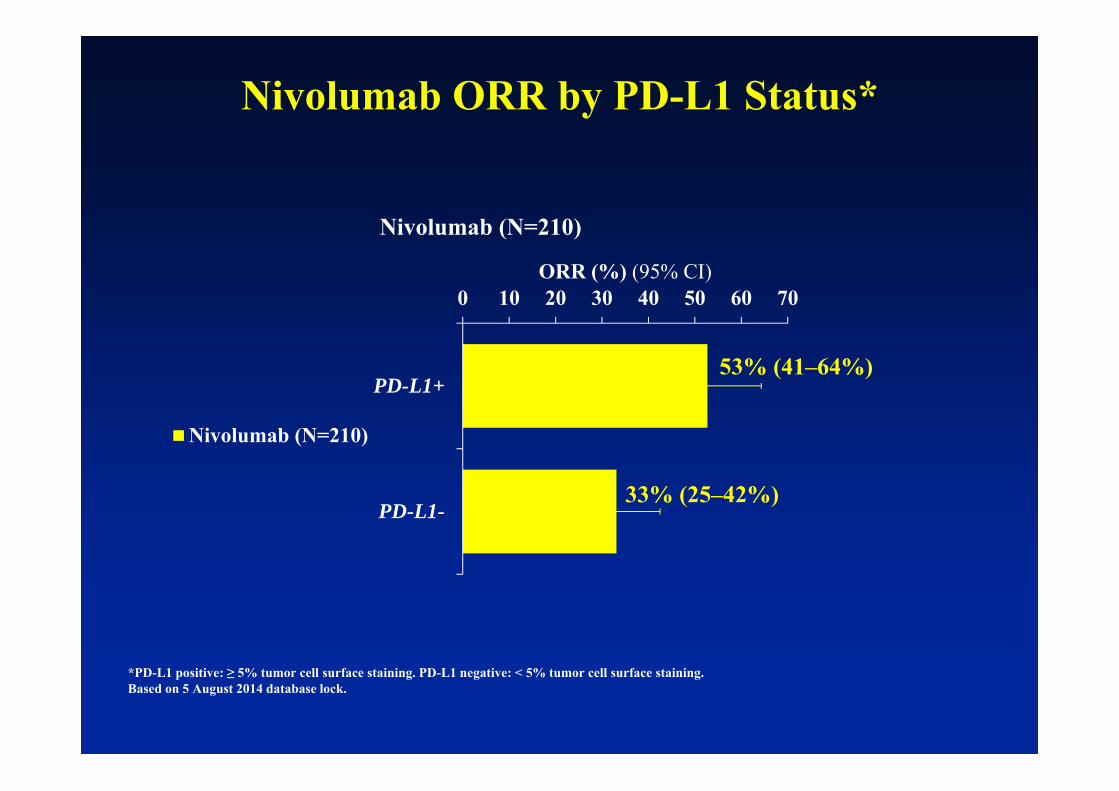
Nivolumab ORR by PD-L1 Status*
*PD-L1 positive: ≥ 5% tumor cell surface staining. PD-L1 negative: < 5% tumor cell surface staining.Based on 5 August 2014 database lock.
0 10 20 30 40 50 60 70
PD-L1+
PD-L1-
ORR (%) (95% CI)
Nivolumab (N=210)
Nivolumab (N=210)
53% (41–64%)
33% (25–42%)
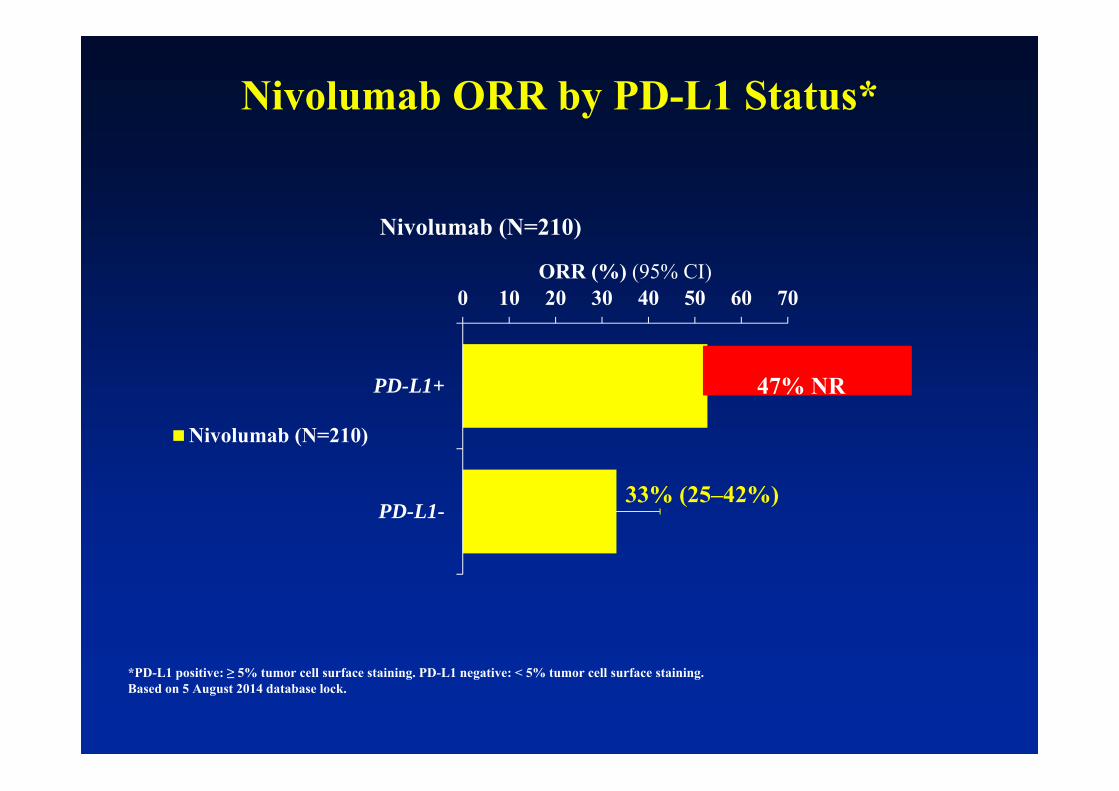
*PD-L1 positive: ≥ 5% tumor cell surface staining. PD-L1 negative: < 5% tumor cell surface staining.Based on 5 August 2014 database lock.
0 10 20 30 40 50 60 70
PD-L1+
PD-L1-
ORR (%) (95% CI)
Nivolumab (N=210)
Nivolumab (N=210)
53% (41–64%)
33% (25–42%)
47% NR
Nivolumab ORR by PD-L1 Status*
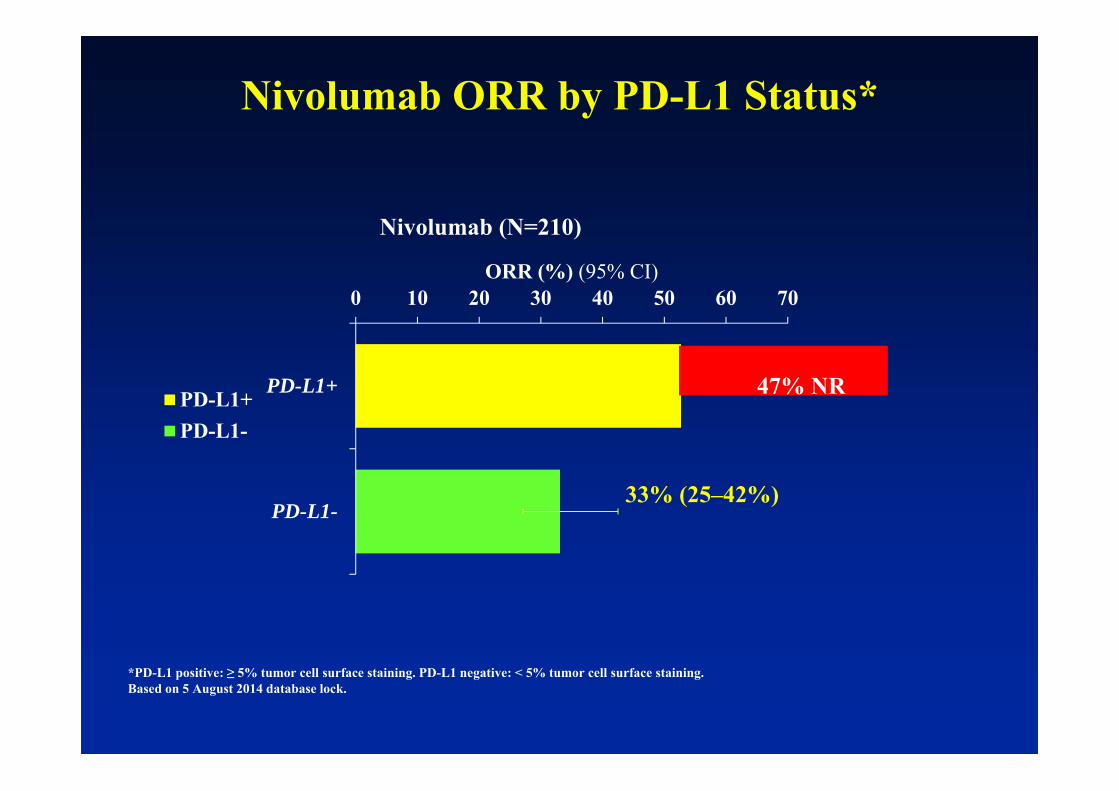
*PD-L1 positive: ≥ 5% tumor cell surface staining. PD-L1 negative: < 5% tumor cell surface staining.Based on 5 August 2014 database lock.
0 10 20 30 40 50 60 70
PD-L1+
PD-L1-
ORR (%) (95% CI)
Nivolumab (N=210)
PD-L1+PD-L1-
53% (41–64%)
33% (25–42%)
47% NR
Nivolumab ORR by PD-L1 Status*
21
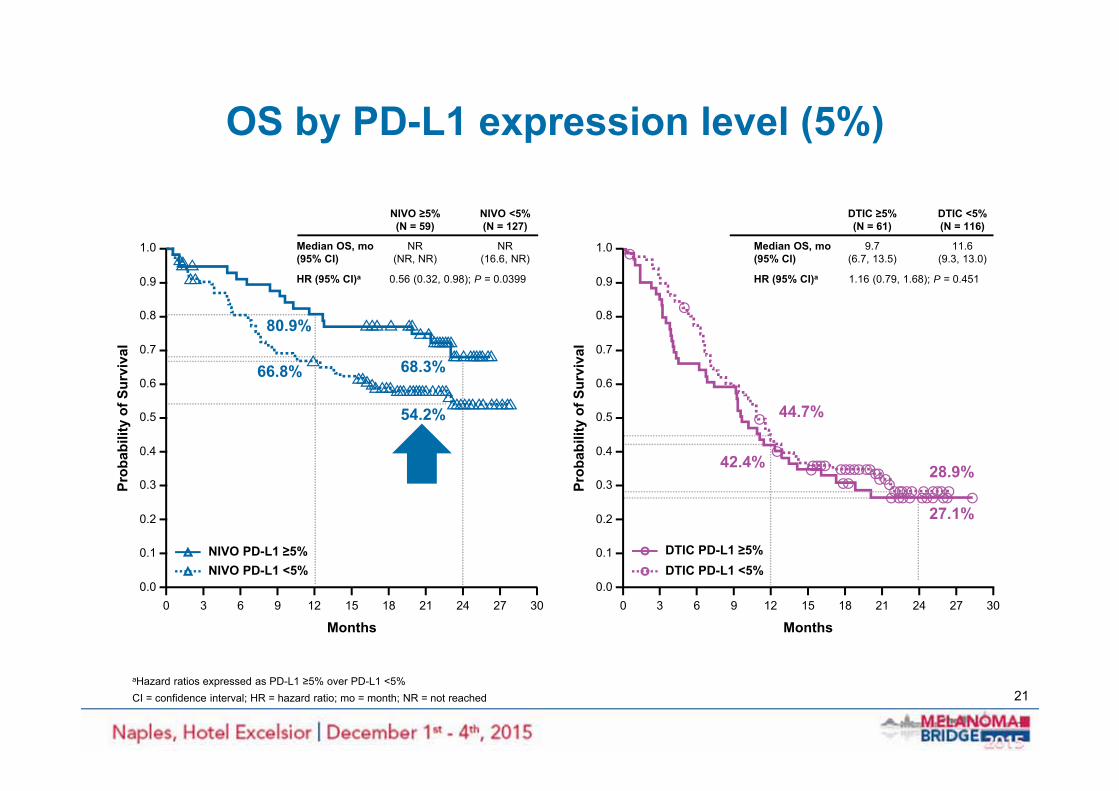
OS by PD-L1 expression level (5%)
aHazard ratios expressed as PD-L1 ≥5% over PD-L1 <5%CI = confidence interval; HR = hazard ratio; mo = month; NR = not reached
Median OS, mo(95% CI)
HR (95% CI)a
NIVO ≥5%(N = 59)
NIVO <5%(N = 127)
NR(NR, NR)
NR(16.6, NR)
0.56 (0.32, 0.98); P = 0.0399
Months300 272421181512963
0.0
0.1
0.2
0.3
0.4
0.5
0.6
0.7
0.8
0.9
1.0
Prob
abili
ty o
f Sur
viva
l
NIVO PD-L1 ≥5%NIVO PD-L1 <5%
80.9%
68.3%66.8%
54.2%
Median OS, mo(95% CI)
HR (95% CI)a
DTIC ≥5%(N = 61)
DTIC <5%(N = 116)
9.7(6.7, 13.5)
11.6(9.3, 13.0)
1.16 (0.79, 1.68); P = 0.451
DTIC PD-L1 ≥5%DTIC PD-L1 <5%
Months300 272421181512963
0.0
0.1
0.2
0.3
0.4
0.5
0.6
0.7
0.8
0.9
1.0
Prob
abili
ty o
f Sur
viva
l
42.4%
44.7%
27.1%
28.9%

2222
Larkin J et al. N Engl J Med 2015;373:23-34
Ipilimumab plus nivolumab - results from the three arms randomized phase 3 study in untreated advanced melanoma patients with ipilimumab/nivolumab or nivolumab alone vs
ipilimumab alone (CA209-067): NIVO + IPI resulted in a longer PFS

Slide 13
Presented By Jedd Wolchok at 2015 ASCO Annual Meeting

Is PD-L1 status useful for selecting treatment for patients in melanoma?

Slide 15
Presented By Jedd Wolchok at 2015 ASCO Annual Meeting
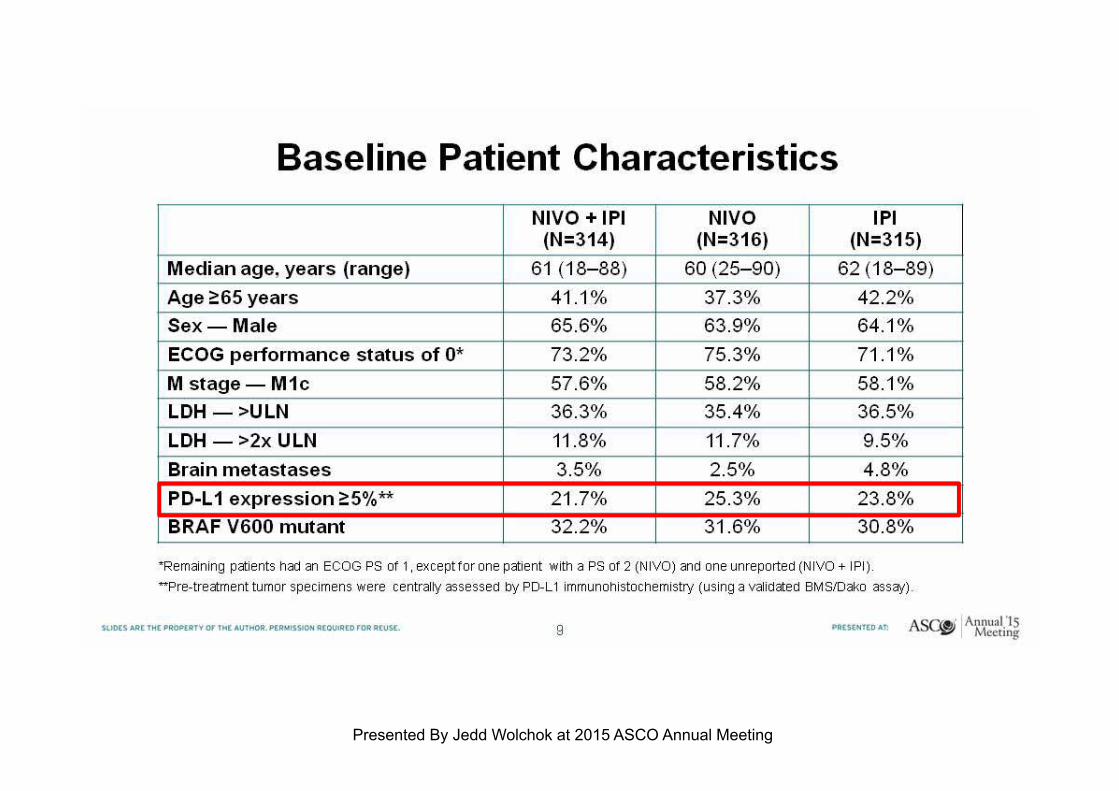
Slide 9
Presented By Jedd Wolchok at 2015 ASCO Annual Meeting

PD-L1 as a potential biomarker: % of Pts PD-L1 positive in the different clinical trials
Study
Pts PDL1+
Positive(%)
CA209-037 (Weber J et al. LO 2015) 49
CA209-066 (Robert C et al. NEJM 2014) 35
Ca209-067 (Larkin J et al. NEJM 2015) ipi/nivo arm 21,7
Ca209-067 (Larkin J et al. NEJM 2015) nivo arm 25,3
Keynote 006 (Robert C et al. NEJM 2015) pembro every 2 wks 80,6Keynote 006 (Robert C et al. NEJM 2015) pembro every 3 wks 79,8Keynote 002 (Puzanov I et al. ASCO 2015) 69Keynote 001 (Daud A et al SMR 2014)) 77
Ascierto PA et al. J Trans Med 2015
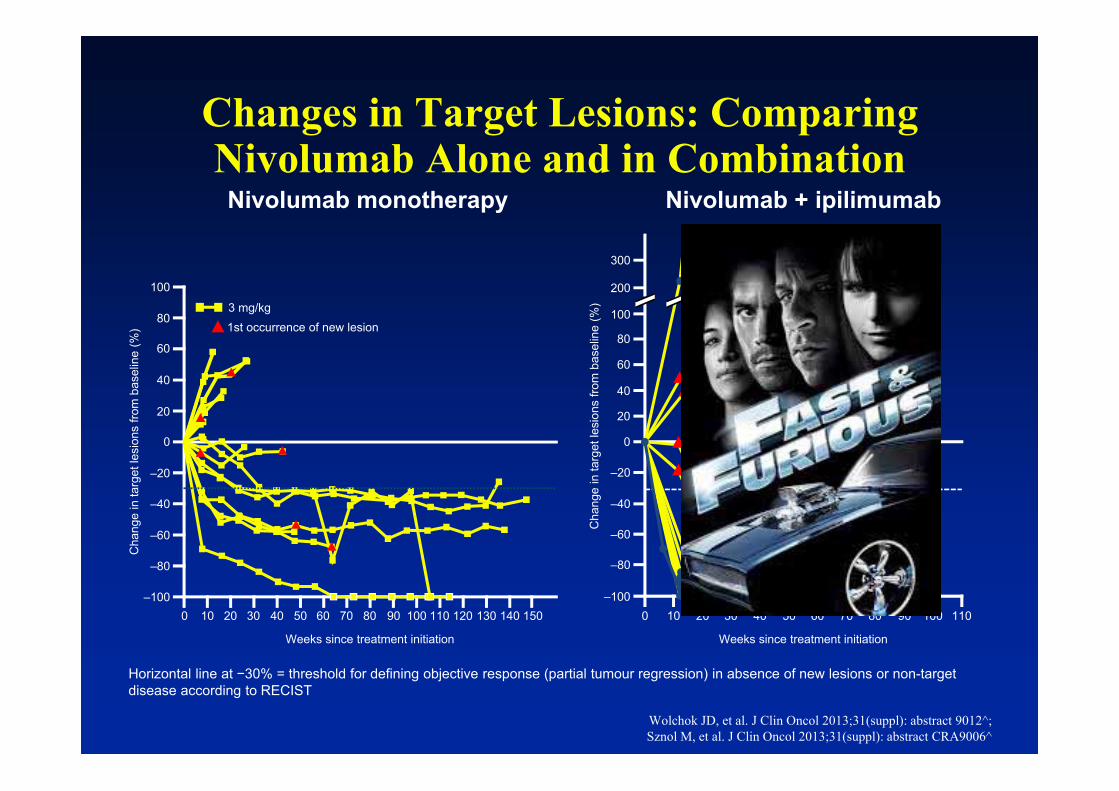
Changes in Target Lesions: Comparing Nivolumab Alone and in Combination
Wolchok JD, et al. J Clin Oncol 2013;31(suppl): abstract 9012^; Sznol M, et al. J Clin Oncol 2013;31(suppl): abstract CRA9006^
Horizontal line at −30% = threshold for defining objective response (partial tumour regression) in absence of new lesions or non-target disease according to RECIST
Nivolumab monotherapy
1st occurrence of new lesion3 mg/kg
Weeks since treatment initiation
Cha
nge
in ta
rget
lesi
ons
from
bas
elin
e (%
)
0 10 20 30 40 50 60 70 80 90 100 110 120 130 140 150–100
–80
–60
–40
–20
0
20
40
60
80
100
1 mg/kg nivolumab + 3 mg/kg ipilimumab
First occurrence of new lesion
Weeks since treatment initiation
Cha
nge
in ta
rget
lesi
ons
from
bas
elin
e (%
)–100
–80
–60
–40
–20
0
20
40
60
80
300
100
200
0 10 20 30 40 50 60 70 80 90 100 110
Nivolumab + ipilimumab
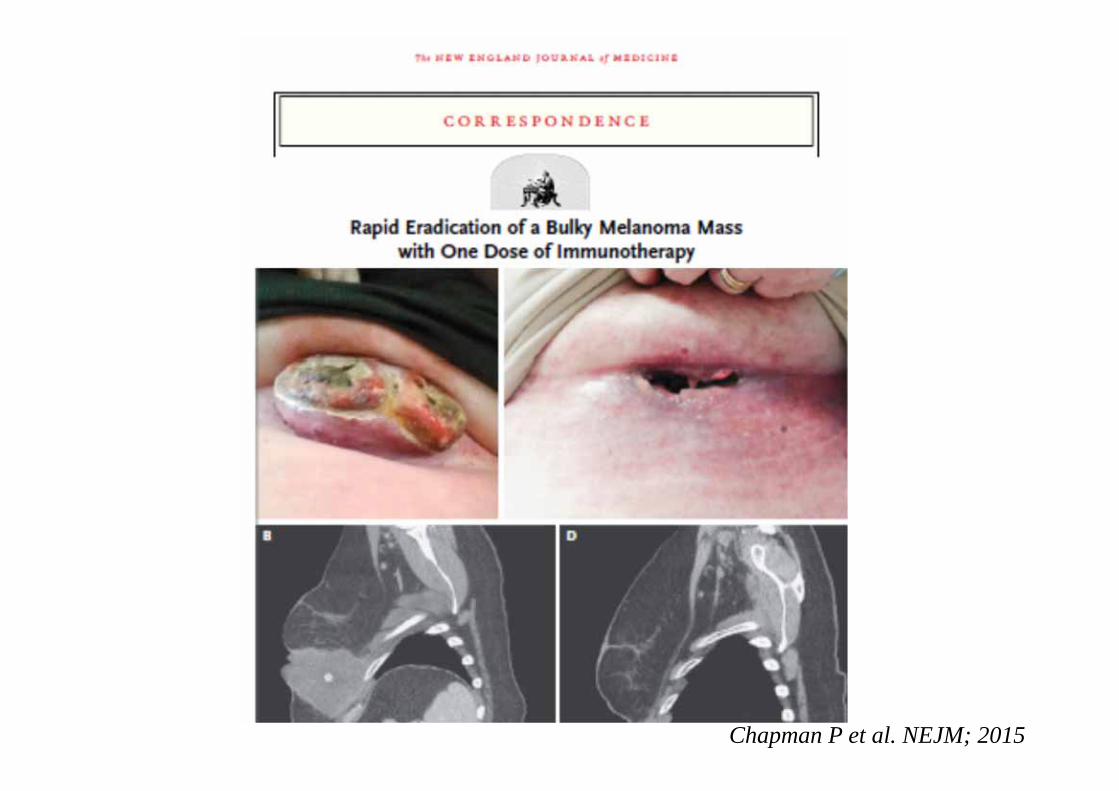
Chapman P et al. NEJM; 2015
MISIPI STUDY: MELANOMA IMMUNOSCORE EVALUATION IN
PATIENTS TREATED WITHIPILIMUMAB

• 200 FPFE samples from metastatic melanoma patients treated with Ipilimumab
• Assess density of different immune populations, using a digital image analysis application to characterize immune infiltrate expression of:– CD3, CD8, CD20, FoxP3 and CD163– PD-L1
• Correlate marker expression profile with clinical outcome; study ongoing.
MISIPI Study
Bifulco C. et al. Journal of Translational Medicine 2014, 12(Suppl 1):P11.
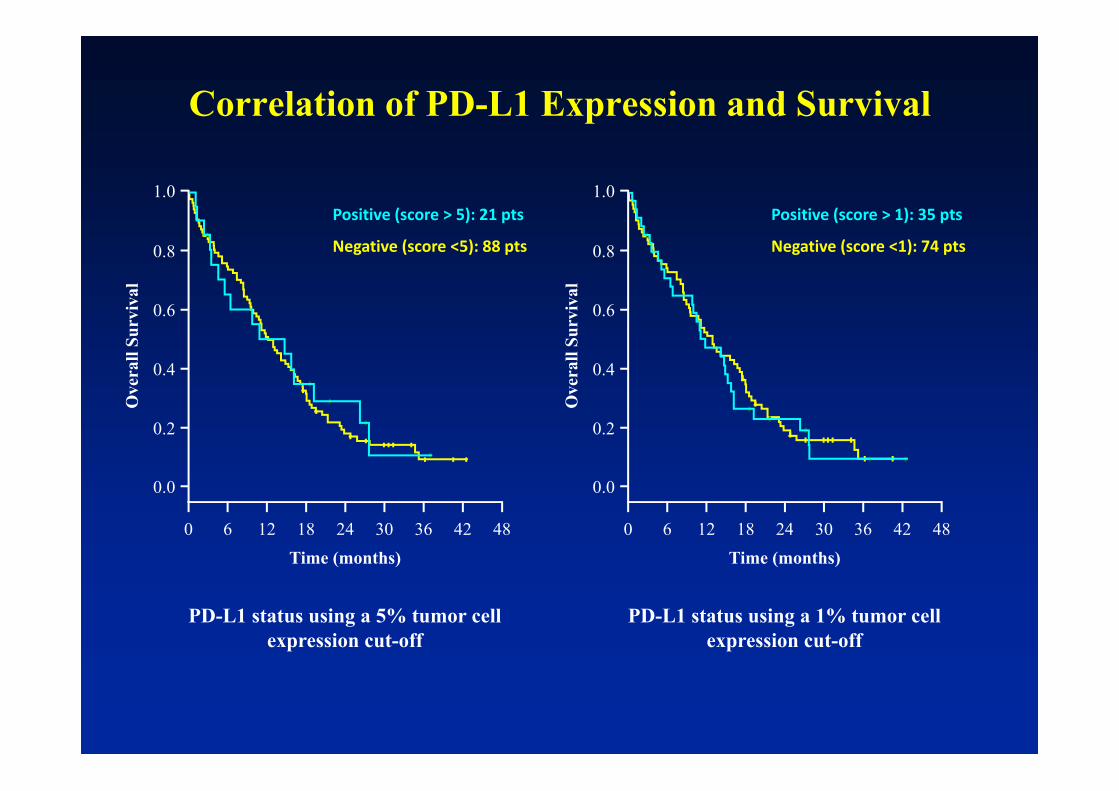
Correlation of PD-L1 Expression and Survival
PD-L1 status using a 5% tumor cell expression cut-off
PD-L1 status using a 1% tumor cell expression cut-off
0
0.2
0.4
0.6
0.8
1.0
0.0
6 12 18 24 30 36 42 48Time (months)
Ove
rall
Surv
ival
0
0.2
0.4
0.6
0.8
1.0
0.0
6 12 18 24 30 36 42 48Time (months)
Ove
rall
Surv
ival
Negative (score <5): 88 pts
Positive (score > 5): 21 pts
Negative (score <1): 74 pts
Positive (score > 1): 35 pts
Is PD-L1 status useful for selecting patients for treatment in lung cancer?

SQ NSCLC - Checkmate 017: OS by PD-L1 Expression
mOS (mo)
Nivolumab Docetaxel
PD-L1 ≥1% 9.3 7.2
PD-L1 <1% 8.7 5.9
mOS (mo)
Nivolumab Docetaxel
PD-L1 ≥5% 10 6.4
PD-L1 <5% 8.5 6.1
mOS (mo)
Nivolumab Docetaxel
PD-L1 ≥10% 11 7.1
PD-L1 <10% 8.2 6.1
1% PD-L1 Expression level 5% PD-L1 Expression level 10% PD-L1 Expression level
Nivolumab PD-L1+Nivolumab PD-L1–
Time (months)
24211815129630
Time (months)
24211815129630
Time (months)
24211815129630
100
90
80
70
60
50
40
30
10
0
20
OS
(%)
24211815129630
100
90
80
70
60
50
40
30
10
0
20
Docetaxel PD-L1+ Docetaxel PD-L1–
Spigel DR et al. ASCO 2015

SQ NSCLC – Keynote 010: OS by PD-L1 Expression
Herbst RS et al. Lancet Oncology 2015
PD-L1 + > 50 %
All patients
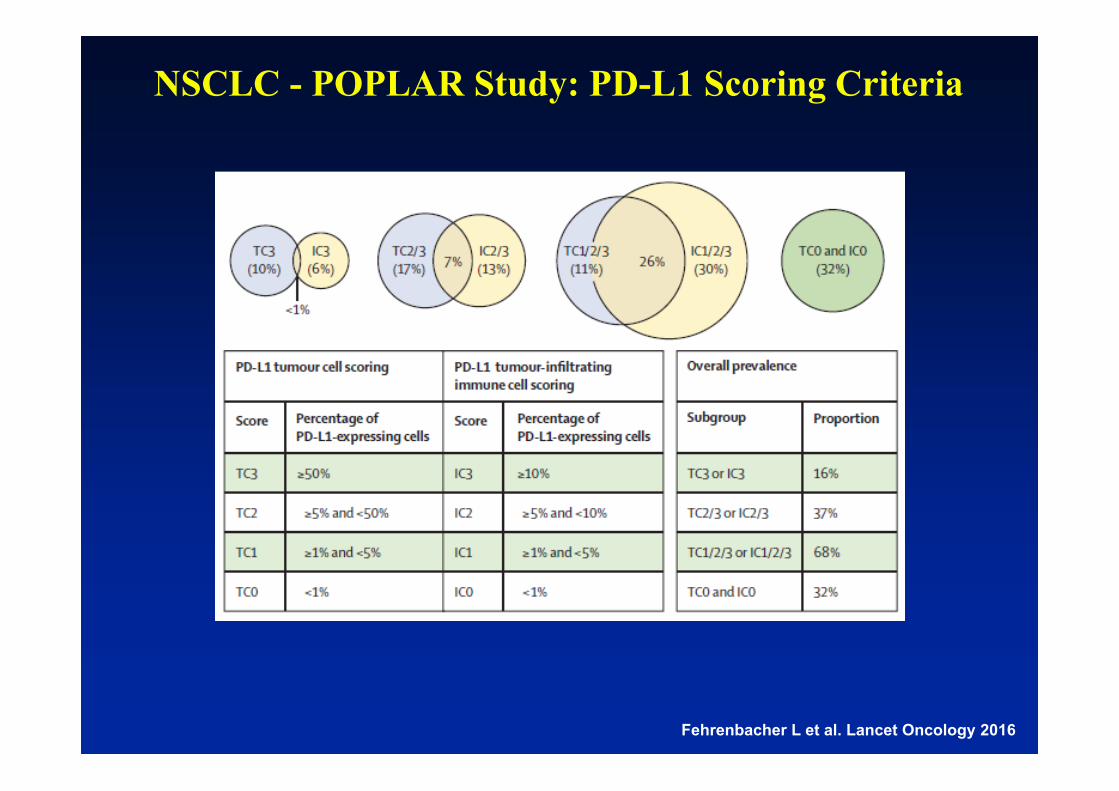
NSCLC - POPLAR Study: PD-L1 Scoring Criteria
Fehrenbacher L et al. Lancet Oncology 2016

NSCLC - POPLAR Study: Overall Survival (ITT)
Fehrenbacher L et al. Lancet Oncology 2016
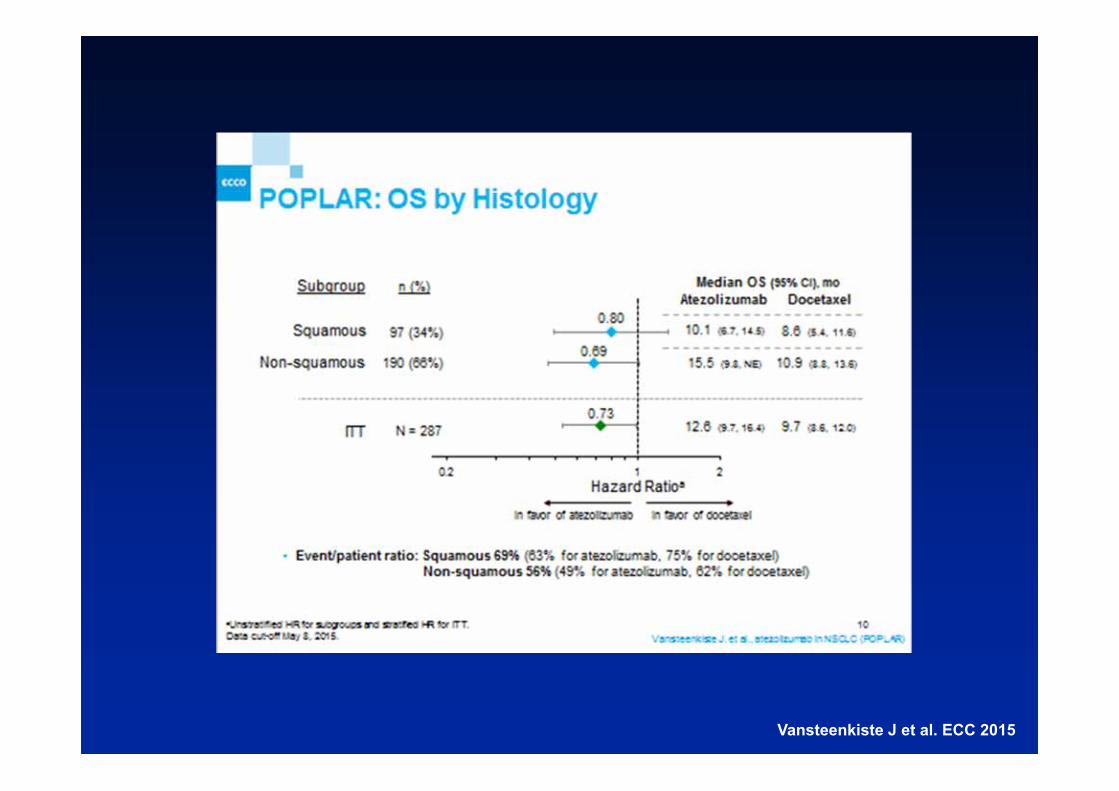
Vansteenkiste J et al. ECC 2015

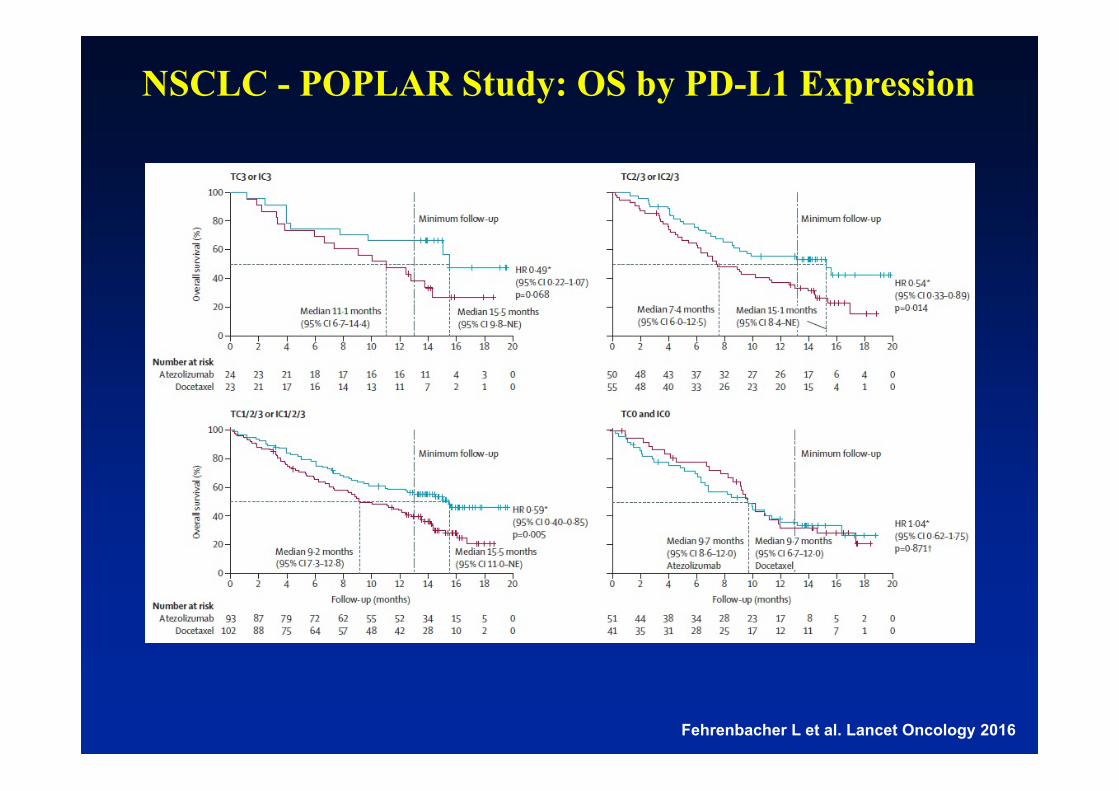
NSCLC - POPLAR Study: OS by PD-L1 Expression
Fehrenbacher L et al. Lancet Oncology 2016
NSCLC - POPLAR Study: OS by PD-L1 Expression
Fehrenbacher L et al. Lancet Oncology 2016

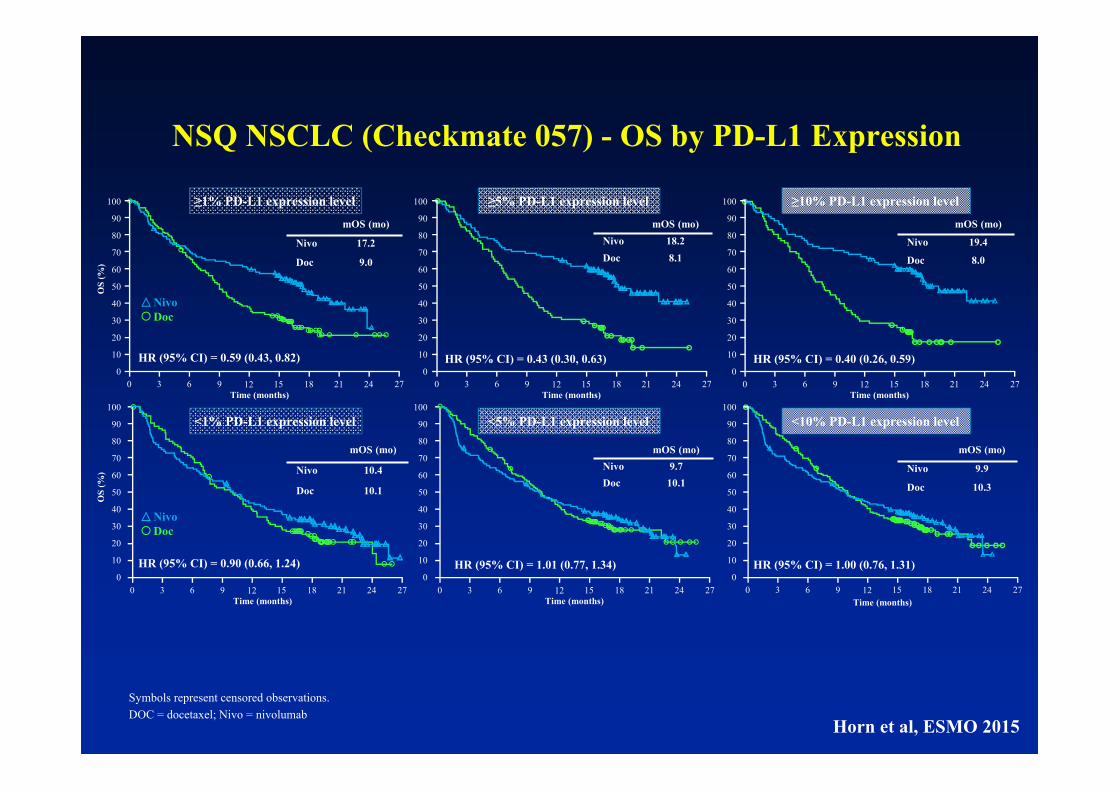
NSQ NSCLC (Checkmate 057) - OS by PD-L1 Expression
NivoDoc
mOS (mo)
Nivo 17.2
Doc 9.0
mOS (mo)
Nivo 19.4
Doc 8.0
Time (months)
≥5% PD-L1 expression level
mOS (mo)Nivo 18.2Doc 8.1
≥1% PD-L1 expression level
HR (95% CI) = 0.59 (0.43, 0.82)
Time (months)
HR (95% CI) = 0.43 (0.30, 0.63)
OS
(%)
Time (months)
≥10% PD-L1 expression level
HR (95% CI) = 0.40 (0.26, 0.59)
24211815129630 27
100
90
80
70
60
50
40
30
10
0
20
24211815129630 27
100
90
80
70
60
50
40
30
10
0
20
24211815129630 27
100
90
80
70
60
50
40
30
10
0
20
Symbols represent censored observations.DOC = docetaxel; Nivo = nivolumab
Horn et al, ESMO 2015
Symbols represent censored observations.DOC = docetaxel; Nivo = nivolumab
NivoDoc
100
90
80
70
60
50
40
30
10
0
20
Time (months)
100
90
80
70
60
50
40
30
10
0
20
24211815129630 27Time (months)
24211815129630 27
mOS (mo)
Nivo 10.4
Doc 10.1
mOS (mo)
Nivo 17.2
Doc 9.0
mOS (mo)
Nivo 9.9
Doc 10.3
mOS (mo)
Nivo 19.4
Doc 8.0
Time (months)
≥5% PD-L1 expression level
<5% PD-L1 expression level
mOS (mo)Nivo 18.2Doc 8.1
mOS (mo)Nivo 9.7Doc 10.1
≥1% PD-L1 expression level
HR (95% CI) = 0.59 (0.43, 0.82)
Time (months)
<1% PD-L1 expression level
OS
(%)
HR (95% CI) = 0.90 (0.66, 1.24)
HR (95% CI) = 0.43 (0.30, 0.63)
HR (95% CI) = 1.01 (0.77, 1.34)
OS
(%)
Time (months)
Time (months)
≥10% PD-L1 expression level
<10% PD-L1 expression level
HR (95% CI) = 0.40 (0.26, 0.59)
HR (95% CI) = 1.00 (0.76, 1.31)
24211815129630 27
100
90
80
70
60
50
40
30
10
0
20
100
90
80
70
60
50
40
30
10
0
20
24211815129630 27
24211815129630 27
100
90
80
70
60
50
40
30
10
0
20
24211815129630 27
100
90
80
70
60
50
40
30
10
0
20
NivoDoc
NSQ NSCLC (Checkmate 057) - OS by PD-L1 Expression
Horn et al, ESMO 2015
10090807060504030
100
20
27181596 211230 24 30
NivolumabDocetaxel
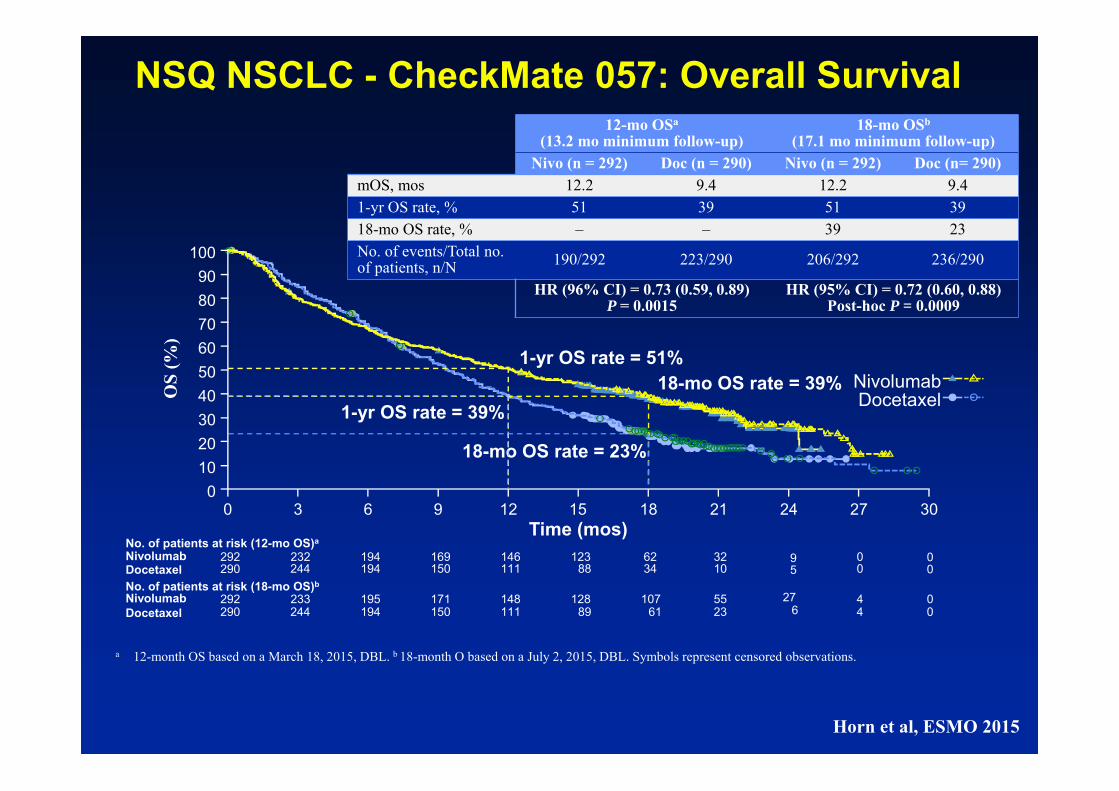
18-mo OS rate = 23%
18-mo OS rate = 39%1-yr OS rate = 39%
1-yr OS rate = 51%
Time (mos)
OS
(%)
NivolumabDocetaxel
No. of patients at risk (18-mo OS)b
292 233 195 171 148 128 107 55 427290 244 194 150 111 89 61 23 4
006
NivolumabDocetaxel
No. of patients at risk (12-mo OS)a
292 232 194 169 146 123 62 32 09290 244 194 150 111 88 34 10 05
00
12-mo OSa
(13.2 mo minimum follow-up)18-mo OSb
(17.1 mo minimum follow-up)Nivo (n = 292) Doc (n = 290) Nivo (n = 292) Doc (n= 290)
mOS, mos 12.2 9.4 12.2 9.41-yr OS rate, % 51 39 51 3918-mo OS rate, % – – 39 23No. of events/Total no. of patients, n/N 190/292 223/290 206/292 236/290
HR (96% CI) = 0.73 (0.59, 0.89)P = 0.0015
HR (95% CI) = 0.72 (0.60, 0.88)Post-hoc P = 0.0009
a 12-month OS based on a March 18, 2015, DBL. b 18-month O based on a July 2, 2015, DBL. Symbols represent censored observations.
NSQ NSCLC - CheckMate 057: Overall Survival
Horn et al, ESMO 2015

10090807060504030
100
20
27181596 211230 24 30
NivolumabDocetaxel
18-mo OS rate = 23%
18-mo OS rate = 39%1-yr OS rate = 39%
1-yr OS rate = 51%
Time (mos)
OS
(%)
NivolumabDocetaxel
No. of patients at risk (18-mo OS)b
292 233 195 171 148 128 107 55 427290 244 194 150 111 89 61 23 4
006
NivolumabDocetaxel
No. of patients at risk (12-mo OS)a
292 232 194 169 146 123 62 32 09290 244 194 150 111 88 34 10 05
00
12-mo OSa
(13.2 mo minimum follow-up)18-mo OSb
(17.1 mo minimum follow-up)Nivo (n = 292) Doc (n = 290) Nivo (n = 292) Doc (n= 290)
mOS, mos 12.2 9.4 12.2 9.41-yr OS rate, % 51 39 51 3918-mo OS rate, % – – 39 23No. of events/Total no. of patients, n/N 190/292 223/290 206/292 236/290
HR (96% CI) = 0.73 (0.59, 0.89)P = 0.0015
HR (95% CI) = 0.72 (0.60, 0.88)Post-hoc P = 0.0009
a 12-month OS based on a March 18, 2015, DBL. b 18-month O based on a July 2, 2015, DBL. Symbols represent censored observations.
NSQ NSCLC - CheckMate 057: Overall Survival
Horn et al, ESMO 2015
Is PD-L1 status useful for selecting patients for treatment in other
cancers?

RCC – Checkmate 025 - Overall survivalMedian OS, months (95% CI)
Nivolumab 25.0 (21.8–NE)Everolimus 19.6 (17.6–23.1)
HR (98.5% CI): 0.73 (0.57–0.93)P = 0.0018
0 3 6 129 15Months
18 21 24 27 30 33
No. of patients at riskNivolumab 410 389 359 337 305 275 213 139 73 29 3 0
411 366 324 287 265 241 187 115 61 20 2 0Everolimus
0.0
0.3
0.1
0.2
0.4
0.5
0.6
0.7
0.8
0.9
1.0O
vera
ll Su
rviv
al (P
roba
bilit
y)
Nivolumab
Everolimus
Minimum follow-up was 14 months.NE, not estimable. Sharma P et al, ECC 2015

RCC Checkmate 025 - Overall survival by PD-L1 expression
PD-L1 <1% (n = 76%)Median OS, months (95% CI)
Nivolumab 21.8 (16.5–28.1)Everolimus 18.8 (11.9–19.9)
No. of patients at riskNivolumab 94 86 79 73 66 58 45 31 18 4 1 0Everolimus 87 77 68 59 52 47 40 19 9 4 1 0
0.00 3 6 129 15
Months18 21 24 27 30 33
0.3
0.1
0.2
0.4
0.5
0.6
0.7
0.8
0.9
1.0
Ove
rall
Surv
ival
(Pro
babi
lity)
Nivolumab
Everolimus
PD-L1 ≥1% (n = 24%)Median OS, months (95% CI)
Nivolumab 27.4 (21.4–NE)Everolimus 21.2 (17.7–26.2)
276 265 245 233 210 189 145 94 48 22 2 0299 267 238 214 200 182 137 92 51 16 1 0
Nivolumab
0 3 6 129 15Months
18 21 24 27 30 33
0.3
0.1
0.2
0.4
0.5
0.6
0.7
0.8
0.9
1.0
0.0
Everolimus
HR (95% CI): 0.79 (0.53–1.17)HR (95% CI): 0.77 (0.60–0.97)
Sharma P et al, ECC 2015
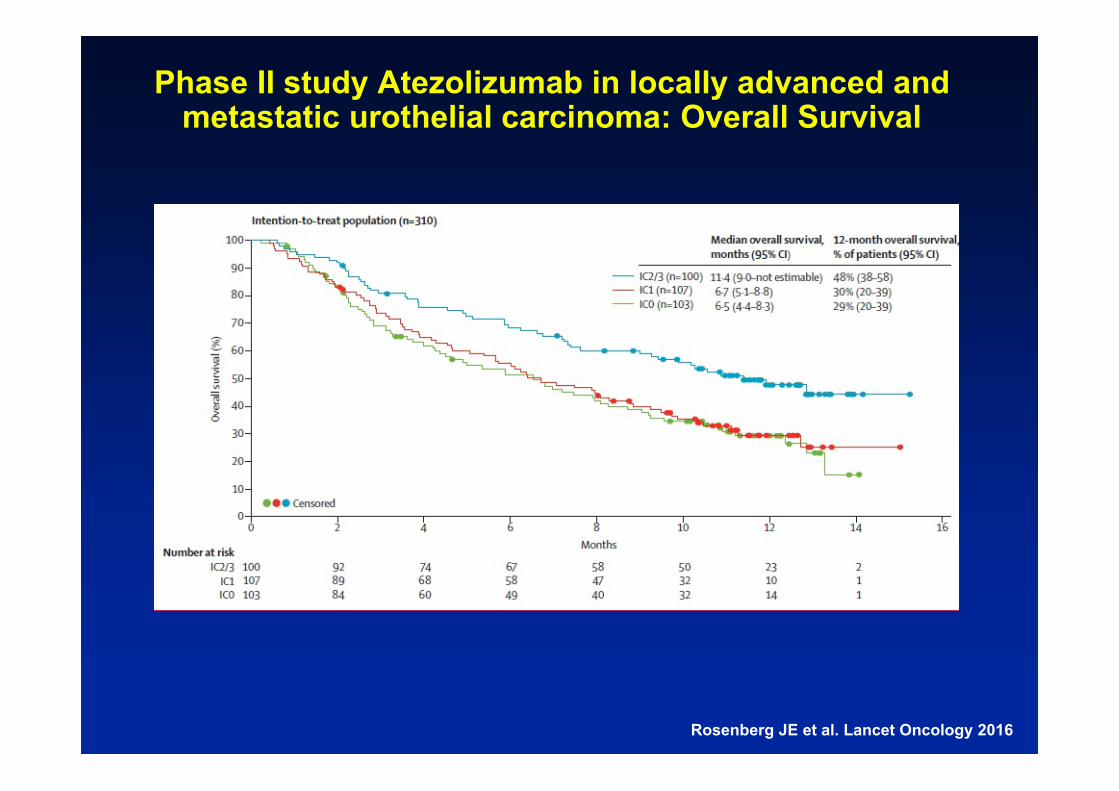
Phase II study Atezolizumab in locally advanced andmetastatic urothelial carcinoma: Overall Survival
Rosenberg JE et al. Lancet Oncology 2016

…the use of PD-L1 as a biomarker is problematic and otherbiomarkers are emerging as potentially more importantpredictive factors of response. Until then, decisions abouttreatment options need to be made on an individual patient basis, withclinicians accepting that full understanding of PD-L1 is far fromcomplete and erring on the side of caution so as to ensure thatotherwise eligible patients are not denied the chance of an effectivetreatment.
Fusi A et al. Lancet Oncology 2015


Slide 10
Presented By Dung Le at 2015 ASCO Annual Meeting

ChairPaolo A. AsciertoMedical OncologistsEster SimeoneAntonio M. GrimaldiLucia FestinoDermatologistsFabrizio AyalaRossella Di TrolioMarco PallaLuigi ScarpatoResearch GroupRosalba CamerlingoMariaelena CaponeRosaria FalconeFederica FratangeloGabriele MadonnaDomenico Mallardo Chiara Botti
Study Coordinators/Data ManagerSusy EspositoMiriam PaoneMarcello CurviettoGianni RinaldiResearch NursesFederica HuberRaffaella Furia
Secretary’s OfficeMariarosaria CeccoAnna Riccio
Via Mariano Semmola, 80131, Napoli, ItalyTel. +39 081 5903 431; Fax +39 081 5903 841Email: [email protected]
Melanoma, Cancer Immunotherapyand Innovative Therapies UnitIstituto Nazionale Tumori – Fondazione “G. Pascale”