pcp hsc project
TRANSCRIPT
8/14/2019 Pcp Hsc Project
http://slidepdf.com/reader/full/pcp-hsc-project 1/25
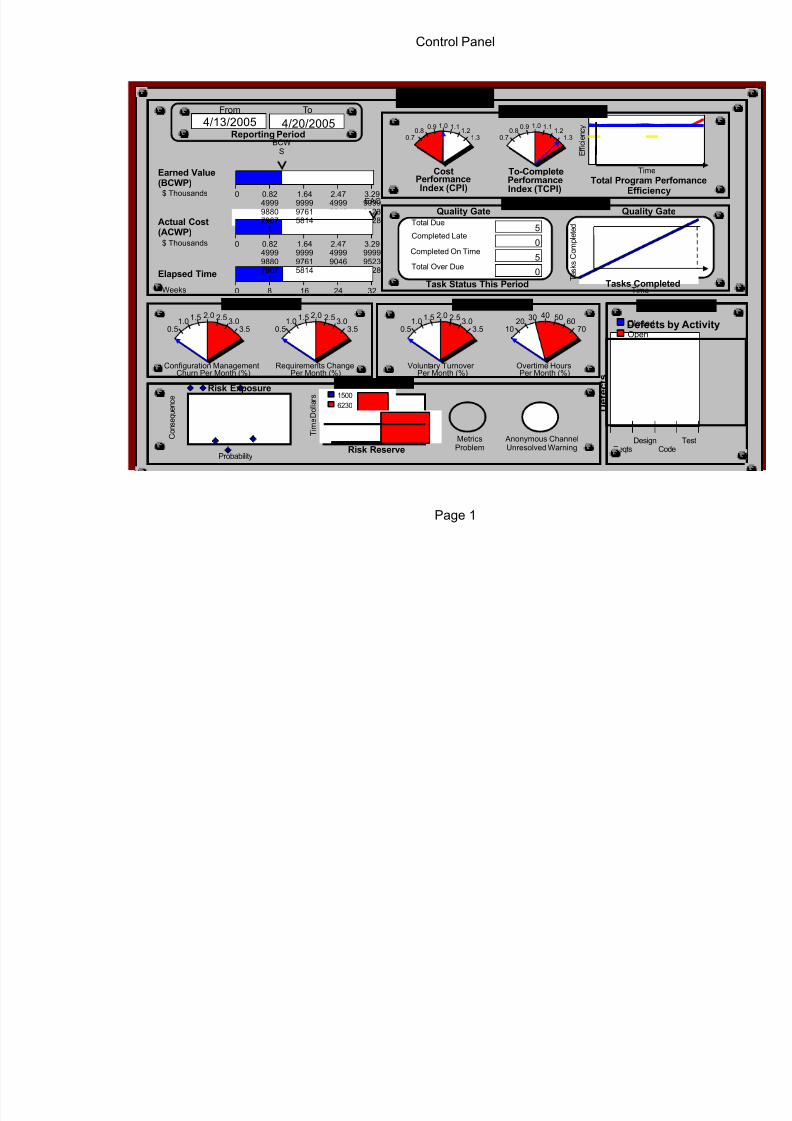
Control Panel
Page 1
Probability
Consequence
15006230
Dollars
Time
ReqtsDesign
CodeTest
Defects by ActivityClosed
Open
Defects
Time
Efficiency
4/13/2005
3.2999999523
1628
2.4749999046
3257
2.47499990463257
3.29999995231628
3224
CHANGE
Time
TasksCompleted
Earned Value(BCWP)
$ Thousands
$ Thousands
Weeks
4/20/2005
PROGRESS
COMPLETION
PRODUCTIVITY
STAFF QUALITY
RISK
CostPerformanceIndex (CPI)
PerformanceIndex (TCPI)
To-Complete
Configuration ManagementChurn Per Month (%)
Requirements ChangePer Month (%)
Voluntary Turnover Per Month (%)
Overtime HoursPer Month (%)
Actual Cost(ACWP)
Elapsed Time
Reporting Period
From To
Completed On Time
Total DueCompleted Late
Total Over Due
0 1.6499999761
5814
0.8249999880
79071
Total Program PerfomanceEfficiency
Quality Gate Quality Gate
Task Status This Period Tasks Completed
Risk Exposure
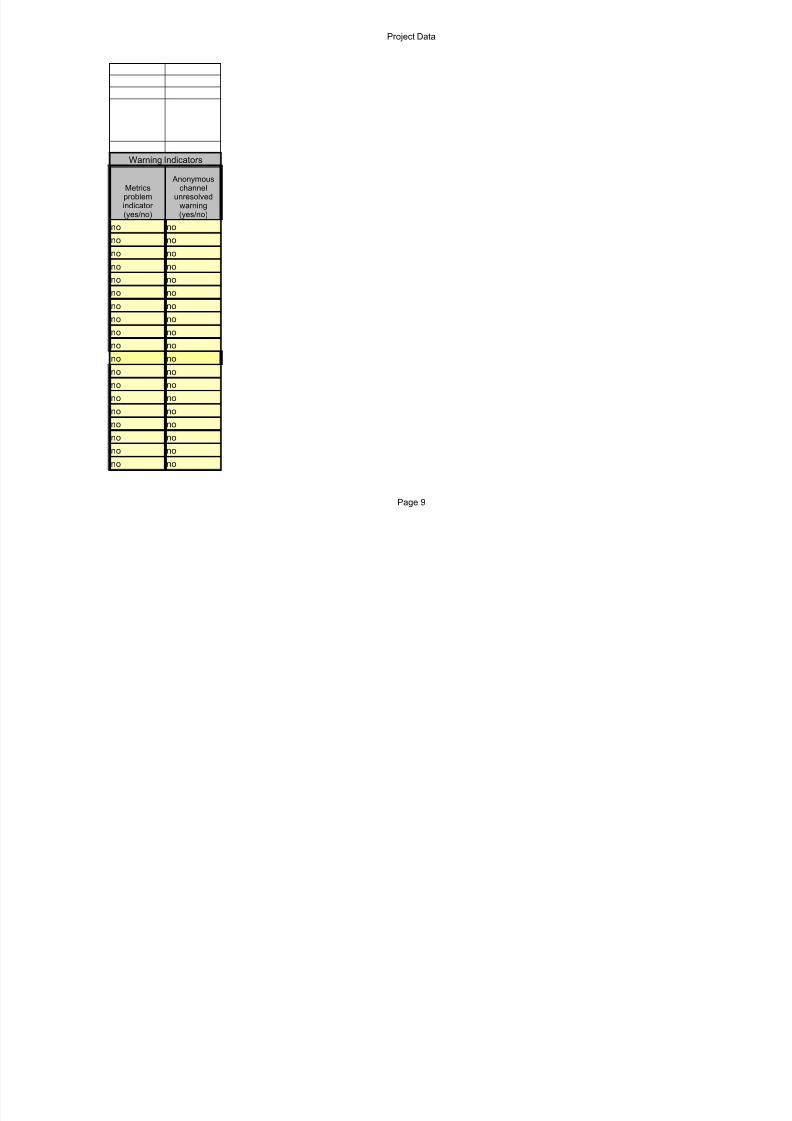
Risk ReserveMetrics
ProblemAnonymous ChannelUnresolved Warning
0 1.64999997615814
0.82499998807907
10 168
0.70.8 0.9 1.0 1.1 1.2
1.3 0.70.8 0.9 1.0 1.1 1.2
1.3
0.51.0 1.5 2.0 2.5 3.0
3.5 0.51.0 1.5 2.0 2.5 3.0
3.5 0.51.0 1.5 2.0 2.5 3.0
3.5 1020 30 40 50 60
70
50
50
BCWS
EAC

8/14/2019 Pcp Hsc Project
http://slidepdf.com/reader/full/pcp-hsc-project 2/25
8/14/2019 Pcp Hsc Project
http://slidepdf.com/reader/full/pcp-hsc-project 3/25
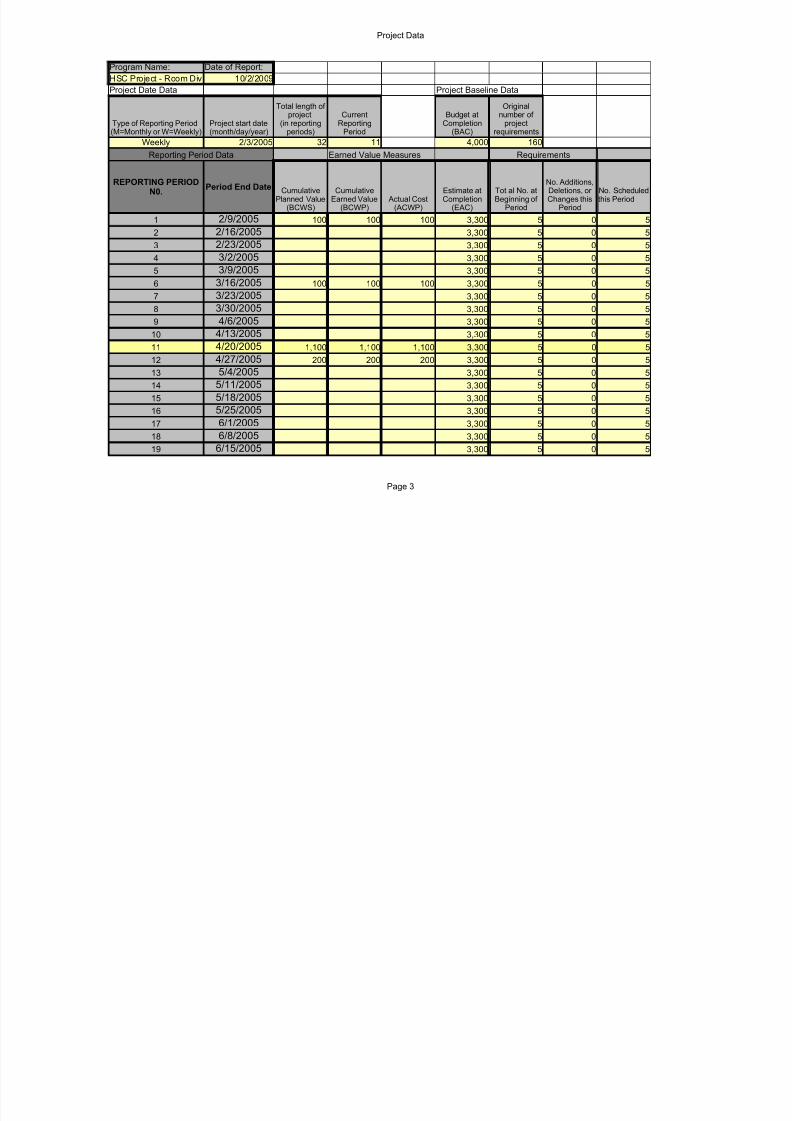
Project Data
Page 3
Program Name: Date of Report:HSC Project - Room Divi 10/2/2009Project Date Data Project Baseline Data
Weekly 2/3/2005 32 11 4,000 160Reporting Period Data Earned Value Measures Requirements
Period End Date
1 2/9/2005 100 100 100 3,300 5 0 52 2/16/2005 3,300 5 0 53 2/23/2005 3,300 5 0 54 3/2/2005 3,300 5 0 55 3/9/2005 3,300 5 0 56 3/16/2005 100 100 100 3,300 5 0 57 3/23/2005 3,300 5 0 58 3/30/2005 3,300 5 0 59 4/6/2005 3,300 5 0 5
10 4/13/2005 3,300 5 0 511 4/20/2005 1,100 1,100 1,100 3,300 5 0 512 4/27/2005 200 200 200 3,300 5 0 513 5/4/2005 3,300 5 0 514 5/11/2005 3,300 5 0 515 5/18/2005 3,300 5 0 516 5/25/2005 3,300 5 0 517 6/1/2005 3,300 5 0 518 6/8/2005 3,300 5 0 519 6/15/2005 3,300 5 0 5
Type of Reporting Period(M=Monthly or W=Weekly)
Project start date(month/day/year)
Total length of project
(in reportingperiods)
CurrentReporting
Period
Budget atCompletion
(BAC)
Originalnumber of
projectrequirements
REPORTING PERIODN0. Cumulative
Planned Value(BCWS)
CumulativeEarned Value
(BCWP)Actual Cost
(ACWP)
Estimate atCompletion
(EAC)
Tot al No. atBeginning of
Period
No. Additions,Deletions, or Changes this
Period
No. Scheduledthis Period
8/14/2019 Pcp Hsc Project
http://slidepdf.com/reader/full/pcp-hsc-project 4/25
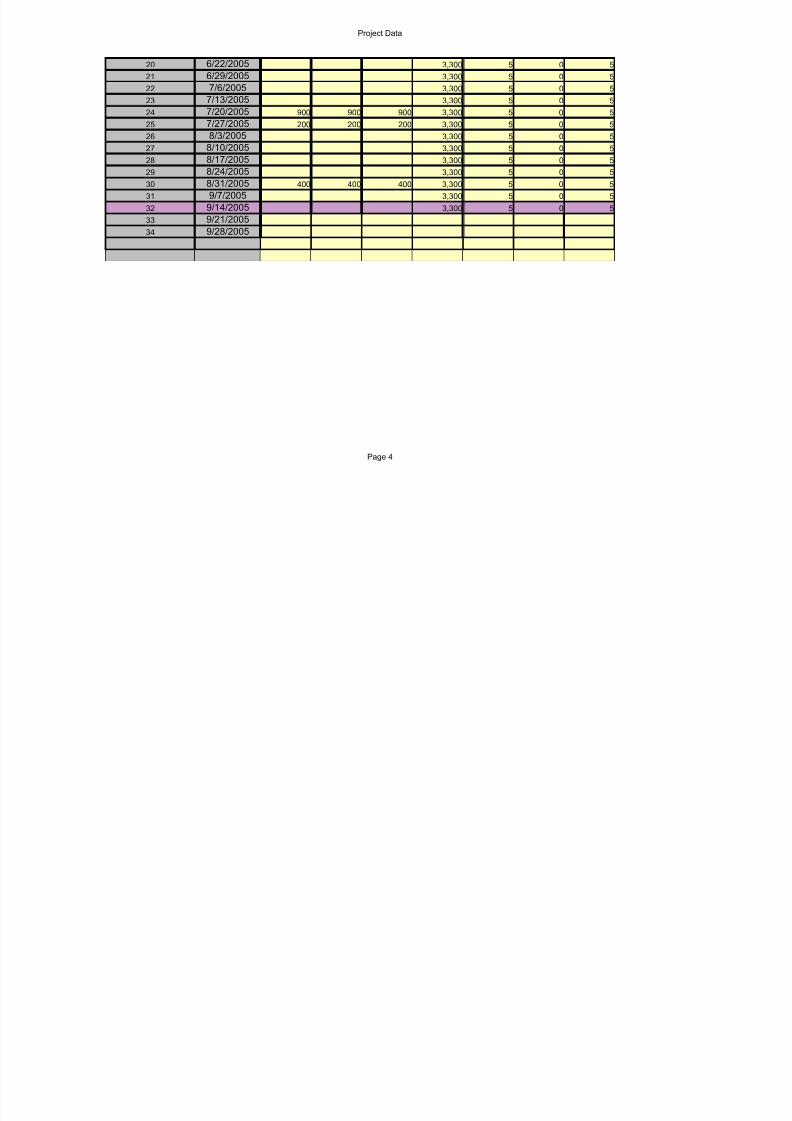
Project Data
Page 4
20 6/22/2005 3,300 5 0 521 6/29/2005 3,300 5 0 522 7/6/2005 3,300 5 0 523 7/13/2005 3,300 5 0 5
24 7/20/2005 900 900 900 3,300 5 0 525 7/27/2005 200 200 200 3,300 5 0 526 8/3/2005 3,300 5 0 527 8/10/2005 3,300 5 0 528 8/17/2005 3,300 5 0 529 8/24/2005 3,300 5 0 530 8/31/2005 400 400 400 3,300 5 0 531 9/7/2005 3,300 5 0 532 9/14/2005 3,300 5 0 5
33 9/21/200534 9/28/2005

8/14/2019 Pcp Hsc Project
http://slidepdf.com/reader/full/pcp-hsc-project 5/25
8/14/2019 Pcp Hsc Project
http://slidepdf.com/reader/full/pcp-hsc-project 6/25
Project Data
Page 6
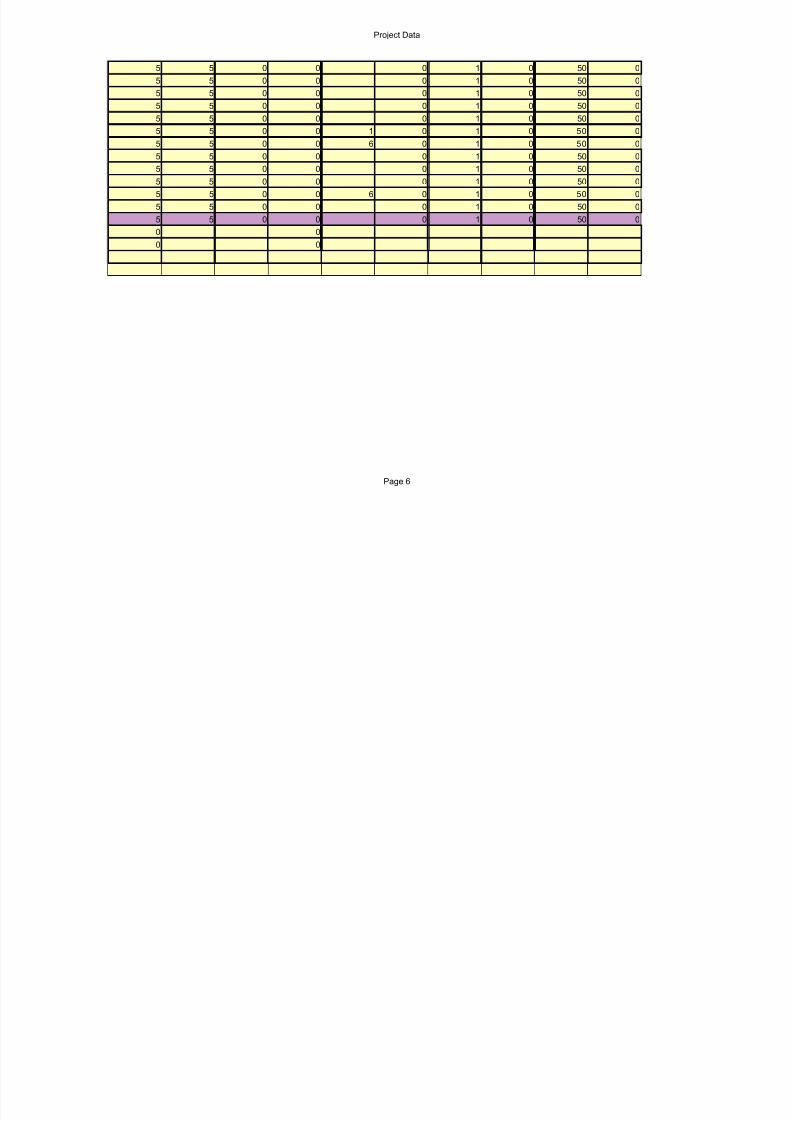
5 5 0 0 0 1 0 50 05 5 0 0 0 1 0 50 05 5 0 0 0 1 0 50 05 5 0 0 0 1 0 50 05 5 0 0 0 1 0 50 05 5 0 0 1 0 1 0 50 05 5 0 0 6 0 1 0 50 05 5 0 0 0 1 0 50 05 5 0 0 0 1 0 50 05 5 0 0 0 1 0 50 05 5 0 0 6 0 1 0 50 05 5 0 0 0 1 0 50 0
5 5 0 0 0 1 0 50 00 00 0

8/14/2019 Pcp Hsc Project
http://slidepdf.com/reader/full/pcp-hsc-project 7/25
Project Data
Page 7
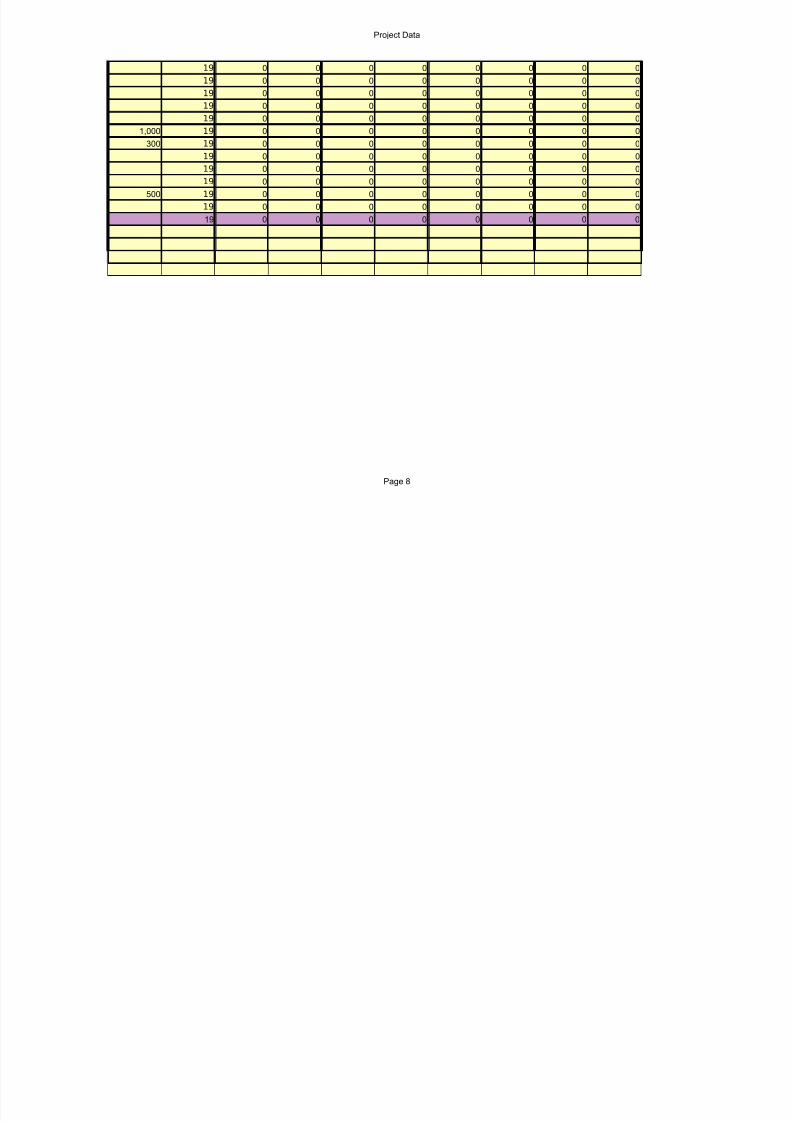
Risk Reserve Defects By Activity
200 19 0 0 0 19 0 0 0 019 0 0 0 18 0 0 0 019 0 0 0 0 0 0 0 019 0 0 0 0 0 0 0 019 0 0 0 0 0 0 0 0
200 19 0 0 0 0 0 0 0 019 0 0 0 0 0 0 0 019 0 0 0 0 0 0 0 0
19 0 0 0 0 0 0 0 019 0 0 0 0 0 0 0 0
1,500 19 0 0 0 0 0 0 0 0300 19 0 0 0 0 0 0 0 0
19 0 0 0 0 0 0 0 019 0 0 0 0 0 0 0 019 0 0 0 0 0 0 0 019 0 0 0 0 0 0 0 019 0 0 0 0 0 0 0 019 0 0 0 0 0 0 0 019 0 0 0 0 0 0 0 0
TotalBudget Risk
Reserve($)
Total ScheduleRisk Reserve
(days)Requirement
defects openRequirement
defects closedDesign defects
openDesign defects
closedConstruction
defects openConstruction
defects closedFinishing
defects openFinishing
defects closed
8/14/2019 Pcp Hsc Project
http://slidepdf.com/reader/full/pcp-hsc-project 8/25
Project Data
Page 8
19 0 0 0 0 0 0 0 019 0 0 0 0 0 0 0 019 0 0 0 0 0 0 0 019 0 0 0 0 0 0 0 019 0 0 0 0 0 0 0 0
1,000 19 0 0 0 0 0 0 0 0300 19 0 0 0 0 0 0 0 0
19 0 0 0 0 0 0 0 019 0 0 0 0 0 0 0 019 0 0 0 0 0 0 0 0
500 19 0 0 0 0 0 0 0 019 0 0 0 0 0 0 0 019 0 0 0 0 0 0 0 0
8/14/2019 Pcp Hsc Project
http://slidepdf.com/reader/full/pcp-hsc-project 9/25

8/14/2019 Pcp Hsc Project
http://slidepdf.com/reader/full/pcp-hsc-project 10/25
Project Data
Page 10
no nono nono nono nono nono nono nono nono nono nono nono nono no

8/14/2019 Pcp Hsc Project
http://slidepdf.com/reader/full/pcp-hsc-project 11/25
Risk Data
1 5 0.50 02 2 0.70 6003 249 0.20 3,3004 249 0.60 3,3005 249 0.60 3,3006 0 0.40 5007 249 0.30 3,30089
1011
RISK DATA
RISK No.
Estimated riskconsequence -
in daysProbability of
risk occurrance
Estimated riskconsequence -
in dollars ($)

8/14/2019 Pcp Hsc Project
http://slidepdf.com/reader/full/pcp-hsc-project 12/25
Earned Value Chart
22879998.xls
1 2 3 4 5 6 7 8 9 10 11$0
$500$1,000$1,500$2,000$2,500$3,000$3,500$4,000$4,500
Earned Value History Graph
Column YColumn Z
Dollars
1 2 3 4 5 6 7 8 9 10 11$0
$200
$400
$600
$800
$1,000
$1,200Column CColumn DColumn E
Reporting Period
Dollars

8/14/2019 Pcp Hsc Project
http://slidepdf.com/reader/full/pcp-hsc-project 13/25
CPI & TCPI Chart
22879998.xls
1 2 3 4 5 6 7 8 9 10 110.00
0.20
0.40
0.60
0.80
1.00
1.20
1.40
CPI and TCPIHistory Graph
Column ABColumn AC
Reporting Period
Note: See the Earned Value Chart for BCWP, ACWP, and BAC historical data.

8/14/2019 Pcp Hsc Project
http://slidepdf.com/reader/full/pcp-hsc-project 14/25
Total Program Performance Chart
22879998.xls
1 2 3 4 5 6 7 8 9 10 11
50%
60%
70%
80%
90%
100%
110%
120%
130%
140%
Total Program Performance Efficiency"Abba Chart"
Efficiency Required to Meetthe Estimate at Completion(TCPI)Efficiency at CompletionCumulative CPICurrent CPI (MonthlyEfficiency)
Time (Reporting Periods)
Efficiency
132%
121%
8/14/2019 Pcp Hsc Project
http://slidepdf.com/reader/full/pcp-hsc-project 15/25
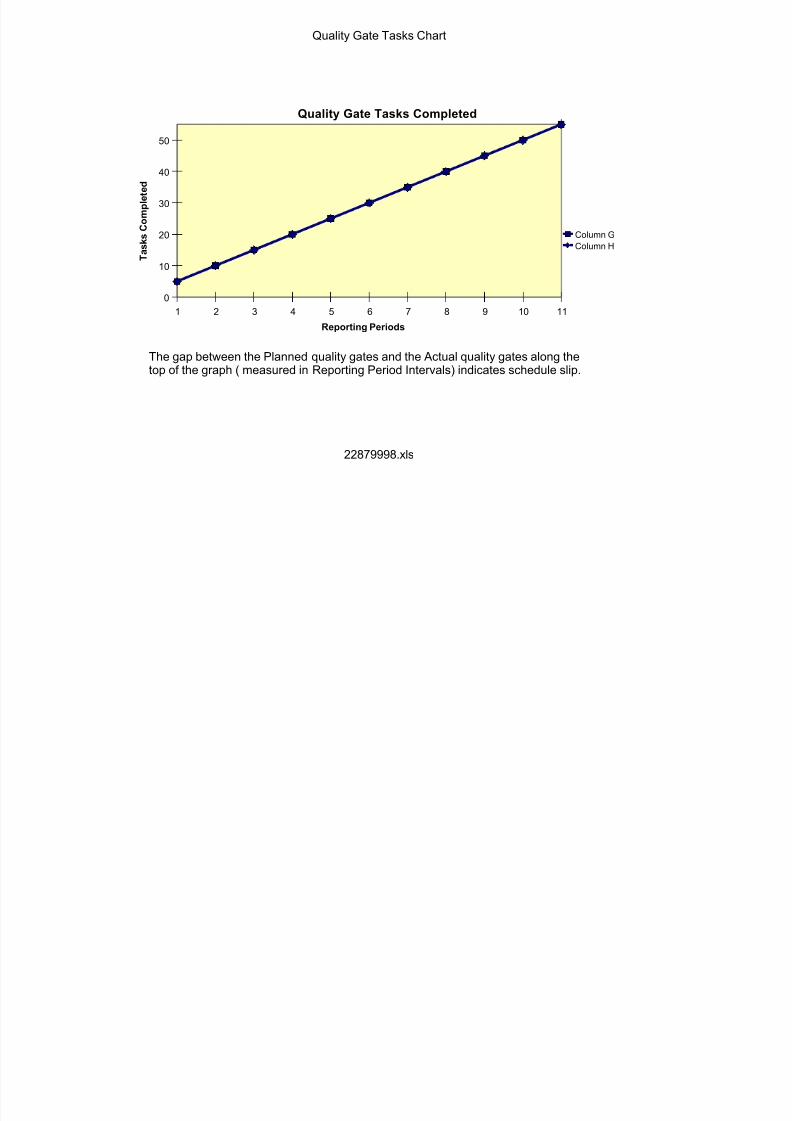
Quality Gate Tasks Chart
22879998.xls
1 2 3 4 5 6 7 8 9 10 110
10
20
30
40
50
Quality Gate Tasks Completed
Column GColumn H
Reporting Periods
TasksCompleted
The gap between the Planned quality gates and the Actual quality gates along thetop of the graph ( measured in Reporting Period Intervals) indicates schedule slip.
8/14/2019 Pcp Hsc Project
http://slidepdf.com/reader/full/pcp-hsc-project 16/25
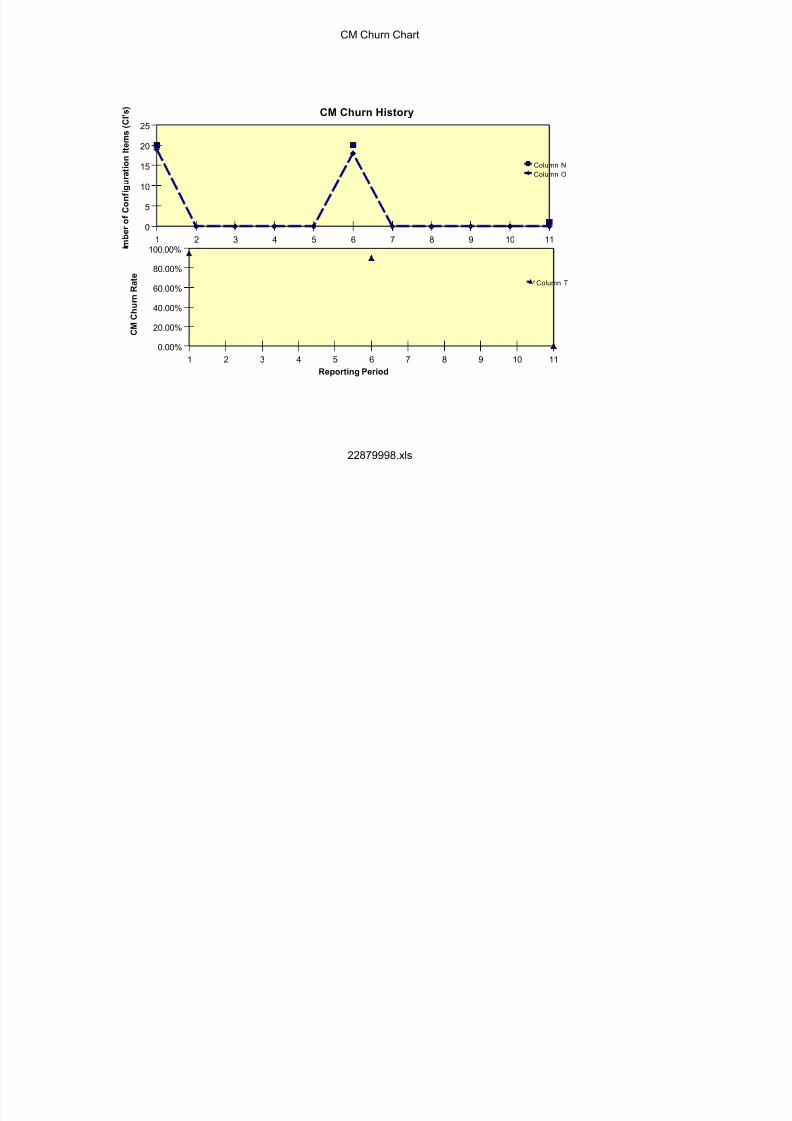
CM Churn Chart
22879998.xls
1 2 3 4 5 6 7 8 9 10 110
5
10
15
20
25 CM Churn History
Column NColumn O
mberofConfigurationItems(CI's)
1 2 3 4 5 6 7 8 9 10 110.00%
20.00%
40.00%
60.00%
80.00%
100.00%
Column T
Reporting Period
CMChurnRate
8/14/2019 Pcp Hsc Project
http://slidepdf.com/reader/full/pcp-hsc-project 17/25
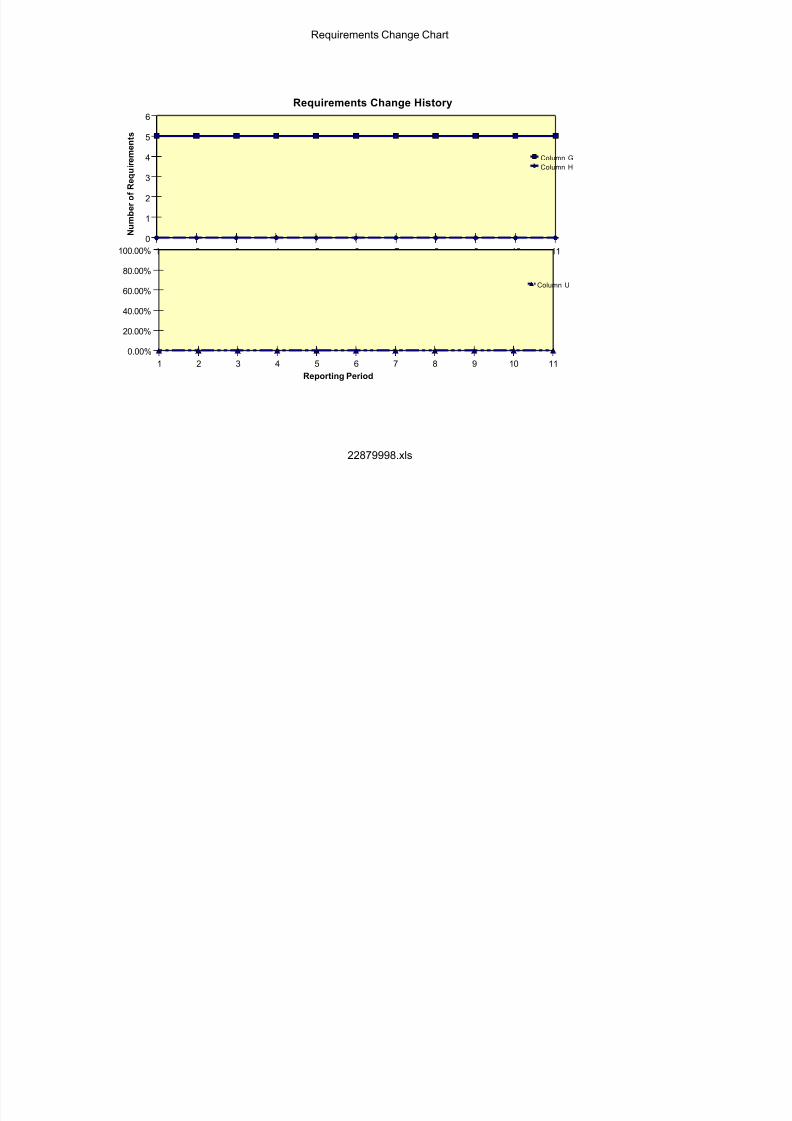
Requirements Change Chart
22879998.xls
1 2 3 4 5 6 7 8 9 10 110
1
2
3
4
5
6
Requirements Change History
Column GColumn H
NumberofRequirements
1 2 3 4 5 6 7 8 9 10 110.00%
20.00%
40.00%
60.00%
80.00%
100.00%
Column U
Reporting Period

8/14/2019 Pcp Hsc Project
http://slidepdf.com/reader/full/pcp-hsc-project 18/25
Voluntary Turnover Chart
22879998.xls
1 2 3 4 5 6 7 8 9 10 110
0
0
1
1
1
1Voluntary Turnover History
Column PColumn Q
Staff
1 2 3 4 5 6 7 8 9 10 110.00%
20.00%
40.00%
60.00%
80.00%
100.00%
Column V
Reporting Period
8/14/2019 Pcp Hsc Project
http://slidepdf.com/reader/full/pcp-hsc-project 19/25
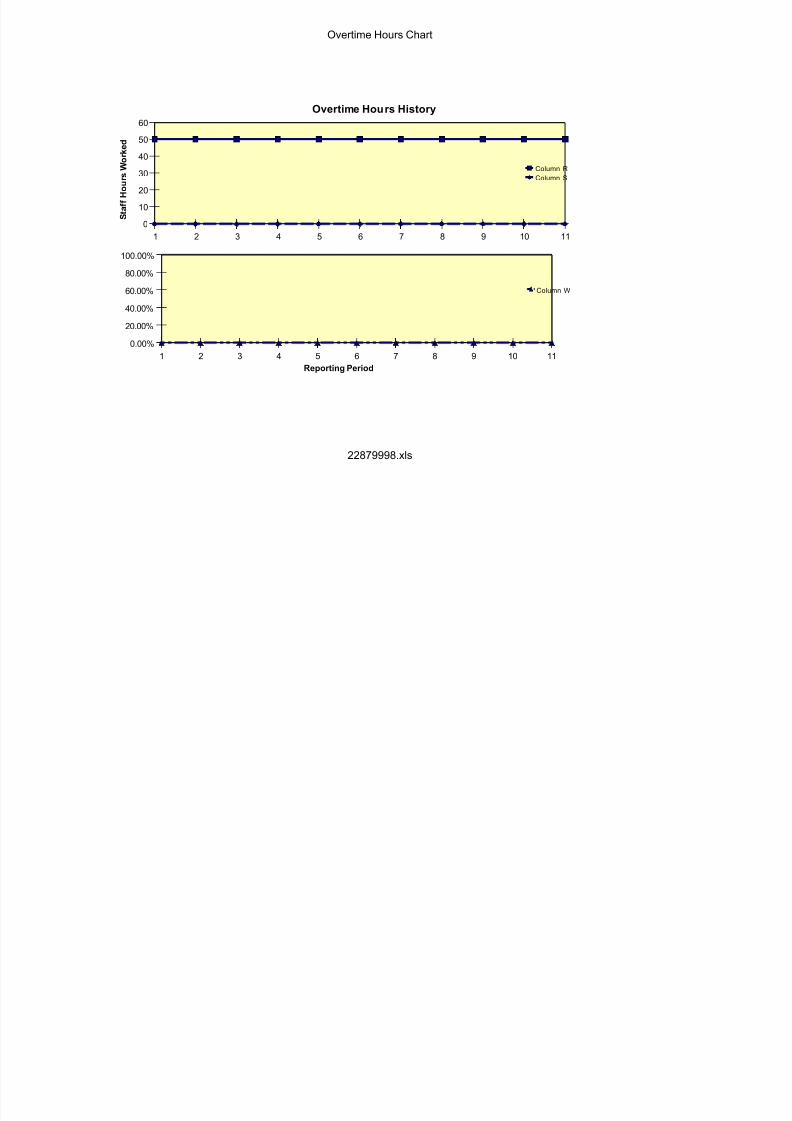
Overtime Hours Chart
22879998.xls
1 2 3 4 5 6 7 8 9 10 110
10
20
30
40
50
60Overtime Hours History
Column RColumn S
StaffHours Worked
1 2 3 4 5 6 7 8 9 10 110.00%
20.00%
40.00%
60.00%
80.00%
100.00%
Column W
Reporting Period

8/14/2019 Pcp Hsc Project
http://slidepdf.com/reader/full/pcp-hsc-project 20/25
8/14/2019 Pcp Hsc Project
http://slidepdf.com/reader/full/pcp-hsc-project 21/25
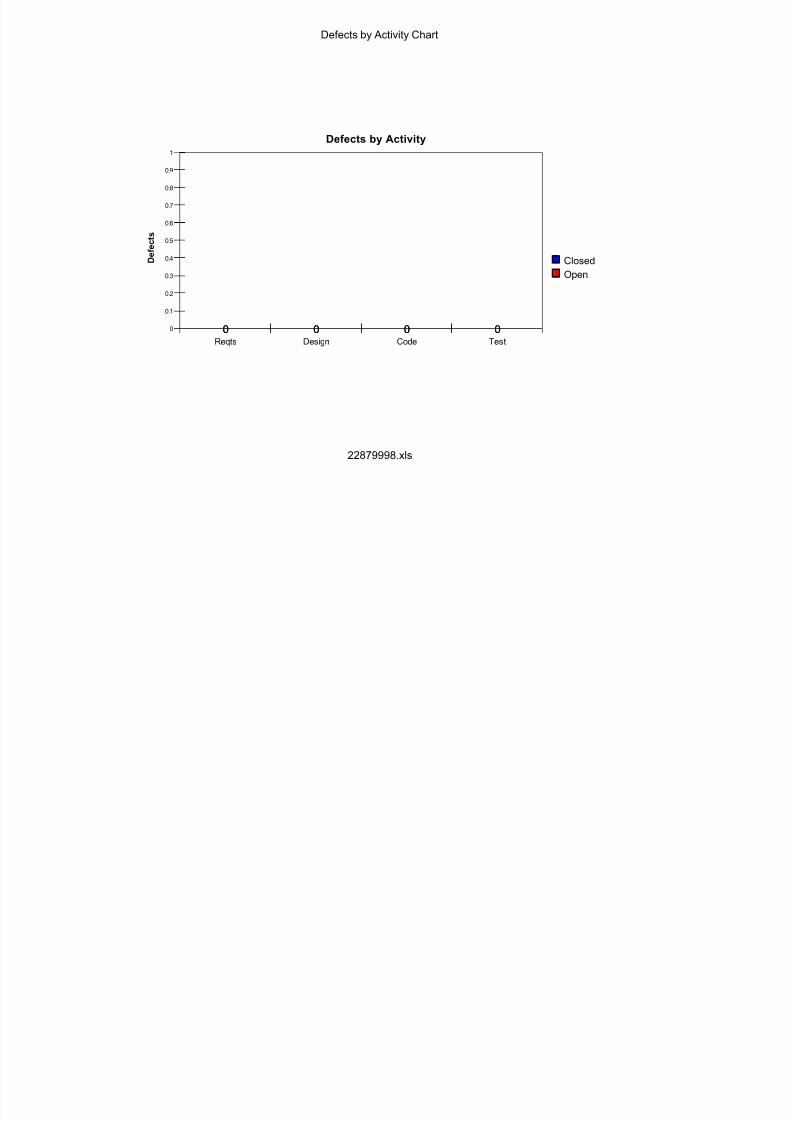
Defects by Activity Chart
22879998.xls
Reqts Design Code Test
0
0.1
0.2
0.3
0.4
0.5
0.6
0.7
0.8
0.9
1
0 0 0 00 0 0 0
Defects by Activity
ClosedOpen
Defects

8/14/2019 Pcp Hsc Project
http://slidepdf.com/reader/full/pcp-hsc-project 22/25
Problem Report Form
Page 22
Project Control Panel Problem Report FormTo return this form:
1 Copy this sheet to its own Excel workbook2 Name the file "XXXXmmdd.xls" where "XXXX" is the first four letters of your last name, "mm" is month and "d3
or send or fax problem reports to:Software Program Manager's NetworkProject Control Panel Initiative758 S. 23rd St.Arlington, VA 222202Phone: (703) 521-5231Fax: (703) 549-9583
Name:email:Phone:FAX:Title:Company:Address:City, State, Zip:
Description of Problem1234567
Attach it to an email and send it to: [email protected]
ProblemNumber
Control PanelVersion(ie CP 2.0)
Date of Problem:
ProblemSeverity(1=anoyance,5= severe)
Cost of Quality(person-hours)this problemcaused you
Location of Problem:Sheet name, item

8/14/2019 Pcp Hsc Project
http://slidepdf.com/reader/full/pcp-hsc-project 23/25
Problem Report Form
Page 23
89
10
8/14/2019 Pcp Hsc Project
http://slidepdf.com/reader/full/pcp-hsc-project 24/25
Problem Report Form
Page 24
" is day
Suggested Solution

8/14/2019 Pcp Hsc Project
http://slidepdf.com/reader/full/pcp-hsc-project 25/25
Problem Report Form
Page 25