pcg company presentation - july 2011
TRANSCRIPT

8/2/2019 PCG Company Presentation - July 2011
http://slidepdf.com/reader/full/pcg-company-presentation-july-2011 1/30
0
Company Presentation
July 2011
© 2011 PETRONAS Chemicals Group Berhad
8/2/2019 PCG Company Presentation - July 2011
http://slidepdf.com/reader/full/pcg-company-presentation-july-2011 2/30
1
Warranties and Exclusion of Liability
While care has been taken in ensuring the correctness of information, statements, text, articles, data, images and other materials contained andappearing in this presentation and the associated slides (hereinafter referred to as "the MATERIALS"), PETRONAS Chemicals Group Berhad(“PCG”), its subsidiaries and related corporations and its or their directors, officers, employees, agents and advisers (hereinafter referred to as "We")make no representations, guarantees or warranties as to the accuracy, reliability, quality, truth, suitability and completeness of the said MATERIALS.We reserve the right to add, delete or make any changes to the MATERIALS without prior notice.
We do not accept any liability for inaccuracies or omissions in the MATERIALS. We further disclaim all liabilities whatsoever for any direct, indirect,
special or consequential loss or damages howsoever resulting directly or indirectly from the access to or the use of this MATERIALS and the relianceon the MATERIALS contained herein. Any decisions made by you based on the MATERIALS are your sole responsibility.
The MATERIALS may also contain information provided by third parties and we make no representation or warranty regarding the said third parties'information.In no event would the MATERIALS constitute or be deemed to constitute an invitation to invest in PCG, its subsidiaries and related corporations or aninvitation by PCG, its subsidiaries and related corporations to enter into a contract with you.
Forward Looking Statements and Associated Risks
The MATERIALS and related discussions, including but not limited to those regarding the petrochemicals environment, anticipated demand forpetrochemicals, plant turnaround activity and costs, investments in safety and operational risk, increase in turnaround activity and impact onproduction, future capital expenditures in general, generation of future receivables, sales to customers, cash flows, costs, cost savings, debt, demand,disposals, dividends, earnings, efficiency, gearing, growth, strategy, trends, reserves and productivity together with statements that contain wordssuch as "believe", "plan", "expect" and "anticipate" and similar expressions thereof may constitute forward looking statements.
Such forward-looking statements are subject to certain risks and uncertainties, including but not limited to, the economic situation in Malaysia andcountries in which we transact business internationally, increases in regulatory burdens in Malaysia and such countries, changes in import control orimport duties, levies or taxes in international markets or in Malaysia, and changes in prices or demand for products produced by us, both in Malaysiaand in international markets, as a result of competitive actions or economic factors. Such forward looking statements are also subject to the risks ofincreased costs in related technologies and such technologies producing expected results, and performance by third parties in accordance with
contractual terms and specifications.
Should one or more of these uncertainties or risks, among others, materialize, actual results may vary materially from those estimated, anticipated orprojected. Specifically, but without limitation, capital costs could increase, projects could be delayed, and anticipated improvements in capacity orperformance may not be fully realised. Although We believe that the expectations of management as reflected by such forward looking statements arereasonable based on information currently available, no assurances can be given that such expectations will prove to have been correct. Accordingly,you are cautioned not to place undue reliance on the forward looking statements. We undertake no obligation to update or revise any of them, whetheras a result of new information, future events or otherwise.
This presentation and its contents are strictly confidential and must not be copied, reproduced, distributed, summarised, disclosed, referred or passedto others at any time without the prior written consent of PCG.
© 2011 PETRONAS Chemicals Group Berhad
8/2/2019 PCG Company Presentation - July 2011
http://slidepdf.com/reader/full/pcg-company-presentation-july-2011 3/30
2
Table of Contents
Company Overview
1
Company Highlights
2
Financials
4
Key Strategies & Future Developments
3
© 2011 PETRONAS Chemicals Group Berhad
8/2/2019 PCG Company Presentation - July 2011
http://slidepdf.com/reader/full/pcg-company-presentation-july-2011 4/30
3
Company Overview
Section 1
© 2011 PETRONAS Chemicals Group Berhad
8/2/2019 PCG Company Presentation - July 2011
http://slidepdf.com/reader/full/pcg-company-presentation-july-2011 5/30
4
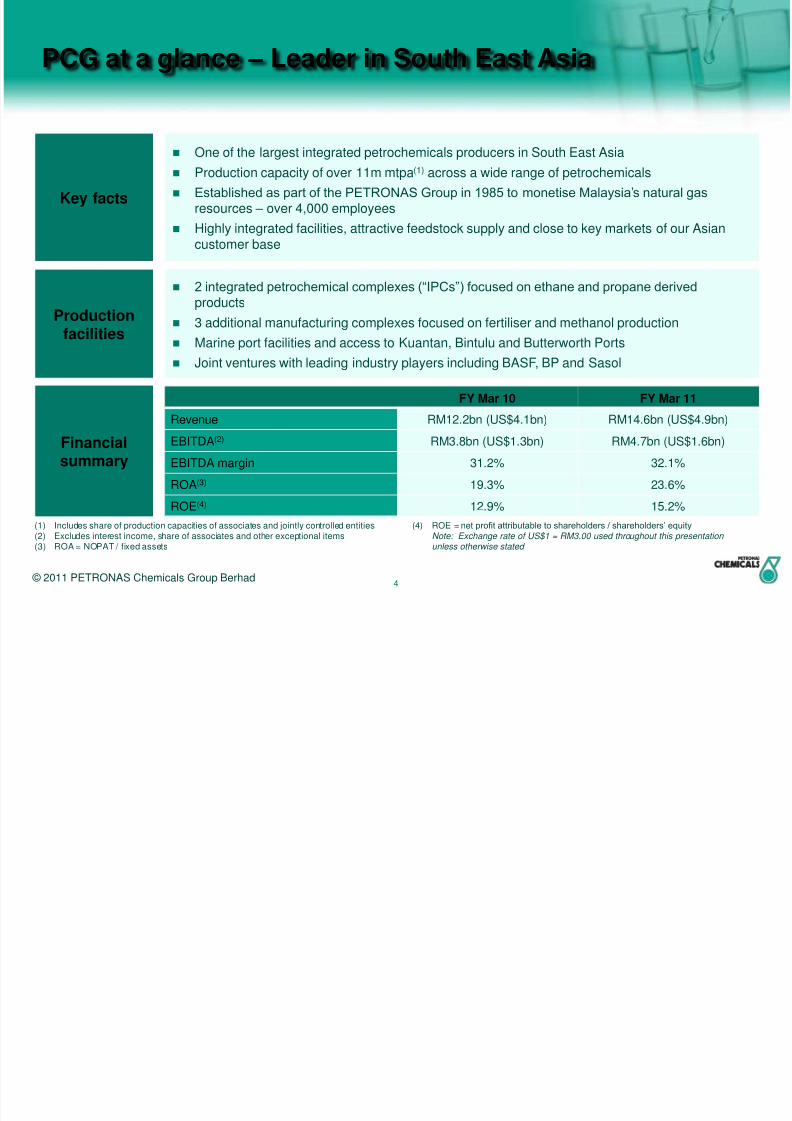
PCG at a glance – Leader in South East Asia
Key facts
One of the largest integrated petrochemicals producers in South East Asia
Production capacity of over 11m mtpa(1) across a wide range of petrochemicals
Established as part of the PETRONAS Group in 1985 to monetise Malaysia‟s natural gas
resources – over 4,000 employees
Highly integrated facilities, attractive feedstock supply and close to key markets of our Asiancustomer base
Productionfacilities
2 integrated petrochemical complexes (“IPCs”) focused on ethane and propane derived
products
3 additional manufacturing complexes focused on fertiliser and methanol production
Marine port facilities and access to Kuantan, Bintulu and Butterworth Ports
Joint ventures with leading industry players including BASF, BP and Sasol
Financialsummary
FY Mar 10 FY Mar 11
Revenue RM12.2bn (US$4.1bn) RM14.6bn (US$4.9bn)
EBITDA(2) RM3.8bn (US$1.3bn) RM4.7bn (US$1.6bn)
EBITDA margin 31.2% 32.1%
ROA(3) 19.3% 23.6%
ROE(4) 12.9% 15.2%
(1) Includes share of production capacities of associates and jointly controlled entities(2) Excludes interest income, share of associates and other exceptional items(3) ROA = NOPAT / fixed assets
© 2011 PETRONAS Chemicals Group Berhad
(4) ROE = net profit attributable to shareholders / shareholders‟ equity
Note: Exchange rate of US$1 = RM3.00 used throughout this presentation unless otherwise stated
8/2/2019 PCG Company Presentation - July 2011
http://slidepdf.com/reader/full/pcg-company-presentation-july-2011 6/30
5
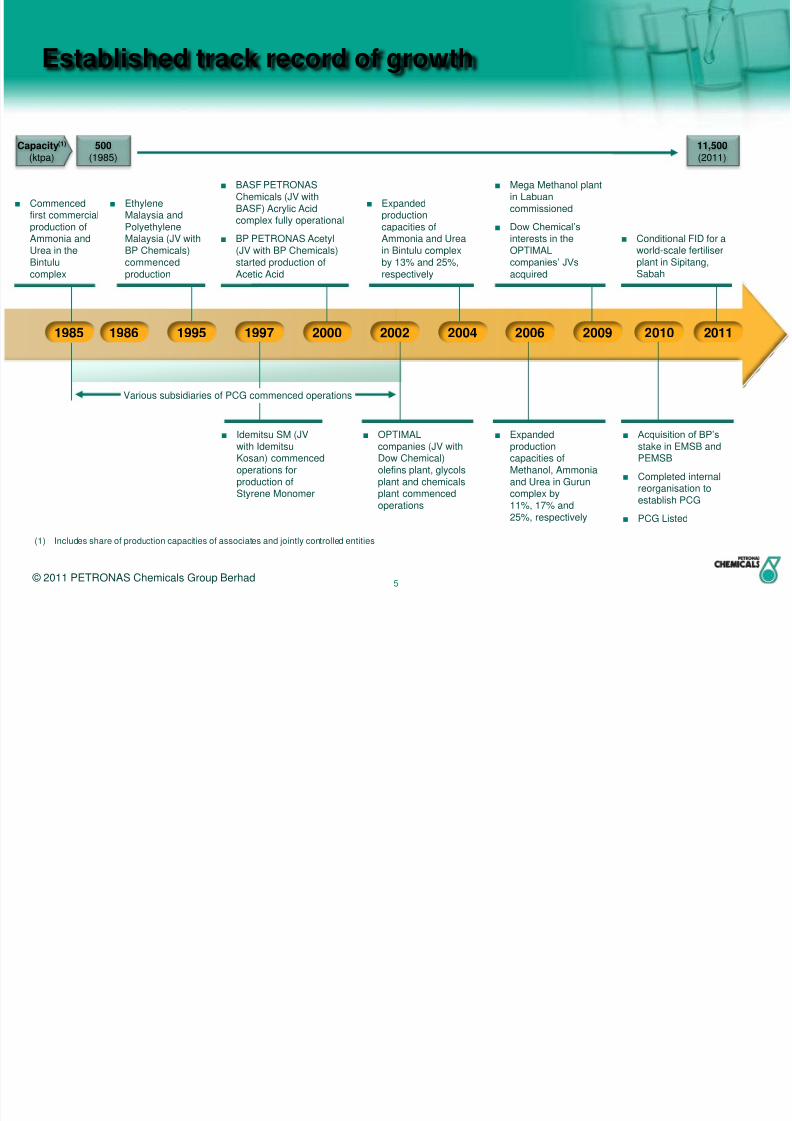
Established track record of growth
1985 1986 1995 1997 2000 2002 2004 2010
■ Commencedfirst commercialproduction ofAmmonia andUrea in theBintulu
complex
■ EthyleneMalaysia andPolyethyleneMalaysia (JV withBP Chemicals)commenced
production
■ BASF PETRONASChemicals (JV withBASF) Acrylic Acidcomplex fully operational
■ BP PETRONAS Acetyl(JV with BP Chemicals)started production of
Acetic Acid
■ Idemitsu SM (JVwith IdemitsuKosan) commencedoperations forproduction ofStyrene Monomer
■ Expandedproductioncapacities ofAmmonia and Ureain Bintulu complexby 13% and 25%,
respectively
■ OPTIMALcompanies (JV withDow Chemical)olefins plant, glycolsplant and chemicalsplant commencedoperations
■ Acquisition of BP‟s
stake in EMSB andPEMSB
■ Completed internalreorganisation toestablish PCG
■ PCG Listed
2006 2009
■ Expandedproductioncapacities ofMethanol, Ammoniaand Urea in Guruncomplex by11%, 17% and25%, respectively
■ Mega Methanol plantin Labuancommissioned
■ Dow Chemical‟s
interests in theOPTIMALcompanies‟ JVs
acquired
Various subsidiaries of PCG commenced operations
500
(1985)Capacity(1)
(ktpa)11,500
(2011)
(1) Includes share of production capacities of associates and jointly controlled entities
■ Conditional FID for aworld-scale fertiliserplant in Sipitang,
Sabah
2011
© 2011 PETRONAS Chemicals Group Berhad

8/2/2019 PCG Company Presentation - July 2011
http://slidepdf.com/reader/full/pcg-company-presentation-july-2011 7/30
6
PCG’s unified corporate structure
OPTIMALOlefins
685 ktpa(2)
EthyleneMalaysia
400 ktpa(2)
Phu My100 ktpa(2)
AromaticsMalaysia
688 ktpa(2)
MalaysianNPK
Fertilizer310 ktpa(2)
PETRONASFertilizer
1,150 ktpa(2)
PETRONASMethanol
2,331 ktpa(2)
PETRONASAmmonia
1,132 ktpa(2)
MTBEMalaysia SB815 ktpa(2)
PolyethyleneMalaysia
300 ktpa(2)
KertihPort
PETRONASChemicalsMarketing
BASFPETRONASChemicals905 ktpa(2)
Idemitsu SM240 ktpa(2)
ASEANBintulu
Fertilizer1,200 ktpa(2)
KertihTerminals
BPPETRONAS
Acetyls500 ktpa(2)
PETLIN255 ktpa(2)
Vinyl ChlorideMalaysia
580 ktpa(2)
OPTIMALGlycols
765 ktpa(2)
OPTIMALChemicals410 ktpa(2)
PolypropyleneMalaysia80 ktpa(2)
Olefins and Derivatives Business Segment Fertilisers and Methanol Business Segment
100% 100% 100% 100% 100% 100% 100% 100% 100% 100% 100%
60% 87.5% 93.11%70% 88%
40% 30%
63.47%
30% 20% 40%
Partly-owned Subsidiaries Associates(1) Jointly Controlled EntityWholly-owned Subsidiaries
35.6%
(1) Associates in which PCG has a significant operational role (2) Production capacity
64.4%
Other Investors
© 2011 PETRONAS Chemicals Group Berhad
PETRONASChemicalsTrading Ltd
PETRONASChemicalsFertiliserSabah
100%
100%
8/2/2019 PCG Company Presentation - July 2011
http://slidepdf.com/reader/full/pcg-company-presentation-july-2011 8/30
7
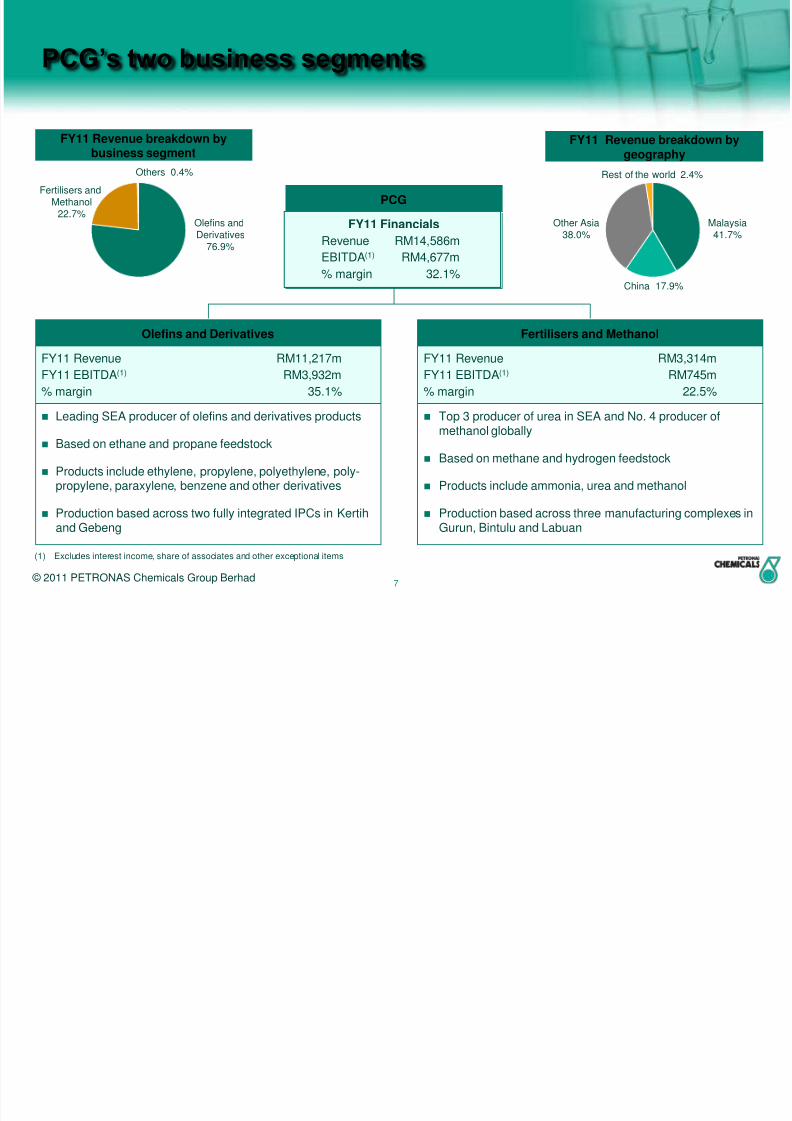
PCG’s two business segments
FY11 Revenue breakdown bybusiness segment
FY11 Revenue breakdown bygeography
FY 2010 financials
Revenue RM12,203m
EBITDA(1) RM3,802m
% margin 31%
Olefins and Derivatives
FY11 Revenue RM11,217m
FY11 EBITDA(1) RM3,932m
% margin 35.1%
Leading SEA producer of olefins and derivatives products
Based on ethane and propane feedstock
Products include ethylene, propylene, polyethylene, poly-propylene, paraxylene, benzene and other derivatives
Production based across two fully integrated IPCs in Kertihand Gebeng
Fertilisers and Methanol
FY11 Revenue RM3,314m
FY11 EBITDA(1) RM745m
% margin 22.5%
Top 3 producer of urea in SEA and No. 4 producer ofmethanol globally
Based on methane and hydrogen feedstock
Products include ammonia, urea and methanol
Production based across three manufacturing complexes inGurun, Bintulu and Labuan
(1) Excludes interest income, share of associates and other exceptional items
PCG
FY11 Financials
Revenue RM14,586m
EBITDA(1) RM4,677m
% margin 32.1%
© 2011 PETRONAS Chemicals Group Berhad
Malaysia41.7%
Other Asia38.0%
China 17.9%
Rest of the world 2.4%
Olefins andDerivatives
76.9%
Fertilisers andMethanol
22.7%
Others 0.4%

8/2/2019 PCG Company Presentation - July 2011
http://slidepdf.com/reader/full/pcg-company-presentation-july-2011 9/308
Company Highlights
Section 2
© 2011 PETRONAS Chemicals Group Berhad

8/2/2019 PCG Company Presentation - July 2011
http://slidepdf.com/reader/full/pcg-company-presentation-july-2011 10/309
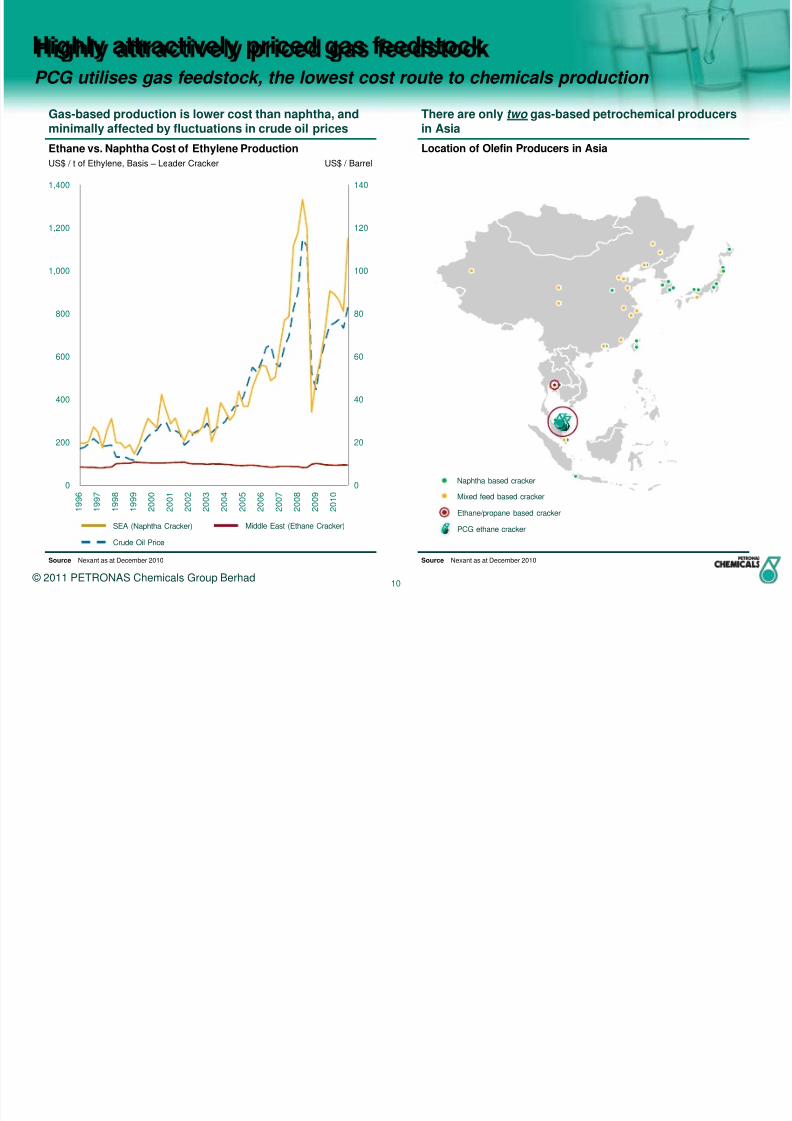
Highly attractive value creation opportunity for investors
Industry leader with significant competitive advantage
Market leadership across principal products1
Highly attractively priced gas feedstock, resulting in low cost production2
Reputation, parentage & support of PETRONAS group6
Strong & experienced leadership team7
Strategic location close to key growth markets4
Strong partnerships with leading chemicals/energy majors5
Highly attractive financial profile8
Fully integrated production facilities3
8/2/2019 PCG Company Presentation - July 2011
http://slidepdf.com/reader/full/pcg-company-presentation-july-2011 11/30
8/2/2019 PCG Company Presentation - July 2011
http://slidepdf.com/reader/full/pcg-company-presentation-july-2011 12/3011
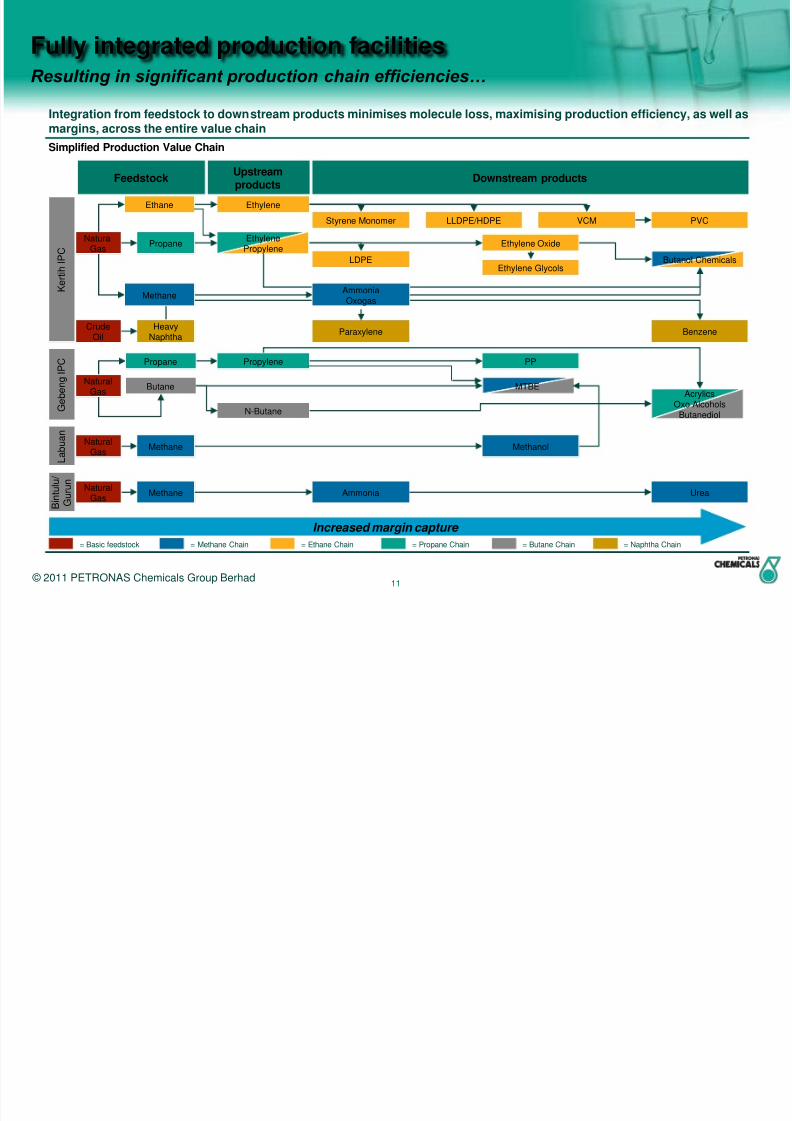
Fully integrated production facilitiesResulting in significant production chain efficiencies…
FeedstockUpstreamproducts
Downstream products
K e r t i h I P C
Ethane
Paraxylene Benzene
Ethylene
Styrene Monomer LLDPE/HDPE VCM
LDPE
Ethylene Oxide
Butanol Chemicals
EthylenePropylene
NaturalGas
CrudeOil
MethaneAmmoniaOxogas
Propane
Ethylene Glycols
PVC
HeavyNaphtha
N-Butane
Propane
Butane
G e b e n g I P C
NaturalGas
Propylene
MTBE
PP
AcrylicsOxo Alcohols
Butanediol
Increased margin capture
Methane
L a b u a n
NaturalGas
Methanol
Methane
B i n t u l u /
G u r u n
NaturalGas
UreaAmmonia
= Ethane Chain= Basic feedstock = Propane Chain = Butane Chain = Naphtha Chain= Methane Chain
Integration from feedstock to downstream products minimises molecule loss, maximising production efficiency, as well asmargins, across the entire value chain
Simplified Production Value Chain
© 2011 PETRONAS Chemicals Group Berhad
8/2/2019 PCG Company Presentation - July 2011
http://slidepdf.com/reader/full/pcg-company-presentation-july-2011 13/3012
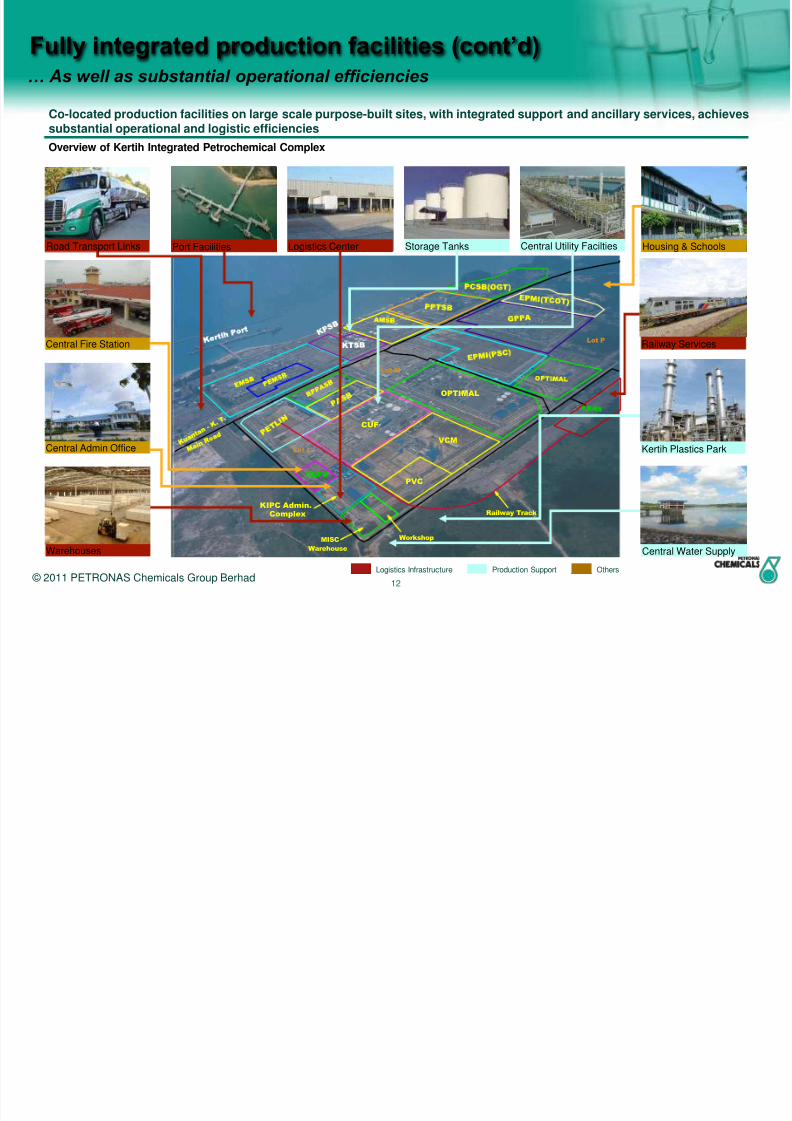
… As well as substantial operational efficiencies
Fully integrated production facilities (cont’d)
Co-located production facilities on large scale purpose-built sites, with integrated support and ancillary services, achievessubstantial operational and logistic efficiencies
Overview of Kertih Integrated Petrochemical Complex
OPTIMAL
VCM
PVC
CUF
CEFS
Lot L
KIPC Admin.Complex
MISC
Warehouse
Lot P
Lot M
Number ofcustomerproductionfacilities(1)
Logistics Infrastructure Production Support Others
Logistics Center Housing & SchoolsStorage Tanks
Warehouses
Central Utility Facilties
Central Admin Office
Central Fire Station Railway Services
Central Water Supply
Kertih Plastics Park
Road Transport Links Port Facilities
Workshop
Railway Track
© 2011 PETRONAS Chemicals Group Berhad

8/2/2019 PCG Company Presentation - July 2011
http://slidepdf.com/reader/full/pcg-company-presentation-july-2011 14/3013
Strategic location close to key growth marketsMalaysia is an ideal production base to export to the high growth Asia Pacific markets
2.2%
3.5%
2.0%2.8%
2.2%
5.6%5.0%
5.4%5.8%
12.1%
2.7%3.4%
0%
3%
6%
9%
12%
15%
Po lyet hylene Et hylene
Glycol
P olypropylene Acrylic A cid M ethanol Urea
Asia Pacific economies have substantially higherpetrochemical demand outlook than developed economies
And Malaysia’s strategic location allows for much
shorter shipping times to those key markets
Petrochemical Demand by Key Markets
CAGR 2010-2017E
Shipping Distances from Malaysia vs. Middle East
(2) Assuming 12 knots/hr average cruising speed(1) North America + Europe
Key driversfor growth inAsia Pacific
Expansion ofmanufacturing
Rising wealth
Increasing substitution
New applications
Population and wealthgrowth
Ethylene & Propylene Methanol & Urea
Shipping
Days (2)
Malaysia
(Kertih)
Middle East
(Jubail, Saudi Arabia)
China (Xiamen) 4 days 19 days
Japan
(avg. Shimizu, Sakai,Kobe, Mizushima)
7 days 22 days
Taiwan (Kaohsiung) 4 days 18 days
Indonesia (avg.Surabaya, Semarang)
4 days 15 days
Thailand (Bangkok) 4 days 16 days
ShippingConsiderations
Smaller ships and smallerloads economically viable
Less crowded routes
More frequent vessels
Only large ships to maintaineconomies of scale
Potential delay throughcrowded Straits of Malacca
Source Nexant as at October 2010
Developed Countries (1) Asia Pacific
© 2011 PETRONAS Chemicals Group Berhad
Source World Ports Distances (www.distances.com)
8/2/2019 PCG Company Presentation - July 2011
http://slidepdf.com/reader/full/pcg-company-presentation-july-2011 15/3014
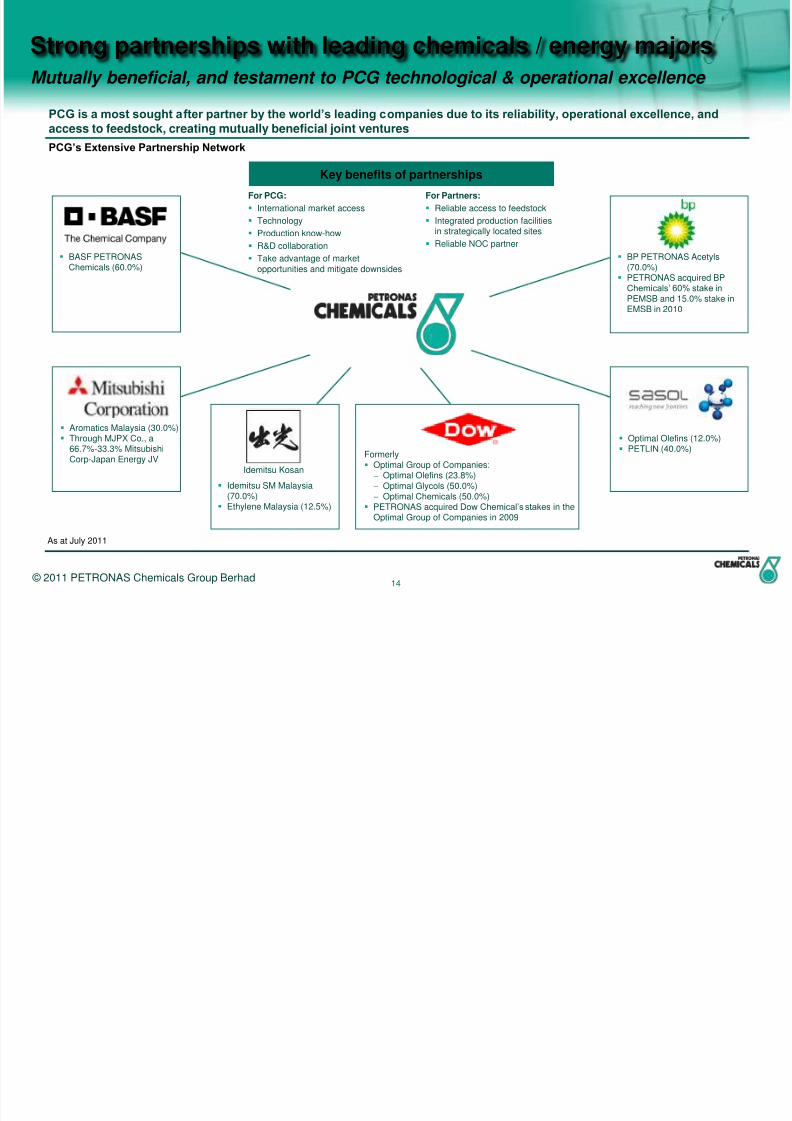
Strong partnerships with leading chemicals / energy majors
Mutually beneficial, and testament to PCG technological & operational excellence
Formerly Optimal Group of Companies: Optimal Olefins (23.8%) Optimal Glycols (50.0%) Optimal Chemicals (50.0%)
PETRONAS acquired Dow Chemical‟s stakes in theOptimal Group of Companies in 2009
Optimal Olefins (12.0%) PETLIN (40.0%)
Aromatics Malaysia (30.0%) Through MJPX Co., a
66.7%-33.3% MitsubishiCorp-Japan Energy JV
BASF PETRONASChemicals (60.0%)
BP PETRONAS Acetyls(70.0%)
PETRONAS acquired BPChemicals‟ 60% stake in
PEMSB and 15.0% stake inEMSB in 2010
Idemitsu SM Malaysia(70.0%)
Ethylene Malaysia (12.5%)
PCG is a most sought after partner by the world’s leading companies due to its reliability, operational excellence, and
access to feedstock, creating mutually beneficial joint ventures
PCG’s Extensive Partnership Network
Idemitsu Kosan
Key benefits of partnerships
For Partners:
Reliable access to feedstock
Integrated production facilitiesin strategically located sites
Reliable NOC partner
For PCG:
International market access
Technology
Production know-how
R&D collaboration
Take advantage of marketopportunities and mitigate downsides
© 2011 PETRONAS Chemicals Group Berhad
As at July 2011

8/2/2019 PCG Company Presentation - July 2011
http://slidepdf.com/reader/full/pcg-company-presentation-july-2011 16/3015
17.9% 23.6%
47.2%
5.2%
6.1%PCG(1)
Reputation, parentage & support of PETRONAS GroupMaintains PCG’s competitiveness and provides synergies for future growth
PCG is Malaysia’s chemical industry champion, and with the on-going support of PETRONAS Group, will be a strongplatform for future growth
PETRONAS Group Overview
Source PETRONAS company reports as at 31 March 2011
National oil company wholly-owned by the Government ofMalaysia
Entrusted with the management of all the oil and gasreserves in Malaysia
Manages the issuances of all PSCs issued in Malaysia
Revenues = US$77 bn EBITDA= US$34 bn Total Assets= US$145 bn
Integrated Oil & Gas producer with E&P, R&M, chemicalsand shipping businesses
Operations in over 30 countries globally Retains majority stakes in listed companies such as
PETRONAS Gas, PETRONAS Dagangan and MISC
Financials FY11A
Cash & Investments = US$35 bn Credit rating of A1/A-/A (Moody‟s/S&P/Fitch)
Ranked 86 among Fortune 500 companies
E&P Business- Crude oil- Natural gas
Gas & Power Business- LNG- Processed gas
Other Businesses
- Logistics & maritimebusiness
- Others
Downstream Business
- Refined petroleumproducts- Crude oil trading
(1) Converted to US$ from MYR at the daily average exchange rate for FY11A, US$1 = MYR3.14
© 2011 PETRONAS Chemicals Group Berhad
Revenue FY11A

8/2/2019 PCG Company Presentation - July 2011
http://slidepdf.com/reader/full/pcg-company-presentation-july-2011 17/3016
Strong and experienced leadership teamWith significant experience across the entire petrochemicals value chain
Seasoned management team, with in-depth knowledge of the petrochemicals industry, and with ambitious plans forPCG…
PCG Senior Management
…building upon a strong track record of successful growth, and poised for future developments
(1) “Industry” = Petrochemicals Value Chain, including Chemicals and oil & gas (2) “Industry” = Petrochemicals Value Chain, including Chemicals and oil & gas, and financial functions
CFO
17 years in industry(2)
14 years at PETRONAS
WanShamilah
Saidi
Chairman
29 years in industry(1)
29 years at PETRONAS
WanZulkiflee
Head, Olefins &
Derivatives Division 28 years in industry(1)
28 years at PETRONAS
YusaHassan
Head, Fertiliser &
Methanol Division 18 years at PETRONAS
MahmadZahri
Mahzan
President/CEO
25 years in industry(1)
Joined May 1st 2011
Dr. A. HapizAbdullah
PCG’s Total Petrochemical Production Capacity
„000s mtpa
0
3,000
6,000
9,000
12,000
1985 1992 1994 1995 1997 1999 2000 2002 2004 2006 2009 2010
ASEAN BintuluFertilizer startedoperations
MTBE & PMSB startedoperations; LabuanMethanol plant acquired
PEMSB & EMSBstarted operations
CUF in Kertih andGebeng in operation;PETRONAS Fertilizerstarted operations
BASF PETRONAS, Aromatics Malaysia,PETRONAS Ammonia, Vinyl ChlorideMalaysia, BP PETRONAS Acetylsstarted operations
OPTIMAL Companies,PETLIN, Phu My startedoperations
Mega Methanol plant in Labuancommissioned; acquired DowChemical‟s stake in OPTIMAL
Companies
Acquired BPChemicals‟ stake in
PEMSB and EMSB
© 2011 PETRONAS Chemicals Group Berhad

8/2/2019 PCG Company Presentation - July 2011
http://slidepdf.com/reader/full/pcg-company-presentation-july-2011 18/3017
Key Strategies & Future Developments
Section 3

8/2/2019 PCG Company Presentation - July 2011
http://slidepdf.com/reader/full/pcg-company-presentation-july-2011 19/3018
Time
Long TermShort Term
Consolidation of ourpetrochemicals activities1
■ Centralise management
■ Optimisation of hydrocarbon
chain■ Economies of scale
■ Higher overall utilisation
Expand our productportfolio2
■ Premium pricing
■ Wider customer base
■ Resilience to economic cycles
■ Enhanced profitability
Increase our productioncapacity3
■ Greenfield integrated refineryand petrochemical complex
■ World-scale, greenfieldammonia and urea productionfacility
Selective synergistic growth acquisitions4
■ Asia Pacific market
■ Existing or complementary products
■ Enhance strategic competitiveness
■ Disciplined financial evaluation
Key strategies & future developmentsMaximise shareholder value through achievable short, medium and long term plans
© 2011 PETRONAS Chemicals Group Berhad
Medium Term

8/2/2019 PCG Company Presentation - July 2011
http://slidepdf.com/reader/full/pcg-company-presentation-july-2011 20/3019
New World-scale Fertiliser Plant in Sabah
Location : Sipitang, Sabah, East Malaysia
Facilities : Ammonia and Urea complex.
Capacity :
Granular Urea : 1.2 mmtpa
Ammonia : 0.74 mmtpa
Estimated development cost of US$1.5 bn
Construction to commence in 2012
Commissioning target date : 2015
Project Overview
Gurun : 0.68 mmtpa
Bintulu : 0.75 mmtpa
Project location
Existing
ammonia & urea
plants
Reinforcing PCG’s position as a key urea producer in SEA
Product Existing New TotalPCGGurun Bintulu Sipitang
Granular
Urea0.68 0.75 1.2 2.6
Ammonia 0.40 0.45 0.74 1.6
Increase in Production Capacity mmpta
Sipitang : 1.2 mmtpa
© 2011 PETRONAS Chemicals Group Berhad
Sipitang
Labuan
Sarawak
Sabah
Brunei
South China
Sea
Location

8/2/2019 PCG Company Presentation - July 2011
http://slidepdf.com/reader/full/pcg-company-presentation-july-2011 21/3020
New world-scale fertiliser plant in Sipitang, Sabah
1.2 mmtpa urea production
Construction commencing 2012
Commissioning target date 2015
Estimated investment size of US$1.5 bn
Key strategies & future developmentsConcrete steps taken towards achieving our strategic goals
Expand our product portfolio2
Increase our production capacity3
New refinery and petrochemical integrated
development (RAPID) complex in Pengerang, Johor
Detailed feasibility study to be completed by
December 2012
Potential combined 3 mtpa of olefins capacity
Potential investment size of US$20 bn for the
refinery & petrochemicals complex
Increase our production capacity3
Expand our product portfolio2
MOU between PETRONAS and BASF Joint feasibility study to produce specialty
chemicals in Malaysia - targeted to be completed
in period ending 2011.
Potential joint investment sum of approx.
RM4.0 bn
PCG will evaluate the outcome of the feasibility
study
© 2011 PETRONAS Chemicals Group Berhad
8/2/2019 PCG Company Presentation - July 2011
http://slidepdf.com/reader/full/pcg-company-presentation-july-2011 22/3021
Financials
Section 4
© 2011 PETRONAS Chemicals Group Berhad
8/2/2019 PCG Company Presentation - July 2011
http://slidepdf.com/reader/full/pcg-company-presentation-july-2011 23/3022
PCG financial highlights
(1) Excludes interest income, share of associates and other exceptional items (2) ROA = NOPAT / fixed assets
Strong group revenue through the petrochemical cycle
– From FY2008 – FY2010, stable revenue of RM12.2bn to RM12.9bn (variance of 5%) through petrochemical
downturn
– In FY2011, revenue increased by 19.5% reflecting the upturn in petrochemical cycle
– Delivered through diversification across products, Optimal stake acquisition and capacity increases (mega
methanol plant start-up)
Superior EBITDA(1) margins
– FY2011 PCG EBITDA margin of 32.1%
– Advantaged feedstock and high degree of integration
Strong cashflow generation
– Cash conversion ratio of 86.7% in FY2011
– Driven by superior cost base and disciplined capital investment
Superior returns on assets
– Average ROA(2) of 24.7% over last 3 years
Prudent capital structure for future growth
– Net cash position of RM5.2bn
© 2011 PETRONAS Chemicals Group Berhad

8/2/2019 PCG Company Presentation - July 2011
http://slidepdf.com/reader/full/pcg-company-presentation-july-2011 24/3023
PCG financial summary
FY2008 FY2009 FY2010 FY2011
Income Statement (RM m)
Revenue 12,855 12,367 12,203 14,586
% growth n/a (3.8%) (1.3%) 19.5%
EBITDA(1) 6,355 4,902 3,803 4,677
% margin 49.4% 39.6% 31.2% 32.1%
Net profit after tax and MI 3,925 2,818 2,199(5) 2,994
% margin 30.5% 22.8% 18.0% 20.5%
Others
Earnings per share (RM) 0.54(6) 0.39(6) 0.30(6) 0.40
Dividends per share (RM) n/a n/a n/a 0.19
Shareholders‟ equity (RM m) 14,889 15,736 17,069 19,647ROE(2) 26.4% 17.9% 12.9% 15.2%
ROA(3) 42.6% 31.2% 19.3% 23.6%
Capex / sales 11.5% 10.0% 7.3% 4.3%
Cash conversion(4) 76.8% 74.7% 76.5% 86.7%
(1) Excludes interest income, share of associates and other exceptional items(2) ROE = net profit attributable to shareholders / shareholders‟ equity
(3) ROA = NOPAT / fixed assets
© 2011 PETRONAS Chemicals Group Berhad
(4) Cash conversion = (EBITDA – Capex) / Capex(5) Includes negative goodwill of RM175m arising from the acquisition of Optimal(6) Based on enlarged share capital of 7,300 million shares
8/2/2019 PCG Company Presentation - July 2011
http://slidepdf.com/reader/full/pcg-company-presentation-july-2011 25/3024
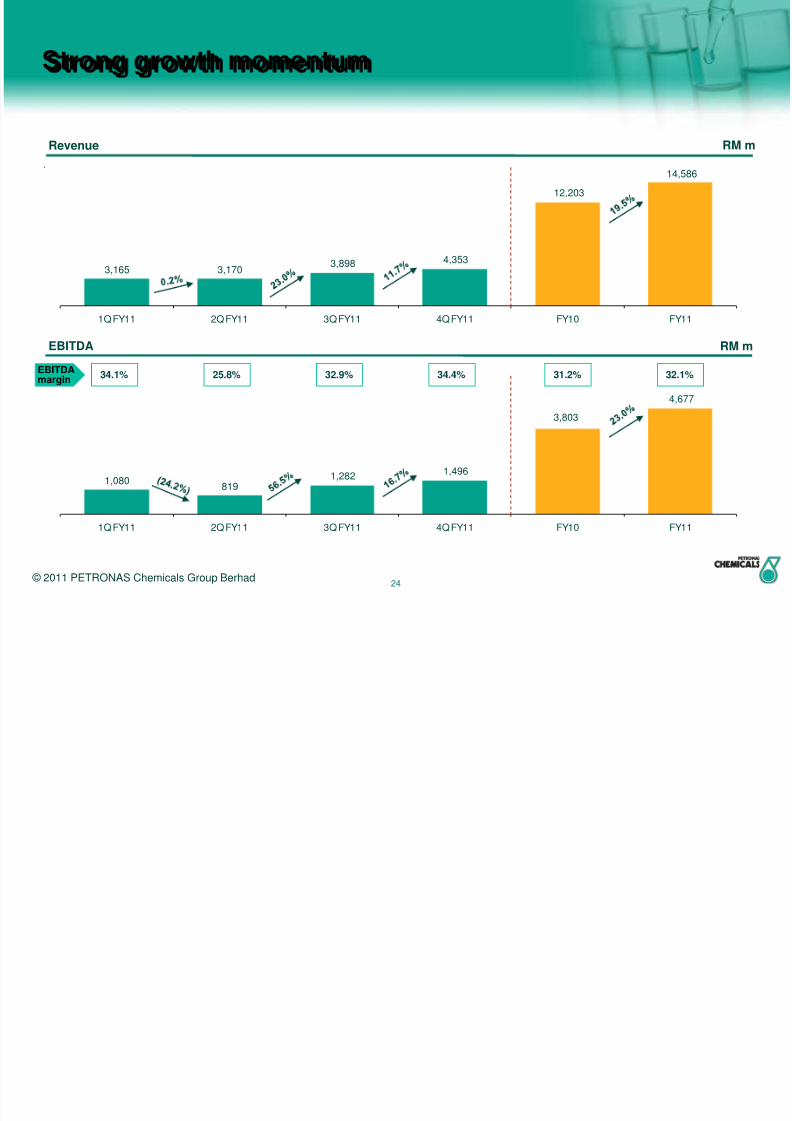
Strong growth momentum
3,165 3,1703,898 4,353
12,203
14,586
1Q FY11 2Q FY11 3Q FY11 4Q FY11 FY10 FY11
1,080819
1,2821,496
3,802
4,677
1Q FY11 2Q FY11 3Q FY11 4Q FY11 FY10 FY11
EBITDAmargin
34.1% 32.9% 34.4%25.8% 31.2% 32.1%
3,803
© 2011 PETRONAS Chemicals Group Berhad
Revenue
EBITDA RM m
RM m

8/2/2019 PCG Company Presentation - July 2011
http://slidepdf.com/reader/full/pcg-company-presentation-july-2011 26/3025
31.2%
19.3%
23.6%
FY09 FY10 FY11
Attractive through the cycle return on assets and equity
(1) ROA = NOPAT / fixed assets(2) ROE = net profit attributable to shareholders / shareholders‟ equity
Despite industry downturn from FY2008 to FY2010, ROA and ROE of PCG remained resilient
Higher YoY ROA and ROE
ROA(1) ROE(2)
© 2011 PETRONAS Chemicals Group Berhad
17.9%
12.9%
15.2%
FY09 FY10 FY11
AverageROA
24.7%AverageROE
15.3%

8/2/2019 PCG Company Presentation - July 2011
http://slidepdf.com/reader/full/pcg-company-presentation-july-2011 27/30
26
Group Utilisation
© 2011 PETRONAS Chemicals Group Berhad
86.6%
74.2%83.9% 82.5% 81.0%
4Q FY10 3Q FY11 4Q FY11 FY10 FY11
92.6%
98.6%
86.0%
90.2%88.3%
4Q FY10 3Q FY11 4Q FY11 FY10 FY11
81.1%
54.7%
82.0%
76.7% 74.6%
4Q FY10 3Q FY11 4Q FY11 FY10 FY11
Group Consolidated
Olefins and Derivatives Fertilisers and Methanol
8/2/2019 PCG Company Presentation - July 2011
http://slidepdf.com/reader/full/pcg-company-presentation-july-2011 28/30
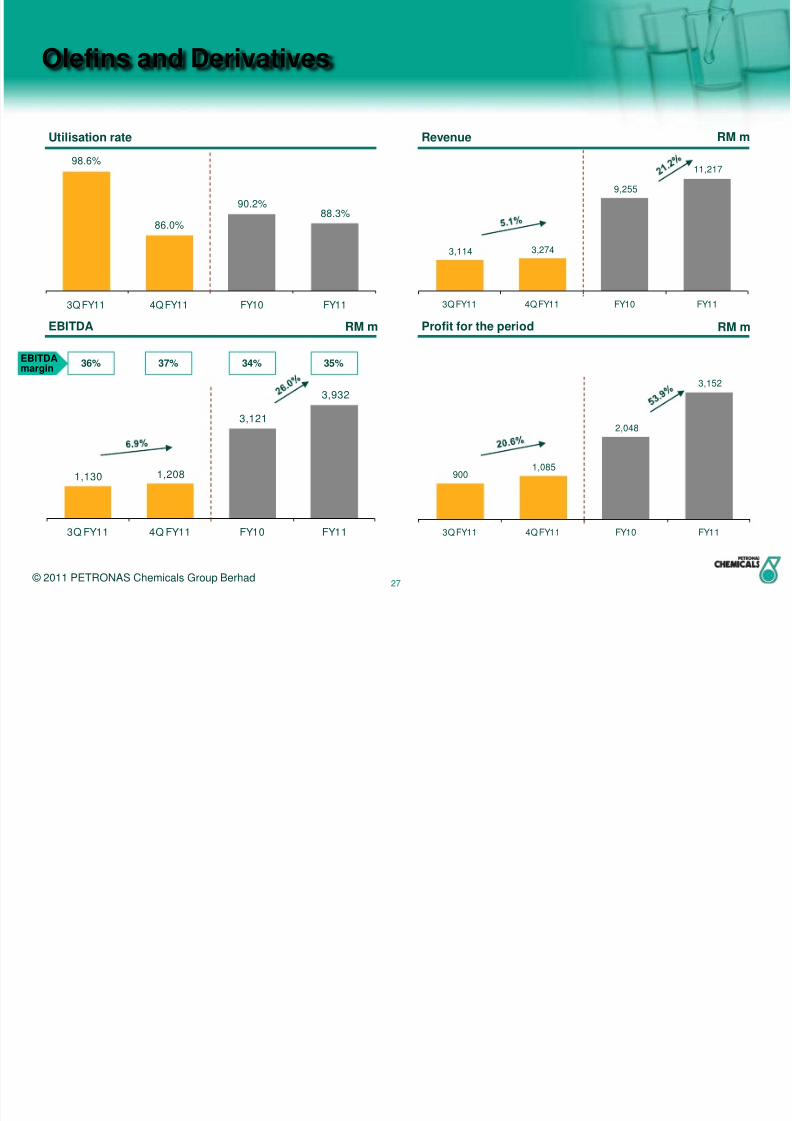
27
3,114 3,274
9,255
11,217
3Q FY11 4Q FY11 FY10 FY11
9001,085
2,048
3,152
3Q FY11 4Q FY11 FY10 FY11
1,130 1,208
3,121
3,932
3Q FY11 4Q FY11 FY10 FY11
Olefins and Derivatives
EBITDAmargin
36% 34% 35%
98.6%
86.0%
90.2%88.3%
3Q FY11 4Q FY11 FY10 FY11
37%
Utilisation rate Revenue
EBITDA Profit for the period
© 2011 PETRONAS Chemicals Group Berhad
RM m RM m
RM m

8/2/2019 PCG Company Presentation - July 2011
http://slidepdf.com/reader/full/pcg-company-presentation-july-2011 29/30
28
Fertilisers and Methanol
7721,070
2,886
3,314
3Q FY11 4Q FY11 FY10 FY11
54.7%
82.0%76.7% 74.6%
3Q FY11 4Q FY11 FY10 FY11
32
166
291
315
3Q FY11 4Q FY11 FY10 FY11
144
312
615
745
3Q FY11 4Q FY11 FY10 FY11
EBITDAmargin
19% 21% 22%29%
Utilisation rate Revenue
EBITDA Profit for the period
© 2011 PETRONAS Chemicals Group Berhad
RM m RM m
RM m

8/2/2019 PCG Company Presentation - July 2011
http://slidepdf.com/reader/full/pcg-company-presentation-july-2011 30/30
Thank Youwww.petronaschemicals.com