pcdrc nhea final report
TRANSCRIPT

7/30/2019 Pcdrc Nhea Final Report
http://slidepdf.com/reader/full/pcdrc-nhea-final-report 1/49
Final Report
Public Opinion Survey on
Health Care Services and Health InequalitiesHealth Care Services and Health InequalitiesHealth Care Services and Health InequalitiesHealth Care Services and Health Inequalities
in Nepalin Nepalin Nepalin Nepal
Submitted to
Nepal Health Economics Association (NHEA)Maharajgunj, Kathmandu
ByYogendra Bahadur Gurung
Roshan BhattaraiDebesh Raj Bhattarai
Ramesh MishraNarendra Gurung
People Centered Development and Research Centre (PCDRC)
Baneshwor, Kathmandu
January 2005

7/30/2019 Pcdrc Nhea Final Report
http://slidepdf.com/reader/full/pcdrc-nhea-final-report 2/49

7/30/2019 Pcdrc Nhea Final Report
http://slidepdf.com/reader/full/pcdrc-nhea-final-report 3/49
Content
Chapter I: Introduction1.1 Background ............................................................................................................. 1
1.2 Project Justification ................................................................................................. 21.3 Project Objective ..................................................................................................... 31.4 Study Operation Procedure ..................................................................................... 41.5 Limitations of the Study.......................................................................................... 6
Chapter II: Country Situation2.1 Country Overview ................................................................................................... 72.2 Health Systems and Health Policies in Nepal ......................................................... 82.3 Government Financing in Health Sector............................................................... 11
Chapter III: Background Characteristics of the Respondents3.1 Type of Place of Residence ................................................................................... 12
3.2 Religion ................................................................................................................. 123.3 Age and Sex Structure .......................................................................................... 133.4 Family Size ........................................................................................................... 133.5 Marital Status ........................................................................................................ 133.6 Education .............................................................................................................. 143.7 Economy ............................................................................................................... 14
Chapter IV: Status of Health Services4.1 Trend of Health Services in Past Five Years ........................................................ 164.2 Inequality in Health Services ................................................................................ 174.3 Current Situation of Health Services .................................................................... 20
Chapter V: Public Opinion on Improvement of Health Services and Financing5.1 Priority on Health Services ................................................................................... 245.2 Financing on Health Services ............................................................................... 275.3 People’s Say in Government Policy ..................................................................... 31
Chapter VI: Summary and Conclusion6.1 Summary of the Findings ...................................................................................... 326.2 Conclusion ............................................................................................................ 34
References Cited ............................................................................................................. 36
Annex I: Questionnaire ................................................................................................... 38
Annex IIa: Technical Advisory Committee .................................................................... 44
Annex IIb: Study Team ................................................................................................... 44
Annex III: List of Field Researchers ............................................................................... 45

7/30/2019 Pcdrc Nhea Final Report
http://slidepdf.com/reader/full/pcdrc-nhea-final-report 4/49
List of Tables
Table 1.1: Distribution of interview and sample by type of health institutions, 2004................... 4 Table 2.1 General Indicators for Nepal ......................................................................................... 7 Table 2.2: Government Health Facilities ....................................................................................... 8 Table 2.3: Background Information on National Health Systems ............................................... 11 Table 3.1: Distribution of Respondents by Place of Residence................................................... 12 Table 3.2: Distribution of Respondents by Religion ................................................................... 12 Table 3.3: Age and Sex Structure of Respondents ...................................................................... 13 Table 3.4: Respondents by Family Size ...................................................................................... 13 Table 3.5: Respondents by Marital Status ................................................................................... 13 Table 3.6: Educational Status ...................................................................................................... 14 Table 3.7: Main Activities of Respondents ................................................................................. 14 Table 3.8: Household Income (Rs.) Per Month Quintiles ........................................................... 15 Table 4.1: Health Institutions Where People Generally Visited in the Last Five Years ............. 16 Table 4.2: Change in Income Between Rich and Poor in the Last Five Years ............................ 16
Table 4.3: Change in Government Spending on Health Services in the Last Five Years ........... 17 Table 4.4: Change in Quality of Government Health Services in the Last Five Years ............... 17 Table 4.5: Who Has Best Access in Government Health Services? ............................................ 18 Table 4.6: Who Makes Most Use of Government Health Services? ........................................... 18 Table 4.7: Who Contributes Most to the Finance of Government Health Services?................... 19 Table 4.8: Who Receives Most of the Government Subsidies to Health Services? .................... 19 Table 4.9: On the Average, Who is in Better Health? ................................................................. 20 Table 4.10 Health System Over the Past Few Years ................................................................... 20 Table 4.11: Difficulty/Easy in Getting Health Care .................................................................... 21 Table 4.12: Difficulty/Easy for Poor in Getting Health Care ...................................................... 21 Table 4.13: Difficulty/Easy for Rich in Getting Health Care ...................................................... 22 Table 4.14: How Did You Raise Money? ................................................................................... 22
Table 4.15: Status of Satisfaction with Current Health Services ................................................ 23 Table 4.16: Reasons for not Satisfied with Current Health Services .......................................... 23 Table 5.1: Needs for Changes in the Current Health System ...................................................... 24 Table 5.2: Priority of the Population to be Targeted for the Health Services ............................. 25 Table 5.3: Preferred Type of Health Services ............................................................................. 25 Table 5.4: Priority to Improve Health Services ........................................................................... 26 Table 5.5: Priority of the Persons to Make Choices of Health Program ..................................... 27 Table 5.6: Current Status of Government Spending on Health Services .................................... 27 Table 5.7: Percentage of Government Tax, Health Insurance, and Out of Pocket Payments ..... 28 Table 5.8: Public Preference on Options to be Raised Additional Revenue for Health .............. 29 Table 5.9: Public Approval for Charges/fee for Medicines ......................................................... 29 Table 5.10: Public Approval for Charges/fee for Visiting a Doctor ............................................ 30
Table 5.11: Public Approval for Charges/fee for Inpatient Treatment/ Hospital Admission ...... 30 Table 5.12: Public Opinion for Those With Higher Income Should Pay More .......................... 30 Table 5.13: Public Opinion for Those With Higher Income Should Pay Greater Share ............. 30 Table 5.14: Public Opinion for Those Who Use Health Care More Should Pay More............... 31 Table 5.15: Public Opinion for Govt. Should Give Low Priority to Expensive Treatment ....... 31 Table 5.16: People’s Perception on Whether Government Consider Public Opinion ................. 31

7/30/2019 Pcdrc Nhea Final Report
http://slidepdf.com/reader/full/pcdrc-nhea-final-report 5/49
1
Chapter I
Introduction
1.1 Background
Nepal is one of the least developed countries. The poverty has been the serious challenge forthe development of Nepal. More than 86 percent of the country’s population live in rural areawith traditional subsistence agriculture. Income per capita is $278 (CBS, 2004a) and thepercentage of population below poverty line is less than 30 (CBS, 2004c). Unequaldistribution of the resources is the main obstacle for alleviating poverty in Nepal. The bottom40 percent of the agricultural households operate only 9 percent of the total agricultural landarea while the top 6 percent occupy more than 33 percent (Panta, 2001). Inequality is alsoprevalent based on household consumption. According to NLSS 2003/04, bottom 20 percentpopulation accounts for 6 percent of consumption while the top 20 percent accounts for 53
percent (CBS, 2004c). Such unequal distribution of resources is due to unequal access of people to politics, social, and economic development, which differs significantly dependingon their social identity in terms of caste, ethnicity and gender and on their economic statusand location.
Health care in rural areas is still dominated by traditional practices such as Baidhya, Dhami,Jhakri, etc. Indigenous healthcare system is one of the major contributor in the governmenthealthcare. They are mainly Ayurveda, Homeopathy, Yunani dispensaries, etc. In the modernhealthcare system, Nepal has adopted primary healthcare system approach. National HealthPolicy 1991 is the milestone of this approach, which aims to extend primary health caresystem to the rural population so that they benefit from modern medical facilities and trained
health care providers by preventive, promotive, and curative health services (MOH, 1991). In1997, Nepal developed a 20 year long - Second Long Term Health Plan (1997-2017) toaddress disparities in healthcare, assuring gender sensitivity and equitable community accessto quality healthcare services. Ninth and Tenth National Plans are also in the similar line toprovide effective and efficient healthcare system specially focusing to the rural poor. Thesehealth policies are also sought for participation of all levels and private sector services.
After restoration of the democracy, there has been tremendous improvement in healthcaresystem in Nepal. The health institution has been reached up to the VDCs and communitylevel. Overall access to health facilities also increased over the years. NLSS 2003/04 foundthat 62 percent of the households have access to health facility within 30 minutes of traveltime, which was only 45 percent in 1995/96 (CBS, 2004b). However, access to health servicesis not equal to all categories of people, even though the health is one of the basic publicservices, the fundamental right of all people. Healthcare service in Nepal has been enjoyedprimarily by those who have money and secondarily by those who have knowledge andmeans to attain it. For instance, the mean time taken to reach the health facility by householdsin the bottom four consumption quintiles is about 1 hour and 15 minutes while that for therichest quintile is only 16 minutes (CBS, 2004b). Similarly, urban-rural gap in access tohealth facility is large, 89 percent versus 57 percent. Another disparity in healthcare servicesis in private sector. Whatever private sector health services exist are urban based, especiallyKathmandu Valley. Consequently, urban-rural gap is also observed in choice of people. For
instance, more than half of rural individuals who are ill choose public facilities which may

7/30/2019 Pcdrc Nhea Final Report
http://slidepdf.com/reader/full/pcdrc-nhea-final-report 6/49
2
offer either traditional or modern treatments, while private care is the preferred choice inurban areas (Hotchkiss et al., 1998).
In spite of the best efforts of HMG, satisfactory changes have not occurred in providinghealth services. For instance, NLSS 2003/04 found that only 14 percent of the households
perceived the government health facility is “good” (CBS, 2004c
). This is primarily because of the poor infrastructures and in most of the cases programs fail to get implemented properly.The main reasons are: i) our country is poor itself and lacks many essential infrastructures forpeople to attain positive level of health services; ii) the literacy level of Nepal is low, that is,54.1 percent among those who are aged six years and above (Manandhar and Shrestha, 2003);and iii) these days, the delivery of essential health care services throughout Nepal has beensignificantly challenged by the Maoist insurgency (Klement and Silverman, 2003).
1.2 Project Justification
Several studies have been carried out in many years regarding the health services, fertility,family planning, child health, and maternal health and so on. Even though the first study of this kind was carried out in 1966, surveys relating to demography and health have beencarried out at an interval of five years since 1975 apart from taking such surveys at othertimes. The surveys have been carried out by the Department of Health, Ministry of Healthfrom the very beginning. However, the focus of the survey differs based on contemporarycontext of health policy of the country and interest of funding agencies. The first study of thiskind was undertaken in 1966 as “National Health Survey”. The survey was focused ongenerating data for demographic estimation for the first time in Nepal. The next survey wascarried out in 1974 to 1978 as longitudinal survey, “Family Planning Knowledge, Attitude
and Practice (KAP) and Fertility Survey”. It was to gather basic information on the familyplanning program and the base line demographic data for launching experimental pilotprojects to assess the impact of family planning program.
In 1976, Nepal Fertility Survey (NFS) was carried out in collaboration with World FertilitySurvey (WFS) project. It is the first most scientific survey in Nepal in terms of methodology.The NFS survey provided estimates of fertility levels at national and regional level anddeterminants of fertility. Since then, Contraceptive Prevalence Survey (CPS) was conductedin 1981 with the joint collaboration of Family Planning and Maternal and Child HealthProject and Westing House System, Washington DC, USA to determine the level of contraceptive use in the country. Fertility and Mortality Survey was conducted in 1984 by a
private research institution (New Era) with the technical support from the then NationalCommission Population. It helped to determine and delineate factors influencing fertility andmortality by geographic regions. Central Bureau of Statistics (1987: 338) outlined the majordrawbacks of the demographic surveys in Nepal are mainly due to limited use of relativelylarge amount of collected data; timely input of survey results to the formulations andevaluation of programs/policies can not be ensured; and no definite time frame forundertaking the surveys.
Since 1991, demographic surveys have been carried out with relatively more scientific and adefinite time frame, in every 5 year interval. Nepal Fertility, Family Planning, and HealthStatus Survey (NFFHS) was the first of its kind conducted in 1991. The survey interviewed
25,384 ever married women from the sample of 24,754 households in all 75 districts (MOH,1993). Nepal Family Health Survey (NFHS) was conducted in 1996 by Family Health

7/30/2019 Pcdrc Nhea Final Report
http://slidepdf.com/reader/full/pcdrc-nhea-final-report 7/49
3
Division, Department of Health Services. This survey was based on nationally representativesample of 8,082 households, from which 8,429 ever married women aged 15-49 years wereinterviewed (MOH, 1997). The latest survey conducted in 2001 is Demographic and HealthSurvey (DHS). These surveys were conducted under the aegis of Department of HealthServices and as part of the global DHS survey. This survey interviewed 8,726 ever married
women and 2,261 men from the sample of 8,602 households (MOH, 2002). These studies likeother previous studies, focused on the subject regarding fertility, family planning, childhealth, maternal health and other health related topics and also on views of married women of reproductive age on family planning, fertility preferences and health care. However, hardlyany researches were found to be dealing with the issues on fairness in financing and deliveryof health care.
Another nationally representative survey is Nepal Living Standards Survey (NLSS I) carriedout by Central Bureau of Statistics (CBS) with assistance from the World Bank in 1995/96.This survey collected information from 3,338 households. The survey provides informationon access to facilities, health, and nutrition along with demographic, social, and income and
consumption. The health section includes questions on whether each household member wasperceived to suffer from a chronic disease or from an illness or injury in the past month,whether the individuals used health care services, the type of place and practitioner that wasconsulted, and the consultation and travel costs for the last two consultations. Informationwas also collected on immunizations and child births. In 2003/04, CBS conducted NLSS IIsurvey with the same dimension. NLSS II enumerated 3,912 households. It also enumerated1,160 households from those interviewed in the NLSS I (1995/96).
This research is focused on the issues of health care services in Nepal. The issues includehealth services and financing, public opinion on health care services in the past five years,inequity of health services and consideration of public opinion in formulating plans andprograms by the government. This study is basically public opinion to understand the viewsof people on health care issues in general, fairness in financing and delivery of health care inparticular. This would help health care policy makers, planners, social workers, and programimplementing agencies such as NGOs, INGOs and Government agencies who are activelyengaged in health related programs at both national and regional levels to understand theopinion of the public on some of the health care issues.
1.3 Project Objective
The general objective of the research project is to conduct study on "public opinion onhealthcare services and health inequalities".The specific objectives are as follows:
• To get socio-economic background of the respondents.
• To know the public views on the trend of health services in the past five years.
• To get the public opinion on issues in inequity of government health services.
• To get the views of general public on government health services and financing.
• To know the public opinion about the importance given to their views on health careservices by the government.

7/30/2019 Pcdrc Nhea Final Report
http://slidepdf.com/reader/full/pcdrc-nhea-final-report 8/49
4
1.4 Study Operation Procedure
The procedure of the study is dealt in two separate sections. First section deals with theadministrative procedure adopted to coordinate and operate the overall project throughout theperiod of study. The second section is about the technical aspects, methods of survey,adopted for the survey operation.
1.4.1 Administrative Procedure
There was one technical advisory committee (TAC) to provide overall guidance andsupervision to the study team and to play bridge role between NHEA and PCDRC toaccomplish the research project. The committee was formed by the representatives of NHEA,PCDRC, and Principal Investigators (see Annex IIa). A study team was formed to accomplishthe present research project. It worked under close guidance and supervision of the technicaladvisory committee. The study team was formed with five persons, which included one
principal investigator and four team members (see Annex IIb). The job responsibilities of thestudy team was to hire field personnel and conduct training for field supervisors, enumeratorsand data processing staff, finalize the questionnaires under the guidance of NHEA and TACand to prepare the report.
1.4.2 Technical Procedure
i. Sampling Design
There are 30 districts selected for the sample of this study. The selection was made based on
the probability proportional to the size of the 2001 census population representing districtsfrom hill and Tarai and five development regions. From each district, 50 general public wereinterviewed and a total of 1500 interview was made from 30 sample districts (Table 1.1).Sixteen Districts were selected from Hill and 14 from Tarai ecological zone. Thus the totalnumber of interview from Hill is 800 and Tarai is 700. Similarly, the number of interview is1,094 from rural and 406 from urban sample.
Table 1.1: Distribution of interview and sample by type of health institutions, 2004
SN Health Institution Sample Interview
1 Central Hospitals 1 10
2 Regional Hospital 1 10
3 Zonal Hospitals 3 304 District Hospitals 24 242
5 PHC/Health Centre 31 310
6 Health Posts 29 291
7 Sub-Health Posts 61 607
Total 150 1,500
The survey was basically of individual survey type and the respondents were public.However, procedure of selecting respondents was based on the health institutions. Tenindividuals aged 18 years and above were selected from wards around the area where health
institution was located. The health institutions covered for the basis of selecting respondentswere central hospital, regional and zonal hospitals, district hospitals, Primary Health Centre

7/30/2019 Pcdrc Nhea Final Report
http://slidepdf.com/reader/full/pcdrc-nhea-final-report 9/49
5
(PHC), health post (HP) and sub-health post (SHP); 1 district hospital, 1 PHC, 1 HP, and 2SHPs from one district. In addition, one central (Bir Hospital, Kathmandu) and one regionalhospital (Pokhara, Kaski) were also visited.
ii. Questionnaire Design and Pretest
This opinion poll survey was basically designed to collect quantitative data through thestructured interview. The standard tested questionnaire was used for the interview (Annex I).Originally, the questionnaire were in English and it was translated into Nepali for theconvenience of the field worker and respondents. The questionnaire was slightly modified tofit into Nepalese context. A series of discussions were made to finalize the questionnaireamong study team in close supervision and guidance of technical advisory committee TAC.Pretest was also conducted to get the questionnaire into final shape.
iii. Hiring and Training for Field Personnel
A total of 15 persons were hired as field researchers for field operation that included 12 malesand 3 females (see Annex III). Field researchers were qualified having completed Master’sDegree in Sociology and other social sciences having experiences in a number of similarsurvey researches. Most of them were PCDRC members and a few were hired from outside.Among the field personnel, 6 were designated as supervisors to supervise and guide the fieldresearchers in the field. And, two persons were also designated as mobile supervisors tosupervise and check the field operation properly and to maintain uniformity in field survey.All the field districts were assigned to these two mobile supervisors.
A three-day rigorous training was conducted for the field researchers. The first day trainingwas focused on concept of the survey, content of questionnaire and stressed on the ways toobtain valid and reliable information from the survey by interviewing people. The trainingwas as much participatory as possible. The concept of content of the questionnaire andmethodology of interview was delivered during the first day and the discussions were madeand the participants were familiarized about their respective assignments and the questioners..In second day, field researchers were sent to the sample field for field training. The mainobjective of the field training was pretesting of the questionnaire and to get more comfortableand familiar with the same. In third day, a discussion was organized to clarify and correct theconfusion in concept and method of the survey.
iv. Survey Operation
A total of 6 group containing not less than two field researchers in a group were deployed fortwenty days to conduct the field survey. Among the field researchers, enumerators wereresponsible for interviewing the people and supervisors were responsible for interview,supervision, field editing and collecting questionnaire in PCDRC. There was a also a mobileteam consisting of two persons responsible for overall supervision, monitoring and to solveproblems if faced in the field operation during the whole survey period.
v. Data Management and Analysis
Filled up questionnaire was rigorously edited before entering into the database, which helped
to minimize the errors and inconsistencies in the filled forms. A few questions were codedand some other categories in the questions were recoded during the desk editing. After desk

7/30/2019 Pcdrc Nhea Final Report
http://slidepdf.com/reader/full/pcdrc-nhea-final-report 10/49
6
editing the forms, the data were entered into the database using Microsoft Access softwarewhich was later converted into SPSS format after. A rigorous data cleaning was carried out inSPSS to minimize inconsistencies and errors generated in the field survey and in the dataentry stage. After machine editing, the tabulation was done in SPSS using required frequencyand cross-tables for the data analysis.
1.5 Limitations of the Study
The aim of the survey was to collect rich data for the study. However, following limitationshave been observed while conducting this study.
• This study was solely based on primary information obtained from the field survey in aquite large sample covering 30 out of 75 districts. So, field survey was at risk of physicaldanger due to current violent political conflict. Another important factor is that manyhealth offices in the rural areas either do not have health staff or the offices have beenclosed due to threat of conflict. Considering this risk, most of the field sites selectedwere relatively safe and they were closer either to district headquarter or to urban area.In this way, representation of rural areas in terms of response may be quite bias towardsurban perception.
• The survey is completely based on structured interview and very limited number of questions were was used. Analysis based on such limited questions does not providedepth of the issues, because there were not subsequent and supportive questions thatcould be used to substantiate better. Therefore, such limited information provides onlythe status of the issues to fulfill stated objectives.

7/30/2019 Pcdrc Nhea Final Report
http://slidepdf.com/reader/full/pcdrc-nhea-final-report 11/49
7
Chapter II
Country Situation
This chapter provides general overview of the country in terms of health systems based onthe literature review and is divided into two parts that is country overview and healthsystems.
2.1 Country Overview
Nepal is one of the poorest countries in the world. Very low per capita income with a highpercentage of population living below the poverty line, high proportion of illiterate women,and high proportion of rural population are the major indicators of poverty and backwardness
of Nepal (Table 2.1). Along with this Nepal has been experiencing a rapid population growthcontributed by steady decline in mortality and almost constant or slow decline in fertility.
Since last decade, overall health situation has been improving in Nepal. This has contributedincreased life expectancy and decreased mortality and fertility. For the first time in Nepal,estimate of life expectancy at birth of women is found to be slightly higher than that of men.This indicates overall health of women has been improved compared to past years. However,the overall level of socio-economic development is still low compared to other manydeveloping countries. DI, NHEA, and IPS (2000) found similar situation of health in Nepaland Bangladesh but both countries are far behind Sri Lanka.
Table 2.1 General Indicators for NepalIndicators Value Source
Socio-economicPopulation (millions) 23 CBS, 2002Area (‘000 km2) 147 CBS, 2002HDI 0.471 UNDP, 2004b GDP per capita (US$) 271 CBS, 2004a GNP per capita (US$) 278 CBS, 2004a GDP per capita (PPP$) 1,370 UNDP, 2004a Gini Index 36.7 UNDP, 2004a Ratio of population living below poverty line 42 NPC, 2003
Percent rural population 86.1 Sharma, 2003% Illiteracy of women (>15 years) 66.2 CBS, 2004b
Health StatusLife expectancy at birth in years (male) 60.5 UNDP, 2004b Life expectancy at birth in years (female) 61.5 UNDP, 2004b Infant mortality rate 64 MOH, 2002Maternal mortality ratio/10,000 740 UNFPA, 2004
DemographyTotal fertility rate 4.1 MOH, 2002Crude birth rate 33.5 MOH, 2002Crude death rate 9.6 MOPE, 2003

7/30/2019 Pcdrc Nhea Final Report
http://slidepdf.com/reader/full/pcdrc-nhea-final-report 12/49
8
2.2 Health Systems and Health Policies in Nepal
As much as 86 percent of the Nepal’s total population reside in rural areas. Though the healthcare of the rural areas of Nepal is dominated by traditional practices (known as Baidhya,Dhami, Jhakri, etc.), the government healthcare system is the major contributor of indigenoushealthcare system. In 1995-96, the Ayurvedic Aushadhalayas provided care to 8.3 millionpatients, while the Yunani dispensaries treated 9,767 patients (DI, NHEA, and IPS, 2000).
Recognizing the need for primary health care to the rural population, Nepal adopted NationalHealth Policy of Nepal in 1991 (MOH, 1991). The main objective of the National HealthPolicy is to extend the primary health care system to the rural population so that they benefitfrom modern medical facilities and trained health care providers by preventive, promotive,and curative health services. Primary health care services at district level through Sub HealthPost (SHP), Health Post (HP), Primary Healthcare Centers (PHC) and District Hospital (DH)(Table 2.2). Secondary care is provided by zonal/regional hospitals and specialized tertiary
facilities. In order to achieve the goals of health policy, a pyramidal health care system hasbeen adopted in Nepal. Community participation is also essential part of the health systems inNepal. Participation of female community health volunteers (FCHV), traditional birthattendants (TBA), and leaders of various local social organizations. VDCs also provides sitesfor the SHPs. This system is based on the concept of lower level health facilities makingreferrals to higher-level health facilities up to the district level hospital (NHEA, 2004).
Table 2.2: Government Health Facilities
Government Health Facilities Total 1. Specialized/Central Hospitals 52. Regional Hospital 1
3. Sub Regional Hospitals 14. Zonal Hospitals 115. District Hospitals 676. District Health Office 757. Primary Health Care Center (PHC-C) 1808. Health Post (HP) 7119. Sub Health Post (SHP) 3,17910. PHC Outreach Clinics 15,548
Source: Fact Sheet, MOH, 2005.
After adopting National Health Policy, health care sector has made significant progress in
both the public and the private sectors. The increase in the establishment of healthcarefacilities has reflected the government’s commitment to improve access of the rural poorpopulation to modern basic health care. The government has built many health care centers atall village level committees and mentioned that sub- health post (SHP) are considered inNepal as the entry point of primary health care (village people). With this concept, there hasbeen a major shift in resource transfer from the center to district and at the village level directtowards addressing the rural poor (Shrestha et. al, 2000).
Department of Health Services is the responsible line agency to implement governmenthealth policies. It delivers the preventive, promotive and curative health services throughoutthe Kingdom. Figure 1 shows organizational structure of the Ministry of Health to implement
health programs at different levels of the health system related to form a network under theDepartment of Health Services.

7/30/2019 Pcdrc Nhea Final Report
http://slidepdf.com/reader/full/pcdrc-nhea-final-report 13/49
9
In line with the National Health Policy, Ninth National Plan prioritized the healthdevelopment as necessary goal for poverty reduction (NPC, 1998). The main objectives of this plan are to universalizing essential health services, increasing access to the healthfacilities, promoting safe motherhood, recruiting and training skilled human resources,mobilizing other partners to support decentralization, reforming health policies, mobilizing
additional resources, reducing population growth rates, improving female literacy rates, andincreasing peoples income earning capacities.
At the same time, the Ministry of Health developed a 20-year Second Long-Term Health Plan(SLTHP) for 1997-2017. The aims of the SLTHP are to provide a guiding framework to buildsuccessive periodic and annual health plans that improve the health status of the population;to develop appropriate strategies, programs, and action plans that reflect national healthpriorities that are affordable and consistent with available resources; and to establish co-ordination among public, private and NGO sectors and development partners (MOH, 1998).The plan addresses disparities in healthcare, assuring gender sensitivity and equitablecommunity access to quality healthcare services through full community participation,
decentralization, gender sensitivity, effective and efficient management, and private andNGO participation.
Accordingly, during the last decade, there has been tremendous increase in private and NGOsector health services. MOH listed 14 NGO sector, 74 Private and 3 community run hospitals.However, they are basically urban based and almost 47 percent of them are in Katmanduvalley. Thouugh large no of doctors are employed by the public sectors, most of them are alsoinvolved in private practices. A 1993 study estimated that 90 percent of doctors wereinvolved in private practices (Center for Education and Technical Studies, 1993). On thecontrary healthcare system has not been functioning well in many rural areas and have notbeen able to achieve its primary goal. It is mainly because as outlined by UNS (1999), thereis a shortage of adequately trained health personnel with numerous staff vacancies in sub-health posts, health posts and primary health care centers (PHCs). Furthermore, the absenceof an effective and efficient referral system that links community health services to higherlevels of care also greatly diminishes the trust people place in the public health system.Where they do exist, these systems often do not make adequate use of public, private or NGOservice providers.
Realizing the situation, the government formulated a Health Sector Strategy in 2002 toaddress the health sector needs. It provides a coherent strategic framework to involve all thestakeholders. The objectives of this strategy are: extending essential health care services to
all, with special emphasis for the poor population living in rural areas; management of thegrowing population by enhancing the accessibility of rural population to family planningservices and expanding maternal and child health services; and ensuring effective control of communicable diseases, such as Malaria, Tuberculosis, and HIV/AIDS. Tenth Plan (2002-2007) has adopted a number of strategies to achieve these objectives: i) expansion of primaryhealth centers and district hospitals, and strengthening out-patient services in hospitals; ii)development and retention of trained health personnel in rural areas; iii) increased supply of essential drugs and vacancies; iv) improved delivery of health services, publicly, throughdecentralized management/ delivery, through increased participation of the private sector,INGOs, and NGOs, or through public-private partnerships; v) improved regulatorymechanisms to ensure the quality and accessibility of health services; and vi) improving
human resource development and management and health care financing (NPC, 2003).

7/30/2019 Pcdrc Nhea Final Report
http://slidepdf.com/reader/full/pcdrc-nhea-final-report 14/49
10
ACRONYMS:
MD: Management DivisionFHD: Family Health DivisionCHD: Child Health DivisionEDCD: Epidemiology and Disease Control
DivisionLMD: Logistics Management DivisionLCD: Leprosy Control DivisionNHTC: National Health Training Centre
NHEICC: National Health Education,Information & CommunicationCentre
NTC: National Tuberculosis CentreNCASC: National Centre for AIDS & STD
ControlNPHL: National Public Health LaboratoryFCHV: Female Community Health
VolunteerTBA: Traditional Birth AttendantPHC: Primary Health Care
EPI: Expanded Program on Immunization
Ministry of Health
Department of Health Services
C E N T E R SD I V I S I O N S
M D
F H D
C H D
E D C D
L M D
L C D
N H T C
N
H E I C C
N T C
N
C A S C
N P H L
Central Hospitals -5
Regional Health Directorate - 5
R e i o n a l H o s
i t a l - 1
R e t i o n a l T r a i n i n
C e n t r e - 5
R e i o n a l L a b o r a t o r
- 1
R e i o n a l M e d i c a l S t o r e - 5
R e i o n a l T B C
e n t e r - 1
Zonal Hospital - 11
District Public Health Office - 14 District Hospital - 67 District Health Office - 75
Primary Health Care Centre/ Health Centre - 180
Health Post - 711
Sub-Health Post – 3,179
FCHV TBA PHC Outreach EPI Outreach
Source: DOHS, Annual Report 2001/02.
Figure 1: Organizational Structure of the Department of Health Services

7/30/2019 Pcdrc Nhea Final Report
http://slidepdf.com/reader/full/pcdrc-nhea-final-report 15/49
11
2.3 Government Financing in Health Sector
In case of healthcare services financing, Nepal has government financed care with publicprovision of medical services. The government services are overwhelmingly tax financed.MOH expenditures as a percentage of the total National budget grew from 3.17 in 1992/93 to4.93 percent in 2002/03, which is, however, only 1 percent of the GDP (NHEA, 2004).UNDP also shows that the total government expenditure on health is only 1.5 percent of theGDP and it is in the public sector (Table 2.3). The health expenditure per capita is US$63.
A very limited amount is generated through user fees. Government has also allowed privatesector financing and provision. Private sector financing is relatively higher (3.6% of GDP)than the public sector, however, they are mostly based on urban areas. Based on thegovernment financing, on the average, ratio of population to the health services is 18,439persons per doctor, 4,987 persons per nurse, 2,349 persons per hospital bed, and 2,071persons per health service provider.
Table 2.3: Background Information on National Health SystemsIndicators Value Source
Health SpendingTotal Expenditure on Health as a % of GDP 1.5 UNDP, 2004a Health Expenditure Per Capita (PPP US$, 2001) 63 UNDP, 2004a
Composition of Health ExpenditurePublic as a % of GDP (2001) 1.5 UNDP, 2004a Private as a % of GDP (2001) 3.6 UNDP, 2004a
Health Service ProvidedPer Doctor 18,439 MOH, 2005Per Nurse 4,987 MOH, 2005
Per Hospital Bed 2,349 MOH, 2005Per Health Care Provider Ratio 2,071 MOH, 2005
* Doctor, Nurse/ANM, Health Assistant/AHW (2001 Calculation).

7/30/2019 Pcdrc Nhea Final Report
http://slidepdf.com/reader/full/pcdrc-nhea-final-report 16/49
12
Chapter III
Background Characteristics of the Respondents
This chapter describes about general background characteristics of the respondentsinterviewed in the survey. The total number of respondents were 1,500 aged 18 years andabove. The reason for selecting respondents of 18 years and above is to assure the capabilityof respondents to respond the survey questionnaire and to provide their opinion on the issuesregarding the study. Based on this survey, following are the background characteristics.
3.1 Type of Place of Residence
Survey interviewed 72.9 percent respondents from rural and 27.1 percent from urbanresidents (Table 3.1). The percentage of urban residents according to census 2001 is 14 in
Nepal (Central Bureau of Statistics, 2002). Urban representation in this study is considerablyhigher than the urban residents in total national population. It is because the healthinstitutions are mostly located in urban areas. While looking at the ecological zone, majorityof the samples are from hill areas (53.3%).
Table 3.1: Distribution of Respondents by Place of Residence
Place of Residence N Percent
Place of ResidenceRural 1,094 72.9Urban 406 27.1
Ecological ZoneHill 800 53.3Tarai 700 46.7
Total 1,500 100.0
3.2 Religion
Large majority of the respondents are Hindu that is 88 percent (Table 3.2). The share of national population of Hindus is 80.6 percent (MOPE, 2003). Respondents who followBuddhism are 5.9 percent and Islam are 3.2 percent. The respondents who follow Christian
are only 5, which is even smaller than other category (2.3%). Other included here are Kirantiand Jain.
Table 3.2: Distribution of Respondents by Religion
Religion N Percent
Hindu 1,325 88.3Buddhist 88 5.9Muslim 48 3.2Christian 5 0.3Other 34 2.3
Total 1,500 100.0
7/30/2019 Pcdrc Nhea Final Report
http://slidepdf.com/reader/full/pcdrc-nhea-final-report 17/49
13
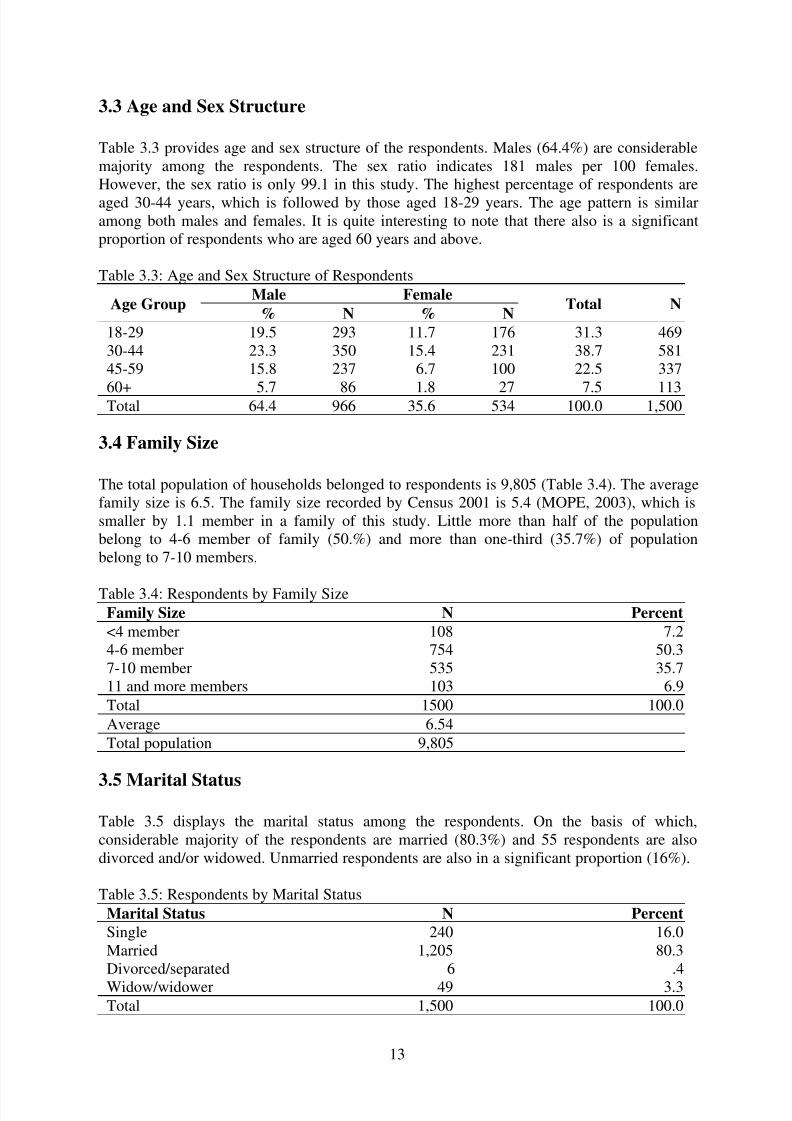
3.3 Age and Sex Structure
Table 3.3 provides age and sex structure of the respondents. Males (64.4%) are considerablemajority among the respondents. The sex ratio indicates 181 males per 100 females.However, the sex ratio is only 99.1 in this study. The highest percentage of respondents areaged 30-44 years, which is followed by those aged 18-29 years. The age pattern is similaramong both males and females. It is quite interesting to note that there also is a significantproportion of respondents who are aged 60 years and above.
Table 3.3: Age and Sex Structure of Respondents
Age GroupMale Female
Total N% N % N
18-29 19.5 293 11.7 176 31.3 46930-44 23.3 350 15.4 231 38.7 58145-59 15.8 237 6.7 100 22.5 337
60+ 5.7 86 1.8 27 7.5 113Total 64.4 966 35.6 534 100.0 1,500
3.4 Family Size
The total population of households belonged to respondents is 9,805 (Table 3.4). The averagefamily size is 6.5. The family size recorded by Census 2001 is 5.4 (MOPE, 2003), which issmaller by 1.1 member in a family of this study. Little more than half of the populationbelong to 4-6 member of family (50.%) and more than one-third (35.7%) of populationbelong to 7-10 members.
Table 3.4: Respondents by Family SizeFamily Size N Percent
<4 member 108 7.24-6 member 754 50.37-10 member 535 35.711 and more members 103 6.9
Total 1500 100.0
Average 6.54
Total population 9,805
3.5 Marital Status
Table 3.5 displays the marital status among the respondents. On the basis of which,considerable majority of the respondents are married (80.3%) and 55 respondents are alsodivorced and/or widowed. Unmarried respondents are also in a significant proportion (16%).
Table 3.5: Respondents by Marital Status
Marital Status N Percent
Single 240 16.0Married 1,205 80.3Divorced/separated 6 .4
Widow/widower 49 3.3Total 1,500 100.0

7/30/2019 Pcdrc Nhea Final Report
http://slidepdf.com/reader/full/pcdrc-nhea-final-report 18/49
14
3.6 Education
The survey did not collect information on literacy categorically. It collected information onwhether the respondents attended school and acquired some grades or not disregarding theliteracy. As shown in Table 3.6, 28.5 percent of respondents never attended school and theremaining 71.5 percent attended school and acquired grades.
Among those who attended school, highest proportions passed secondary level of education(26.8%). This is followed by those who have primary (23.7%) and then by those who haveuniversity education (under-graduate) (19.9%). The respondents who have done post-graduate are also in a significant number (17 or 1.1%).
Table 3.6: Educational Status
Educational Status N Percent
No Schooling 427 28.5
Primary 355 23.7Secondary 402 26.8University 299 19.9Post Graduation 17 1.1
Total 1,500 100.0
3.7 Economy
3.7.1 Main Activities of Respondents
To understand the economic background of the respondents, the survey collected informationon two aspects; main activity and the household income per year in general. Table 3.7provides main activities of respondents for their livelihood. The information shows that thehighest percentage of respondents are unemployed (43.5%) and another highest percentage of them are self-employed such as in own agriculture and related activities (23.4%). Of them, 10percent are students, about 9 percent are professionals, and 5.2 percent are unskilled worker.And, 4.3 percent of respondents are skilled worker and 2.2 percent are retired.
Table 3.7: Main Activities of Respondents
Activities N Percent
Unemployed 652 43.5Self-employed 351 23.4Student 150 10.0Professional 132 8.8Unskilled Worker 78 5.2Skilled Worker 64 4.3Retired 33 2.2Other 40 2.7
Total 1,500 100.0

7/30/2019 Pcdrc Nhea Final Report
http://slidepdf.com/reader/full/pcdrc-nhea-final-report 19/49
15
3.7.2 Income Poverty
The survey also enquired about household income per year in the survey. According to thereport of respondents, income of the households are classified into 5 quintile categories todemonstrate the continuum from poorest, poor, middle income, rich, and richest households.
This classification is based on the quintile categories of household income per year obtainedfrom NLSS 1996 data. NLSS 1996 information on income was based on seven sectors of household income obtained from the survey. Seven sectors includes income from: allagriculture farm; non-agriculture farm enterprises; wage; non-agriculture rental; remittanceand transfers; owner occupied housing (house rent); and others (interest and dividend fromtax and savings, deposits, stock share, employment provident, pension, commission,royalties, etc.). The range of quintile categories was adjusted by projected IMF CPI for theperiod of 2003/04 (1.574). Adjusting 1996 quintile categories by 1.574 provides thecategories of household income per year for 2004. Finally, the income per year was changedinto per month.
Based on these categories, 8.5 percent of the enumerated households are poorest and 10.9percent are poor (Table 3.8). On the other hand, 39.3 percent of the households fall in therichest categories and 24.5 percent in rich. And, only 16.8 percent of households have middlelevel income.
Table 3.8: Household Income (Rs.) Per Month Quintiles
Quintile Category Income Range % N
First Quintile <2,069 8.5 127Second Quintile 2,070 − 3,187 10.9 164
Third Quintile 3,188 − 4,755 16.8 252
Fourth Quintile 4,756 − 7,677 24.5 367Fifth Quintile > 7,678 39.3 590
Total 100.0 1,500

7/30/2019 Pcdrc Nhea Final Report
http://slidepdf.com/reader/full/pcdrc-nhea-final-report 20/49
16
Chapter IV
Status of Health Services
4.1 Trend of Health Services in Past Five Years
This section deals with the trend of government health services in the last five years. Thecomponents being discussed includes use of health services, gap between rich and poor,change in government spending on health services, and change in quality of governmenthealth services. The observation discussed here are based on the interview with respondentsduring the field survey.
4.1.1 Preferred Use of Health Services
Table 4.1 provides the trend of people to access medical facility when they get sick. More
than three-fourth of the respondents (75.5%) reported that they generally visit governmenthospitals and clinics when they felt sick during the last five years. Other 10.2 percent went toprivate hospitals, 8.3 percent went to pharmacies and shops and only 6 percent went toprivate clinics and doctors. The percentage of rural residents is higher among those who visitgovernment hospitals, whereas the percentage of urban residents is higher among those whovisit private hospitals and doctors. The trend is similar to the findings of Hotchkiss et al(1998), but not for urban areas that private care is preferred choice in urban areas.
Table 4.1: Health Institutions Where People Generally Visited in the Last Five Years
Health Institutions Urban Rural Total
Government Hospitals/Clinics 69.7 77.7 75.5Private Hospitals 11.1 9.9 10.2Pharmacies/Shops 7.6 8.5 8.3Private Doctors/Clinics 11.6 3.9 6.0
Total % 100.0 100.0 100.0N 406 1,094 1,500
4.1.2 Change in Income Between Rich and Poor
Information obtained the observation of respondents shows that the highest percentage of respondents (40.3%) observed that the income between rich and poor has increased during
the last five years (Table 4.2). It indicates the gap between rich and poor is yet increasing.Another 33.5 percent reported the gap has not changed, whereas 21.1 percent observed thegap has been decreasing.
Table 4.2: Change in Income Between Rich and Poor in the Last Five Years
Change in Income Urban Rural Total
Increased 43.8 39.0 40.3Not changed 36.7 32.4 33.5Decreased 16.7 22.8 21.1Don't Know/No opinion 2.7 5.9 5.0
Total % 100.0 100.0 100.0
N 406 1,094 1,500

7/30/2019 Pcdrc Nhea Final Report
http://slidepdf.com/reader/full/pcdrc-nhea-final-report 21/49
17
Respondents from urban areas (43.8%) observed increased gap in income between rich andpoor during the last five years compared to rural areas (39%). Correspondingly, therespondents from rural areas (22.8%) observed decreased gap in income between rich andpoor compared to urban areas (16.7%). This clearly confirms that the gap between rich andpoor has been increasing more in urban areas.
4.1.3 Change in Government Spending on Health Services
A considerable majority of the respondents (64.2%) observed that the government spendingon health services has increased during the last five years (Table 4.3). There are also 29.4percent of the respondents who observed there is no change in government spending onhealth services. Increased efforts of the government in health services is slightly lower inurban areas reported by 62.8 percent than in rural areas reported by 64.7 percent of therespondents.
Table 4.3: Change in Government Spending on Health Services in the Last Five Years
Change in Govt. Spending Urban Rural Total
Increased 62.8 64.7 64.2Not changed 31.3 28.7 29.4Decreased 2.5 3.4 3.1Don't Know/No opinion 3.4 3.2 3.3
Total % 100.0 100.0 100.0N 406 1,094 1,500
4.1.4 Change in Quality of Government Health Services
A considerable majority of the respondents observed that the overall quality of governmenthealth services has increased during the last five years (Table 4.4). For instance, almost 64percent of the respondents reported that the quality of government health services hasincreased. There is a noticeable proportion of the respondents (7.3%) who observed thedecreased quality of health services and also 27.1 percent who did not see any change in thequality during the last five years.
Table 4.4: Change in Quality of Government Health Services in the Last Five Years
Change in Quality Urban Rural Total
Increased 64.5 63.7 63.9Not changed 24.4 28.2 27.1
Decreased 10.1 6.3 7.3Don't Know/ No opinion 1.0 1.8 1.6
Total % 100.0 100.0 100.0N 406 1,094 1,500
4.2 Inequality in Health Services
This section deals with existing situation of issues in inequality of government healthservices. The information is based on the observation reported by the respondents. It is
important to note here that change in income gap between rich and poor as observed in theprevious section of this report is one of the causes to make health services provided by the

7/30/2019 Pcdrc Nhea Final Report
http://slidepdf.com/reader/full/pcdrc-nhea-final-report 22/49
18
government easily accessible. Inequality here, therefore, is discussed in terms of the level of accessibility, use, contribution, receiving subsidies, and better health situation on the basis of income status of the high, middle and the lower end of the economic segment of the people.
4.2.1 Access in Government Health Services
A question was asked to the respondents about who among the designated income status suchas better off, middle income, and the poor have the best access in government health services.Table 4.5 provides the answer of the respondents on this question. It is surprising to note thatboth rich and the poor have the best access in government health services as reported byalmost one third of the total respondents (33%). Another 26.5 percent reported that all sortsof people have same access in the health services. However, very few respondents reportedthat middle income people have the best access in the government health services.
The observation does not vary much among rural and urban residents. However, the overallfinding has been supported by slightly higher proportions of the urban residents.
Table 4.5: Who Has Best Access in Government Health Services?
Category of People Urban Rural Total
Better off 33.5 31.9 32.3Middle income 12.1 6.9 8.3The poor 34.0 32.4 32.9All same 20.4 28.7 26.5
Total % 100.0 100.0 100.0N 406 1,094 1,500
4.2.2 Use of Government Health Services
For the use of government health services, question was asked to the respondents about whomakes the most use of government health services. Table 4.6 shows that highest percentageof respondents reported that the poor people make most use of the government services(39.3%). It is quite natural that the poor people are much vulnerable to diseases and illness inone hand, and they are compelled to make use of government health services as they can notafford private hospitals and clinics, on the other. The next largest percentage of respondentsreported that all sorts of people use the same level of government health services (28.3%).And, lowest percentage of respondents reported that middle income people make most use of government health services.
Table 4.6: Who Makes Most Use of Government Health Services?
Category of People Urban Rural Total
Better off 20.7 18.6 19.1Middle income 16.0 12.2 13.3The poor 38.9 39.4 39.3All same 24.4 29.8 28.3
Total % 100.0 100.0 100.0N 406 1,094 1,500
The response pattern is not so much different among the residents from both rural and urbanareas. Only the proportion of respondents is slightly higher among those who reported betteroff and middle income people make most use of government health services.
7/30/2019 Pcdrc Nhea Final Report
http://slidepdf.com/reader/full/pcdrc-nhea-final-report 23/49
19
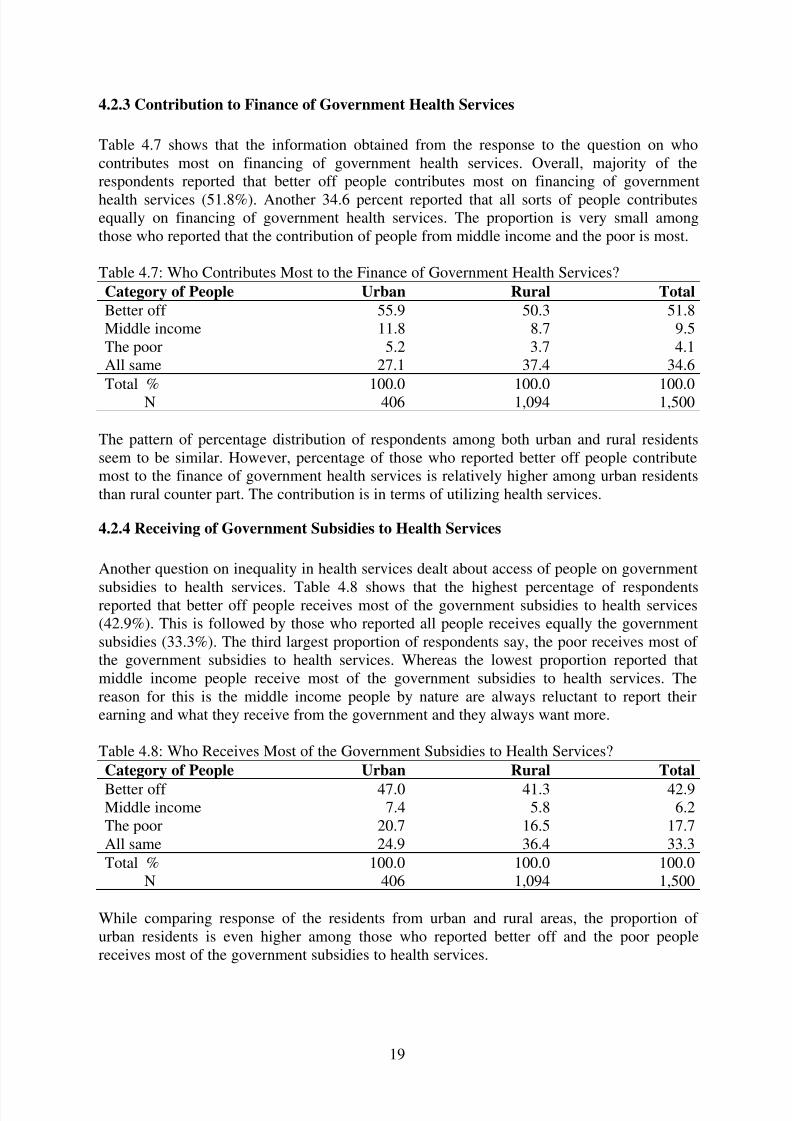
4.2.3 Contribution to Finance of Government Health Services
Table 4.7 shows that the information obtained from the response to the question on whocontributes most on financing of government health services. Overall, majority of therespondents reported that better off people contributes most on financing of government
health services (51.8%). Another 34.6 percent reported that all sorts of people contributesequally on financing of government health services. The proportion is very small amongthose who reported that the contribution of people from middle income and the poor is most.
Table 4.7: Who Contributes Most to the Finance of Government Health Services?
Category of People Urban Rural Total
Better off 55.9 50.3 51.8Middle income 11.8 8.7 9.5The poor 5.2 3.7 4.1All same 27.1 37.4 34.6
Total % 100.0 100.0 100.0N 406 1,094 1,500
The pattern of percentage distribution of respondents among both urban and rural residentsseem to be similar. However, percentage of those who reported better off people contributemost to the finance of government health services is relatively higher among urban residentsthan rural counter part. The contribution is in terms of utilizing health services.
4.2.4 Receiving of Government Subsidies to Health Services
Another question on inequality in health services dealt about access of people on government
subsidies to health services. Table 4.8 shows that the highest percentage of respondentsreported that better off people receives most of the government subsidies to health services(42.9%). This is followed by those who reported all people receives equally the governmentsubsidies (33.3%). The third largest proportion of respondents say, the poor receives most of the government subsidies to health services. Whereas the lowest proportion reported thatmiddle income people receive most of the government subsidies to health services. Thereason for this is the middle income people by nature are always reluctant to report theirearning and what they receive from the government and they always want more.
Table 4.8: Who Receives Most of the Government Subsidies to Health Services?
Category of People Urban Rural Total
Better off 47.0 41.3 42.9Middle income 7.4 5.8 6.2The poor 20.7 16.5 17.7All same 24.9 36.4 33.3
Total % 100.0 100.0 100.0N 406 1,094 1,500
While comparing response of the residents from urban and rural areas, the proportion of urban residents is even higher among those who reported better off and the poor peoplereceives most of the government subsidies to health services.

7/30/2019 Pcdrc Nhea Final Report
http://slidepdf.com/reader/full/pcdrc-nhea-final-report 24/49
20
4.2.5 Better Health Situation
Finally, inequality in health services is examined on the basis of health situation among thepeople. It is quite natural that the better off people have better health situation as they arecapable to afford better health services and it rarely matters whether it is private or
government. Similarly, as shown in Table 4.9, the highest percentage of respondents (45.3%)reported that better off people are in better health. This percentage is even higher amongurban residents than among rural residents. The next highest percentage reported that allpeople are in better health situation (36.9%). However, this percentage is slightly loweramong urban residents than among rural residents. A striking thing is that percentage of middle income respondents is considerably low (5.5%) who reported on who is in betterhealth. Finding is similar to receiving the most government subsidies to health services. Thisis also due the fact that middle income people tend to hide their prosperity in the hope of getting more from others.
Table 4.9: On the Average, Who is in Better Health?
Category of People Urban Rural Total
Better off 47.0 44.7 45.3Middle income 7.4 4.8 5.5The poor 12.3 12.2 12.3All same 33.3 38.2 36.9
Total % 100.0 100.0 100.0N 406 1,094 1,500
4.3 Current Situation of Health Services
This section deals with the current situation of government health services. In order tounderstand the health situation; status of health system, people’s access to health services,and people’s satisfaction with health services are discussed here as per the informationcollected from the field survey.
4.3.1 Status of Government Health System
As discussed previously that the government spending on health services has been increasing(Table 4.3), the status of health system is also found to be getting better over the past fewyears. For instance, 73.2 percentage of the respondents reported that the health system isgetting better (Table 4.10). The second highest percentage of respondents (17%) reported thatthere is no change in the health system over the years. The proportion of those who reportedof degrading health system can not be ignored (8.8%) and should be taken take intoconsideration.
Table 4.10 Health System Over the Past Few Years
Status of Health System Urban Rural Total
Better 68.2 75.0 73.2Worse 11.6 7.8 8.8No change 19.2 16.2 17.0Don't Know 1.0 1.0 1.0
Total % 100.0 100.0 100.0N 406 1,094 1,500

7/30/2019 Pcdrc Nhea Final Report
http://slidepdf.com/reader/full/pcdrc-nhea-final-report 25/49
21
The pattern is similar even among the residents from urban and rural areas. However, thepercentage of those who reported the health system getting better is relatively higher amongrural than among urban residents. In contrast, percentage of those reporting on declininghealth system is relatively higher among urban residents.
4.3.2 People’s Access to Health Services
Access of people to government health services is examined on the basis of information onhow easy or difficult it is to obtain health care in general, for poor, and for rich people. Table4.11 shows that majority of the respondents reported that government health care is easy toobtain in general (69%). This proportion is slightly lower among the urban residents (64.3%).However, proportion who reported health care is difficult to obtain is also significant, morethan one-fifth of the respondents, which is slightly higher among urban residents (22.9%).
Table 4.11: Difficulty/Easy in Getting Health Care
Easy/Difficulty Urban Rural Total
Very Easy 9.6 5.2 6.4Easy 64.3 70.7 69.0Difficult 22.9 20.0 20.8Quite Difficult 3.2 3.8 3.7Not used 0.0 0.2 0.1
Total % 100.0 100.0 100.0N 406 1,094 1,500
The pattern of reporting is similar even though the question was specifically indicated to poor
people. But the percentage is slightly different from question in general. For instance, 58.3percent of the respondents reported that getting health care is easy for poor people (Table4.12). This proportion is considerably lower among the urban residents as compared toamong rural residents. On the other hand, percentage of those who reported that gettinghealth care for poor is difficult is 30.7. This proportion is more than ten-times higher amongurban than among rural residents.
Table 4.12: Difficulty/Easy for Poor in Getting Health Care
Easy/Difficulty Urban Rural Total
Very Easy 3.7 1.8 2.3Easy 49.3 61.6 58.3
Difficult 38.2 27.9 30.7Quite Difficult 8.6 8.2 8.3Don't Know/ No Opinion 0.2 0.5 0.4
Total % 100.0 100.0 100.0N 406 1,094 1,500
This question indicates the highest percentage of respondents reported that getting health carefor rich people is easy (50%) (Table 4.13). And, only the difference is that a large proportionof respondents reported to get health care for rich is very easy (46%). The proportion of thosereporting to be difficult to get health care is negligible. The pattern is similar to both urbanand rural residents.

7/30/2019 Pcdrc Nhea Final Report
http://slidepdf.com/reader/full/pcdrc-nhea-final-report 26/49

7/30/2019 Pcdrc Nhea Final Report
http://slidepdf.com/reader/full/pcdrc-nhea-final-report 27/49
23
Table 4.15: Status of Satisfaction with Current Health Services
Status of satisfaction Urban Rural Total
Very Satisfied 3.4 2.4 2.7Satisfied 60.6 67.8 65.9
Not Satisfied 36.0 29.8 31.5Total % 100.0 100.0 100.0
N 406 1,094 1,500
The respondents not satisfied with the government health services were asked anotherquestion to further understand the reasons about their dissatisfaction. Table 4.16 provides theinformation on reasons. Among the reasons provided by the respondents, misbehaviour of doctors and other health staffs (26.7%) and shortage of medicine (24.2%) are most importantfactor about their dissatisfaction with government health services. Poor quality of services(16.1%), lack of doctors/equipments (14.6%), and long waiting time (13.3%) are alsoimportant reasons but the percentage is relatively lower than former two reasons.
The reason for dissatisfaction with government health services is slightly different whilecomparing rural and urban areas. For instance, among rural residents, shortage of medicine(27%) and misbehaviour of doctors/staffs (24.5%) are found to be the most importantreasons, whereas among urban residents misbehaviour of doctors/staffs (31.5%) and lack of doctors/equipments (19.2%) are most important reasons for being not satisfied with thegovernment health services.
Table 4.16: Reasons for not Satisfied with Current Health Services
Reason for Not Satisfied Urban Rural Total
Misbehaviour of doctors/staffs 31.5 24.5 26.7Shortage of medicine 17.8 27.0 24.2Poor quality of services 15.8 16.3 16.1Lack of doctors/equipments 19.2 12.6 14.6Long waiting time 11.6 14.1 13.3Long distance 1.4 3.4 2.8No clear Govt. policy 2.7 2.1 2.3
Total % 100.0 100.0 100.0N 146 326 472

7/30/2019 Pcdrc Nhea Final Report
http://slidepdf.com/reader/full/pcdrc-nhea-final-report 28/49
24
Chapter V
Public Opinion on Improvement of Health Services and Financing
This chapter is devoted to deal with public opinion on priority in health services andimprovement of the existing situation and fund raising of the government spending on healthservices. It also deals with the perception of people whether the government considers theirview in shaping health care system in Nepal.
5.1 Priority on Health Services
This section deals with the public opinion on priority on health services to be made. The
priority is examined on the basis of need for change in health system, priority of target group,preferred type of health services, priority area to improve health services, and the personswho should have rights for making choices of health services.
5.1.1 Need for Change in Health System
Table 5.1 shows that whether there is need for changes in current health system. Majority of the respondents reported that the current health system needs major changes (58.5%),whereas about one-third think that minor change is sufficient to improve current healthsystem for providing health services to all. The residents from both rural and urban areas areunanimous to this opinion.
Table 5.1: Needs for Changes in the Current Health System
Needs for Change Urban Rural Total
Working well, OK 8.4 7.0 7.4Needs minor changes 32.5 33.3 33.1Needs major changes 58.1 58.6 58.5Don't know/No opinion 1.0 1.1 1.1
Total % 100.0 100.0 100.0N 406 1,094 1,500
Notably, according to the finding, majority of the respondents reported that the overallquality of government health care services has been improved over the years and they aresatisfied on it. However, majority of them still opine that there is a need of major change ingovernment health care services. It is because improvement in and the satisfaction with healthcare services refer only to the past and the existing situation of health facilities is still notsufficient to provide services to the mass rural population.
5.1.2 Priority Target Group
The highest proportion of the respondents feels that target of health services should not be aparticular group of population, it should be to all, reported by 48.3 percent of respondents

7/30/2019 Pcdrc Nhea Final Report
http://slidepdf.com/reader/full/pcdrc-nhea-final-report 29/49
25
(Table 5.2). The second highest percentage think that poor people should be prioritized forthe target group because of incapacity to afford health services. Pregnant women should alsobe one of the target group for health services, reported by 12 percent of the respondents.Similar pattern is found in rural areas regarding pregnant women, whereas children shouldalso be one of the priority groups for health services, emphasized by the urban respondents.
Table 5.2: Priority of the Population to be Targeted for the Health Services
Priority Group Urban Rural Total
No group 48.5 48.3 48.3Poor 15.3 22.1 20.3Pregnant women 13.3 11.6 12.1Children 11.3 6.6 7.9Disabled 7.1 5.7 6.1Retired/elderly 2.2 4.3 3.7Unemployed 2.0 1.4 1.5No opinion 0.2 0.1 0.1
Total % 100.0 100.0 100.0N 406 1,094 1,500
5.1.3 Priority Area in Health Services
On the basis of information obtained from the field survey, public health services andprevention is the most important one among the various types of health services reported by63 percent (Table 5.3). It is quite natural that respondents opine that it would be better toprevent disease than getting people sick. Such opinion is even more common among urban
residents (71%). Little less then one-third of the respondents opine that all the health servicessuch as outpatient services, impatient care/ hospital admission, and public health services andprevention are equally important. Percentage of those who preferred all type of healthservices is relatively higher among rural respondents than urban counter-part.
Table 5.3: Preferred Type of Health Services
Priority Area in Health Services Urban Rural Total
Outpatient Services 0.5 2.5 1.9Inpatient Care/Hospital Admission 2.7 2.1 2.3Public Health Services and Prevention 70.9 60.2 63.1All Equally 25.9 35.2 32.7
Total % 100.0 100.0 100.0N 406 1,094 1,500
5.1.4 Priority to Improve Health Services
There are a number of options to improve health services. They are quality of services, accessof health services for poor, drug supply in hospitals, motivation and morale of staff andreduction of waiting time for getting health services. Information from Table 5.4 shows thatthere is not so clear picture on ranking of priority to improve any services of health.However, the highest percentage of respondents ranked improvement of the quality of services, access of health services is number one. On the basis of percentage, improvement indrug supply in hospitals, staff motivation and morale, and reduction of waiting time were not

7/30/2019 Pcdrc Nhea Final Report
http://slidepdf.com/reader/full/pcdrc-nhea-final-report 30/49
26
in the first rank as emphasized by the respondents. Residents from both rural and urban areasdo not seem to differ in their opinion regarding ranking of priority.
Table 5.4: Priority to Improve Health Services
Reforms for Health SystemPriority Ranking Total
1 2 3 4 5 6 N
Improve Quality of ServicesUrban 29.1 20.0 20.4 14.0 13.5 3.0 406Rural 23.6 20.5 18.9 20.7 12.2 4.0 1,094
Total 25.1 20.3 19.3 18.9 12.6 3.7 1,500
Improve Access of Health Services for PoorUrban 23.6 20.2 19.5 18.7 14.8 3.2 406Rural 31.4 21.8 18.1 16.6 9.7 2.5 1,094
Total 29.3 21.3 18.5 17.2 11.1 2.7 1,500
Improve Drug Supply in HospitalsUrban 14.3 19.5 18.2 19.5 20.2 8.4 406Rural 15.2 18.6 18.5 17.4 21.4 9.0 1,094
Total 14.9 18.8 18.4 17.9 21.1 8.9 1,500
Improve Staff Motivation and MoraleUrban 10.3 15.0 13.3 22.9 20.4 18.0 406Rural 10.6 10.6 12.7 20.9 21.1 24.0 1,094
Total 10.5 11.8 12.9 21.5 20.9 22.4 1,500
Reduce Waiting Time
Urban 18.5 16.0 13.5 14.3 17.2 20.4 406Rural 15.9 18.8 15.1 12.6 19.8 17.7 1,094
Total 16.6 18.1 14.7 13.1 19.1 18.5 1,500
5.1.5 Priority Figure to Make Choices of Health Program
Respondents were asked, who should have a say in making choices about which healthprogram should be given priority. This information would help to understand the appropriatepersons who should have say for making choices of health program that could beadvantageous for people. Table 5.5 shows that respondents preferred that doctors are the most
appropriate persons who should have most say in making choices of health program (73.5%).People also preferred health experts (65.8%) and general public (65.5%) should also havemore say on it but with slightly low weightage as compared to doctors. However, people aretotally against politicians to have say in making choices of health program. In both rural andrural areas, the preference of people is similar.

7/30/2019 Pcdrc Nhea Final Report
http://slidepdf.com/reader/full/pcdrc-nhea-final-report 31/49
27
Table 5.5: Priority of the Persons to Make Choices of Health Program
Who Have Most Say Most Say Some Say No Say Total
Politicians Have Most SayUrban 9.4 45.3 45.3 100.0Rural 8.5 39.8 51.7 100.0
Total 8.7 41.3 50.0 100.0Doctors Have Most Say
Urban 70.7 27.6 1.7 100.0Rural 74.6 24.1 1.3 100.0
Total 73.5 25.1 1.4 100.0
Health Experts Have Most SayUrban 64.3 33.5 2.2 100.0Rural 66.4 32.4 1.3 100.0
Total 65.8 32.7 1.5 100.0
General Public Have Most SayUrban 68.2 30.8 1.0 100.0Rural 64.5 34.5 1.0 100.0
Total 65.5 33.5 1.0 100.0
5.2 Financing on Health Services
This section discusses about the current level of government financing on health and publicopinion on raising revenue, fees and charges and target group for charging fees for healthservices.
5.2.1 Current Government Spending
Table 5.6 shows that present government has been spending adequate amount on healthservices reported by the highest percentage of respondents (47%). The next highest percentreported that the government spending is too little (31.8%). And, there are also 17.5 percentof respondents who observed the government spending on health services is too much.Proportion of those reporting government spending to be too little and too much is slightlyhigher in urban than in rural areas.
Table 5.6: Current Status of Government Spending on Health Services
Extent of Govt. Spending Urban Rural Total
Too Much 19.7 16.6 17.5Too Little 33.7 31.1 31.8The Right Amount 43.3 48.4 47.0Don't Know 3.2 3.9 3.7
Total % 100.0 100.0 100.0N 406 1,094 1,500
5.2.2 Public Opinion on Raising Additional Revenue for Health Services
Table 5.7 provides two types of information. First one is present percentage share of government taxes, health insurance, and out of pocket payments in health services and,

7/30/2019 Pcdrc Nhea Final Report
http://slidepdf.com/reader/full/pcdrc-nhea-final-report 32/49
28
second is the percentage share of those sector should be in the future. The respondents seemto be much aware on the share of government taxes and out of pocket payments to collectrevenue for the health services. Health insurance is non-existent in Nepal from thegovernment side. However, in some areas, community health insurance system has beenemerging under the community cooperative concept such as in Biratnagar.
According to the information, respondents clearly reported that 60.3 percent share of thegovernment spending on health services comes from government taxes. The remaining 38.6percent comes from out of pocket payments from the public. Almost same amount of share of government taxes and out of pocket payments has been reported by the respondents in bothurban are rural areas.
Based on the information, respondents expected to increase in share from the governmenttaxes by 7 percentage points and decrease in share to pay from out of pocket payments by 17percentage points for the health services. Respondents are also interested in health insurancescheme. They reported that the share of health insurance in health services should be 10
percent. Preference on health insurance is relatively predominant in urban areas than in ruralcounter parts.
Table 5.7: Percentage of Government Tax, Health Insurance, and Out of Pocket Payments
Government
taxes
Health
Insurance
Out of pocket
payments Total
UrbanCurrent Situation 59.8 1.5 38.7 100.0What should it be? 64.3 12.5 22.9 100.0
RuralCurrent Situation 60.5 1.0 38.6 100.0What should it be? 68.8 9.3 21.8 100.0
TotalCurrent Situation 60.3 1.1 38.6 100.0What should it be? 67.6 10.2 22.1 100.0
The previous table indicates a large share of financial source should be raised from thegovernment taxes, it would also be very important to understand the effective ways forimplementing it. Table 5.8 gives some idea on it. The respondents were asked to rank twooptions most preferred in case the government intended to raise additional revenue to spendmore on health services. Five options to raise additional revenue for health facilities were
listed in the questionnaire.
For the first option, most of the respondents preferred to increase taxes on tobacco andalcohol to collect additional revenue for health (73.8%). They also preferred to increase taxeson income and profits 21.5 percent. Other options bears negligible significance for collectingadditional revenue as preferred by the respondents other than the first option of imposingmore taxes. In both urban and rural areas, pattern of response is almost similar to havepreference for raising additional revenue for health.
As the second preference, highest percentage of respondents reported to increase taxes onincome and profits (45.7%) for raising additional revenue for spending on health. Increase
taxes on tobacco and alcohol and increase user fees in government health services are also

7/30/2019 Pcdrc Nhea Final Report
http://slidepdf.com/reader/full/pcdrc-nhea-final-report 33/49
29
important ones to raise additional revenue. There is no different pattern among respondentsfrom rural and urban areas. Only a few proportions are observed to be different.
It is also surprising that a significant proportion of the respondents (10.6%) did not want thegovernment to increase spending on health. In their view, the current spending is sufficient.
Table 5.8: Public Preference on Options to be Raised Additional Revenue for Health
Option for improvements Urban Rural Total
First Preference− Increase taxes on income/profits 23.4 20.8 21.5− Increase taxes on consumption of goods/services 1.5 1.1 1.2− Increase taxes on tobacco and alcohol 72.2 74.4 73.8− Increase user fees in government health services 1.7 1.7 1.7− Government should not increase spending on health 1.2 1.9 1.7
Total % 100.0 100.0 100.0
Second Preference− Increase taxes on income/profits 46.6 45.3 45.7− Increase taxes on consumption of goods/services 4.2 4.4 4.3− Increase taxes on tobacco and alcohol 20.7 17.9 18.7− Increase user fees in government health services 9.9 10.9 10.6− Government should not increase spending on health 16.0 15.6 15.7− Don’t know/ No option 2.7 5.9 5.0
Total % 100.0 100.0 100.0
N 406 1,094 1,500
5.2.3 Public Opinion on Charges/Fee in Health Services
Respondents were also asked for approval or disapproval to increase charges/fee formedicines, doctors, and inpatient treatment/hospital admission. Table 5.9, 5.10, and 5.11provides the responses on the approval of respondents on charges/fees.
Of the total respondents, 63.5 percent have shown approval if the government was tointroduce/ increase charges/ fees for the medicines. The remaining 36.5 percent did not giveapproval. The proportion of respondents who gave approval for charges/fees is quite higher inrural areas (65.5%) compared to its urban counter parts (58.1%). In other words, proportionof those who showed disapproval to have charges/fees for medicines is quite higher in urban
areas (41.9%) compared to its rural counter parts (34.5%).
Table 5.9: Public Approval for Charges/fee for Medicines
Approve/Disapprove Urban Rural Total
Approve 58.1 65.5 63.5Disapprove 41.9 34.5 36.5
Total % 100.0 100.0 100.0N 406 1,094 1,500
In case for visiting doctor, more than two-third of the respondents have shown approval tohave increased charges/fees (Table 5.10) and the remaining 32.5 percent did not give anyapproval. The proportion of those who showed approval is relatively higher among ruralresidents than among urban residents.

7/30/2019 Pcdrc Nhea Final Report
http://slidepdf.com/reader/full/pcdrc-nhea-final-report 34/49
30
Table 5.10: Public Approval for Charges/fee for Visiting a Doctor
Approve/Disapprove Urban Rural Total
Approve 64.0 68.8 67.5Disapprove 36.0 31.2 32.5
Total % 100.0 100.0 100.0N 406 1,094 1,500
Similarly, respondents also gave their approval to increase charges/fee for inpatienttreatment/ hospital admission. Almost two-third of the respondents gave approval (66.7%)and the remaining one-third are against the increment of charges/fees for inpatient treatment/ hospital admission (Table 5.11). The proportion of those who gave approval on it is relativelyhigher among rural residents and those who did not give approval is relatively higher amongurban residents.
Table 5.11: Public Approval for Charges/fee for Inpatient Treatment/ Hospital Admission
Approve/Disapprove Urban Rural Total
Approve 64.5 67.6 66.7Disapprove 35.5 32.4 33.3
Total % 100.0 100.0 100.0N 406 1,094 1,500
5.2.4 Public Opinion on Who Has to Pay for Health Services
Previous section dealt with approval of introducing/increasing charges/fees for healthservices. This section discusses about public opinion on who should be the most contributors
for paying charges/fees for health services. Table 5.12 indicates that people with higherincome should pay more. A considerable majority of the respondents agreed to this (73.3%).The proportion of those agreeing on it is similar for both rural and urban areas.
Table 5.12: Public Opinion for Those With Higher Income Should Pay More
Opinion Urban Rural Total
Agree 73.2 73.4 73.3Disagree 26.8 26.4 26.5Don't Know 0.0 0.2 0.1
Total % 100.0 100.0 100.0N 406 1,094 1,500
According to Table 5.13, it is found that three-fourth of the total respondents agreed with thefact that people with higher income should contribute greater share of their income (75%).Proportion of this is almost similar among both urban and rural residents.
Table 5.13: Public Opinion for Those With Higher Income Should Pay Greater Share
Opinion Urban Rural Total
Agree 74.9 75.0 75.0Disagree 24.4 24.8 24.7Don't Know 0.7 0.2 0.3
Total % 100.0 100.0 100.0N 406 1,094 1,500

7/30/2019 Pcdrc Nhea Final Report
http://slidepdf.com/reader/full/pcdrc-nhea-final-report 35/49
31
Surprisingly, public opinion on those who use health care more should pay more is found tobe different. Almost two-third of the respondents disagreed in the case for those who usehealth care more should pay more (67.1%) (Table 5.14). This proportion is slightly higheramong urban residents compared to its rural counter parts. It may be due to fact thatvulnerability and the incidence of being sick and ill is no doubt high among poor people but
they are not able to afford much to the health services.
Table 5.14: Public Opinion for Those Who Use Health Care More Should Pay More
Opinion Urban Rural Total
Agree 29.6 32.9 32.0Disagree 69.0 66.4 67.1Don't Know 1.5 0.7 0.9
Total % 100.0 100.0 100.0N 406 1,094 1,500
Finally, on condition regarding priority to expensive treatment, overwhelming majority of the respondents (81.4%) (Table 5.15) disagreed . Urban residents are even more among thosewho agreed that the government should give low priority on expensive treatment (82.3%).
Table 5.15: Public Opinion for Govt. Should Give Low Priority to Expensive Treatment
Opinion Urban Rural Total
Agree 82.3 81.1 81.4Disagree 17.2 18.2 17.9Don't Know 0.5 0.7 0.7
Total % 100.0 100.0 100.0N 406 1,094 1,500
5.3 People’s Say in Government Policy
At the end, a crucial question was asked to the respondents to obtain public opinion ongovernment consideration on people’s voices and views in facilitating the health care servicesin Nepal. A considerable majority of the respondents reported that the government hardlyconsiders the public views for shaping the health care services (65.6%) (Table 5.16). A verysmall proportion of respondents were optimistic regarding government considerations to thepublic views.(4.7%). However a large proportion of the respondents reported that thegovernment never considers public opinion in the formulation of the policy of health services.
Table 5.16: People’s Perception on Whether Government Consider Public Opinion
Extent of Consideration Urban Rural Total
To a large extent 4.4 4.8 4.7To a small extent 65.8 65.5 65.6Never 29.8 29.6 29.7
Total % 100.0 100.0 100.0N 406 1,094 1,500

7/30/2019 Pcdrc Nhea Final Report
http://slidepdf.com/reader/full/pcdrc-nhea-final-report 36/49
32
Chapter VI
Summary and Conclusion
This study is public opinion poll to understand the views of people on health care issues ingeneral and the fairness in financing and delivery of health care. The study covered 30districts from which 50 general public were interviewed. This is basically a householdsurvey. Ten households were selected from the ward around the area where health institutionwere located. Respondent, who are aged 18 years and above, were interviewed from onehousehold. The health institutions visited are central hospital, regional and zonal hospitals,district hospitals, Primary Health Centre (PHC), health post (HP) and sub-health post (SHP).From one district, 1 district hospital, 1 PHC, 1 HP, and 2 SHPs were visited. In addition, onecentral (Bir Hospital, Kathmandu) and one regional hospital (Pokhara, Kaski) were alsovisited.
6.1 Summary of the Findings
6.1.1 Background Characteristics
• Survey interviewed 72.9 percent respondents from rural and 27.1 percent from urbanareas. Regarding ecological zone, majority of the samples are from hill areas (53.3%).
• Overwhelming majority of the respondents are Hindu that is 88 percent. The remainingare Buddhist (5.9%), Islam (3.2%), and Christian (0.3%).
• The sex ratio indicates 181 males per 100 females. The highest percentage of respondents are aged 30-44 years, which is followed by those aged 18-29 years. The agepattern is similar among both males and females.
• The average family size is 6.5. Overwhelming majority of the respondents are married(80.3%) and 55 respondents are also divorced and/or widowed.
• Of the total, only 71.5 percent have attended school and acquired some grades. Of which, 26.8 percent have passed secondary level, 23.7 percent passed primary and 19.9percent passed university education.
• The highest percentage of respondents are unemployed (43.5%), which is followed bythose involved in self-employment such as own agriculture and related activities
(23.4%).
• Of the total households, 8.5 percent are poorest, 10.9 percent are poor, 24.5 percent rich,and 39.3 percent richest.
6.1.2 Current Situation of Health
• Trend during the last five years shows that people generally go to the governmenthospital when they get sick (75.5%). This tendency is relatively higher among ruralresidents (78%) than among urban residents (70%).
• The highest percentage of respondents (40.3%) observed that the income gap between
rich and poor has been increasing during the last five years.

7/30/2019 Pcdrc Nhea Final Report
http://slidepdf.com/reader/full/pcdrc-nhea-final-report 37/49
33
• Majority of the respondents observed that the government spending on health serviceshas increased during the last five years (64.2%). Accordingly, the overall quality of government health services has increased.
• Both rich and the poor have the best access in government health services (33% each).The poor people make most use of the government services (39.3%). However, richpeople contribute most to the finance of government health services (51.8%) and at thesame time they receive most of the government subsidies to health services (42.9%).Consequently, they have better health situation, compared to the poor people.
• The government health system is getting better day by day. The government health careis easy to obtain in general (69%). Getting health care is easy for both rich and the poorpeople in both rural and urban areas. Consequently, most people are found to be satisfiedwith government health services (65.9%). However, also a large proportion of respondents are not satisfied with health services (31.5%). This is because of misbehaviour of doctors and health staffs (26.7%) and shortage of medicine (24.2%).
6.1.3 Public Poll on Improvement of Health Services and Financing on Health
• Majority of the respondents reported that the current health system needs major changes(58.5%) and residents from both rural and urban areas are unanimous to this opinion.Public health services and prevention is the most important area to be prioritized by thegovernment, reported by 63 percent and all people should be targeted.
• In the health system, quality of services and access of health services for poor are alsoprioritized for improvement by the respondents. Doctors (73.5%), other health experts(65.8%) and general public (65.5%) should also have most say in making choices of health program.
• The government has been spending adequate amount on health services (47%).According to respondents, 60.3 percent share of the government spending on healthservices comes from government taxes, which has to be increased by 7 percentagepoints. The remaining 38.6 percent comes from out of pocket payments from the publicand it has to be decreased by 17 points. Respondents are also interested in healthinsurance scheme. They reported that the share of health insurance in health servicesshould be 10 percent.
• Most respondents preferred to increase taxes on tobacco and alcohol for additionalrevenue on health (73.8%). They also preferred to increase taxes on income and profits
for it (21.5%).• Of the total respondents, 63.5 percent have agreed to introduce/ increase charges/ fees
for the medicines and more than two-third of the respondents approved to increasecharges/fees for visiting doctor and inpatient treatment/ hospital admission.
• Respondents agreed to the condition for those with higher income should pay more forhealth services (73.3%), those with higher income should pay greater share of theirincome (75%) and government should give low priority to expensive treatment (81.4%).However, they did not agree on those who use healthcare more should pay more(67.1%).
• A considerable majority of the respondents reported that the government considers the
public views to a small extent in the policy formulation (65.6%).

7/30/2019 Pcdrc Nhea Final Report
http://slidepdf.com/reader/full/pcdrc-nhea-final-report 38/49
34
6.2 Conclusion
Nepal is one of the poorest countries, where more than 86 percent population live in ruralarea with traditional subsistence agriculture. Country’s current income per capita is $278 andinequality in income and other resources is pervasive in Nepal. Bottom 80 percent of thepopulation earns 47 percent of total income while the richest 20 percent earns 53 percent of total income. This situation implies also in the healthcare system of the country.
Modern healthcare practice is quite new. Nepal has adopted primary healthcare systemapproach through National Health Policy 1991 by aiming to extend the primary health caresystem to the rural population so that they benefit from modern medical facilities and trainedhealth care providers by preventive, promotive, and curative health services. MOH hasdeveloped a 20 year long - Second Long Term Health Plan (1997-2017) to address disparitiesin healthcare, assuring gender sensitivity and equitable community access to qualityhealthcare services. Ninth and Tenth National Plans are also in the similar line to provide
effective and efficient healthcare system specially focusing to the rural poor withparticipation at all levels and private sector services.
The survey result also shows that income inequality among the respondents is prevalent asfound by NLSS II (2003/04). People generally tend to go to government hospital when theyget sick. This tendency is relatively higher among rural residents than among urban residents.However, people preferring private sector healthcare is slightly more in urban areas.
Even though the gap between poor and rich has increased during the last five years, thegovernment spending on health services has also increased, by which government healthsystem is getting better and also the overall quality of government health services. The
government health care is also easy to obtain for both rich and poor people in both rural andurban areas. In other words, both rich and the poor have the best access in government healthservices. So people are satisfied with government health services. However, the prevalence of misbehaviour of doctors and other health staffs and shortage of medicine is still observed ingovernment healthcare services. This result indicates inequality in access to governmenthealthcare services has been decreasing in the last five years. However, it is contradictory tothe findings of NLSS II. It may be due to fact that the NLSS II examined accessibility interms of time to reach, whereas this study examined the accessibility in terms of use and therespondents taken for this study were from around the location of health facilities.
Rich people contribute most to the finance of government health services and at the same
time they receive most of the government subsidies to health services. So, they haverelatively better health situation, compared to the poor. In contrast the poor people make mostuse of the government services. it is because the poor consume generally less nutritional food,live in unhealthy sanitation and get sick more frequently. On the other hand, they can notafford for private sector healthcare services. Therefore, the government health services arehighly demanding for the poor.
Even though the improvement in government healthcare services is observed, the respondentsunanimously opine that the current health system needs major changes in both rural andurban areas. Public health services and prevention is the most important area to be prioritizedby the government and the priority should be given to improve the quality of services and
access to health services for poor. They prefer Doctors, health experts and general public tohave most say in making choices of health program.

7/30/2019 Pcdrc Nhea Final Report
http://slidepdf.com/reader/full/pcdrc-nhea-final-report 39/49
35
The government has been spending adequate amount on health services. However, therespondents opine that current 60.3 percent share of government spending on healthcareservices should be increased by 7 percentage points and current 38.6 percent share of out of pocket payments from the public should be decreased by 17 points. Respondents are also
interested in health insurance scheme that they preferred to have 10 percent share inhealthcare services. In order to increase the government spending on health, increased tax ontobacco and alcohol and income and profits would be the most appropriate.
Respondents agreed to introduce/ increase charges/ fees for the medicines and they alsoapproved to increase charges/fees for visiting doctor and inpatient treatment/ hospitaladmission. They opine that people who have higher income should pay more for healthservices, those with higher income should pay greater share of their income and thegovernment should give low priority to expensive treatment. However, they did not agree onthose who use health care more should pay more. And, they have a perception that thegovernment considers the public views to a small extent in the policy formulation.
This study is based on field survey and the entire country is in the grip of current violentpolitical conflict. Due to this situation, most of the field sites selected were relatively safe thatare closer either to district headquarter or to urban areas. In this situation, representation of rural areas in terms of response may be quite bias towards urban perception. Another thing isthat the survey was based on the questionnaire with very limited numbers. Analysis based onsuch limited questions does not provide depth of the issues. Such limited information wouldprovide only the status of the issues.

7/30/2019 Pcdrc Nhea Final Report
http://slidepdf.com/reader/full/pcdrc-nhea-final-report 40/49
36
References Cited
Center for Education and Technical Studies,1993, Private Sector Health Expenditure in
Nepal (Kathmandu: Centre for Education and Technical Studies).
Central Bureau of Statistics, 2004
a
, National Accounts of Nepal 2003/04 (Kathmandu:Central Bureau of Statistics, HMG/Nepal).
______, 2004b, Nepal Living Standard Survey Report 2003/04, Volume One (Kathmandu:Central Bureau of Statistics, HMG/Nepal).
______, 2004c, Nepal Living Standard Survey Report 2003/04, Volume Two (Kathmandu:Central Bureau of Statistics, HMG/Nepal).
______, 2003, Population Monograph of Nepal, Vol. II (Kathmandu: CBS, HMG/N).
______, 2002, Population Census 2001: National Report (Kathmandu: Central Bureau of Statistics, HMG/Nepal).
______, 1997, Nepal Living Standard Survey Report, Part II (Kathmandu: Central Bureau of Statistics, HMG/Nepal).
______, 1987, Population Monograph of Nepal (Kathmandu: Central Bureau of Statistics,HMG/Nepal).
DI, NHEA, and IPS, 2000, Equity in Financing and Delivery of Health Services in
Bangladesh, Nepal and Sri Lanka: Results of the Tri- Country Study, DataInternational Ltd., Nepal Health Economics Association and Institute of PolicyStudies.
Hotchkiss, D.R., J.J. Rous, K. Karmacharya, and P. Sangraula, 1998, “Household Health
Expenditure in Nepal: Implications to Health Care Financing Reform” , Health Policyand Planning, 13(4): 371-383.
Klement, Julie and Barry Silverman, 2003, Primary Health Care Services in Nepal: Program
Options in Response to Conflict , Report Submitted to The United States Agency forInternational Development (Washington DC: USAID).
Manandhar, Tirtha B. and Krishna P Shrestha, 2003, “Population Growth and EducationalDevelopment”, Population Monograph of Nepal, Vol. I, Chapter 6 (Kathmandu:Central Bureau of Statistics, HMG/Nepal), pp.213-271.
MOH, 2005 , Fact Sheet (Kathmandu: Ministry of Health).
______, 2002, Nepal Demographic and Health Survey 2001 (Kathmandu: Ministry of Health,HMG).
______, 1998, Second Long Term Health Plan (1997-2017) (Kathmandu: Ministry of Health,HMG/ Nepal).
______, 1997, Nepal Family Health Survey 1996 (Kathmandu: Family Health Division,Department of Health Services, Ministry of Health).
______, 1993, Nepal Fertility, Family Planning and Health Survey 1991 (Kathmandu: NewEra, IIDS and VaRG).
______, 1991, National Health Policy (Kathmandu: Ministry of Health, HMG/Nepal).
MOPE, 2003, Nepal Population Report 2003 (Kathmandu: Ministry of Population andEnvironment, HMG/Nepal).

7/30/2019 Pcdrc Nhea Final Report
http://slidepdf.com/reader/full/pcdrc-nhea-final-report 41/49
37
NHEA, 2004, Public Health Facility Efficiency Survey Report (Kathmandu: Nepal HealthEconomics Association).
NPC, 2003, The Tenth Plan: Poverty Reduction Strategy Paper, 2002-2007 (Kathmandu:National Planning Commission, HMG).
______, 1998, The Ninth Five Year Plan 1997-2002 (Kathmandu: National PlanningCommission, HMG/Nepal).
Panta, Haridhoj, 2001, “Country Report: Nepal”, in M. Ghaffar Chaudhari (ed.), Report of the
APO Study Meeting on Agrarian Reforms and Agriculture Productivity (Tokyo: AsianProductivity Organization).
Sharma, Pitamber, 2003, “Urbanization and Development”, Population Monograph of Nepal, Vol. I, Chapter 10 (Kathmandu: Central Bureau of Statistics, HMG/Nepal), pp.375-412.
Shrestha B.R and Shreebasta Sherstha, 1995, Analysis of Health Economics In Nepal (Kathmandu: Policy, Planning Foreign Aid and Monitoring Division, Ministry of Health, HMG/Nepal).
UNDP, 2004a, Human Development Report 2004: Cultural Liberty in Todays’ Diverse World
(New Delhi: Oxford University Press).
UNDP, 2004b, Nepal Human Development Report 2004: Empowerment and Poverty
Reduction (Kathmandu: United Nations Development Programme).
UNFPA, 2004, State of the World Population (New York: United Nations Population Fund).
UNS, 1999, Nepal: Common Country Assessment (Kathmandu: United Nations System).

7/30/2019 Pcdrc Nhea Final Report
http://slidepdf.com/reader/full/pcdrc-nhea-final-report 42/49
38
Annex I: QuestionnairePeople-Centered Development and Research Centre (PCDRC) KATHMANDU
Nepal Health Economics Association (NHEA)
PUBLIC OPINION POLL ON HEALTH CARE & HEALTH INEQUALITIES
[October-November, 2004] Namaste! My name is ... ... ... ... ... ... ... ... ... ... ... I am here with you for that PCDRC in collaborationwith NHEA is conducting a Public Opinion Survey on “Health Services and Health Inequalities inNepal”. For the same reason, we are in here amongst you. I would like to ask some questions to knowyour opinions on this matter. I also want to assure you that your opinion would be very much helpfulfor future strategy on health services in Nepal. Your opinion and information you provide us will beconfidential. It may take half - an hour to complete. I would like to request you to give us yourprecious time.
GENERAL BACKGROUND
1. Ecological Zone ... ... ... ... ... ... ... ... ... ... ... ... ... ... ... ... ... ... ... ... ... ... ... ... ... ...Mountain ... ... ... 1
Hill ... ... ... 2Tarai ... ... ... 3
2. District : ... ... ... ... ... ... ... ... ... ... ... ... ... ... ... ... ... ... ... ... ... ... ... ... … … … …
3. V.D.C./Municipality
V.D.C. ... ... ...1
Municipality ... ... ... 2Sub-Metropolitan City ... ... ... 3
Metropolitan City. ... ... ... 4
4. Ward No.: ... ... ... ... ... ... ... ... ... ... ... ... ... ... ... ... ... ... ... ... ... ... ... ... .
5. Tole/Street Name………………………………………………………………………………..
6. In which type of Health Center, the Interview conducted?
Central Hospital ... ... ... 1Zonal Hospital ... ... ... 2
District Hospital ... ... ... 3
Public Health Center (P.H.C.) ... ... ... 4Health Post ... ... ... 5
Sub-Health Post ... ... ... 67. Name of the Health Center. ... ... ... ... ... ... ... ... ... ... ... ... ... ... ... ... ... ..
8. Head of the Health Center ... .... .... ... ... ... ... ... ... ... ... ... ... ... ...
Position: ... ... ... ... ... ... ... ... ... ... ... ... ... ... ...
Date of Interview: … … … … … … … … … … … … … … … … … … … … … … … … … …
Name of Interviewer: … … … … … … … … … … … … Signature: … … … … … … … … … …
Editor: … … … … … … … … … … … … … … … … … Signature: … … … … … … … … … …

7/30/2019 Pcdrc Nhea Final Report
http://slidepdf.com/reader/full/pcdrc-nhea-final-report 43/49
39
A. GENERAL BACKGROUND
1. Name . ... ... ... ... (Mention code of Cast/ethnicity)
2. Gender
Male ... ... ...1Female ... ... ...2
3. ReligionHindu ... ... ...1
Boudha ... ... ...2Kirant ... ... ...3
Muslim ... ... ...4Christian/Catholic ... ... ...5
Jain ... ... ...6Others ... ... ...8
4. How old are You? (The respondent must be 18 years and above)
..... ... ... ...
5. What is the highest of educational qualification you have obtained?No Schooling ... ... ...1
Primary .. ... ...2Secondary... ... ...3
Higher Secondary... ... ...4Graduate ... ... ...5
Post-Graduate ... ... ...66. Which best describes your occupational status (current activity)?
Student... ... ...1Agriculture.. ... ...2
Unemployed... ... ...3Retired... ... ...4
Self-employed.. ... ...5Unskilled Worker.. ... ...6
Skilled Worker.. ... ...7Professional.. ... ...8
Other.. ... ...97. What best describes your marital status?
Single ... ... ...1Married ... ... ...2
Divorced/Separated) ... ... ...3
Widow/Widower ... ... ...48. How many members (currently residing together) do you have in your family?
Female …………..Male ... ... ... ...
Total ... ... ... ...
9. What is your household income per year? [Need to know the source and calculate on roughly,then mention the total income]
Total Rs. …………………………..

7/30/2019 Pcdrc Nhea Final Report
http://slidepdf.com/reader/full/pcdrc-nhea-final-report 44/49
40
B. TREND IN THE PAST FIVE YEARS
10. When you or your families are sick, which of the following do you generally go to?Government Hospital/clinics ... ... ...1
Private doctors/clinics ... ... ...2
Private Hospital ... ... ...3Pharmacies/shops ... ... ...4Others ... ... ...5
(First of all, be familiar with the social and economic condition of the locality, then interview)
11. In the past five years, has the difference in income between rich and poor increased, decreased ornot changed?
Increased ... ... ...1Not Changed ... ... ...2
Decreased ... ... ...3Don't Know ... ... ...8
12. In the past five years, has the government spending on health increased, decreased or notchanged?
Increased... ... ...1Not Changed... ... ...2
Decreased ... ... ...3Don't Know ... ... ...8
13. In the past five years, has the quality of government health services increased, decreased or notchanged?
Increased... ... ...1Not Changed... ... ...2
Quality Decreased ... ... ...3Don't Know ... ... ...8
14. In the past five years has the quality of non-government health services increased, decreased ornot changed?
Increased... ... ...1Not Changed... ... ...2
Quality Decreased ... ... ...3Don't Know ... ... ...8
C. INEQUALITY IN HEALTH SERVICES
15. The following questions are all about government health services. In your opinion, amongrich, middle income, poor, or all the same, which group has more access to health services?
Questions Better off Middle income The poor All same
a. Has the best access to governmenthealth services?
1 2 3 4
b. Makes most use of governmentservices?
1 2 3 4
c. Contributes most to the finance of government health services?
1 2 3 4
d. Receives most of the government
subsidies to health services?1 2 3 4
e. On average, is in better health? 1 2 3 4

7/30/2019 Pcdrc Nhea Final Report
http://slidepdf.com/reader/full/pcdrc-nhea-final-report 45/49
41
D. HEALTH SERVICES AND FINANCING
16. In your opinion, should the government concentrate on providing preventive or curative services?[Go To 18] Preventive Services (Public Health and Prevention) ... ... ...1
Curative Services ... ... ...2
Both ... ... ...317. If it is curative, should the government prioritize on inpatient care or outpatient services or
both?Inpatient Care/ Hospital Admission ... ... ...1
Outpatient Services ... ... ...2Both … … 3
18. How easy/difficult has it been for you to obtain health care from government services?Very Easy ... ... ...1
Easy ... ... ...2Difficult ... ... ...3
Quite Difficult ... ... ...4Don’t Know ... ... ...8
19. In your opinion, how easy or difficult is it for the poor to obtain health care from governmentservices?
Very Easy ... ... ...1Easy ... ... ...2
Difficult ... ... ...3Quite Difficult ... ... ...4
Don’t Know ... ... ...820. In your opinion, how easy or difficult is it for the rich to obtain health care from government
services?Very Easy ... ... ...1
Easy ... ... ...2
Difficult ... ... ...3Quite Difficult ... ... ...4Don’t Know ... ... ...8
21. If the Government was to introduce/increase [introduce in SL/increase in others] charges/fees forthe following types of medical service at government hospitals in order to improve quality andavailability, would you approve or disapprove [Responses: Approve, Disapprove]?
Approve DisapproveMedicine … … 1 2
For in-patient treatment (x-Ray, Lab, etc.) … … 1 2Hospital admission … … 1 2
22. Over the last year, has it been necessary to do to raise money to pay for health care for members
of your family? (If no, Go to the Q24)Yes ... ... ...1No ... ... ...2
23. If yes, how did you raise money to pay for health care?Borrowed money... ... ...1
Sold household items/farm animals/valuables ... ... ...2Used savings ... ... ...3
Decreased consumption of goods/services ... ... ...4Worked longer hours... ... ...5
Other ... ... ...624. Overall, how satisfied are you with the Government health services?
Very satisfied ... ... ...1
Satisfied ... ... ...2Not Satisfied ... ... ...3

7/30/2019 Pcdrc Nhea Final Report
http://slidepdf.com/reader/full/pcdrc-nhea-final-report 46/49

7/30/2019 Pcdrc Nhea Final Report
http://slidepdf.com/reader/full/pcdrc-nhea-final-report 47/49
43
31. According to you, how is the health system running?Better ... ... ...1
Need to little improve ... ... ...2Need to lot of improve ... ... ...3
Don’t Know ... ... ...8
32. What is the main priority area to improve the health service system? Please rank the followingwith priority on health system reforms.
Priority Area Rank 1, 2, 3........ etc.
1. Reduce payments in government facilities
2. Improving overall quality of services
3. Improve access of health care for the poor
4. Improving drug supply in government hospitals5. Improve staff motivation and morale
6. Reduce waiting time7. Other
33. In your view, who should have a say in making choices about which health program should begiven priority?
Who Most say Some say No say Don't know
Politicians 1 2 3 8
Doctors 1 2 3 8Health experts 1 2 3 8
ServiceConsumers
1 2 3 8
General public 1 2 3 8
34. The health care system in your area has been undergoing changes over the past few years. Somefeel that the system is getting better, whereas others feel it getting worse. According to you, is thesystem getting better or worst?
Better... ... ...1Worse... ... ...2
Not Changed... ... ...3Don’t Know... ... ...8
35. Does Government consider your views in shaping the health care services?To a large extent ... ... ...1To a small extent ... ... ...2
Never ... ... ...3
THANKS FOR YOUR TIME & CO-OPERATION!!!

7/30/2019 Pcdrc Nhea Final Report
http://slidepdf.com/reader/full/pcdrc-nhea-final-report 48/49
44
Annex IIa: Technical Advisory Committee
1. Dr. Pushpa Lal Joshi, Nepal Health Economics Association2. Mr. Chiranjibi Bahadur Thapa, Nepal Health Economics Association.3. Mr. Devi Prasai, Nepal Health Economics Association.
4. Ms. Rosan Bhattarai, President, PCDRC.5. Mr. Yogendra Bahadur Gurung, Lecturer, Central Department of Population Studies,
Tribhuvan University.
Annex IIb: Study Team
1. Mr. Yogendra Gurung, Principal Investigator2. Ms. Roshan Bhattarai, Team Member
3. Ar.Mr. Debesh Raj Bhattarai, Team Member4. Mr. Ramesh Mishra, Team Member5. Mr. Narendra Gurung, Team Member

7/30/2019 Pcdrc Nhea Final Report
http://slidepdf.com/reader/full/pcdrc-nhea-final-report 49/49