pccp dynamic article links citethis: doi: 10.1039...
TRANSCRIPT
This journal is c the Owner Societies 2011 Phys. Chem. Chem. Phys.
Cite this: DOI: 10.1039/c0cp01516d
Pre-nucleation dynamics of organic molecule self-assembly investigated
by PEEM
Alexander J. Fleming,* Stephen Berkebile, Thomas Ules and Michael G. Ramsey
Received 17th August 2010, Accepted 13th December 2010
DOI: 10.1039/c0cp01516d
Pre-nucleation dynamics, nucleation and templated self-assembly of a conjugated planar aromatic
molecule are investigated by photoemission electron microscopy (PEEM). The high resolution of
individual molecular layers in PEEM, in combination with a numerical simulation, reveals the
dynamic behaviour of molecules during the pre-nucleation deposition period and their
temperature dependence. The in situ deposition of p-sexiphenyl (6P) molecules on Cu(110) and
Cu(110) 2 � 1–O surfaces in ultrahigh vacuum, when monitored by PEEM in real-time allows (a)
layer densities, (b) meta-stable layer filling by 6P molecules, (c) dynamic surface redistributions
during layer filling and (d) critical density spontaneous dewetting to be accurately measured.
The comparison of 6P deposited on Cu(110) to Cu(110) 2 � 1–O enables temperature dependent
6P nucleation processes on Cu(110) to be elucidated from PEEM. The interplay between
energetically stable molecular arrangements and kinetically stabilised arrangements is shown to
dominate the pre- and post-nucleation processes. In combination with additional data obtained
during post-nucleation deposition times, such as surface diffusion anisotropies and nucleation
energies, it is concluded that the pre-requisite for 6P nucleation, in a lying down orientation, is
the formation of a double tilted layer with at least one layer being meta-stable.
1. Introduction
Numerous studies conducted on 6P to date, such as electronic
band formation1,2 and doping,3,4 have demonstrated that this
molecule is exceptionally well suited to be a text book example
of organic molecule phenomenology in the condensed phase.
Our focus recently has been to comprehensively explain
growth phenomena of 6P.5 Having accrued many years of
experience in preparing high quality single crystals of 6P on
surfaces for various electron spectroscopy6,7 and surface probe
techniques,8,9 we have with our detailed in situ growth study
by PEEM, systematically examined the three growth
processes: pre-nucleation, nucleation and 3D growth. Our
novel contribution, to the study of technologically relevant
organic molecule crystal growth for the electronics industry, is
the inclusion of pre-nucleation dynamics in our description of
growth.5
Growing organic electro-active molecular crystals on metal
or metal oxide surfaces is a key process in the construction of
organic electronic devices.10,11 This decides the morphology
and orientation of molecular crystals grown, and can either
enhance or detrimentally affect device characteristics. In
order to study the connection between morphology and
performance, a first step is to grow uniformly oriented and
ordered crystals. To achieve this, molecular crystals are grown
on single crystal surfaces in an ultra-high vacuum (UHV)
chamber. The process of molecular crystal growth can be
observed by various techniques after nucleation has begun,
however in this paper we will highlight the crucial events that
occur prior to nucleation and their importance in determining
final crystal morphologies. PEEM has been used previously to
measure the post-nucleation growth of pentacene12 on SiO2,
chloroaluminium phthalocyanine on MoS2 film,13 anthracence
on Si(111),14 PTCDA on Ag(111),15 to study the dynamic CO
oxidation on platinum16 and other dynamic processes.17 In
our case PEEM is used to examine the pre-nucleation
dynamics of 6P molecules. It will be shown that the
pre-nucleation dynamics does determine the growth and
quality of 6P nano-crystals. In fact, our results indicate that
in order to grow well ordered, unique orientation molecular
crystals,18 as required for organic electronics, a complete
control over the pre-nucleation deposition period will be
necessary. In this respect our current aim is to control and
manipulate this pre-nucleation deposition period.
In this paper, technologically relevant 6P (also known as
hexaphenyl and p6P) molecules are deposited on Cu(110)
2� 1–O and Cu(110) surfaces. The different 6P nanostructures
that form when 6P is deposited on Cu(110) and Cu(110)
2 � 1–O are shown in Fig. 1(a) and (b), respectively. The
deposition characteristics of 6P on these two substrates will be
Surface and Interface Physics, Karl-Franzens Universitat Graz,Universitatsplatz 5, 8010 Graz, Austria.E-mail: [email protected]
PCCP Dynamic Article Links
www.rsc.org/pccp PAPER
Dow
nloa
ded
by U
nive
rsita
tsbi
blio
thek
Gra
z on
07
Febr
uary
201
1Pu
blis
hed
on 2
7 Ja
nuar
y 20
11 o
n ht
tp://
pubs
.rsc
.org
| do
i:10.
1039
/C0C
P015
16D
View Online
Phys. Chem. Chem. Phys. This journal is c the Owner Societies 2011
compared and contrasted with the aim of elucidating the
dominant controlling mechanisms of nucleation and growth
of 6P thin films. Like many weakly bound organic crystals of
short chain-like molecules, 6P readily nucleates into an
energetically stable herring-bone crystalline structure. When
6P nucleates on a surface, a combination of kinetics and
energetics determines which plane of the molecular herring-
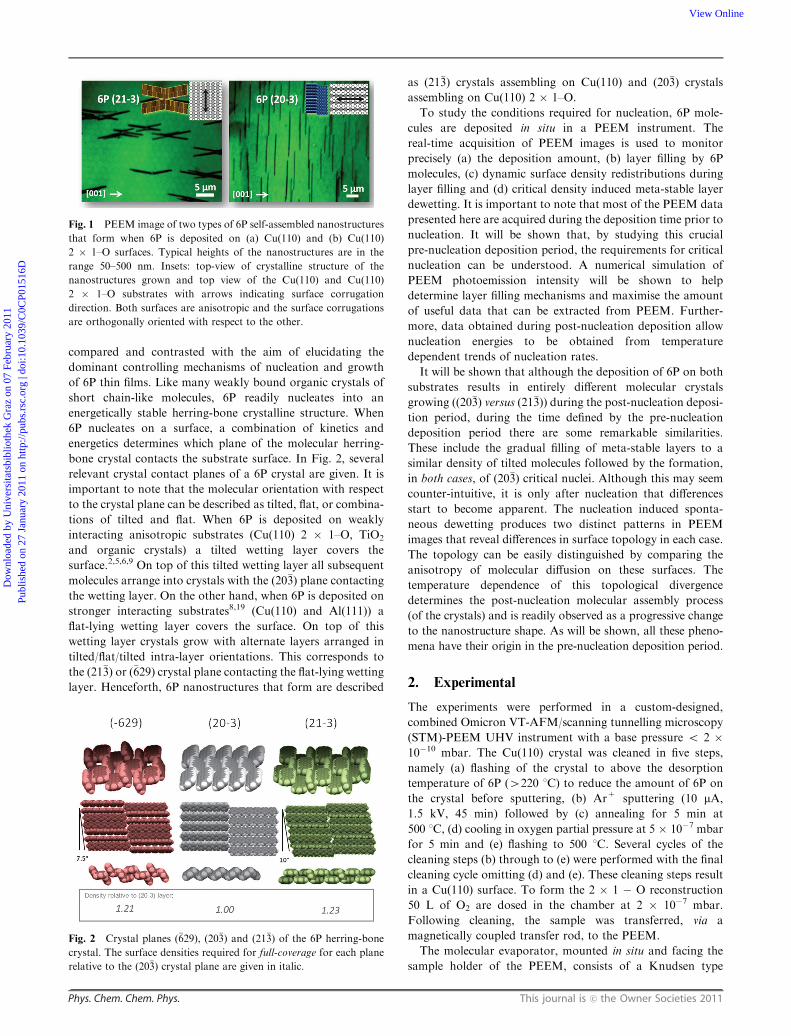
bone crystal contacts the substrate surface. In Fig. 2, several
relevant crystal contact planes of a 6P crystal are given. It is
important to note that the molecular orientation with respect
to the crystal plane can be described as tilted, flat, or combina-
tions of tilted and flat. When 6P is deposited on weakly
interacting anisotropic substrates (Cu(110) 2 � 1–O, TiO2
and organic crystals) a tilted wetting layer covers the
surface.2,5,6,9 On top of this tilted wetting layer all subsequent
molecules arrange into crystals with the (20�3) plane contacting
the wetting layer. On the other hand, when 6P is deposited on
stronger interacting substrates8,19 (Cu(110) and Al(111)) a
flat-lying wetting layer covers the surface. On top of this
wetting layer crystals grow with alternate layers arranged in
tilted/flat/tilted intra-layer orientations. This corresponds to
the (21�3) or (�629) crystal plane contacting the flat-lying wetting
layer. Henceforth, 6P nanostructures that form are described
as (21�3) crystals assembling on Cu(110) and (20�3) crystals
assembling on Cu(110) 2 � 1–O.
To study the conditions required for nucleation, 6P mole-
cules are deposited in situ in a PEEM instrument. The
real-time acquisition of PEEM images is used to monitor
precisely (a) the deposition amount, (b) layer filling by 6P
molecules, (c) dynamic surface density redistributions during
layer filling and (d) critical density induced meta-stable layer
dewetting. It is important to note that most of the PEEM data
presented here are acquired during the deposition time prior to
nucleation. It will be shown that, by studying this crucial
pre-nucleation deposition period, the requirements for critical
nucleation can be understood. A numerical simulation of
PEEM photoemission intensity will be shown to help
determine layer filling mechanisms and maximise the amount
of useful data that can be extracted from PEEM. Further-
more, data obtained during post-nucleation deposition allow
nucleation energies to be obtained from temperature
dependent trends of nucleation rates.
It will be shown that although the deposition of 6P on both
substrates results in entirely different molecular crystals
growing ((20�3) versus (21�3)) during the post-nucleation deposi-
tion period, during the time defined by the pre-nucleation
deposition period there are some remarkable similarities.
These include the gradual filling of meta-stable layers to a
similar density of tilted molecules followed by the formation,
in both cases, of (20�3) critical nuclei. Although this may seem
counter-intuitive, it is only after nucleation that differences
start to become apparent. The nucleation induced sponta-
neous dewetting produces two distinct patterns in PEEM
images that reveal differences in surface topology in each case.
The topology can be easily distinguished by comparing the
anisotropy of molecular diffusion on these surfaces. The
temperature dependence of this topological divergence
determines the post-nucleation molecular assembly process
(of the crystals) and is readily observed as a progressive change
to the nanostructure shape. As will be shown, all these pheno-
mena have their origin in the pre-nucleation deposition period.
2. Experimental
The experiments were performed in a custom-designed,
combined Omicron VT-AFM/scanning tunnelling microscopy
(STM)-PEEM UHV instrument with a base pressure o 2 �10�10 mbar. The Cu(110) crystal was cleaned in five steps,
namely (a) flashing of the crystal to above the desorption
temperature of 6P (4220 1C) to reduce the amount of 6P on
the crystal before sputtering, (b) Ar+ sputtering (10 mA,
1.5 kV, 45 min) followed by (c) annealing for 5 min at
500 1C, (d) cooling in oxygen partial pressure at 5 � 10�7 mbar
for 5 min and (e) flashing to 500 1C. Several cycles of the
cleaning steps (b) through to (e) were performed with the final
cleaning cycle omitting (d) and (e). These cleaning steps result
in a Cu(110) surface. To form the 2 � 1 � O reconstruction
50 L of O2 are dosed in the chamber at 2 � 10�7 mbar.
Following cleaning, the sample was transferred, via a
magnetically coupled transfer rod, to the PEEM.
The molecular evaporator, mounted in situ and facing the
sample holder of the PEEM, consists of a Knudsen type
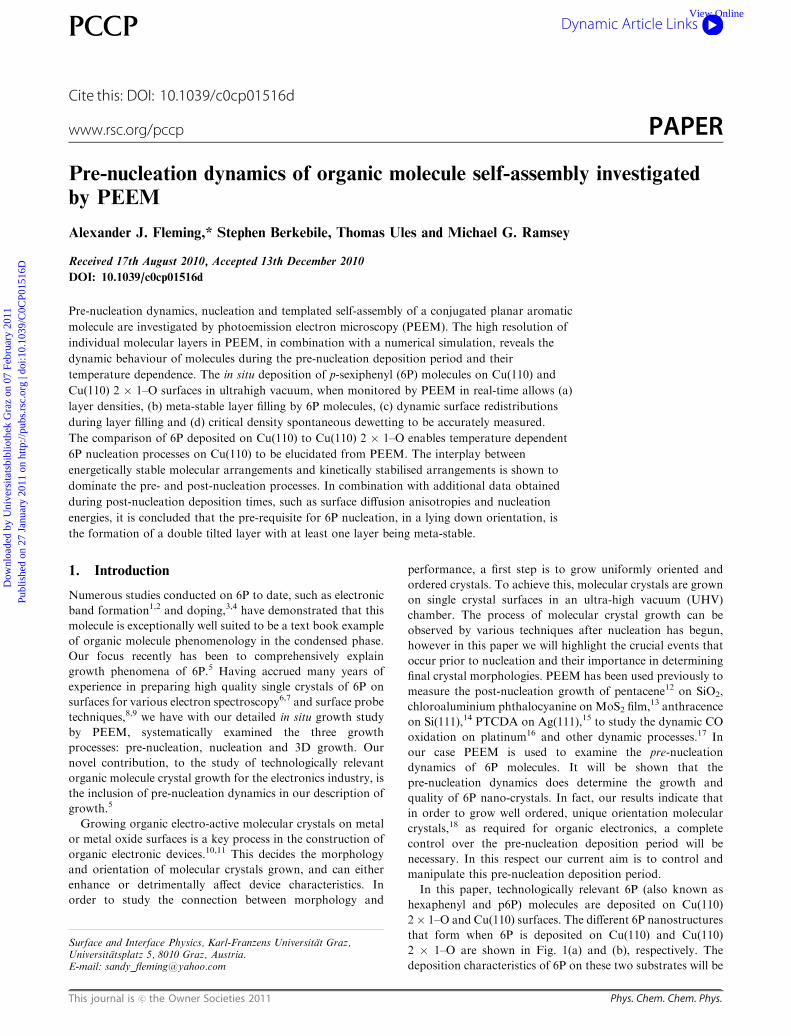
Fig. 1 PEEM image of two types of 6P self-assembled nanostructures
that form when 6P is deposited on (a) Cu(110) and (b) Cu(110)
2 � 1–O surfaces. Typical heights of the nanostructures are in the
range 50–500 nm. Insets: top-view of crystalline structure of the
nanostructures grown and top view of the Cu(110) and Cu(110)
2 � 1–O substrates with arrows indicating surface corrugation
direction. Both surfaces are anisotropic and the surface corrugations
are orthogonally oriented with respect to the other.
Fig. 2 Crystal planes (�629), (20�3) and (21�3) of the 6P herring-bone
crystal. The surface densities required for full-coverage for each plane
relative to the (20�3) crystal plane are given in italic.
Dow
nloa
ded
by U
nive
rsita
tsbi
blio
thek
Gra
z on
07
Febr
uary
201
1Pu
blis
hed
on 2
7 Ja
nuar
y 20
11 o
n ht
tp://
pubs
.rsc
.org
| do
i:10.
1039
/C0C
P015
16D
View Online
This journal is c the Owner Societies 2011 Phys. Chem. Chem. Phys.
effusion cell resistively heated by current supplied to a filament
by a constant-current source. The 6P in powder form, supplied
by TCI chemicals (Japan) and introduced previously into the
Knudsen cell, is degassed thoroughly by extended heating just
below the sublimation temperature of 6P. The first few 6P
films deposited are not used for measurements. There is no
quartz thickness monitor available due to space restrictions so
no instantaneous deposition rate monitoring is possible.
However, the constant-current supply allows the heating of
the evaporator to be stabilised to a given temperature, which
when combined with the accurate photo-emission intensity
versus time curves (see results) allows for an accurate
a posteriori calculation of the stabilised deposition rate.
Typical deposition rates of molecules are between 0.25 to
1 ML min�1. However, it will be shown that the deposition
rate does not influence the layer filling in the time-scales
explored during deposition. Unless otherwise stated, the
molecular evaporator shutter is open throughout the entire
deposition. After nucleation, and once dewetting is complete,
the shutter is opened and closed periodically to probe mole-
cular surface diffusion.
PEEM measurements were carried out using a FOCUS/
Omicron PEEM instrument in a high magnification mode
using a Mercury HBO 103W/2 discharge lamp (maximum of
hn = 4.9 eV) for illumination at an angle of incidence of 251.
For the molecule/substrate combination used here the image
contrast in PEEM makes use of laterally distributed local
workfunction differences that result in varying yields of photo-
electrons. In the threshold mode, the ionisation potential of 6P
(6.12 eV) is too large for the Hg lamp excitation source
(4.9 eV) thus no photoemission is observed from 6P. However,
the workfunction of the metal substrate is less than 4.9 eV,
therefore photoemission from the metal surface is observed.
Depositing 6P (a dielectric) onto the metal substrate reduces
the surface dipole component of the metal surface workfunc-
tion and hence the photoemission intensity increases. How-
ever, once the first monolayer is complete no more changes to
the surface dipole of the metal occur so any further molecules
deposited do not change the workfunction but instead attenu-
ate the photoemission originating from the metal. The
attenuation is due to inelastic scattering of photoelectrons by
6P molecules (the electronic bandgap isB3.9 eV). An aperture
size of 50 mm together with a fully open iris gave the optimal
resolution for images with a pre-calibrated (in-house) field-of-
view of 20–70 mm. Extractor voltages of 10.5–13.5 kV were
employed, with a sample–extractor distance of 1.8 mm. No
adverse effects, such as decomposition or desorption, arising
from the UV light or high electric field were observed for 6P on
Cu(110). Photoelectron intensities plotted in the Results
section were acquired directly from intensity averaged areas
of the PEEM images. Area-averaging of the intensity works
well up to the point when dark structures form on the surface
(nucleation). Once dark structures start growing, area-
averaging the intensity to determine the surface molecular
density will become distorted by the coverage of three dimen-
sional dark structures. At 140 1C the ratio of dark structures to
bright area is small; therefore the error introduced is also
small. A video camera exposure time of 500 ms at an acquisi-
tion rate of 2 Hz was found to be adequate to monitor
dynamic processes on the surface. In situ sample heating was
achieved by indirect heating with a filament following a
pre-determined and calibrated temperature–time curve.
To observe dynamic changes in surface molecular density
during the pre-nucleation deposition period, some post-
processing of PEEM images is required. First all PEEM
images of a video sequence are normalised to the average
intensity of the first image (clean surface before deposition)
and batch processed to produce a difference image sequence
with respect to the first image. Furthermore, any contrast
enhancement observed can be quantised by batch processing
the PEEM image sequence to determine the intensity rms
deviation for each image and plot it versus deposition time.
3. Results and discussion
Highly ordered uni-axially aligned molecular crystallites form
when 6P molecules are deposited on Cu(110) and Cu(110)
2 � 1–O. The templating of the first molecular layer by the
metal surface corrugation into an ordered and aligned layer
leads to anisotropic crystallite growth and anisotropic surface
diffusion of molecules. Shown in Fig. 1 are typical examples of
the different nanostructures that form when 6P is deposited on
Cu(110) and Cu(110) at 140 1C. Straight (20�3) needles form
when 6P is deposited on Cu(110) 2 � 1–O, whereas crossed
(21�3) needles form when 6P is deposited on Cu(110). It is the
binding/sticking anisotropy of plano-linear 6P molecules
which results in a preferred co-facial stacking. Hence upon
stacking, crystallites grow perpendicular to the molecular
orientation within the molecular crystal. As will be shown
later, this growth direction is also perpendicular to the fastest
molecular diffusion direction.
In order to explain the behaviour of 6P pre-nucleation,
nucleation and growth, general observations of the combined
6P/substrate system are presented first. These include compar-
isons of the photoemission intensity evolution with deposition
time and general observations, such as condensation at steps
and dewetting, that distinguish the behaviour of 6P deposited
on Cu(110) 2 � 1–O from 6P deposited on Cu(110).
Subsequently, a description and explanation of the tempera-
ture dependence of various phenomena related to 6P deposited
on Cu(110), that are not observed for 6P deposited on Cu(110)
2 � 1–O, are presented. To do this, a simulation of PEEM
photoemission intensity is constructed to interpret the
temperature dependence; STM images and measurements of
the molecular surface diffusion are also included. Finally, the
nucleation energies of both systems are compared and
contrasted.
3.1 Photoemission intensity evolution of 6P deposited on
Cu(110) and Cu(110) 2 � 1–O
From dynamic PEEM data and other static techniques5,6,8 6P
deposited on Cu(110) 2 � 1–O is known to form a tilted first
layer (a stable wetting layer) followed by a tilted meta-stable
second layer that spontaneously forms (20�3) nuclei when a
critical surface density (at B1.95 ML) is reached. Upon
nucleation, dewetting of the metastable layer proceeds
whereby 6P molecules diffuse to the nuclei, and the nuclei
grow into long needles. On the other hand, for 6P deposited on
Dow
nloa
ded
by U
nive
rsita
tsbi
blio
thek
Gra
z on
07
Febr
uary
201
1Pu
blis
hed
on 2
7 Ja
nuar
y 20
11 o
n ht
tp://
pubs
.rsc
.org
| do
i:10.
1039
/C0C
P015
16D
View Online
Phys. Chem. Chem. Phys. This journal is c the Owner Societies 2011
Cu(110) the information available thus far is limited. Several
static techniques, applied after nucleation, have determined
that 6P forms a flat-lying first layer (a permanent wetting
layer) and a static second layer with three-dimensional
crossed-needles growing on top. X-Ray diffraction studies
indicate that the nanostructures have a (�629) structure when
grown at RT. However, no studies have examined the
pre-nucleation deposition period, hence the motivation for
this work.
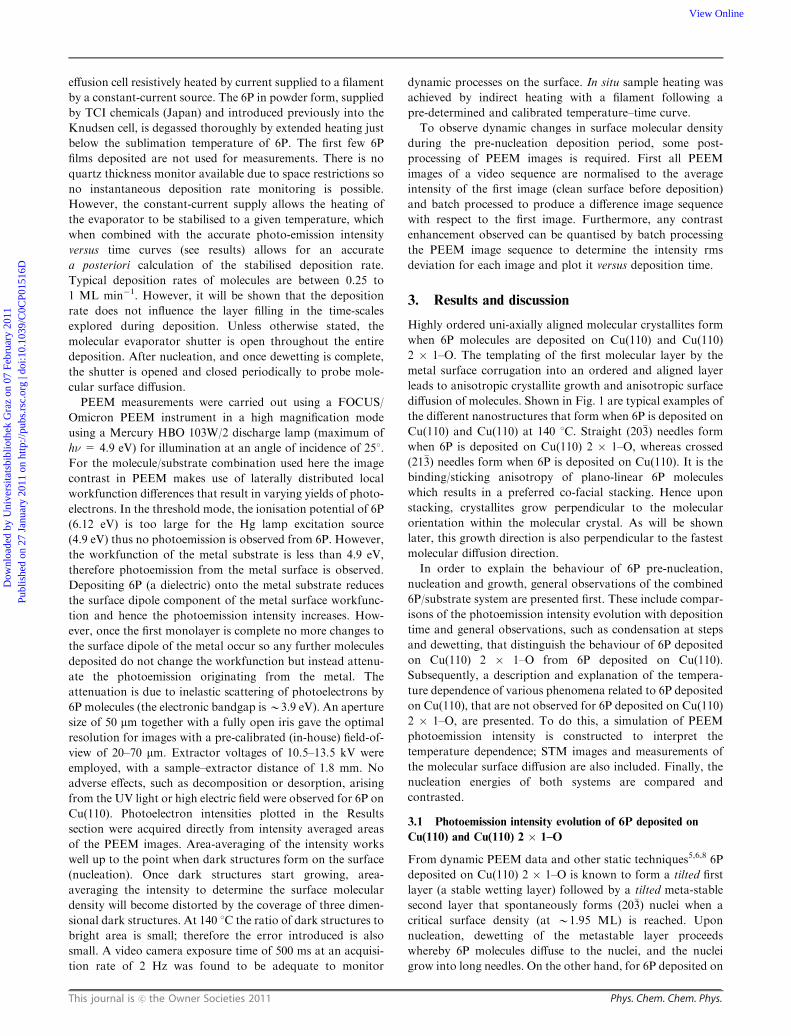
Typical area averaged photoemission intensity versus time
plots which correspond to 6P deposited on (a) Cu(110)
2 � 1–O and (b) Cu(110) are given in Fig. 3. Both plots
undergo a similar general trend which involves (1) a sharp rise
in intensity, (2) a maximum with a subsequent decrease in
intensity (this decrease is more prolonged for 6P on Cu(110)
since more molecules must be deposited), and (3) upon
reaching a critical deposited amount, a sharp cusp followed
by a constant gentle rise in intensity thereafter. The transition
from increasing to decreasing photoemission intensity upon
completion of the first layer is a general characteristic of
photoemission obtained in the threshold regime.
To facilitate comparison, the photoemission intensity
curves, shown in Fig. 3, are double normalised to the
maximum intensity and to one complete monolayer as
explained in more detail by Fleming et al.5 To facilitate
interpretation of the double normalised plots, the inset in
Fig. 3 is a plot of the same data where the normalised
photoemission intensity is plotted versus the total surface
density of molecules deposited. This better illustrates how
more material must be deposited to form a tilted first layer
on Cu(110) 2 � 1–O compared to a flat-lying first layer on
Cu(110). A noticeable difference between the evolution of the
photoemission intensity for 6P on Cu(110) and 6P on Cu(110)
2 � 1–O up to 1 ML deposited material is the presence of a
re-arrangement kink at B0.2 ML in the double normalised
plot for 6P deposited on Cu(110) 2 � 1–O. A kink describes a
sudden change in the rate of intensity increase/decrease with
deposition time. Thus during the initial deposition of 6P on
Cu(110) 2 � 1–O, PEEM correctly indicates that the dilute
layer undergoes a spontaneous re-arrangement from flat lying
to tilted 6P orientation. This agrees with the observation, from
STM8 and LEED, that the 6P wetting layer molecules are
tilted at an angle of 371 with respect to the surface. It can
therefore be deduced from the monotonic intensity increase
during the initial deposition of 6P on Cu(110) (i.e. without a
re-arrangement kink between 0 ML and 1 ML) that molecules
in the wetting layer remain flat-lying. This is supported by
STM8 and valence-band photoemission1,6 of the full-coverage
wetting layer which shows that the wetting layer consists of
flat-lying 6P molecules strongly bound to the surface. Thus,
unlike with Cu(110) 2 � 1–O, no change in orientation is
observed nor expected for the first layer deposition.
During second layer filling, on the other hand, photo-
emission intensity trends of both systems are not monotonic.
The re-arrangement kinks, observed at B1.2 ML for 6P
deposited on Cu(110) 2 � 1–O and at B1.1 ML for 6P
deposited on Cu(110), indicate that re-arrangements of dilute
second layer molecules occur. The implication is that for both
systems the second layers are initially filled with flat-lying
molecules which, at a certain surface density, tilt to eventually
form a densely packed layer of tilted molecules. This filling
process is temperature independent for 6P deposited on
Cu(110) 2 � 1–O and it proceeds until a maximum surface
density is reached (when the tilt angle of the second layer
reaches B331). At this maximum surface density, critical
nucleation occurs, followed by dewetting.
For 6P on Cu(110) on the other hand, neither nucleation
nor dewetting occurs during second layer filling. Instead layer
filling continues uninterrupted up to B3.8 ML. However,
there is a significant kink at 2.4 ML. This is not a re-arrangement
kink as described above, rather it indicates when a layer is
completed and next layer filling commences (the temperature
dependence of this kink is described in detail later). The
surface density of a full-coverage 6P tilted layer (at 331) is a
factor B1.4 greater than the density of a full-coverage
flat-lying layer (at 01). Hence the 1.4 factor difference in the
density between a flat-lying and a tilted layer should be
taken into account when interpreting the time evolution of the
averaged area photoemission intensity for coverages 41 ML
in the double normalised plot. This means that the normalised
time required to fill identical tilted layers will be 1.4 ML for 6P
deposited on Cu(110) and 1.0 ML for 6P deposited on
Cu(110) 2 � 1–O. As can be seen from the plot, there is a
kink in the intensity evolution at B2.4 ML. This kink at
2.4 ML indicates that a second layer, composed of tilted
molecules, is completed. More significantly, the important result
is that both second layers, on Cu(110) 2 � 1–O and on Cu(110),
have the same density (as can also be seen in the inset in Fig. 3).
Once the tilted second layer is complete a subsequent third
layer begins to fill for 6P deposited on Cu(110). This layer, in
common with the second layer, also has a re-arrangement kink
located at B2.5 ML which indicates a change from flat-lying
to tilted orientation. As can be seen in Fig. 3, third layer filling
continues until a critical density is reached and spontaneous
nucleation occurs. For 6P deposited on Cu(110), the critical
surface density is reached at 3.8 ML (normalised time) which
Fig. 3 Normalised area-averaged photoemission intensity versus
normalised time for 6P deposited on Cu(110) 2 � 1 � O at 140 1C
(black line) and on Cu(110) at 125 1C (grey line). Inset: same data
re-plotted with normalised intensity as a function of total surface
molecular density.
Dow
nloa
ded
by U
nive
rsita
tsbi
blio
thek
Gra
z on
07
Febr
uary
201
1Pu
blis
hed
on 2
7 Ja
nuar
y 20
11 o
n ht
tp://
pubs
.rsc
.org
| do
i:10.
1039
/C0C
P015
16D
View Online

This journal is c the Owner Societies 2011 Phys. Chem. Chem. Phys.
corresponds to two completed tilted 6P layers (1.4ML+1.4ML)
deposited on top of a flat-lying first layer (1 ML). Thus critical
nucleation occurs at the point in time when the third layer
is just completed. Similarly, for 6P deposited on Cu(110)
2 � 1–O, critical nucleation begins when the second layer is
just completed at B2 ML. Note that the second and third
layers on Cu(110) and the second layer on Cu(110) 2 � 1–O,
all have the same density. This will be shown later to be the
deciding factor that determines what crystal structure critical
nuclei have.
To summarise, comparison of area-averaged photoemission
intensity versus deposition time curves for both substrates
indicates that more 6P must be deposited on Cu(110) to
initiate critical nuclei formation. 6P deposited on Cu(110)
2 � 1–O fills two layers with tilted-lying-down molecules:
the first layer is a permanent tilted wetting layer and the
second is a tilted layer. This second layer is meta-stable since
it dewets upon critical nucleation. On the other hand, 6P
deposited on Cu(110) fills three layers: the first is a flat-lying
permanent wetting layer and the second/third layers together
form a tilted-lying-down double layer. This double layer
will be also shown to be meta-stable since it partially dewets
upon critical nucleation to form a permanent second layer
reconstruction. Interestingly, the photoemission intensity
curves also show that at 125 1C all tilted layers on any of
the systems have approximately the same density.
3.2 Dynamic surface density re-distributions during deposition
of 6P on Cu(110) and Cu(110) 2 � 1–O
In this section a brief introduction to other phenomena,
observed during the pre-nucleation and post-nucleation
deposition period, which highlight the differences between
the two systems are presented and discussed. For instance,
when 6P is deposited on Cu(110) an enhanced contrast of
Cu(110) crystal steps and terraces is observed that does not
occur when 6P is deposited on Cu(110) 2 � 1–O. Further
differences, observed during the spontaneous nucleation
induced dewetting, that draw attention to the different surface
topologies during dewetting are also given. These phenomena
also have a temperature dependence that is discussed in more
detail later.
3.2.1 6P condensation at steps during pre-nucleation deposition
period for 6P on Cu(110). In situ real-time monitoring by
PEEM enables surface density re-distributions to be moni-
tored during pre-nucleation and post-nucleation deposition
periods. The difference image sequence shown in Fig. 4 (A–F)
for 6P deposited on Cu(110) reveals large changes in PEEM
image contrast which indicate that 6P re-distributes on the
surface during the pre-nucleation deposition period. The
contrast enhancement observed, quantised by batch
processing, is plotted versus normalised deposition time and
displayed in tandem with the corresponding photoemission
intensity curve in Fig. 4(b). Large variations in image contrast
for the different layers are explained by variations in molecule
to surface interactions during this pre-nucleation deposition
period. The surface on which molecules diffuse and condense
changes depending on which layers are completed. This
explains the varying behaviour as a function of deposition
time in Fig. 4(b). For deposition times o 1 ML 6P molecules
diffuse on Cu(110) whereas 41 ML 6P molecules diffuse on
either a flat-lying (first layer) or a tilted layer (second and third
Fig. 4 (a) Difference image sequence (A to F) for 6P deposited on Cu(110) that illustrates the contrast enhancement provided by 6P condensation
at steps during second layer and third layer deposition. (b) Combined plot of area-averaged photoemission intensity for 6P on Cu(110) deposited at
125 1C (grey) and corresponding area-calculated rms intensity deviation plotted versus normalised deposition time in monolayers (black). Note
that (A to F) correspond to the image sequence. (c) Schematic diagram of condensation at steps starting from the bottom of the step (condensation
starting from top of step is also possible but not drawn) for A, C and E.
Dow
nloa
ded
by U
nive
rsita
tsbi
blio
thek
Gra
z on
07
Febr
uary
201
1Pu
blis
hed
on 2
7 Ja
nuar
y 20
11 o
n ht
tp://
pubs
.rsc
.org
| do
i:10.
1039
/C0C
P015
16D
View Online

Phys. Chem. Chem. Phys. This journal is c the Owner Societies 2011
layers) of 6P. No 6P condensation at steps is observed when
deposited on Cu(110) 2 � 1–O.
Examining Fig. 4(b) to compare the spatial rms intensity
versus the area-averaged photoemission intensity plots reveals
some trends. Namely, spatial rms intensity minima observed at
1 ML, 2.4 ML and 3.8 ML coincide in time with the
completion of each successive layer (these are indicated by
B, D and F, respectively, in Fig. 4). Reciprocally, spatial rms
intensity maxima coincide, with the exception of the first layer,
with the point in deposition time when a layer is exactly half
filled (indicated by C and E in Fig. 4). Thus when the
condensation at steps reaches 50% coverage of terraces the
contrast observed is maximised, whereas 50% coverage with
no condensation at steps, whereby molecules are distributed
homogeneously over the surface results in no contrast enhance-
ment. Likewise 100% coverage of terraces (completed layers)
results in no contrast enhancement, but serves to confirm that
the normalised deposition times for layer completion (1 ML,
2.4 ML and 3.8 ML), extrapolated from the area-averaged
photoemission intensity curves in Fig. 3, are correct. The
reasons why condensation at steps varies during deposition
are explained next.
For depositions times r 1 ML 6P molecules interact
strongly with the metal surface when 6P is deposited on
Cu(110) and thus adopt a flat-lying orientation. This strong
binding interaction with the surface prevents a strong binding
interaction between molecules (there is a minimal inter-
molecular orbital overlap in the flat-lying configuration)
so no preferred condensation at steps is observed. This is
illustrated in Fig. 4 A.
On the other hand, 6P molecules filling the second layer on
Cu(110) do not interact with the metal surface and instead
experience weaker van der Waals interactions with flat-lying
molecules from the first layer. It is this relative weakness which
allows molecules to re-orient into a tilted orientation. The
process of tilting is kinetically driven in the presence of a high
surface density of molecules and is explained later in more
detail. Since condensed and tilted 6P molecules on top of the
flat-lying layer present a hydrogen terminated surface towards
the aromatic plane of the first layer, as shown in Fig. 4 C, the
intra-layer inter-molecular overlap of the second layer is
comparatively greater and hence the van der Waals interaction
within the second layer will dominate. It is important to note
that the flat-lying layer also presents a relatively small surface
topology corrugation compared to the bare substrate. This
combination facilitates the 6P condensation at steps process
since molecules will diffuse on terraces and collect at stronger
binding sites such as steps. It should be noted that condensa-
tion at steps does not produce a bulk type crystal arrangement
(in fact the layers are meta-stable), but it is nevertheless
energetically favourable during the pre-nucleation deposition
period to condense.
From Fig. 4 it is clear that third layer condensation at steps
produces a weaker contrast enhancement than the second
layer. Although condensed molecules in the third layer also
present a hydrogen terminated surface to the second layer,
the matching surface topology (they can adopt a 1 : 1
commensurate spacing) to the second layer hydrogen
termination results in molecules condensing anywhere on the
terraces including at step edges. Thus this more sympathetic
interaction leads to only a partial condensation at steps for the
third layer. It should be noted that due to the differential layer
photoemission attenuation, the maximum contrast enhance-
ment from the third layer condensation at steps will be half
that of the contrast enhancement of the second layer. Apart
from confirming some of the conclusions garnered from
photoemission intensity curves, the agreement between the
positions of rms minima and layer completion kinks indicates
that at 125 1C the layer filling mode, in the pre-nucleation
deposition time, is layer-by-layer.
3.2.2 Spontaneous dewetting during post-nucleation
deposition period. Thus far, it has been shown that compar-
isons between the intensity evolutions of 6P on Cu(110)
2 � 1–O and 6P on Cu(110) allow pre-nucleation layer filling
mechanisms to be established. The post-nucleation deposition
period can also be studied. When 6P is deposited on Cu(110)
2 � 1–O, second layer molecules form a meta-stable layer that
spontaneously dewets at a critical density to form 6P (20�3) 3D
needles.5 No condensation at steps is observed during deposi-
tion of the second layer, since in this case the layer is in a
homogenous liquid state up until a critical surface density is
reached at B1.95 ML. At this critical density, (20�3) nuclei
form and spontaneous dewetting of the layer to form 3D
nuclei proceeds. As described above, the deposition timeline
for 6P deposited on Cu(110) is different—layer filling
continues up to 3.8 ML (one flat and 2 tilted layers); upon
when spontaneous nucleation induced dewetting occurs. It will
be shown later that unlike with 6P deposited on Cu(110)
2 � 1–O, the (20�3) critical nuclei formed when 6P is deposited
on Cu(110) do not determine the final structure of the nano-
structures that grow. This is because the process of dewetting
leads to a molecular layer reconstruction, of areas surrounding
critical nuclei, which changes the favourable crystal structure
to self-assemble from (20�3) to (21�3) for temperatures 4 RT.
Shown in Fig. 5(a) and (b) are post-nucleation PEEM
images of 6P deposited on Cu(110) and Cu(110) 2 � 1–O,
respectively. In both cases, 6P crystals that form are darker in
PEEM than the surrounding area. This is due to their 3D
Fig. 5 Anisotropic dewetting of 6P from (a) meta-stable second and
third layers of 6P on Cu(110) to form crossed-needles and (b) meta-
stable second layer of 6P on Cu(110) 2 � 1–O to form needles. Areas
with lower surface density of 6P molecules appear bright since there is
less attenuation of the photoemission from the Cu(110) 2 � 1–O or
Cu(110) surface beneath. The fastest diffusion direction is along the
Cu(110) 2 � 1–O or Cu(110) surface corrugations. Note that in both
cases, the permanent first layer never dewets.
Dow
nloa
ded
by U
nive
rsita
tsbi
blio
thek
Gra
z on
07
Febr
uary
201
1Pu
blis
hed
on 2
7 Ja
nuar
y 20
11 o
n ht
tp://
pubs
.rsc
.org
| do
i:10.
1039
/C0C
P015
16D
View Online
This journal is c the Owner Societies 2011 Phys. Chem. Chem. Phys.
structure of multiple 6P layers which, in total, attenuate
secondary photo-electrons very strongly. Notice that areas
immediately surrounding nuclei are brighter than the rest of
the image. These bright areas indicate regions of low surface
density where molecules have dewetted the surface by diffusing
away (in the presence of a concentration gradient) to nuclei.
The shape of these low surface density regions is determined
by how anisotropically 6P diffuses on the surface. As can be
seen in Fig. 5(a), the elongated bright areas are clear evidence
of anisotropic diffusion during the process of nucleation
induced spontaneous dewetting. In Fig. 5(b) the elongation
is not as pronounced, however, in both cases the direction of
fastest dewetting is perpendicular to the fastest growth
direction of the nanostructures that form and is parallel to
the surface corrugation that templated the wetting layer
(shown in Fig. 1). In Fig. 5, the dewetting process occurs on
a much larger length scale for 6P on Cu(110). It is highly
anisotropic (410 : 1) and produces long thin streaks in the
[1�10] direction that grow wider in tandem with the length
increase of the nanostructures. It is also important to note that
the boundary of the dewetted region is sharp in the [001]
direction and smeared out in the direction parallel to the fast
diffusion direction [1�10]. 6P deposited on Cu(110) 2 � 1–O, on
the other hand, produces a less anisotropic (roughly 4 : 1)
spontaneous nucleation dewetting bright area with sharp
boundaries in all directions. It will be shown later that the
high anisotropy observed during dewetting on Cu(110) is due
to molecules diffusing on a reconstructed layer that channels
molecules towards the nuclei. On the other hand, 6P
molecules, during dewetting on Cu(110) 2 � 1–O, diffuse on
an un-reconstructed, tilted layer, which weakly confines
molecules into anisotropic diffusion.
3.3 Temperature dependence of 6P deposited on Cu(110)
In this section, temperature dependences of the dynamic
behaviour of 6P during pre-nucleation and post-nucleation
deposition times are examined. It will be shown that by
constructing a simulation of photoemission intensity curves
and comparing it to experimental data for several deposition
temperatures, the layer filling scheme can be sub-divided into
two growth modes: layer-by-layer or hole creation. It is then
postulated that a single mechanism involving hole creation
and filling can explain both growth modes. This is confirmed
by analysing the temperature dependence of the condensation
at steps during second and third layer filling. Furthermore, by
comparing surface densities required to complete a layer, it is
postulated that at all temperatures (20�3) critical nuclei form
when 6P is deposited on Cu(110). Although this would seem to
contradict the observation of (21�3) crossed needles, analysis by
PEEM and STM of the nature of the top surface remaining
after dewetting (the molecular reconstruction) shows that
there are highly anisotropic channels that are formed by a
mixture of tilted and flat molecules. This mixed orientation,
also present in the crystal structure of (21�3) and (�629) planes, is
what encourages growth of crossed needles. Finally, the
postulate that (20�3) critical nuclei can give rise, via a
reconstruction of the surrounding area, to crossed-needles is
confirmed by PEEM images of crossed needles exhibiting
additional (20�3) straight needles. Further confirmation is
provided by the fact that nucleation energies for 6P on both
substrates are nearly identical.
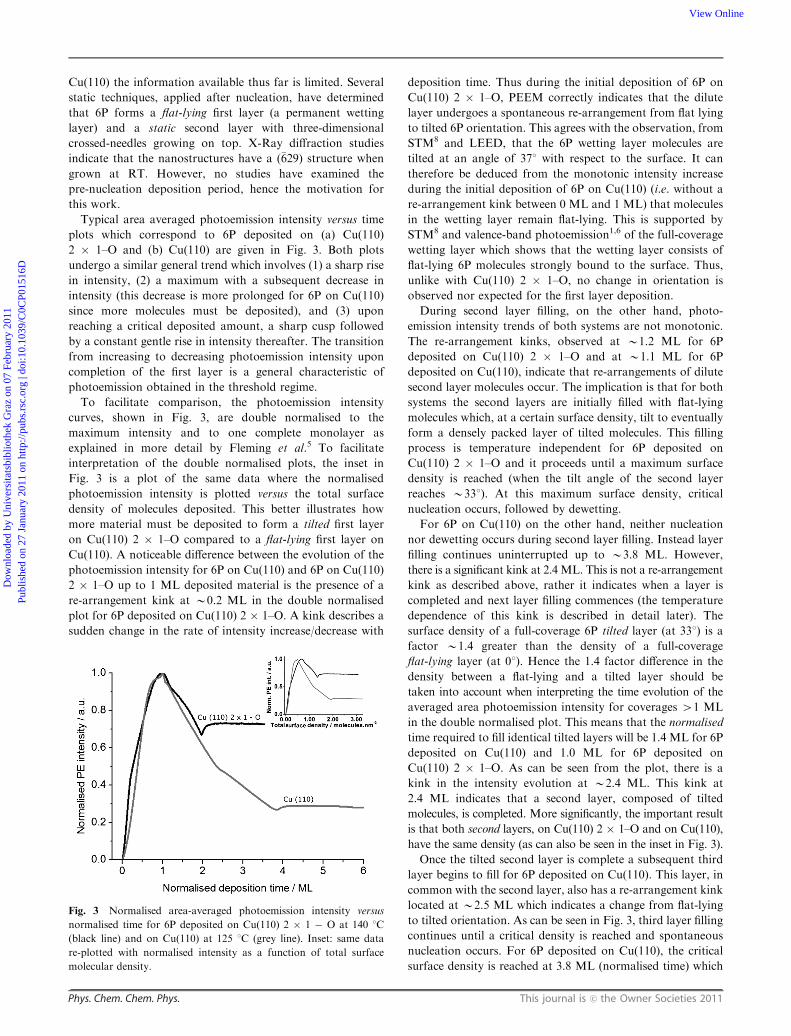
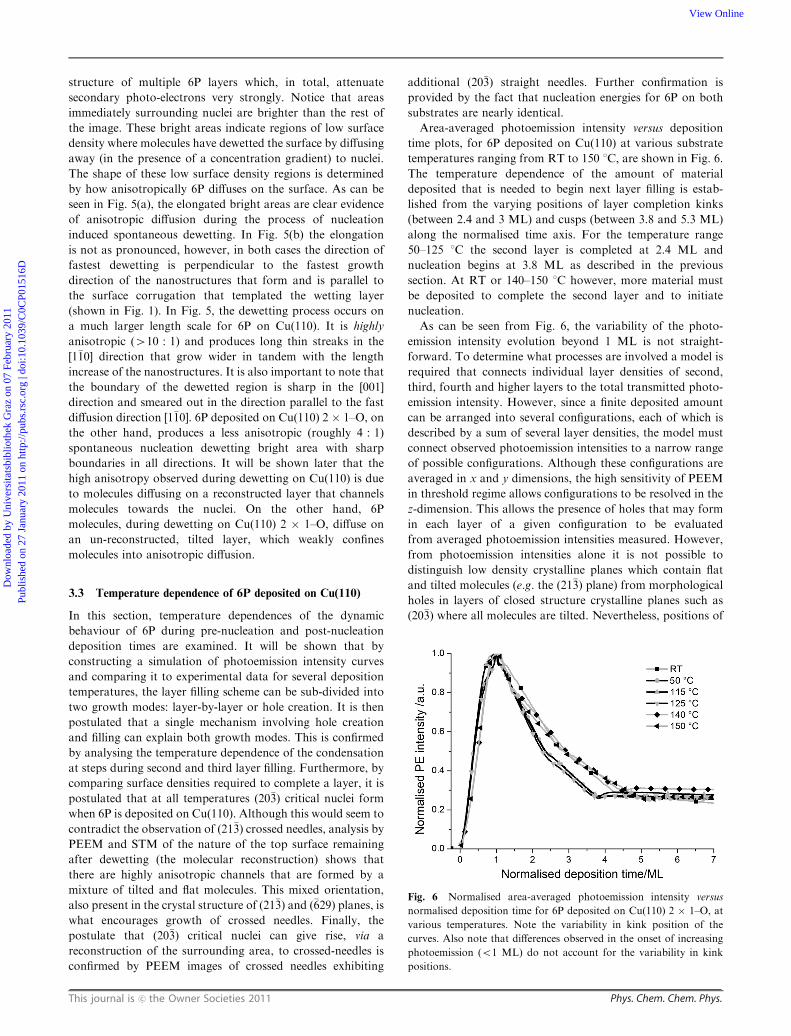
Area-averaged photoemission intensity versus deposition
time plots, for 6P deposited on Cu(110) at various substrate
temperatures ranging from RT to 150 1C, are shown in Fig. 6.
The temperature dependence of the amount of material
deposited that is needed to begin next layer filling is estab-
lished from the varying positions of layer completion kinks
(between 2.4 and 3 ML) and cusps (between 3.8 and 5.3 ML)
along the normalised time axis. For the temperature range
50–125 1C the second layer is completed at 2.4 ML and
nucleation begins at 3.8 ML as described in the previous
section. At RT or 140–150 1C however, more material must
be deposited to complete the second layer and to initiate
nucleation.
As can be seen from Fig. 6, the variability of the photo-
emission intensity evolution beyond 1 ML is not straight-
forward. To determine what processes are involved a model is
required that connects individual layer densities of second,
third, fourth and higher layers to the total transmitted photo-
emission intensity. However, since a finite deposited amount
can be arranged into several configurations, each of which is
described by a sum of several layer densities, the model must
connect observed photoemission intensities to a narrow range
of possible configurations. Although these configurations are
averaged in x and y dimensions, the high sensitivity of PEEM
in threshold regime allows configurations to be resolved in the
z-dimension. This allows the presence of holes that may form
in each layer of a given configuration to be evaluated
from averaged photoemission intensities measured. However,
from photoemission intensities alone it is not possible to
distinguish low density crystalline planes which contain flat
and tilted molecules (e.g. the (21�3) plane) from morphological
holes in layers of closed structure crystalline planes such as
(20�3) where all molecules are tilted. Nevertheless, positions of
Fig. 6 Normalised area-averaged photoemission intensity versus
normalised deposition time for 6P deposited on Cu(110) 2 � 1–O, at
various temperatures. Note the variability in kink position of the
curves. Also note that differences observed in the onset of increasing
photoemission (o1 ML) do not account for the variability in kink
positions.
Dow
nloa
ded
by U
nive
rsita
tsbi
blio
thek
Gra
z on
07
Febr
uary
201
1Pu
blis
hed
on 2
7 Ja
nuar
y 20
11 o
n ht
tp://
pubs
.rsc
.org
| do
i:10.
1039
/C0C
P015
16D
View Online

Phys. Chem. Chem. Phys. This journal is c the Owner Societies 2011
layer completion kinks and cusps, which have been shown to
indicate how much deposited material is required to complete
a layer, together with the simulation of photoemission
intensity, can be used to establish which crystalline plane fills
a layer and which morphological phenomena are involved.
3.3.1 Simulation of PEEM intensity time evolution. To
construct the model several factors must be considered,
including (a) number density of molecules on the surface per
unit area, (b) number of molecular layers, (c) lateral resolution
of the PEEM instrument, (d) PEEM contrast regime and (e)
molecular inter-layer rearrangement mechanisms. The PEEM
instrument extracts photoelectrons from the substrate surface,
focuses them onto a micro-channel plate that increases the
gain of the photoelectron signal and finally produces an image
on a phosphorescent screen. PEEM has a resolution that is
insufficient to resolve individual molecular sites on the surface,
thus final images are area-averaged and hence our model
requirements are greatly simplified. The strategy is to evaluate
the average photoemission intensity for each possible
configuration that is realistically attainable via molecular
re-arrangement for a given number density of molecules per
unit area. Since there aren’t any non-intrusive experimental
techniques that can laterally resolve individual molecule
dynamic re-arrangements, this PEEM simulation is a worth-
while approach. The reference molecular density is taken to be
the density of a (20�3) full-coverage tilted layer. In view of the
fact that our aim is to interpret trends in area-averaged
photoemission intensity versus deposition time plots, such as
in Fig. 6, a simple 3D layered 3 � 3 grid will provide sufficient
resolution to compare to the experimental data when small
amounts between 1–4 ML of material are deposited. Note that
only the second layer and above are considered in this model
since molecules of the first layer are strongly bound to the
Cu(110) surface.
Shown in Fig. 7 is the multilayered N � N grid that is used
to construct the simulation. Each molecule occupies one site
(i, j) on the grid (no double occupancy is allowed) and
molecules are moved between layers L, by subtracting a
molecule from a layer (creating a hole in that layer) and
adding the molecule on to a different layer (creating a
‘‘tower’’). Occupancy of each available site is given by
Si,j,L = 1. For unoccupied sites Si,j,L = 0. Furthermore,
several constraints are required. During re-arrangement the
total number of molecules must be conserved. Molecules can
only occupy a higher layer if equivalent sites in the layers
beneath are occupied too—this prevents evaluating states with
unphysical ‘‘floating’’ molecules. Only structures such as
stepped pyramids and cuboids are considered. Arches and
other similar structures which violate the above rules are
excluded. Thus, the constraint Si,j,L Z Si,j,L+1 is applied in
the simulation during re-arrangement. In order to model the
layer filling as measured by PEEM, deposition quantities are
increased in 1/N2 ML* steps and at each deposition step the
photoemission intensity of each possible re-arrangement is
calculated. Note that for the purposes of the model ML*
refers to a (20�3) layer of tilted molecules (1 ML* = 1.4 ML).
The model will be re-normalised later to the flat-lying wetting
layer in order to compare to PEEM data.
In our case deposition is simulated as follows: using a 3 � 3
grid, at every 1/9 ML* step increase in number density of
molecules, all possible configurations of molecules on the grid,
following the rules above, are determined. As an example, all
possible configurations attainable via re-arrangement for
4 molecules on a 3 � 3 grid are given in Fig. 7(d). The various
configurations lead to different area-averaged photoemission
intensities for a given deposition amount. For each possible
configuration the normalised area-averaged photoemission
intensity of the 3 � 3 grid is calculated. To evaluate photo-
emission intensities in the photoemission attenuation regime,
the total transmission probability per site is calculated as a
product of transmission probabilities per layer Ti,j,L for each
site (i, j). The total transmission probability per site is then
averaged over the 3 � 3 grid to obtain the normalised
area-averaged photoemission intensity. More generally the
expression for photoemission intensity for every 1/N2
deposition step is given by,
IPEav ¼1
N2
XNi
XNj
YLmax
L¼1Si;j;LTi;j;L
" #
The uppermost layer that has an occupied site is Lmax (L = 1
is the flat-lying first layer that is excluded from the model).
Values evaluated for Lmax that lie outside the range of
experimentally obtained PEEM data intensity values are
excluded. These configurations are usually unrealistic struc-
tures that would produce higher photoemission intensities
than are observed and thus are not required for the simulation.
For example one of the various configurations in Fig. 7(d),
where 4 molecules are towered on top of a complete first layer
(i.e. Lmax = 5), produces a spike. Such a configuration is far
less likely to form than a shape with a complete first layer and
4 molecules in the second. In terms of the minimisation of
surface free energy principle, dewetting a surface to expose the
underlying surface in order to create a spike with a large
surface area to volume ratio leads to a large, and unfavour-
able, increase in total surface free energy.
The results of the PEEM simulation, re-normalised by
setting 1 ML* = 1.4 ML (for deposition times 41 ML), are
given in Fig. 8 (grey squares). The simulation data can be
Fig. 7 (a) One of many possible configurations of 12 molecules on the
surface distributed over 3 layers. (b) Total intensity transmission per
site (i, j) through the 3 layers. (c) The resultant area-averaged
transmitted intensity. (d) Intensity in-equivalent structural configura-
tions possible with 4 molecules deposited (the white 3 � 3 grid in this
case represents the permanent first layer). Note: the maximum layer
number (Lmax) with non-zero occupancy increases from 2 to 5 from
left to right.
Dow
nloa
ded
by U
nive
rsita
tsbi
blio
thek
Gra
z on
07
Febr
uary
201
1Pu
blis
hed
on 2
7 Ja
nuar
y 20
11 o
n ht
tp://
pubs
.rsc
.org
| do
i:10.
1039
/C0C
P015
16D
View Online

This journal is c the Owner Societies 2011 Phys. Chem. Chem. Phys.
broken up into two kinds: minimum intensity data points
which correspond to layer-by-layer filling and all other data
points of higher intensity that correspond to layer filling with
hole creation. At 1 ML the transmitted intensity is maximal as
there are only holes in the second layer fully exposing the
L = 1 flat-lying wetting layer beneath. Following the lowest
intensity simulation data points, for each deposition step
between 1 ML and 3.8 ML, it is clear that the photoemission
intensity decreases linearly within a layer and exponentially
between layers. These lowest intensity simulation data points
correspond to the case where no towering occurs, and hence
represent layer-by-layer filling. The layer completion kink
observed at 2.4 ML and 3.8 ML for layer-by-layer filling
and higher intensity data points in the simulation can be
explained together since they have a common origin. For
instance, when towering occurs during second layer filling
the number of holes in the second layer increases as site
occupancy in higher layers increases. When averaged, the
differential intensity change upon towering leads to an increase
in photoemission intensity for a given deposition amount. The
reason is that creating n unoccupied sites in the second layer
via re-arrangement will increase the area-averaged trans-
mission by (1/9) per unoccupied site. However there is a
counter balance, since to conserve the total number of sites
occupied, n molecules must be towered somewhere on the
surface. In the case of Lmax = 3, the area-averaged trans-
mission will decrease by (1/9)2 per tower created in this layer.
The averaging of these differential intensity changes leads to a
small rise in photoemission intensity. The various area-
averaged intensities of the different configurations possible
for every deposition step are plotted in Fig. 8. As can be seen
in Fig. 8, there is a distinct change in the rate at which the area-
averaged photoemission intensity varies when the deposited
amount increases linearly. This produces the characteristic
layer completion kinks described previously during the
transition from only filling the second layer to only filling
the third layer at 2.4 ML (this is confirmed experimentally by
the condensation at steps in the previous section). The pre-
sence of a kink in the simulation is therefore an indication of a
transition to filling the next layer; however this is not limited to
layer-by-layer filling since it can still occur when the hole
density of a particular layer is held constant.
3.3.2 Comparison of PEEM simulation to experiment. The
main hypothesis of the simulation is that molecules attenuate
equally no matter which layer (41 ML) they are in. The inset
in Fig. 8 shows the photoemission intensity as a function of
layer distance and it clearly follows a 1/2L dependence which
indicates that molecules in each layer above the first layer
attenuate equally and therefore no change, as a function
of distance to the surface, influences the photoemission
attenuation. In addition, no change is observed in ARUPS
workfunction measurements after the wetting layer is deposited.12
From inspection of Fig. 8 there is a good fit between the
photoemission intensity curve at 115 1C (which is representa-
tive of depositions between 50–125 1C) and the simulation
data points which correspond to configurations where the
number of holes is kept to a minimum (the lowest intensity
data points for each deposition point in the timeline). There is
an excellent fit to slopes between 1–3.8 ML and kink positions
at 2.4 ML and 3.8 ML (whereupon fourth layer filling would
begin if spontaneous nucleation dewetting did not occur). This
indicates that at these deposition temperatures layer filling
proceeds layer-by-layer and thus the hole density in all layers is
zero. Conversely, at RT the photoemission curve follows a
different path (this is also representative of the 140–150 1C
depositions). This indicates that at these temperatures layer
filling does not proceed layer-by-layer. Instead, the simulation
indicates that curves proceed along a path that creates a
non-zero hole density in layers during layer filling.
Photoemission intensity variability. Higher photoemission
intensity during deposition of second and third layers at RT
and 140–150 1C, and delayed layer completion kinks and cusps
confirm that some competing processes occur that are
cancelled out at deposition temperatures in the range 50–125 1C.
These processes must be temperature activated but also must
compete to produce variability in layer filling rates. We
propose that hole filling and hole creation fulfil these criteria.
At RT molecules will diffuse slowly on the surface and will
thus slowly fill naturally occurring holes that are created by
random spatial distributions of molecules arriving from the
evaporator. Note that due to the flat-lying first layer, second
layer holes are temporarily filled by molecules in a flat-lying
orientation. Lower temperatures slow the rate at which
flat-lying molecules re-tilt to join tilted parts of the layer;
and hence result in longer waiting times before tilted molecules
can occupy the same site (this will also prevent lateral growth
of sub-critical nuclei). On the other hand, between 140–150 1C
molecular diffusion is much faster so holes are filled much
more quickly. However high temperatures lead to more hole
creation since, in the context of a fixed intermolecular binding
energy, according to Boltzmann statistics, more molecules will
have enough energy to de-bind and therefore diffuse elsewhere.
Fig. 8 PEEM data for RT and 115 1C depositions overlaid on top of
PEEM simulation. Note that straight line segments of experimental
photoemission curves indicate that the deposition rate is constant
during deposition. Inset: photoemission intensity at kink positions for
some photoemission curves corresponding to layer-by-layer growth
plotted versus layer number (ML*). A 1/2L fit is also given and plotted
up to 6 ML*.
Dow
nloa
ded
by U
nive
rsita
tsbi
blio
thek
Gra
z on
07
Febr
uary
201
1Pu
blis
hed
on 2
7 Ja
nuar
y 20
11 o
n ht
tp://
pubs
.rsc
.org
| do
i:10.
1039
/C0C
P015
16D
View Online
Phys. Chem. Chem. Phys. This journal is c the Owner Societies 2011
Higher temperatures also shorten the time that a flat-lying
molecule occupies a hole by increasing the re-tilting rate, and
thus encourages the formation of kinetically stabilised tilted
layers. In the temperature range 50–125 1C the rate of hole
filling equals the rate of hole creation and thus they cancel out.
In this case, only the rate of deposition will determine the rate
of layer filling. However the rate of deposition does not
influence the filling mechanism itself. This becomes apparent
when comparing the absolute deposition rates in the
50–125 1C temperature range: all three depositions have
differing deposition rates, with the 115 1C deposition rate
roughly a factor 3 faster than the others.
For RT and 140–150 1C depositions, the PEEM simulation
indicates that hole creation and filling can explain the differing
behaviour. A hole in the simulation represents a lower density
per unit area than for the same area filled with tilted molecules,
only if the total number of molecules is conserved by moving
excess molecules to another layer. Thus configurations B and
C, shown in Fig. 9(a), both satisfy the condition for a hole in
the model. Areas of flat-lying molecules, areas with small
packing angles o 331 surrounded by tilted regions with
packing angles of 331 or regions with configurations such as
tilted/tilted/flat/tilted/tilted/flat can all equally represent a hole
in the simulation so long as excess molecules are transferred to
other layers. Hence there is a difficulty in distinguishing
between morphological holes (Fig. 9(a) B) and structural holes
of a crystal plane (Fig. 9(a) C).
By comparing the simulation data to PEEM data in Fig. 8 it
is possible to extract a symbolic representation of filling
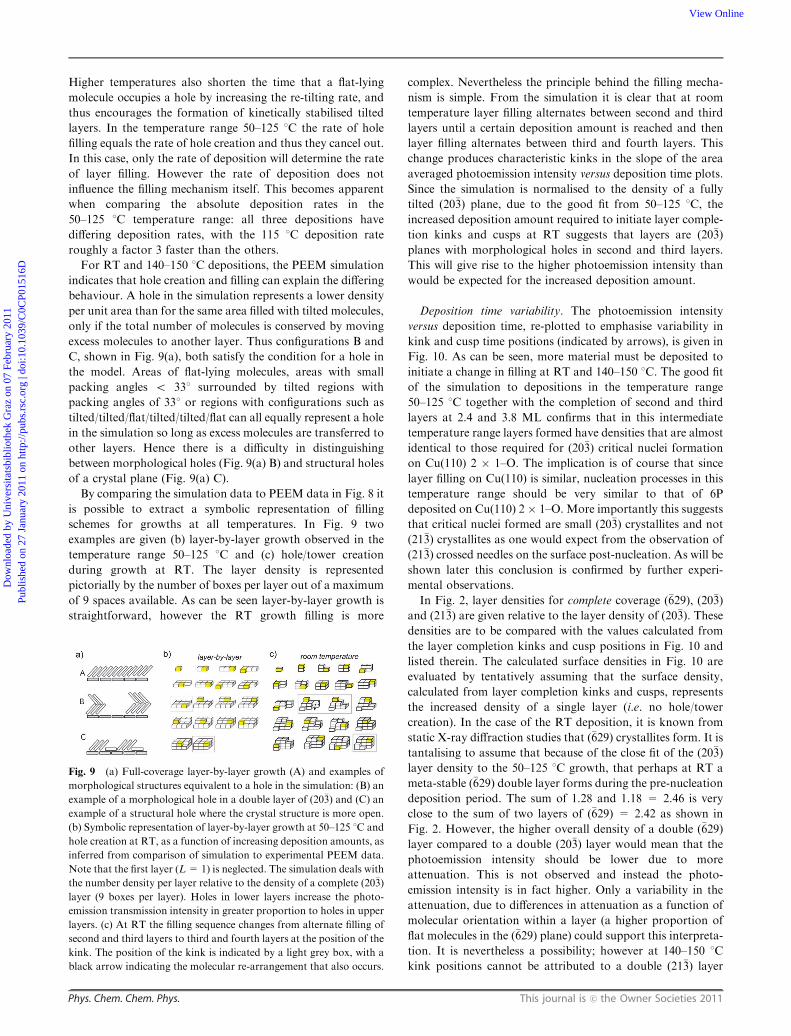
schemes for growths at all temperatures. In Fig. 9 two
examples are given (b) layer-by-layer growth observed in the
temperature range 50–125 1C and (c) hole/tower creation
during growth at RT. The layer density is represented
pictorially by the number of boxes per layer out of a maximum
of 9 spaces available. As can be seen layer-by-layer growth is
straightforward, however the RT growth filling is more
complex. Nevertheless the principle behind the filling mecha-
nism is simple. From the simulation it is clear that at room
temperature layer filling alternates between second and third
layers until a certain deposition amount is reached and then
layer filling alternates between third and fourth layers. This
change produces characteristic kinks in the slope of the area
averaged photoemission intensity versus deposition time plots.
Since the simulation is normalised to the density of a fully
tilted (20�3) plane, due to the good fit from 50–125 1C, the
increased deposition amount required to initiate layer comple-
tion kinks and cusps at RT suggests that layers are (20�3)
planes with morphological holes in second and third layers.
This will give rise to the higher photoemission intensity than
would be expected for the increased deposition amount.
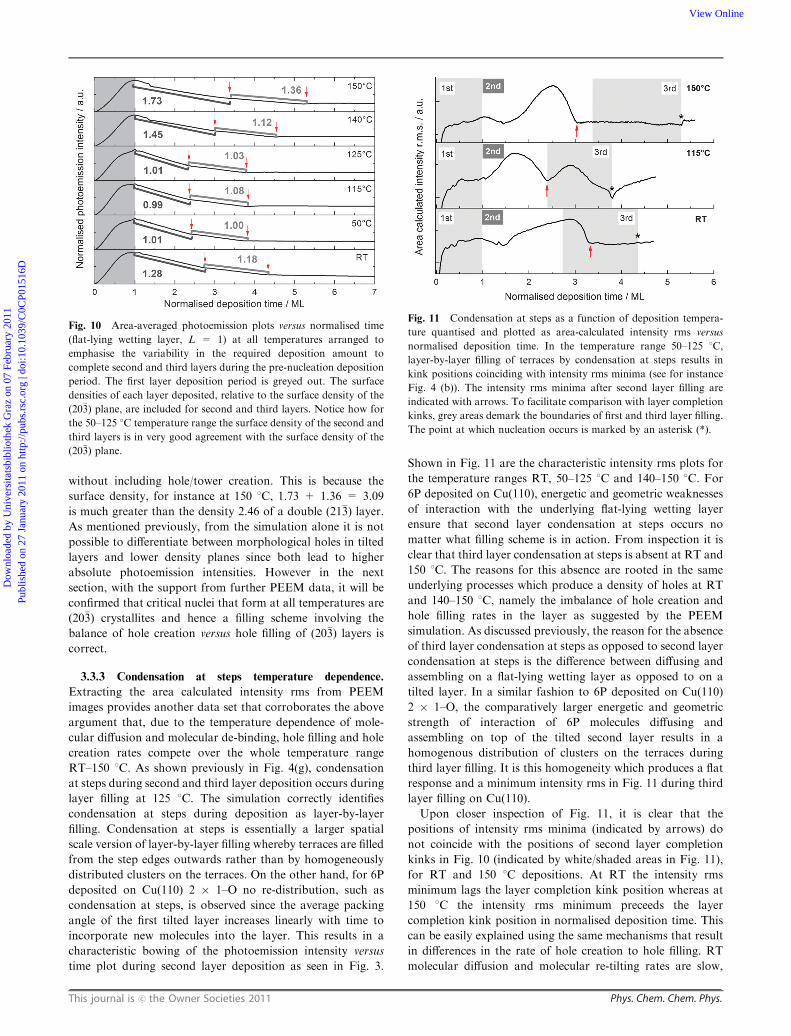
Deposition time variability. The photoemission intensity
versus deposition time, re-plotted to emphasise variability in
kink and cusp time positions (indicated by arrows), is given in
Fig. 10. As can be seen, more material must be deposited to
initiate a change in filling at RT and 140–150 1C. The good fit
of the simulation to depositions in the temperature range
50–125 1C together with the completion of second and third
layers at 2.4 and 3.8 ML confirms that in this intermediate
temperature range layers formed have densities that are almost
identical to those required for (20�3) critical nuclei formation
on Cu(110) 2 � 1–O. The implication is of course that since
layer filling on Cu(110) is similar, nucleation processes in this
temperature range should be very similar to that of 6P
deposited on Cu(110) 2� 1–O. More importantly this suggests
that critical nuclei formed are small (20�3) crystallites and not
(21�3) crystallites as one would expect from the observation of
(21�3) crossed needles on the surface post-nucleation. As will be
shown later this conclusion is confirmed by further experi-
mental observations.
In Fig. 2, layer densities for complete coverage (�629), (20�3)
and (21�3) are given relative to the layer density of (20�3). These
densities are to be compared with the values calculated from
the layer completion kinks and cusp positions in Fig. 10 and
listed therein. The calculated surface densities in Fig. 10 are
evaluated by tentatively assuming that the surface density,
calculated from layer completion kinks and cusps, represents
the increased density of a single layer (i.e. no hole/tower
creation). In the case of the RT deposition, it is known from
static X-ray diffraction studies that (�629) crystallites form. It is
tantalising to assume that because of the close fit of the (20�3)
layer density to the 50–125 1C growth, that perhaps at RT a
meta-stable (�629) double layer forms during the pre-nucleation
deposition period. The sum of 1.28 and 1.18 = 2.46 is very
close to the sum of two layers of (�629) = 2.42 as shown in
Fig. 2. However, the higher overall density of a double (�629)
layer compared to a double (20�3) layer would mean that the
photoemission intensity should be lower due to more
attenuation. This is not observed and instead the photo-
emission intensity is in fact higher. Only a variability in the
attenuation, due to differences in attenuation as a function of
molecular orientation within a layer (a higher proportion of
flat molecules in the (�629) plane) could support this interpreta-
tion. It is nevertheless a possibility; however at 140–150 1C
kink positions cannot be attributed to a double (21�3) layer
Fig. 9 (a) Full-coverage layer-by-layer growth (A) and examples of
morphological structures equivalent to a hole in the simulation: (B) an
example of a morphological hole in a double layer of (20�3) and (C) an
example of a structural hole where the crystal structure is more open.
(b) Symbolic representation of layer-by-layer growth at 50–125 1C and
hole creation at RT, as a function of increasing deposition amounts, as
inferred from comparison of simulation to experimental PEEM data.
Note that the first layer (L= 1) is neglected. The simulation deals with
the number density per layer relative to the density of a complete (20�3)
layer (9 boxes per layer). Holes in lower layers increase the photo-
emission transmission intensity in greater proportion to holes in upper
layers. (c) At RT the filling sequence changes from alternate filling of
second and third layers to third and fourth layers at the position of the
kink. The position of the kink is indicated by a light grey box, with a
black arrow indicating the molecular re-arrangement that also occurs.
Dow
nloa
ded
by U
nive
rsita
tsbi
blio
thek
Gra
z on
07
Febr
uary
201
1Pu
blis
hed
on 2
7 Ja
nuar
y 20
11 o
n ht
tp://
pubs
.rsc
.org
| do
i:10.
1039
/C0C
P015
16D
View Online
This journal is c the Owner Societies 2011 Phys. Chem. Chem. Phys.
without including hole/tower creation. This is because the
surface density, for instance at 150 1C, 1.73 + 1.36 = 3.09
is much greater than the density 2.46 of a double (21�3) layer.
As mentioned previously, from the simulation alone it is not
possible to differentiate between morphological holes in tilted
layers and lower density planes since both lead to higher
absolute photoemission intensities. However in the next
section, with the support from further PEEM data, it will be
confirmed that critical nuclei that form at all temperatures are
(20�3) crystallites and hence a filling scheme involving the
balance of hole creation versus hole filling of (20�3) layers is
correct.
3.3.3 Condensation at steps temperature dependence.
Extracting the area calculated intensity rms from PEEM
images provides another data set that corroborates the above
argument that, due to the temperature dependence of mole-
cular diffusion and molecular de-binding, hole filling and hole
creation rates compete over the whole temperature range
RT–150 1C. As shown previously in Fig. 4(g), condensation
at steps during second and third layer deposition occurs during
layer filling at 125 1C. The simulation correctly identifies
condensation at steps during deposition as layer-by-layer
filling. Condensation at steps is essentially a larger spatial
scale version of layer-by-layer filling whereby terraces are filled
from the step edges outwards rather than by homogeneously
distributed clusters on the terraces. On the other hand, for 6P
deposited on Cu(110) 2 � 1–O no re-distribution, such as
condensation at steps, is observed since the average packing
angle of the first tilted layer increases linearly with time to
incorporate new molecules into the layer. This results in a
characteristic bowing of the photoemission intensity versus
time plot during second layer deposition as seen in Fig. 3.
Shown in Fig. 11 are the characteristic intensity rms plots for
the temperature ranges RT, 50–125 1C and 140–150 1C. For
6P deposited on Cu(110), energetic and geometric weaknesses
of interaction with the underlying flat-lying wetting layer
ensure that second layer condensation at steps occurs no
matter what filling scheme is in action. From inspection it is
clear that third layer condensation at steps is absent at RT and
150 1C. The reasons for this absence are rooted in the same
underlying processes which produce a density of holes at RT
and 140–150 1C, namely the imbalance of hole creation and
hole filling rates in the layer as suggested by the PEEM
simulation. As discussed previously, the reason for the absence
of third layer condensation at steps as opposed to second layer
condensation at steps is the difference between diffusing and
assembling on a flat-lying wetting layer as opposed to on a
tilted layer. In a similar fashion to 6P deposited on Cu(110)
2 � 1–O, the comparatively larger energetic and geometric
strength of interaction of 6P molecules diffusing and
assembling on top of the tilted second layer results in a
homogenous distribution of clusters on the terraces during
third layer filling. It is this homogeneity which produces a flat
response and a minimum intensity rms in Fig. 11 during third
layer filling on Cu(110).
Upon closer inspection of Fig. 11, it is clear that the
positions of intensity rms minima (indicated by arrows) do
not coincide with the positions of second layer completion
kinks in Fig. 10 (indicated by white/shaded areas in Fig. 11),
for RT and 150 1C depositions. At RT the intensity rms
minimum lags the layer completion kink position whereas at
150 1C the intensity rms minimum preceeds the layer
completion kink position in normalised deposition time. This
can be easily explained using the same mechanisms that result
in differences in the rate of hole creation to hole filling. RT
molecular diffusion and molecular re-tilting rates are slow,
Fig. 10 Area-averaged photoemission plots versus normalised time
(flat-lying wetting layer, L = 1) at all temperatures arranged to
emphasise the variability in the required deposition amount to
complete second and third layers during the pre-nucleation deposition
period. The first layer deposition period is greyed out. The surface
densities of each layer deposited, relative to the surface density of the
(20�3) plane, are included for second and third layers. Notice how for
the 50–125 1C temperature range the surface density of the second and
third layers is in very good agreement with the surface density of the
(20�3) plane.
Fig. 11 Condensation at steps as a function of deposition tempera-
ture quantised and plotted as area-calculated intensity rms versus
normalised deposition time. In the temperature range 50–125 1C,
layer-by-layer filling of terraces by condensation at steps results in
kink positions coinciding with intensity rms minima (see for instance
Fig. 4 (b)). The intensity rms minima after second layer filling are
indicated with arrows. To facilitate comparison with layer completion
kinks, grey areas demark the boundaries of first and third layer filling.
The point at which nucleation occurs is marked by an asterisk (*).
Dow
nloa
ded
by U
nive
rsita
tsbi
blio
thek
Gra
z on
07
Febr
uary
201
1Pu
blis
hed
on 2
7 Ja
nuar
y 20
11 o
n ht
tp://
pubs
.rsc
.org
| do
i:10.
1039
/C0C
P015
16D
View Online
Phys. Chem. Chem. Phys. This journal is c the Owner Societies 2011
therefore second layer inhomogeneities introduced by the
random arrival of molecules from the evaporator do not
anneal out; hence these inhomogeneous features persist for a
while during third layer deposition. On the other hand, at
150 1C molecular diffusion, hole creation and re-tilting rates
are much faster. These three processes combine to prevent any
significant condensation at steps from growing to a large size.
Thus any condensation at steps is quickly broken up into
smaller clusters that are homogenously distributed on the
terrace. The observation that condensation at steps is
temperature dependent is further confirmation that the
temperature dependence of PEEM photoemission intensity
data in Fig. 6 and 7(b) is real and that layer filling mechanisms
described, and hence the conclusions drawn from the PEEM
simulation, are in fact correct.
3.3.4 Dewetting induced second and third meta-stable layer
re-construction. The nucleation of 6P to form energetically
stable crossed needles, as seen in Fig. 1(a), initiates
spontaneous dewetting of molecules from areas surrounding
nucleation sites that are readily observable by PEEM. Shown
in Fig. 5(a) are highly anisotropic dewetting streaks that lie at
either side of nuclei in the [110] direction. From PEEM and
LEED measurements it is known that the final structure of 6P
deposited on Cu(110) has a flat-lying wetting layer, a single
reconstructed layer on top and 6P crossed (21�3) needles
distributed over the reconstructed layer. This means that the
tilted meta-stable double layer (second and third layers), which
from measured densities are (20�3) type layers, must re-arrange
upon dewetting to form a single reconstructed layer. In order
to investigate this several techniques such as static STM and
dynamic PEEM are employed.
The main question that must be answered is how crossed
(21�3) needles grow from the nucleation of 6P arranged in (20�3)
type layers? When 6P is deposited on Cu(110) 2 � 1–O, a (20�3)
layer nucleates to produce straight (20�3) needles (see
Fig. 1(b)). However, when 6P is deposited on Cu(110) crossed
needles with a characteristic angle of 201 are observed
(see Fig. 1(a)). This angle corresponds to the top-view of
two needles of the (21�3) plane intersecting (these are crossed
needles, see angle in Fig. 2). So how does the switch over
occurs, and what role does the dewetting and subsequent
reconstruction of the meta-stable (20�3) double layer play in
deciding the final crystal structure of the 6P nanostructures?
As will be shown the answer lies in the flat-lying wetting layer,
which till now has only played a minor role in for instance
facilitating condensation at steps during second layer filling.
STM of dewetting induced reconstruction. During layer
filling in the pre-nucleation deposition period, two kinetically
stabilised layers of tilted molecules form that according to the
PEEM simulation are in a (20�3) arrangement. At RT and
140–150 1C these layers are not perfect since there are holes in
the layers which get temporarily filled by flat-lying molecules
and excess molecules diffuse in dilute fourth, fifth layers. The
key point is that the general (20�3) orientation describes the
densest configuration (by volume) possible for 6P molecules to
assemble in and yet remain lying-down and aligned in the [1�10]
direction. As can be seen from the highly anisotropic
dewetting streaks, molecules in the meta-stable double layer
are aligned when nucleation occurs. However upon
nucleation, molecules diffuse quickly to nuclei and hence
reduce the surface density of molecules in regions surrounding
nuclei. This reduction in surface density reduces the kinetic
stabilisation of the meta-stable double layer (fewer collisions
and attachments) and thus the double (20�3) layer relaxes into a
more energetically stable structure. This structure is a single
reconstructed layer with a combination of flat-lying and titled
molecules that is similar, but not identical, to the (21�3) or (�629)
crystal plane.
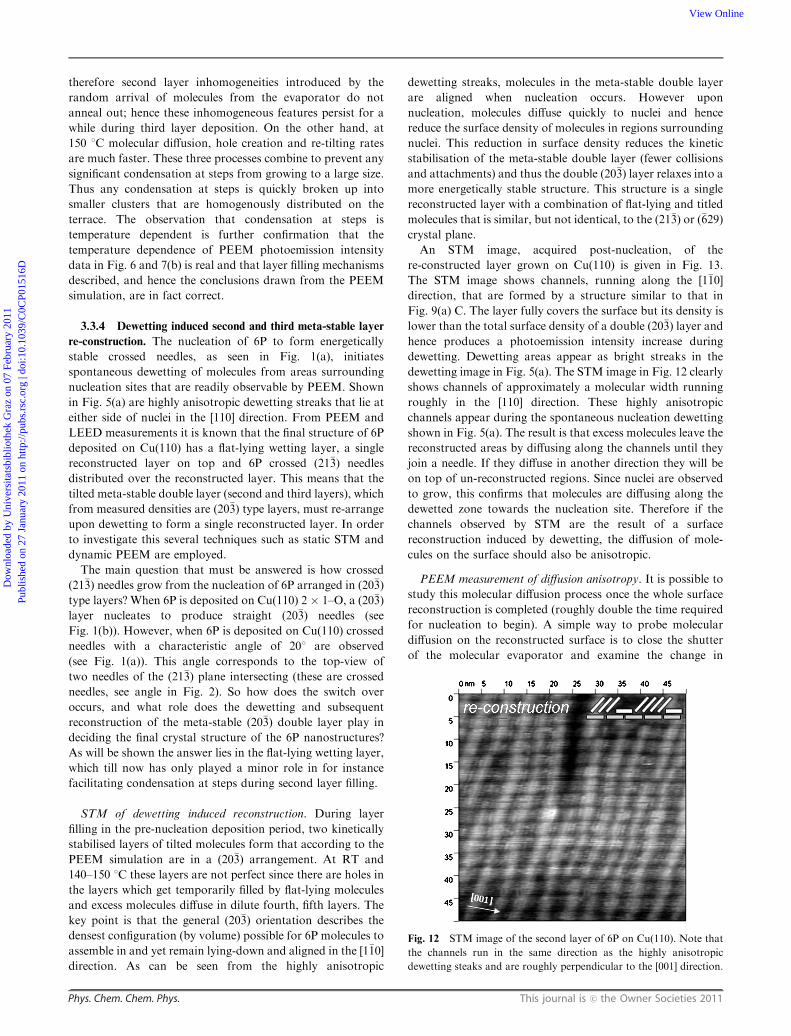
An STM image, acquired post-nucleation, of the
re-constructed layer grown on Cu(110) is given in Fig. 13.
The STM image shows channels, running along the [1�10]
direction, that are formed by a structure similar to that in
Fig. 9(a) C. The layer fully covers the surface but its density is
lower than the total surface density of a double (20�3) layer and
hence produces a photoemission intensity increase during
dewetting. Dewetting areas appear as bright streaks in the
dewetting image in Fig. 5(a). The STM image in Fig. 12 clearly
shows channels of approximately a molecular width running
roughly in the [110] direction. These highly anisotropic
channels appear during the spontaneous nucleation dewetting
shown in Fig. 5(a). The result is that excess molecules leave the
reconstructed areas by diffusing along the channels until they
join a needle. If they diffuse in another direction they will be
on top of un-reconstructed regions. Since nuclei are observed
to grow, this confirms that molecules are diffusing along the
dewetted zone towards the nucleation site. Therefore if the
channels observed by STM are the result of a surface
reconstruction induced by dewetting, the diffusion of mole-
cules on the surface should also be anisotropic.
PEEM measurement of diffusion anisotropy. It is possible to
study this molecular diffusion process once the whole surface
reconstruction is completed (roughly double the time required
for nucleation to begin). A simple way to probe molecular
diffusion on the reconstructed surface is to close the shutter
of the molecular evaporator and examine the change in
Fig. 12 STM image of the second layer of 6P on Cu(110). Note that
the channels run in the same direction as the highly anisotropic
dewetting steaks and are roughly perpendicular to the [001] direction.
Dow
nloa
ded
by U
nive
rsita
tsbi
blio
thek
Gra
z on
07
Febr
uary
201
1Pu
blis
hed
on 2
7 Ja
nuar
y 20
11 o
n ht
tp://
pubs
.rsc
.org
| do
i:10.
1039
/C0C
P015
16D
View Online
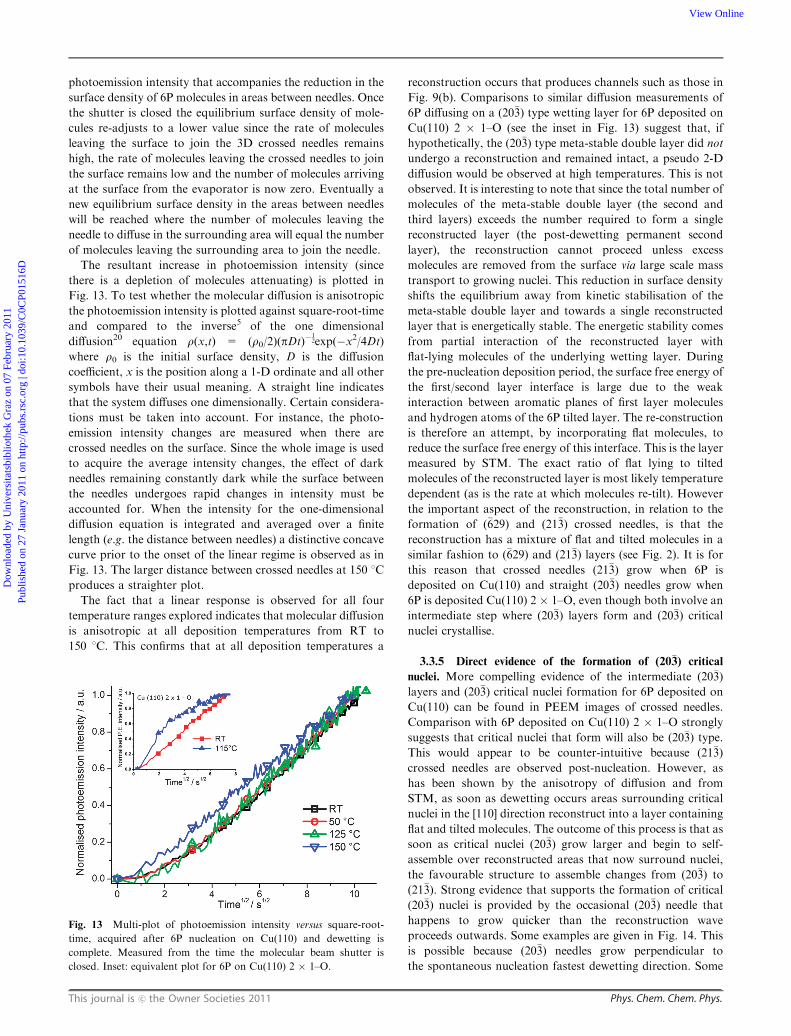
This journal is c the Owner Societies 2011 Phys. Chem. Chem. Phys.
photoemission intensity that accompanies the reduction in the
surface density of 6P molecules in areas between needles. Once
the shutter is closed the equilibrium surface density of mole-
cules re-adjusts to a lower value since the rate of molecules
leaving the surface to join the 3D crossed needles remains
high, the rate of molecules leaving the crossed needles to join
the surface remains low and the number of molecules arriving
at the surface from the evaporator is now zero. Eventually a
new equilibrium surface density in the areas between needles
will be reached where the number of molecules leaving the
needle to diffuse in the surrounding area will equal the number
of molecules leaving the surrounding area to join the needle.
The resultant increase in photoemission intensity (since
there is a depletion of molecules attenuating) is plotted in
Fig. 13. To test whether the molecular diffusion is anisotropic
the photoemission intensity is plotted against square-root-time
and compared to the inverse5 of the one dimensional
diffusion20 equation r(x,t) = (r0/2)(pDt)�12exp(�x2/4Dt)
where r0 is the initial surface density, D is the diffusion
coefficient, x is the position along a 1-D ordinate and all other
symbols have their usual meaning. A straight line indicates
that the system diffuses one dimensionally. Certain considera-
tions must be taken into account. For instance, the photo-
emission intensity changes are measured when there are
crossed needles on the surface. Since the whole image is used
to acquire the average intensity changes, the effect of dark
needles remaining constantly dark while the surface between
the needles undergoes rapid changes in intensity must be
accounted for. When the intensity for the one-dimensional
diffusion equation is integrated and averaged over a finite
length (e.g. the distance between needles) a distinctive concave
curve prior to the onset of the linear regime is observed as in
Fig. 13. The larger distance between crossed needles at 150 1C
produces a straighter plot.
The fact that a linear response is observed for all four
temperature ranges explored indicates that molecular diffusion
is anisotropic at all deposition temperatures from RT to
150 1C. This confirms that at all deposition temperatures a
reconstruction occurs that produces channels such as those in
Fig. 9(b). Comparisons to similar diffusion measurements of
6P diffusing on a (20�3) type wetting layer for 6P deposited on
Cu(110) 2 � 1–O (see the inset in Fig. 13) suggest that, if
hypothetically, the (20�3) type meta-stable double layer did not
undergo a reconstruction and remained intact, a pseudo 2-D
diffusion would be observed at high temperatures. This is not
observed. It is interesting to note that since the total number of
molecules of the meta-stable double layer (the second and
third layers) exceeds the number required to form a single
reconstructed layer (the post-dewetting permanent second
layer), the reconstruction cannot proceed unless excess
molecules are removed from the surface via large scale mass
transport to growing nuclei. This reduction in surface density
shifts the equilibrium away from kinetic stabilisation of the
meta-stable double layer and towards a single reconstructed
layer that is energetically stable. The energetic stability comes
from partial interaction of the reconstructed layer with
flat-lying molecules of the underlying wetting layer. During
the pre-nucleation deposition period, the surface free energy of
the first/second layer interface is large due to the weak
interaction between aromatic planes of first layer molecules
and hydrogen atoms of the 6P tilted layer. The re-construction
is therefore an attempt, by incorporating flat molecules, to
reduce the surface free energy of this interface. This is the layer
measured by STM. The exact ratio of flat lying to tilted
molecules of the reconstructed layer is most likely temperature
dependent (as is the rate at which molecules re-tilt). However
the important aspect of the reconstruction, in relation to the
formation of (�629) and (21�3) crossed needles, is that the
reconstruction has a mixture of flat and tilted molecules in a
similar fashion to (�629) and (21�3) layers (see Fig. 2). It is for
this reason that crossed needles (21�3) grow when 6P is
deposited on Cu(110) and straight (20�3) needles grow when
6P is deposited Cu(110) 2 � 1–O, even though both involve an
intermediate step where (20�3) layers form and (20�3) critical
nuclei crystallise.
3.3.5 Direct evidence of the formation of (20�3) critical
nuclei. More compelling evidence of the intermediate (20�3)
layers and (20�3) critical nuclei formation for 6P deposited on
Cu(110) can be found in PEEM images of crossed needles.
Comparison with 6P deposited on Cu(110) 2 � 1–O strongly
suggests that critical nuclei that form will also be (20�3) type.
This would appear to be counter-intuitive because (21�3)
crossed needles are observed post-nucleation. However, as
has been shown by the anisotropy of diffusion and from
STM, as soon as dewetting occurs areas surrounding critical
nuclei in the [110] direction reconstruct into a layer containing
flat and tilted molecules. The outcome of this process is that as
soon as critical nuclei (20�3) grow larger and begin to self-
assemble over reconstructed areas that now surround nuclei,
the favourable structure to assemble changes from (20�3) to
(21�3). Strong evidence that supports the formation of critical
(20�3) nuclei is provided by the occasional (20�3) needle that
happens to grow quicker than the reconstruction wave
proceeds outwards. Some examples are given in Fig. 14. This
is possible because (20�3) needles grow perpendicular to
the spontaneous nucleation fastest dewetting direction. Some
Fig. 13 Multi-plot of photoemission intensity versus square-root-
time, acquired after 6P nucleation on Cu(110) and dewetting is
complete. Measured from the time the molecular beam shutter is
closed. Inset: equivalent plot for 6P on Cu(110) 2 � 1–O.
Dow
nloa
ded
by U
nive
rsita
tsbi
blio
thek
Gra
z on
07
Febr
uary
201
1Pu
blis
hed
on 2
7 Ja
nuar
y 20
11 o
n ht
tp://
pubs
.rsc
.org
| do
i:10.
1039
/C0C
P015
16D
View Online
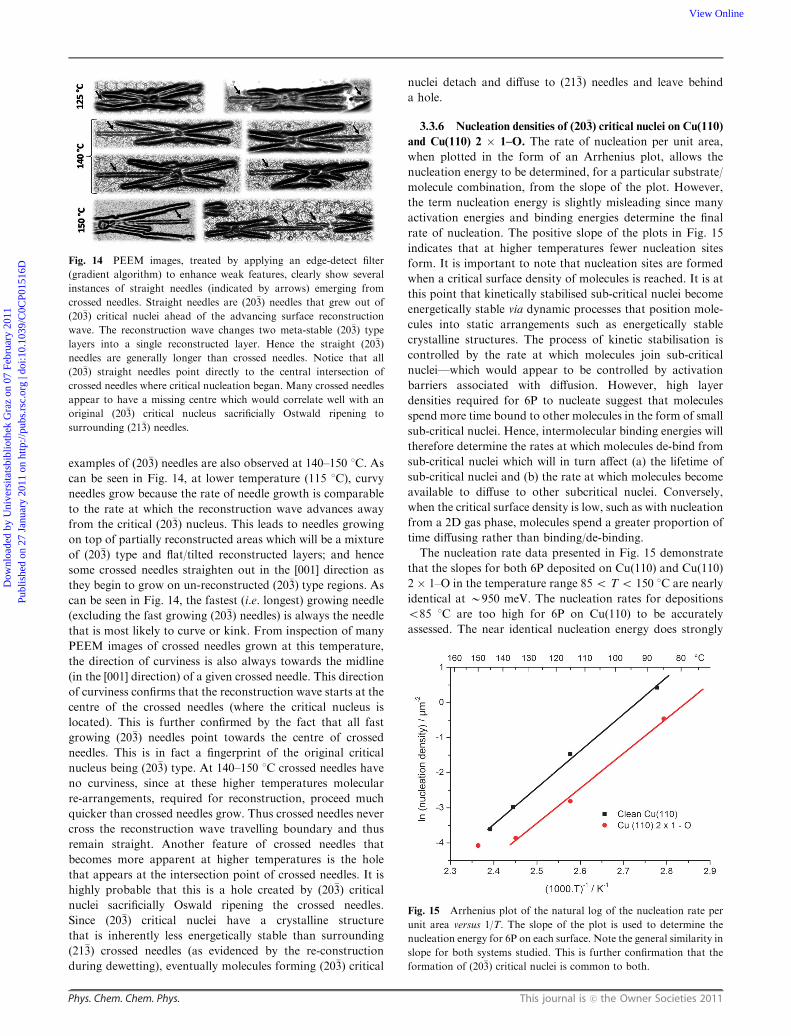
Phys. Chem. Chem. Phys. This journal is c the Owner Societies 2011
examples of (20�3) needles are also observed at 140–150 1C. As
can be seen in Fig. 14, at lower temperature (115 1C), curvy
needles grow because the rate of needle growth is comparable
to the rate at which the reconstruction wave advances away
from the critical (20�3) nucleus. This leads to needles growing
on top of partially reconstructed areas which will be a mixture
of (20�3) type and flat/tilted reconstructed layers; and hence
some crossed needles straighten out in the [001] direction as
they begin to grow on un-reconstructed (20�3) type regions. As
can be seen in Fig. 14, the fastest (i.e. longest) growing needle
(excluding the fast growing (20�3) needles) is always the needle
that is most likely to curve or kink. From inspection of many
PEEM images of crossed needles grown at this temperature,
the direction of curviness is also always towards the midline
(in the [001] direction) of a given crossed needle. This direction
of curviness confirms that the reconstruction wave starts at the
centre of the crossed needles (where the critical nucleus is
located). This is further confirmed by the fact that all fast
growing (20�3) needles point towards the centre of crossed
needles. This is in fact a fingerprint of the original critical
nucleus being (20�3) type. At 140–150 1C crossed needles have
no curviness, since at these higher temperatures molecular
re-arrangements, required for reconstruction, proceed much
quicker than crossed needles grow. Thus crossed needles never
cross the reconstruction wave travelling boundary and thus
remain straight. Another feature of crossed needles that
becomes more apparent at higher temperatures is the hole
that appears at the intersection point of crossed needles. It is
highly probable that this is a hole created by (20�3) critical
nuclei sacrificially Oswald ripening the crossed needles.
Since (20�3) critical nuclei have a crystalline structure
that is inherently less energetically stable than surrounding
(21�3) crossed needles (as evidenced by the re-construction
during dewetting), eventually molecules forming (20�3) critical
nuclei detach and diffuse to (21�3) needles and leave behind
a hole.
3.3.6 Nucleation densities of (20�3) critical nuclei on Cu(110)
and Cu(110) 2 � 1–O. The rate of nucleation per unit area,
when plotted in the form of an Arrhenius plot, allows the
nucleation energy to be determined, for a particular substrate/
molecule combination, from the slope of the plot. However,
the term nucleation energy is slightly misleading since many
activation energies and binding energies determine the final
rate of nucleation. The positive slope of the plots in Fig. 15
indicates that at higher temperatures fewer nucleation sites
form. It is important to note that nucleation sites are formed
when a critical surface density of molecules is reached. It is at
this point that kinetically stabilised sub-critical nuclei become
energetically stable via dynamic processes that position mole-
cules into static arrangements such as energetically stable
crystalline structures. The process of kinetic stabilisation is
controlled by the rate at which molecules join sub-critical
nuclei—which would appear to be controlled by activation
barriers associated with diffusion. However, high layer
densities required for 6P to nucleate suggest that molecules
spend more time bound to other molecules in the form of small
sub-critical nuclei. Hence, intermolecular binding energies will
therefore determine the rates at which molecules de-bind from
sub-critical nuclei which will in turn affect (a) the lifetime of
sub-critical nuclei and (b) the rate at which molecules become
available to diffuse to other subcritical nuclei. Conversely,
when the critical surface density is low, such as with nucleation
from a 2D gas phase, molecules spend a greater proportion of
time diffusing rather than binding/de-binding.
The nucleation rate data presented in Fig. 15 demonstrate
that the slopes for both 6P deposited on Cu(110) and Cu(110)
2 � 1–O in the temperature range 85 o T o 150 1C are nearly
identical at B950 meV. The nucleation rates for depositions
o85 1C are too high for 6P on Cu(110) to be accurately
assessed. The near identical nucleation energy does strongly
Fig. 14 PEEM images, treated by applying an edge-detect filter
(gradient algorithm) to enhance weak features, clearly show several
instances of straight needles (indicated by arrows) emerging from
crossed needles. Straight needles are (20�3) needles that grew out of
(20�3) critical nuclei ahead of the advancing surface reconstruction
wave. The reconstruction wave changes two meta-stable (20�3) type
layers into a single reconstructed layer. Hence the straight (20�3)
needles are generally longer than crossed needles. Notice that all
(20�3) straight needles point directly to the central intersection of
crossed needles where critical nucleation began. Many crossed needles
appear to have a missing centre which would correlate well with an
original (20�3) critical nucleus sacrificially Ostwald ripening to
surrounding (21�3) needles.
Fig. 15 Arrhenius plot of the natural log of the nucleation rate per
unit area versus 1/T. The slope of the plot is used to determine the
nucleation energy for 6P on each surface. Note the general similarity in
slope for both systems studied. This is further confirmation that the
formation of (20�3) critical nuclei is common to both.
Dow
nloa
ded
by U
nive
rsita
tsbi
blio
thek
Gra
z on
07
Febr
uary
201
1Pu
blis
hed
on 2
7 Ja
nuar
y 20
11 o
n ht
tp://
pubs
.rsc
.org
| do
i:10.
1039
/C0C
P015
16D
View Online
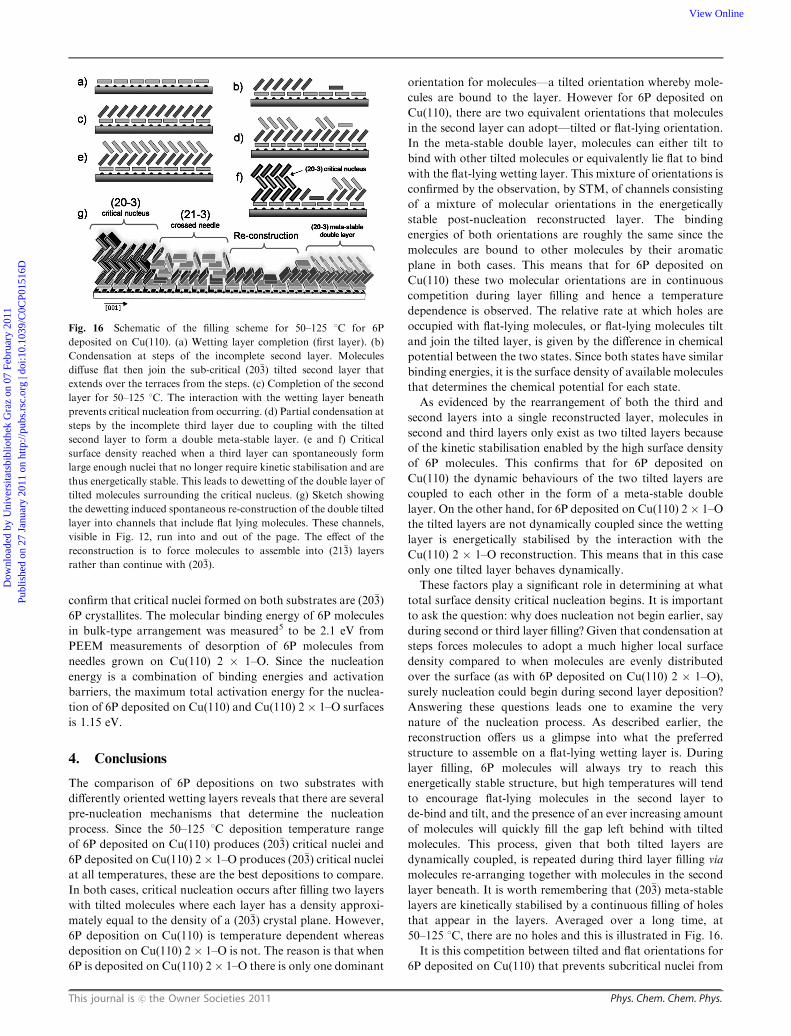
This journal is c the Owner Societies 2011 Phys. Chem. Chem. Phys.
confirm that critical nuclei formed on both substrates are (20�3)
6P crystallites. The molecular binding energy of 6P molecules
in bulk-type arrangement was measured5 to be 2.1 eV from
PEEM measurements of desorption of 6P molecules from
needles grown on Cu(110) 2 � 1–O. Since the nucleation
energy is a combination of binding energies and activation
barriers, the maximum total activation energy for the nuclea-
tion of 6P deposited on Cu(110) and Cu(110) 2 � 1–O surfaces
is 1.15 eV.
4. Conclusions
The comparison of 6P depositions on two substrates with
differently oriented wetting layers reveals that there are several
pre-nucleation mechanisms that determine the nucleation
process. Since the 50–125 1C deposition temperature range
of 6P deposited on Cu(110) produces (20�3) critical nuclei and
6P deposited on Cu(110) 2� 1–O produces (20�3) critical nuclei
at all temperatures, these are the best depositions to compare.
In both cases, critical nucleation occurs after filling two layers
with tilted molecules where each layer has a density approxi-
mately equal to the density of a (20�3) crystal plane. However,
6P deposition on Cu(110) is temperature dependent whereas
deposition on Cu(110) 2 � 1–O is not. The reason is that when
6P is deposited on Cu(110) 2� 1–O there is only one dominant
orientation for molecules—a tilted orientation whereby mole-
cules are bound to the layer. However for 6P deposited on
Cu(110), there are two equivalent orientations that molecules
in the second layer can adopt—tilted or flat-lying orientation.
In the meta-stable double layer, molecules can either tilt to
bind with other tilted molecules or equivalently lie flat to bind
with the flat-lying wetting layer. This mixture of orientations is
confirmed by the observation, by STM, of channels consisting
of a mixture of molecular orientations in the energetically
stable post-nucleation reconstructed layer. The binding
energies of both orientations are roughly the same since the
molecules are bound to other molecules by their aromatic
plane in both cases. This means that for 6P deposited on
Cu(110) these two molecular orientations are in continuous
competition during layer filling and hence a temperature
dependence is observed. The relative rate at which holes are
occupied with flat-lying molecules, or flat-lying molecules tilt
and join the tilted layer, is given by the difference in chemical
potential between the two states. Since both states have similar
binding energies, it is the surface density of available molecules
that determines the chemical potential for each state.
As evidenced by the rearrangement of both the third and
second layers into a single reconstructed layer, molecules in
second and third layers only exist as two tilted layers because
of the kinetic stabilisation enabled by the high surface density
of 6P molecules. This confirms that for 6P deposited on
Cu(110) the dynamic behaviours of the two tilted layers are
coupled to each other in the form of a meta-stable double
layer. On the other hand, for 6P deposited on Cu(110) 2� 1–O
the tilted layers are not dynamically coupled since the wetting
layer is energetically stabilised by the interaction with the
Cu(110) 2 � 1–O reconstruction. This means that in this case
only one tilted layer behaves dynamically.
These factors play a significant role in determining at what
total surface density critical nucleation begins. It is important
to ask the question: why does nucleation not begin earlier, say
during second or third layer filling? Given that condensation at
steps forces molecules to adopt a much higher local surface
density compared to when molecules are evenly distributed
over the surface (as with 6P deposited on Cu(110) 2 � 1–O),
surely nucleation could begin during second layer deposition?
Answering these questions leads one to examine the very
nature of the nucleation process. As described earlier, the
reconstruction offers us a glimpse into what the preferred
structure to assemble on a flat-lying wetting layer is. During
layer filling, 6P molecules will always try to reach this
energetically stable structure, but high temperatures will tend
to encourage flat-lying molecules in the second layer to
de-bind and tilt, and the presence of an ever increasing amount
of molecules will quickly fill the gap left behind with tilted
molecules. This process, given that both tilted layers are
dynamically coupled, is repeated during third layer filling via
molecules re-arranging together with molecules in the second
layer beneath. It is worth remembering that (20�3) meta-stable
layers are kinetically stabilised by a continuous filling of holes
that appear in the layers. Averaged over a long time, at
50–125 1C, there are no holes and this is illustrated in Fig. 16.
It is this competition between tilted and flat orientations for
6P deposited on Cu(110) that prevents subcritical nuclei from
Fig. 16 Schematic of the filling scheme for 50–125 1C for 6P
deposited on Cu(110). (a) Wetting layer completion (first layer). (b)
Condensation at steps of the incomplete second layer. Molecules
diffuse flat then join the sub-critical (20�3) tilted second layer that
extends over the terraces from the steps. (c) Completion of the second
layer for 50–125 1C. The interaction with the wetting layer beneath
prevents critical nucleation from occurring. (d) Partial condensation at
steps by the incomplete third layer due to coupling with the tilted
second layer to form a double meta-stable layer. (e and f) Critical
surface density reached when a third layer can spontaneously form
large enough nuclei that no longer require kinetic stabilisation and are
thus energetically stable. This leads to dewetting of the double layer of
tilted molecules surrounding the critical nucleus. (g) Sketch showing
the dewetting induced spontaneous re-construction of the double tilted
layer into channels that include flat lying molecules. These channels,
visible in Fig. 12, run into and out of the page. The effect of the
reconstruction is to force molecules to assemble into (21�3) layers
rather than continue with (20�3).
Dow
nloa
ded
by U
nive
rsita
tsbi
blio
thek
Gra
z on
07
Febr
uary
201
1Pu
blis
hed
on 2
7 Ja
nuar
y 20
11 o
n ht
tp://
pubs
.rsc
.org
| do
i:10.
1039
/C0C
P015
16D
View Online
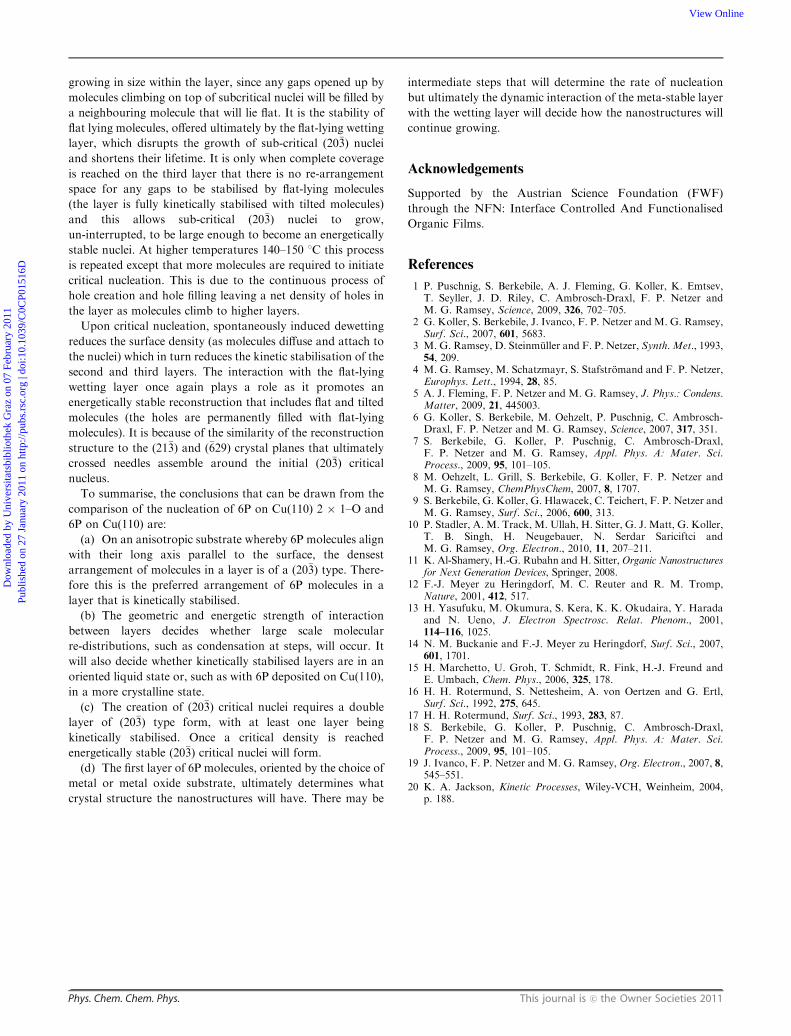
Phys. Chem. Chem. Phys. This journal is c the Owner Societies 2011
growing in size within the layer, since any gaps opened up by
molecules climbing on top of subcritical nuclei will be filled by
a neighbouring molecule that will lie flat. It is the stability of
flat lying molecules, offered ultimately by the flat-lying wetting
layer, which disrupts the growth of sub-critical (20�3) nuclei
and shortens their lifetime. It is only when complete coverage
is reached on the third layer that there is no re-arrangement
space for any gaps to be stabilised by flat-lying molecules
(the layer is fully kinetically stabilised with tilted molecules)
and this allows sub-critical (20�3) nuclei to grow,
un-interrupted, to be large enough to become an energetically
stable nuclei. At higher temperatures 140–150 1C this process
is repeated except that more molecules are required to initiate
critical nucleation. This is due to the continuous process of
hole creation and hole filling leaving a net density of holes in
the layer as molecules climb to higher layers.
Upon critical nucleation, spontaneously induced dewetting
reduces the surface density (as molecules diffuse and attach to
the nuclei) which in turn reduces the kinetic stabilisation of the
second and third layers. The interaction with the flat-lying
wetting layer once again plays a role as it promotes an
energetically stable reconstruction that includes flat and tilted
molecules (the holes are permanently filled with flat-lying
molecules). It is because of the similarity of the reconstruction
structure to the (21�3) and (�629) crystal planes that ultimately
crossed needles assemble around the initial (20�3) critical
nucleus.
To summarise, the conclusions that can be drawn from the
comparison of the nucleation of 6P on Cu(110) 2 � 1–O and
6P on Cu(110) are:
(a) On an anisotropic substrate whereby 6P molecules align
with their long axis parallel to the surface, the densest
arrangement of molecules in a layer is of a (20�3) type. There-
fore this is the preferred arrangement of 6P molecules in a
layer that is kinetically stabilised.
(b) The geometric and energetic strength of interaction
between layers decides whether large scale molecular
re-distributions, such as condensation at steps, will occur. It
will also decide whether kinetically stabilised layers are in an
oriented liquid state or, such as with 6P deposited on Cu(110),
in a more crystalline state.
(c) The creation of (20�3) critical nuclei requires a double
layer of (20�3) type form, with at least one layer being
kinetically stabilised. Once a critical density is reached
energetically stable (20�3) critical nuclei will form.
(d) The first layer of 6P molecules, oriented by the choice of
metal or metal oxide substrate, ultimately determines what
crystal structure the nanostructures will have. There may be
intermediate steps that will determine the rate of nucleation
but ultimately the dynamic interaction of the meta-stable layer
with the wetting layer will decide how the nanostructures will
continue growing.
Acknowledgements
Supported by the Austrian Science Foundation (FWF)
through the NFN: Interface Controlled And Functionalised
Organic Films.
References
1 P. Puschnig, S. Berkebile, A. J. Fleming, G. Koller, K. Emtsev,T. Seyller, J. D. Riley, C. Ambrosch-Draxl, F. P. Netzer andM. G. Ramsey, Science, 2009, 326, 702–705.
2 G. Koller, S. Berkebile, J. Ivanco, F. P. Netzer and M. G. Ramsey,Surf. Sci., 2007, 601, 5683.
3 M. G. Ramsey, D. Steinmuller and F. P. Netzer, Synth. Met., 1993,54, 209.
4 M. G. Ramsey, M. Schatzmayr, S. Stafstromand and F. P. Netzer,Europhys. Lett., 1994, 28, 85.
5 A. J. Fleming, F. P. Netzer and M. G. Ramsey, J. Phys.: Condens.Matter, 2009, 21, 445003.
6 G. Koller, S. Berkebile, M. Oehzelt, P. Puschnig, C. Ambrosch-Draxl, F. P. Netzer and M. G. Ramsey, Science, 2007, 317, 351.
7 S. Berkebile, G. Koller, P. Puschnig, C. Ambrosch-Draxl,F. P. Netzer and M. G. Ramsey, Appl. Phys. A: Mater. Sci.Process., 2009, 95, 101–105.
8 M. Oehzelt, L. Grill, S. Berkebile, G. Koller, F. P. Netzer andM. G. Ramsey, ChemPhysChem, 2007, 8, 1707.
9 S. Berkebile, G. Koller, G. Hlawacek, C. Teichert, F. P. Netzer andM. G. Ramsey, Surf. Sci., 2006, 600, 313.
10 P. Stadler, A. M. Track, M. Ullah, H. Sitter, G. J. Matt, G. Koller,T. B. Singh, H. Neugebauer, N. Serdar Sariciftci andM. G. Ramsey, Org. Electron., 2010, 11, 207–211.
11 K. Al-Shamery, H.-G. Rubahn and H. Sitter,Organic Nanostructuresfor Next Generation Devices, Springer, 2008.
12 F.-J. Meyer zu Heringdorf, M. C. Reuter and R. M. Tromp,Nature, 2001, 412, 517.
13 H. Yasufuku, M. Okumura, S. Kera, K. K. Okudaira, Y. Haradaand N. Ueno, J. Electron Spectrosc. Relat. Phenom., 2001,114–116, 1025.
14 N. M. Buckanie and F.-J. Meyer zu Heringdorf, Surf. Sci., 2007,601, 1701.
15 H. Marchetto, U. Groh, T. Schmidt, R. Fink, H.-J. Freund andE. Umbach, Chem. Phys., 2006, 325, 178.
16 H. H. Rotermund, S. Nettesheim, A. von Oertzen and G. Ertl,Surf. Sci., 1992, 275, 645.
17 H. H. Rotermund, Surf. Sci., 1993, 283, 87.18 S. Berkebile, G. Koller, P. Puschnig, C. Ambrosch-Draxl,
F. P. Netzer and M. G. Ramsey, Appl. Phys. A: Mater. Sci.Process., 2009, 95, 101–105.
19 J. Ivanco, F. P. Netzer and M. G. Ramsey, Org. Electron., 2007, 8,545–551.
20 K. A. Jackson, Kinetic Processes, Wiley-VCH, Weinheim, 2004,p. 188.
Dow
nloa
ded
by U
nive
rsita
tsbi
blio
thek
Gra
z on
07
Febr
uary
201
1Pu
blis
hed
on 2
7 Ja
nuar
y 20
11 o
n ht
tp://
pubs
.rsc
.org
| do
i:10.
1039
/C0C
P015
16D
View Online