pcap2016 - cmec · 2018-04-30 · pan-canadian assessment program pcap 2016 report on the...
TRANSCRIPT

Pan-Canadian Assessment Program
PCAP 2016Report on the Pan-Canadian Assessment of
Reading, Mathematics, and Science

Pan-Canadian Assessment Program
PCAP 2016Report on the Pan-Canadian Assessment of
Reading, Mathematics, and Science
Authors
Kathryn O’Grady, Council of Ministers of Education, CanadaKaren Fung, Council of Ministers of Education, Canada
Laura Servage, ThirdSpace Research and ConsultingGulam Khan, Council of Ministers of Education, Canada

The Council of Ministers of Education, Canada (CMEC) was formed in 1967 by the jurisdictional ministers responsible for education to provide a forum in which they could discuss matters of mutual interest, undertake educational initiatives cooperatively, and represent the interests of the provinces and territories with national educational organizations, the federal government, foreign governments, and international organizations. CMEC is the national voice for education in Canada and, through CMEC, the provinces and territories work collectively on common objectives in a broad range of activities at the elementary, secondary, and postsecondary levels.
Through the CMEC Secretariat, the Council serves as the organization in which ministries and departments of education undertake cooperatively the activities, projects, and initiatives of particular interest to all jurisdictions. One of the activities on which they cooperate is the development and implementation of pan-Canadian testing based on contemporary research and best practices in the assessment of student achievement in core subjects.
Council of Ministers of Education, Canada95 St. Clair West, Suite 1106Toronto, Ontario M4V 1N6
Telephone: (416) 962-8100Fax: (416) 962-2800E-mail: [email protected]© 2018 Council of Ministers of Education, Canada
ISBN 978-0-88987-245-5
Ce rapport est également disponible en français.
Note of appreciation
The Council of Ministers of Education (Canada) would like to thank the students, teachers, and administrators whose participation in the Pan-Canadian Assessment Program ensured its success. The quality of your commitment has made this study possible. We are truly grateful for your contribution to a pan-Canadian understanding of educational policy and practices in reading, mathematics, and science at the Grade 8/Secondary II level.

TABLE OF CONTENTS
Introduction: What Is the Pan-Canadian Assessment Program .................................1Goals of PCAP ............................................................................................................................1Development of the assessment ...............................................................................................2
The PCAP assessment cycle ...................................................................................................2Development of PCAP frameworks ........................................................................................2Assessment design .................................................................................................................3
PCAP contextual questionnaires ................................................................................................3Administering and scoring the assessment ...............................................................................4Presentation of PCAP results .....................................................................................................4
Reporting by language ..........................................................................................................5Reporting PCAP achievement over time ................................................................................5Applications of PCAP data .....................................................................................................6
Organization of this report ........................................................................................................6
Reading Assessment ..........................................................................................9The primary domain: reading ...................................................................................................9Modelling reading literacy .........................................................................................................9
Text types and forms ............................................................................................................11Subdomains of reading literacy ...........................................................................................12Reporting on levels of performance in reading ....................................................................14
Results in reading ....................................................................................................................16Results in reading by performance level ..............................................................................17Results in reading by province .............................................................................................23Results in reading by language of the school system ..........................................................23Results in reading by gender ................................................................................................27Change in reading performance over time ..........................................................................30
Summary .................................................................................................................................32
Mathematics Assessment ................................................................................35Defining mathematics ..............................................................................................................35Results in mathematics ............................................................................................................36
Results in mathematics by province ....................................................................................36Results in mathematics by language of the school system ..................................................36Results in mathematics by gender ......................................................................................38Change in mathematics performance over time .................................................................39
Summary .................................................................................................................................41
1
2

Science Assessment .........................................................................................43Defining science .......................................................................................................................43Results in science .....................................................................................................................44
Results in science by province ..............................................................................................44Results in science by language of the school system ...........................................................45Results in science by gender ................................................................................................46Change in science performance over time ...........................................................................48
Summary .................................................................................................................................49
Assessment Results by Province ......................................................................51BRITISH COLUMBIA ............................................................................................................. 51
Context statement ...................................................................................................................51Social context .......................................................................................................................51Organization of the school system .......................................................................................51Language arts teaching .......................................................................................................51Language arts assessment ..................................................................................................52
Results in reading ....................................................................................................................52Results in reading by performance level ..............................................................................52Results in reading by mean score ........................................................................................53Comparison of reading results over time .............................................................................56
Results in mathematics and science ........................................................................................57Results in mathematics ........................................................................................................57Results in science .................................................................................................................58
ALBERTA .............................................................................................................................. 61Context statement ...................................................................................................................61
Social context .......................................................................................................................61Organization of the school system .......................................................................................61Language arts teaching .......................................................................................................62Language arts assessment ..................................................................................................63
Results in reading ....................................................................................................................64Results in reading by performance level ..............................................................................64Results in reading by mean score ........................................................................................65Comparison of reading results over time .............................................................................67
Results in mathematics and science ........................................................................................68Results in mathematics ........................................................................................................68Results in science .................................................................................................................70
SASKATCHEWAN .................................................................................................................. 72Context statement ...................................................................................................................72
Social context .......................................................................................................................72Organization of the school system .......................................................................................72Language arts teaching .......................................................................................................72Language arts assessment ..................................................................................................72
Results in reading ....................................................................................................................73
3
4

Results in reading by performance level ..............................................................................73Results in reading by mean score ........................................................................................74Comparison of reading results over time .............................................................................77
Results in mathematics and science ........................................................................................78Results in mathematics ........................................................................................................78Results in science .................................................................................................................79
MANITOBA .......................................................................................................................... 81Context statement ...................................................................................................................81
Social context .......................................................................................................................81Organization of the school system .......................................................................................81Language arts teaching .......................................................................................................81Language arts assessment ..................................................................................................83
Results in reading ....................................................................................................................83Results in reading by performance level ..............................................................................83Results in reading by mean score ........................................................................................84Comparison of reading results over time .............................................................................87
Results in mathematics and science ........................................................................................88Results in mathematics ........................................................................................................88Results in science .................................................................................................................89
ONTARIO ............................................................................................................................. 91Context statement ...................................................................................................................91
Social context .......................................................................................................................91Organization of the school system .......................................................................................91Language teaching ..............................................................................................................92Language arts assessment ..................................................................................................93
Results in reading ....................................................................................................................94Results in reading by performance level ..............................................................................94Results in reading by mean score ........................................................................................95Comparison of reading results over time .............................................................................98
Results in mathematics and science ........................................................................................99Results in mathematics ........................................................................................................99 Results in science ..............................................................................................................100
QUEBEC ..............................................................................................................................103Context statement .................................................................................................................103
Social context .....................................................................................................................103Organization of the school system .....................................................................................103Language arts teaching .....................................................................................................104Language arts assessment ................................................................................................104
Results in reading ..................................................................................................................105Results in reading by performance level ............................................................................105Results in reading by mean score ......................................................................................106Comparison of reading results over time ...........................................................................108
Results in mathematics and science ......................................................................................109

Results in mathematics ......................................................................................................109Results in science ...............................................................................................................111
NEW BRUNSWICK ...............................................................................................................113Context statement .................................................................................................................113
Social context .....................................................................................................................113Organization of the school system .....................................................................................113Language arts teaching .....................................................................................................114Language arts assessment ................................................................................................115
Results in reading ..................................................................................................................115Results in reading by performance level ............................................................................115Results in reading by mean score ......................................................................................116Comparison of reading results over time ...........................................................................119
Results in mathematics and science ......................................................................................120Results in mathematics ......................................................................................................120Results in science ...............................................................................................................121
NOVA SCOTIA .....................................................................................................................123Context statement .................................................................................................................123
Social context .....................................................................................................................123Organization of the school system .....................................................................................123Language arts teaching .....................................................................................................123Language arts assessments ...............................................................................................124
Results in reading ..................................................................................................................124Results in reading by performance level ............................................................................124Results in reading by mean score ......................................................................................125Comparison of reading results over time ...........................................................................128
Results in mathematics and science ......................................................................................129Results in mathematics ......................................................................................................129Results in science ...............................................................................................................130
PRINCE EDWARD ISLAND ....................................................................................................133Context statement .................................................................................................................133
Social context .....................................................................................................................133Organization of the school system .....................................................................................133Language arts teaching .....................................................................................................133
Results in reading ..................................................................................................................134Results in reading by performance level ............................................................................135Results in reading by mean score ......................................................................................135Comparison of reading results over time ...........................................................................137
Results in mathematics and science ......................................................................................138Results in mathematics ......................................................................................................138Results in science ...............................................................................................................139
NEWFOUNDLAND AND LABRADOR .....................................................................................141Context statement .................................................................................................................141
Social context .....................................................................................................................141

Organization of the school system .....................................................................................141Language arts teaching .....................................................................................................141Language arts assessment ................................................................................................141
Results in reading ..................................................................................................................142Results in reading by performance level ............................................................................142Results in reading by mean score ......................................................................................143Comparison of reading results over time ...........................................................................144
Results in mathematics and science ......................................................................................145Results in mathematics ......................................................................................................145Results in science ...............................................................................................................146
Conclusion ...........................................................................................................149Overview of results ................................................................................................................149
Test design .........................................................................................................................149Pan-Canadian results in reading by performance level ....................................................149Achievement in reading, mathematics, and science by mean score ..................................150Achievement by language of the school system ................................................................150Achievement by gender .....................................................................................................151Pan-Canadian results by subdomains in reading ...............................................................151Performance comparisons over time ................................................................................151
Final statement ......................................................................................................................152
References ...........................................................................................................153
Appendix A: Sampling Procedures and Response Rate .........................................155
Appendix B: Data Tables .......................................................................................159

LIST OF FIGURES
Introduction: What Is the Pan-Canadian Assessment Program .................................1Figure 1 Selecting a random sample of Canadian Grade 8/Secondary II students ...........4
Reading Assessment ..........................................................................................9Figure 1.1 Reading literacy: a model .................................................................................10Figure 1.2 Percentage of students at each performance level in reading .........................18Figure 1.3 Percentage of students at each performance level in reading in Canada
by language of the school system.....................................................................19Figure 1.4 Percentage of students at each performance level in reading in Canada
by gender ..........................................................................................................20Figure 1.5 Canadian results in reading by language of the school system ........................24Figure 1.6 Canadian results in reading by gender .............................................................27Figure 1.7 Canadian results in reading achievement over time by language
of the school system and gender ......................................................................31
Mathematics Assessment ................................................................................35Figure 2.1 Canadian results in mathematics by language of the school system ...............37Figure 2.2 Canadian results in mathematics by gender ....................................................38Figure 2.3 Canadian results in mathematics achievement over time by language
of the school system and gender ......................................................................40
Science Assessment .........................................................................................43Figure 3.1 Canadian results in science by language of the school system ........................45Figure 3.2 Canadian results in science by gender .............................................................47Figure 3.3 Canadian results in science achievement over time ........................................48
Assessment Results by Province ......................................................................51Figure BC.1 Canada–British Columbia: results in reading by level of performance .............53Figure BC.2 Canada–British Columbia: results in reading by mean score ...........................54Figure BC.3 Canada–British Columbia: results in reading by subdomain ............................54Figure BC.4 British Columbia: results in reading over time .................................................56Figure BC.5 Canada–British Columbia: results in mathematics ...........................................57Figure BC.6 British Columbia: results in mathematics over time .........................................58Figure BC.7 Canada–British Columbia: results in science ....................................................59Figure BC.8 British Columbia: results in science over time .................................................60Figure AB.1 Canada–Alberta: results in reading by level of performance ...........................64Figure AB.2 Canada–Alberta: results in reading by mean score ..........................................65Figure AB.3 Canada–Alberta: results in reading by subdomain ...........................................66
1
2
3
4

Figure AB.4 Alberta: results in reading over time ................................................................68Figure AB.5 Canada–Alberta: results in mathematics ..........................................................69Figure AB.6 Alberta: results in mathematics over time .......................................................70Figure AB.7 Canada–Alberta: results in science ...................................................................71Figure AB.8 Alberta: results in science over time ................................................................71Figure SK.1 Canada–Saskatchewan: results in reading by level of performance ................74Figure SK.2 Canada–Saskatchewan: results in reading by mean score ...............................75Figure SK.3 Canada–Saskatchewan: results in reading by subdomain ................................75Figure SK.4 Saskatchewan: results in reading over time .....................................................77Figure SK.5 Canada–Saskatchewan: results in mathematics ...............................................78Figure SK.6 Saskatchewan: results in mathematics over time ............................................79Figure SK.7 Canada–Saskatchewan: results in science ........................................................80Figure SK.8 Saskatchewan: results in science over time .....................................................80Figure MB.1 Canada–Manitoba: results in reading by level of performance .......................84Figure MB.2 Canada–Manitoba: results in reading by mean score ......................................85Figure MB.3 Canada–Manitoba: results in reading by subdomain .......................................85Figure MB.4 Manitoba: results in reading over time ............................................................87Figure MB.5 Canada–Manitoba: results in mathematics ......................................................88Figure MB.6 Manitoba: results in mathematics over time ...................................................89Figure MB.7 Canada–Manitoba: results in science ...............................................................90Figure MB.8 Manitoba: results in science over time ............................................................90Figure ON.1 Canada–Ontario: results in reading by level of performance ..........................95Figure ON.2 Canada–Ontario: results in reading by mean score ..........................................96Figure ON.3 Canada–Ontario: results in reading by subdomain ..........................................96Figure ON.4 Ontario: results in reading over time................................................................98Figure ON.5 Canada–Ontario: results in mathematics .........................................................99Figure ON.6 Ontario: results in mathematics over time .....................................................100Figure ON.7 Canada–Ontario: results in science ................................................................101Figure ON.8 Ontario: results in science over time ..............................................................102Figure QC.1 Canada–Quebec: results in reading by level of performance .........................105Figure QC.2 Canada–Quebec: results in reading by mean score .......................................106Figure QC.3 Canada–Quebec: results in reading by subdomain ........................................107Figure QC.4 Quebec: results in reading over time .............................................................109Figure QC.5 Canada–Quebec: results in mathematics .......................................................110Figure QC.6 Quebec: results in mathematics over time .....................................................111Figure QC.7 Canada–Quebec: results in science ................................................................112Figure QC.8 Quebec: results in science over time ..............................................................112Figure NB.1 Canada–New Brunswick: results in reading by level of performance ...........116Figure NB.2 Canada–New Brunswick: results in reading by mean score ...........................117Figure NB.3 Canada–New Brunswick: results in reading by subdomain ............................117Figure NB.4 New Brunswick: results in reading over time .................................................119Figure NB.5 Canada–New Brunswick: results in mathematics ...........................................120Figure NB.6 New Brunswick: results in mathematics over time ........................................121Figure NB.7 Canada–New Brunswick: results in science ....................................................122
Figure NB.8 New Brunswick: results in science over time .................................................122Figure NS.1 Canada–Nova Scotia: results in reading by level of performance ..................125Figure NS.2 Canada–Nova Scotia: results in reading by mean score .................................126Figure NS.3 Canada–Nova Scotia: results in reading by subdomain ..................................126Figure NS.4 Nova Scotia: results in reading over time .......................................................128Figure NS.5 Canada–Nova Scotia: results in mathematics .................................................129Figure NS.6 Nova Scotia: results in mathematics over time ..............................................130Figure NS.7 Canada–Nova Scotia: results in science ..........................................................131Figure NS.8 Nova Scotia: results in science over time .......................................................132Figure PE.1 Canada–Prince Edward Island: results in reading by level
of performance ..............................................................................................135Figure PE.2 Canada–Prince Edward Island: results in reading by mean score ..................136Figure PE.3 Canada–Prince Edward Island: results in reading by subdomain ...................136Figure PE.4 Prince Edward Island: results in reading over time ........................................137Figure PE.5 Canada–Prince Edward Island: results in mathematics ..................................138Figure PE.6 Prince Edward Island: results in mathematics over time ................................139Figure PE.7 Canada–Prince Edward Island: results in science ...........................................139Figure PE.8 Prince Edward Island: results in science over time .........................................140Figure NL.1 Canada–Newfoundland and Labrador: results in reading by level
of performance ...............................................................................................142Figure NL.2 Canada–Newfoundland and Labrador: results in reading by mean score ......143Figure NL.3 Canada–Newfoundland and Labrador: results in reading by subdomain ......143Figure NL.4 Newfoundland and Labrador: results in reading over time ............................145Figure NL.5 Canada–Newfoundland and Labrador: results in mathematics .....................146Figure NL.6 Newfoundland and Labrador: results in mathematics over time ...................146Figure NL.7 Canada–Newfoundland and Labrador: results in science ..............................147Figure NL.8 Newfoundland and Labrador: results in science over time ............................147

LIST OF TABLES
Introduction: What Is the Pan-Canadian Assessment Program .................................1Table 1 Actual and proposed dates of PCAP assessments ..............................................2Table 2 Comparison of large-scale and classroom assessments .....................................6
Reading Assessment ..........................................................................................9Table 1.1 Before-during-after model of student reading strategies .................................11Table 1.2 Knowledge and skills characteristic of achievement at Performance Level 3 ..14Table 1.3 Knowledge and skills characteristic of achievement at Performance Level 2 ..15Table 1.4 Knowledge and skills characteristic of achievement at Performance Level 1 ..16Table 1.5 Comparison of Canadian and provincial results for percentage of students
achieving at or above Level 2 in reading by language of the school system ....19Table 1.6 Summary of difference in provincial results, percentage of students
achieving at or above Level 2 in reading by language of the school system ....19Table 1.7 Comparison of Canadian and provincial results for percentage of students
achieving at or above Level 2 in reading by gender .........................................20Table 1.8 Summary of differences in provincial results for percentage of students
achieving at or above Level 2 in reading by gender .........................................21Table 1.9 Achievement scores in reading by province .....................................................23Table 1.10 Comparison of Canadian and provincial results for reading by language
of the school system .........................................................................................24Table 1.11 Summary of provincial results in reading by language of the school system ...24Table 1.12 Canadian results in reading subdomains by language of the school system ...25Table 1.13 Comparison of Canadian and provincial results in reading subdomains
by language of the school system.....................................................................26Table 1.14 Summary of differences in provincial results in reading subdomains
by language of the school system.....................................................................27Table 1.15 Comparison of Canadian and provincial results in reading by gender .............28Table 1.16 Canadian results in reading subdomains by gender .........................................28Table 1.17 Comparison of Canadian and provincial results in reading subdomains
by gender ..........................................................................................................29Table 1.18 Summary of difference in provincial results in reading subdomains
by gender .........................................................................................................30Table 1.19 Summary of provincial results for reading performance over time
(2010–16) by language of the school system and gender ...............................32
1

Mathematics Assessment ................................................................................35Table 2.1 Achievement scores in mathematics by province ............................................36Table 2.2 Comparison of Canadian and provincial results for mathematics
by language of the school system.....................................................................37Table 2.3 Summary of provincial results in mathematics by language of
the school system ............................................................................................37Table 2.4 Comparison of Canadian and provincial results in mathematics by gender.....38Table 2.5 Summary of provincial results in mathematics by gender ..............................39Table 2.6 Summary of provincial results for mathematics achievement over time
by language of the school system and gender .................................................41
Science Assessment .........................................................................................43Table 3.1 Achievement scores in science by province .....................................................45Table 3.2 Comparison of Canadian and provincial results in science by language
of the school system .........................................................................................46Table 3.3 Summary of provincial results in science by language of the school system ..46Table 3.4 Comparison of Canadian and provincial results in science by gender ..............47Table 3.5 Summary of provincial results in science by gender .......................................47Table 3.6 Summary of provincial results in science achievement over time ...................49
Assessment Results by Province ......................................................................51Table BC.1 Canada–British Columbia: results in reading by subdomain and
language of the school system .........................................................................55Table BC.2 Canada–British Columbia: results in reading by subdomain and gender .........55Table AB.1 Canada–Alberta: results in reading by subdomain and language
of the school system .........................................................................................66Table AB.2 Canada–Alberta: results in reading by subdomain and gender ........................67Table SK.1 Canada–Saskatchewan: results in reading by subdomain and
language of the school system .........................................................................76Table SK.2 Canada–Saskatchewan: results in reading by subdomain and gender .............76Table MB.1 Canada–Manitoba: results in reading by subdomain and language
of the school system .........................................................................................86Table MB.2 Canada–Manitoba: results in reading by subdomain and gender ....................86Table ON.1 Canada–Ontario: results in reading by subdomain and language
of the school system .........................................................................................97Table ON.2 Canada–Ontario: results in reading by subdomain and gender .......................97Table QC.1 Canada–Quebec: results in reading by subdomain and language
of the school system .......................................................................................107Table QC.2 Canada–Quebec: results in reading by subdomain and gender .....................108Table NB.1 Canada–New Brunswick: results in reading by subdomain and
language of the school system .......................................................................118Table NB.2 Canada–New Brunswick: results in reading by subdomain and gender .........118Table NS.1 Canada–Nova Scotia: results in reading by subdomain and
language of the school system .......................................................................127
3
4
2

Table NS.2 Canada–Nova Scotia: results in reading by subdomain and gender ...............127Table PE.1 Canada–Prince Edward Island: results in reading by subdomain
and gender .....................................................................................................137Table NL.1 Canada–Newfoundland and Labrador: results in reading
by subdomain and gender ..............................................................................144
Appendix A: Sampling Procedures and Response Rate .........................................153Table A.1 Student participation rates .............................................................................156Table A.2 Student exemption rates ................................................................................157Table A.3 School response rates .....................................................................................158
Appendix B: Data Tables .......................................................................................159Table B.1 Percentage of students at each level of performance in reading
by province .....................................................................................................159Table B.2 Percentage of students at each level of performance in reading
by language of the school system...................................................................160Table B.2.1 Intra-provincial comparison of levels of performance in reading
between anglophone and francophone schools ...........................................160Table B.3 Percentage of students at each level of performance in reading by gender ..161Table B.3.1 Intra-provincial comparison of levels of performance in reading
between males and females ...........................................................................161Table B.4 Achievement scores in reading by province ...................................................... 162Table B.5 Achievement scores in reading by language of the school system .................162Table B.6 Achievement scores in reading by gender ......................................................163Table B.7 Achievement scores in reading by subdomain .................................................. 164Table B.8 Achievement scores in reading by subdomain and language
of the school system .......................................................................................... 166Table B.9 Achievement scores in reading by subdomain and gender .............................. 168Table B.10 Changes over time in reading achievement, 2016, 2013, 2010, and 2007 ....... 170Table B.11 Changes over time in reading achievement by language
of the school system, 2016, 2013, 2010, and 2007 ........................................... 171Table B.12 Changes over time in reading achievement by gender, 2016, 2013,
2010, and 2007 .................................................................................................. 172Table B.13 Achievement scores in mathematics by province ............................................. 173Table B.14 Achievement scores in mathematics by language of the school system ........173Table B.15 Achievement scores in mathematics by gender .............................................174Table B.16 Changes over time in mathematics achievement, 2016, 2013, and 2010 ......174Table B.17 Changes over time in mathematics achievement by language
of the school system, 2016, 2013, and 2010 ..................................................... 175Table B.18 Changes over time in mathematics achievement by gender, 2016, 2013,
and 2010 ............................................................................................................. 176Table B.19 Achievement scores in science by province ...................................................... 177Table B.20 Achievement scores in science by language of the school system .................177Table B.21 Achievement scores in science by gender ......................................................178

Table B.22 Changes over time in science achievement, 2016 and 2013 ..........................178Table B.23 Changes over time in science achievement by language
of the school system, 2016 and 2013 ................................................................ 179Table B.24 Changes over time in science achievement by gender, 2016 and 2013 ........... 180Table B.25 Multiple comparisons of overall reading achievement .................................... 181Table B.26 Multiple comparisons of overall mathematics achievement ........................... 182Table B.27 Multiple comparisons of overall science achievement .................................... 183

PCAP 2016 1
INTRODUCTION: WHAT IS THE PAN-CANADIAN ASSESSMENT PROGRAM
The Pan-Canadian Assessment Program (PCAP) is a collaborative project that provides data on student achievement in Canadian provinces and territories.1 It is part of the ongoing commitment of the Council of Ministers of Education, Canada (CMEC) to inform Canadians about how well their education systems are meeting the needs of students and society. Every three years, close to 30,000 Grade 8/Secondary II2 students from across Canada are assessed with respect to their achievement of the curricular expectations common to all provinces and territories in three core learning domains: reading, mathematics, and science. The information gained from this pan-Canadian assessment provides ministers of education and other stakeholders with a basis for examining their provincial curriculum and other aspects of their school systems.
School programs and curricula vary from province to province and from territory to territory across the country, so comparing results in these domains is a complex task. However, young Canadians in different provinces and territories learn many similar skills in reading, mathematics, and science. PCAP has been designed to determine whether students across Canada reach similar levels of performance in these core disciplines at about the same age, and to complement existing provincial/territorial assessments with comparative Canada-wide data on the achievement levels attained by Grade 8/Secondary II students.
Goals of PCAPWith the establishment of PCAP in 2003, Canada’s ministers of education set out the following goals with respect to pan-Canadian educational assessment:
• to inform educational policies that seek to improve approaches to learning;
• to focus on reading, mathematics, and science, with the possibility of including other domains as the need arises;
• to reduce the testing burden on schools through a more streamlined administrative process;
• to provide useful background information through the use of complementary context questionnaires for students, teachers, and school administrators; and
• to enable provinces and territories to use both national and international results to validate the results of their own assessment programs, and to improve these programs.3
1 All ten provinces have participated in each PCAP administration. The three territories did not participate in PCAP 2016.2 PCAP is administered to students in Secondary II in Quebec and Grade 8 in the rest of Canada.3 PCAP 2016 results can be compared to three international studies: the Progress in International Reading Literacy Study (PIRLS), the Programme
for International Student Assessment (PISA), and the Trends in International Mathematics and Science Study (TIMSS). Unlike PCAP, these studies are not aligned with provincial/territorial programs of study. However, the comparison is useful because the same subjects are assessed, which provides indirect information about the relative progress in performance across grades and ages. PISA is administered in all provinces to the same age cohort of students as PCAP, but two years later. Fewer provinces participate in TIMSS, which assesses Grade 4 and Grade 8/Secondary II students in science and mathematics, and PIRLS, which assesses Grade 4 students in reading.

2 PCAP 2016
Development of the assessment
The PCAP assessment cyclePCAP assessments are administered every three years to students who are in Grade 8/Secondary II. Each assessment cycle collects achievement data using a cognitive test with a major emphasis on one of the three learning domains—reading, mathematics, or science—and a minor emphasis on the two remaining domains. PCAP also collects a significant range of contextual information (e.g., on demographics, socioeconomic factors, and school teaching and learning conditions) to enhance interpretation of student performance.4
Each PCAP assessment includes questions on all three domains, although the focus shifts, as shown in Table 1. The repetition of the assessments at regular intervals yields timely data that can be compared across provinces and territories, and over time. For the fourth assessment, in 2016, the focus was on reading, as it had been in the first assessment, in 2007, with mathematics and science as the minor domains.
Table 1 Actual and proposed dates of PCAP assessments
DomainCycle 1 Cycle 2
Spring 2007 Spring 2010 Spring 2013 Spring 2016 Spring 2019 Spring 2022
Major Reading Mathematics Science Reading Mathematics Science
Minor Mathematics Science Reading Mathematics Science Reading
Minor Science Reading Mathematics Science Reading Mathematics
Development of PCAP frameworksWhile school programs differ from one part of the country to another, PCAP is based on curriculum areas that are common to all provinces at the Grade 8/Secondary II level. This focus on common areas allows comparisons of students at a comparable point in their schooling, across provinces and territories. PCAP 2016: Assessment Framework (CMEC, 2016) provides the theoretical underpinnings, design principles, and performance descriptors that were used to develop test items in each of the three domains for the second cycle of PCAP (2016–22).
PCAP development began in 2003 with a thorough review of curricula and then-current assessment practices for each of the three target learning domains. All Canadian provinces and territories were consulted, and extensive literature reviews were conducted for each domain. These analyses informed the synthesis of a core of common expectations for Canadian Grade 8/Secondary II students. The resulting common curricular framework for each domain reflected a perspective agreed upon by all provinces and territories, and was informed by the latest pedagogical research (CMEC, 2005a). The framework document was reviewed and updated in preparation for the second cycle of PCAP.
4 These contextual data are published in a separate report.

PCAP 2016 3
For each PCAP assessment, the framework document guides the development of test items. Items are developed in both official languages, cross-translated, and field tested. The 2016 framework document describes the theory guiding the construction of PCAP assessments and provides further detail about the design and field testing of questions used in the assessments (CMEC, 2016).
Assessment designIn measuring any complex and integrated set of skills, it is usually best to include a variety of types of items in the assessment, both to allow all students to respond in the manner that best demonstrates their skill attainment and to measure a wide range of the complex skills involved.
In general, the PCAP assessment is designed with units of questions based on a particular context. The units are self-contained, integrate a range of text types currently read by Grade 8/Secondary II students both in and out of class, and are short enough to allow for a range of reading demands in the 90 minutes allowed for the test. An attempt was made to ensure that the contexts were relevant, appropriate, and sensible for Canadian Grade 8/Secondary II students. Attention was paid to creating a balance of constructed-response (or open-ended-response) and selected-response items, allowing for an efficient use of student testing time. The ratio of selected-response to constructed-response items is approximately 3:1. In developing assessment items, the choice of item format depended on the competency or subdomain being assessed and the format that best enabled the student to demonstrate his or her proficiency.
More details about the domains, subdomains, and assessment design may be found in PCAP 2016: Assessment Framework (CMEC, 2016) and PCAP 2016: Technical Report (O’Grady & Fung, forthcoming).
PCAP contextual questionnairesStudents participating in PCAP, and their teachers and school principals, complete questionnaires that are designed to provide all provinces and territories with contextual information to aid in the interpretation of the performance results. Researchers, policy-makers, and practitioners can use the information provided by these questionnaires to help them determine what factors influence learning outcomes. The content of the contextual questionnaires changes depending on which of the three domains is the primary focus in a PCAP assessment.
Contextual questions accompanying the PCAP 2016 assessment reflect factors that have been found in past studies to correlate with reading achievement. Some examples of these correlates include:
• parental level of education;
• language spoken in the home; and
• number of books in the home.
Contextual questionnaires completed by teachers cover questions about teaching and learning conditions, including teachers’ homework expectations, areas of specialization, and years of teaching experience.

4 PCAP 2016
Administering and scoring the assessmentIn spring of 2016, the PCAP assessment was administered to a random sample of students from across Canada.5 The selection process occurred in several steps, as shown in Figure 1. Approximately 27,000 students from all ten provinces participated in the 2016 PCAP assessment.6 All participating students answered questions in all three domains. Approximately 20,000 responded in English, and 7,000 in French. The assessment comprised both selected- and constructed-response items. Student written responses were scored by subject specialists from across Canada, rigorously trained in PCAP assessment protocols. Multiple checks and balances were built in to the assessment process to ensure the reliability of the data collected. Additional information about the design and scoring of PCAP domains is available in PCAP 2016: Assessment Framework (CMEC, 2016) and PCAP 2016: Technical Report (O’Grady & Fung, forthcoming).
Figure 1 Selecting a random sample of Canadian Grade 8/Secondary II students
Random sample of publicly funded schools from each province*
Random selection of a Grade 8/Secondary II classroom within sampled schools**
Random distribution of four different versions of the test among students in the selected classroom
* Provinces provide lists of publicly funded schools. These schools may be public or private.** In provinces with small school populations, all schools and/or all Grade 8/Secondary II classes meeting the criteria were
selected, in order to obtain a sufficient number of participants for a valid sample.
Presentation of PCAP resultsEvery PCAP report provides data for the three learning domains in the form of mean scores. While overall mean scores, and the relative rankings compared to the Canadian mean scores, are useful indicators of the performance of education systems overall, they do not provide much information about student learning.
To provide a detailed understanding of what students know, understand, and can do, PCAP has developed useful benchmarks or performance levels that align a range of scores to levels of knowledge and skills measured by PCAP as an assessment of learning. For the major domain, which was reading in 2016, PCAP used three performances levels, which provide an overall picture of students’ accumulated proficiency at Grade 8/Secondary II. Performance levels are reported for the overall
5 The sampling process refers to the way in which students were selected to write the assessment. It is necessary to select a large enough number of participants to allow for adequate representation of the population’s performance. The word “population” refers to all eligible Grade 8/Secondary II students within a jurisdiction and/or a linguistic group.
6 The three Canadian territories did not participate in PCAP 2016.
Randomized school sample
Randomized classroom sample
Randomized test distribution

PCAP 2016 5
domain as well as by subdomain. (The performance levels for each subdomain of reading are described in Tables 1.2, 1.3, and 1.4. in Chapter 1.)
The achievement results in the minor subject domains (mathematics and science, in 2016) are reported only as overall mean scores. Together, these two minor domains constituted approximately one-third of the assessment. Because the students responded to a smaller subset of items for the two minor subject areas, their results by subdomain or by performance level are not reported.
PCAP results are weighted based on population size—provinces with a larger population have a greater weight. This weighting has implications for the mean scores: because English-language students from Ontario and French-language students from Quebec contribute the greatest number of test results, their average scores are more likely than those of any other population to be closest to the Canadian English mean and Canadian French mean, respectively.
The actual results from students’ assessments are called “raw scores.” The raw scores are converted to a scale, which has a range of 0 to 1000. These raw scores are standardized, providing a common measurement so that meaningful comparisons can be made of scores obtained from different populations over time and on different versions of a test.
The standardized scale used for PCAP assessments places scores on a normal distribution with a midpoint or mean of 500 and a standard deviation of 100. The scale midpoint of 500 is equal to the pan-Canadian average for each subject in the baseline year.7 The majority of students in Canada—about two thirds—will score between 400 and 600, or within one standard deviation of the mean. This mean can then be used as a reference point that allows the comparison of Canada-wide results.
Reporting by languageThe results obtained from students educated in the francophone school system of their respective provinces are reported as French. The results obtained from students educated in the anglophone school system of their respective provinces are reported as English. Students in French immersion programs wrote the assessment in English; thus, PCAP did not assess their reading literacy skills in their second language. However, as a resource for French immersion students, a list of common science and mathematics terms was provided in English and French.
Reporting PCAP achievement over timeOne of the strengths of PCAP is its measurement of changes over time in student performance. The PCAP achievement scales provide a common metric on which provinces can compare students’ progress at the Grade 8/Secondary II level in the three core subjects from one assessment year to another. Items that were administered in the baseline years, known as “anchor items,” provide the basis for linking the assessment results. Such links enable provinces to have comparable achievement data from 2007, 2010, 2013, and 2016, and to analyze changes in performance over time.
7 The baseline year is the first year in which the domain was the major domain assessed (2007 for reading, 2010 for mathematics, and 2013 for science).

6 PCAP 2016
Applications of PCAP dataPCAP is designed as a system-level assessment to be used primarily by provincial ministries of education to monitor and assess their respective educational systems. PCAP data are reported by province (and, where data are available, by territory), by language of the school system, and by gender.8
The goal of national (and international) large-scale assessments is to provide reliable information about academic achievement and insight into the contextual factors influencing it. The data from studies such as PCAP provide policy-makers, administrators, teachers, and researchers with meaningful insights into the functioning of education systems and how they might be improved.
It should be noted that PCAP is not designed to report valid results at the student, school, or school board level: its results complement classroom assessment but do not replace it. Although public attention is often focused on the results of large-scale, standardized assessments, research suggests that valid and reliable classroom assessments used by teachers in their daily practice provide powerful tools to improve student achievement (Olsen, 2002). Therefore it is important to recognize the important roles of both classroom assessments (formative and summative) and larger-scale summative assessments such as PCAP in providing valuable information about student learning. Table 2 summarizes the similarities and differences between large-scale assessments like PCAP and classroom assessments.
Table 2 Comparison of large-scale and classroom assessments
Large-scale assessments Classroom assessments
Summative assessment Program of formative and summative assessments
Standardized procedures, randomly administered Multiple modes and instances of assessment adapted to student learning needs
Supports analysis of education systems Supports and assesses the learning of individual students
Fosters system accountability Provides educators and students with immediate, context-specific feedback on learning
Differentiates by student achievement Differentiates by student achievement, learning needs, and strengths
Organization of this reportThis report provides initial results from the PCAP 2016 assessment for Canada overall and for the ten provinces. It presents the pan-Canadian and provincial results in reading, mathematics, and science, and it also offers comparative results among provinces and between Canada and individual provinces.
8 Approximately 1 per cent of students did not specify a gender. This result will be presented in the forthcoming report PCAP 2016: Contextual Report on Student Achievement in Reading.

PCAP 2016 7
Chapter 1 presents information on reading, the primary focus of PCAP 2016. It explains the domain and subdomains that constitute the PCAP assessment of reading literacy and describes the three performance levels that broadly classify achievement as expected (Level 2), below expected (Level 1), and above expected (Level 3) for students in Grade 8/Secondary II.9 This chapter presents reading achievement by performance level, with comparisons by province, language of the school system, and gender. It reports on reading achievement by overall mean score as well as changes over time for the years 2007, 2010, 2013, and 2016. Again, comparisons by province, language of the school system, and gender are presented.
Chapters 2 and 3 present achievement outcomes in mathematics and science, the two minor domains assessed in 2016. For minor domains, only mean score data are reported. Findings include comparisons among provinces as well as changes in achievement over time. Data are presented by province, language of the school system, and gender.
Chapter 4 presents the 2016 PCAP assessment data for each province. At the opening of each subsection, a “context statement” provides background information on the social and organizational contexts of the province’s public education system and an overview of how the province approaches curriculum in the major domain. Provincial results are compared with pan-Canadian averages, with additional breakouts of the data by language of the school system (where appropriate) and by gender. The profile of each province also includes available data for achievement changes over time for all domains.
Major findings are summarized in the conclusion. For more detailed information, additional data tables are presented in the appendices, including details on sampling and response rates.
9 Additional information about the learning theories, design, methodology, scoring, and classification of PCAP data may be found in PCAP 2016: Assessment Framework (CMEC, 2016). This framework is the most up-to-date resource for all three PCAP learning domains for the second PCAP cycle.


PCAP 2016 9
READING ASSESSMENT
This chapter presents the results of the PCAP 2016 Reading Assessment. Prior to providing these results, the chapter delineates the conceptual framework of the reading component of PCAP 2016 and summarizes current research findings and best practices in the field of literacy development and the learning of reading. Following this contextual information, the results of student performance on the reading assessment are given. This chapter presents these results in two ways: as the percentage of students attaining the three performance levels and as overall mean scores. Results are presented for Canada overall and by province, both for reading overall and by the subdomains of reading.
The primary domain: reading Although basic reading skills are usually gained in childhood, these skill sets are not static: readers continue to develop repertoires of textual engagement strategies with new reading experiences. Reading literacy emphasizes that new textual practices develop, in different settings and for different purposes, throughout one’s life. In order to reflect the contemporary understanding of reading as an ongoing and dynamic process of growth, the focus of the reading assessment has shifted from “reading” in PCAP 2007 to “reading literacy” in PCAP 2016.
Incorporating “literacy” with “reading” directs attention to the agency that comes with a learner’s successful encounters with an increasing variety of texts. Reading literacy also aligns the conceptual understanding of the reading domain in PCAP assessments with those definitions used in provincial curricula10 and in international studies assessing reading, notably the Progress in International Reading Literacy Study (PIRLS) and the Programme for International Student Assessment (PISA).
Modelling reading literacyReading literacy is a process: through a growing number of encounters with an increasing variety of texts, a student gains skills, strategies, and understandings that help him or her achieve desired outcomes, whether individual, educational, or social. Reading literacy is a dynamic, expansive interaction between the reader, the reader’s motivations or intentions, the text itself, and the context of the engagement. These four elements influence an iterative process, as shown in Figure 1.1.
10 For updated reading curricula, please visit jurisdictional Web sites.
1

10 PCAP 2016
Figure 1.1 Reading literacy: a model
Text
Context Purpose
Reader
The reader: Student readers vary in what they bring to a text, including differences in the following:
• background knowledge and experiences;
• attitudes toward texts in their various forms;
• facility with the different strategies that can be used to approach, interpret, and make use of texts;
• metacognition—that is, knowledge and understanding of how language works in both print and digital settings.
The text: The definition of texts has been expanding with changes in technology. PCAP 2016: Assessment Framework defines a text as a “communication that uses words, graphics, sounds, and/or images in print, oral, visual, or digital form to present information and ideas” (CMEC, 2016, p. 13).11 In addition, texts can appear in many genres, whether in fiction, non-fiction, or combined forms. A student’s success in understanding a text will be influenced by its complexity and by his or her familiarity with the genre and its conventions.
The reader’s purpose: Readers engage with texts for a variety of purposes. For their personal enjoyment, readers may read traditional texts such as novels or engage with multi-media texts such as Web sites. In school, students are typically required to use texts for learning. The purpose of engagement in this setting is pragmatic, although students may also find aesthetic pleasure in their reading and learning. The purpose of engaging with the text—whether for pleasure, learning, or some combination of these—influences motivation and engagement strategies.
Context: The setting or context of reading has emotional, social, physical, and institutional dimensions. Contextual dimensions combine to determine the extent to which the student reader is willing and able to engage in the reading task. A student’s level of engagement and motivation is influenced by:
• the presence of peers and supportive adults;
• the student’s physical health, physical state, and level of interest;
• the physical environment, including light, temperature, noise, and aesthetics;
• social and cultural settings that influence his or her world view.
11 Oral and digital texts were not included in the 2016 PCAP assessment.

PCAP 2016 11
Contemporary concepts of reading recognize that the process of reading involves the interaction of reader, text, purpose, and context before, during, and after reading. The interaction is critical for print media (Binkley & Linnakylä, 1997; Bruner, 1990) and even more so for digital media, where the sociocultural contexts are more complex (Legros & Crinon, 2002). This before-during-after (BDA) model of reading strategies, as it applies in the classroom, is explained in Table 1.1. Reading is not a finite set of discrete skills, knowledge, and concepts. Rather, it is a process of continuous growth in which readers constantly expand the boundaries of their reading comprehension, interpretation, response, and reflection. In doing so, they refine the fluency of their integrated reading processes.
Table 1.1 Before-during-after model of student reading strategies
Before reading the text, the reader:
• has a purpose for reading• activates prior knowledge about the topic• recognizes familiar genres or textual conventions• wonders, asks questions, and makes predictions
During reading, the reader:
• recognizes signposts and contextual cues• revises predictions• highlights or notes important information• monitors and adjusts reading strategies
After reading, the reader:
• summarizes learning or reading experiences• discusses, writes, or creates graphic organizers related to the content• applies learning• reflects on reading strategies
Text types and formsAlthough, in daily life, readers will encounter texts that combine more than one form, in the PCAP assessment, students were presented with one of three recognizable text forms: 1) expository non-fiction, 2) persuasive non-fiction, and 3) fiction. PCAP assessments focused on written passages of text, while recognizing that reading literacy encompasses visual and multi-media texts as well.
Expository non-fiction
The primary purpose of an expository non-fiction text is to communicate information, ideas, and perspectives on issues. Examples of such texts include textbooks, essays, lab reports, newspaper articles, maps, and infographics. To engage with an expository text effectively, the student must be able to recognize patterns such as cause and effect, problems and solutions, categorization, and sequencing.

12 PCAP 2016
Persuasive non-fiction
Persuasive material presents arguments, takes stands, provides reasons, or otherwise attempts to persuade the reader to adopt a specific point of view or take a specific action. Examples of such texts include letters to the editor, advertisements, and speeches. To engage with a persuasive text effectively, the student must be able to comprehend arguments and recognize rhetorical devices.
Fiction
Fiction is often read for pleasure, although it may help readers cultivate insights into human goals, motivations, and social relations. Examples of such texts include poetry, novels, short stories, plays, and graphic novels. To engage effectively with a fictive text, a student must be able to comprehend it literally and recognize its aesthetic features.
Subdomains of reading literacyIn light of the interactive process of reader, text, purpose, and context, PCAP considers readers’ engagement with the text as well as their response to it. Such an approach is consistent with curricula across Canada, which reflect the following major aspects, or subdomains, of reading literacy:
• understanding texts;
• interpreting texts;
• responding personally and critically to texts.
All the provinces have these three subdomains as common curricular foundations; therefore, their inclusion is in keeping with the design of PCAP’s Reading Assessment as a curriculum-based test.
These three subdomains are parallel to Gray’s (1960) distinction between reading the lines, reading between the lines, and reading beyond the lines, which are commonly used by Canadian teachers. “The first refers to the literal meaning of text, the second to inferred meanings, and the third to readers’ critical evaluation of text” (as cited in Alderson & Bachman, 2000, pp. 7–8). The PCAP 2016 assessment is designed to report on these three subdomains. Reporting with this level of specificity will aid provinces in developing, adopting, and adapting education policies and programs so as to focus on continuous improvement. “It will also enable provinces and territories to improve their own assessments and to validate their results by comparing them to both national and international results” (Crocker, 2005, p. 1).
A brief description of each subdomain is given below. In each of these categories, there are, of course, different levels of complexity and difficulty. More detailed descriptions with examples of types of questions for each subdomain can be found in PCAP 2016: Assessment Framework (CMEC 2016, pp. 15–18).
Understanding texts (“reading the lines”)
This subdomain describes students’ ability to draw on the immediate text to gain information and make meaning. At this basic level of reading literacy, students do not have to go beyond the immediate text to respond to questions. Inferences may be drawn readily from the information provided in the text. Little elaboration is required. Students demonstrate comprehension when they:

PCAP 2016 13
• distinguish primary from ancillary information;
• recognize the organization of information in a text;
• locate information within the text.
Interpreting texts (“reading between the lines”)
Interpretation requires that the student move beyond seeing the text as a collection of discrete components. Making more sophisticated inferences as to meaning depends on the student’s ability to synthesize what he or she is reading. Students demonstrate that they can interpret a text when they:
• use details from the text to make logical inferences (i.e., about points that are not immediately stated in the text);
• see patterns and relationships of meaning in the text;
• bring together components of a text to identify and analyze meaning.
Responding personally and critically to texts (“reading beyond the lines”)
When students respond to texts, they demonstrate their ability to create new meanings. Outcomes may be learning-oriented, pragmatic, expressive, aesthetic, or some combination of these. When students can respond effectively to texts, they demonstrate their growing capacity for agency—the ultimate aim of reading literacy.
PCAP 2016 measured the subdomains of responding personally to texts and responding critically to texts separately. Students demonstrate their ability to respond personally to a text when they:
• draw on their own experiences, knowledge, and emotions to make connections with the text;
• use examples and details from the text combined with experience from their own lives to communicate and provide support for their insights.
Students demonstrate an effective critical response to a text when they:
• assess or evaluate the text as a social or cultural artefact;
• use detail and evidence from the text to comment on its content and compositional elements;
• recognize the accuracy, bias, and/or point of view of the text as well as its elements of persuasion.
In addition to these subdomains, the PCAP 2016 Reading Assessment considers abilities related to transliteracy. “Transliteracy” refers to the ability of the reader to create a coherent mental representation from a body of loosely connected information gathered through various means (Scardamalia & Bereiter, 2014). An example of transliteracy assessment might be requiring students to engage with multiple texts (e.g., a map, graph, diagram, and short narrative) to extract a coherent account of an event or idea. Such a task would demonstrate transliteracy while requiring students to draw on skills related to the four assessed subdomains.

14 PCAP 2016
Reporting on levels of performance in readingIn reporting levels of performance in reading, PCAP provides an overall picture of students’ accumulated understanding in this domain by the end of Grade 8/Secondary II. The assessment categorizes results according to three levels of performance. Tables 1.2–1.4 list the descriptions of the knowledge and skills that characterize these levels in each of the three subdomains of reading, with the third subdomain—responding to texts—broken down into personal and critical responses.12 Students classified at a given performance level are assumed to be able to perform most of the tasks at that level as well as those at the lower levels, if any. Based on pan-Canadian curriculum expectations in reading, the expected level of performance of Grade 8/Secondary II students is Level 2.
Table 1.2 Knowledge and skills characteristic of achievement at Performance Level 3
Level 3 – Scores of 603 and above
Subdomain: Understanding texts (“reading the lines”)
Students at this level demonstrate:• a thorough understanding of a variety of texts; • an understanding of directly stated information as well as implied information that arises from subtle aspects
of the text such as tone;• knowledge of and insight into how writers structure texts and use other elements of style.
Subdomain: Interpreting texts (“reading between the lines”)
Students at this level are able to: • analyze and synthesize a combination of elements in order to provide an insightful perspective on the
meaning of the text;• support their interpretation by drawing on subtle relationships among elements and ideas.
Subdomain: Responding personally to texts (“reading beyond the lines”)
Students at this level are able to: • provide extended personal responses that reflect an evaluation of the text and often include references to its
social and cultural implications;• use their background knowledge to reflect on and make insightful connections between the text and their
own experience, providing specific details, examples, and explanations; • elaborate on a viewpoint with evidence from the text to support personal opinions about issues.
Subdomain: Responding critically to texts (“reading beyond the lines”)
Students at this level are able to: • provide extended critical responses that reflect an evaluation of the text and often include references to its
social and cultural implications; • provide a thoughtful response to the text, often taking an evaluative stance about the quality or value of the
text; • support their responses by providing specific, appropriate details from the text, and from other sources.
12 The performance levels were established using the Bookmark standard setting method (see Lewis, Mitzel, Mercado, & Schultz, 2012).

PCAP 2016 15
Table 1.3 Knowledge and skills characteristic of achievement at Performance Level 2
Level 2 – Scores between 400 and 602
Subdomain: Understanding texts (“reading the lines”)
Students at this level demonstrate: • a clear understanding of a variety of texts; • an understanding of directly stated information as well as implied information that relies on context;• knowledge of how texts are structured and organized.
Subdomain: Interpreting texts (“reading between the lines”)
Students at this level are able to:• connect general statements and supporting details in order to provide a broad perspective on the meaning of
the text; • draw conclusions by understanding inferences and figurative language.
Subdomain: Responding personally to texts (“reading beyond the lines”)
Students at this level are able to:• provide reasonable personal responses that are supported with references to the text and other sources;• use their background knowledge to make personal connections between the text and their own experiences,
providing reasonable explanations and supporting arguments; • state a viewpoint, using evidence from the text or personal experiences to support their position.
Subdomain: Responding critically to texts (“reading beyond the lines”)
Students at this level are able to:• provide reasonable critical responses that are supported with references to the text and other sources;• provide a reasonable response supported by appropriate statements using evidence from the text;• use details from the text and other sources to support their response.

16 PCAP 2016
Table 1.4 Knowledge and skills characteristic of achievement at Performance Level 1
Level 1 – Scores of 399 and less
Subdomain: Understanding texts (“reading the lines”)
Students at this level demonstrate:• limited understanding of texts; • an understanding of directly stated information that relies on known vocabulary, concrete details, and explicit
statements; • limited understanding of the parts and features of, and events described in, the text.
Subdomain: Interpreting texts (“reading between the lines”)
Students at this level are able to:• provide a limited perspective on, and convey a limited sense of the meaning of, the text;• identify directly stated conclusions, making connections to some aspects of the text.
Subdomain: Responding personally to texts (“reading beyond the lines”)
Students at this level are able to:• provide personal responses in a vague or general manner;• use their background knowledge to make some personal connections between the text and their own
experiences, providing limited explanations and supporting arguments;• state a viewpoint, using limited evidence from the text or personal experiences to support their position.
Subdomain: Responding critically to texts (“reading beyond the lines”)
Students at this level are able to:• provide critical responses in a vague or general manner;• provide simple responses, supporting them with general statements that draw on information that is explicitly
presented in the text; • use some details from the text, including some that may be irrelevant, to support their response.
An example of a PCAP reading unit showing sample results at all three levels can be found in the PCAP 2007 public report (CMEC, 2008, pp. 13–17). Sample questions accompanied by student responses show the types of knowledge and skills demonstrated by students at different levels of performance. A more comprehensive set of sample items will be available in a forthcoming issue of Assessment Matters! 13
Results in readingThis report presents the results of student performance on the PCAP 2016 Reading Assessment in two ways: as the percentage of students attaining the three performance levels and as overall mean scores. This chapter presents results for Canada as a whole and by province, both for reading overall and for each of the subdomains of reading. Student achievement is also broken down by language of the school system for all provinces except Prince Edward Island and Newfoundland and Labrador. This
13 Assessment Matters! is a series of articles and research notes available on the CMEC Web site, at http://www.cmec.ca/131/Programs-and-Initiatives/Assessment/Overview/index.html

PCAP 2016 17
chapter also compares Canadian students’ performance by gender. Given that the 2016 assessment marks the second time that PCAP assessed reading as a major domain (the first time was in 2007), this chapter also discusses changes in reading performance over time.
Canadian youth are competent readers. In the PCAP 2016 Reading Assessment, close to 90 per cent of Canadian students performed at Level 2 or Level 3. PCAP results align with Canadian results in international assessment programs, in which Canadian students consistently perform above international averages.
Results in reading by performance levelIn PCAP 2016, 88 per cent of Grade 8/Secondary II students in Canada performed at or above Level 2 in reading (Level 2 being the expected or baseline level of reading proficiency). Across provinces, the results range from 82 per cent in New Brunswick and Newfoundland and Labrador to 91 per cent in Prince Edward Island (Figure 1.2 and Appendix B.1). Across Canada, 12 per cent of students did not reach the baseline level in reading. Again, results varied among the provinces. The proportion of low achievers in reading in British Columbia, Alberta, Ontario, and Quebec was similar to that in Canada overall. Compared to the Canadian average, Prince Edward Island had a lower percentage of students at Level 1. All other provinces had a significantly higher percentage of students achieving only at Level 1.
At the higher end of the PCAP scale, 14 per cent of all Canadian students performed at Level 3. At the provincial level, the proportion of students achieving at the highest level was similar to the Canadian average in British Columbia, Alberta, Ontario, Nova Scotia, and Prince Edward Island.
Overall, the distribution of reading proficiency by performance level follows patterns similar to those observed among Canadian students in the PISA 2015 assessment, in which almost 90 per cent of Canadian students performed at the baseline level or better, compared to 80 per cent of students from other OECD countries (OECD, 2016). Although PISA uses a more complex model of performance, with six levels, Level 2 in both PCAP and PISA assessment is considered “baseline proficiency,” or the level at which “students begin to demonstrate the reading skills that would enable them to participate effectively and productively in life” (OECD, 2016, p. 164).

18 PCAP 2016
Figure 1.2 Percentage of students at each performance level in reading
12
18
9
15
18
11
11
17
16
12
12
74
71
79
73
73
78
72
74
74
72
74
14
11
13
12
9
11
16
9
9
16
15
0 20 40 60 80 100
CAN
NL
PE
NS
NB
QC
ON
MB
SK
AB
BC
Percentage
Level 1
Level 2
Level 3
Note: Percentages may not add up to 100 due to rounding.
Students’ level of reading performance by language of the school system
PCAP samples are representative of both majority and minority official language groups in the eight provinces that have sufficient numbers for valid statistical comparisons. Owing to the small sample size, results for students enrolled in French-language schools in Prince Edward Island are not provided separately; however, they are included in the calculations for the overall mean scores in that province. Although the Saskatchewan francophone population is also very small, it is representative because all eligible Grade 8 francophone students in that province participated in the assessment. Francophone schools in Newfoundland and Labrador did not participate in PCAP 2016.
Figure 1.3 shows performance levels in reading by the language of the school system in which students were enrolled. In Canada overall, the same proportion of students in French-language schools and English-language schools (88 per cent) achieved Level 2 or above. English-language school systems had a greater proportion of students attain Level 3, in comparison to their francophone counterparts, and the same proportion of students performing at Level 1.
When pan-Canadian and provincial results at Level 2 or higher for English-language schools are compared, we see that students in British Columbia, Alberta, Ontario, Quebec, and Nova Scotia achieved these levels at a rate similar to those in Canada as a whole, while students in Prince Edward Island achieved these levels at a higher rate than the Canadian average. Students in the remaining provinces, achieved Levels 2 or 3 at a rate lower than the Canadian average. With respect to French-language schools, a similar proportion of students in Quebec performed at or above the expected level in reading compared to the Canadian results; all other provinces had a lower percentage of students

PCAP 2016 19
at Level 2 or above (Table 1.5 and Appendix B.2). Saskatchewan and Quebec were the only provinces with equity in reading achievement between the two language systems (Table 1.6, Appendix B.2).
Figure 1.3 Percentage of students at each performance level in reading in Canada by language of the school system
12
12
78
73
10
15
0 20 40 60 80 100
French
English
Percentage
Level 1
Level 2
Level 3
Table 1.5 Comparison of Canadian and provincial results for percentage of students achieving at or above Level 2 in reading, by language of the school system
Anglophone school system
Higher* percentage than Canada The same percentage as Canada Lower* percentage than Canada
Prince Edward Island British Columbia, Alberta, Ontario, Quebec, Nova Scotia
Saskatchewan, Manitoba, New Brunswick,
Newfoundland and Labrador
Francophone school system
Higher* percentage than Canada The same percentage as Canada Lower* percentage than Canada
Quebec British Columbia, Alberta, Saskatchewan, Manitoba, Ontario, New Brunswick,
Nova Scotia
* Denotes significant difference
Table 1.6 Summary of difference in provincial results, percentage of students achieving at or above Level 2 in reading, by language of the school system
Higher* percentage in anglophone schools
Higher* percentage in francophone schools
No significant difference between school systems
British Columbia, Alberta, Manitoba, Ontario, New Brunswick,
Nova Scotia
Saskatchewan, Quebec
* Denotes significant difference
Students’ level of reading performance by gender
Student motivation and interest in school can have a significant impact on later career choices and salary prospects. Policy-makers therefore have an interest in reducing gender disparities in education.
Canada, and indeed all countries and economies participating in PISA, consistently report gender gaps for 15-year-old students in reading proficiency, with females outperforming males by approximately one school year of learning (OECD, 2016). The finding is consistent at the Grade 4 level, as reported

20 PCAP 2016
in PIRLS 2011 (Labrecque, Chuy, Brochu, & Houme, 2012), although gender equity in reading achievement was found for some countries. Weaker overall reading literacy by males is an enduring and widespread phenomenon noted in studies of reading (OECD, 2014).
As was the case in PCAP 2007, girls performed significantly better than boys in the PCAP 2016 Reading Assessment. Eighty-five per cent of boys attained Level 2 or higher, compared with over 90 per cent of girls. In all Canadian provinces, boys are more likely to perform at Level 1—that is, below expected levels of reading proficiency—and are less likely than girls to achieve Level 3, except in Prince Edward Island where there was no significant difference between girls and boys (Figure 1.4 and Appendix B.3).
A higher percentage of girls in Prince Edward Island achieved at or above the expected level of performance compared to the average results for girls in Canada overall. In British Columbia, Alberta, Ontario, and Quebec, the percentage of both girls and boys who achieved at or above the expected level of reading proficiency was similar to the percentages for Canada as a whole. Results similar to the Canadian averages were also attained by girls in Nova Scotia and by boys in Prince Edward Island (Table 1.7, Appendix B.3). In the other provinces, a smaller proportion of girls and boys attained Level 2 or above than in Canada overall.
A higher percentage of girls than boys achieved at or above Level 2 in all provinces and in Canada as a whole, except in Quebec, where there was no gender gap (Table 1.8, Appendix B.3).
Figure 1.4 Percentage of students at each performance level in reading in Canada by gender
15
9
76
72
10
18
0 20 40 60 80 100
Male
Female
Percentage
Level 1
Level 2
Level 3
Table 1.7 Comparison of Canadian and provincial results for percentage of students achieving at or above Level 2 in reading by gender
Girls
Higher* percentage than Canada The same percentage as Canada Lower* percentage than Canada
Prince Edward Island British Columbia, Alberta, Ontario, Quebec, Nova Scotia
Saskatchewan, Manitoba, New Brunswick,
Newfoundland and Labrador
Boys
Higher* percentage than Canada The same percentage as Canada Lower* percentage than Canada
British Columbia, Alberta, Ontario, Quebec, Prince Edward Island
Saskatchewan, Manitoba, New Brunswick, Nova Scotia, Newfoundland and Labrador
* Denotes significant difference

PCAP 2016 21
Table 1.8 Summary of differences in provincial results for percentage of students achieving at or above Level 2 in reading by gender
Higher* percentage of girls Higher* percentage of boys No significant difference between girls and boys
British Columbia, Alberta, Saskatchewan, Manitoba, Ontario,
New Brunswick, Nova Scotia, Prince Edward Island,
Newfoundland and Labrador
Quebec
* Denotes significant difference
Results in reading by mean scores
The PCAP 2016 mean scores in reading are reported on the PCAP scale, which has a range of 0–1000. In PCAP 2007, when reading was also the major domain, the Canadian mean was set at 500, with a standard deviation of 100. PCAP assessed 13-year-olds in 2007, but, in order to minimize the disruption to classrooms and schools, PCAP 2010 switched to sampling Grade 8/Secondary II classes. To accommodate this change in the target population and to enhance the validity of comparisons over time, analysts isolated the data on Grade 8/Secondary II students from the 2007 sample, so that only these data would be used for comparisons.14 The baseline for reading was changed to PCAP 2010 and the scale was reset to 500 in that year. Within PCAP, changes over time are typically determined by comparison to the year in which the subject was the major domain, as those assessments involve a larger number of items and broad coverage of the subdomains. Reading was a minor domain in the adjusted baseline year of 2010, and it is therefore necessary to exercise caution when interpreting results for reading trends over time.
To facilitate direct comparisons over time, the Canadian mean of 500, established in the adjusted baseline year in 2010, has not been rescaled to 500 in subsequent years. Thus, in PCAP 2016, the Canadian mean for reading is 507, with a 95 per cent confidence interval of 2.1.
It may be misleading to compare and rank student performance based on mean scores only. There is always some degree of error when using a sample to estimate the mean of a population. It is thus important, when comparing results, to take into account the error of measurement and sampling error associated with each mean score. Doing so will determine whether differences in the mean scores are statistically significant. (The box on statistical comparison on page 22 provides additional information on these issues.)
14 More detailed information on the process used to ensure a valid comparison can be found in PCAP 2013: Technical Report (O’Grady & Houme, 2015), available at http://cmec.ca/Publications/Lists/Publications/Attachments/351/PCAP2013-Technical-Report-EN-Final-Web.pdf.

22 PCAP 2016
A note on statistical comparisons
In this report, the terms “difference” or “different” refer to a statistically significant difference. A statistically significant difference is one that is very unlikely to have occurred due to chance. Whenever a sample is drawn to represent a population, there is some chance that the sample will not be a good representation of that population. Statistical techniques are used to minimize such measurement error. However, because no sample will perfectly represent a population, there is always some error of measurement. And, because an error of measurement always exists, it is common practice to provide a range of scores around the sample mean score.
Confidence Intervals (CI)
When comparing scores among provinces or population subgroups, the degree of error in each average should be considered in order to determine whether averages are significantly different from each other. Standard errors and confidence intervals may be used as the basis for performing these comparative statistical tests. Such tests can identify, with a known probability, whether actual differences are likely to be observed in the populations being compared.
The range of scores around a mean score is called a confidence interval. A 95 per cent confidence interval is used in this report – in other words, the actual mean score should fall between the high- and low-end points 95 per cent of the time. Another way to understand this is to say that one can be confident that the actual achievement of the whole population of students, if we could actually measure it, would fall somewhere within the established range of scores 19 times out of 20. For example, when an observed difference is significant at the .05 level, it implies that, because of sampling or measurement error, the probability is less than .05 that the observed difference could have occurred. When comparing provinces, extensive use is made of this type of statistical test to reduce the likelihood that differences resulting from sampling or measurement errors will be interpreted as real.
In the figures in this report, confidence intervals are represented by the following symbol: . The data should be interpreted as the mean score plus or minus (±) the confidence interval. If the confidence intervals overlap, typically the differences are defined as not statistically significant.
When the confidence intervals between the mean scores being compared overlapped slightly, an additional test of significance (the t-test) is conducted in order to determine whether the difference is statistically significant. For comparisons between pan-Canadian and provincial results in this report, the Bonferroni adjusted t-test was used. This correction reduces the rate of false positive (or type 1) errors.
Small confidence intervals indicate greater accuracy—a better “fit” between the sample and the population it represents. A larger confidence interval indicates a wider range of scores within which the real mean score of the population falls.
Comparisons between results for English and French school systems
Caution is advised when comparing achievement results for the two language groups, even though assessment instruments were prepared collaboratively with due regard for equity for students in both groups. Every language has unique features that are not readily comparable. While the cognitive items, performance descriptors, scoring guides, and processes were judged equivalent in English and French, pedagogical, cultural, and geographical differences related to differences in language structure and use render direct comparisons between language groups inherently difficult, and any such comparisons should be interpreted with caution.

PCAP 2016 23
Results in reading by provinceTable 1.9 provides the mean scores in reading for all provinces participating in the PCAP 2016 Reading Assessment for Grade 8/Secondary II and indicates the extent to which the results differ statistically from the Canadian mean score.
These findings allow us to group provinces into categories in relation to the Canadian mean score. Students in British Columbia, Alberta, Ontario, Quebec, and Prince Edward Island achieved results that are statistically similar to the Canadian mean. Students in Saskatchewan, Manitoba, New Brunswick, Nova Scotia, and Newfoundland and Labrador achieved results below the Canadian mean score. Multiple comparisons of reading achievement among provinces can be found in Appendix B.25.
Table 1.9 Achievement scores in reading by province
Province Mean score Confidence interval (±)
Difference (Province–Canada)
British Columbia 509 4.9 2
Alberta 510 3.3 3
Saskatchewan 491 3.0 -16*
Manitoba 487 4.3 -20*
Ontario 512 4.3 5
Quebec 503 4.0 -4
New Brunswick 489 3.5 -18*
Nova Scotia 498 3.7 -9*
Prince Edward Island 513 7.2 6
Newfoundland and Labrador 491 5.2 -16*
Canada 507 2.1
* Denotes significant difference
Results in reading by language of the school systemIn Canada overall, students in English-language schools achieved higher scores than those in French-language schools in reading (Figure 1.5). This result is consistent with the result reported for Canadian Grade 4 students in PIRLS 2011 (Labrecque et al., 2012). However, this finding differs from the results reported for Canadian 15-year-olds in the 2015 PISA study, in which there was no significant difference between the two language systems in reading (O’Grady et al., 2016).

24 PCAP 2016
Figure 1.5 Canadian results in reading by language of the school system
500
509
400 420 440 460 480 500 520 540 560 580 600
French
English
Mean score
Table 1.10 presents a comparison of provincial results with the Canadian means for both English- and French-language school systems. In English-language systems, the achievement of students in British Columbia, Alberta, Ontario, Quebec, and Prince Edward Island is the same as the Canadian English mean; all other provinces scored below the Canadian English mean. In French-language schools in Quebec, students achieve the same as the Canadian French mean. For all other provinces, the results are significantly below the Canadian French mean (Appendix B.5).
Table 1.10 Comparison of Canadian and provincial results for reading by language of the school system
Anglophone school system
Above* the Canadian English mean At the Canadian English mean Below* the Canadian English mean
British Columbia, Alberta, Ontario, Quebec,
Prince Edward Island
Saskatchewan, Manitoba, New Brunswick, Nova Scotia, Newfoundland and Labrador
Francophone school system
Above* the Canadian French mean At the Canadian French mean Below* the Canadian French mean
Quebec British Columbia, Alberta, Saskatchewan, Manitoba, Ontario,
New Brunswick, Nova Scotia
* Denotes significant difference
The data reveal statistically different performance between anglophone and francophone school systems within each province in reading overall: students in the English-language system performed better than their counterparts in the French-language system (Table 1.11). In light of these findings, it would be prudent for policy-makers to further investigate the provincial results, given that differences between the majority- and the minority-language school systems were as much as 61 points on the overall reading scale (Appendix B.5).
Table 1.11 Summary of provincial results in reading by language of the school system
Anglophone schools performed significantly better
than francophone schools
Francophone schools performed significantly better
than anglophone schools
No significant difference between school systems
British Columbia, Alberta, Saskatchewan, Manitoba, Ontario,
Quebec, New Brunswick, Nova Scotia

PCAP 2016 25
Differences between anglophone and francophone school systems are also evident in the reading subdomains. At the Canadian level, students in anglophone schools performed better than their counterparts in francophone schools in the interpreting texts subdomain. The opposite pattern occurred for the responding personally to texts subdomain, with higher achievement in francophone schools for Canada overall (Table 1.12). At the provincial level, higher achievement compared to the Canadian mean was found in the English-language systems in Alberta for understanding texts and in Ontario for interpreting texts and responding critically to texts. British Columbia, Alberta, Ontario, Quebec, and Prince Edward Island were the only provinces in which student achievement was at or above the Canadian means in all four subdomains. In the francophone school system, students in Alberta and Ontario attained scores at the Canadian mean for the responding personally to texts and the responding critically to texts subdomains, and Quebec students attained scores similar to the Canadian means in the four reading subdomains (Table 1.13, Appendix B.8).
Table 1.12 Canadian results in reading subdomains by language of the school system
Reading subdomain
Anglophone school system Francophone school systemDifference
(English–French)Mean score Confidence interval (±)
Mean score
Confidence interval (±)
Understanding texts 501 2.1 497 4.5 4
Interpreting texts 506 2.3 480 3.7 26*
Responding personally to texts 498 2.6 506 4.2 -8*
Responding critically to texts 501 2.6 497 3.9 4
* Denotes significant difference

26 PCAP 2016
Table 1.13 Comparison of Canadian and provincial results in reading subdomains by language of the school system
Anglophone school system
Above* the Canadian English mean At the Canadian English mean Below* the Canadian English mean
Understanding texts
Alberta British Columbia, Ontario, Quebec, New Brunswick,
Nova Scotia, Prince Edward Island
Saskatchewan, Manitoba, Newfoundland and Labrador
Interpreting texts
Ontario British Columbia, Alberta, Quebec,
Prince Edward Island
Saskatchewan, Manitoba, New Brunswick, Nova Scotia, Newfoundland and Labrador
Responding personally to texts
British Columbia, Alberta, Ontario, Quebec,
Prince Edward Island
Saskatchewan, Manitoba, New Brunswick, Nova Scotia, Newfoundland and Labrador
Responding critically to texts
Ontario British Columbia, Alberta, Quebec, Prince Edward Island
Saskatchewan, Manitoba, New Brunswick, Nova Scotia, Newfoundland and Labrador
Francophone school system
Above* the Canadian French mean At the Canadian French mean Below* the Canadian French mean
Understanding texts
Quebec British Columbia, Alberta, Saskatchewan, Manitoba, Ontario,
New Brunswick, Nova Scotia
Interpreting texts
Quebec British Columbia, Alberta, Saskatchewan, Manitoba, Ontario,
New Brunswick, Nova Scotia
Responding personally to texts
Alberta, Ontario, Quebec
British Columbia, Saskatchewan, Manitoba, New Brunswick,
Nova Scotia
Responding critically to texts
Alberta, Ontario, Quebec
British Columbia, Saskatchewan, Manitoba,
New Brunswick, Nova Scotia
* Denotes significant difference

PCAP 2016 27
Within provinces, anglophone students in Saskatchewan, Manitoba, New Brunswick, and Nova Scotia achieved higher scores than their francophone peers in all four reading subdomains in PCAP 2016 (Table 1.14). The results were quite variable between subdomains for the other provinces (Appendix B.8).
Table 1.14 Summary of differences in provincial results in reading subdomains by language of the school system
Anglophone schools performed significantly better
than francophone schools
Francophone schools performed significantly better
than anglophone schools
No significant difference between school systems
Understanding texts
British Columbia, Alberta, Saskatchewan, Manitoba, Ontario,
New Brunswick, Nova Scotia
Quebec
Interpreting texts
British Columbia, Alberta, Saskatchewan, Manitoba,
Ontario, Quebec, New Brunswick, Nova Scotia
Responding personally to texts
Saskatchewan, Manitoba, New Brunswick, Nova Scotia
British Columbia, Alberta, Ontario, Quebec
Responding critically to texts
British Columbia, Saskatchewan, Manitoba, Ontario, New Brunswick,
Nova Scotia
Alberta, Quebec
Results in reading by genderAs was the case in PCAP 2007, girls performed significantly better than boys in PCAP 2016 on the reading assessment in Canada overall and in all provinces. On average across Canada, girls outperformed boys in reading by 27 points (Figure 1.6). At the provincial level, the gender gap favouring girls ranged from 18 points in Saskatchewan and Newfoundland and Labrador to 34 points in New Brunswick (Appendix B.6).
Figure 1.6 Canadian results in reading by gender
494
521
400 420 440 460 480 500 520 540 560 580 600
Males
Females
Mean score

28 PCAP 2016
Table 1.15 presents a comparison of provincial results with the Canadian means for girls and boys in reading overall. The achievement of girls and boys in British Columbia, Alberta, Ontario, Quebec, and Prince Edward Island, and for girls in Nova Scotia is statistically the same as the respective Canadian means for reading; all other provinces are below the respective Canadian mean scores.
Table 1.15 Comparison of Canadian and provincial results in reading by gender
Girls
Above* the Canadian mean for girls At the Canadian mean for girls Below* the Canadian mean for girls
British Columbia, Alberta, Ontario, Quebec, Nova Scotia,
Prince Edward Island
Saskatchewan, Manitoba, New Brunswick,
Newfoundland and Labrador
Boys
Above* the Canadian mean for boys At the Canadian mean for boys Below* the Canadian mean for boys
British Columbia, Alberta, Ontario, Quebec,
Prince Edward Island
Saskatchewan, Manitoba, New Brunswick, Nova Scotia, Newfoundland and Labrador
* Denotes significant difference
For Canada overall, girls outperformed boys in each subdomain in reading (Table 1.16), although there is much variability among the provinces. Only in British Columbia, Alberta, Ontario, and Prince Edward Island did both girls and boys achieve scores at or above the Canadian means in all four subdomains (Table 1.17).
Within provinces, girls achieved higher scores than boys in all provinces in the four reading subdomains, except in Prince Edward Island, where gender equity was found in the subdomain of understanding texts (Table 1.18, Appendix B.9).
Table 1.16 Canadian results in reading subdomains by gender
Reading subdomain
Girls BoysDifference
(Females–Males)Mean score Confidence interval (±)
Mean score
Confidence interval (±)
Understanding texts 509 3.6 492 2.6 17*
Interpreting texts 515 3.7 487 3.4 28*
Responding personally to texts 511 3.2 490 3.7 21*
Responding critically to texts 516 3.5 485 3.4 31*
* Denotes significant difference

PCAP 2016 29
Table 1.17 Comparison of Canadian and provincial results in reading subdomains by gender
Girls
Above* the Canadian mean for girls At the Canadian mean for girls Below* the Canadian mean for girls
Understanding texts
Alberta British Columbia, Ontario, Quebec, New Brunswick,
Nova Scotia, Prince Edward Island
Saskatchewan, Manitoba, Newfoundland and Labrador
Interpreting texts
Ontario British Columbia, Alberta, Nova Scotia,
Prince Edward Island
Saskatchewan, Manitoba, Quebec, New Brunswick,
Newfoundland and Labrador
Responding personally to texts
British Columbia, Alberta, Ontario, Quebec, Nova Scotia,
Prince Edward Island
Saskatchewan, Manitoba, New Brunswick,
Newfoundland and Labrador
Responding critically to texts
Ontario British Columbia, Alberta, Quebec, Nova Scotia, Prince Edward Island
Saskatchewan, Manitoba, New Brunswick,
Newfoundland and Labrador
Boys
Above* the Canadian mean for boys At the Canadian mean for boys Below* the Canadian mean for boys
Understanding texts
British Columbia, Alberta, Saskatchewan, Ontario, Quebec,
Nova Scotia, Prince Edward Island,
Newfoundland and Labrador
Manitoba, New Brunswick
Interpreting texts
Ontario British Columbia, Alberta, Prince Edward Island
Newfoundland and Labrador
Saskatchewan, Manitoba, Quebec, New Brunswick,
Nova Scotia
Responding personally to texts
British Columbia, Alberta, Ontario, Quebec,
Prince Edward Island
Saskatchewan, Manitoba, New Brunswick, Nova Scotia, Newfoundland and Labrador
Responding critically to texts
British Columbia, Alberta, Ontario, Quebec,
Prince Edward Island, Newfoundland and Labrador
Saskatchewan, Manitoba, New Brunswick, Nova Scotia
* Denotes significant difference

30 PCAP 2016
Table 1.18 Summary of difference in provincial results in reading subdomains by gender
Girls performed significantly better than boys
Boys performed significantly better than girls
No significant difference between boys and girls
Understanding texts
British Columbia, Alberta, Saskatchewan, Manitoba,
Ontario, Quebec, New Brunswick, Nova Scotia, Newfoundland and Labrador
Prince Edward Island
Interpreting texts
All provinces
Responding personally to texts
All provinces
Responding critically to texts
All provinces
Change in reading performance over time15
Although reading was the major domain in PCAP 2007 and 2016, changes in sampling and scales, discussed above (see page 21), render comparisons between these two assessments problematic, and so PCAP 2010 is used as the basis for comparison with PCAP 2016. As shown in Figure 1.7, there was a significant positive change in achievement between 2010 and 2016 in Canada overall, although the results remained stable over the last two administrations of the PCAP Reading Assessment. Within provinces, the greatest gain occurred in Prince Edward Island (32 points). A positive change in reading overall was also found in British Columbia, Manitoba, Quebec, New Brunswick, and Nova Scotia; no significant change over time was found in the remaining provinces (Table 1.19, Appendix B.10).
When reading results were examined by the language of the school system, a positive change over time was found in francophone schools, while results remained stable in anglophone schools in Canada as a whole (Figure 1.7). As shown in Table 1.19, six provinces (British Columbia, Manitoba, Quebec, New Brunswick, Nova Scotia, and Prince Edward Island) saw improvement in the scores in their anglophone schools between 2010 and 2016. The only negative changes over time were in the francophone school systems in Manitoba and in Nova Scotia (Table 1.19, Appendix B.11)
With respect to gender, positive changes over time were achieved by girls, while results remained stable for boys in Canada overall (Figure 1.7). Positive changes over time were achieved by both girls and boys in Quebec and in Prince Edward Island (Table 1.19). The results in other provinces were more variable: in some provinces, the scores of girls showed positive change while those of boys remained stable; in other provinces, the opposite was found (Table 1.19, Appendix B.12).
15 A linking error was not used when comparing results over time. This method is consistent with the TIMSS and PIRLS international studies.

PCAP 2016 31
Figure 1.7 Canadian results in reading achievement over time by language of the school system and gender*
489
515
480
507
500
494
521
501
510
508
494
521
500
509
507
400 420 440 460 480 500 520 540 560 580 600
Males
Females
French
English
Overall reading
Mean score
2016
2013
2010
* Difference compared to adjusted baseline (2010)

32 PCAP 2016
Table 1.19 Summary of provincial results for reading performance over time (2010–16) by language of the school system and gender*
Positive change over time Negative change over time No change over time
Reading overall
British Columbia, Manitoba, Quebec, New Brunswick,
Nova Scotia, Prince Edward Island
Alberta, Saskatchewan, Ontario, Newfoundland and Labrador
Anglophone school system
British Columbia, Manitoba, Quebec, New Brunswick,
Nova Scotia, Prince Edward Island
Alberta, Saskatchewan, Ontario, Newfoundland and Labrador
Francophone school system
Quebec Manitoba, Nova Scotia British Columbia, Alberta, Saskatchewan, Ontario,
New Brunswick
Girls
British Columbia, Alberta, Quebec, Nova Scotia, Prince Edward Island
Saskatchewan, Manitoba, Ontario, New Brunswick,
Newfoundland and Labrador
Boys
Manitoba, Quebec, New Brunswick,
Prince Edward Island, Newfoundland and Labrador
British Columbia, Alberta, Saskatchewan, Ontario,
Nova Scotia
* Difference compared to adjusted baseline (2010)
SummaryCanada continues to perform well in reading. In PCAP 2016, close to 90 per cent of Canadian Grade 8/Secondary II students reached at least the baseline level of reading proficiency (Level 2)—the level of achievement expected at this grade level—while almost one in seven students performed at Level 3.
In spite of these strong results, PCAP 2016 scores in reading literacy suggest some cause for concern. Over one in ten Canadian students do not meet the level of reading proficiency expected at the Grade 8/Secondary II level. In addition, students in minority-language settings achieve lower results than their counterparts in majority-language settings.
The gender difference in reading continues to persist in PCAP 2016, as well as in the international studies in which Canada participates. PIRLS 2011 (Labrecque et al., 2012), PISA 2012 (Brochu, Deussing, Houme, & Chuy, 2013), and PISA 2015 (O’Grady et al., 2016) all report that girls outperform boys on reading achievement scores. This gap in achievement may influence the tendency to read in later life.

PCAP 2016 33
There are also differences in achievement among provinces. The comparative approach taken in this chapter does not lend itself to developing explanations for these differences. Secondary analysis undertaken as part of the forthcoming report PCAP 2016: Contextual Report on Student Achievement in Reading will explore how resources and school and classroom conditions, as well as student characteristics and family circumstances, can affect achievement among Grade 8/Secondary II students.


PCAP 2016 35
MATHEMATICS ASSESSMENT
Mathematics was a minor domain in PCAP 2016 and so there were fewer assessment items compared to the major domain of reading. As a result, PCAP 2016 allows for only an update on overall performance in mathematics and not on its subdomains and processes. This chapter reports on the performance of Grade 8/Secondary II students across Canada and in the ten provinces for mathematics overall. It then breaks down the findings, reporting on the performance of students enrolled in anglophone and francophone school systems, comparing mathematics achievement by gender, and, finally, reporting on changes in mathematics performance over time.
Defining mathematicsFor the purpose of the PCAP 2016 assessment, mathematics is broadly defined as a conceptual tool that students can use to increase their capacity to calculate, describe, and solve problems. The overriding principle of the assessment is that the application of mathematics is an integrated act in which the skills and concepts of various content areas are inherently linked.
The PCAP Mathematics Assessment focuses on curricular outcomes that are common to all Canadian provinces at the Grade 8/Secondary II level. The domain is divided into four subdomains and five processes. The subdomains are traditional groupings of skills and knowledge. The processes are used in the application of all subdomains. Mathematics curricula within the various provinces in Canada are structured around a number of these mathematical processes, which are deemed essential to the effective study of the subject. These processes reflect the means by which students acquire and apply mathematical knowledge and skills and are not intended to be separated from the knowledge and skills acquired through the curriculum content.
The PCAP mathematics subdomains are as follows:
• numbers and operations: percentages, equivalent representations, rates, ratio, and proportionality
• geometry and measurement: properties of 2-D figures and 3-D shapes, relative position, transformations, and measurement
• patterns and relationships: patterns and algebraic expressions, linear relations, and equations
• data management and probability: data collection, organization, and analysis; experimental and theoretical probability
The PCAP mathematics processes are:
• problem solving • communication • representation • reasoning and proof • connections
2

36 PCAP 2016
Results in mathematicsPCAP 2016 mean scores in mathematics are reported on the PCAP scale, which has a range of 0–1000. In the baseline year for mathematics (PCAP 2010), the Canadian mean was set at 500, with a standard deviation of 100. To facilitate direct comparisons over time, the Canadian mean has not been rescaled to 500 following the baseline year.
Results in mathematics by provinceTable 2.1 provides the mean scores in mathematics for all provinces and indicates the extent to which the achievement results differ statistically from the Canadian mean score. Students in Quebec have the highest achievement, with average scores well above the Canadian mean; students in Ontario and Prince Edward Island achieved results statistically similar to the Canadian mean; and students in all other provinces achieved scores statistically below the Canadian mean. Multiple comparisons of mathematics achievement among provinces can be found in Appendix B.26.
Table 2.1 Achievement scores in mathematics by province
Province Mean score Confidence interval (±)
Difference (Province–Canada)
British Columbia 494 3.4 -17*
Alberta 505 3.3 -6*
Saskatchewan 483 3.0 -28*
Manitoba 479 4.3 -32*
Ontario 508 3.7 -3
Quebec 541 3.7 30*
New Brunswick 498 3.4 -13*
Nova Scotia 497 2.8 -14*
Prince Edward Island 503 6.7 -8
Newfoundland and Labrador 490 4.1 -21*
Canada 511 2.2
* Denotes significant difference
Results in mathematics by language of the school systemFigure 2.1 presents the mathematics performance of students enrolled in provinces with a sufficiently large sample size to allow for separate reporting on students in the English-language and French-language school systems. Overall, students in French-language school systems achieved significantly higher scores in mathematics than those in English-language systems. This result is consistent with previous PCAP assessments and with the results of international standardized tests in which Canada participates. For 15-year-olds in PISA 2015 (O’Grady et al., 2016) and for both Grade 4 and Grade 8 students in TIMSS (Trends in International Mathematics and Science Study) 2015 (Brochu et al.,

PCAP 2016 37
2017), achievement in mathematics in Canadian francophone school systems was significantly higher than that in anglophone school systems.
Figure 2.1 Canadian results in mathematics by language of the school system
Table 2.2 presents a comparison of provincial results with the Canadian mean in mathematics for each of the two language systems. Quebec students in the anglophone school system achieved higher scores than the Canadian English mean. Alberta, Ontario, Nova Scotia, and Prince Edward Island students in English-language schools and Quebec students in French-language schools achieved scores similar to the respective Canadian means for language. The results are significantly below the Canadian English and French means for all other provinces (Appendix B.14).
Within provinces, there were no differences between the two language systems in mathematics performance in Alberta and Manitoba (Table 2.3). The remaining provinces show a statistically different performance in mathematics in favour of the francophone school system (Appendix B.14).
Table 2.2 Comparison of Canadian and provincial results for mathematics by language of the school system
Anglophone school system
Above* the Canadian English mean At the Canadian English mean Below* the Canadian English mean
Quebec Alberta, Ontario, Nova Scotia, Prince Edward Island
British Columbia, Saskatchewan, Manitoba, New Brunswick,
Newfoundland and Labrador
Francophone school system
Above* the Canadian French mean At the Canadian French mean Below* the Canadian French mean
Quebec British Columbia, Alberta, Saskatchewan, Manitoba, Ontario,
New Brunswick, Nova Scotia
* Denotes significant difference
Table 2.3 Summary of provincial results in mathematics by language of the school system
Anglophone schools performed significantly better
than francophone schools
Francophone schools performed significantly better
than anglophone schools
No significant difference between school systems
British Columbia, Saskatchewan, Ontario, Quebec, New Brunswick,
Nova Scotia
Alberta, Manitoba
540
502
400 420 440 460 480 500 520 540 560 580 600
French
English
Mean score

38 PCAP 2016
Results in mathematics by gender In PCAP 2016, there was no gender difference in mathematics (Figure 2.2). This finding is consistent with the results for Grade 8/Secondary II students in both PCAP 2010 (CMEC, 2011) and TIMSS 2015 (Brochu et al., 2017). However, boys outperformed girls in mathematics at the Grade 4 level in TIMSS 2015 and among 15-year-olds in PISA 2015 (O’Grady et al., 2016).
Figure 2.2 Canadian results in mathematics by gender
512
511
400 420 440 460 480 500 520 540 560 580 600
Males
Females
Mean score
Table 2.4 presents a comparison of provincial results with the Canadian means for mathematical achievement for girls and boys. Girls and boys in Quebec achieved higher scores than the Canadian means; both boys and girls in Alberta, Ontario, and Prince Edward Island had achievement that was statistically the same as the respective Canadian means. All other provinces were below the Canadian mean scores for girls and boys. Within provinces, there was no gender gap in mathematics, except in Saskatchewan, where boys outperformed girls (Table 2.5, Appendix B.15).
Table 2.4 Comparison of Canadian and provincial results in mathematics by gender
Girls
Above* the Canadian mean for girls At the Canadian mean for girls Below* the Canadian mean for girls
Quebec Alberta, Ontario, Prince Edward Island
British Columbia, Saskatchewan, Manitoba, New Brunswick,
Nova Scotia, Newfoundland and Labrador
Boys
Above* the Canadian mean for boys At the Canadian mean for boys Below* the Canadian mean for boys
Quebec Alberta, Ontario, Prince Edward Island
British Columbia, Saskatchewan, Manitoba, New Brunswick,
Nova Scotia, Newfoundland and Labrador
* Denotes significant difference

PCAP 2016 39
Table 2.5 Summary of provincial results in mathematics by gender
Girls performed significantly better than boys
Boys performed significantly better than girls
No significant difference between girls and boys
Saskatchewan British Columbia, Alberta, Manitoba, Ontario, Quebec, New Brunswick, Nova Scotia,
Prince Edward Island, Newfoundland and Labrador
Change in mathematics performance over timeThe mathematics framework statement for PCAP 2016 has not been altered from that used to define mathematics performance in the 2010 assessment, in which mathematics was the major domain. This enables comparisons over time between the cohorts.
As shown in Figure 2.3, there has been a positive change in overall mathematics achievement in Canada between the baseline year and 2016. Table 2.6 summarizes provincial results in mathematics over time. All provinces show a positive change in achievement in mathematics, except in Ontario where the results have remained stable. The greatest gains occurred in Prince Edward Island (43 points) and Quebec (26 points) (Appendix B.16).
Positive change in mathematics achievement is evident in both anglophone and francophone school systems for Canada overall. Yet, the change in achievement in French-language schools (25 points) was much greater than that in English-language schools (7 points) (Figure 2.3). Within provinces, the greatest improvement compared to the baseline year were found in both language systems in British Columbia, Quebec, and New Brunswick; however, in all provinces mathematics achievement in both systems either remained stable or showed improvement over time compared to PCAP 2010 (Table 2.6, Appendix B.23)
There was a positive change for both girls and boys (12 points and 8 points, respectively) in PCAP 2016 mathematics results compared to the baseline year (Figure 2.3). Higher scores were attained by both girls and boys in 2016 in Manitoba, Quebec, New Brunswick, Nova Scotia, Prince Edward Island, and Newfoundland and Labrador (Table 2.6, Appendix B.18).

40 PCAP 2016
Figure 2.3 Canadian results in mathematics achievement over time by language of the school system and gender*
504
499
515
495
500
507
507
526
501
507
512
511
540
502
511
400 420 440 460 480 500 520 540 560 580 600
Males
Females
French
English
Overall mathematics
Mean score
2016
2013
2010
* Difference compared to baseline (2010).

PCAP 2016 41
Table 2.6 Summary of provincial results for mathematics achievement over time by language of the school system and gender*
Positive change over time Negative change over time No change over time
Mathematics overall
British Columbia, Alberta, Saskatchewan, Manitoba, Quebec, New Brunswick,
Nova Scotia, Prince Edward Island, Newfoundland and Labrador
Ontario
Anglophone school system
British Columbia, Alberta, Saskatchewan, Manitoba, Quebec, New Brunswick,
Nova Scotia, Prince Edward Island, Newfoundland and Labrador
Ontario
Francophone school system
British Columbia, Ontario, Quebec, New Brunswick
Alberta, Saskatchewan, Manitoba, Nova Scotia
Girls
British Columbia, Alberta, Manitoba, Quebec,
New Brunswick, Nova Scotia, Prince Edward Island,
Newfoundland and Labrador
Saskatchewan, Ontario
Boys
Saskatchewan, Manitoba, Quebec, New Brunswick,
Nova Scotia, Prince Edward Island, Newfoundland and Labrador
British Columbia, Alberta, Ontario
* Difference compared to baseline (2010)
SummaryThis chapter has presented the performance of Canadian students in the PCAP 2016 Mathematics Assessment. The assessment focuses on curricular outcomes that are common to all the Canadian provinces at the Grade 8/Secondary II level. In 2016, provincial scores ranged from a low of 479 to a high of 541.
Compared with the baseline established in PCAP 2010 (500 ± 2.2), mathematics achievement in Canada increased by 11 points (511 ± 2.2). All provinces showed improvement, with the exception of Ontario, where results remained the same as those in the baseline year. In many provinces, higher scores than in 2010 were attained by students in both anglophone and francophone school systems and by both girls and boys.

42 PCAP 2016
Students in French-language school systems continue to outperform their English-language counterparts in mathematics in Canada overall. Among provinces that participated in both official languages, only students in Alberta and Manitoba achieved at the same levels in both language systems. For Canada overall, changes in mathematics achievement over time have been greater in francophone school systems (25 points) compared with anglophone school systems (7 points) between 2016 and the baseline year of 2010.
There is no gender gap in mathematics at the Grade 8/Secondary II level in Canada overall. Within provinces, there was no gender gap, except in Saskatchewan, where boys outperformed girls by 10 points in mathematics.

PCAP 2016 43
SCIENCE ASSESSMENT
Science was a minor domain in PCAP 2016 and so there were fewer assessment items compared to the major domain of reading. As a result, PCAP 2016 allows for only an update on overall performance in science and not on its subdomains. Therefore, this chapter reports on the performance of Grade 8/Secondary II students across Canada and in the ten provinces for science overall. It then breaks down the findings, reporting on the performance of students enrolled in anglophone and francophone school systems, comparing science performance by gender, and, finally, reporting on changes in science performance over time.
Defining scienceScientific literacy, as outlined in the PCAP 2016 assessment framework (CMEC, 2016), builds on two other CMEC initiatives in Canadian science education: the School Achievement Indicators Program (SAIP) science assessments (CMEC 1996, 2005b) and the Common Framework of Science Learning Outcomes K to 12 (CMEC, 1997). The curriculum on which the PCAP Science Assessment is based reflects common elements of science curricula in Canadian provinces. PCAP is not intended to be a comprehensive assessment of outcomes in the science curricula of specific provinces.
Science at the Grade 8/Secondary II level aims to provide all students with foundations for future study in sciences. Yet, not all students will pursue sciences in postsecondary settings. Therefore, an important and universal goal of Canadian science curricula is to equip students with an understanding of the roles that science and technology play in society. Science curricula in Canadian provinces aim to develop students’ competence in problem solving and their ability to apply the principles of scientific inquiry and skills associated with scientific reasoning to real-world situations and familiar problems.
For PCAP assessment purposes, the domain of science is divided into three competencies and four subdomains.
The three PCAP science competencies are:
• science inquiry: understanding how inquiries are conducted in science to provide evidence-based explanations of natural phenomena
• problem solving: using scientific knowledge and skills to solve problems in social and environmental contexts
• scientific reasoning: being able to reason scientifically and make connections by applying scientific knowledge and skills to make decisions and address issues involving science, technology, society, and the environment
3
“Scientific literacy reflects the emphasis of ‘science for all’ and is inclusive of both those who choose to pursue further study in science and those who choose other careers and interests that are not specific to science.” (CMEC, 2016, p. 41)

44 PCAP 2016
The PCAP science subdomains are as follows:
• nature of science: understanding the nature of scientific knowledge and the processes by which that knowledge develops
• life science: understanding the characteristics and needs of living things; cells and cell components; and the processes, functions, and systems responsible for the maintenance of an organism’s life
• physical science: describing the properties and components of matter and explaining interactions between those components
• Earth science: explaining how water is a resource for society and understanding patterns of change and their effect on water resources on Earth
Results in sciencePCAP 2016 mean scores in science are reported on the PCAP scale, which has a range of 0–1000. In the baseline year for science (PCAP 2013), the Canadian mean was set at 500, with a standard deviation of 100. To facilitate direct comparisons over time, the Canadian mean has not been rescaled to 500 following the baseline year.
Results in science by provinceTable 3.1 provides the mean scores in science for all provinces and indicates whether the achievement results differ statistically from the Canadian mean score. Students in Alberta have the highest achievement, with average scores above the Canadian mean; students in British Columbia, Ontario, Quebec, Prince Edward Island, and Newfoundland and Labrador achieved results statistically similar to the Canadian mean; and students in all other provinces achieved scores below the Canadian mean. Multiple comparisons of science achievement among provinces can be found in Appendix B.27.

PCAP 2016 45
Table 3.1 Achievement scores in science by province
Province Mean score Confidence interval (±)
Difference (Province–Canada)
British Columbia 505 4.0 -3
Alberta 518 3.3 10*
Saskatchewan 491 3.9 -17*
Manitoba 491 3.2 -17*
Ontario 510 4.0 2
Quebec 507 4.5 -1
New Brunswick 500 3.0 -8*
Nova Scotia 499 2.5 -9*
Prince Edward Island 516 7.5 8
Newfoundland and Labrador 501 5.1 -7
Canada 508 2.0
* Denotes significant difference
Results in science by language of the school systemFigure 3.1 presents the science performance of students in provinces with a sufficiently large sample size to allow for separate reporting for students in the English-language and French-language school systems. There is no significant difference in achievement between students in these two school systems. This finding is consistent with results from other studies. No significant difference between the two language systems was reported for Canadian 15-year-olds in the 2015 PISA study for science (O’Grady et al., 2016) or for both Grade 4 and Grade 8/Secondary II students in TIMSS 2015 (Brochu et al., 2017). In PCAP 2013, anglophone students outperformed their peers in the francophone school system in science (O’Grady & Houme, 2014).
Figure 3.1 Canadian results in science by language of the school system
506
508
400 420 440 460 480 500 520 540 560 580 600
French
English
Mean score
Table 3.2 presents a comparison of provincial results with the Canadian mean in science for each of the two language systems. In the English-language school system, students in Alberta achieved scores significantly higher than the Canadian English mean, while student achievement in British Columbia, Ontario, New Brunswick, Prince Edward Island, and Newfoundland and Labrador was statistically

46 PCAP 2016
similar to the Canadian English mean; all other provinces are below the Canadian English mean. In French-language schools in British Columbia, Alberta, and Quebec, students achieved scores similar to the Canadian French mean; for all other provinces, the results were significantly below the Canadian French mean (Appendix B.20).
Within provinces, there were no differences between the two language systems in science performance in British Columbia and New Brunswick (Table 3.3). The remaining provinces show a statistically different performance in science between anglophone and francophone school systems (Appendix B.20).
Table 3.2 Comparison of Canadian and provincial results in science by language of the school system
Anglophone school system
Above* the Canadian English mean At the Canadian English mean Below* the Canadian English mean
Alberta British Columbia, Ontario, New Brunswick,
Prince Edward Island, Newfoundland and Labrador
Saskatchewan, Manitoba, Quebec, Nova Scotia
Francophone school system
Above* the Canadian French mean At the Canadian French mean Below* the Canadian French mean
British Columbia, Alberta, Quebec
Saskatchewan, Manitoba, Ontario, New Brunswick,
Nova Scotia
* Denotes significant difference
Table 3.3 Summary of provincial results in science by language of the school system
Anglophone schools performed significantly better
than francophone schools
Francophone schools performed significantly better
than anglophone schools
No significant difference between school systems
Alberta, Manitoba, Ontario, Nova Scotia
Saskatchewan, Quebec British Columbia, New Brunswick
Results in science by genderIn PCAP 2016, girls outperformed boys in science (Figure 3.2). This finding differs from the results for Grade 8/Secondary II students in PCAP 2013 (O’Grady & Houme, 2014) and TIMMS 2015 (Brochu et al., 2017), both of which reported no gender gap in science. The PCAP 2016 results also differ from the Grade 4 results in TIMSS 2015 and among 15-year-olds in PISA 2015 (O’Grady et al., 2016), in which boys outperformed girls in science.

PCAP 2016 47
Figure 3.2 Canadian results in science by gender
505
511
400 420 440 460 480 500 520 540 560 580 600
Males
Females
Mean score
Table 3.4 presents a comparison of provincial results with the Canadian means for science achievement for girls and boys. In Alberta, girls achieved higher scores than the Canadian mean, whereas boys achieved scores similar to the Canadian mean. Both boys and girls in British Columbia, Ontario, Quebec, Prince Edward Island, and Newfoundland and Labrador had achievement that was statistically the same as the respective Canadian means. In no other provinces did both genders score at the Canadian mean; however, girls in New Brunswick and Nova Scotia, and boys in Newfoundland and Labrador, did perform at the Canadian mean. Within provinces, girls outperformed boys in Alberta, Manitoba, New Brunswick, and Nova Scotia; there was no gender gap in science in the remaining provinces (Table 3.5, Appendix B.21).
Table 3.4 Comparison of Canadian and provincial results in science by gender
Girls
Above* the Canadian mean for girls At the Canadian mean for girls Below* the Canadian mean for girls
Alberta British Columbia, Ontario, Quebec, New Brunswick,
Nova Scotia, Prince Edward Island,
Newfoundland and Labrador
Saskatchewan, Manitoba
Boys
Above* the Canadian mean for boys At the Canadian mean for boys Below* the Canadian mean for boys
British Columbia, Alberta, Ontario, Quebec,
Prince Edward Island, Newfoundland and Labrador
Saskatchewan, Manitoba, New Brunswick, Nova Scotia
* Denotes significant difference
Table 3.5 Summary of provincial results in science by gender
Girls performed significantly better than boys
Boys performed significantly better than girls
No significant difference between girls and boys
Alberta, Manitoba, New Brunswick, Nova Scotia
British Columbia, Saskatchewan, Ontario, Quebec,
Prince Edward Island, Newfoundland and Labrador

48 PCAP 2016
Change in science performance over timeThe science framework statement for PCAP 2016 has not been altered from that used to define science performance in the 2013 assessment, in which science was the major domain. This enables comparisons over time between the cohorts.
As shown in Figure 3.3, there has been positive change in science achievement between the baseline year and 2016 for Canada overall. Table 3.6 summarizes provincial results for science over time, showing a positive change for Manitoba, Quebec, New Brunswick, Nova Scotia, and Prince Edward Island for science overall.
Positive change in science achievement is evident in francophone schools, while results in anglophone schools remained stable (Figure 3.3). Although there was variability among provinces, achievement in all provinces in both language systems either remained stable or showed improvement over time compared to the baseline year (Table 3.6, Appendix B.23)
In Canada overall, there has also been a positive change in science scores for both girls and boys since 2013 (10 points and 6 points, respectively) (Figure 3.3). Higher science scores were obtained by both girls and boys in Manitoba, Quebec, New Brunswick, and Prince Edward Island, and by girls in Saskatchewan and Nova Scotia, while the results for other provinces remained stable over time (Table 3.6, Appendix B.24).
Figure 3.3 Canadian results in science achievement over time*
499
501
483
505
500
505
511
506
508
508
400 420 440 460 480 500 520 540 560 580 600
Males
Females
French
English
Overall Science
Mean score
2016
2013
* Difference compared to baseline (2013).

PCAP 2016 49
Table 3.6 Summary of provincial results in science achievement over time*
Positive change over time Negative change over time No change over time
Science overall
Manitoba, Quebec, New Brunswick, Nova Scotia,
Prince Edward Island
British Columbia, Alberta, Saskatchewan, Ontario,
Newfoundland and Labrador
Anglophone school system
Manitoba, Quebec, New Brunswick, Nova Scotia,
Prince Edward Island
British Columbia, Alberta, Saskatchewan, Ontario,
Newfoundland and Labrador
Francophone school system
Saskatchewan, Manitoba, Ontario, Quebec, New Brunswick
British Columbia, Alberta, Nova Scotia
Girls
Saskatchewan, Manitoba, Quebec, New Brunswick, Nova Scotia,
Prince Edward Island
British Columbia, Alberta, Ontario, Newfoundland and Labrador
Boys
Manitoba, Quebec, New Brunswick,
Prince Edward Island
British Columbia, Alberta, Saskatchewan, Ontario,
Nova Scotia, Newfoundland and Labrador
* Difference compared to baseline (2013)
SummaryThis chapter has presented the performance of Canadian students in the PCAP 2016 Science Assessment. The assessment focused on curricular outcomes that are common to the Canadian provinces at the Grade 8/Secondary II level. In 2016, provincial scores ranged from a low of 491 to a high of 518.
Compared with the baseline established in PCAP 2013 (500 ± 1.9), pan-Canadian science achievement has increased by 8 points (508 ± 2.0). Higher scores were attained for science overall, by students in francophone school systems, and by both girls and boys. Within provinces, science results either remained stable or improved between 2013 and 2016.
Overall in Canada, there was no significant difference in performance between English- and French- language schools in science. This differs from the 2013 assessment, in which anglophone students had the stronger performance. Within provinces, science achievement was higher in anglophone than francophone schools in Alberta, Manitoba, Ontario, and Nova Scotia, whereas students in francophone schools in Saskatchewan and Quebec outperformed their anglophone peers.

50 PCAP 2016
Girls outperformed boys in science in PCAP 2016 in Canada overall and in Alberta, Manitoba, New Brunswick, and Nova Scotia; there was no gender gap in the remaining provinces. These results differ somewhat from those PCAP 2013, the baseline year for science, in which no gender gap was found in science.

PCAP 2016 51
ASSESSMENT RESULTS BY PROVINCE
BRITISH COLUMBIA
Context statement
Social contextBritish Columbia has a population of more than four million. Eighty-six per cent of the population lives in urban areas, the largest portion of which is concentrated in the Greater Vancouver region. (http://www.gov.bc.ca/).
Organization of the school systemApproximately 550,000 students are enrolled in the public school system, 80,000 in independent schools, and over 2,200 in home schools. The province has 60 school districts, including one French-language district, the Conseil scolaire francophone. (For more information on the BC school system, go to http://www.gov.bc.ca/bced/.)
Language arts teachingIn recent years, the BC language arts curriculum has been redesigned according to a know-do-understand (KDU) model, which comprises the knowledge, competencies, and understandings that students are expected to achieve. Core competencies in communication, thinking, and personal and social responsibility are integrated throughout the new curriculum.
All students in British Columbia are required to take language arts from Kindergarten through Grade 12. The redesigned K–9 curriculum has been fully implemented since the 2016–17 school year. The Grade 10 curriculum is due for full implementation commencing in the 2018–19 school year and the Grade 11–12 curriculum commencing in the 2019–20 school year.
The curriculum for K–12 language arts is available in both English and French. For each subject and grade, the curriculum documents provide contextual information and supports, such as instructional samples, which may include suggestions for classroom assessment.
The provincial language arts curriculum integrates six broad areas (reading, writing, listening, speaking, viewing, and representing) that are intended to support student success in literacy and communication within and beyond the school context. The learning standards of the language arts curriculum (what students should know and be able to do) are grouped according to two curriculum organizers: Comprehend and Connect, and Create and Communicate. (More information on the language arts curriculum can be found at www.curriculum.gov.bc.ca.)
4

52 PCAP 2016
Language arts assessmentBritish Columbia’s provincial assessments are under revision, in order to align them with the new curriculum. All students in Grades 4 and 7 are assessed annually in reading, writing, and numeracy through the Foundation Skills Assessment (FSA). (For more detail on these assessments, see https://curriculum.gov.bc.ca/assessment-reporting/new-foundation-skills-assessment.)
Secondary school students in their senior years will be required to write numeracy and literacy assessments, which are cross-curricular in nature. The numeracy assessment will be in place in the 2017–18 school year, and the literacy assessment in the 2018–19 school year. Students also participate in two international assessments—the Progress in International Reading Literacy Study (PIRLS) and the Programme for International Student Assessment (PISA).
The British Columbia Ministry of Education has developed a set of performance standards in reading, writing, numeracy, and social responsibility for voluntary use in schools. Focusing on performance assessment, these standards are a resource to support ongoing instruction and assessment. They exemplify a criterion-referenced approach to student assessment, and they enable teachers, students, and parents to relate student performance to provincial expectations. (For more information on performance standards, see http://www.bced.gov.bc.ca/perf_stands/.) These performance standards will be reviewed and potentially updated to align with the redesigned provincial curriculum.
Results in readingThis section presents PCAP 2016 results in reading for British Columbia and Canada by performance levels and mean scores. Student achievement is reported in reading overall, by language of the school system, and by gender. The section concludes with a comparison of changes over time in reading achievement.
Results in reading by performance levelFigure BC.1 presents the performance of British Columbia students and that of Canadian students overall in the PCAP 2016 Reading Assessment. Eighty-eight per cent of students in British Columbia performed at or above Level 2 in reading (Level 2 is the baseline or expected level of reading proficiency for Grade 8 students), and 15 per cent of students achieved the highest level of performance (Level 3). These proportions are similar to those of Canadian students overall (Appendix B.1).
Eighty-nine per cent of students in the English-language school system in British Columbia achieved Level 2 or higher in reading, which was similar to the proportion among Canadian students overall. A lower proportion of students in the province’s French-language schools achieved at or above Level 2 (82 per cent) than was observed at the Canadian level (88 per cent). Within British Columbia, a significantly higher proportion of English-language students than French-language students achieved the expected proficiency level (Appendix B.2).
In British Columbia, 92 per cent of girls and 85 per cent of boys performed at Level 2 or above in reading, which is similar to the proportions by gender observed for Canadian students overall. A

PCAP 2016 53
considerably higher proportion of girls than boys in British Columbia achieved Level 3 (Appendix B.3).
Figure BC.1 Canada–British Columbia: results in reading by level of performance
15
15
9
8
12
18
12
11
12
12
76
75
72
73
78
76
73
74
74
74
10
10
18
19
10
6
15
15
14
15
0 20 40 60 80 100
CAN – Males
BC – Males
CAN – Females
BC – Females
CAN – French
BC – French
CAN – English
BC – English
CAN – Overall reading
BC – Overall reading
Percentage
Level 1
Level 2
Level 3
Note: Percentages may not add up to 100 due to rounding.
Results in reading by mean scoreFigure BC.2 summarizes the results by mean score of the PCAP Reading Assessment for students in British Columbia and Canada overall. The mean score of British Columbia students is the same as that of Canadian students overall (Appendix B.4).
The results for students in the French-language school system in British Columbia were significantly lower than the French-language results in the country overall, while students in the English-language school system in the province achieved results similar to those of students from English-language school systems across Canada. Within the province, anglophone students obtained significantly higher scores than their francophone counterparts, which is consistent with results at the pan-Canadian level (Appendix B.5).
Both girls and boys in British Columbia achieved scores in reading similar to those of girls and boys in the Canadian sample. As was the case for Canada overall, girls significantly outperformed boys in the province (Appendix B.6).

54 PCAP 2016
Figure BC.2 Canada–British Columbia: results in reading by mean score
494
521
500
509
507
495
523
478
509
509
400 420 440 460 480 500 520 540 560 580 600
Males
Females
French
English
Overall reading
Mean score
BC
CAN
Figure BC.3 and Tables BC.1 and BC.2 present the results in reading by subdomain for British Columbia and Canadian students. Overall, students in the province achieved results similar to the Canadian means on each of the four subdomains (Figure BC.3, Appendix B.7).
Figure BC.3 Canada–British Columbia: results in reading by subdomain
500
500
500
500
496
494
506
505
400 420 440 460 480 500 520 540 560 580 600
Responding criticallyto texts
Responding personallyto texts
Interpreting texts
Understanding texts
Mean score
BC
CAN
Students in English-language schools in British Columbia achieved results in the reading subdomains similar to those of anglophone students in Canada as a whole, but students in French-language schools in the province achieved lower scores in each of the four subdomains compared to the Canadian means for French-language schools (Table BC.1, Appendix B.8). Within the province, there was no significant difference between students in the English- and French-language school systems in the responding personally to texts subdomain; however, students in English-language schools outperformed those in French-language schools in the other three subdomains.

PCAP 2016 55
Table BC.1 Canada–British Columbia: results in reading by subdomain and language of the school system
Understanding texts Interpreting texts Responding
personally to textsResponding
critically to texts
Mean score CI (±) Mean score CI (±) Mean score CI (±) Mean score CI (±)
CAN English 501 2.1 506 2.3 498 2.6 501 2.6
BC English 506 6.4 506 4.6 494 6.2 496 4.8
Difference 5 0 4 5
CAN French 497 4.5 480 3.7 506 4.2 497 3.9
BC French 473 3.0 461 3.8 492 3.3 476 2.8
Difference 24* 19* 14* 21*
BC English 506 6.4 506 4.6 494 6.2 496 4.8
BC French 473 3.0 461 3.8 492 3.3 476 2.8
Difference 33* 45* 2 20*
* Denotes significant difference
British Columbia girls and boys achieved results similar to girls and boys in Canada in each of the four subdomains (Table BC.2, Appendix B.9). Within the province, girls outperformed boys in each of the four subdomains.
Table BC.2 Canada–British Columbia: results in reading by subdomain and gender
Understanding texts Interpreting texts Responding
personally to textsResponding
critically to texts
Mean score CI (±) Mean score CI (±) Mean score CI (±) Mean score CI (±)
CAN female 509 3.6 515 3.7 511 3.2 516 3.5
BC female 517 6.6 519 6.3 503 6.2 510 6.3
Difference 8 4 8 6
CAN male 492 2.6 487 3.4 490 3.7 485 3.4
BC male 494 7.0 493 7.2 484 6.3 483 6.8
Difference 2 6 6 2
BC female 517 6.6 519 6.3 503 6.2 510 6.3
BC male 494 7.0 493 7.2 484 6.3 483 6.8
Difference 23* 26* 19* 27*
* Denotes significant difference

56 PCAP 2016
Comparison of reading results over timeChanges in reading results in the province over time are presented in Figure BC.4. In British Columbia overall, there has been a positive change in achievement in reading from 2010 to 2016 (Appendix B.10). (As explained in Chapter 2, the baseline year for reading was adjusted to 2010, when the PCAP target group changed from 13-year old students to Grade 8 students.)
Anglophone school systems in the province showed a positive change from 2010 to 2016; francophone school systems were stable over the same period. For Canada as a whole, reading achievement showed positive change over time in French-language systems but remained stable in English-language systems (Appendix B.11).
In British Columbia, reading achievement underwent positive change over time for girls but was unchanged for boys over the same period. At the Canadian level, change was positive for girls and stable for boys from 2010 to 2016 (Appendix B.12).
Figure BC.4 British Columbia: results in reading over time
491
511
473
499
499
486
518
499
502
502
495
523
478
509
509
400 420 440 460 480 500 520 540 560 580 600
Males
Females
French
English
BC ‒ Overall reading
Mean score
2016
2013
2010

PCAP 2016 57
Results in mathematics and scienceAs noted in the introduction to this document, mathematics and science are both minor domains in PCAP 2016. Results for these domains are reported by mean scores only. This section presents mathematics and science scores for the province, compares BC and pan-Canadian scores, reports results by language of the school system and by gender, and presents multiple comparisons over time.
Results in mathematicsAs shown in Figure BC.5, British Columbia students achieved lower scores than the Canadian mean in mathematics in PCAP 2016 (Appendix B.13).
Students in both English- and French-language schools in British Columbia achieved scores below the respective Canadian means in mathematics by language. Within the province, students in francophone schools outperformed those in anglophone schools, which is consistent with the results for Canada overall (Appendix B.14).
Both girls and boys in British Columbia achieved scores in mathematics that were significantly lower than those for girls and boys in the Canadian sample. However, within the province, and for Canada overall, there was no gender gap in mathematics (Appendix B.15).
Figure BC.5 Canada–British Columbia: results in mathematics
As shown in Figure BC.6, in British Columbia, there was a positive change in achievement in mathematics in PCAP 2016 compared to the baseline year of 2010. At the Canadian level, positive, statistically significant change was also observed in 2016 compared to the 2010 baseline (Appendix B.16).
Positive change over time in mathematics occurred in both French- and English-language school systems in British Columbia, which is consistent with the pan-Canadian results (Appendix B.17).
512
511
540
502
511
492
497
516
494
494
400 420 440 460 480 500 520 540 560 580 600
Males
Females
French
English
Overallmathematics
Mean score
BC
CAN

58 PCAP 2016
In the province, mathematics achievement improved over time for girls but remained stable for boys. For Canada overall, both boys and girls achieved significantly higher scores in 2016 compared to the 2010 baseline (Appendix B.18).
Figure BC.6 British Columbia: results in mathematics over time
490
475
504
481
481
487
491
513
489
489
492
497
516
494
494
400 420 440 460 480 500 520 540 560 580 600
Males
Females
French
English
BC ‒ Overall mathematics
Mean score
2016
2013
2010
Results in scienceIn the PCAP 2016 Science Assessment, there was no statistically significant difference between achievement scores in British Columbia and Canada overall (Figure BC.7, Appendix B.19).
Science achievement in English- and French-language schools in the province was similar to the respective Canadian means. Within the province and at the Canadian level, there was no significant difference in science achievement by language of instruction (Appendix B.20).
Both girls and boys in British Columbia achieved science outcomes similar to girls and boys in Canada overall. Within British Columbia, boys and girls performed at a similar level, while girls outperformed boys in Canada as a whole (Appendix B.21).

PCAP 2016 59
Figure BC.7 Canada–British Columbia: results in science
505
511
506
508
508
503
507
502
505
505
400 420 440 460 480 500 520 540 560 580 600
Males
Females
French
English
Overall science
Mean score
BC
CAN
Figure BC.8 presents changes over time in science achievement in the province. No significant change is evident in overall science mean scores in British Columbia from 2013 (the baseline year) to 2016, a result that differs from the pan-Canadian results, which showed a positive change in science achievement (Appendix B.22).
Both English- and French-language school systems in British Columbia had statistically similar outcomes in science in 2013 and 2016. For Canada overall, anglophone school systems had stable results and francophone school systems saw a positive change in science achievement over the same period (Appendix B.23).
In British Columbia, girls and boys have had stable achievement in science between 2013 and 2016. Over the same period, results for Canadian boys and girls have shown a positive change in science achievement (Appendix B.24).

60 PCAP 2016
Figure BC.8 British Columbia: results in science over time
498
503
495
501
501
503
507
502
505
505
400 420 440 460 480 500 520 540 560 580 600
Males
Females
French
English
BC ‒ Overall science
Mean score
2016
2013

PCAP 2016 61
ALBERTA
Context statement
Social contextAlberta is home to a culturally diverse population of more than four million people, with recent growth due mainly to record levels of interprovincial and international migration into the province. Alberta has a relatively young population, with a median age of approximately 36 years, the lowest of all Canadian provinces.
Organization of the school systemThe government of Alberta has the primary responsibility for education in Kindergarten through Grade 12, and it shares this responsibility with local school boards.
Several school choices exist in Alberta, including public, separate, francophone, private, and charter schools. Separate schools, which can be either Roman Catholic (in most cases) or Protestant, are funded on the same basis as public schools. Students also have access to a number of unique and innovative programs, including home education, on-line or virtual schools, outreach programs, and alternative programs. Students in Alberta are required to attend school from ages 6 to 16, although parents may choose to home-school their children.
In the 2015–16 school year, 691,648 students were registered in 2,188 schools in Alberta. Of these students, 67 per cent attended public schools; 24 per cent attended separate schools; and the remaining 9 per cent attended a variety of private, charter, special, and federal schools. All students in each grade in the anglophone school system, regardless of the program they are in, enrol in English language arts. Likewise, all students registered in francophone programs enrol in Français (French first language). Approximately 8,066 students (1.17 per cent) were enrolled in French-first-language programs offered by the four francophone school authorities.
The senior high school English language arts program has three course sequences: English Language Arts 10-1, 20-1, and 30-1; English Language Arts 10-2, 20-2, and 30-2; and English Language Arts 10-4, 20-4, and 30-4.
The senior high school Français program, which is designed for francophone students, also has three course sequences: Français 10-1, 20-1, and 30-1; Français 10-2, 20-2, and 30-2; and Français 10-4, 20-4, and 30-4. The French language arts program, which is designed for French immersion students, has two course sequences: French Language Arts 10-1, 20-1, and 30-1 and French Language Arts 10-2, 20-2, and 30-2.
The first sequence listed in both English language arts and Français (i.e., 10-1, etc.) is designed for students in academic programs; the second sequence (i.e., 10-2, etc.) is for general program students; and the third sequence (i.e., 10-4, etc.) is for students enrolled in the Knowledge and Employability Program. Students may transfer from one course sequence to another, provided they meet certain requirements.

62 PCAP 2016
As the population of students who speak English as a second language (ESL) continues to grow, more ESL programs are offered to students whose level of English-language proficiency precludes them from full participation in the learning experiences provided in Alberta schools without additional support in English language development.
Language arts teachingIn the language arts, Alberta schools provide a variety of learning experiences so that students can read for information, understanding, and enjoyment, and can write and speak clearly, accurately, confidently, and appropriately for the context.
The following principles provide the framework for the English language arts program:
• Language skills are applied throughout life.
• Language facilitates the development of thinking skills, enabling students to reflect on and control their own thinking and learning processes.
• The six language arts strands—listening and speaking, reading and writing, viewing and representing—are interrelated and interdependent. Facility in one strengthens and supports the others.
• Literature plays an integral part in the language-learning program.
• Language is used to communicate understandings, ideas, and feelings, and it assists social and personal development.
• Language skills are essential throughout the entire curriculum.
• Language is closely interwoven with experiences in all learning situations. Print, on-line, and other media present ideas in diverse and characteristic ways.
• Language skills expand with practice.
In the case of French-first-language students, the development of language skills goes hand-in-hand with the development of francophone identity. The following principles provide the framework for developing French language arts for French-first-language students:
• Language is a communication tool.
• Language is considered in its totality.
• Numerous opportunities are available to use language, especially in interactive situations.
• Students are exposed to a wide variety of presentations, texts, passages, and excellent language models.
• Learning is geared towards finding meaning.
• Risk-taking is encouraged in a climate of trust.
• Learning situations are meaningful and interactive.
• Learning situations take into consideration student interests and needs.
• Learning situations allow students to make choices.

PCAP 2016 63
• Learning situations allow for diversity in learning styles and forms of intelligence.
• Numerous contacts are made with the francophone community/world and with its linguistic and cultural diversity.
Evaluation methods reflect and support these principles.
The English language arts curriculum has five general outcomes, each of which includes numerous specific outcomes that students are to achieve by the end of each grade level. The outcomes are interrelated and interdependent, and each is to be achieved through a variety of listening, speaking, reading, writing, viewing, and representing experiences.
The Français programs of study reflect the current curriculum and also make explicit the planning, monitoring, and evaluation strategies used by effective communicators.
In ESL teaching, the ESL program of studies (senior high), various ESL instructional guides, and authorized resources developed by the Alberta Ministry of Education provide teachers with teaching strategies. Examples include literature-based reading programs, literacy scaffolds, attention to phonics, and various pre-reading strategies. Many of the accommodations and effective strategies for teaching ESL students are similar to those used with other students who have special needs.
Language arts assessmentIn addition to extensive classroom assessment, student achievement in language arts has been monitored through curriculum-based Provincial Achievement Tests (PATs) that are administered annually at Grades 6 and 9. As well, Diploma Examinations, which count for 30 per cent of a student’s final mark in Grade 12 language arts courses such as English Language Arts 30-1 and 30-2, Français 30-1, and French Language Arts 30-1, are administered five times each year. All the language arts achievement tests and diploma examinations include an extensive written component, worth 50 per cent of the total examination/test mark. These tests and examinations, which are jointly developed by ministry staff and classroom teachers using provincial programs of study and provincial standards, provide information on the degree to which students in the province have met these standards. Following each major test administration, detailed reports at the school authority, school, class, and individual student levels are generated, based on the data collected from the provincial assessment, and are sent to schools. Teachers and other school authority personnel use these reports to help identify their students’ strengths and areas for instructional improvement.
A new provincial assessment at the Grade 3 level, called the Student Learning Assessment (SLA), was introduced in the 2014–15 school year, replacing the previous Grade 3 PAT. The SLA is a digitally based “check-in” assessment tool, administered at the beginning of the school year, that Alberta is developing to enable both parents and teachers to identify student strengths and areas of growth at the start of Grade 3. The SLA is available in English and in French. It is composed of a set of digital interactive literacy questions, a literacy performance task, a set of digital interactive numeracy questions, and a numeracy performance task. The SLA was a census pilot in 2014 and 2015 and a sample pilot in 2016. The evolution of the SLA in the 2016–17 school year will help inform next steps for the test.
For more information, see Alberta Education’s Web site, at http://education.alberta.ca (English) or http://education.alberta.ca/francais.aspx (French).

64 PCAP 2016
Results in readingThis section presents PCAP 2016 results in reading for Alberta and Canada by performance levels and mean scores. Student achievement is reported in reading overall, by language of the school system, and by gender. This section concludes with a comparison of changes over time in reading achievement.
Results in reading by performance levelFigure AB.1 presents the performance of Alberta students and that of Canadian students overall in the PCAP 2016 Reading Assessment. Eighty-eight per cent of students in Alberta performed at or above Level 2 in reading (Level 2 is the baseline or expected level of reading proficiency for Grade 8 students), and 16 per cent achieved the highest level (Level 3). These proportions are similar to those of Canadian students overall (Appendix B.1).
In Alberta, 88 per cent of students in the English-language school system achieved at or above Level 2 reading proficiency, which is similar to achievement among anglophones in Canada as a whole. In contrast, the proportion of students in French-language schools in the province that achieved at or above Level 2 (79 per cent) is significantly lower than the Canadian average for francophone students. Within Alberta, a significantly higher proportion of students in the anglophone system than in the francophone system achieved at or above the expected level of reading proficiency. This result contrasts with results in Canada overall, where there was no significant difference between the respective language groups (Appendix B.2).
A higher proportion of Alberta girls (92 per cent) than boys (85 per cent) achieved at or above Level 2, which is similar to the results for Canada overall. Girls were more likely than boys to achieve at the highest performance level (Level 3) both within Alberta and in Canada as a whole (Appendix B.3).
Figure AB.1 Canada–Alberta: results in reading by level of performance
15
15
9
8
12
21
12
12
12
12
76
73
72
70
78
71
73
72
74
72
10
12
18
21
10
8
15
16
14
16
0 20 40 60 80 100
CAN – Males
AB – Males
CAN – Females
AB – Females
CAN – French
AB – French
CAN – English
AB – English
CAN – Overall reading
AB – Overall reading
Percentage
Level 1
Level 2
Level 3
Note: Percentages may not add up to 100 due to rounding.

PCAP 2016 65
Results in reading by mean scoreFigure AB.2 presents the results by mean score of the PCAP Reading Assessment for students in Alberta and Canadian overall. The mean score of Alberta students is the similar to that of all Canadian students (Appendix B.4).
In Alberta, reading scores for students in French-language schools were significantly lower than the Canadian francophone mean, while students in English-language schools achieved scores similar to those of the Canadian anglophone sample (Appendix B.5). Within the province, anglophone students significantly outperformed francophone students in reading; this is consistent with scores at the pan-Canadian level.
Girls and boys in Alberta both obtained mean scores in reading similar to those of girls and boys across Canada (Appendix B.6). Within the province, girls significantly outperformed boys in reading, which was also the case in Canada overall.
Figure AB.2 Canada–Alberta: results in reading by mean score
494
521
500
509
507
496
528
481
511
510
400 420 440 460 480 500 520 540 560 580 600
Males
Females
French
English
Overall reading
Mean score
AB
CAN
Figure AB.3 and Tables AB.1 and AB.2 present the results in reading by subdomain for Alberta and Canadian students. Students in Alberta scored significantly higher than the Canadian mean for understanding texts (Appendix B.7). In the remaining subdomains, Alberta students obtained results similar to the Canadian mean.

66 PCAP 2016
Figure AB.3 Canada–Alberta: results in reading by subdomain
500
500
500
500
495
503
502
510
400 420 440 460 480 500 520 540 560 580 600
Responding criticallyto texts
Responding personallyto texts
Interpreting texts
Understanding texts
Mean score
AB
CAN
With regard to the language of the school system, Alberta students in francophone schools scored below Canadian francophone means for understanding texts and interpreting texts and at the Canadian French mean for the other two subdomains (Table AB.1). Students in anglophone systems scored significantly above the Canadian anglophone mean for understanding texts, and achieved results similar to the Canadian mean for the three other subdomains. Comparing performance by language group within the province, the findings show that student enrolled in French-languages schools scored significantly lower than those in English-language schools in two subdomains: understanding texts and interpreting texts (Appendix B.8).
Table AB.1 Canada–Alberta: results in reading by subdomain and language of the school system
Understanding texts Interpreting texts Responding
personally to textsResponding
critically to texts
Mean score CI (±) Mean score CI (±) Mean score CI (±) Mean score CI (±)
CAN English 501 2.1 506 2.3 498 2.6 501 2.6
AB English 510 5.2 502 4.7 503 5.3 495 5.1
Difference 9* 4 5 6
CAN French 497 4.5 480 3.7 506 4.2 497 3.9
AB French 471 8.3 461 9.6 499 8.8 487 8.9
Difference 26* 19* 7 10
AB English 510 5.2 502 4.7 503 5.3 495 5.1
AB French 471 8.3 461 9.6 499 8.8 487 8.9
Difference 39* 41* 4 8
* Denotes significant difference

PCAP 2016 67
Alberta girls performed significantly higher than the Canadian mean in the understanding texts subdomain. Otherwise, both girls and boys achieved scores similar to the respective Canadian mean scores for the subdomains. In Alberta, girls significantly outperformed boys in all subdomains (Table AB.2, Appendix B.9).
Table AB.2 Canada–Alberta: results in reading by subdomain and gender
Understanding texts Interpreting texts Responding
personally to textsResponding
critically to texts
Mean score CI (±) Mean score CI (±) Mean score CI (±) Mean score CI (±)
CAN female 509 3.6 515 3.7 511 3.2 516 3.5
AB female 520 4.8 522 5.6 519 5.1 511 6.2
Difference 11* 7 8 5
CAN male 492 2.6 487 3.4 490 3.7 485 3.4
AB male 501 7.3 484 7.6 489 5.2 480 5.8
Difference 9 3 1 5
AB female 520 4.8 522 5.6 519 5.1 511 6.2
AB male 501 7.3 484 7.6 489 5.2 480 5.8
Difference 19* 38* 30* 31*
* Denotes significant difference
Comparison of reading results over timeIn PCAP 2016, Alberta students’ reading scores were similar to those from 2010, which is the baseline year for the PCAP reading domain (Figure AB.4, Appendix B.10). (As explained in Chapter 2, the baseline year for reading was adjusted to 2010, when the PCAP target group changed from 13-year-old students to Grade 8 students.)
In Alberta, students in both French- and English-language school systems had similar reading scores in PCAP 2016 and the 2010 baseline. For Canada as a whole, French-language systems achieved positive change between 2010 and 2016, while scores for English-language school systems were statistically similar (Appendix B.11).
Girls in Alberta achieved positive change over time in reading. Boys’ reading achievement was more variable, but there was no significant difference between boys’ reading scores in 2010 and 2016. At the Canadian level, girls achieved significant, positive change in reading achievement, while boys’ results remained stable in 2016 compared to the 2010 baseline (Appendix B.12).

68 PCAP 2016
Figure AB.4 Alberta: results in reading over time
497
516
490
506
506
485
518
473
503
502
496
528
481
511
510
400 420 440 460 480 500 520 540 560 580 600
Males
Females
French
English
AB ‒ Overall reading
Mean score
2016
2013
2010
Results in mathematics and scienceAs noted in the introduction to this document, mathematics and science are both minor domains in PCAP 2016. Results for these domains are reported by mean scores only. This section presents mathematics and science scores for the province, compares Alberta and pan-Canadian scores, reports results by language of the school system and by gender, and presents multiple comparisons over time.
Results in mathematicsAs shown in Figure AB.5, which displays the mathematics achievement of Alberta and Canadian students on PCAP 2016, students in the province scored below the Canadian mean (Appendix B.13).
Students from English-language school systems in Alberta obtained scores in mathematics similar to the Canadian anglophone mean, while students in French-language schools in the province scored well below francophone students in Canada overall. Within Alberta, the math scores of both language groups were statistically similar. This result differs from mathematics achievement by language of the school system for Canada as a whole, in which francophone students outperformed their anglophone peers (Appendix B.14).

PCAP 2016 69
In Alberta, girls and boys both achieved mean scores similar to those of girls and boys at the pan-Canadian level. Within the province, and for Canada overall, there was no gender gap in mathematics (Appendix B.15).
Figure AB.5 Canada–Alberta: results in mathematics
512
511
540
502
511
504
507
506
505
505
400 420 440 460 480 500 520 540 560 580 600
Males
Females
French
English
Overallmathematics
Mean score
AB
CAN
Figure AB.6 shows that students in Alberta achieved statistically higher scores in mathematics in PCAP 2016 than in 2010, which is the baseline year for PCAP mathematics. Across Canada, students also showed positive, significant change in mathematics from 2010 to 2016 (Appendix B.16).
Students in Alberta’s English-language school systems had significant achievement gains in 2016 over 2010. Scores achieved by students in French-language schools in Alberta were stable over time. For Canada overall, mathematics results improved between 2010 and 2016 for both anglophone and francophone students (Appendix B.17).
In Alberta, girls achieved significant, positive change in mathematics in PCAP 2016 compared to the 2010 baseline, while mathematics achievement for boys remained stable. At the pan-Canadian level, both boys and girls achieved higher scores in mathematics in 2016 compared to 2010 (Appendix B.18).

70 PCAP 2016
Figure AB.6 Alberta: results in mathematics over time
500
491
504
495
495
499
504
502
502
502
504
507
506
505
505
400 420 440 460 480 500 520 540 560 580 600
Males
Females
French
English
AB ‒ Overall mathematics
Mean score
2016
2013
2010
Results in scienceIn the PCAP 2016 Science Assessment, Alberta students achieved higher scores than the Canadian mean (Figure AB.7, Appendix B.19).
Students in the English-language school system in the province obtained higher scores in science than anglophone students in Canada overall, whereas students in the province’s French-language school system achieved below the Canadian francophone mean. Within the province, anglophone students outperformed francophone students in science. This result contrasts with science achievement at the Canadian level, where there was no significant difference between the two language groups (Appendix B.23).
The science scores for girls in Alberta were higher than those for girls in Canada as a whole, while boys achieved scores similar to the Canadian mean for their gender. Within the province, girls achieved significantly higher scores in science than boys, which was consistent with the results at the pan-Canadian level (Appendix B.24).

PCAP 2016 71
Figure AB.7 Canada–Alberta: results in science
505
511
506
508
508
512
526
496
518
518
400 420 440 460 480 500 520 540 560 580 600
Males
Females
French
English
Overall science
Mean score
AB
CAN
Figure AB.8 presents changes over time in science achievement in the province. No significant change is evident in overall science mean scores in Alberta from 2013 (the baseline year) to 2016, a result that differs from the pan-Canadian results, which showed positive change in science achievement (Appendix B.22).
Both English- and French-language school systems in Alberta had statistically similar outcomes in science in 2013 and 2016. For Canada overall, anglophone school systems had stable results and francophone school systems saw a positive change in science achievement over the same period (Appendix B.23).
In Alberta, girls and boys had stable achievement in science between 2013 and 2016. Over the same period, results for Canadian boys and girls showed a positive change in science achievement (Appendix B.24).
Figure AB.8 Alberta: results in science over time
516
525
488
521
521
512
526
496
518
518
400 420 440 460 480 500 520 540 560 580 600
Males
Females
French
English
AB ‒ Overall science
Mean score
20162013

72 PCAP 2016
SASKATCHEWAN
Context statement
Social contextSaskatchewan has a population of just over 1.1 million, its largest population in the past 60 years, which is spread throughout a vast geographic area. About half of Saskatchewan’s population lives in towns, villages, rural municipalities, or on First Nation reserves, providing a strong rural influence in the province. Potash and uranium mining, oil production, agriculture, and forestry are the major industries. Saskatchewan has a diverse cultural and ethnic heritage, including a large and growing First Nation and Métis population and an increased number of immigrants from around the world.
Organization of the school systemSaskatchewan has approximately 197,000 students in Kindergarten to Grade 12. About 90 per cent of elementary/secondary students attend 750 publicly funded provincial schools; 7 per cent attend First Nation schools, and the remainder attend independent schools or are home-schooled. The average class size is 18.7 students, with the typical rural classroom having about two to three fewer students than the typical urban classroom.
Language arts teachingThe purpose of the Saskatchewan language arts curriculum is to guide the continuous growth and development of students’ speaking, listening, reading, writing, viewing, representing, and thinking abilities. An integrated, resource-based approach to instruction aims to develop students’ understanding and appreciation of language and literature. The general goals of Saskatchewan’s English language arts curriculum are to:
• encourage the enjoyment of, and develop proficiency in, speaking, listening, reading, writing, viewing, and representing;
• develop students’ appreciation of, and response to, literature;
• develop students’ English-language abilities as a function of their thinking abilities; and
• promote personal growth and social development by developing students’ knowledge and use of the English language.
Language arts assessmentClassroom teachers in Saskatchewan are responsible for assessment, evaluation, and promotion of students from Kindergarten through Grade 11. In Grade 12, those teachers who are accredited in Grade 12 English language arts continue to determine students’ final marks. However, teachers who are not accredited in this subject are responsible for determining only 60 per cent of each student’s final mark; the other 40 per cent is determined by a departmental exam.

PCAP 2016 73
In all grades, students are assessed on the full range of knowledge, skills, attitudes, and values that are reflected in the curriculum. Teachers are encouraged to develop diversified evaluation plans that reflect the various instructional methods they use in adapting instruction to each class and to each student.
In Saskatchewan, reading level data are collected at the end of the school year by the Ministry of Education for Grades 1–3 English and Fransaskois students and Grades 2 and 3 French immersion students. All provincial schools are required to use an approved levelled reading program; the majority of schools use the Fountas and Pinnell Leveled Literacy Intervention System (LLI). All assessments in use have been correlated, and benchmarks have been established, using criteria from the provincial curricula. Reading is one of the priorities established in the province-wide Education Sector Strategic Plan (ESSP), co-developed by all the education sector partners, the 28 school boards, and the Ministry of Education. The reading goal in the ESSP is to have 80 per cent of students reading at or above grade level by 2020.
For more information about education in Saskatchewan, visit the Ministry of Education’s Web site at http://www.saskatchewan.ca/residents/education-and-learning.
Results in readingThis section presents PCAP 2016 results in reading for Saskatchewan and Canada by performance levels and mean scores. Student achievement is reported in reading overall, by language of the school system, and by gender. This section concludes with a comparison of changes over time in reading achievement.
Results in reading by performance levelFigure SK.1 presents the performance of Saskatchewan students and that of Canadian students overall in the PCAP 2016 Reading Assessment. Eighty-four per cent of students in Saskatchewan achieved Level 2 or higher in reading (Level 2 is considered the baseline or expected level of reading proficiency for Grade 8 students). The proportion of Saskatchewan students at Level 2 was similar to the Canadian average; however, a significantly lower percentage of students in the province achieved at Level 3 compared to the overall Canadian sample (Appendix B.1).
In Saskatchewan, 84 per cent of students enrolled in anglophone schools and 85 per cent of students enrolled in francophone schools achieved Level 2 or higher in reading, which was lower than the Canadian averages for the respective language groups. Within the province, there was no significant difference by language group in the proportion of students achieving at or above the expected reading proficiency for Grade 8, which is consistent with the results at the pan-Canadian level. Both provincially and for Canada overall, a higher proportion of anglophone students attained Level 3 compared to their francophone peers (Appendix B.2).
A higher proportion of girls (86 per cent) than boys (81 per cent) in Saskatchewan achieved at or above the expected proficiency in reading. Although a similar proportion of girls and boys attained Level 2, girls were more likely to attain Level 3. This pattern is similar to that for Canada as a whole (Appendix B.3).

74 PCAP 2016
Figure SK.1 Canada–Saskatchewan: results in reading by level of performance
1519
914
1215
1216
1216
7674
7275
7878
7374
7474
108
1811
107
159
149
0 20 40 60 80 100
CAN – MalesSK – Males
CAN – FemalesSK – Females
CAN – FrenchSK – French
CAN – EnglishSK – English
CAN – Overall readingSK – Overall reading
Percentage
Level 1Level 2Level 3
Note: Percentages may not add up to 100 due to rounding.
Results in reading by mean scoreFigure SK.2 summarizes the results by mean score of the PCAP Reading Assessment for students in Saskatchewan and Canada as a whole. In reading overall, the mean scores for Saskatchewan students are significantly lower than the Canadian mean (Appendix B.4).
Saskatchewan students enrolled in both English- and French-language schools also achieved significantly lower scores in reading than did the respective language groups in the Canadian sample. Within the province, francophone students scored lower than anglophone students. This result is consistent with the pan-Canadian pattern (Appendix B.5).
With respect to mean achievement by gender, both boys and girls in Saskatchewan achieved significantly lower scores than boys and girls in Canada overall. Girls in Saskatchewan significantly outperformed boys, which is consistent with results at the pan-Canadian level (Appendix B.6).

PCAP 2016 75
Figure SK.2 Canada–Saskatchewan: results in reading by mean score
494
521
500
509
507
482
500
476
491
491
400 420 440 460 480 500 520 540 560 580 600
Males
Females
French
English
Overall reading
Mean score
SK
CAN
Figure SK.3 and Tables SK.1 and SK.2 present the results in reading by subdomain for Saskatchewan and Canadian students. Saskatchewan students scored significantly below the Canadian means in all four subdomains (Figure SK.3, Appendix B.7). Students enrolled in both anglophone and francophone school systems in Saskatchewan achieved scores statistically lower than the Canadian means for the respective language groups in all subdomains (Table SK.1). Within the province, anglophone students achieved statistically higher mean scores than francophone students in all subdomains (Appendix B.8).
Figure SK.3 Canada–Saskatchewan: results in reading by subdomain
500
500
500
500
483
480
485
491
400 420 440 460 480 500 520 540 560 580 600
Responding criticallyto texts
Responding personallyto texts
Interpreting texts
Understanding texts
Mean score
SK
CAN

76 PCAP 2016
Table SK.1 Canada–Saskatchewan: results in reading by subdomain and language of the school system
Understanding texts Interpreting texts Responding
personally to textsResponding
critically to texts
Mean score CI (±) Mean score CI (±) Mean score CI (±) Mean score CI (±)
CAN English 501 2.1 506 2.3 498 2.6 501 2.6
SK English 492 4.0 485 3.4 480 3.1 483 2.8
Difference 9* 21* 18* 18*
CAN French 497 4.5 480 3.7 506 4.2 497 3.9
SK French 476 0.0 472 0.0 459 0.0 478 0.0
Difference 21* 8* 47* 19*
SK English 492 4.0 485 3.4 480 3.1 483 2.8
SK French 476 0.0 472 0.0 459 0.0 478 0.0
Difference 16* 13* 21* 5*
* Denotes significant difference
Girls in Saskatchewan achieved below girls in the Canadian sample in all four subdomains (Table SK.2). Boys achieved similar scores to the Canadian average in the understanding texts subdomain and below the Canadian average in the other three subdomains. Girls in the province scored significantly higher than boys in all reading subdomains (Appendix B.9).
Table SK.2 Canada–Saskatchewan: results in reading by subdomain and gender
Understanding texts Interpreting texts Responding
personally to textsResponding
critically to texts
Mean score CI (±) Mean score CI (±) Mean score CI (±) Mean score CI (±)
CAN female 509 3.6 515 3.7 511 3.2 516 3.5
SK female 496 6.2 498 5.1 487 5.7 494 5.7
Difference 13* 17* 24* 22*
CAN male 492 2.6 487 3.4 490 3.7 485 3.4
SK male 487 4.4 473 6.4 474 4.9 473 4.4
Difference 5 14* 16* 12*
SK female 496 6.2 498 5.1 487 5.7 494 5.7
SK male 487 4.4 473 6.4 474 4.9 473 4.4
Difference 9* 25* 13* 21*
* Denotes significant difference

PCAP 2016 77
Comparison of reading results over timeIn Saskatchewan, overall reading achievement has been stable between the baseline year of 2010 and 2016 (Figure SK.4). (As explained in Chapter 2, the baseline year for reading was adjusted to 2010 when the PCAP target group changed from 13-year-old students to Grade 8 students.) For Canada, more variability in reading over time is observed; however, Canadian students achieved statistically higher scores in reading in 2016 compared to 2010 (Appendix B.10).
Mean scores for both anglophone and francophone students in Saskatchewan were stable from 2010 to 2016. For Canada as a whole, positive change in reading achievement over time occurred in French-language systems, but results remained stable in English-language systems (Appendix B.11).
Mean scores obtained by both boys and girls in Saskatchewan did not change significantly from 2010 to 2016. At the Canadian level, change was positive and significant for girls, while results remained stable for boys in 2016 compared to 2010 (Appendix B.12).
Figure SK.4 Saskatchewan: results in reading over time
482
504
468
492
491
476
498
478
487
487
482
500
476
491
491
400 420 440 460 480 500 520 540 560 580 600
Males
Females
French
English
SK ‒ Overall reading
Mean score
2016
2013
2010

78 PCAP 2016
Results in mathematics and scienceAs noted in the introduction to this document, mathematics and science are both minor domains in PCAP 2016. Results for these domains are reported by mean scores only. This section presents mathematics and science scores for the province, compares Saskatchewan and pan-Canadian scores, reports results by language of the school system and by gender, and presents multiple comparisons over time.
Results in mathematicsFigure SK.5 displays achievement in mathematics for Saskatchewan and Canada in PCAP 2016. It shows that Saskatchewan students scored below the Canadian mean in mathematics (Appendix B.13).
Both English- and French-language students in Saskatchewan achieved scores significantly lower than the Canadian mean scores in mathematics for the respective language groups. Within the province, francophone students significantly outperformed their anglophone peers in mathematics. This result is comparable to that for Canada overall, where students from French-language school systems outperformed those from English-language systems (Appendix B.14).
In Saskatchewan, mean achievement scores for boys and girls in mathematics were significantly lower than Canadian means by gender. Saskatchewan was the only province in PCAP 2016 in which boys achieved statistically higher mean scores in mathematics than girls. At the pan-Canadian level, there was no significant difference between boys and girls in mathematics achievement (Appendix B.15).
Figure SK.5 Canada–Saskatchewan: results in mathematics
Figure SK.6 shows changes over time in mathematics achievement in Saskatchewan. Mean scores in mathematics increased significantly between 2010 (the baseline year for PCAP mathematics assessment) and 2016. Over the same period of time, positive, statistically significant change in mathematics scores was also observed at the Canadian level (Appendix B.16).
Students in English-language school systems in the province achieved higher scores in mathematics in 2016 compared to the baseline year of 2010; there was no significant change in the achievement of
512
511
540
502
511
488
478
501
483
483
400 420 440 460 480 500 520 540 560 580 600
Males
Females
French
English
Overallmathematics
Mean score
SK
CAN

PCAP 2016 79
students in the French-language system over the same years. In Canada overall, both francophone and anglophone school systems had significantly higher scores in mathematics in 2016 compared to the 2010 baseline (Appendix B.17).
Comparing 2010 and 2016 mathematics results with respect to gender, positive change was observed for boys in Saskatchewan, while girls’ achievement was stable. Across Canada, both boys and girls achieved significantly higher mean scores in mathematics in 2016 compared to the 2010 baseline (Appendix B.18).
Figure SK.6 Saskatchewan: results in mathematics over time
477
475
498
474
474
488
487
518
487
488
488
478
501
483
483
400 420 440 460 480 500 520 540 560 580 600
Males
Females
French
English
SK ‒ Overall mathematics
Mean score
2016
2013
2010
Results in scienceFigure SK.7, which displays mean scores for the PCAP 2016 Science Assessment for Saskatchewan and Canada, shows that Saskatchewan students scored significantly lower than the Canadian mean (Appendix B.19).
Students enrolled in both anglophone and francophone schools in the province achieved below the Canadian mean scores in science for the respective language groups. Within the province, students in francophone schools outperformed those in anglophone schools, which differs from results for Canada as a whole, where there was no significant difference between the two language groups (Appendix B.20).
Both boys and girls in Saskatchewan scored below the Canadian mean in science in 2016. There was no gender gap in science in the province, a result that differs from that for Canada overall, where girls achieved significantly higher scores than boys in science (Appendix B.21).

80 PCAP 2016
Figure SK.7 Canada–Saskatchewan: results in science
505
511
506
508
508
491
492
498
491
491
400 420 440 460 480 500 520 540 560 580 600
Males
Females
French
English
Overall science
Mean score
SK
CAN
Figure SK.8 displays changes over time in science achievement for Saskatchewan. From 2013 to 2016, there was no significant change in achievement for Saskatchewan students overall. This result contrasts with a significant, positive change over the same period for Canadian students (Appendix B.22).
The English-language school system in Saskatchewan also maintained statistically similar scores over this period, while French-language schools improved significantly. For Canada overall, anglophone school systems had stable results and francophone school systems saw a positive change in science achievement over the same period (Appendix B.23).
Girls in Saskatchewan improved significantly in science from 2013 to 2016, whereas no significant changes were observed for boys. Across Canada, both boys and girls achieved statistically significant gains in science over the same period (Appendix B.24).
Figure SK.8 Saskatchewan: results in science over time
490
481
474
486
486
491
492
498
491
491
400 420 440 460 480 500 520 540 560 580 600
Males
Females
French
English
SK ‒ Overall science
Mean score
2016
2013

PCAP 2016 81
MANITOBA
Context statement
Social contextManitoba has a population of approximately 1.3 million people, about 57 per cent of whom reside in the capital city of Winnipeg. Manitoba’s population comprises a wide range of ethnic and cultural groups, including a strong Franco-Manitoban community and an Indigenous community, in both rural and urban areas. Manitoba has a broad and diverse economic base.
Organization of the school systemManitoba’s public and funded independent school system enrols about 196,000 students in Kindergarten to Grade 12 and employs about 13,000 teachers in 37 school divisions and the funded independent schools. Students may choose courses from four school programs—the English Program, the Français Program (about 3 per cent of students), the French Immersion Program (about 12 per cent of students), and the Senior Years Technology Education Program. Children of a francophone parent may enrol in the Division scolaire franco-manitobaine, which offers the Français Program. Other educational options include non-funded independent schools, home-schooling, and federally funded on-reserve schools for First Nation students. Schools group grades according to early years (Kindergarten to Grade 4), middle years (Grades 5 to 8), and senior years (Grades 9 to 12). Both public schools and provincially funded independent schools participated in PCAP. Students in the Français Program participated in French. French immersion students participated in English, and their results are included in the English system results for the province.
Language arts teachingManitoba is currently phasing in renewed language arts curricula for Kindergarten to Grade 8. The previous English language arts curriculum was developed following Manitoba’s involvement with the Western and Northern Canadian Protocol for Collaboration in Basic Education (WNCP). A new English language arts curriculum is being developed by staff at Manitoba’s Department of Education and Training in collaboration with provincial school division educators.
The curriculum framework for K–12 English language arts highlights four interrelated areas of practice that teachers and students use for a variety of interconnected purposes within learning experiences: language as sense making, language as system, language as exploration and design, and language as power and agency. Students use, build, and deepen their competencies in language and literacy as they engage with practices in these areas. Listening, speaking, viewing, representing, reading, and writing are vehicles for engaging in these practices with a wide range of texts—including print, non-print, electronic, virtual, and multimodal—and for a wide range of purposes, in meaningful learning contexts. Learning experiences engage students in deep and flexible learning and provide rich ground for students to explore significant and complex ideas and questions that support meaningful reflection on and use of skills, strategies, and processes embedded in the practices. Grade 9

82 PCAP 2016
to 12 course options are currently being reviewed. Current course options in Grades 11 and 12 allow students to focus on literary, transactional, or comprehensive contexts.
The curriculum framework for Kindergarten to Grade 12 English as an Additional Language (EAL) and Literacy, Academics, and Language (LAL) programming reflects the needs of the increasing number of students from a variety of backgrounds who are learning English as an additional language, as well as adolescent and young adult EAL learners with significantly interrupted formal education. The core of the EAL/LAL framework is a continuum of stages that describes student development of competencies in EAL, recognizing that students enter school in Manitoba at different points and with diverse experiences. The continuum provides goals for EAL/LAL learning, accompanied by sample descriptors and indicators that depict the language learning demonstrated by students as they develop proficiency in EAL. The continuum guides EAL assessment and EAL programming and is a companion to other subject-area curricula.
For more information on the Manitoba curriculum and assessment program, see • www.edu.gov.mb.ca/k12 • http://www.edu.gov.mb.ca/k12/cur/index.html • http://www.edu.gov.mb.ca/m12/progetu/fl1/doc_cur.html
French-first-language teaching
In the Français-first-language curriculum, students take an active role in learning and developing their level of competency in the French language. The curriculum supports the development, by teachers, of authentic learning experiences that are relevant, engaging, and meaningful to students. These learning experiences empower students to use French in various contexts and for various purposes and to develop proficiency with a variety of oral, print, visual, and multimedia texts. Metacognitive and critical thinking processes are central to the curriculum and encompass all aspects of the language. In addition, the Français-first-language curriculum focuses on building students’ francophone identity in a minority setting by allowing them “to think and to live” in French so that they become engaged members within the franco-manitoban community. For more information on the Français-first-language program, see http://www.edu.gov.mb.ca/m12/progetu/fl1/doc_cur.html.
French-second-language teaching
In the Français-second-language immersion curriculum, students learn and develop their proficiency in the French language through the exploration of complex ideas, questions, and issues related to themselves and the world in which they live. These authentic learning contexts, which allow students to use French in various contexts and for various purposes and to develop proficiency with a variety of oral, print, visual, and multimedia texts, foster the development of knowledge, skills, and attitudes that students require to become critically literate citizens. The Français immersion curriculum also focuses on developing student awareness in regard to the significance of French-language learning for their academic, personal, and social growth as well as their evolving identity as plurilingual students. For more information on the Français-second-language program, see http://www.edu.gov.mb.ca/m12/progetu/fl2/doc_cur.html.

PCAP 2016 83
Language arts assessmentManitoba has multiple assessments of language arts skills, strategies, and processes. Reading (Grade 3, English and French Immersion programs) and lecture (Reading in French: Grade 3 Français Program and Grade 4 French Immersion Program) are assessed early in the school year. Reading comprehension and writing of expository texts in English (English and French Immersion programs) and in French (Français and French Immersion programs) are assessed mid-year at Grade 8 in provincially funded schools. Teachers base their assessments on classroom observations, conversations, and student products, according to prescribed criteria. The primary purpose of these assessments is to identify and address with students any gaps in order to support learning across subjects. In Grade 12, provincially mandated curriculum-based assessments in language arts are administered towards the end of each school year or semester. Developed by Manitoba Grade 12 language arts teachers in collaboration with departmental consultants, the tests are designed to be as congruent with the curriculum as possible, within the parameters of large-scale testing. The tests serve as summative assessments of student learning relative to the Grade 12 language arts curricula and count for 30 per cent of students’ final course grades. More information about the assessment program in Manitoba can be found at http://www.edu.gov.mb.ca/k12/assess/assess_program.html.
Results in readingThis section presents PCAP 2016 results in reading for Manitoba and Canada by performance levels and mean scores. Student achievement is reported in reading overall, by language of the school system, and by gender. This section concludes with a comparison of changes over time in reading achievement.
Results in reading by performance levelFigure MB.1 presents the performance of Manitoba students and that of Canadian students overall in the PCAP 2016 Reading Assessment. In Manitoba, 83 per cent of students achieved Level 2 or higher in reading, compared to 88 per cent of students across Canada (Level 2 is considered the baseline or expected level or reading proficiency for Grade 8 students). The proportion of Manitoba students at Level 2 was similar to the Canadian average; however, a smaller proportion of students in Manitoba achieved Level 3 proficiency in reading (Appendix B.1).
Eighty-three per cent of students in the English-language school system (including French immersion students) and 70 per cent of students in the French-language school system in Manitoba attained Level 2 or higher in reading. For both language groups, the proportion of students who reached expected proficiency was lower than that of students in the two language groups in Canada overall. Within the province, fewer francophone students than anglophone students achieved Level 2 or higher. This result contrasts with performance levels by language group for Canada as a whole, where similar proportions of francophones and anglophones achieved Level 2 or higher in reading (Appendix B.2).
In Manitoba, 85 per cent of girls obtained Level 2 or higher in reading, which is lower than the Canadian average for girls (91 per cent). Eighty-one per cent of Manitoba boys obtained Level 2 or higher, compared to 85 per cent of boys across Canada (Appendix B.3). Within the province, there

84 PCAP 2016
was no gender gap at the expected level of performance (Level 2); however, girls in Manitoba and in Canada overall were more likely than boys to achieve Level 3 (Appendix B.3).
Figure MB.1 Canada–Manitoba: results in reading by level of performance
15
19
9
15
12
30
12
17
12
17
76
74
72
74
78
68
73
74
74
74
10
7
18
11
10
3
15
9
14
9
0 20 40 60 80 100
CAN – Males
MB – Males
CAN – Females
MB – Females
CAN – French
MB – French
CAN – English
MB – English
CAN – Overall reading
MB – Overall reading
Percentage
Level 1
Level 2
Level 3
Note: Percentages may not add up to 100 due to rounding.
Results in reading by mean scoreFigure MB.2 summarizes the results by mean score of the PCAP 2016 Reading Assessment for Manitoba and Canada. It shows that Manitoba students scored significantly below the Canadian mean (Appendix B.4).
Students in both anglophone and francophone school systems in the province scored statistically lower in reading than the Canadian mean for the respective language groups. Within the province, students in the English-language school system outperformed those in the French-language system, which is consistent with the Canadian results (Appendix B.5).
Both girls and boys in Manitoba achieved below the Canadian means for gender in reading. Within the province, girls outperformed boys, which was also the case for achievement by gender at the Canadian level (Appendix B.6).

PCAP 2016 85
Figure MB.2 Canada–Manitoba: results in reading by mean score
494
521
500
509
507
477
499
450
488
487
400 420 440 460 480 500 520 540 560 580 600
Males
Females
French
English
Overall reading
Mean score
MB
CAN
Figure MB.3 and Tables MB.1 and MB.2 present the results in reading by subdomain for Manitoba and Canadian students. Overall, in all subdomains, mean scores achieved by students in Manitoba were significantly lower than those attained by students at the pan-Canadian level (Appendix B.7).
Figure MB.3 Canada–Manitoba: results in reading by subdomain
500
500
500
500
483
479
485
481
400 420 440 460 480 500 520 540 560 580 600
Responding criticallyto texts
Responding personallyto texts
Interpreting texts
Understanding texts
Mean score
MBCAN
Examination of achievement by subdomain and language of the school system reveals that students in both French- and English-language school systems in the province obtained scores below the Canadian means for the respective language groups in all four subdomains (Table MB.1, Appendix B.8). In Manitoba, students enrolled in the English-language school system achieved higher scores than those in the French-language system in all four subdomains.

86 PCAP 2016
Table MB.1 Canada–Manitoba: results in reading by subdomain and language of the school system
Understanding texts Interpreting texts Responding
personally to textsResponding
critically to texts
Mean score CI (±) Mean score CI (±) Mean score CI (±) Mean score CI (±)
CAN English 501 2.1 506 2.3 498 2.6 501 2.6
MB English 483 4.7 487 4.9 479 4.1 483 4.8
Difference 18* 19* 19* 18*
CAN French 497 4.5 480 3.7 506 4.2 497 3.9
MB French 436 6.2 438 6.6 469 6.5 469 6.3
Difference 61* 42* 37* 28*
MB English 483 4.7 487 4.9 479 4.1 483 4.8
MB French 436 6.2 438 6.6 469 6.5 469 6.3
Difference 47* 49* 10* 14*
* Denotes significant difference
Table MB.2 shows subdomain scores for Manitoba and Canadian students by gender. In Manitoba, both girls and boys achieved below Canadian mean scores in all subdomains (Appendix B.9). In all subdomains, girls in the province outperformed boys.
Table MB.2 Canada–Manitoba: results in reading by subdomain and gender
Understanding texts Interpreting texts Responding
personally to textsResponding
critically to texts
Mean score CI (±) Mean score CI (±) Mean score CI (±) Mean score CI (±)
CAN female 509 3.6 515 3.7 511 3.2 516 3.5
MB female 489 6.9 498 6.5 493 6.2 495 7.3
Difference 20* 17* 18* 21*
CAN male 492 2.6 487 3.4 490 3.7 485 3.4
MB male 476 6.6 476 5.7 468 5.7 472 6.0
Difference 16* 11* 22* 13*
MB female 489 6.9 498 6.5 493 6.2 495 7.3
MB male 476 6.6 476 5.7 468 5.7 472 6.0
Difference 13* 22* 25* 23*
* Denotes significant difference

PCAP 2016 87
Comparison of reading results over timeStudents in Manitoba achieved significantly higher scores in reading in PCAP 2016 compared to 2010, which is the baseline year for reading (Figure MB.4). (As explained in Chapter 2, the baseline year for reading was adjusted to 2010, when the PCAP target group changed from 13-year-old students to Grade 8 students.) For Canada, from 2010 to 2016, change in reading achievement was also positive and significant (Appendix B.10).
Comparing 2016 achievement to the 2010 baseline reveals that students in the English-language school system in Manitoba scored significantly higher in reading in 2016, while students in the French-language school system had statistically lower achievement in 2016 than in the baseline year. These outcomes are different from those for Canada overall, where anglophone school systems had stable reading achievement over time, and francophone systems had significant, positive growth (Appendix B.11).
Girls in Manitoba achieved similar results in PCAP 2016 and 2010, while positive change occurred for boys. At the Canadian level, change in reading was positive for girls, while remaining stable for boys in 2016 compared to 2010 (Appendix B.12).
Figure MB.4 Manitoba: results in reading over time
466
494
468
478
478
459
480
471
469
469
477
499
450
488
487
400 420 440 460 480 500 520 540 560 580 600
Males
Females
French
English
MB ‒ Overall reading
Mean score
2016
2013
2010

88 PCAP 2016
Results in mathematics and scienceAs noted in the introduction to this document, mathematics and science are both minor domains in PCAP 2016. Results for these domains are reported by mean scores only. This section presents mathematics and science scores for the province, compares Manitoba and pan-Canadian scores, reports results by language of the school system and by gender, and presents multiple comparisons over time.
Results in mathematicsFigure MB.5 displays achievement in mathematics for Manitoba and Canada in PCAP 2016. It shows that Manitoba students achieved significantly lower scores in mathematics than the Canadian mean (Appendix B.13).
Students in both French- and English-language school systems in Manitoba achieved below the Canadian mean scores in mathematics for their respective language groups. Within the province, the mathematics achievement of anglophone and francophone students was similar. By contrast, at the Canadian level, students in French-language school systems outperformed those in English-language systems (Appendix B.14).
In Manitoba, both girls and boys achieved mathematics scores below the respective Canadian means by gender. There was no gender gap in mathematics achievement in Manitoba, which is consistent with the pattern in Canada overall (Appendix B.15).
Figure MB.5 Canada–Manitoba: results in mathematics
512
511
540
502
511
480
478
474
479
479
400 420 440 460 480 500 520 540 560 580 600
Males
Females
French
English
Overallmathematics
Mean score
MB
CAN
Figure MB.6 displays changes over time in mathematics achievement. Students in Manitoba achieved significantly higher scores in mathematics in PCAP 2016 compared to 2010, which is the baseline year for mathematics. Over the same period, positive, statistically significant change was also observed at the Canadian level (Appendix B.16).

PCAP 2016 89
In Manitoba, students enrolled in the English-language school system achieved higher scores in mathematics in 2016 than in 2010. Students in the French-language system had stable achievement in mathematics over the same period. In Canada, both language groups achieved higher scores in 2016 than in 2010 (Appendix B.17).
Both girls and boys in Manitoba had increased scores in mathematics in 2016 compared to 2010. At the Canadian level, both genders also had higher mean scores in 2016 than in 2010 (Appendix B.18).
Figure MB.6 Manitoba: results in mathematics over time
470
468
480
467
468
471
470
476
470
471
480
478
474
479
479
400 420 440 460 480 500 520 540 560 580 600
Males
Females
French
English
MB ‒ Overall mathematics
Mean score
2016
2013
2010
Results in scienceIn PCAP 2016, Manitoba students achieved below the Canadian mean score in science (Figure MB.7, Appendix B.19).
Students in both language groups in Manitoba obtained scores in science below the Canadian mean scores for the respective groups. Within Manitoba, students in the English-language school system outperformed their French-language counterparts. This result differs from that at the Canadian level, where there was no significant difference in science achievement between the two language groups (Appendix B.20).
The science scores of both girls and boys in Manitoba were lower than the Canadian means by gender. Within the province, girls attained higher scores than boys, which reflects the trend at the pan-Canadian level (Appendix B.21).

90 PCAP 2016
Figure MB.7 Canada–Manitoba: results in science
505
511
506
508
508
487
497
468
492
491
400 420 440 460 480 500 520 540 560 580 600
Males
Females
French
English
Overall science
Mean score
MB
CAN
Figure MB.8 displays changes over time in science achievement. In PCAP 2016, students in Manitoba had higher scores in science relative to 2013, which was the baseline year for PCAP science. Students across Canada also showed significant gains in science over this period (Appendix B.22).
In Manitoba, students enrolled in both English- and French-language school systems had increased science achievement between 2013 and 2016. For Canada overall, anglophone school systems had stable results and francophone school systems saw a positive change in science achievement over the same period (Appendix B.23).
Both girls and boys in the province achieved higher scores in science in 2016 compared to 2013. At the Canadian level, both genders also showed improvement in science achievement over this period (Appendix B.24).
Figure MB.8 Manitoba: results in science over time
467
463
453
465
465
487
497
468
492
491
400 420 440 460 480 500 520 540 560 580 600
Males
Females
French
English
MB ‒ Overall science
Mean score
2016
2013

PCAP 2016 91
ONTARIO
Context statement
Social contextIn 2016, Ontario’s population was 13.45 million. English is Ontario’s official language, but French language rights have been extended to the legal and education systems. According to 2011 census data, approximately 70 per cent of Ontarians have English as their first language, 4 per cent have French, and 26 per cent have a language other than English or French. The six languages most commonly spoken at home for children and youth between the ages of 5 and 19 are English (1,936,345), French (50,830), Punjabi (19,085), Urdu (17,740), Spanish (16,610), and Arabic (14,610).
According to the latest available data, First Nation, Métis, and Inuit individuals constitute 2 per cent of the population of the province. An estimated 64,000 Indigenous students between the ages of 5 and 19 attend provincially funded elementary and secondary schools (Statistics Canada, 2011).
The Ministry of Education works to promote successful outcomes for all students, including students whose first language is neither English nor French; students with special education needs; First Nation, Métis, and Inuit students; and students who face socioeconomic challenges.
Organization of the school systemApproximately 94 per cent of Ontario’s students are enrolled in publicly funded schools. Ontario has 72 district school boards—31 English public, 29 English Catholic, 4 French public, and 8 French Catholic. In 2014–15, there were over two million students in the publicly funded education system, enrolled in approximately 4,000 elementary and 900 secondary schools. About two-thirds of Ontario’s students are enrolled in public schools and one-third in Catholic schools. Approximately 5 per cent of Ontario’s students are enrolled in French-language schools. In addition to the Ontario district school boards, the province has 11 school authorities, consisting of four geographically isolated boards, six hospital-based school authorities, and the Provincial Schools Authority.
The province has five provincial schools and four demonstration schools for students who are deaf or hard of hearing, deaf-blind, or blind or have low vision, or who have severe disabilities. In addition, in 2014–15 there were approximately 1,073 private schools that were recognized by the Ministry of Education but that did not receive government funding.
Ontario has a two-year Kindergarten program that is a child-centred, developmentally appropriate, and integrated program of learning for four- and five-year-olds. The purpose of the program is to establish a strong foundation for learning in the early years, and to do so in a safe and caring play-based environment that promotes the physical, social, emotional, and cognitive development of all children. Parents may enrol their children in the first year of Kindergarten at age four or the second year of Kindergarten at age five. Some students may start the first year of Kindergarten at age three if their fourth birthday is between September 1 and December 31. While Kindergarten is not mandatory, over 90 per cent of eligible children are enrolled.

92 PCAP 2016
Mandatory schooling begins in Grade 1. Students who have their sixth birthday before December 31 of that school year may enter Grade 1 in September.
Language teachingThe knowledge and skills that are to be developed to support reading are explicitly outlined in the Ontario curriculum policy documents The Ontario Curriculum, Grades 1–8: Language, 2006 (Revised) and Le curriculum de l’Ontario, de la 1re à la 8e année: Français, 2006 (révisé). These skills are found in the Reading strand in every grade (in both overall and specific expectations). Information related to program planning can also be found in the front matter of the curriculum policy documents. District school boards may have a reading policy at the local level.
All Ontario curriculum documents are based on research findings that literacy is critical to responsible and productive citizenship and that all students can become literate. The Ontario Curriculum, Grades 1–8: Language, 2006 (Revised) and Le curriculum de l’Ontario, de la 1re à la 8e année: Français, 2006 (révisé) emphasize that successful language learners:
• understand that language learning is a necessary, life-enhancing, reflective process;
• communicate—that is, read, listen, view, speak, write, and represent—effectively and with confidence;
• make meaningful connections between themselves, what they encounter in texts, and the world around them;
• think critically;
• understand that all texts advance a particular point of view that must be recognized, questioned, assessed, and evaluated;
• appreciate the cultural impact and aesthetic power of texts; and
• use language to interact and connect with individuals and communities, for personal growth, and for active participation as world citizens.
Ontario’s language curriculum documents set out overall and specific curriculum expectations in four strands, or broad areas of learning: Oral Communication, Reading, Writing, and Media Literacy. All four areas of learning are closely interrelated.
The overall expectations of the Reading strand in Grades 1–8 state that students will:
• read and demonstrate an understanding of a variety of literary, graphic, and informational texts, using a range of strategies to construct meaning;
• recognize a variety of text forms, text features, and stylistic elements, and demonstrate understanding of how they help communicate meaning;
• use knowledge of words and cueing systems to read fluently; and
• reflect on and identify their strengths as readers, areas for improvement, and the strategies they found most helpful before, during, and after reading.

PCAP 2016 93
In each grade, specific expectations are associated with each of the above overall expectations. The content of the specific expectations and examples differs from grade to grade, reflecting the development of skills, knowledge, and understanding by students throughout the elementary years.
The language curriculum for French students is developed, implemented, and revised in parallel with the English-language curriculum. The Français document is organized in a similar way to the English-language curriculum, and it has three strands: Communication orale, Lecture, and Écriture—media literacy is integrated within these three strands. The French reading strand is divided into three areas: prélecture, lecture, and réaction à la lecture. A distinct feature of the French-language education system in Ontario is the aménagement linguistique policy, which is intended to promote, enhance, and foster the development of the French language and culture in a minority setting, in all spheres of activity. With respect to reading, the policy focuses on optimal oral and written language acquisition, as well as on integrating cultural experiences into daily life in the classroom and school.
In the English-language publicly funded school system, over 22 per cent of Ontario elementary students have a first language other than English. Ontario has a policy for English language learners and two programs to support them—English as a Second Language, supporting students in Kindergarten to Grade 12, and English Literacy Development for students with limited prior schooling, supporting students in Grades 3 to 12.
Similarly, there are documents and resources that support French-language learners in French-language schools. The curriculum policy documents Actualisation linguistique en français and Programme d’appui aux nouveaux arrivants support students in Grades 1 to 12.
The curriculum policy documents related to language instruction may be found at:
• The Ontario Curriculum, Language, Grades 1–8 http://www.edu.gov.on.ca/eng/curriculum/elementary/subjects.html
• Le curriculum de l’Ontario : Palier élémentaire http://www.edu.gov.on.ca/fre/curriculum/elementary/subjects.html
• The Ontario Curriculum, English, Grades 9 and 10 http://www.edu.gov.on.ca/eng/curriculum/secondary/english910currb.pdf
• The Ontario Curriculum, English, Grades 11 and 12 http://www.edu.gov.on.ca/eng/curriculum/secondary/english1112currb.pdf
• The Ontario Curriculum, English as a Second Language and English Literacy Development, Grades 9 to 12 http://www.edu.gov.on.ca/eng/curriculum/secondary/esl912currb.pdf
• Le curriculum de l’Ontario : Palier secondaire http://www.edu.gov.on.ca/fre/curriculum/secondary/subjects.html
Language arts assessmentIn 2010, the Ministry of Education released the provincial assessment policy Growing Success: Assessment, Evaluation, and Reporting in Ontario’s Schools, covering Grades 1 to 12. Subsequently, in 2016, The Kindergarten Addendum, which sets out policy for assessment, evaluation, and reporting in Kindergarten, was released. These policies are based on fundamental principles to ensure that assessment, evaluation, and reporting are valid and reliable, and that they lead to the improvement of

94 PCAP 2016
learning for all students, help inform instructional decisions, and promote student engagement. (The French version of Growing Success—Faire croître le succès: Evaluation et communication du rendement des élèves fréquentant les écoles de l’Ontario—is based on similar principles.)
In Ontario, teachers are responsible for classroom assessment and evaluation, with the goal of improving student learning. Teachers and early childhood educators bring varied assessment and evaluation approaches to the classroom, including assessment for, as, and of learning. Classroom assessment and evaluation are based on the expectations in the provincial curriculum. Overall expectations are the basis for evaluation, while specific expectations specify in more detail the expected learning. All curriculum documents have achievement charts with four levels of achievement and four categories of knowledge and skills. The provincial standard or expected level of achievement is Level 3 (equivalent to a “B” letter grade), the level at which teachers and parents can be confident that students are well prepared for work in the next grade or the next course.
The Education Quality and Accountability Office (EQAO), a Crown agency of the Ministry of Education, develops and administers provincial large-scale assessments. Assessments are administered annually in English or French to all students in Grades 3 and 6 (in reading, writing, and mathematics) and Grade 9 (mathematics). In addition, the Ontario Secondary School Literacy Test (OSSLT) is administered in Grade 10. The results do not affect student grades or promotion in Grades 3, 6; however, to obtain an Ontario Secondary School Diploma, all students must meet a graduation literacy requirement by passing the OSSLT. Students who are not successful on this test may retake it or meet the requirement by passing the Ontario Secondary School Literacy Course. Teachers are given the option of marking all or a portion of their students’ work on the Grade 9 mathematics assessment and incorporating the marks in their determination of the students’ final grades for mathematics courses.
Ontario participates in large-scale assessments of reading through PCAP, the Programme for International Student Assessment (PISA), and the Progress in International Reading Literacy Study (PIRLS). More information on provincial, national, and international assessments in Ontario may be found on the EQAO Web site: • English: http://www.eqao.com/NIA/NIA.aspx?status=logout&Lang=E • French: http://www.eqao.com/NIA/NIA.aspx?status=logout&Lang=F
Results in readingThis section presents PCAP 2016 results in reading for Ontario and Canada by performance levels and mean scores. Student achievement is reported in reading overall, by language of the school system, and by gender. This section concludes with a comparison of changes over time in reading achievement.
Results in reading by performance levelFigure ON.1 presents the performance of Ontario students and that of Canadian students overall in the PCAP Reading Assessment. Eighty-nine per cent of Ontario students attained Level 2 or higher, a result that is similar to the achievement of students for Canada as a whole (Level 2 is the baseline or expected level of reading proficiency for Grade 8 students). Sixteen per cent of students in the province attained Level 3 in reading, a figure that is statistically similar to the Canadian average (Appendix B.1).

PCAP 2016 95
A similar proportion of students enrolled in English-language school systems in Ontario and Canada achieved the expected or higher levels of reading proficiency. Students enrolled in French-language schools in Ontario were significantly less likely than francophones in Canada overall to attain Level 2 or higher proficiency. Within the province, students in English-language schools were more likely than their francophone peers to achieve at Level 3 (Appendix B.2).
In Ontario, girls and boys attained expected or higher reading achievement in similar proportions to boys and girls across Canada. Within the province, a significantly higher proportion of girls than boys attained Level 3, which is consistent with the pan-Canadian pattern (Appendix B.3).
Figure ON.1 Canada–Ontario: results in reading by level of performance
15
14
9
9
12
19
12
11
12
11
76
75
72
70
78
70
73
73
74
72
10
11
18
21
10
10
15
16
14
16
0 20 40 60 80 100
CAN – Males
ON – Males
CAN – Females
ON – Females
CAN – French
ON – French
CAN – English
ON – English
CAN – Overall reading
ON – Overall reading
Percentage
Level 1
Level 2
Level 3
Note: Percentages may not add up to 100 due to rounding.
Results in reading by mean scoreFigure ON.2 presents the results by mean score of the PCAP Reading Assessment for students in Ontario and Canada. Ontario students obtained mean scores in reading similar to the Canadian mean (Appendix B.4).
Students enrolled in anglophone schools in the province achieved reading scores similar to the Canadian anglophone mean, while students in Ontario’s francophone schools scored below the Canadian francophone mean (Appendix B.5). Students in English-language schools in Ontario outperformed those in French-language schools.
Girls and boys in Ontario achieved mean scores in reading similar to the respective Canadian means for gender. Both in Ontario and at the pan-Canadian level, girls outperformed boys in reading (Appendix B.6).

96 PCAP 2016
Figure ON.2 Canada–Ontario: results in reading by mean score
494
521
500
509
507
499
526
485
513
512
400 420 440 460 480 500 520 540 560 580 600
Males
Females
French
English
Overall reading
Mean score
ON
CAN
Figure ON.3 and Tables ON.1 and ON.2 display the mean scores in reading by subdomain for Ontario and Canadian students. Ontario students achieved statistically higher mean scores compared to those of Canadian students in two subdomains: interpreting texts and responding critically to texts. Results in the other two subdomains were similar to the Canadian means (Appendix B.7).
Figure ON.3 Canada–Ontario: results in reading by subdomain
500
500
500
500
508
502
511
498
400 420 440 460 480 500 520 540 560 580 600
Responding criticallyto texts
Responding personallyto texts
Interpreting texts
Understanding texts
Mean score
ON
CAN
Students in English-language school systems in Ontario achieved results higher than the Canadian mean in two subdomains—interpreting texts and responding critically to texts—and results similar to the anglophone Canadian mean for the other two subdomains. Students in Ontario’s French-language schools achieved at the Canadian French mean in two subdomains—responding personally and responding critically to texts—and at levels lower than the Canadian French mean for the other two subdomains (Table ON.1). Students enrolled in English-language school systems outperformed their

PCAP 2016 97
French-language counterparts in the province on all subdomains except responding personally to texts, in which the two language groups achieved similar scores (Appendix B.8).
Table ON.1 Canada–Ontario: results in reading by subdomain and language of the school system
Understanding texts Interpreting texts Responding
personally to textsResponding
critically to texts
Mean score CI (±) Mean score CI (±) Mean score CI (±) Mean score CI (±)
CAN English 501 2.1 506 2.3 498 2.6 501 2.6
ON English 500 6.4 513 4.1 502 4.8 509 4.8
Difference 1 7* 4 8*
CAN French 497 4.5 480 3.7 506 4.2 497 3.9
ON French 471 4.6 469 4.6 501 4.8 499 4.5
Difference 26* 11* 5 2
ON English 500 6.4 513 4.1 502 4.8 509 4.8
ON French 471 4.6 469 4.6 501 4.8 499 4.5
Difference 29* 44* 1 10*
* Denotes significant difference
In Ontario, boys and girls obtained results that were statistically higher than those of boys and girls in Canada overall for the interpreting texts subdomain, and girls achieved higher scores than the overall Canadian sample in the responding critically to texts subdomain. Results were statistically similar for the other subdomains (Table ON.2). Within the province, girls outperformed boys in all four subdomains (Appendix B.9).
Table ON.2 Canada–Ontario: results in reading by subdomain and gender
Understanding texts Interpreting texts Responding
personally to textsResponding
critically to texts
Mean score CI (±) Mean score CI (±) Mean score CI (±) Mean score CI (±)
CAN female 509 3.6 515 3.7 511 3.2 516 3.5
ON female 506 4.4 525 5.0 514 5.7 526 5.6
Difference 3 10* 3 10*
CAN male 492 2.6 487 3.4 490 3.7 485 3.4
ON male 492 6.4 498 6.3 491 7.1 492 6.9
Difference 0 11* 1 7
ON female 506 4.4 525 5.0 514 5.7 526 5.6
ON male 492 6.4 498 6.3 491 7.1 492 6.9
Difference 14* 27* 23* 34*
* Denotes significant difference

98 PCAP 2016
Comparison of reading results over timeThe results of Ontario students in reading in PCAP 2016 were similar to those obtained in 2010, which is the baseline year for reading (Figure ON.4, Appendix B.10). (As explained in Chapter 2, the baseline year for reading was adjusted to 2010 when the PCAP target group changed from 13-year-old students to Grade 8 students.)
After an increase in 2013, reading scores for English-language students in Ontario returned to 2010 levels in 2016. Results for French-language school systems in Ontario were stable over the entire period. Within Ontario, students in anglophone school systems consistently outperformed their francophone counterparts in reading between 2010 and 2016. For Canada as a whole, anglophone school systems had stable reading achievement over time, and francophone systems had significant, positive growth (Appendix B.11).
In PCAP 2016, girls and boys in Ontario both obtained reading scores similar to those achieved by the province’s boys and girls in 2010. By contrast, at the Canadian level, change in reading was positive for girls and stable for boys in 2016 compared to 2010 (Appendix B.12).
Figure ON.4 Ontario: results in reading over time
503
530
481
517
515
510
538
481
526
524
499
526
485
513
512
400 420 440 460 480 500 520 540 560 580 600
Males
Females
French
English
ON ‒ Overall reading
Mean score
2016
2013
2010

PCAP 2016 99
Results in mathematics and scienceAs noted in the introduction to this document, mathematics and science are both minor domains in PCAP 2016. Results for these domains are reported by mean scores only. This section presents mathematics and science scores for the province, compares Ontario and pan-Canadian scores, reports results by language of the school system and by gender, and presents multiple comparisons over time.
Results in mathematicsFigure ON.5 displays achievement of Ontario and Canadian students in mathematics. Overall, students in Ontario achieved mean scores in mathematics similar to those of Canadian students (Appendix B.13).
Statistically comparable results between Ontario and Canadian students are also observed for English-language school systems. Students in French-language schools in Ontario achieved significantly lower scores in mathematics than francophones in Canada as a whole but significantly higher scores than students in English-language schools in Ontario (Appendix B.14).
Girls and boys in Ontario achieved scores in mathematics that were statistically similar to those of girls and boys at the pan-Canadian level. There was no gender gap in mathematics achievement in Ontario in PCAP 2016, which is consistent with the results at the Canadian level (Appendix B.15).
Figure ON.5 Canada–Ontario: results in mathematics
512
511
540
502
511
508
508
528
507
508
400 420 440 460 480 500 520 540 560 580 600
Males
Females
French
English
Overallmathematics
Mean score
ON
CAN
Overall mathematics achievement in Ontario has been stable between 2010 and 2016 (Figure ON.6). For Canada, over the same period, the results show positive, statistically significant change in mathematics achievement (Appendix B.16).

100 PCAP 2016
Students in anglophone school systems in Ontario have had stable performance over time in mathematics, whereas francophone students in the province showed significant and positive change. At the Canadian level, students in both French- and English-language school systems had significantly higher scores in mathematics in PCAP 2016 compared to the 2010 baseline (Appendix B.17).
Both boys and girls in Ontario have had stable achievement in mathematics over time. By contrast, across Canada, both boys and girls achieved significantly higher mean scores in mathematics in 2016 compared to the 2010 baseline (Appendix B.18).
Figure ON.6 Ontario: results in mathematics over time
508
509
511
507
507
514
511
500
512
512
508
508
528
507
508
400 420 440 460 480 500 520 540 560 580 600
Males
Females
French
English
ON ‒ Overall mathematics
Mean score
2016
2013
2010
Results in scienceFigure ON.7 shows achievement in science in PCAP 2016 for both Ontario and Canadian students. Overall, the science achievement of Ontario students was statistically similar to that of Canadian students (Appendix B.19).
Students in English-language school systems in Ontario obtained similar scores to those in English-language systems across Canada. Students in French-language school systems in the province underperformed in science relative to francophone students in Canada overall. Within the province, students in francophone school systems achieved lower science scores than students in anglophone systems. At the Canadian level, there was no significant difference in science achievement between the two language groups (Appendix B.20).

PCAP 2016 101
Girls and boys in Ontario achieved mean scores in science similar to those of girls and boys in Canada overall. There was no gender gap in science achievement in Ontario. However, at the Canadian level, girls achieved significantly higher scores in science than boys in PCAP 2016 (Appendix B.21).
Figure ON.7 Canada–Ontario: results in science
505
511
506
508
508
508
511
499
510
510
400 420 440 460 480 500 520 540 560 580 600
Males
Females
French
English
Overall science
Mean score
ON
CAN
Figure ON.8, which displays changes over time, shows that science achievement in Ontario was stable between 2016 and the baseline year of 2013 (Appendix B.22).
Students enrolled in English-language school systems in Ontario had stable performance in science over time, while scores for students in French-language school systems increased significantly from 2013 to 2016. For Canada overall, anglophone school systems had stable results and francophone school systems saw a positive change in science achievement over the same period (Appendix B.23).
In Ontario, girls and boys had stable achievement in science between 2013 and 2016. Over the same period, results for Canadian boys and girls showed a positive change in science achievement (Appendix B.24).

102 PCAP 2016
Figure ON.8 Ontario: results in science over time
511
511
464
513
511
508
511
499
510
510
400 420 440 460 480 500 520 540 560 580 600
Males
Females
French
English
ON ‒ Overall science
Mean score
2016
2013

PCAP 2016 103
QUEBEC
Context statement
Social contextQuebec’s population of more than eight million is concentrated in the south of the province, mostly in its largest city, Montreal, and its capital city, Quebec City. The official language of Quebec is French. Francophones account for around 78 per cent of Quebec’s total population. Anglophones make up around 9 per cent of the population; they have access to a full system of educational institutions, from preschool to university. There are 11 Aboriginal peoples in Quebec, who account for about 1 per cent of the population. Under the Indian Act, the government of Canada is responsible for ensuring that Aboriginal children receive educational services. However, under treaties signed with three Aboriginal groups in the 1970s, the government of Quebec plays a decisive role in the implementation of the educational services delivered to Cree, Inuit, and Naskapi communities.
An increase in immigration, especially in the Greater Montreal Area, has resulted in a massive inflow of students whose first language is neither French nor English. Under provincial legislation, these students attend French schools. To meet the needs of this new client group, schools have implemented special measures, including francisation programs and welcoming classes.
Organization of the school systemQuebec has four levels of education: elementary (including preschool), secondary, college, and university. Full- and part-time enrolment in all four levels was approximately 1.8 million in 2015–16. Elementary, secondary, and college education is free. University students pay tuition fees, which are relatively low in the North American context. Children are admitted to elementary school at six years of age, and school attendance is compulsory until the age of 16. The official language of instruction at the elementary and secondary levels is French. Education in English is available mainly to students whose father or mother pursued elementary studies in English in Canada. Approximately 9.6 per cent of Quebec students were educated in English in 2015–16. It is noted that in Quebec, some 65 per cent of private schools receive a subsidy from the Ministère de l’Éducation et de l’Enseignement supérieur. The per student subsidy allocated to private schools is equal to 60 per cent of the per student subsidy allocated to public schools for educational services.
Elementary school is usually preceded by one year of full-time Kindergarten for five-year-olds. Almost all five-year-olds attend Kindergarten, even though it is not compulsory. Since September 2013, some children from underprivileged backgrounds have access to full-day Kindergarten from the age of four.
Elementary school lasts six years. Secondary school lasts five years and is divided into two levels. The first level, or “cycle,” lasts two years and is strongly focused on basic education. In the second, three-year cycle, students continue their general education but also take optional courses to explore other avenues of learning before going on to college.
In 2015–16, a total of 1,014,407 students were registered in general non-adult classes in Quebec’s 2,675 elementary and secondary schools. These include 2,346 public schools run by 72 school boards, and 302 private schools.

104 PCAP 2016
Language arts teachingThe Ministère de l’Éducation et de l’Enseignement supérieur (MEES) determines curriculum content in close collaboration with professional subject experts, curriculum developers, teachers, and school board consultants.
During the 2006–07 academic year, a new curriculum was implemented in the second year of the first secondary cycle. In language arts as well as in all other disciplines, the new curriculum focuses on skills development.
Language arts assessmentAt the secondary level, schools use their own assessments of student learning. However, in order to earn their secondary school diploma, students must successfully complete the required language courses (offered by language of instruction in the school) as well as all sections of second-language courses, as determined by the education system. Final results in language courses and second-language courses are assessed using ministry exams.
The first-language curriculum focuses on writing and reading, with the following weighting: French, language of instruction
Competencies—first cycle • Writing 40% • Reading 40% • Oral communication 20%
Components—second cycle • Writing 50% • Reading 40% • Oral communication 10%
English, language of instruction Competencies—first cycle
• Writing 33% • Reading 33% • Oral communication 34%
Components—second cycle • Writing 33% • Reading 33% • Oral communication 34%
For more information on curriculum and evaluation in Quebec, visit: • http://www.education.gouv.qc.ca/references/programmes-detudes/ • http://www1.education.gouv.qc.ca/progressionPrimaire/ • https://www7.education.gouv.qc.ca/dc/evaluation/

PCAP 2016 105
Results in readingThis section presents PCAP 2016 results in reading for Quebec and Canada by performance levels and mean scores. Student achievement is reported in reading overall, by language of the school system, and by gender. This section concludes with a comparison of changes over time in reading achievement.
Results in reading by performance levelFigure QC.1 presents the performance of Quebec students and that of Canadian students overall in the PCAP 2016 Reading Assessment. Eighty-nine per cent of students in Quebec and 88 per cent of Canadian students achieved Level 2 or higher in reading. (Level 2 is the PCAP baseline or expected level for reading proficiency for Grade 8/Secondary II.) A lower proportion of students in Quebec (11 per cent) than in Canada overall (14 per cent) attained Level 3 in reading (Appendix B.1).
Eighty-nine per cent of students enrolled in francophone schools in Quebec achieved expected or higher proficiency in reading, a statistically similar proportion compared to the Canadian average (88 per cent). Eight-six per cent of students in Quebec’s anglophone school systems obtained Level 2 or higher in reading, compared to 88 per cent of Canadian students. Within Quebec, there was no significant difference in the proportion of students achieving Level 2 or above between the two language groups; however, students in English-language schools were more likely to achieve Level 3 than their French-language peers (Appendix B.2).
In Quebec, 91 per cent of girls and 87 per cent of boys achieved Level 2 or higher in reading proficiency, which is not significantly different than achievement for girls and boys across Canada. A greater proportion of girls than boys in Quebec attained Level 3 (Appendix B.3).
Figure QC.1 Canada–Quebec: results in reading by level of performance
15
13
9
9
12
14
12
11
12
11
76
80
72
76
73
69
78
79
74
78
10
7
18
15
15
17
10
10
14
11
0 20 40 60 80 100
CAN – Males
QC – Males
CAN – Females
QC – Females
CAN – English
QC – English
CAN – French
QC – French
CAN – Overall reading
QC – Overall reading
Percentage
Level 1
Level 2
Level 3
Note: Percentages may not add up to 100 due to rounding.

106 PCAP 2016
Results in reading by mean scoreFigure QC.2 presents PCAP 2016 results in reading by mean score for students in Quebec and Canada. It shows that students in Quebec achieved scores similar to the Canadian mean in reading (Appendix B.4).
Reading achievement of students in Quebec’s anglophone and francophone schools was the same as the respective Canadian averages. Within Quebec, students in English-language schools outperformed their peers in French-language schools, which is consistent with the results at the Canadian level (Appendix B.5).
In Quebec, both girls and boys achieved results in reading similar to those of girls and boys in Canada as a whole.Within the province, girls significantly outperformed boys in reading, which is consistent with the pattern at the pan-Canadian level (Appendix B.6).
Figure QC.2 Canada–Quebec: results in reading by mean score
494
521
509
500
507
492
516
511
503
503
400 420 440 460 480 500 520 540 560 580 600
Males
Females
English
French
Overall Reading
Mean score
QC
CAN
Figure QC.3 and Tables QC.1 and QC.2 present the achievement of Quebec and Canadian students by subdomains in reading. In Quebec, students achieved at the Canadian mean in three reading subdomains: understanding texts, responding personally to texts, and responding critically to texts. Quebec students achieved lower scores than their Canadian peers in the interpreting texts subdomain (Appendix B.7).

PCAP 2016 107
Figure QC.3 Canada–Quebec: results in reading by subdomain
500
500
500
500
498
508
484
502
400 420 440 460 480 500 520 540 560 580 600
Responding criticallyto texts
Responding personallyto texts
Interpreting texts
Understanding texts
Mean score
QCCAN
Students in both French- and English-language schools in Quebec achieved scores similar to the Canadian mean in all four subdomains. Within Quebec, students in the two language groups had similar scores in three subdomains: understanding texts, responding personally to texts, and responding critically to texts, while anglophone students outperformed francophone students in the interpreting texts subdomain (Appendix B.8).
Table QC.1 Canada–Quebec: results in reading by subdomain and language of the school system
Understanding texts Interpreting texts Responding
personally to textsResponding
critically to texts
Mean score CI (±) Mean score CI (±) Mean score CI (±) Mean score CI (±)
CAN French 497 4.5 480 3.7 506 4.2 497 3.9
QC French 501 4.5 482 4.6 508 5.4 498 5.3
Difference 4 2 2 1
CAN English 501 2.1 506 2.3 498 2.6 501 2.6
QC English 503 6.2 506 6.1 504 6.8 501 5.9
Difference 2 0 6 0
QC French 501 4.5 482 4.6 508 5.4 498 5.3
QC English 503 6.2 506 6.1 504 6.8 501 5.9
Difference 2 24* 4 3
* Denotes significant difference

108 PCAP 2016
Both girls and boys in Quebec achieved significantly lower scores than girls and boys in Canada overall in the interpreting texts subdomain. Results were similar for Canadian and Quebec girls and boys for the other subdomains. Within Quebec, girls achieved significantly higher scores than boys in all four subdomains (Appendix B.9).
Table QC.2 Canada–Quebec: Results in reading by subdomain and gender
Understanding texts Interpreting texts Responding
personally to textsResponding
critically to texts
Mean score CI (±) Mean score CI (±) Mean score CI (±) Mean score CI (±)
CAN female 509 3.6 515 3.7 511 3.2 516 3.5
QC female 510 8.1 497 7.2 517 7.7 514 6.8
Difference 1 18* 6 2
CAN male 492 2.6 487 3.4 490 3.7 485 3.4
QC male 494 5.6 473 6.1 500 6.1 484 5.8
Difference 2 14* 10 1
QC female 510 8.1 497 7.2 517 7.7 514 6.8
QC male 494 5.6 473 6.1 500 6.1 484 5.8
Difference 16* 24* 17* 30*
* Denotes significant difference
Comparison of reading results over timeFigure QC.4 displays reading achievement over time in Quebec. It shows that there has been a positive and significant change in reading since 2010 (Appendix B.10). (As explained in Chapter 2, the baseline year for reading was adjusted to 2010, when the PCAP target group changed from 13-year old students to Grade 8/Secondary II students.)
Compared to the baseline year of 2010, PCAP 2016 showed an increase in achievement scores in reading for students enrolled in both anglophone and francophone schools in Quebec. At the pan-Canadian level, the reading scores of students in French-language systems increased significantly in 2016 compared to the 2010 baseline, while the scores of students in English-language school systems were stable during this time period (Appendix B.11).
Changes over time in reading were positive and significant for both girls and boys in Quebec. At the Canadian level, change in reading was positive for girls and stable for boys in 2016 compared to 2010 (Appendix B.12).

PCAP 2016 109
Figure QC.4 Quebec: results in reading over time
471
498
492
480
481
493
514
497
504
503
492
516
511
503
503
400 420 440 460 480 500 520 540 560 580 600
Males
Females
English
French
QC ‒ Overall reading
Mean score
2016
2013
2010
Results in mathematics and scienceAs noted in the introduction to this document, mathematics and science are both minor domains in PCAP 2016. Results for these domains are reported by mean scores only. This section presents mathematics and science scores for the province, compares Quebec and pan-Canadian scores, reports results by language of the school system and by gender, and presents multiple comparisons over time.
Results in mathematicsFigure QC.5 displays achievement in mathematics for Quebec and Canada. Students in Quebec significantly outperformed students in Canada overall in mathematics in PCAP 2016 (Appendix B.13).
Students enrolled in Quebec’s English-language schools achieved scores higher than the Canadian anglophone sample, while students in the province’s French-language schools achieved results statistically similar to the Canadian French mean. Within Quebec, students in francophone schools significantly outperformed their anglophone counterparts. At the Canadian level, mean scores in mathematics in francophone systems were also significantly higher than those in anglophone systems (Appendix B.14).

110 PCAP 2016
Girls and boys in Quebec both scored significantly above girls and boys in the Canadian sample in mathematics. There was no significant gender gap in mathematics in Quebec, which is consistent with the results at the pan-Canadian level (Appendix B.15).
Figure QC.5 Canada–Quebec: results in mathematics
512
511
502
540
511
543
539
522
543
541
400 420 440 460 480 500 520 540 560 580 600
Males
Females
English
French
OverallMathematics
Mean score
QC
CAN
Mathematics achievement increased in Quebec between the baseline year of 2010 and 2016 (Figure QC.6). This trend is consistent with the results for Canada over the same period of time (Appendix B.16).
Students enrolled in both francophone and anglophone schools in Quebec achieved higher scores in mathematics in PCAP 2016 compared to PCAP 2010, which is consistent with the pattern at the Canadian level (Appendix B.17).
Both girls and boys in Quebec attained higher scores in mathematics in 2016 compared to 2010, a trend that is consistent with the results across Canada over the same period (Appendix B.18).

PCAP 2016 111
Figure QC.6 Quebec: results in mathematics over time
523
513
507
516
515
526
528
509
529
527
543
539
522
543
541
400 420 440 460 480 500 520 540 560 580 600
Males
Females
English
French
QC ‒ Overall mathematics
Mean score
2016
2013
2010
Results in scienceFigure QC.7 presents achievement in the PCAP 2016 Science Assessment for students in Quebec and in Canada overall. It shows that Quebec achieved results similar to the Canadian mean for science (Appendix B.19).
In Quebec, students enrolled in francophone schools scored the same as the Canadian French mean for science while students enrolled in anglophone schools achieved below the Canadian English mean. Quebec’s French-language schools outperformed its English-language schools in science, which differs from results at the pan-Canadian level where there was no significant difference in science achievement between the two language groups (Appendix B.20).
Girls and boys in Quebec both achieved scores in science that were similar to those of girls and boys in Canada overall. In Quebec, there was no significant gender gap in science, while in Canada overall girls achieved significantly higher scores in science than boys (Appendix B.21).

112 PCAP 2016
Figure QC.7 Canada–Quebec: results in science
505
511
508
506
508
504
509
499
507
507
400 420 440 460 480 500 520 540 560 580 600
Males
Females
English
French
Overall Science
Mean score
QC
CAN
Figure QC.8 presents changes over time in science achievement. In Quebec, changes in science scores from the baseline year of 2013 to 2016 were positive and significant, which is consistent with the pattern at the Canadian level (Appendix B.22).
Change over time in science achievement was positive for both English- and French-language schools in Quebec. For Canada overall, anglophone school systems had stable results and francophone school systems saw a positive change in science achievement over the same period (Appendix B.23).
In Quebec, achievement in science from 2013 to 2016 increased significantly for both girls and boys. This trend is also reflected at the Canadian level (Appendix B.24).
Figure QC.8 Quebec: results in science over time
485
485
484
485
485
504
509
498
518
507
400 420 440 460 480 500 520 540 560 580 600
Males
Females
English
French
QC ‒ Overall science
Mean score
2016
2013

PCAP 2016 113
NEW BRUNSWICK
Context statement
Social contextAs Canada’s only officially bilingual province, New Brunswick offers students the opportunity to learn in both English and French. New Brunswick also offers the opportunity to learn Wolastoqey and Mi’kmaq, which are the official languages of the First Nations in the province. According to the Indian Register System from what was then Aboriginal Affairs and Northern Development Canada, as of December 31, 2014, there were approximately 15,249 First Nation people in New Brunswick, 9,366 living in a First Nation community and 5,883 living off-community. On July 1, 2016, the estimated total population of New Brunswick was 756,800, an increase of 0.33 per cent over the preceding year. Although the province’s population remained fairly stable over the previous five years, enrolment in francophone and anglophone schools has decreased since 2005.
Since 2009, the number of older people in New Brunswick has exceeded the number of children. In July 2015, the median age in the province was 44.8, compared to 40.5 for all of Canada. The exception to this trend is New Brunswick’s Indigenous population: 42 per cent were under the age of 25, compared with 27 per cent of the non-Indigenous population.
Organization of the school systemNew Brunswick’s Education Act affirms the right of all students to be educated within a common learning environment to the fullest extent practicable. Inclusive education has been entrenched in the public education system since 1986. Recently developed provincial policy has strengthened the requirements for supporting all learners to develop to their full potential in a common, positive learning environment. A recent amendment to the Education Act introduced an obligation of the minister to approve programs and services that foster an understanding of Indigenous history and culture among all students.
In 1974, New Brunswick recognized its linguistic duality by establishing two parallel but distinct school systems. The francophone sector of the Department of Education and Early Childhood Development is responsible for francophone curriculum and assessment, and the anglophone sector is responsible for curriculum and assessment in anglophone schools. Schools are organized within seven school districts, three francophone and four anglophone. Each school district is governed by a district education council, whose members are locally elected by the public and who are responsible for policy development and decision-making regarding school and district operations.
For the 2015–16 school year, 28,863 students were enrolled in the francophone sector and 69,049 students in the anglophone sector. These students represented, respectively, 29.5 per cent and 70.5 per cent of the total enrolment of 97,912 in the province from Kindergarten to Grade 12. On September 30, 2016, there were 1,369 students living in First Nation communities in the province. Of these, 1,304 attended anglophone schools and 65 attended francophone schools. The number of Indigenous students living and attending schools off community is not tracked.

114 PCAP 2016
Children who are five years old, or who will be five by December 31 of that school year, are enrolled in Kindergarten in September. School attendance is compulsory until the end of secondary school or the age of 18, whichever comes first. In addition, since 2009, two mandatory curricula, one anglophone and one francophone, have been implemented in all regulated facilities that offer services to preschool-aged children.
For more information about New Brunswick’s anglophone school districts, see http://www2.gnb.ca/content/gnb/en/departments/education/k12.html
For more information about New Brunswick’s francophone school districts, see http://www2.gnb.ca/content/gnb/fr/ministeres/education/m12/content/secteur_francophone/francophone.html
Language arts teaching
English language arts teaching
The Atlantic Provinces Education Foundation (APEF) has developed a common curriculum, the Atlantic Canada English Language Arts Curriculum (1998), which articulates the intended outcomes of English language arts learning from Kindergarten/entry through Grade 12. Using ten general outcomes within three strands—Speaking and Listening, Reading and Viewing, and Writing and Other Ways of Representing—the identified areas of learning are common to all, while support documents specific to Kindergarten–Grade 3, Grades 4–6, and Grades 9–12 elaborate on the expected outcomes by grade. The curriculum provides for flexibility of classroom organization, teaching practices, assessment for/as learning, and resources, so that teachers are able to organize and structure their teaching to facilitate learning for all. First Nation literacy resources relevant to all curricular outcomes are available for teachers.
French language arts teaching
French is a core subject in the New Brunswick curriculum, and French courses are compulsory for all students from Kindergarten to Grade 12. These courses promote a communicative approach and a philosophy based on skills development. Students acquire language skills through approaches related to various linguistic methods, including expressive, informative, analytical, critical, and/or play-based methods. Developing skills in comprehension, speaking, writing, and reading are the key elements in the French language arts curriculum, which aims to enable students to succeed in the French language in all subjects.
In French language arts courses, students are supported in developing strategies necessary for the comprehension and production of varied works. Thus, French is an essential subject in which language, in addition to being a critical communication tool, serves to structure thought. It is through language that students learn to reason, to infer, to synthesize, to work with concepts, to communicate their thoughts, and to share their opinions.

PCAP 2016 115
Language arts assessment
English language arts assessment
The provincial evaluation program monitors student achievement at various grades so as to provide feedback at the provincial, district, school, and student levels. Currently, an annual literacy assessment is conducted at Grade 2, with a focus on reporting data in terms of whether or not expectations have been met. At the middle school level, a matrix sample assessment includes a reading component, which is administered to Grade 6 students. In addition, Grade 9 students write the English Language Proficiency Assessment, which students must pass in order to receive a New Brunswick high school diploma. Students have a number of additional opportunities to meet this basic literacy requirement before graduation.
All assessment instruments are aligned with the APEF curriculum documents as well as the standards documents of the Council of Atlantic Ministers of Education and Training (CAMET).
French language arts assessment
Francophone New Brunswick participates in PCAP and the PISA and PIRLS international assessments. As part of its provincial evaluation program, the francophone sector of the Department of Education and Early Childhood Development administers a literacy assessment in Grade 2 and Grade 3. In addition, reading and writing assessments are administered in Grade 8 and Grade 11.
For more information on the Department of Education and Early Childhood Development and the francophone sector’s Apprenticeship Assessment Program, visit: http://www2.gnb.ca/content/gnb/fr/ministeres/education/m12/content/secteur_francophone/mesure_et_evaluation.html
Results in readingThis section presents PCAP 2016 results in reading for New Brunswick and Canada by performance levels and mean scores. Student achievement is reported in reading overall, by language of the school system, and by gender. This section concludes with a comparison of changes over time in reading achievement.
Results in reading by performance levelFigure NB.1 presents the performance of New Brunswick students and that of Canadian students overall in the PCAP 2016 Reading Assessment. Eighty-two per cent of students in New Brunswick achieved Level 2 or higher. (Level 2 is the baseline or expected level for reading proficiency for Grade 8.) The proportion of New Brunswick students at Level 2 was statistically similar to Canada overall, although a lower proportion of students in New Brunswick than in Canada as a whole attained Level 3 (Appendix B.1).
In New Brunswick, smaller proportions of students enrolled in both English- and French-language school systems achieved at or above the expected level of proficiency compared to the proportions of students in these respective groups at the pan-Canadian level. Within the province, the proportion of

116 PCAP 2016
students at Level 2 was the same in both language systems, but students in anglophone schools were more likely to achieve Level 3 proficiency than were students in francophone schools (Appendix B.2).
A smaller proportion of both boys and girls in New Brunswick achieved expected or higher proficiency in reading than boys and girls in Canada overall (Appendix B.3). In New Brunswick, a greater proportion of girls than boys achieved Level 2 or higher (Appendix B.3.1).
Figure NB.1 Canada–New Brunswick: results in reading by level of performance
15
23
9
13
12
23
12
16
12
18
76
70
72
76
78
73
73
73
74
73
10
7
18
11
10
4
15
11
14
9
0 20 40 60 80 100
CAN – Males
NB – Males
CAN – Females
NB – Females
CAN – French
NB – French
CAN – English
NB – English
CAN – Overall reading
NB – Overall reading
Percentage
Level 1
Level 2
Level 3
Note: Percentages may not add up to 100 due to rounding.
Results in reading by mean scoreFigure NB.2 presents results by mean score of the PCAP Reading Assessment for students in New Brunswick and Canada overall. It shows that students in New Brunswick scored below the Canadian mean in reading overall (Appendix B.4).
Students enrolled in both French- and English-language school systems in New Brunswick scored below Canadian mean scores in reading for the respective language groups. Within New Brunswick, students enrolled in anglophone schools outperformed those in francophone schools, which is consistent with the results at the Canadian level (Appendix B.5).
Girls and boys in New Brunswick both had scores in reading significantly below Canadian mean scores by gender. Girls in the province achieved higher scores in reading than boys, which is consistent with the results at the Canadian level (Appendix B.6).

PCAP 2016 117
Figure NB.2 Canada–New Brunswick: results in reading by mean score
494
521
500
509
507
472
506
467
498
489
400 420 440 460 480 500 520 540 560 580 600
Males
Females
French
English
Overall reading
Mean score
NB
CAN
Figure NB.3 and Tables NB.1 and NB.2 display the achievement of New Brunswick and Canadian students by subdomains in reading. Students in New Brunswick scored well below the Canadian means in all four subdomains (Figure NB.3, Appendix B.7).
Figure NB.3 Canada–New Brunswick: results in reading by subdomain
500
500
500
500
486
484
479
487
400 420 440 460 480 500 520 540 560 580 600
Responding criticallyto texts
Responding personallyto texts
Interpreting texts
Understanding texts
Mean score
NBCAN
Students enrolled in English-language school systems in New Brunswick achieved at the Canadian anglophone mean in the understanding texts subdomain, and below the Canadian mean in the remaining three reading subdomains (Table NB.1). For students enrolled in the province’s French-language schools, scores in all four subdomains were below the respective Canadian francophone means (Appendix B.8).

118 PCAP 2016
Table NB.1 Canada–New Brunswick: results in reading by subdomain and language of the school system
Understanding texts Interpreting texts Responding
personally to textsResponding
critically to texts
Mean score CI (±) Mean score CI (±) Mean score CI (±) Mean score CI (±)
CAN English 501 2.1 506 2.3 498 2.6 501 2.6
NB English 496 6.1 492 5.1 486 4.4 490 5.4
Difference 5 14* 12* 11*
CAN French 497 4.5 480 3.7 506 4.2 497 3.9
NB French 464 6.5 447 6.0 477 6.2 476 4.7
Difference 33* 33* 29* 21*
NB English 496 6.1 492 5.1 486 4.4 490 5.4
NB French 464 6.5 447 6.0 477 6.2 476 4.7
Difference 32* 45* 9* 14*
* Denotes significant difference
Table NB.2 shows that girls in New Brunswick scored at the Canadian mean in the understanding texts subdomain. Both girls and boys had lower scores than girls and boys in Canada overall in the other subdomains. Girls in New Brunswick outperformed boys in all four subdomains (Appendix B.9).
Table NB.2 Canada–New Brunswick: results in reading by subdomain and gender
Understanding texts Interpreting texts Responding
personally to textsResponding
critically to texts
Mean score CI (±) Mean score CI (±) Mean score CI (±) Mean score CI (±)
CAN female 509 3.6 515 3.7 511 3.2 516 3.5
NB female 500 6.0 497 6.1 498 5.0 505 5.0
Difference 9 18* 13* 11*
CAN male 492 2.6 487 3.4 490 3.7 485 3.4
NB male 474 5.4 461 5.0 469 5.9 468 4.8
Difference 18* 26* 21* 17*
NB female 500 6.0 497 6.1 498 5.0 505 5.0
NB male 474 5.4 461 5.0 469 5.9 468 4.8
Difference 26* 36* 29* 37*
* Denotes significant difference

PCAP 2016 119
Comparison of reading results over timeFigure NB.4 displays reading achievement over time in New Brunswick. Students in the province attained higher achievement in reading overall in 2016 compared to 2010, which is the baseline year for PCAP reading (Appendix B.10). (As explained in Chapter 2, the baseline year for reading was adjusted to 2010, when the PCAP target group changed from 13-year-old students to Grade 8 students.)
Students enrolled in English-language schools in New Brunswick achieved higher scores in reading in 2016 compared to the 2010 baseline. For students in the province’s French-language schools, scores in 2016 and 2010 were statistically similar. At the Canadian level, the reading scores of students in French-language systems were higher in 2016 compared to the 2010 baseline, while the scores in English-language school systems were statistically similar (Appendix B.11).
Between the 2010 baseline and 2016, New Brunswick boys achieved significantly higher scores in reading, while girls achieved statistically similar scores. At the Canadian level, change in reading was positive for girls and stable for boys in 2016 compared to 2010 (Appendix B.12).
Figure NB.4 New Brunswick: results in reading over time
462
501
464
486
479
459
485
485
466
471
472
506
467
498
489
400 420 440 460 480 500 520 540 560 580 600
Males
Females
French
English
NB ‒ Overall reading
Mean score
2016
2013
2010

120 PCAP 2016
Results in mathematics and scienceAs noted in the introduction to this document, mathematics and science are both minor domains in PCAP 2016. Results for these domains are reported by mean scores only. This sections presents mathematics and science scores for the province, compares New Brunswick and pan-Canadian scores, reports results by language of the school system and by gender, and presents multiple comparisons over time.
Results in mathematicsFigure NB.5 displays mathematics achievement for students in New Brunswick and Canada as a whole in PCAP 2016. It shows that New Brunswick students achieved below the Canadian mean in mathematics overall (Appendix B.13).
Students in both French- and English-language school systems in the province had lower achievement in mathematics than the respective groups in the Canadian sample. Within the province, students enrolled in French-language schools outperformed their English-language counterparts, which is consistent with the pattern at the Canadian level (Appendix B.14).
Girls and boys in New Brunswick scored below the means in mathematics for Canadian girls and boys. There was no gender gap in mathematics achievement in New Brunswick, which is consistent with results at the Canadian level (Appendix B.15).
Figure NB.5 Canada–New Brunswick: results in mathematics
512
511
540
502
511
496
500
521
489
498
400 420 440 460 480 500 520 540 560 580 600
Males
Females
French
English
Overallmathematics
Mean score
NB
CAN
Figure NB.6 shows changes over time in mathematics achievement in New Brunswick. Achievement in mathematics was significantly higher in PCAP 2016 than in 2010, which is the baseline year for PCAP mathematics. For Canada, mathematics achievement in 2016 was also higher than in 2010 (Appendix B.16).

PCAP 2016 121
Achievement in both French- and English-language schools in the province was higher in 2016 compared to the 2010 baseline. At the Canadian level, both language groups also had positive change in 2016 compared to 2010 (Appendix B.17).
Girls and boys in New Brunswick both scored significantly higher in mathematics in PCAP 2016 than in 2010, which is consistent with the pattern at the Canadian level (Appendix B.18).
Figure NB.6 New Brunswick: results in mathematics over time
473
486
507
466
478
477
483
507
470
480
496
500
521
489
498
400 420 440 460 480 500 520 540 560 580 600
Males
Females
French
English
NB ‒ Overall mathematics
Mean score
2016
2013
2010
Results in scienceFigure NB.7 shows that New Brunswick students achieved below the Canadian mean score in science in PCAP 2016 (Appendix B.19).
New Brunswick students enrolled in French-language schools had scores below the Canadian means in science for the respective language groups. Within the province, science achievement for the two language groups was statistically similar, which is consistent with the trend at the Canadian level (Appendix B.20).
Girls in New Brunswick achieved science scores similar to those of Canadian girls, while boys in the province scored below the Canadian mean for boys. Girls in New Brunswick outperformed boys in science in 2016, which is consistent with the results at the Canadian level (Appendix B.21).

122 PCAP 2016
Figure NB.7 Canada–New Brunswick: results in science
505
511
506
508
508
491
509
498
501
500
400 420 440 460 480 500 520 540 560 580 600
Males
Females
French
English
Overall science
Mean score
NB
CAN
Students in New Brunswick achieved higher science scores in PCAP 2016 compared to the baseline year of 2013 (Figure NB.8, Appendix B.22).
Both French- and English-language schools in New Brunswick saw significant, positive changes in science scores between 2013 and 2016. For Canada overall, anglophone school systems had stable results and francophone school systems saw a positive change in science achievement over the same period (Appendix B.23).
The results in science for boys and girls in New Brunswick showed positive, significant change from 2013 to 2016, a trend that is also reflected in the results for Canada overall (Appendix B.24).
Figure NB.8 New Brunswick: results in science over time
467
472
475
467
469
491
509
498
501
500
400 420 440 460 480 500 520 540 560 580 600
Males
Females
French
English
NB ‒ Overall science
Mean score
2016
2013

PCAP 2016 123
NOVA SCOTIA
Context statement
Social contextNova Scotia has a population of 923,595, with a higher rural population than the Canadian average. The annual population growth rate is below 1 per cent, and immigration is low compared to the rest of Canada. About 10 per cent of the population speaks both English and French or French only. Slightly under 4 per cent of the total population are visible minorities. Unemployment rates in Nova Scotia are typically above the Canadian average.
Organization of the school systemThere are seven regional anglophone school boards in Nova Scotia, which enrol 95.2 per cent of all public school students. The provincial school board for Acadian/francophone students, known as the Conseil scolaire acadien provincial, is responsible for the remaining 4.8 per cent of students. Nova Scotia’s total public school population is about 118,567 students, from primary to Grade 12. School enrolment has been decreasing, a trend that is expected to continue. Students who are entering primary school must be five years old on or before December 31 of that school year. Students must attend school until they are 16 years old.
Language arts teachingNova Scotia has undertaken a streamlining and renewal of curriculum in recent years. Work has been initiated and is ongoing at the primary to Grade 6 levels, with revisions to Grades 7 and 8 to start in the fall of 2017. The revised language arts curriculum continues to focus on:
• cross-curricular literacy strategies; • knowledge of and experience with a broad range of texts; • knowledge about language strategies; • knowledge about features and purposes of various types of text; • knowledge about the underlying systems and structures of texts; • the personal, social, and cultural contexts of language learning; • an expanded concept of text, to describe any language event, whether oral, written, or visual; • resource-based learning environments; • culturally responsive pedagogy; • language arts classrooms as centres of inquiry where learners investigate language and language
learning; • interactive learning and the use of social instructional contexts; • increased opportunities for students to use current and emerging technologies; and • the integration of assessment with instruction and the use of a wide variety of assessment strategies.

124 PCAP 2016
Literacy is a priority in Nova Scotia’s public schools at all grade levels and in all subject areas. Nova Scotia’s Literacy Strategy centres on improving teaching, learning, and achievement. The government is committed to providing learning materials for students in literacy, mentors for teachers and students, and professional development for teachers of English or French language arts.
Language arts assessmentsProvincial assessment in Grades 3, 6, and 8 in literacy are administered as “assessments for learning.” These assessments are used to identify student learning needs and to focus provincial improvement strategies. Assessment results are returned to each school in a timely manner so that schools can plan for the instructional needs of individual students. Senior high school students participate in Grade 10 provincial examinations in language arts. The examination result counts as 20 per cent of the student’s final grade in his or her language arts course.
Results in readingThis section presents PCAP 2016 results in reading for Nova Scotia and Canada by performance levels and mean scores. Student achievement is reported in reading overall, by language of the school system, and by gender. This section concludes with a comparison of changes over time in reading achievement.
Results in reading by performance levelFigure NS.1 presents the performance of Nova Scotia students and that of Canadian students overall in the PCAP 2016 Reading Assessment. Eighty-five per cent of students in Nova Scotia achieved Level 2 or higher in reading proficiency (Level 2 is the baseline or expected level for reading proficiency at Grade 8). The percentage of students attaining Levels 2 and 3 in Nova Scotia was the same as in Canada overall (Appendix B.1).
A similar proportion of students enrolled in anglophone school systems in Nova Scotia and Canada achieved at or above the expected level of performance in reading. Significantly fewer students in Nova Scotia’s French-language schools attained Level 2 or above in reading compared to francophones in the country as a whole. Within the province, students in anglophone schools were far more likely than their francophone counterparts to achieve the expected level of proficiency in reading (Appendix B.2).
Similar proportions of girls and a smaller proportion of boys in Nova Scotia achieved Level 2 and above in reading compared to the respective Canadian averages (Appendix B.3). In Nova Scotia, a similar proportion of girls and boys achieved Level 2; however, a higher proportion of girls achieved Level 3.

PCAP 2016 125
Figure NS.1 Canada–Nova Scotia: results in reading by level of performance
15
19
9
11
12
37
12
14
12
15
76
72
72
73
78
58
73
73
74
73
10
9
18
16
10
5
15
13
14
12
0 20 40 60 80 100
CAN – Males
NS – Males
CAN – Females
NS – Females
CAN – French
NS – French
CAN – English
NS – English
CAN – Overall reading
NS – Overall reading
Percentage
Level 1
Level 2
Level 3
Note: Percentages may not add up to 100 due to rounding.
Results in reading by mean scoreFigure NS.2 presents results by mean score of the PCAP 2016 Reading Assessment. It shows that students in Nova Scotia scored below the Canadian mean in reading overall (Appendix B.4).
Students in Nova Scotia’s French- and English-language school systems both scored below the Canadian mean scores in reading for the respective language groups. Within the province, students in anglophone school systems outperformed their francophone counterparts, which is consistent with the pattern at the pan-Canadian level (Appendix B.5).
Girls in Nova Scotia achieved reading scores similar to the Canadian mean for girls, while boys scored below the Canadian mean for boys. Within the province, girls significantly outperformed boys in reading, which is consistent with the results at the Canadian level (Appendix B.6).

126 PCAP 2016
Figure NS.2 Canada–Nova Scotia: results in reading by mean score
494
521
500
509
507
482
514
439
500
498
400 420 440 460 480 500 520 540 560 580 600
Males
Females
French
English
Overall reading
Mean score
NS
CAN
Figure NS.3 and Tables NS.1 and NS.2 display achievement of students in both Nova Scotia and Canada by subdomains in reading. Figure NS.3 shows that students in Nova Scotia scored at the Canadian mean in the understanding texts subdomain and below the Canadian mean in the other three subdomains (Appendix B.7).
Figure NS.3 Canada–Nova Scotia: results in reading by subdomain
500
500
500
500
489
488
492
494
400 420 440 460 480 500 520 540 560 580 600
Responding criticallyto texts
Responding personallyto texts
Interpreting texts
Understanding texts
Mean score
NS
CAN
Students enrolled in English-language schools in Nova Scotia achieved scores similar to the Canadian anglophone mean in the understanding texts subdomain but were below the respective Canadian means for the other three subdomains (Table NS.1). Students enrolled in francophone schools achieved below the Canadian francophone means for the four reading subdomains. Within Nova Scotia, students enrolled in anglophone school systems outperformed their counterparts in francophone schools in all four reading subdomains (Appendix B.8).

PCAP 2016 127
Table NS.1 Canada–Nova Scotia: results in reading by subdomain and language of the school system
Understanding texts Interpreting texts Responding
personally to textsResponding
critically to texts
Mean score CI (±) Mean score CI (±) Mean score CI (±) Mean score CI (±)
CAN English 501 2.1 506 2.3 498 2.6 501 2.6
NS English 497 4.5 494 3.6 490 3.2 491 4.7
Difference 4 12* 8* 10*
CAN French 497 4.5 480 3.7 506 4.2 497 3.9
NS French 427 11.7 428 9.8 448 12.4 463 8.5
Difference 70* 52* 58* 34*
NS English 497 4.5 494 3.6 490 3.2 491 4.7
NS French 427 11.7 428 9.8 448 12.4 463 8.5
Difference 70* 66* 42* 28*
* Denotes significant difference
Girls in Nova Scotia achieved scores similar to the Canadian means for girls in all four reading subdomains (Table NS.2). Boys in Nova Scotia achieved at the Canadian mean for boys in the understanding texts subdomain and below the Canadian mean in the other three subdomains of reading. Within the province, girls significantly outperformed boys in all subdomains (Appendix B.9).
Table NS.2 Canada–Nova Scotia: results in reading by subdomain and gender
Understanding texts Interpreting texts Responding
personally to textsResponding
critically to texts
Mean score CI (±) Mean score CI (±) Mean score CI (±) Mean score CI (±)
CAN female 509 3.6 515 3.7 511 3.2 516 3.5
NS female 504 6.6 511 4.4 503 5.6 508 5.3
Difference 5 4 8 8
CAN male 492 2.6 487 3.4 490 3.7 485 3.4
NS male 486 5.6 473 5.7 474 5.3 471 5.5
Difference 6 14* 16* 14*
NS female 504 6.6 511 4.4 503 5.6 508 5.3
NS male 486 5.6 473 5.7 474 5.3 471 5.5
Difference 18* 38* 29* 37*
* Denotes significant difference

128 PCAP 2016
Comparison of reading results over timeFigure NS.4 displays reading achievement over time for Nova Scotia. Within the province as a whole, reading achievement was higher in PCAP 2016 compared to the baseline year of 2010 (Appendix B.10). (As explained in Chapter 2, the baseline year for reading was adjusted to 2010, when the PCAP target group changed from 13-year-old students to Grade 8 students.)
Students in Nova Scotia’s anglophone school system had higher achievement in reading in 2016 compared to the 2010 baseline, while reading scores in the province’s francophone schools declined significantly. At the Canadian level, the reading scores of students in French-language systems were higher in 2016 compared to the 2010 baseline, while the scores in English-language school systems remained stable (Appendix B.11).
In Nova Scotia and in Canada overall, girls’ reading achievement increased between 2010 and 2016, while boys’ scores remained stable (Appendix B.12).
Figure NS.4 Nova Scotia: results in reading over time
480
501
475
489
489
477
499
468
489
488
482
514
439
500
498
400 420 440 460 480 500 520 540 560 580 600
Males
Females
French
English
NS ‒ Overall reading
Mean score
2016
2013
2010

PCAP 2016 129
Results in mathematics and scienceAs noted in the introduction to this document, mathematics and science are both minor domains in PCAP 2016. Results for these domains are reported by mean scores only. This section presents mathematics and science scores for the province, compares Nova Scotia and pan-Canadian scores, reports results by language of the school system and by gender, and presents multiple comparisons over time.
Results in mathematicsFigure NS.5 shows that students in Nova Scotia achieved below the Canadian mean score for mathematics overall in PCAP 2016 (Appendix B.13).
Mathematics achievement in Nova Scotia’s anglophone schools was statistically similar to the Canadian mean for anglophone systems. In contrast, students enrolled in Nova Scotia’s francophone school system achieved significantly below the Canadian mean for francophone systems. Within the province, as was the case at the Canadian level, students enrolled in French-language school systems outperformed their English-language counterparts in mathematics (Appendix B.14).
Boys and girls in Nova Scotia both scored below the respective Canadian means in mathematics. Within the province, there was no gender gap in mathematics, which is consistent with results at the Canadian level (Appendix B.15).
Figure NS.5 Canada–Nova Scotia: results in mathematics
512
511
540
502
511
496
498
507
497
497
400 420 440 460 480 500 520 540 560 580 600
Males
Females
French
English
Overallmathematics
Mean score
NS
CAN

130 PCAP 2016
Figure NS.6 shows that, since the baseline year for mathematics in PCAP 2010, achievement in that domain has increased in the province. For Canada, change in mathematics over the same period was also positive (Appendix B.16).
Mathematics scores in Nova Scotia’s English-language schools increased from 2010 to 2016, while achievement in the province’s French-language school system was stable. At the Canadian level, both language groups had positive change in mathematics achievement in 2016 compared to the 2010 baseline (Appendix B.17).
For both girls and boys in Nova Scotia, mean scores in mathematics changed positively between 2010 and 2016, a trend consistent with the results for Canada as a whole (Appendix B.18).
Figure NS.6 Nova Scotia: results in mathematics over time
473
478
503
473
474
487
489
499
488
488
496
498
507
497
497
400 420 440 460 480 500 520 540 560 580 600
Males
Females
French
English
NS ‒ Overall mathematics
Mean score
2016
2013
2010
Results in scienceIn PCAP 2016, students in Nova Scotia achieved scores in science below the Canadian mean (Figure NS.7, Appendix B.19).
Students in both anglophone and francophone school systems in Nova Scotia achieved below the Canadian means for the respective language groups. Within the province, students in English-language schools attained higher mean scores in science than their francophone counterparts, while there was no significant difference in science achievement between the two language groups at the Canadian level (Appendix B.20).

PCAP 2016 131
Girls in Nova Scotia achieved scores in science that were statistically similar to the Canadian mean for girls, while boys achieved below the Canadian mean for boys. In Nova Scotia, and at the Canadian level, girls outperformed boys in science (Appendix B.21).
Figure NS.7 Canada–Nova Scotia: results in science
505
511
506
508
508
495
505
473
500
499
400 420 440 460 480 500 520 540 560 580 600
Males
Females
French
English
Overall science
Mean score
NS
CAN
Figure NS.8 shows that students in Nova Scotia attained higher science achievement in 2016 compared to 2013, which is the baseline year for PCAP science. This finding is consistent with the Canadian results overall (Appendix B.22).
Changes in science over time in Nova Scotia were positive in English-language schools and stable for French-language schools. For Canada overall, anglophone school systems had stable results and francophone school systems saw a positive change in science achievement over the same period (Appendix B.23).
Girls in Nova Scotia showed positive change in science between 2013 and 2016, while the achievement for boys was stable. In contrast, at the Canadian level, the results for both girls and boys improved over this period (Appendix B.24).

132 PCAP 2016
Figure NS.8 Nova Scotia: results in science over time
492
491
466
493
492
495
505
473
500
499
400 420 440 460 480 500 520 540 560 580 600
Males
Females
French
English
NS ‒ Overall science
Mean score
2016
2013

PCAP 2016 133
PRINCE EDWARD ISLAND
Context statement
Social contextPrince Edward Island is the smallest province in Canada, in terms of both land (5,684 square kilometres) and population (145,855). Ninety-nine per cent of the population speak English. Prince Edward Island has the third highest percentage of bilingualism in Canada, with 12.7 per cent of the population self-identifying as speaking both English and French. Approximately 6,000 francophone residents live in Prince Edward Island. Fifty-six per cent of the province’s population is rural, with approximately 7 per cent living on farms. The environment is predominately rural, with agriculture, tourism, fishing, and manufacturing constituting the major industries. However, the Island economy is diversifying, with growth industries such as aerospace, bioscience (including agriculture and fisheries), information technology, and renewable energy. The Confederation Bridge, the world’s longest continuous multi-span bridge, opened in 1997, connecting Prince Edward Island to mainland New Brunswick.
Organization of the school systemDuring the 2015–16 school year, the part of Prince Edward Island’s public school system responsible for English-language students was reorganized into the Public Schools Branch (the French school board was unchanged). In 2016, 20,007 students were enrolled in the provinces 62 public schools. This figure included approximately 863 students in six French schools, 22 per cent of whom were in French immersion programs. In addition, there were three private schools, with an enrolment of 277 students, along with one First Nation–operated school. Prince Edward Island has approximately 1,524 teachers.
The school system consists of Kindergarten to Grade 12. High school is Grades 10–12. Students entering Kindergarten must be five years of age by the end of December of their first school year. Prince Edward Island’s students are accommodated within facilities that contain a number of grade configurations, including K–3, K–4, K–6, K–8, K–12, 4–6, 5–8, 7–9, 9–12, and 10–12. This diversity results from the realities of enrolments and existing facilities as well as demands placed on the schools by local communities.
Language arts teaching
English language arts teaching
Prince Edward Island students follow the English language arts (ELA) curriculum formulated by the Atlantic Provinces Education Foundation. This curriculum provides a framework for balanced literacy instruction and scaffolds a variety of skills within the three strands of the ELA program: Speaking and Listening, Reading and Viewing, and Writing and Other Ways of Representing. Grade-level reading and writing standards provide clear detail with regard to expected achievement. In Grades 7–9, the curriculum promotes choice and flexibility in classroom organization, teaching practices, resources, and assessment. Teachers are encouraged to adopt a workshop model to help students

134 PCAP 2016
develop skills and apply strategies in a variety of contexts. “Essential graduation competencies” are threaded throughout the ELA curriculum to support student growth in the areas of citizenship, communication, personal career development, creativity and innovation, critical thinking, and technical fluency.
The Grade 7–9 ELA curriculum is currently under review, and the revised Grade 9 ELA curriculum is being piloted beginning in September 2017.
English language arts assessment
Teachers are encouraged to use a variety of formative assessment practices that involve the use of mentor texts as well as co-constructed success criteria. It is critical that teachers align their instruction and assessment so as to facilitate student learning related to specific curriculum outcomes. In addition, students should have multiple opportunities to acquire and apply formative feedback before summative classroom assessments.
French-as-a-first-language program
The French-as-a-first-language program at the intermediate level is built around the three fundamental components of literacy: verbal communication, reading, and writing. Students develop their competencies through study of various genres of text.
Learning outcomes in this program are based on cross-curricular competencies that are built into the curriculum. These include learning opportunities spanning multiple subjects: acquisition of French language and knowledge of Acadian and francophone culture; citizenship; communication; creativity and innovation; personal and career development; technological proficiency; and critical thinking.
French-first-language evaluation and performance assessment
Teachers are encouraged to plan ongoing formative assessment and evaluation of student progress in order to determine the degree of proficiency achieved. It is important that teachers choose the most relevant among a large number of formative assessment/evaluation tools. Students also need multiple opportunities and paths to demonstrate what they have learned, and they need to receive feedback throughout the year.
Provincial reading and writing assessments are administered at the end of Grades 3 and 6. A provincial secondary literacy assessment measuring skills up to the end of Grade 9 will be developed and implemented for the September 2018 school year. Successful completion of this assessment will be a graduation requirement for all Prince Edward Island students.
Results in readingThis section presents PCAP 2016 results in reading for Prince Edward Island and Canada by performance levels and mean scores. Student achievement is reported in reading overall and by gender. This section concludes with a comparison of changes over time in reading achievement. Results by language of the school system are not included for Prince Edward Island, as the sample of students writing in French was too small to allow for statistically meaningful comparisons.

PCAP 2016 135
Results in reading by performance levelFigure PE.1 presents the performance of Prince Edward Island students and that of Canadian students overall in the PCAP 2016 Reading Assessment. Ninety-one per cent of students in Prince Edward Island achieved Level 2 or higher in reading, which is higher than the Canadian average (Level 2 is the PCAP baseline or expected level for reading proficiency in Grade 8). The percentage of students attaining Level 3 in Prince Edward Island was statistically similar to the Canadian average (Appendix B.1).
A significantly higher proportion of girls in Prince Edward Island achieved at or above the expected level of performance in reading compared to the Canadian average for girls, while the percentage of boys at or above Level 2 was statistically the same as the Canadian average for boys. Within Prince Edward Island, a larger proportion of girls than boys achieved Level 2 or above (Appendix B.3).
Figure PE.1 Canada–Prince Edward Island: results in reading by level of performance
15
13
9
4
12
9
76
75
72
82
74
79
10
12
18
13
14
13
0 20 40 60 80 100
CAN – Males
PE – Males
CAN – Females
PE – Females
CAN – Overall reading
PE – Overall reading
Percentage
Level 1
Level 2
Level 3
Note: Percentages may not add up to 100 due to rounding.
Results in reading by mean scoreFigure PE.2 presents results in reading by mean score for students in Prince Edward Island and Canada. In PCAP 2016, students in the province achieved similar scores to the Canadian mean in reading (Appendix B.4).
Girls and boys in Prince Edward Island both achieved reading scores similar to the respective Canadian means for gender. Within the province, girls significantly outperformed boys in reading, which is consistent with the results at the Canadian level (Appendix B.6).

136 PCAP 2016
Figure PE.2 Canada–Prince Edward Island: results in reading by mean score
494
521
507
498
526
513
400 420 440 460 480 500 520 540 560 580 600
Males
Females
Overall reading
Mean score
PE
CAN
Figure PE.3 and Table PE.1 display the achievement by subdomains in reading for students in both Prince Edward Island and Canada. Students in the province achieved scores similar to the Canadian means in all four of the subdomains (Appendix B.7).
Figure PE.3 Canada–Prince Edward Island: results in reading by subdomain
500
500
500
500
501
501
505
508
400 420 440 460 480 500 520 540 560 580 600
Responding criticallyto texts
Responding personallyto texts
Interpreting texts
Understanding texts
Mean score
PECAN
Table PE.1 shows that girls and boys in Prince Edward Island achieved scores similar to the Canadian means for gender in all four reading subdomains. Within the province, girls and boys achieved statistically similar scores in the understanding texts subdomain. Girls outperformed boys in the other three subdomains (Appendix B.9).

PCAP 2016 137
Table PE.1 Canada–Prince Edward Island: results in reading by subdomain and gender
Understanding texts Interpreting texts Responding
personally to textsResponding
critically to texts
Mean score CI (±) Mean score CI (±) Mean score CI (±) Mean score CI (±)
CAN female 509 3.6 515 3.7 511 3.2 516 3.5
PE female 515 10.0 524 11.6 512 11.9 515 14.1
Difference 6 9 1 1
CAN male 492 2.6 487 3.4 490 3.7 485 3.4
PE male 501 16.0 485 15.2 489 16.3 487 10.0
Difference 9 2 1 2
PE female 515 10.0 524 11.6 512 11.9 515 14.1
PE male 501 16.0 485 15.2 489 16.3 487 10.0
Difference 14 39* 23* 28*
* Denotes significant difference
Comparison of reading results over timeFigure PE.4 displays reading achievement over time for students in the province. Students achieved higher reading scores in 2016 compared to 2010, which is the PCAP baseline year for reading (Appendix B.10). (As explained in Chapter 2, the baseline year for reading was adjusted to 2010, when the PCAP target group changed from 13-year-old students to Grade 8 students.)
Girls and boys in Prince Edward Island achieved higher reading scores in PCAP 2016 compared to the 2010 baseline (Appendix B.12). In Canada overall, girls achieved higher scores and boys’ scores remained stable during this period.
Figure PE.4 Prince Edward Island: results in reading over time
474
491
481
479
509
494
498
526
513
400 420 440 460 480 500 520 540 560 580 600
Males
Females
PE ‒ Overall reading
Mean score
2016
2013
2010

138 PCAP 2016
Results in mathematics and scienceAs noted in the introduction to this document, mathematics and science are both minor domains in PCAP 2016. Results for these domains are reported by mean scores only. This section presents mathematics and science scores for the province, compares Prince Edward Island and pan-Canadian scores, reports results by gender, and presents comparisons over time.
Results in mathematicsFigure PE.5 displays mean score achievement in mathematics in PCAP 2016 for Prince Edward Island and Canada. It shows that students in the province attained a mean score in mathematics similar to the Canadian mean (Appendix B.13).
There was no gender gap either in Prince Edward Island or at the Canadian level in math achievement in 2016 (Appendix B.15).
Figure PE.5 Canada–Prince Edward Island: results in mathematics
512
511
511
504
502
503
400 420 440 460 480 500 520 540 560 580 600
Males
Females
Overallmathematics
Mean score
PE
CAN
In Prince Edward Island, mathematics scores were significantly higher in 2016 compared to the 2010 baseline for PCAP mathematics (Figure PE.6). This is consistent with the results at the Canadian level (Appendix B.18).
Scores in mathematics improved significantly for both girls and boys in the province between 2010 and 2016 (Figure PE.6). These results are consistent with those for girls and boys in Canada as a whole in the same period (Appendix B.18).

PCAP 2016 139
Figure PE.6 Prince Edward Island: results in mathematics over time
468
453
460
485
498
492
504
502
503
400 420 440 460 480 500 520 540 560 580 600
Males
Females
PE ‒ Overall mathematics
Mean score
2016
2013
2010
Results in scienceIn PCAP 2016, the mean score in overall science for students in Prince Edward Island was the same as the Canadian mean (Figure PE.7, Appendix B.19).
The science achievement of both girls and boys in Prince Edward Island was also statistically similar to the respective Canadian means for gender. Within the province, there was no gender gap in science achievement. This differs from the results at the Canadian level, where girls achieved higher scores than boys (Appendix B.21).
Figure PE.7 Canada–Prince Edward Island: results in science
505
511
508
515
518
516
400 420 440 460 480 500 520 540 560 580 600
Males
Females
Overall science
Mean score
PE
CAN
Students in Prince Edward Island achieved higher scores in science in PCAP 2016 than in 2013, which is the baseline year for science (Figure PE.8, Appendix B.22).
Science scores for both girls and boys in Prince Edward Island were also significantly higher in 2016 compared to 2013, which is consistent with the results at the Canadian level (Appendix B.24).

140 PCAP 2016
Figure PE.8 Prince Edward Island: results in science over time
495
488
491
515
518
516
400 420 440 460 480 500 520 540 560 580 600
Males
Females
PE ‒ Overall science
Mean score
2016
2013

PCAP 2016 141
NEWFOUNDLAND AND LABRADOR
Context statement
Social contextNewfoundland and Labrador’s population of approximately 528,450 people is spread over a large geographical area. The population of rural areas has been declining, while that of urban areas has been rising: currently, the capital city of St. John’s makes up 39 per cent of the total population of the province. The decline in the size of rural communities, along with the large geographic area of the province, presents many challenges for the delivery of educational programs and services. To add to this challenge, over the past few years, the provincial economy has declined and employment rates have decreased.
Organization of the school systemThe province’s education system is organized into two public school districts—one English and one French—and includes six private schools as well. The districts contain 258 schools with a total student enrolment of approximately 66,300 and 5,300 school-based educators. Fifty-three per cent of the provincial student enrolment is concentrated in the Avalon Peninsula, in the eastern part of the province. Early French immersion (K–12) and late French immersion (Grades 7–12) are offered in the anglophone public school district. Approximately 15 per cent of the total student population is enrolled in either early or late French immersion. School entry is compulsory for children who are six years of age by December 31 of the school year; however, most children enter Kindergarten at the age of five. Typically, Grade 8 students are 13 years old.
Language arts teachingThe framework for curriculum development within the Newfoundland and Labrador Department of Education and Early Childhood Development is based on outcomes in the Atlantic Provinces Education Foundation (APEF) curriculum. Kindergarten to Level III curriculum is organized around ten general curriculum outcomes (GCOs) and six strands (Speaking and Listening, Reading and Viewing, and Writing and Other Ways of Representing). GCOs are subdivided into specific curriculum outcomes for each grade level, which state what students are expected to know and to be able to do as a result of their learning experiences in a given course and at a specific grade level. Students in Kindergarten to Grade 9 are offered a common comprehensive English language arts curriculum. At the senior high school level, students are offered an option to complete a general or academic-level program.
Language arts assessmentNewfoundland and Labrador administers standardized provincial assessments each year at the end of primary, elementary, and intermediate levels in an effort to improve student learning. Students are assessed in the outcomes of the various strands of the English language arts curriculum. Provincial assessments are constructed to measure student learning in reading and writing. Reading portions

142 PCAP 2016
of the assessments involve student responses to a range of reading prompts in informational, visual, narrative, and poetic texts.
A provincial examination is administered to high school students who are completing the academic English language arts program. This examination is worth 50 per cent of a student’s final grade and is marked by a panel of teachers at the end of the school year.
More information about the Newfoundland and Labrador K–12 education system can be found on the Department of Education Web site, at http://www.gov.nl.ca/edu.
Results in readingThis section presents PCAP 2016 results in reading for Newfoundland and Labrador and Canada by performance levels and mean scores. Student achievement is reported in reading overall and by gender. This section concludes with a comparison of changes over time in reading achievement.
Results in reading by performance levelFigure NL.1 presents the performance of Newfoundland and Labrador students and that of Canadian students overall in the PCAP 2016 Reading Assessment. Eighty-two per cent of students in Newfoundland and Labrador achieved Level 2 or higher in reading proficiency (Level 2 is the PCAP baseline or expected level for reading proficiency for Grade 8). The proportion of students in the province who achieved at Level 2 was similar to those in Canada as a whole. However, students in Newfoundland and Labrador were more likely to attain Level 1 compared to students in Canada as a whole (Appendix B.1).
In Newfoundland and Labrador, a smaller proportion of boys and girls achieved Level 2 or higher in reading proficiency than boys and girls in Canada overall. Within the province, a similar proportion of girls and boys achieved Level 2, but girls were more likely than boys to attain Level 3 (Appendix B.3).
Figure NL.1 Canada–Newfoundland and Labrador: results in reading by level of performance
15
21
9
15
12
18
76
70
72
71
74
71
10
8
18
14
14
11
0 20 40 60 80 100
CAN – Males
NL – Males
CAN – Females
NL – Females
CAN – Overall reading
NL – Overall reading
Percentage
Level 1
Level 2
Level 3
Note: Percentages may not add up to 100 due to rounding.

PCAP 2016 143
Results in reading by mean scoreFigure NL.2 displays results by mean score of the PCAP Reading Assessment for students in Newfoundland and Labrador and in Canada overall. It shows that students in the province achieved below the Canadian mean in reading (Appendix B.4).
Girls and boys in Newfoundland and Labrador achieved reading scores below the gender means for Canada as a whole. Within the province, and in Canada overall, girls achieved significantly higher scores than boys (Appendix B.6).
Figure NL.2 Canada–Newfoundland and Labrador: results in reading by mean score
494
521
507
482
500
491
400 420 440 460 480 500 520 540 560 580 600
Males
Females
Overall reading
Mean score
NL
CAN
Figure NL.3 and Table NL.1 display achievement of students in Newfoundland and Labrador and Canada overall by subdomains in reading. Newfoundland and Labrador students achieved scores below the Canadian means for the four PCAP subdomains (Figure NL.3, Appendix B.7).
Figure NL.3 Canada–Newfoundland and Labrador: results in reading by subdomain
500
500
500
500
486
483
488
487
400 420 440 460 480 500 520 540 560 580 600
Responding criticallyto texts
Responding personallyto texts
Interpreting texts
Understanding texts
Mean score
NL
CAN

144 PCAP 2016
Table NL.1 shows that boys in Newfoundland and Labrador achieved at the Canadian mean for boys in three of the four reading subdomains: understanding texts, interpreting texts, and responding critically to texts. Girls in Newfoundland and Labrador achieved below the Canadian means on all four subdomains. Within the province, girls outperformed boys on all four subdomains (Appendix B.9).
Table NL.1 Canada–Newfoundland and Labrador: results in reading by subdomain and gender
Understanding texts Interpreting texts Responding
personally to textsResponding
critically to texts
Mean score CI (±) Mean score CI (±) Mean score CI (±) Mean score CI (±)
CAN female 509 3.6 515 3.7 511 3.2 516 3.5
NL female 493 6.7 500 7.1 491 7.4 493 6.5
Difference 16* 15* 20* 23*
CAN male 492 2.6 487 3.4 490 3.7 485 3.4
NL male 482 6.8 477 8.8 475 7.1 479 7.6
Difference 10 10 15* 6
NL female 493 6.7 500 7.1 491 7.4 493 6.5
NL male 482 6.8 477 8.8 475 7.1 479 7.6
Difference 11* 23* 16* 14*
* Denotes significant difference
Comparison of reading results over timeFigure NL.4 displays reading achievement in the province over time. Overall reading achievement in Newfoundland and Labrador has been stable since 2010, which is the baseline year for PCAP reading (Appendix B.10). (As explained in Chapter 2, the baseline year for reading was adjusted to 2010, when the PCAP target group changed from 13-year-old students to Grade 8 students.)
Boys in Newfoundland and Labrador achieved higher scores, whereas there was no significant change in reading achievement for girls between 2016 and 2010. At the Canadian level, change in reading was positive for girls and stable for boys during this period (Appendix B.12).

PCAP 2016 145
Figure NL.4 Newfoundland and Labrador: results in reading over time
468
506
486
486
503
495
482
500
491
400 420 440 460 480 500 520 540 560 580 600
Males
Females
NL ‒ Overall reading
Mean score
2016
2013
2010
Results in mathematics and scienceAs noted in the introduction to this document, mathematics and science are both minor domains in PCAP 2016. Results for these domains are reported by mean scores only. This section presents mathematics and science scores for the province, compares Newfoundland and Labrador and pan-Canadian scores, reports results by gender, and presents comparisons over time.
Results in mathematicsFigure NL.5 displays achievement in mathematics for Newfoundland and Labrador and for Canada overall. In PCAP 2016, students in Newfoundland and Labrador achieved significantly below the Canadian mean score for mathematics (Appendix B.13).
Both boys and girls in Newfoundland and Labrador achieved below the respective Canadian means for gender in mathematics. Within the province, and at the Canadian level, there was no gender gap in mathematics (Appendix B.15).

146 PCAP 2016
Figure NL.5 Canada–Newfoundland and Labrador: results in mathematics
512
511
511
491
488
490
400 420 440 460 480 500 520 540 560 580 600
Males
Females
Overallmathematics
Mean score
NL
CAN
Figure NL.6 shows that mathematics achievement in Newfoundland and Labrador was higher in 2016 compared to 2010, which is the PCAP baseline year for mathematics. This is consistent with the results at the Canadian level (Appendix B.16).
Both girls and boys in Newfoundland and Labrador had significantly higher achievement in mathematics in 2016 compared to 2010. These trends are consistent with those at the Canadian level (Appendix B.18).
Figure NL.6 Newfoundland and Labrador: results in mathematics over time
471
476
472
484
489
487
491
488
490
400 420 440 460 480 500 520 540 560 580 600
Males
Females
NL ‒ Overall mathematics
Mean score
2016
2013
2010
Results in scienceFigure NL.7 displays PCAP 2016 science achievement for Newfoundland and Labrador and for Canada. Students in Newfoundland and Labrador achieved at the Canadian mean for science overall (Appendix B.19).

PCAP 2016 147
Boys and girls in Newfoundland and Labrador achieved results similar to the Canadian science mean for boys and girls. Within the province, there was no gender gap in PCAP 2016 science; in contrast, in Canada as a whole, girls outperformed boys in science (Appendix B.21).
Figure NL.7 Canada–Newfoundland and Labrador: results in science
505
511
508
498
503
501
400 420 440 460 480 500 520 540 560 580 600
Males
Females
Overall science
Mean score
NL
CAN
Figure NL.8 shows that science achievement for Newfoundland and Labrador students was stable between 2016 and 2013, which was the baseline year for PCAP science. During this period, there was a positive change in science achievement at the Canadian level (Appendix B.22).
Science scores were stable for both girls and boys from 2013 to 2016. This differs from the results at the pan-Canadian level, which showed positive change over time in science achievement for both girls and boys (Appendix B.24).
Figure NL.8 Newfoundland and Labrador: results in science over time
500
500
500
498
503
501
400 420 440 460 480 500 520 540 560 580 600
Males
Females
NL ‒ Overall science
Mean score
2016
2013


PCAP 2016 149
CONCLUSION
The Pan-Canadian Assessment Program (PCAP) reflects CMEC’s ongoing commitment to inform Canadians about how well their education systems are meeting the needs of students and society. The information gained from this pan-Canadian assessment provides ministers of education with a basis for monitoring and evaluating the curriculum and other aspects of their school systems.
This report has described the performance of Grade 8/Secondary II students in the fourth administration of PCAP. In this assessment, the major domain was reading and the minor domains were mathematics and science. As the major domain, the reading component of PCAP 2016 encompassed more of the actual curricula of all Canadian provinces. The components of mathematics and science, assessed as minor domains, maintained a focus on the same subdomains as in baseline year (mathematics in 2010 and science in 2013), but fewer items were assessed.
Participation in the testing process can be a demanding exercise. PCAP does not provide student results on an individual or a school basis, which means that the testing process can appear to be of no immediate consequence to the participants at those levels. Therefore, it is a tribute to the students, the teachers, and the school principals who participated in the administration process that they so readily and clearly applied themselves to the tasks demanded of them.
Overview of results
Test designBased on a review of contemporary research and the curricula from all provinces in each subject area for the grade level, the development process for the PCAP test included a bilingual item-development team, a validation process, and field testing, all under the constant review of and feedback from the provinces and their particular subject-area experts. The resulting data indicate that the design and content of the instruments are sound, engaging students effectively. The instruments provide reliable and valid data on specific pan-Canadian curriculum-based objectives, using a range of scenarios and item designs to engage students and allow them to demonstrate their proficiency in the three domains.
Pan-Canadian results in reading by performance level As the major domain in PCAP 2016, reading was assessed to provide results by performance levels, which were mapped to achievement indicators that provide a detailed description of students’ reading proficiency at three levels. In PCAP, Level 2 is considered the baseline, or expected level of reading proficiency, for Grade 8/Secondary II students.
In PCAP 2016, 88 per cent of students in Canada achieved performance Level 2 or higher in reading, and 14 per cent of students achieved Level 3 (the highest level of reading proficiency). Quebec had a higher proportion of students achieving Level 2 compared to the Canadian average, while achievement in all other provinces was similar to the Canadian average. The proportion of students at

150 PCAP 2016
Level 3 in British Columbia, Alberta, Ontario, Nova Scotia, and Prince Edward Island was statistically similar to the Canadian average.
Achievement in reading, mathematics, and science by mean scoreIn PCAP 2016, achievement in reading, mathematics, and science is reported by mean score. Student achievement was higher than the Canadian average in mathematics in Quebec and in science in Alberta. No province scored above the Canadian mean in each of the domains of reading, mathematics, and science.
Achievement that was similar to the Canadian mean was found in British Columbia, Alberta, Ontario, Quebec, and Prince Edward Island in reading; in Ontario and Prince Edward Island in mathematics; and in British Columbia, Ontario, Quebec, Prince Edward Island, and Newfoundland and Labrador in science. Ontario, Quebec, and Prince Edward Island were the only provinces to score at or above the Canadian mean in each of reading, mathematics, and science.
Achievement by language of the school systemIn reading, students enrolled in English-language school systems outperformed students in French-language school systems in Canada overall. The opposite pattern was observed for mathematics, where francophone students achieved higher scores than their anglophone peers. In the PCAP 2016 Science Assessment, there was no significant difference between the two language systems at the pan-Canadian level.
In reading, students enrolled in English-language schools in British Columbia, Alberta, Ontario, Quebec, and Prince Edward Island attained mean scores statistically similar to those obtained by Canadian anglophone students overall. In French-language schools, students in Quebec achieved scores similar to the Canadian francophone mean; results in francophone school systems in all other provinces were below the Canadian French mean. Students in the English-language system outperformed those in the French-language system in all provinces.
In mathematics, students enrolled in anglophone schools in Alberta, Ontario, Quebec, Nova Scotia, and Prince Edward Island obtained mean scores that were at or above the Canadian English mean. In francophone schools, students in Quebec attained scores statistically similar to the Canadian French mean; francophone school systems in all other provinces were below the Canadian French mean. Significant differences in mathematics achievement by language of the school system were found in British Columbia, Saskatchewan, Ontario, Quebec, New Brunswick, and Nova Scotia. In all cases, this achievement gap favoured francophone school systems. The two language groups achieved similar outcomes in mathematics in Alberta and Manitoba.
In science, English-language students in British Columbia, Alberta, Ontario, Prince Edward Island, and Newfoundland and Labrador achieved at or above the Canadian English mean, while French-language students in British Columbia, Alberta, and Quebec scored at the Canadian French mean. Provincial results were quite variable. Students enrolled in anglophone schools attained scores higher than their francophone counterparts in Alberta, Manitoba, Ontario, and Nova Scotia; those in francophone schools had higher achievement than anglophone students in Saskatchewan and

PCAP 2016 151
Quebec. There was no significant difference in achievement between the two school systems in British Columbia and New Brunswick.
Achievement by genderIn PCAP 2016, girls outperformed boys in reading, both at the pan-Canadian level and in individual provinces, a result that is consistent with results reported in international studies such as PIRLS 2016 for Grade 4 students and PISA 2015 for 15-year-olds. Results by gender were more variable in mathematics and science. In mathematics, boys and girls achieved similar scores in PCAP 2016 in all provinces except Saskatchewan, where boys outperformed girls. In science, girls outperformed boys in Canada overall, and in Alberta, Manitoba, New Brunswick, and Nova Scotia. There was no gender gap in science in the remaining provinces.
Pan-Canadian results by subdomains in readingPCAP 2016 assessed students in four subdomains of reading: understanding texts, interpreting texts, responding personally to texts, and responding critically to texts. For those provinces performing at or above the Canadian mean, most show stronger results in one or two subdomains, although the specific subdomains with the highest scores vary from province to province.
Overall in Canada, students in anglophone schools achieved higher scores than their francophone counterparts in the interpreting texts subdomain; however, the opposite pattern occurs for the responding personally to texts subdomain, with francophone students outperforming their peers in anglophone school systems.
As was the case for overall reading, the gender gap favours girls for the four reading subdomains at the Canadian level. Within provinces, girls outperformed boys in all four subdomains, except in Prince Edward Island where there was no gender gap for the understanding texts subdomain.
Performance comparisons over time This fourth administration of PCAP allows for comparisons of results of Grade 8/Secondary II students in reading from 2007, 2010, 2013, and 2016;16 in mathematics from 2010, 2013, and 2016; and in science from 2013 and 2016. Using anchor items to link the tests to the baseline administration, comparisons can be made with respect to changes over time in achievement.
In PCAP 2016, reading achievement improved in Canada overall compared to the baseline year of 2010. Within provinces, there have been gains in overall reading achievement in British Columbia, Manitoba, Quebec, New Brunswick, Nova Scotia, and Prince Edward Island. In anglophone systems, reading scores improved in British Columbia, Manitoba, Quebec, New Brunswick, Nova Scotia, and Prince Edward Island; improvements also occurred in the francophone system in Quebec. Reading scores declined in French-language schools in Manitoba and Nova Scotia during this period. Between 2010 and 2016, girls improved in reading in British Columbia, Alberta, Quebec, Nova Scotia, and Prince Edward Island, while boys improved in Manitoba, Quebec, New Brunswick, Prince Edward Island, and Newfoundland and Labrador.
16 Note, though, that the baseline year for reading was adjusted from 2007 to 2010, when PCAP changed from an aged-based (13-year-olds) to a grade-based (Grade 8/Secondary II) assessment.

152 PCAP 2016
In mathematics, significant improvements in achievement between 2010 and 2016 occurred overall in Canada and in all provinces except Ontario, where results remained stable over time. Three of the provinces in which results were assessed by language of the school system showed positive change for both anglophone and francophone students (British Columbia, Quebec, and New Brunswick); over half of all provinces showed positive change for both girls and boys.
In the PCAP 2016 Science Assessment, Canadian students registered higher scores over time, compared to the baseline year of 2013. Manitoba, Quebec, and New Brunswick showed gains in science in both the anglophone and francophone school systems, and more than half of the provinces showed gains for girls. Achievement improved over time for boys in Manitoba, Quebec, New Brunswick, and Prince Edward Island.
Final statementThe results of the PCAP 2016 assessment conclude that most Canadian Grade 8/Secondary II students are achieving levels of performance in reading that are at the expected level or higher. Certain nuances are nevertheless to be noted. A persistent gender gap favouring girls continues to be apparent in the pan-Canadian reading assessment, which is consistent with findings in international studies. As well, there are still numerous students who perform at Level 1, for whom reading presents a significant challenge.
Although there are differences in achievement among provinces, the approach taken in this report does not lend itself to developing explanations for these differences. Secondary analysis undertaken as part of the forthcoming report PCAP 2016: Contextual Report on Student Achievement in Reading will explore how resources and school and classroom conditions, as well as the characteristics of students and their families, may affect achievement among Grade 8/Secondary II students.
PCAP is designed to determine whether students across Canada reach similar levels of performance in the core disciplines of reading, mathematics, and science at about the same age. It complements existing assessments in each province, generating comparative Canada-wide data on the achievement attained by Grade 8/Secondary II students across the country. Further comparative evidence can be obtained from international assessments such as PIRLS, which tests Grade 4 students in reading; TIMMS, which tests Grade 4 and Grade 8 students in mathematics and science; and the upcoming PISA, which will test the same cohort of students as PCAP in reading, mathematics, and science, but two years later.
Overall, the PCAP testing reaffirms that CMEC’s large-scale assessment projects offer innovative and timely direction on education policy, curriculum, and classroom practices in Canada. Although Canadian students are performing well in reading, mathematics, and science, this report, and the upcoming contextual report, helps identify areas that could be improved. Over the coming months, CMEC, in collaboration with ministries and departments of education, will continue to analyze the results from PCAP in conjunction with other education indicators to better inform teaching and learning in the three core domains as well as related educational policies.

PCAP 2016 153
REFERENCES
Alderson, J., & Bachman, F. (2000). Assessing reading. Cambridge: Cambridge University Press.
Binkley, M., & Linnakylä, P. (1997). Teaching reading in the United States and Finland. In M. Binkley, K. Rust, and T. Williams (Eds.), Reading literacy in an international perspective. Washington, DC: US Department of Education.
Brochu, P., Deussing, M.-P., Houme, K., & Chuy, M. (2013). Measuring up: Canadian results of the OECD PISA Study. The performance of Canada’s youth in mathematics, reading, and science – 2012. First results for Canadians aged 15. Toronto: Council of Ministers of Education, Canada. Retrieved from http://cmec.ca/Publications/Lists/Publications/Attachments/318/PISA2012_CanadianReport_EN_Web.pdf
Brochu, P., O’Grady, K., Scerbina, T., Khan, G. & Muhe, N. (2017). TIMSS 2015: Canadian results from the Trends in International Mathematics and Science Study. Toronto: Council of Ministers of Education, Canada. Retrieved from https://www.cmec.ca/Publications/Lists/Publications/Attachments/373/TIMSS2015_Report_EN.pdf
Bruner, J. (1990). Acts of meaning. Cambridge, MA: Harvard University Press.
Council of Ministers of Education, Canada. (1996). SAIP 1996 Science Assessment. Toronto: Author. Retrieved from https://www.cmec.ca/Publications/Lists/Publications/Attachments/139/SAIP-1996-Science.pdf
Council of Ministers of Education, Canada. (1997). Common framework of science learning outcomes, K to 12: Pan-Canadian protocol for collaboration on school curriculum. Toronto: Author. http://science.cmec.ca/framework/
Council of Ministers of Education, Canada. (2005a). The Pan-Canadian Assessment Program: Literature review of reading assessment and test design. Unpublished report.
Council of Ministers of Education, Canada. (2005b). SAIP Science III Assessment 2004: The public report. Toronto: Author. Retrieved from https://www.cmec.ca/Publications/Lists/Publications/Attachments/62/SAIP-Science2004.en.pdf
Council of Ministers of Education, Canada. (2008). PCAP-13 2007: Report on the assessment of 13-year-olds in reading, mathematics, and science. Toronto: Author. Retrieved from https://www.cmec.ca/Publications/Lists/Publications/Attachments/124/PCAP2007-Report.en.pdf
Council of Ministers of Education, Canada. (2011). PCAP-2010: Report on the pan-Canadian assessment of mathematics, science, and reading. Toronto: Author. Retrieved from https://www.cmec.ca/Publications/Lists/Publications/Attachments/274/pcap2010.pdf
Council of Ministers of Education, Canada. (2016). PCAP 2016: Assessment framework. Toronto: Author. Retrieved from http://www.cmec.ca/537/Programs-and-Initiatives/Assessment/Pan-Canadian-Assessment-Program-(PCAP)/PCAP-2016/General-Information/index.html
Crocker, R. (2005). The Pan-Canadian Assessment Program. Concept paper, Draft 2. Unpublished manuscript.

154 PCAP 2016
Gray, W.S. (1960). The major aspects of reading. In H. Robinson (Ed.), Sequential development of reading abilities. Supplementary Educational Monographs, No. 90 (pp. 8–24). Chicago: University of Chicago Press.
Labrecque, M., Chuy, M., Brochu, P., & Houme, K. (2012). PIRLS 2011: Canada in context: Canadian results from the Progress in International Reading Literacy Study. Toronto: Council of Ministers of Education, Canada. Retrieved from http://cmec.ca/Publications/Lists/Publications/Attachments/294/PIRLS_2011_EN.pdf
Legros, D., & Crinon, J. (2002). Psychologie des apprentissages et multimedia. Paris: Armand Colin.
Lewis, D. M., Mitzel, H. C., Mercado, R. L, & Schultz, E. M. (2012). The Bookmark standard setting procedure. In G. J. Cizek (Ed.), Setting performance standards: Foundations, methods, and innovations (2nd ed., pp. 225–254). New York: Taylor & Francis.
O’Grady, K., Deussing, M. A., Scerbina, T., Fung, K., & Muhe, N. (2016). Measuring up: Canadian results of the OECD PISA study. The performance of Canada’s youth in science, reading and mathematics – 2015. First results for Canadians aged 15. Toronto: Council of Ministers of Education, Canada. Retrieved from http://www.cmec.ca/Publications/Lists/Publications/Attachments/365/PISA2015-CdnReport-EN.pdf
O’Grady, K., & Fung, K. (forthcoming). PCAP 2016: Technical report. Toronto: Council of Ministers of Education, Canada.
O’Grady, K., & Houme, K. (2014). PCAP 2013: Report on the Pan-Canadian assessment of science, reading, and mathematics. Toronto: Council of Ministers of Education, Canada. Retrieved from http://www.cmec.ca/Publications/Lists/Publications/Attachments/337/PCAP-2013-Public-Report-EN.pdf.
O’Grady. K., & Houme, K. (2015). PCAP 2013: Technical report. Toronto: Council of Ministers of Education, Canada. Retrieved from http://cmec.ca/Publications/Lists/Publications/Attachments/351/PCAP2013-Technical-Report-EN-Final-Web.pdf.
Olsen, L. (2002). “Up close and personal.” Education Week on-line. May 22. Retrieved from http://www.edweek.org/ew/articles/2002/05/22/37assess.h21.html?qs=%22up+close+and+personal%22
Organisation for Economic Co-operation and Development. (2014). PISA in Focus: Are boys and girls equally prepared for life? Paris: Author. Retrieved from https://www.oecd.org/pisa/pisaproducts/PIF-2014-gender-international-version.pdf
Organisation for Economic Co-operation and Development. (2016). PISA 2015 results: Vol.I. Excellence and equity in education. Paris: OECD Publishing.
Scardamalia, M., & Bereiter, C. (2014). Knowledge building and knowledge creation: Theory, pedagogy, and technology. In K. Sawyer (Ed.). Cambridge handbook of the learning sciences (2nd ed., pp. 397–417). New York: Cambridge University Press.
Statistics Canada. (2011). Population by mother tongue, by province and territory, excluding institutional residents (2011 Census). Retrieved from http://www.statcan.gc.ca/tables-tableaux/sum-som/l01/cst01/demo11b-eng.htm

PCAP 2016 155
APPENDIX A: SAMPLING PROCEDURES AND RESPONSE RATE
The accuracy of PCAP survey results depends on the quality of the information on which the sample is based, as well as on the sampling procedures. The PCAP 2016 sample for Canada was based on a two-stage stratified random sample. The first stage consisted of sampling individual schools in which Grade 8/Secondary II students were enrolled. Schools were sampled systematically, with probabilities proportional to size, the measure of size being a function of the estimated number of eligible (Grade 8/Secondary II) students enrolled in the school. A minimum number of schools had to be selected in each province in order to produce reliable estimates for the anglophone school system in all provinces and the francophone school system in British Columbia, Alberta, Saskatchewan, Manitoba, Ontario, Quebec, New Brunswick, and Nova Scotia. The second stage of the selection process randomly sampled classes within the schools. Once schools were selected, one or more intact classes were selected and a list of all Grade 8/Secondary II students in each was prepared. Sampled students who were to be exempted by the school were still included in the sampling documentation, and a list was drawn up stating the reason for their exemption.
In order to minimize the potential for response bias, data quality standards in PCAP require minimum participation rates for schools and students. PCAP 2016 required a minimum student participation rate of 80 per cent of all eligible students and a minimum school participation rate of 85 per cent of all eligible schools at the national level.
Table A.1 shows the response rates for students. At the national level, there were close to 30,000 eligible Grade 8/Secondary II students, of which 27,487 (92 per cent) participated in the PCAP 2016 assessment. All provinces met the required student participation rate, which ranged from 87 per cent in the anglophone school system in British Columbia to 96 per cent in the francophone school systems in Alberta, Saskatchewan, and Manitoba.
A number of accommodations for the administration of PCAP were available for students who receive such accommodations in a test situation as part of their regular school program. Alternative test formats included audio versions for the science and mathematics portions of the assessment, Braille test booklets, coloured paper stock, and large-print test booklets. Other accommodations permitted were additional time, supervised breaks, an alternative setting, use of a scribe, and, in the science and mathematics portions of the test, verbatim reading of instructions and occasional prompts or questions. Table A.1 shows that 3.7 per cent of students used accommodations in PCAP 2016.

156 PCAP 2016
Table A.1 Student participation rates
Province Language
Number of eligible students1
(participating and non-
participating)
Number of non-participating students Participating students
Non-participating
students
Absent Other2 With accommodations3
Participation rate4
n % n % n % n %
British Columbia
English 2808 380 218 7.8 162 5.8 44 1.8 2428 86.5
French5 251 24 18 7.2 6 2.4 9 4.0 227 90.4
Alberta English 2818 229 52 1.8 177 6.3 87 3.4 2589 91.9
French 270 11 6 2.2 5 1.9 15 5.8 259 95.9
Saskatchewan English 3208 246 124 3.9 122 3.8 82 2.8 2962 92.3
French 75 3 0 0.0 3 4.0 0 0.0 72 96.0
Manitoba English 2642 238 112 4.2 126 4.8 49 2.0 2404 91.0
French 260 11 4 1.5 7 2.7 29 11.6 249 95.8
OntarioEnglish 2732 142 80 2.9 62 2.3 127 4.9 2590 94.8
French 2105 119 76 3.6 43 2.0 85 4.3 1986 94.3
QuebecEnglish 1502 128 77 5.1 51 3.4 55 4.0 1374 91.5
French 3457 219 165 4.8 54 1.6 67 2.1 3238 93.7
New Brunswick
English 1610 117 68 4.2 49 3.0 22 1.5 1493 92.7
French 1141 83 53 4.6 30 2.6 130 12.3 1058 92.7
Nova Scotia English 2485 237 156 6.3 81 3.3 66 2.9 2248 90.5
French 180 11 4 2.2 7 3.9 9 5.3 169 93.9
Prince Edward Island
English 406 23 12 3.0 11 2.7 8 2.1 383 94.3
French 57 5 3 5.3 2 3.5 2 3.8 52 91.2
Newfoundland and Labrador
English 1923 217 132 6.9 85 4.4 118 6.9 1706 88.7
French -- -- -- -- -- -- -- -- -- --
Canada
Total 29930 2443 1360 4.5 1083 3.6 1004 3.7 27487 91.8
English 22134 1957 1031 4.7 926 4.2 658 3.3 20177 91.2
French 7796 486 329 4.2 157 2.0 346 4.7 7310 93.8
1 The number of eligible students does not include exempted students (see Table A.2).2 “Other” = included students: (1) who are exempted by the school; (2) who are exempted because appropriate modifications could not
be made; (3) who are no longer enrolled in the selected school/class; (4) who do not wish to participate; and (5) for whom no data were available. It does not include the number of exempted students in Table A.2.
3 Proportion of students using alternative formats and accommodations.4 The overall students’ participation rate was calculated the following way: number of participating students/number of eligible students
(participating students + non-participating students).5 Due to an error with booklet distributions for a BC French school, 86 students were not able to participate and thus were removed from the
sample.Note: Numbers presented in this table do not represent the total number in the final dataset because it does not reflect invalid data removed before analyses.
Table A.2 displays the total number of exempted students and classifies them into specific categories in accordance with the national standards. Student exemptions could be based on three categories: 1) students with functional disabilities (the student has a moderate-to-severe permanent physical disability such that he or she cannot perform in the PCAP testing situation); 2) students with intellectual disabilities or socioemotional

PCAP 2016 157
conditions (the student has a mental or emotional disability and is cognitively delayed such that he or she cannot perform in the PCAP testing situation); and 3) students with a limited proficiency in the assessment language (the student is unable to read or speak in either of the two languages of the assessment—English and French—and would be unable to overcome the language barrier in the testing situation; such a student typically has received less than one year of instruction in the language of the assessment).
The student exemption rate for Canada overall was 3 per cent. This proportion ranged from 1 per cent in both language systems in Ontario and the francophone system in Quebec to 6 per cent in the anglophone school system in Nova Scotia. Across all provinces, the majority of exemptions were as a result of an intellectual disability (category 2, as described above).
Table A.2 Student exemption rates
Province Language
Total number of eligible
students sampled (participating,
non-participating, and exempted)
Eligible students*
Number of exempted students
Functional disabilities
Intellectual disabilities or
socioemotional conditions
Language (non-native-
language speakers)
Exemption rate**
n % n % n % n %
British Columbia
English 2927 2808 8 0.3 81 2.8 30 1.0 119 4.1
French‡ 264 251 2 0.8 11 4.2 0 0.0 13 4.9
Alberta English 2904 2818 3 0.1 59 2.0 24 0.8 86 3.0
French 274 270 0 0.0 4 1.5 0 0.0 4 1.5
Saskatchewan English 3385 3208 10 0.3 101 3.0 66 1.9 177 5.2
French 79 75 0 0.0 4 5.1 0 0.0 4 5.1
Manitoba English 2749 2642 2 0.1 78 2.8 27 1.0 107 3.9
French 270 260 2 0.7 6 2.2 2 0.7 10 3.7
OntarioEnglish 2767 2732 1 0.0 23 0.8 11 0.4 35 1.3
French 2128 2105 2 0.1 19 0.9 2 0.1 23 1.1
QuebecEnglish 1538 1502 1 0.1 22 1.4 13 0.8 36 2.3
French 3479 3457 4 0.1 10 0.3 8 0.2 22 0.6
New BrunswickEnglish 1671 1610 2 0.1 43 2.6 16 1.0 61 3.7
French 1198 1141 3 0.3 52 4.3 2 0.2 57 4.8
Nova Scotia English 2634 2485 4 0.2 133 5.0 12 0.5 149 5.7
French 183 180 0 0.0 3 1.6 0 0.0 3 1.6
Prince Edward Island
English 428 406 1 0.2 15 3.5 6 1.4 22 5.1
French 59 57 0 0.0 2 3.4 0 0.0 2 3.4
Newfoundland and Labrador
English 1969 1923 7 0.4 37 1.9 2 0.1 46 2.3
French -- -- -- -- -- -- -- -- -- --
Canada
Total 30906 29930 52 0.2 703 2.3 221 0.7 976 3.2
English 22972 22134 39 0.2 592 2.6 207 0.9 838 3.6
French 7934 7796 13 0.2 111 1.4 14 0.2 138 1.7
* Eligible students = (total number of eligible students sampled - total number of exempted students)** The students’ exemption rate is calculated the following way: total number of exempted students/total number of eligible students
sampled (participating students + non-participating students + exempted students)‡ Due to an error with booklet distributions for a BC French school, 86 students were not able to participate and thus were removed from the
sample.

158 PCAP 2016
Table A.3 presents the response rates for schools. The school participation rate for Canada overall was 92 per cent. The school participation rate was 100 per cent in both anglophone and francophone school systems in New Brunswick, Nova Scotia, and Prince Edward Island, and in the francophone school system in Saskatchewan. Two populations did not meet the minimum school participation rate of 85 per cent: the anglophone school system in Alberta (83 per cent) and both the anglophone and francophone school systems in Quebec (84 per cent). Francophone schools in Newfoundland and Labrador did not participate in PCAP 2016.
Table A.3 School response rates
Province Language
Number of selected schools
(participating and non-participating)
(n)
Number of participating schools (after replacement)
(n)
School participating
rate* (%)
British ColumbiaEnglish 150 134 89.3
French 12 11 91.7
Alberta English 150 125 83.3
French 20 18 90.0
Saskatchewan English 186 182 97.8
French 5 5 100.0
Manitoba English 150 145 96.7
French 19 18 94.7
OntarioEnglish 150 132 88.0
French 125 112 89.6
QuebecEnglish 89 75 84.3
French 150 126 84.0
New BrunswickEnglish 83 83 100.0
French 61 61 100.0
Nova Scotia English 116 116 100.0
French 11 11 100.0
Prince Edward Island English 22 22 100.0
French 3 3 100.0
Newfoundland and Labrador English 114 110 96.5
French 3 0 0.0
Canada
Total 1619 1489 92.0
English 1210 1124 92.9
French 409 365 89.2
* School participation rate was calculated the following way: number of participating schools/number of selected schools (participating schools + non-participating schools).

PCAP 2016 159
APPENDIX B: DATA TABLES
Table B.1 Percentage of students at each level of performance in reading by province
ProvinceLevel 1 Level 2 Level 3 Levels 2 and 3
% SE % SE % SE % SE
British Columbia 12 0.7 74 1.1 15 0.8 88 0.7
Alberta 12 0.8 72 1.0 16 0.8 88 0.7
Saskatchewan 16* 0.7 74 0.7 9* 0.5 84* 0.8
Manitoba 17* 1.0 74 1.1 9* 0.6 83* 0.9
Ontario 11 0.8 72 0.8 16 0.9 89 0.8
Quebec 11 0.8 78* 1.1 11* 0.6 89 0.9
New Brunswick 18* 0.7 73 0.9 9* 0.5 82* 0.8
Nova Scotia 15* 0.7 73 0.9 12 0.7 85* 0.7
Prince Edward Island 9* 1.2 79 1.8 13 1.6 91* 1.1
Newfoundland and Labrador 18* 1.2 71 1.1 11* 0.8 82* 1.0
Canada 12 0.4 74 0.5 14 0.4 88 0.4
* Significant difference compared to CanadaNote: Percentages may not add up to 100 due to rounding.
For comparisons between pan-Canadian and provincial results, the Bonferroni adjustments were applied.

160 PCAP 2016
Table B.2 Percentage of students at each level of performance in reading by language of the school system
Province
Anglophone school system Francophone school system
Level 1 Level 2 Level 3 Levels 2 and 3 Level 1 Level 2 Level 3 Levels 2
and 3
% SE % SE % SE % SE % SE % SE % SE % SE
British Columbia 11 0.7 74 1.0 15 0.8 89 0.9 18* 0.7 76 0.9 6* 0.4 82* 0.7
Alberta 12 0.7 72 1.1 16 0.9 88 0.7 21* 1.4 71* 2.1 8 1.3 79* 1.6
Saskatchewan 16* 0.8 74 1.0 9* 0.6 84* 0.8 15* 0.0 78 0.0 7* 0.0 85* 0.0
Manitoba 17* 0.8 74 1.0 9* 0.7 83* 0.9 30* 1.4 68* 1.3 3* 0.4 70* 1.4
Ontario 11 0.8 73 1.0 16 0.9 89 0.8 19* 0.9 70* 1.2 10 0.8 81* 0.9
Quebec 14 1.1 69 1.5 17 0.9 86 1.3 11 0.9 79 1.1 10 0.8 89 1.1
New Brunswick 16* 0.9 73 0.7 11* 0.7 84* 0.9 23* 1.1 73* 1.1 4* 0.4 77* 1.0
Nova Scotia 14 0.7 73 1.0 13* 0.7 86 0.7 37* 2.2 58* 2.6 5* 1.2 63* 2.6
Prince Edward Island 8* 1.3 79 2.3 13 1.7 92* 1.3 -- -- -- -- -- -- -- --
Newfoundland and Labrador 18* 1.1 71 1.1 11* 0.9 82* 0.9 -- -- -- -- -- -- -- --
Canada 12 0.4 73 0.7 15 0.5 88 0.4 12 0.7 78 1.0 10 0.6 88 0.9
* Significant difference compared to CanadaNotes: All francophone schools were sampled in Saskatchewan. Although the Saskatchewan sample is small, it represents the entire Saskatchewan Grade 8 francophone population, resulting in a standard error of 0. Percentages may not add up to 100 due to rounding.
Table B.2.1 Intra-provincial comparison of levels of performance in reading between anglophone and francophone schools
Level 1 Level 2 Level 3 Levels 2 and 3
British Columbia ** ** **
Alberta ** ** **
Saskatchewan ** **
Manitoba ** ** ** **
Ontario ** ** **
Quebec ** ** **
New Brunswick ** ** **
Nova Scotia ** ** ** **
Prince Edward Island -- -- -- --
Newfoundland and Labrador -- -- -- --
Canada ** **
** Significant difference within the province

PCAP 2016 161
Table B.3 Percentage of students at each level of performance in reading by gender
Province
Females Males
Level 1 Level 2 Level 3 Levels 2 and 3 Level 1 Level 2 Level 3 Levels 2
and 3
% SE % SE % SE % SE % SE % SE % SE % SE
British Columbia 8 0.9 73 1.6 19 1.4 92 0.9 15 1.3 75 1.5 10 1.1 85 1.2
Alberta 8 0.7 70 1.6 21 1.6 92 1.0 15 1.2 73 1.2 12 1.1 85 1.4
Saskatchewan 14* 0.9 75 1.3 11* 0.8 86* 1.2 19* 1.0 74 1.1 8* 0.6 81* 1.0
Manitoba 15* 1.0 74 1.3 11* 1.0 85* 0.9 19* 1.2 74 1.3 7* 0.7 81* 1.3
Ontario 9 1.0 70 1.7 21 1.5 91 1.0 14 1.0 75 1.6 11 0.8 86 0.9
Quebec 9 1.4 76 2.1 15 1.3 91 1.7 13 1.4 80* 1.4 7* 0.6 87 1.4
New Brunswick 13* 0.9 76 1.3 11* 0.9 87* 0.9 23* 1.0 70* 1.1 7* 0.7 77* 1.1
Nova Scotia 11 0.7 73 1.1 16 1.0 89 0.7 19* 1.3 72 1.2 9 0.8 81* 1.1
Prince Edward Island 4* 1.1 82* 2.9 13 1.9 96* 1.4 13 2.4 75 3.2 12 2.1 87 2.8
Newfoundland and Labrador 15* 1.2 71 1.8 14 1.4 85* 1.3 21* 1.5 70* 1.8 8 1.1 79* 1.4
Canada 9 0.5 72 0.9 18 0.7 91 0.5 15 0.5 76 0.7 10 0.4 85 0.5
* Significant difference compared to CanadaNote: Percentages may not add up to 100 due to rounding.
Table B.3.1 Intra-provincial comparison of levels of performance in reading between males and females
Province Level 1 Level 2 Level 3 Levels 2 and 3
British Columbia ** ** **
Alberta ** ** **
Saskatchewan ** ** **
Manitoba ** ** **
Ontario ** ** ** **
Quebec ** **
New Brunswick ** ** ** **
Nova Scotia ** ** **
Prince Edward Island ** **
Newfoundland and Labrador ** ** **
Canada ** ** ** **
** Significant difference within the province

162 PCAP 2016
Table B.4 Achievement scores in reading by province
Province Mean score SE Difference
British Columbia 509 2.5 2
Alberta 510 1.7 3
Saskatchewan 491 1.5 -16*
Manitoba 487 2.2 -20*
Ontario 512 2.2 5
Quebec 503 2.1 -4
New Brunswick 489 1.8 -18*
Nova Scotia 498 1.9 -9*
Prince Edward Island 513 3.7 6
Newfoundland and Labrador 491 2.6 -16*
Canada 507 1.1
* Significant difference compared to Canada
Table B.5 Achievement scores in reading by language of the school system
ProvinceAnglophone school system Francophone school system Difference**
(A–F)Mean score SE Mean score SE
British Columbia 509 2.2 478* 1.4 31**
Alberta 511 2.3 481* 4.4 30**
Saskatchewan 491* 1.6 476* 0.0 15**
Manitoba 488* 1.8 450* 2.5 38**
Ontario 513 2.2 485* 2.2 28**
Quebec 511 3.0 503 2.6 8**
New Brunswick 498* 2.5 467* 2.5 31**
Nova Scotia 500* 1.7 439* 5.2 61**
Prince Edward Island 514 4.4 -- -- --
Newfoundland and Labrador 491* 2.5 -- -- --
Canada 509 1.2 500 2.2 9**
* Significant difference compared to Canada** Significant difference within the provinceNote: All francophone schools were sampled in Saskatchewan. Although the Saskatchewan sample is small, it represents the entire Saskatchewan Grade 8 francophone population, resulting in a standard error of 0.

PCAP 2016 163
Table B.6 Achievement scores in reading by gender
ProvinceFemales Males Difference**
(F–M)Mean score SE Mean score SE
British Columbia 523 3.2 495 3.2 28**
Alberta 528 2.8 496 3.2 32**
Saskatchewan 500* 2.3 482* 2.2 18**
Manitoba 499* 3.0 477* 2.6 22**
Ontario 526 2.3 499 2.7 27**
Quebec 516 3.7 492 2.4 24**
New Brunswick 506* 2.4 472* 2.4 34**
Nova Scotia 514 2.9 482* 2.3 32**
Prince Edward Island 526 4.8 498 6.4 28**
Newfoundland and Labrador 500* 2.9 482* 3.2 18**
Canada 521 1.8 494 1.2 27**
* Significant difference compared to Canada** Significant difference within the province

164 PCAP 2016
Table B.7 Achievement scores in reading by subdomain
Province Mean score SE Difference
Understanding texts
British Columbia 505 2.0 5
Alberta 510 2.7 10*
Saskatchewan 491 1.6 -9*
Manitoba 481 2.4 -19*
Ontario 498 2.2 -2
Quebec 502 2.5 2
New Brunswick 487 2.8 -13*
Nova Scotia 494 2.3 -6
Prince Edward Island 508 4.8 8
Newfoundland and Labrador 487 2.7 -13*
Canada 500 1.1
Interpreting texts
British Columbia 506 2.0 6
Alberta 502 2.4 2
Saskatchewan 485 1.8 -15*
Manitoba 485 2.0 -15*
Ontario 511 2.6 11*
Quebec 484 2.7 -16*
New Brunswick 479 2.4 -21*
Nova Scotia 492 2.0 -8*
Prince Edward Island 505 4.6 5
Newfoundland and Labrador 488 3.6 -12*
Canada 500 1.2

PCAP 2016 165
Province Mean score SE Difference
Responding personally to texts
British Columbia 494 2.3 -6
Alberta 503 2.3 3
Saskatchewan 480 2.0 -20*
Manitoba 479 2.2 -21*
Ontario 502 2.1 2
Quebec 508 2.9 8
New Brunswick 484 2.5 -16*
Nova Scotia 488 1.8 -12*
Prince Edward Island 501 4.3 1
Newfoundland and Labrador 483 2.8 -17*
Canada 500 1.1
Responding critically to texts
British Columbia 496 2.6 -4
Alberta 495 2.2 -5
Saskatchewan 483 1.5 -17*
Manitoba 483 2.3 -17*
Ontario 508 2.1 8*
Quebec 498 2.1 -2
New Brunswick 486 2.0 -14*
Nova Scotia 489 1.4 -11*
Prince Edward Island 501 4.4 1
Newfoundland and Labrador 486 2.6 -14*
Canada 500 1.2
* Significant difference compared to Canada
Table B.7 Achievement scores in reading by subdomain (cont’d)

166 PCAP 2016
Table B.8 Achievement scores in reading by subdomain and language of the school system
ProvinceAnglophone school
systemFrancophone school
system Difference(A–F)
Mean score SE Mean score SE
Understanding texts
British Columbia 506 3.3 473* 1.5 33**
Alberta 510* 2.7 471* 4.2 39**
Saskatchewan 492* 2.0 476* 0.0 16**
Manitoba 483* 2.4 436* 3.1 47**
Ontario 500 3.3 471* 2.4 29**
Quebec 503 3.2 501 2.3 2
New Brunswick 496 3.1 464* 3.3 32**
Nova Scotia 497 2.3 427* 6.0 70**
Prince Edward Island 510 4.8 -- --
Newfoundland and Labrador 487* 3.0 -- --
Canada 501 1.1 497 2.3 4
Interpreting texts
British Columbia 506 2.3 461* 1.9 45**
Alberta 502 2.4 461* 4.9 41**
Saskatchewan 485* 1.7 472* 0.0 13**
Manitoba 487* 2.5 438* 3.4 49**
Ontario 513* 2.1 469* 2.4 44**
Quebec 506 3.1 482 2.4 24**
New Brunswick 492* 2.6 447* 3.1 45**
Nova Scotia 494* 1.8 428* 5.0 66**
Prince Edward Island 508 4.6 -- --
Newfoundland and Labrador 488* 2.7 -- --
Canada 506 1.2 480 1.9 26**

PCAP 2016 167
ProvinceAnglophone school
systemFrancophone school
system Difference(A–F)
Mean score SE Mean score SE
Responding personally to texts
British Columbia 494 3.2 492* 1.7 2
Alberta 503 2.7 499 4.5 4
Saskatchewan 480* 1.6 459* 0.0 21**
Manitoba 479* 2.1 469* 3.3 10**
Ontario 502 2.5 501 2.4 1
Quebec 504 3.5 508 2.8 -4
New Brunswick 486* 2.2 477* 3.2 9**
Nova Scotia 490* 1.6 448* 6.3 42**
Prince Edward Island 501 5.0 -- --
Newfoundland and Labrador 483* 2.4 -- --
Canada 498 1.3 506 2.2 -8**
Responding critically to texts
British Columbia 496 2.4 476* 1.4 20**
Alberta 495 2.6 487 4.5 8
Saskatchewan 483* 1.4 478* 0.0 5**
Manitoba 483* 2.4 469* 3.2 14**
Ontario 509* 2.5 499 2.3 10**
Quebec 501 3.0 498 2.7 3
New Brunswick 490* 2.7 476* 2.4 14**
Nova Scotia 491* 2.4 463* 4.3 28**
Prince Edward Island 502 5.8 -- --
Newfoundland and Labrador 486* 2.3 -- --
Canada 501 1.3 497 2.0 4
* Significant difference compared to Canada** Significant difference within the provinceNote: All francophone schools were sampled in Saskatchewan. Although the Saskatchewan sample is small, it represents the entire Saskatchewan Grade 8 francophone population, resulting in a standard error of 0.
Table B.8 Achievement scores in reading by subdomain and language of the school system (cont’d)

168 PCAP 2016
Table B.9 Achievement scores in reading by subdomain and gender
ProvinceFemales Males Difference
(F–M)Mean score SE Mean score SE
Understanding texts
British Columbia 517 3.4 494 3.6 23**
Alberta 520* 2.5 501 3.7 19**
Saskatchewan 496* 3.2 487 2.2 9**
Manitoba 489* 3.5 476* 3.3 13**
Ontario 506 2.3 492 3.3 14**
Quebec 510 4.1 494 2.9 16**
New Brunswick 500 3.1 474* 2.8 26**
Nova Scotia 504 3.4 486 2.9 18**
Prince Edward Island 515 5.1 501 8.2 14
Newfoundland and Labrador 493* 3.4 482 3.5 11**
Canada 509 1.8 492 1.3 17**
Interpreting texts
British Columbia 519 3.2 493 3.7 26**
Alberta 522 2.9 484 3.9 38**
Saskatchewan 498* 2.6 473* 3.2 25**
Manitoba 498* 3.3 476* 2.9 22**
Ontario 525* 2.6 498* 3.2 27**
Quebec 497* 3.7 473* 3.1 24**
New Brunswick 497* 3.1 461* 2.5 36**
Nova Scotia 511 2.3 473* 2.9 38**
Prince Edward Island 524 5.9 485 7.8 39**
Newfoundland and Labrador 500* 3.6 477 4.5 23**
Canada 515 1.9 487 1.7 28**

PCAP 2016 169
ProvinceFemales Males Difference
(F–M)Mean score SE Mean score SE
Responding personally to texts
British Columbia 503 3.1 484 3.2 19**
Alberta 519 2.6 489 2.6 30**
Saskatchewan 487* 2.9 474* 2.5 13**
Manitoba 493* 3.2 468* 2.9 25**
Ontario 514 2.9 491 3.6 23**
Quebec 517 3.9 500 3.1 17**
New Brunswick 498* 2.6 469* 3.0 29**
Nova Scotia 503 2.9 474* 2.7 29**
Prince Edward Island 512 6.1 489 8.3 23**
Newfoundland and Labrador 491* 3.8 475* 3.6 16**
Canada 511 1.6 490 1.9 21**
Responding critically to texts
British Columbia 510 3.2 483 3.5 27**
Alberta 511 3.2 480 3.0 31**
Saskatchewan 494* 2.9 473* 2.3 21**
Manitoba 495* 3.7 472* 3.1 23**
Ontario 526* 2.9 492 3.5 34**
Quebec 514 3.5 484 3.0 30**
New Brunswick 505* 2.6 468* 2.5 37**
Nova Scotia 508 2.7 471* 2.8 37**
Prince Edward Island 515 7.2 487 5.1 28**
Newfoundland and Labrador 493* 3.3 479 3.9 14**
Canada 516 1.8 485 1.7 31**
* Significant difference compared to Canada** Significant difference within the province
Table B.9 Achievement scores in reading by subdomain and gender (cont’d)
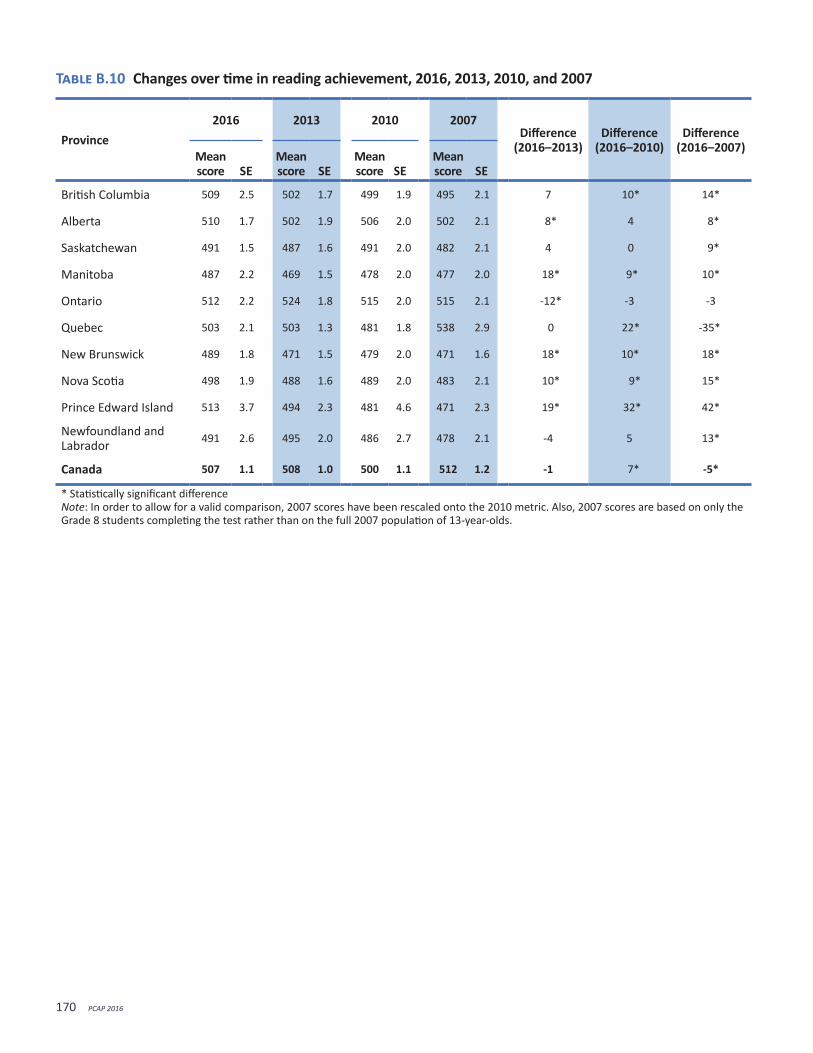
170 PCAP 2016
Table B.10 Changes over time in reading achievement, 2016, 2013, 2010, and 2007
Province2016 2013 2010 2007
Difference (2016–2013)
Difference (2016–2010)
Difference (2016–2007)
Mean score SE
Mean score SE
Mean score SE
Mean score SE
British Columbia 509 2.5 502 1.7 499 1.9 495 2.1 7 10* 14*
Alberta 510 1.7 502 1.9 506 2.0 502 2.1 8* 4 8*
Saskatchewan 491 1.5 487 1.6 491 2.0 482 2.1 4 0 9*
Manitoba 487 2.2 469 1.5 478 2.0 477 2.0 18* 9* 10*
Ontario 512 2.2 524 1.8 515 2.0 515 2.1 -12* -3 -3
Quebec 503 2.1 503 1.3 481 1.8 538 2.9 0 22* -35*
New Brunswick 489 1.8 471 1.5 479 2.0 471 1.6 18* 10* 18*
Nova Scotia 498 1.9 488 1.6 489 2.0 483 2.1 10* 9* 15*
Prince Edward Island 513 3.7 494 2.3 481 4.6 471 2.3 19* 32* 42*
Newfoundland and Labrador 491 2.6 495 2.0 486 2.7 478 2.1 -4 5 13*
Canada 507 1.1 508 1.0 500 1.1 512 1.2 -1 7* -5*
* Statistically significant differenceNote: In order to allow for a valid comparison, 2007 scores have been rescaled onto the 2010 metric. Also, 2007 scores are based on only the Grade 8 students completing the test rather than on the full 2007 population of 13-year-olds.

PCAP 2016 171
Table B.11 Changes over time in reading achievement by language of the school system, 2016, 2013, 2010, and 2007
Province Language2016 2013 2010 2007
Difference (2016–2013)
Difference (2016–2010)
Difference (2016–2007)
Mean score SE
Mean score SE
Mean score SE
Mean score SE
British Columbia
English 509 2.2 502 1.7 499 2.0 495 2.3 7* 10* 14*
French 478 1.4 499 4.2 473 2.6 476 7.1 -21* 5 2
Alberta English 511 2.3 503 2.1 506 2.1 502 2.1 8* 5 9*
French 481 4.4 473 2.0 490 2.7 490 3.8 8 -9 -9
Saskatchewan English 491 1.6 487 1.3 492 2.0 482 2.1 4 -1 9*
French 476 0.0 478 1.2 468 4.1 474 14.4 -2 8 2
Manitoba English 488 1.8 469 1.4 478 2.0 482 2.4 19* 10* 6
French 450 2.5 471 1.6 468 2.0 437 3.9 -21* -18* 13*
OntarioEnglish 513 2.2 526 1.8 517 2.5 516 2.3 -13* -4 -3
French 485 2.2 481 1.6 481 1.9 482 2.7 4 4 3
QuebecEnglish 511 3.0 497 2.0 492 3.0 492 2.7 14* 19* 19*
French 503 2.6 504 1.7 480 1.8 544 3.2 -1 23* -41*
New BrunswickEnglish 498 2.5 466 1.9 486 2.7 471 2.0 32* 12* 27*
French 467 2.5 485 2.4 464 2.3 470 2.0 -18* 3 -3
Nova Scotia English 500 1.7 489 2.0 489 1.8 484 2.0 11* 11* 16*
French 439 5.2 468 2.0 475 1.5 479 5.3 -29* -36* -40*
Prince Edward Island English 514 4.4 496 2.8 482 5.3 470 2.0 18* 32* 44*
Newfoundland and Labrador English 491 2.5 495 2.3 486 2.6 478 2.6 -4 5 13*
CanadaEnglish 509 1.2 510 1.1 507 1.1 504 1.4 -1 2 5*
French 500 2.2 501 1.1 480 1.8 536 2.5 -1 20* -36*
* Statistically significant differenceNotes: In order to allow for a valid comparison, 2007 scores have been rescaled onto the 2010 metric. Also, 2007 scores are based on only the Grade 8 students completing the test rather than on the full 2007 population of 13-year-olds.All francophone schools were sampled in Saskatchewan. Although the Saskatchewan sample is small, it represents the entire Saskatchewan Grade 8 francophone population, resulting in a standard error of 0.

172 PCAP 2016
Table B.12 Changes over time in reading achievement by gender, 2016, 2013, 2010, and 2007
Province Gender2016 2013 2010 2007
Difference (2016–2013)
Difference (2016–2010)
Difference (2016–2007)
Mean score SE
Mean score SE
Mean score SE
Mean score SE
British Columbia
Female 523 3.2 518 2.1 511 2.9 505 3.1 5 12* 18*
Male 495 3.2 486 2.4 491 2.8 485 3.3 9 4 10
Alberta Female 528 2.8 518 2.6 516 2.8 511 3.0 10* 12* 17*
Male 496 3.2 485 2.6 497 2.3 492 3.1 11* -1 4
Saskatchewan Female 500 2.3 498 2.0 504 3.0 490 3.0 2 -4 10*
Male 482 2.2 476 2.7 482 2.6 476 2.5 6 0 6
Manitoba Female 499 3.0 480 2.2 494 2.8 485 3.2 19* 5 14*
Male 477 2.6 459 2.1 466 3.0 471 2.7 18* 11* 6
OntarioFemale 526 2.3 538 2.5 530 3.1 523 3.6 -12* -4 3
Male 499 2.7 510 2.8 503 2.9 506 3.4 -11* -4 -7
QuebecFemale 516 3.7 514 2.3 498 2.3 550 3.7 2 18* -34*
Male 492 2.4 493 2.2 471 2.7 524 4.0 -1 21* -32*
New BrunswickFemale 506 2.4 485 2.0 501 2.5 484 2.1 21* 5 22*
Male 472 2.4 459 2.6 462 3.0 457 2.2 13* 10* 15*
Nova Scotia Female 514 2.9 499 2.7 501 2.5 491 3.2 15* 13* 23*
Male 482 2.3 477 2.6 480 2.9 475 3.2 5 2 7
Prince Edward Island
Female 526 4.8 509 3.0 491 6.9 481 2.6 17* 35* 45*
Male 498 6.4 479 3.7 474 7.0 461 2.9 19* 24* 37*
Newfoundland and Labrador
Female 500 2.9 503 2.4 506 3.8 496 4.0 -3 -6 4
Male 482 3.2 486 4.0 468 3.7 458 3.2 -4 14* 24*
CanadaFemale 521 1.8 521 1.1 515 1.3 522 1.6 0 6* -1
Male 494 1.2 494 1.2 489 1.7 501 1.7 0 5 -7*
* Statistically significant differenceNote: In order to allow for a valid comparison, 2007 scores have been rescaled onto the 2010 metric. Also, 2007 scores are based on only the Grade 8 students completing the test rather than on the full 2007 population of 13-year-olds.

PCAP 2016 173
Table B.13 Achievement scores in mathematics by province
Province Mean score SE Difference
British Columbia 494 1.7 -17*
Alberta 505 1.7 -6*
Saskatchewan 483 1.5 -28*
Manitoba 479 2.2 -32*
Ontario 508 1.9 -3
Quebec 541 1.9 30*
New Brunswick 498 1.7 -13*
Nova Scotia 497 1.4 -14*
Prince Edward Island 503 3.4 -8
Newfoundland and Labrador 490 2.1 -21*
Canada 511 1.1
* Significant difference compared to Canada
Table B.14 Achievement scores in mathematics by language of the school system
ProvinceAnglophone school system Francophone school system Difference
(A–F)Mean score SE Mean score SE
British Columbia 494* 2.0 516* 1.3 -22**
Alberta 505 1.6 506* 3.7 -1
Saskatchewan 483* 1.6 501* 0.0 -18**
Manitoba 479* 1.7 474* 2.8 5
Ontario 507 1.9 528* 1.9 -21**
Quebec 522* 2.4 543 2.2 -21**
New Brunswick 489* 2.3 521* 2.3 -32**
Nova Scotia 497 1.6 507* 4.8 -10**
Prince Edward Island 503 4.0 -- -- --
Newfoundland and Labrador 490* 2.5 -- -- --
Canada 502 1.2 540 1.5 -38**
* Significant difference compared to Canada** Significant difference within the provinceNote: All francophone schools were sampled in Saskatchewan. Although the Saskatchewan sample is small, it represents the entire Saskatchewan Grade 8 francophone population, resulting in a standard error of 0.

174 PCAP 2016
Table B.15 Achievement scores in mathematics by gender
ProvinceFemales Males Difference
(F–M)Mean score SE Mean score SE
British Columbia 497* 2.4 492* 3.2 5
Alberta 507 2.1 504 2.7 3
Saskatchewan 478* 2.1 488* 2.4 -10**
Manitoba 478* 2.7 480* 2.3 -2
Ontario 508 2.6 508 2.6 0
Quebec 539* 2.8 543* 3.0 -4
New Brunswick 500* 2.1 496* 2.5 4
Nova Scotia 498* 2.3 496* 2.2 2
Prince Edward Island 502 6.2 504 6.0 -2
Newfoundland and Labrador 488* 2.6 491* 2.8 -3
Canada 511 1.4 512 1.5 -1
* Significant difference compared to Canada** Significant difference within the province
Table B.16 Changes over time in mathematics achievement, 2016, 2013, and 2010
Province2016 2013 2010
Difference (2016–2013)
Difference (2016–2010)
Mean score SE
Mean score SE
Mean score SE
British Columbia 494 1.7 489 1.6 481 1.8 5 13*
Alberta 505 1.7 502 2.0 495 2.0 3 10*
Saskatchewan 483 1.5 488 2.0 474 1.9 -5 9*
Manitoba 479 2.2 471 1.7 468 2.1 8* 11*
Ontario 508 1.9 512 1.8 507 2.0 -4 1
Quebec 541 1.9 527 1.5 515 2.0 14* 26*
New Brunswick 498 1.7 480 1.8 478 2.0 18* 20*
Nova Scotia 497 1.4 488 1.7 474 2.0 9* 23*
Prince Edward Island 503 3.4 492 1.9 460 4.2 11* 43*
Newfoundland and Labrador 490 2.1 487 2.4 472 2.7 3 18*
Canada 511 1.1 507 1.0 500 1.1 4* 11*
* Statistically significant difference

PCAP 2016 175
Table B.17 Changes over time in mathematics achievement by language of the school system, 2016, 2013, and 2010
Province Language2016 2013 2010
Difference (2016–2013)
Difference (2016–2010)
Mean score SE
Mean score SE
Mean score SE
British ColumbiaEnglish 494 2.0 489 1.7 481 1.9 5 13*
French 516 1.3 513 3.1 504 2.6 3 12*
Alberta English 505 1.6 502 2.0 495 2.0 3 10*
French 506 3.7 502 1.8 504 2.7 4 2
Saskatchewan English 483 1.6 487 1.7 474 2.0 -4 9*
French 501 0.0 518 1.1 498 3.6 -17* 3
Manitoba English 479 1.7 470 1.3 467 2.2 9* 12*
French 474 2.8 476 1.5 480 1.8 -2 -6
OntarioEnglish 507 1.9 512 1.5 507 2.4 -5 0
French 528 1.9 500 2.0 511 1.9 28* 17*
QuebecEnglish 522 2.4 509 2.0 507 3.4 13* 15*
French 543 2.2 529 1.8 516 1.8 14* 27*
New BrunswickEnglish 489 2.3 470 2.0 466 2.5 19* 23*
French 521 2.3 507 2.9 507 2.7 14* 14*
Nova Scotia English 497 1.6 488 2.1 473 2.2 9* 24*
French 507 4.8 499 1.9 503 1.6 8 4
Prince Edward Island English 503 4.0 492 2.2 460 5.2 11* 43*
Newfoundland and Labrador English 490 2.5 487 2.4 472 2.7 3 18*
CanadaEnglish 502 1.2 501 1.0 495 1.2 1 7*
French 540 1.5 526 1.5 515 1.9 14* 25*
* Statistically significant differenceNote: All francophone schools were sampled in Saskatchewan. Although the Saskatchewan sample is small, it represents the entire Saskatchewan Grade 8 francophone population, resulting in a standard error of 0.

176 PCAP 2016
Table B.18 Changes over time in mathematics achievement by gender, 2016, 2013, and 2010
Province Gender2016 2013 2010
Difference (2016–2013)
Difference (2016–2010)
Mean score SE
Mean score SE
Mean score SE
British ColumbiaFemale 497 2.4 491 2.2 475 2.5 6 22*
Male 492 3.2 487 2.2 490 2.8 5 2
Alberta Female 507 2.1 504 2.6 491 2.5 3 16*
Male 504 2.7 499 2.7 500 2.5 5 4
Saskatchewan Female 478 2.1 487 2.4 475 2.7 -9* 3
Male 488 2.4 488 3.3 477 2.5 0 11*
Manitoba Female 478 2.7 470 1.9 468 2.6 8* 10*
Male 480 2.3 471 2.1 470 3.0 9* 10*
OntarioFemale 508 2.6 511 2.7 509 3.1 -3 -1
Male 508 2.6 514 2.9 508 2.9 -6 0
QuebecFemale 539 2.8 528 2.5 513 2.4 11* 26*
Male 543 3.0 526 1.7 523 2.8 17* 20*
New BrunswickFemale 500 2.1 483 2.2 486 3.0 17* 14*
Male 496 2.5 477 2.6 473 2.7 19* 23*
Nova Scotia Female 498 2.3 489 2.0 478 2.4 9* 20*
Male 496 2.2 487 2.2 473 3.0 9* 23*
Prince Edward Island Female 502 6.2 498 3.0 453 5.7 4 49*
Male 504 6.0 485 3.7 468 6.0 19* 36*
Newfoundland and Labrador
Female 488 2.6 489 2.5 476 3.3 -1 12*
Male 491 2.8 484 3.4 471 4.1 7 20*
CanadaFemale 511 1.4 507 1.0 499 1.5 4* 12*
Male 512 1.5 507 1.5 504 1.5 5* 8*
* Statistically significant difference

PCAP 2016 177
Table B.19 Achievement scores in science by province
Province Mean score SE Difference
British Columbia 505 2.1 -3
Alberta 518 1.7 10*
Saskatchewan 491 2.0 -17*
Manitoba 491 1.6 -17*
Ontario 510 2.0 2
Quebec 507 2.3 -1
New Brunswick 500 1.5 -8*
Nova Scotia 499 1.3 -9*
Prince Edward Island 516 3.8 8
Newfoundland and Labrador 501 2.6 -7
Canada 508 1.0
* Statistically significant difference
Table B.20 Achievement scores in science by language of the school system
ProvinceAnglophone school system Francophone school system Difference
(A–F)Mean score SE Mean score SE
British Columbia 505 1.9 502 1.5 3
Alberta 518* 2.0 496 3.7 22**
Saskatchewan 491* 1.6 498* 0.0 -7**
Manitoba 492* 1.7 468* 2.7 24**
Ontario 510 1.6 499* 2.3 11**
Quebec 499* 2.8 507 2.2 -8**
New Brunswick 501 2.8 498* 2.3 3
Nova Scotia 500* 1.4 473* 5.6 27**
Prince Edward Island 517 4.1 -- -- --
Newfoundland and Labrador 501 2.7 -- -- --
Canada 508 1.0 506 2.3 -2
* Significant difference compared to Canada** Significant difference within the provinceNote: All francophone schools were sampled in Saskatchewan. Although the Saskatchewan sample is small, it represents the entire Saskatchewan Grade 8 francophone population, resulting in a standard error of 0.

178 PCAP 2016
Table B.21 Achievement scores in science by gender
ProvinceFemales Males Difference
(F–M)Mean score SE Mean score SE
British Columbia 507 2.5 503 2.8 4
Alberta 526* 2.6 512 2.9 14**
Saskatchewan 492* 2.2 491* 2.0 1
Manitoba 497* 2.6 487* 2.2 10**
Ontario 511 2.3 508 2.2 3
Quebec 509 2.6 504 2.8 5
New Brunswick 509 2.2 491* 2.1 18**
Nova Scotia 505 2.4 495* 2.5 10**
Prince Edward Island 518 4.5 515 5.9 3
Newfoundland and Labrador 503 2.8 498 3.3 5
Canada 511 1.6 505 1.3 6**
* Significant difference compared to Canada** Significant difference within the province
Table B.22 Changes over time in science achievement, 2016 and 2013
Province2016 2013 Difference
2016–2013Mean score SE Mean score SE
British Columbia 505 2.1 501 2.1 4
Alberta 518 1.7 521 2.5 -3
Saskatchewan 491 2.0 486 2.2 5
Manitoba 491 1.6 465 1.6 26*
Ontario 510 2.0 511 2.3 -1
Quebec 507 2.3 485 1.8 22*
New Brunswick 500 1.5 469 1.9 31*
Nova Scotia 499 1.3 492 1.8 7*
Prince Edward Island 516 3.8 491 2.6 25*
Newfoundland and Labrador 501 2.6 500 2.2 1
Canada 508 1.0 500 1.0 8*
* Statistically significant difference compared to the baseline in 2013

PCAP 2016 179
Table B.23 Changes over time in science achievement by language of the school system, 2016 and 2013
Province Language2016 2013 Difference
(2016–2013) Mean score SE Mean score SE
British ColumbiaEnglish 505 1.7 501 2.2 4
French 502 1.6 495 4.0 7
Alberta English 518 1.8 521 2.1 -3
French 496 4.1 488 2.5 8
Saskatchewan English 491 1.6 486 2.3 5
French 498 0.0 474 0.8 24*
Manitoba English 492 1.8 465 1.8 27*
French 468 2.4 453 1.8 15*
OntarioEnglish 510 1.7 513 2.6 -3
French 499 2.0 464 2.1 35*
QuebecEnglish 498 2.5 484 2.6 15*
French 518 1.7 485 1.9 22*
New BrunswickEnglish 501 2.1 467 1.9 34*
French 498 2.4 475 2.6 23*
Nova Scotia English 500 1.5 493 2.1 7*
French 473 5.7 466 1.9 7
Prince Edward Island English 517 4.4 492 2.6 25*
Newfoundland and Labrador English 501 2.4 500 2.4 1
CanadaEnglish 508 1.0 505 1.2 3
French 506 2.3 483 1.3 23*
* Statistically significant differenceNote: All francophone schools were sampled in Saskatchewan. Although the Saskatchewan sample is small, it represents the entire Saskatchewan Grade 8 francophone population, resulting in a standard error of 0.

180 PCAP 2016
Table B.24 Changes over time in science achievement by gender, 2016 and 2013
Province Gender2016 2013 Difference
(2016–2013) Mean score SE Mean score SE
British ColumbiaFemale 507 2.5 503 2.8 4
Male 503 2.8 498 2.5 5
Alberta Female 526 2.6 525 3.2 1
Male 512 2.9 516 3.2 -4
Saskatchewan Female 492 2.2 481 2.5 11*
Male 491 2.0 490 3.1 1
Manitoba Female 497 2.6 463 2.3 34*
Male 487 2.2 467 2.4 20*
OntarioFemale 511 2.3 511 2.9 0
Male 508 2.2 511 2.9 -3
QuebecFemale 509 2.6 485 2.5 24*
Male 504 2.8 485 2.3 19*
New BrunswickFemale 509 2.2 472 2.8 37*
Male 491 2.1 467 2.7 24*
Nova Scotia Female 505 2.4 491 2.9 14*
Male 495 2.5 492 2.7 3
Prince Edward Island Female 518 4.5 488 3.7 30*
Male 515 5.9 495 2.8 20*
Newfoundland and Labrador Female 503 2.8 500 3.4 3
Male 498 3.3 500 3.9 -2
CanadaFemale 511 1.6 501 1.3 10*
Male 505 1.3 499 1.2 6*
* Statistically significant difference

PCAP 2016 181
Table B.25 Multiple comparisons of overall reading achievement
Instructions: Choose a province from the left-hand column. Read across the row to compare its performance with that of Canada and the provinces, listed along the top of the chart. The symbols indicate whether its performance is above, below, or the same as that of Canada and the provinces.
Average achievement significantly higher than comparison province or Canada Average achievement significantly lower than comparison province or Canada
Province Mean score SE PE ON AB BC CAN QC NS SK NL NB MB
PE 513 3.7
ON 512 2.2
AB 510 1.7
BC 509 2.5
CAN 507 1.1
QC 503 2.1
NS 498 1.9
SK 491 1.5
NL 491 2.6
NB 489 1.8
MB 487 2.2
Note: Significant difference determined using Bonferroni adjusted t-test

182 PCAP 2016
Table B.26 Multiple comparisons of overall mathematics achievement
Instructions: Choose a province from the left-hand column. Read across the row to compare its performance with that of Canada and the provinces, listed along the top of the chart. The symbols indicate whether its performance is above, below, or the same as that of Canada and the provinces.
Average achievement significantly higher than comparison province or Canada Average achievement significantly lower than comparison province or Canada
Province Mean score SE QC CAN ON AB PE NB NS BC NL SK MB
QC 551 1.1
CAN 511 0.9
ON 508 1.9
AB 505 1.7
PE 503 3.4
NB 498 1.7
NS 497 1.4
BC 494 1.7
NL 490 2.1
SK 483 1.5
MB 479 2.2
Note: Significant difference determined using Bonferroni adjusted t-test

PCAP 2016 183
Table B.27 Multiple comparisons of overall science achievement
Instructions: Choose a province from the left-hand column. Read across the row to compare its performance with that of Canada and the provinces, listed along the top of the chart. The symbols indicate whether its performance is above, below, or the same as that of Canada and the provinces.
Average achievement significantly higher than comparison province or Canada Average achievement significantly lower than comparison province or Canada
Province Mean score SE AB PE ON CAN QC BC NL NB NS SK MB
AB 518 1.7
PE 516 3.8
ON 510 2.0
CAN 508 1.0
QC 507 2.3
BC 505 2.1
NL 501 2.6
NB 500 1.5
NS 499 1.3
SK 491 2.0
MB 491 1.6
Note: Significant difference determined using Bonferroni adjusted t-test