pc9 gr_6_azdr_1 egfr t790m (8%) pc9 gr_6_azdr_2 egfr t790m (13%) nras gain pc9 gr_6_azdr_3 egfr...
TRANSCRIPT

PC9 GR_6_AZDR_1EGFR T790M
(8%)
PC9 GR_6_AZDR_2 EGFR T790M
(13%)NRAS gain
PC9 GR_6_AZDR_3 EGFR T790M
(12%)NRAS gain
PC9 GR_6_AZDR_4 EGFR T790M
(13%)
PC9 GR_6EGFR T790M (13%)
PC9 GR_1 EGFR T790M (7%)
KRAS gain
PC9 GR_2NRAS E63K (22%)
PC9 GR_8EGFR T790M (8%)
KRAS gain
PC9 GR_3T790M (11%)
PC9 GR_4T790M (7%)
PC9 GR_7 T790M (9%)
PC9 GR_5T790M (7%)
Gefitinib
PC9 GR_1_AZDR_1
EGFR T790M (4%)KRAS gain
PC9 GR_1_AZDR_2
KRAS gain
PC9 GR_1_AZDR_3
EGFR T790M (7%)
KRAS gain
PC9 GR_1_AZDR_4
EGFR T790M (2%)
KRAS gain
AZD9291
PC9 AZDR_6NRAS E63K
(24%)
PC9 AZDR_7NRAS G12R
(2.4%)
PC9 AZDR_5NRAS E63K
(21%)PC9 AZDR_4
PC9 AZDR_3 MAPK1 gainCRKL gain
PC9 AZDR_1NRAS gain
MAPK1 gainCRKL gain
PC9 AZDR_2NRAS G12V
(2.4%)
PC9 Parent
AZD9291
Afatinib
PC9 AR_1KRAS gain
PC9 AR_4 EGFR T790M
(8%)
PC9 AR_6 EGFR T790M
(8%) NRAS gain
PC9 WZR_3KRAS amp
WZ4002
PC9 WZR_1NRAS Q61K*
AZD9291
Supplementary Figure S1
A
B NCI-H1975EGFR T790M (78%)
NCI-H1975 AZDR_1EGFR T790M (75%)
NCI-H1975 AZDR_2EGFR T790M (86%)
NCI-H1975 AZDR_4EGFR T790M (92%)NRAS Q61K (6%)
NCI-H1975 AZDR_3EGFR T790M (99%)
AZD9291
Supplementary Figure S1. Comparison of genetic alterations across multiple populations resistant to AZD9291 and other EGFR TKIs(A) Genetic alterations detected in DNA from 28 separate PC9 resistant populations Allele frequencies are shown. (B) Genetic alterations detected in DNA from 4 separate NCI-H1975 resistant populations. Allele frequencies are shown

PC9_GR T790M+ populations
with a partial response to AZD9291
PC9_GR T790M+ populations
with a full response to AZD9291
PC9_GR T790M+ population
with no response to AZD9291
Supplementary Figure S2A
(i) (ii) (iii)

Supplementary Figure S2B
0 1.0x10⁻⁴ 1.0x10⁻³ 1.0x10⁻² 1.0x10⁻¹
0
500
1000
1500
2000
2500
3000
3500
4000
4500
5000
5500
6000
6500
7000
7500
8000 IC50 = 0.008346
AZD9291 M
Cel
l cou
nt
AZD9291 PC9_GR_1 partial response
0 1.0x10⁻⁴ 1.0x10⁻³ 1.0x10⁻² 1.0x10⁻¹ 1.0x100
0
500
1000
1500
2000
2500
3000
3500
4000
4500
5000
5500
6000
6500
AZD9291 PC9_GR_3 partial response
AZD9291 M
Cel
l cou
nt
IC50 = 0.004313
0 1.0x10⁻⁴ 1.0x10⁻³ 1.0x10⁻² 1.0x10⁻¹
0
1000
2000
3000
4000
5000
6000
7000
8000
9000
AZD9291 PC9_GR_5 partial response
AZD9291 M
Ce
ll co
un
t
IC50 = 0.007453
Supplementary Figure S2. Treatment of resistant populations with AZD9291.PC9 gefitinib resistant T790M+ populations were treated with a dose response of AZD9291 and dose response curves plotted to determine IC50 values. (A) Representative dose response curves indicate varying sensitivity of the cells within the populations to AZD9291 (i) less than 50% of the cells are sensitive to AZD9291 growth inhibition; (ii) almost all of the cells are sensitive to AZD9291 growth inhibition; (iii) none of the cells are sensitive to AZD9291 growth inhibition.(B) Representative dose response curves for the sensitive cells from the partially sensitive populations. IC50 values for AZD9291 growth inhibition are similar across all sensitive cells.

Supplementary Figure S3
(A) (B)
Supplementary Figure S3. Detection and Validation of a novel NRAS E63K mutation.Integrative Genomic Viewer (IGV) screen shots of the NRAS E63K mutation from orthogonal NGS platforms. (Table insert shows read depth and nucleotide counts for each sample.) (A) Life Technologies PGM platform: the E63K variant has an allele frequency of 20 and 23%, respectively for the two resistant samples. (B) Illumina platform: the E63K variant has an allele frequency of 21 and 22%, respectively for the two resistant samples. The parental sample, PC-9, shows no evidence of the NRAS E63K variant on either platform.
Supplementary Figure S4
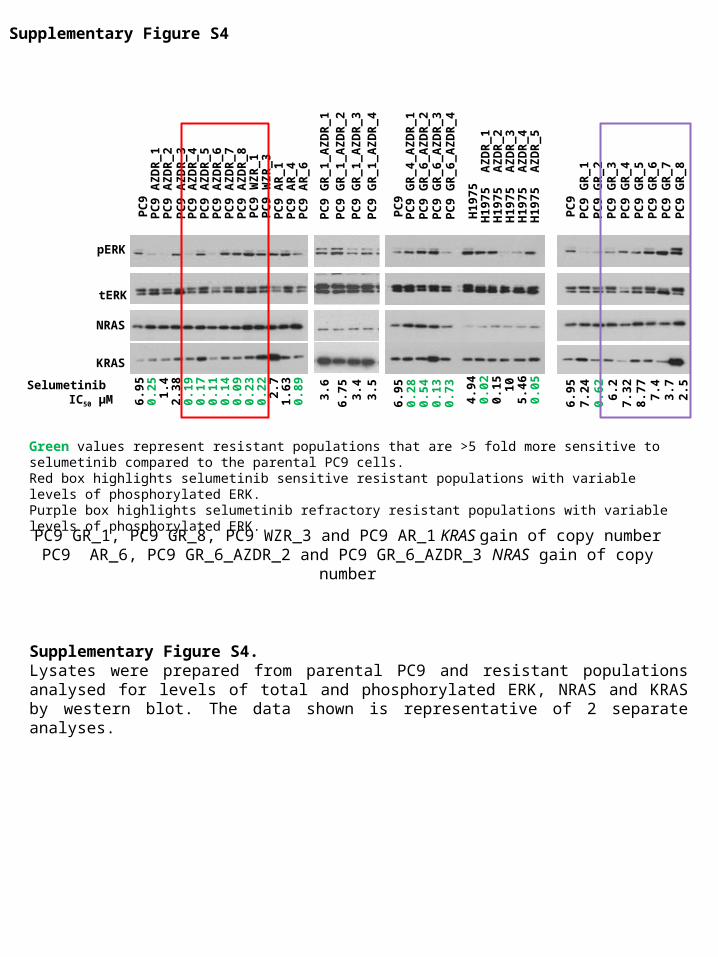
PC9 GR_1, PC9 GR_8, PC9 WZR_3 and PC9 AR_1 KRAS gain of copy numberPC9 AR_6, PC9 GR_6_AZDR_2 and PC9 GR_6_AZDR_3 NRAS gain of copy number
Green values represent resistant populations that are >5 fold more sensitive to selumetinib compared to the parental PC9 cells. Red box highlights selumetinib sensitive resistant populations with variable levels of phosphorylated ERK.Purple box highlights selumetinib refractory resistant populations with variable levels of phosphorylated ERK.
Supplementary Figure S4.Lysates were prepared from parental PC9 and resistant populations analysed for levels of total and phosphorylated ERK, NRAS and KRAS by western blot. The data shown is representative of 2 separate analyses.
0.2
2
0.1
90
.17
0.1
10
.14
0.0
90
.23
0.8
9
PC
9
NRAS
tERK
KRAS
pERK
PC
9 A
ZD
R_
1
PC
9 A
ZD
R_
3P
C9
AZ
DR
_2
PC
9 A
ZD
R_
4P
C9
AZ
DR
_5
PC
9 A
ZD
R_
6P
C9
AZ
DR
_7
PC
9 A
ZD
R_
8P
C9
WZ
R_
1P
C9
WZ
R_
3P
C9
AR
_1
PC
9 A
R_
4P
C9
AR
_6
PC
9P
C9
GR
_4
_A
ZD
R_
1P
C9
GR
_6
_A
ZD
R_
2
H19
75
PC
9 G
R_
6_
AZ
DR
_3
PC
9 G
R_
6_
AZ
DR
_4
H19
75
AZ
DR
_1
H19
75
AZ
DR
_2
H19
75
AZ
DR
_3
H19
75
AZ
DR
_4
H19
75
AZ
DR
_5
PC
9P
C9
GR
_1
PC
9 G
R_
2P
C9
GR
_3
PC
9 G
R_
4P
C9
GR
_5
PC
9 G
R_
6P
C9
GR
_7
PC
9 G
R_
8
6.9
50
.25
2.3
81
.4
2.7
1.6
3Selumetinib IC50 µM
PC
9 G
R_
1_
AZ
DR
_1
PC
9 G
R_
1_
AZ
DR
_2
PC
9 G
R_
1_
AZ
DR
_3
PC
9 G
R_
1_
AZ
DR
_4
0.0
2
6.9
50
.28
0.5
40
.13
0.7
3
4.9
4
5.4
6
3.6
6.7
5
3.5
3.4
0.1
51
0
0.0
5
7.3
2
6.9
57
.24
0.6
26
.2
3.7
8.7
77
.4
2.5
NRAS-GTP
NRAS
Total RAS-GTP
Total RAS
PC9
AZD9291160nM + - + - + - +
KRAS-GTP
KRAS
-
PC9 AZDR_5NRAS E63K
PC9 GR_2NRAS E63K
PC9 WZR_1NRAS Q61K
Supplementary Figure S5
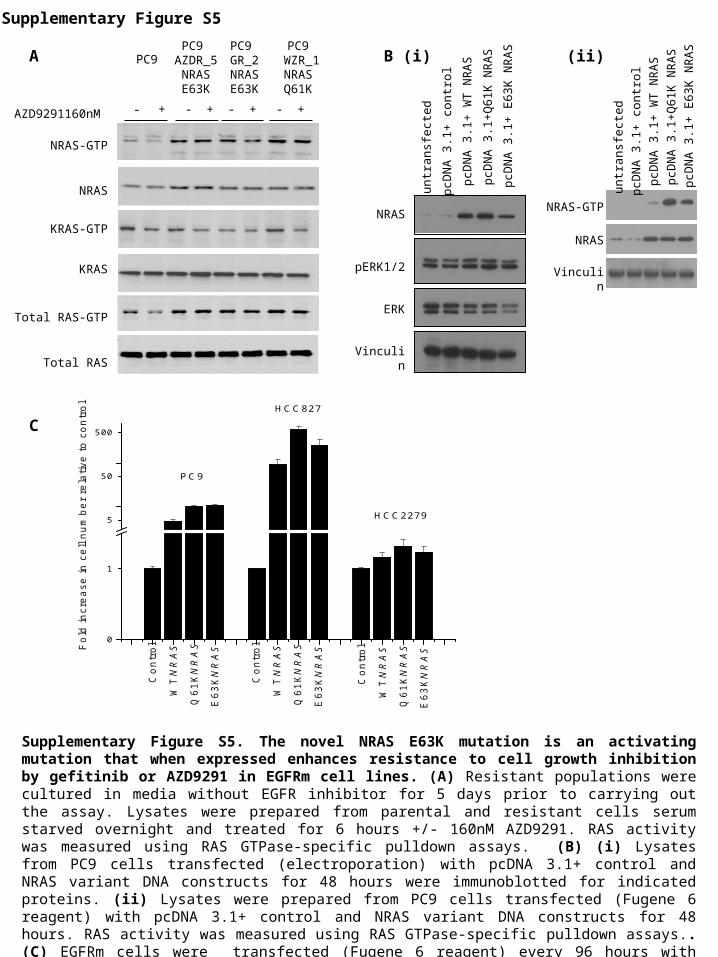
Supplementary Figure S5. The novel NRAS E63K mutation is an activating mutation that when expressed enhances resistance to cell growth inhibition by gefitinib or AZD9291 in EGFRm cell lines. (A) Resistant populations were cultured in media without EGFR inhibitor for 5 days prior to carrying out the assay. Lysates were prepared from parental and resistant cells serum starved overnight and treated for 6 hours +/- 160nM AZD9291. RAS activity was measured using RAS GTPase-specific pulldown assays. (B) (i) Lysates from PC9 cells transfected (electroporation) with pcDNA 3.1+ control and NRAS variant DNA constructs for 48 hours were immunoblotted for indicated proteins. (ii) Lysates were prepared from PC9 cells transfected (Fugene 6 reagent) with pcDNA 3.1+ control and NRAS variant DNA constructs for 48 hours. RAS activity was measured using RAS GTPase-specific pulldown assays.. (C) EGFRm cells were transfected (Fugene 6 reagent) every 96 hours with indicated DNA constructs and cultured in media containing 160nM AZD9291 over a period of 12 days.
A
C
pERK1/2
Vinculin
NRAS
ERK
un
tra
nsf
ect
ed
pcD
NA
3.1
+ c
on
tro
l
pcD
NA
3.1
+Q
61K
NR
AS
pcD
NA
3.1
+ W
T N
RA
S
pcD
NA
3.1
+ E
63K
NR
ASB (i)
0
1
5
50
500
E6
3K
NR
AS
Q6
1K
NR
AS
WT
NR
AS
Co
ntr
ol
HCC2279
HCC827
Fo
ld in
cre
ase
in
ce
ll n
um
be
r re
lative
to
co
ntr
ol
PC9
Co
ntr
ol
WT
NR
AS
Q6
1K
NR
AS
E6
3K
NR
AS
Co
ntr
ol
WT
NR
AS
Q6
1K
NR
AS
E6
3K
NR
AS
un
tra
nsf
ect
ed
pcD
NA
3.1
+ c
on
tro
l
pcD
NA
3.1
+Q
61K
NR
AS
pcD
NA
3.1
+ W
T N
RA
S
pcD
NA
3.1
+ E
63K
NR
AS
NRAS-GTP
NRAS
Vinculin
(ii)

Control AZD9291 selumetinib AZD9291+selumetinib0
25
100
500
5000
50000
Fol
d ch
ange
in c
ell n
umbe
r
Day 1 Day 6 Day 17 Day 23 Day 30 Day 37 Day 44 Day 51
NCI-H820 (EGFRm+/T790M+ / cMET amp)
Control AZD9291 selumetinib AZD9291+selumetinib0
10
100
500
5000
50000
Fol
d ch
ange
in c
ell n
umbe
r
Day 1 Day 6 Day 17 Day 23 Day 30 Day 37 Day 44 Day 51
HCC827 (EGFRm+)
Supplementary Figure S6
A
B
Supplementary Figure S6. In vitro combination of AZD9291 with selumetinib induces more profound phenotype inhibition. (A) HCC827 and (B) NCI-H820 cells were chronically treated for 51 days with; DMSO, AZD9291, selumetinib or a combination of both AZD9291 with selumetinib. Fold increase in cell number was monitored over time.