p.c. buchanan Æ c. koeberl f.j. kruger geochemistry of ... · geochemistry of intermediate to...
TRANSCRIPT

P.C. Buchanan Æ W.U. Reimold Æ C. KoeberlF.J. Kruger
Geochemistry of intermediate to siliceous volcanic rocksof the Rooiberg Group, Bushveld Magmatic Province, South Africa
Received: 3 December 2001 /Accepted: 4 June 2002 / Published online: 6 September 2002� Springer-Verlag 2002
Abstract The volcanic Rooiberg Group represents theearliest phase of Bushveld-related magmatism andcomprises, in some areas, the floor and roof rocks of themafic–ultramafic intrusive units of the Bushveld Com-plex. The lower to middle Dullstroom Formation iscomposed of two interbedded series of low Ti and highTi volcanic strata, which are predominantly basalticandesites. Volcanic units above these strata range fromandesites to dacites in the upper Dullstroom Formationand to predominantly rhyolites in the overlying Damwaland Kwaggasnek Formations. Compositional data sug-gest that these intermediate to siliceous volcanic rocksare petrogenetically related to the low Ti volcanic suiteand suggest that the low Ti magmas resided in a shallowmagma chamber where they experienced fractionalcrystallization and assimilation of crustal material. Incontrast, the high Ti volcanic suite is petrogeneticallyunrelated. These data confirm previous suggestions thatBushveld-related magmas experienced significantamounts of assimilation of continental crust.
Introduction
The Rooiberg Group, which includes, in ascendingorder, the Dullstroom, Damwal, Kwaggasnek, andSchrikkloof Formations (Schweitzer et al. 1995), islocated in the eastern part of South Africa (Fig. 1) andrepresents a voluminous (�6-km thick) series of pre-dominantly volcanic rocks with minor interbeddedsediments (Fig. 2). The original areal extent of thissequence was large, as the present outcrop exposuresextend over parts of an area of �65,000 km2 (Tankardet al. 1982; Schweitzer et al. 1995). In some areas,these volcanic units make up the floor and roof rocksof the Rustenburg Layered Suite (RLS), the mafic–ultramafic phase of the intrusive Bushveld Complex.The Lebowa Granite Suite, the granitic phase of theBushveld Complex, intrudes the Rooiberg Group inother areas.
Most of the isotopic age dates acquired for samples ofthe Rooiberg Group and the Bushveld Complex rangefrom 2061±2 to 2052±48 Ma (e.g.; Walraven et al.1987, 1990; Walraven 1997; Harmer, personal commu-nication 2000; Buick et al. 2001). The close spatial re-lationships of these intrusive and extrusive rocks and thesimilarity of their crystallization ages suggest that theywere deposited during the same magmatic event. Irvine(1982) suggested that all of these rocks should be in-cluded in the Bushveld Magmatic Province. The intru-sive relationship of the Bushveld Complex with theRooiberg Group indicates that these volcanic rocksrepresent the initiation and early development of Bush-veld magmatic activity.
Three hypotheses have been proposed for the originof the Rooiberg Group. First, several authors (e.g.,Rhodes 1975; Elston 1992) attributed these strata andthe Bushveld Complex to the simultaneous impact ofseveral comets or asteroids. However, Buchanan andReimold (1998) discounted this hypothesis. Second,Hatton (1988) suggested that subduction-related pro-cesses associated with a nearby plate margin formed
Contrib Mineral Petrol (2002) 144: 131–143DOI 10.1007/s00410-002-0386-1
P.C. Buchanan (&) Æ W.U. ReimoldImpact Cratering Research Group, School of Geosciences,University of the Witwatersrand, Private Bag 3,WITS 2050 Johannesburg, South AfricaE-mail: [email protected]
C. KoeberlInstitute of Geochemistry, University of Vienna,Althanstrasse 14, 1090 Vienna, Austria
F.J. KrugerEconomic Geology Research Institute-Hugh Allsopp Laboratory,School of Geosciences, University of the Witwatersrand,Johannesburg, South Africa
Present address: P.C. BuchananAntarctic Meteorite Research Center,National Institute of Polar Research,1-9-10 Kaga Itabashi-ku, Tokyo 173-8515, Japan
Editorial responsibility: T.L. Grove
these units. Third, Harmer and von Gruenewaldt (1991),Hatton (1995), and Hatton and Schweitzer (1995) at-tributed the Rooiberg Group and the Bushveld Complexto partial melting of subcontinental lithosphere andlower crust by a mantle plume.
Recently, Buchanan et al. (1999) studied the high Tiand low Ti andesites and basaltic andesites of theDullstroom Formation and suggested that they repre-sent magmas that were derived by partial melting ofcompositionally distinct source areas and that they re-sided in at least two magma chambers in which magmamixing, fractional crystallization, and assimilation ofcrustal material occurred. The goal of this study is toelucidate the petrogenesis of the overlying intermediateto siliceous volcanic rocks. Bulk geochemical compo-sitions should help to trace the development of theseearly stages of Bushveld-related magmatism and todetermine whether these magmas were derived bycrustal melting or by differentiation and contaminationof the same melts represented by the more mafic
volcanic rocks of the lower to middle DullstroomFormation.
Samples and analytical techniques
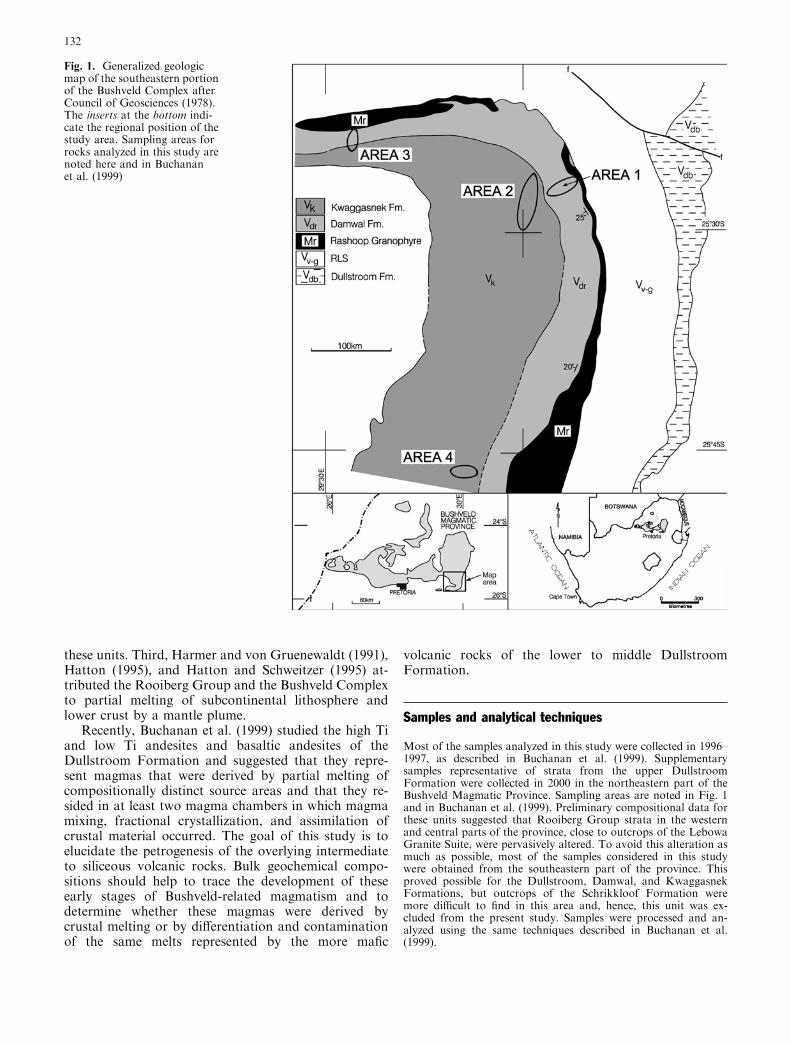
Most of the samples analyzed in this study were collected in 1996–1997, as described in Buchanan et al. (1999). Supplementarysamples representative of strata from the upper DullstroomFormation were collected in 2000 in the northeastern part of theBushveld Magmatic Province. Sampling areas are noted in Fig. 1and in Buchanan et al. (1999). Preliminary compositional data forthese units suggested that Rooiberg Group strata in the westernand central parts of the province, close to outcrops of the LebowaGranite Suite, were pervasively altered. To avoid this alteration asmuch as possible, most of the samples considered in this studywere obtained from the southeastern part of the province. Thisproved possible for the Dullstroom, Damwal, and KwaggasnekFormations, but outcrops of the Schrikkloof Formation weremore difficult to find in this area and, hence, this unit was ex-cluded from the present study. Samples were processed and an-alyzed using the same techniques described in Buchanan et al.(1999).
Fig. 1. Generalized geologicmap of the southeastern portionof the Bushveld Complex afterCouncil of Geosciences (1978).The inserts at the bottom indi-cate the regional position of thestudy area. Sampling areas forrocks analyzed in this study arenoted here and in Buchananet al. (1999)
132

Results
Petrography
Buchanan et al. (1999) described the petrography andmineral chemistry of the low Ti and high Ti rock suitesof the lower to middle Dullstroom Formation. Meta-volcanic units of the upper Dullstroom Formation alsodisplay both primary volcanic textures and metamorphictextures. These rocks contain rare altered phenocrysts,porphyroblasts, and zoned amygdules in a fine-grainedto very fine-grained groundmass, which is predomi-nantly composed of subequal proportions of equantquartz and lath-shaped feldspar with varying propor-tions of amphibole, biotite, and opaque minerals(Fig. 3a). Groundmass feldspar is twinned and is pre-dominantly plagioclase (An3 to An59) with rare grains ofalkali feldspar (Or99 to Or86). Phenocrysts apparentlywere originally feldspar and commonly are sericitized.
Hornblende porphyroblasts in units of the upperDullstroom Formation are variably developed andgenerally comprise anhedral to subhedral, lath-shaped,and somewhat poikilitic crystals. In some cases, opaquemineral grains are concentrated in the outer portions of
these porphyroblasts. Amphibole has an average abun-dance of TiO2 of �0.57 wt% and Mg# [100 Mg/(Mg+Fe), atomic] ranges from 40 to 56. In general,these amphiboles are more Fe-rich than those in the lowTi and high Ti units of the Dullstroom Formation(Buchanan et al. 1999). Minor proportions of prehnite,pumpellyite, magnetite, chlorite, and possible apatitealso occur in these samples. Biotite is also present in afew samples and, in some cases, augen-shaped inclusionsof green hornblende occur within individual grains ofbiotite (Fig. 3b).
Zoned amygdules in samples from the upper Dullst-room Formation have quartz-lined outer edges and
Fig. 2. Generalized stratigraphic column of the Rooiberg Group asproposed by Schweitzer et al. (1995). Adapted from Cheney andTwist (1991), Council of Geosciences (1978), Eriksson et al. (1994),and Schweitzer et al. (1995). Strata designated as white are volcanicand pyroclastic rocks, those designated with horizontal lines aresedimentary rocks, and those designated as solid black aregranophyric rocks. Scale, in meters, shows approximate thicknessof units
Fig. 3. Photomicrographs of the various units considered in thisstudy: a representative photomicrograph of a dacite from the upperDullstroom Formation, b photomicrograph of augen-shapedbodies of amphibole within an individual biotite grain, c represen-tative photomicrograph of a rhyolitic volcanic rock from theDamwal Formation. All photomicrographs are the same scale andthe scale bar is �1 mm. All photomicrographs taken withtransmitted light
133

cores that contain pleochroic, green/tan hornblende. Inrare cases, these amygdules also contain feldspar. Thematrices of a few of these volcanic rocks display con-centrations of quartz in linear or curving concentrationsthat apparently represent fractures filled with secondaryquartz. Where possible, these fractures were avoidedduring sample preparation.
The metavolcanic rocks of the Damwal Formationalso display both primary volcanic textures and meta-morphic textures. These strata occur above the Rust-enburg Layered Suite (RLS) and range from rocks withspherulitic textures to rocks that are somewhat grano-phyric in texture and grade into the Rashoop Gran-ophyre. This study concentrates on the spherulitic units(e.g., Fig. 3c) and those that have pyroclastic textures,including units that appear to be lapilli tuffs. Thespherulitic units have a fine-grained groundmass pre-dominantly composed of quartz and feldspar. Thesefeldspars commonly have albite-rich compositions (Ab72to Ab83) with rare grains of K-feldspar (Or90 to Or95).Rare euhedral to subhedral feldspar phenocrysts occurand are commonly altered. In some samples, thesephenocrysts occur in clusters and these rocks have aglomeroporphyritic texture.
Significant metamorphism of these units of theDamwal Formation is indicated by the development ofhornblende porphyroblasts. These porphyroblasts rangein Mg# from 13 to 35 and abundances of TiO2 rangefrom 0.86 to 1.18 wt%. Rare amygdules are filled withquartz. Some of these rocks contain quartz-filled frac-tures and some are layered with concentrations of quartzin undulating zones that have diffuse boundaries andmay reflect primary pyroclastic textures.
Volcanic rocks of the Kwaggasnek Formation arefine- to very fine-grained and are predominantly com-posed of quartz and feldspar with varying proportionsof opaque minerals, which include ilmenite and magne-tite. These opaque minerals occur as discrete grains andas intergrowths that may be the result of exsolution.Textures are, to a greater or lesser degree, spherulitic,with centers of spherules that are fine-grained, equi-granular aggregates. Samples that are not spherulitic arevery fine-grained and are equigranular in texture. Insome of these samples, concentrations of quartz havelinear or elongated shapes and the units have a vaguelayering, which may also reflect primary pyroclastictextures. Feldspars are twinned and are either predom-inantly albite (e.g., Ab97) or K-feldspar (e.g., Or98).Rare, sericitized, euhedral to rounded feldspar pheno-crysts also occur in these units and may be partiallyresorbed. In some cases, these phenocrysts occur inclusters. Rounded quartz grains are also present, but arerare.
Chemical compositions
Geochemical compositions of these volcanic rocks arecontained in Tables 1, 2, and 3 and suggest that the
upper Dullstroom Formation and the Damwal andKwaggasnek Formations in the southeastern part of theBushveld Magmatic Province suffered minimal hydro-thermal alteration. Loss on ignition (LOI) values aregenerally close to 1 wt% and Na/K values are low andrelatively constant. Specimens appear relatively freshwith only rare, minor iron oxide staining. Abundancesof the element Ba, which is commonly considered to bemobile during hydrothermal alteration, increase withincreasing SiO2 content, which suggests differentiationrather than significant degrees of post-crystallizationremobilization. Data for Rooiberg Group strata in otherparts of the province suggest that hydrothermal altera-tion was more significant at locations near present-dayoutcrops of the Lebowa Granite Suite and, hence, con-firm the suggestion by Schweitzer and Hatton (1995)that significant alteration was associated with graniteintrusion at 2,053.4±3.9 to 2,057.5±4.2 Ma (Harmerpersonal communication 2000).
As suggested by previous authors (e.g., Schweitzeret al. 1995), there is a general increase in abundance ofSiO2 moving upward in the Rooiberg Group succession(Fig. 4). Harmer and von Gruenewaldt (1991), Hattonand Schweitzer (1995), Schweitzer et al. (1995), andBuchanan et al. (1999) determined that most of thevolcanic rocks of the lower to middle Dullstroom For-mation, which range from basalts to andesites, but arepredominantly basaltic andesites, fall into two geo-chemical groups: high Ti units (TiO2>1.0 wt%;SiO2<60 wt%) and low Ti units (TiO2<1.0 wt%;SiO2<60 wt%; Fig. 5a). Rare dacite volcanic units areinterbedded with these basaltic andesites in the middleDullstroom Formation (Schweitzer et al. 1995; Bu-chanan et al. 1999). These dacites become more commonmoving upward into the upper Dullstroom Formationand basaltic andesites diminish in number and volume.Volcanic strata in the overlying Damwal Formationinclude both rhyolites and dacites and units of theKwaggasnek Formation are predominantly rhyolites(Fig. 4).
Twist (1985) originally divided the intermediate tosiliceous units of the upper Dullstroom Formation andthe Damwal Formation into two groups: high Mg fel-sites (MgO >1.7 wt%) and low Mg felsites (MgO<1.0 wt%). High Mg felsites predominate in the upperDullstroom Formation and low Mg felsites predominatein the Damwal Formation. Detailed sampling in thestudy area and laboratory analyses of these samplessuggest that these two groups of volcanic rocks mayhave originally represented a spectrum of related com-positions. In many variation diagrams (Fig. 5a–f), theserocks form clusters along trends that also include sam-ples of the low Ti suite and samples from the Kwa-ggasnek Formation. This division into two groups basedon abundances of MgO is complicated by the fact thatthe intrusive Rustenburg Layered Suite may have as-similated significant portions of wallrock with interme-diate abundances of MgO from the central portion ofthe Rooiberg Group succession (e.g., Fig. 2). Hence,
134

because it is not clear that this division into high Mgfelsites and low Mg felsites is a function of originalpetrogenetic processes, in this study, these volcanic unitsare classified by the formations in which they occur,rather than by abundances of MgO.
Compositional data for the volcanic units of theDullstroom, Damwal, and Kwaggasnek Formationsshow consistent variations from the basaltic andesites ofthe Dullstroom Formation to the rhyolitic rocks of theKwaggasnek Formation (Fig. 5a–f). Samples of volcanicunits from the Mg-rich extreme of this spectrum com-monly are relatively enriched in Al2O3, CaO, and Sc. Incontrast, samples of volcanic units from the Mg-poorextreme of the spectrum are relatively enriched in K2Oand the rare earth elements (e.g., Sm, Fig. 5f). Increasingabundances of some elements correlate with those of theincompatible element Zr and other elements display a
reverse correlation. For example, abundances of Sr, Sc,and Co decrease with increasing abundances of Zr(Fig. 6a–c), whereas abundances of Ba, Ta, and Hf in-crease as abundances of Zr increase (Fig. 6d–f).
Chondrite-normalized abundances of rare earth ele-ments for representative samples from each suite areplotted in Fig. 7a–c. Abundances of rare earth elementsfor low Ti and high Ti volcanic units of the DullstroomFormation were previously reported in Buchanan et al.(1999). Abundances increase with increasing strati-graphic height and patterns are generally parallel formost of these samples. The magnitude of the negativechondrite-normalized Eu anomaly increases with strati-graphic height.
Figure 8 contains spider-diagrams in which the ele-ment abundances for samples of the volcanic suites ofthe upper Dullstroom Formation, Damwal Formation,
Table 1. Compositions determined by XRF and INAA for dacites of the upper Dullstroom Formation. V, Ni, Cu, Y, Nb, and mostmajor elements determined by XRF. Na, Fe, Cr, Zn, Sr, Zr, and Ba determined by a combination of both XRF and INAA. The remainderof the trace elements determined by INAA. n.d. Not determined
Sample hs1 hs2 hs5 hs7 hs8 hs10 hs16 hs17 hs18 hs20 hs21 Avg.
wt%SiO2 66.0 64.8 65.5 68.1 67.2 69.2 65.9 65.3 65.7 65.2 65.9 66.3TiO2 0.65 0.66 0.62 0.60 0.59 0.52 0.67 0.66 0.66 0.64 0.66 0.63Al2O3 13.4 13.5 13.3 12.7 12.9 12.3 13.5 13.7 13.4 13.5 13.3 13.2Fe2O3
a 6.87 7.35 6.95 5.96 5.86 5.07 7.31 7.05 7.03 7.06 7.09 6.69MnO 0.14 0.15 0.13 0.11 0.14 0.04 0.07 0.07 0.08 0.17 0.19 0.12MgO 2.24 2.51 2.35 1.29 1.33 1.26 1.87 2.28 2.17 2.19 1.94 1.95CaO 4.66 4.69 4.83 3.57 3.74 3.78 4.47 4.43 4.73 4.46 4.66 4.37Na2O 2.77 3.34 3.30 3.28 3.21 2.12 3.16 2.88 3.35 3.33 3.11 3.08K2O 2.50 2.16 2.28 2.62 3.01 3.29 2.48 2.58 2.19 2.68 2.46 2.57P2O5 0.14 0.15 0.13 0.13 0.12 0.10 0.14 0.14 0.14 0.14 0.14 0.13LOI 1.12 1.08 1.08 0.81 0.94 1.19 0.83 1.10 0.99 1.13 0.97 1.02Total 100.5 100.4 100.5 99.2 99.0 98.9 100.4 100.2 100.4 100.5 100.4 100.1
ppmSc 16.3 18.8 17.6 13.1 12.7 n.d. 16.9 16.3 15.7 n.d. 16.8 16.0V 109 121 109 88 83 87 113 116 113 118 117 107Cr 132 126 102 64 55 226 155 143 156 151 142 132Co 19.0 25.0 21.0 16.0 13.0 21.0 20.0 21.0 21.0 24.0 20.0 20.1Ni 23 34 34 18 15 17 27 29 26 29 21 25Cu 11 8 14 16 18 9 9 15 4 22 11 13Zn 100 83 98 74 98 57 81 92 88 85 97 87Rb 96 74 85 102 118 135 92 95 77 99 86 96Sr 284 272 286 272 296 239 288 277 271 261 273 274Y 31 32 31 31 38 28 30 32 32 32 31 32Zr 219 213 213 232 217 202 222 221 216 221 220 218Nb 12 12 12 11 12 11 11 12 11 12 12 12Cs 1.87 1.79 1.83 1.35 1.79 n.d. 1.74 2.01 1.47 n.d. 1.62 1.72Ba 630. 722. 694. 798. 831. 880. 752. 713. 620. 711. 657. 728.La 43.5 37.4 42.7 39.7 42.2 n.d. 41.9 38.5 37.9 n.d. 41.7 40.6Ce 80.6 73.7 78.4 75.3 76.7 n.d. 76.2 75.1 72.7 n.d. 76.8 76.2Nd 36.2 34.7 37.6 35.3 37.9 n.d. 35.4 30.7 32.4 n.d. 36.5 35.2Sm 5.66 5.59 6.04 5.47 6.45 n.d. 5.64 5.48 5.54 n.d. 5.93 5.76Eu 1.27 1.35 1.37 1.24 1.32 n.d. 1.34 1.29 1.48 n.d. 1.29 1.33Gd 4.26 4.75 5.59 4.66 5.31 n.d. 4.99 4.65 5.06 n.d. 5.05 4.92Tb 0.81 0.75 0.83 0.76 0.85 n.d. 0.76 0.76 0.77 n.d. 0.71 0.78Tm 0.47 0.43 0.46 0.35 0.45 n.d. 0.41 0.44 0.43 n.d. 0.41 0.43Yb 2.63 2.61 2.91 2.42 1.85 n.d. 2.63 2.41 2.64 n.d. 2.64 2.64Lu 0.42 0.42 0.41 0.38 0.43 n.d. 0.39 0.38 0.41 n.d. 0.42 0.41Hf 5.15 5.07 5.17 5.19 5.29 n.d. 4.97 4.82 5.06 n.d. 5.17 5.10Ta 0.75 0.63 0.66 0.63 0.67 n.d. 0.55 0.57 0.55 n.d. 0.59 0.62Th 12.8 11.1 12.4 11.8 12.1 n.d. 11.9 11.5 11.2 n.d. 12.3 11.9U 2.51 2.45 2.51 2.56 2.34 n.d. 2.03 1.76 2.14 n.d. 2.23 2.28
aAll iron reported as Fe2O3
135

and Kwaggasnek Formation are normalized to thecomposition of pyrolite (silicate earth) of McDonoughand Sun (1995). Similar diagrams for low Ti and highTi volcanic units were previously displayed in Bu-chanan et al. (1999). Patterns for volcanic rocks fromthe Dullstroom, Damwal, and Kwaggasnek Forma-tions are consistently enriched in most incompatibletrace elements, which commonly increase in abundancewith increasing stratigraphic height and increasingabundance of SiO2. However, negative pyrolite-nor-malized anomalies for Nb, Ta, Sr, P, and Ti occur.With increasing stratigraphic height, the Sr, P, and Tianomalies become more pronounced. In contrast,abundances of Nb and Ta increase with increasingstratigraphic height and increasing SiO2 abundance,and, hence, the magnitude of the Nb–Ta anomalyremains relatively constant.
Discussion
Magmatic processes
The sequence of volcanic rocks in the Rooiberg Group isdistinctive because of the presence of a wide spectrum ofcompositions (Fig. 4). These rocks range from two typesof relatively mafic rocks (low Ti and high Ti suites) inthe lower to middle Dullstroom Formation throughstrata with intermediate compositions (andesites anddacites) in the upper Dullstroom Formation to rhyolitesin the overlying formations. Abundances of various in-compatible trace elements parallel this broad range ofcompositions (Figs. 5 and 6).
The abundances of some incompatible trace elementsconstrain the petrogenetic relationships of these volcanic
Table 2. Compositions determined by XRF and INAA for rhyolites of the Damwal Formation. V, Ni, Cu, Y, Nb, and most majorelements determined by XRF. Na, Fe, Cr, Zn, Sr, Zr, and Ba determined by a combination of both XRF and INAA. The remainder of thetrace elements determined by INAA. b.d. Below detection limits
Sample kk20 kk21 nk10 nk11 nk15 pb3 pb8 pb9 pb10 l17 ld1 Avg.
wt%SiO2 68.4 67.3 69.0 69.5 69.2 69.2 69.9 69.6 71.8 67.7 69.9 69.2TiO2 0.57 0.64 0.53 0.54 0.51 0.65 0.53 0.55 0.41 0.57 0.64 0.56Al2O3 12.0 11.9 11.9 11.9 12.2 11.8 11.8 11.3 11.7 11.9 11.9 11.9Fe2O3
a 8.06 8.82 7.26 7.04 7.14 6.57 6.86 7.64 6.22 8.09 7.27 7.36MnO 0.13 0.14 0.15 0.15 0.11 0.11 0.11 0.13 0.08 0.12 0.18 0.13MgO 0.76 0.95 0.29 0.38 0.27 0.33 0.14 0.15 b.d. 0.34 0.24 0.35CaO 2.68 2.71 1.99 2.41 2.07 2.33 1.92 2.10 1.41 1.76 0.77 2.01Na2O 3.60 3.11 3.18 3.59 3.63 3.23 2.64 3.01 2.66 3.19 3.77 3.24K2O 3.38 4.01 4.11 3.56 3.83 4.71 4.68 4.97 5.27 4.42 4.56 4.32P2O5 0.10 0.16 0.15 0.15 0.15 0.18 0.12 0.13 0.06 0.14 0.14 0.13LOI 0.43 0.61 0.36 0.51 0.65 0.81 0.99 0.79 0.87 1.06 0.94 0.73Total 100.1 100.4 98.9 99.7 99.8 99.9 99.7 100.4 100.5 99.3 100.3 99.9
ppmSc 13.4 15.7 11.9 11.6 12.5 12.8 10.5 12.1 7.96 12.8 11.0 12.0V 5 4 <15 <15 <15 <15 <15 <15 <15 b.d. b.d.Cr 7.40 5.00 4.45 6.12 5.96 2.71 2.84 4.14 2.48 2.81 10.8 4.97Co 5.81 8.49 10.1 9.22 9.18 8.14 6.75 7.48 2.40 9.95 10.6 8.01Ni 5 5 <9 <9 <9 <9 <9 <9 <9 b.d. b.d.Cu 43 45 26 25 21 55 15 35 13 37 8 29Zn 149 155 133 129 176 138 142 179 115 132 341 163Rb 143 151 154 124 153 184 167 185 201 160 176 163Sr 155 140 148 166 143 168 163 123 111 149 100 142Y 54 51 46 44 47 47 58 49 62 52 50 51Zr 333 317 294 331 309 329 339 329 405 329 370 335Nb 18 17 18 16 17 17 18 17 20 18 22 18Cs 2.34 1.03 3.84 4.91 3.56 4.45 2.10 2.24 3.75 2.27 0.73 2.84Ba 1,041 981 961 818 922 1,168 1,036 1,030 1,263 970 1,014 1,019La 65.9 61.8 69.2 61.8 69.1 50.9 78.0 75.9 73.8 67.8 69.6 67.6Ce 131 128 122 116 127 105 144 131 140 126 115 126Nd 65.3 57.2 56.5 55.0 62.1 51.3 62.0 63.6 64.8 55.9 54.8 59.0Sm 10.9 10.3 10.5 9.23 10.6 9.21 11.0 11.5 12.2 11.3 11.0 10.7Eu 1.61 1.59 1.79 1.84 1.87 1.67 1.96 2.12 2.11 1.96 1.69 1.84Gd 10.3 7.96 10.2 8.60 10.6 9.75 10.3 10.7 11.4 9.09 8.96 9.81Tb 1.66 1.38 1.47 1.31 1.49 1.50 1.65 1.59 1.87 1.68 1.61 1.56Tm 0.89 0.77 0.83 0.70 0.76 0.73 0.77 0.81 0.99 0.94 0.79 0.82Yb 6.14 5.59 5.01 4.48 5.32 4.95 5.11 5.46 6.93 5.66 5.26 5.45Lu 0.81 0.77 0.75 0.71 0.79 0.74 0.76 0.82 0.98 0.81 0.77 0.79Hf 9.45 8.52 8.59 8.08 8.94 8.85 8.43 9.42 10.3 8.97 9.23 8.98Ta 1.12 0.97 1.26 1.06 1.23 1.48 1.17 1.49 1.66 1.43 1.38 1.30Th 21.6 19.2 21.6 19.6 21.8 20.3 19.3 22.2 22.3 20.9 20.8 20.9U 4.84 3.79 5.47 4.25 5.47 4.28 4.05 5.40 5.28 5.90 4.59 4.85
aAll iron reported as Fe2O3
136

rocks. For example, the abundances of some rare earthelements are greater for the high Ti suite than for the lowTi suite or for the overlying strata of the upper Dullst-room Formation (Fig. 5f; see also Buchanan et al. 1999).Hence, dacite liquids represented by strata of the upperDullstroom Formation probably were not derived fromhigh Ti magmas because such derivation requires dif-ferentiation of liquids with lower abundances of in-compatible trace elements from liquids with higherabundances. These data suggest that all of the interme-diate to siliceous volcanic rocks of the upper DullstroomFormation and the Damwal and Kwaggasnek Forma-
tions were derived from low Ti magmas, which hadlower abundances of incompatible trace elements thanthe high Ti magmas. This is also well illustrated by a plotof Hf (ppm) vs. Ti/Zr (both in ppm; Fig. 9). On this plot,compositions of low Ti volcanic rocks and overlyingintermediate to siliceous rocks form a well-defined trend,whereas compositions of high Ti volcanic rocks form aseparate trend.
Considering all of these data together, it is likely thatfractional crystallization affected the magmas repre-sented by the Rooiberg Group. The magnitude of thenegative chondrite-normalized Eu anomaly increases
Sample m2 m3 m5 m6 m7 m8 m9 m10 Avg.Kwag.
Avg.low Ti
Avg.high Ti
VG1
wt%SiO2 76.9 76.6 76.2 75.5 74.1 74.7 75.8 74.8 75.6 55.0 56.5 71.0TiO2 0.28 0.28 0.26 0.27 0.26 0.26 0.25 0.28 0.27 0.59 1.58 0.43Al2O3 12.3 11.8 11.5 11.5 11.6 11.2 11.0 11.2 11.5 15.2 12.9 15.2Fe2O3
a 1.05 1.64 2.89 3.98 4.31 5.00 4.54 4.08 3.44 9.60 11.0 2.39MnO 0.01 0.03 0.05 0.04 0.04 0.09 0.03 0.03 0.04 0.16 0.16 0.05MgO b.d. b.d. b.d. b.d. b.d. b.d. b.d. b.d. 5.81 4.51 0.43CaO b.d. b.d. 0.06 0.26 0.29 0.05 0.02 0.13 0.10 8.95 7.46 2.11Na2O 2.75 2.91 2.60 2.32 2.62 2.17 2.53 3.53 2.68 2.54 2.95 5.26K2O 4.98 4.99 4.44 5.06 5.08 5.06 5.06 5.09 4.97 1.11 1.67 2.72P2O5 0.02 0.03 0.02 0.03 0.02 0.02 0.03 0.02 0.02 0.09 0.17 0.13LOI 1.11 0.83 1.11 1.09 0.98 1.05 0.96 0.83 1.00 1.03 0.81 0.64Total 99.4 99.1 99.1 100.1 99.3 99.6 100.2 100.0 99.6 100.1 99.7 100.4
ppmSc 1.54 1.46 1.30 1.26 1.22 1.31 1.31 1.39 1.35 34.2 22.5 2.70V b.d. b.d. b.d. b.d. b.d. b.d. b.d. b.d. 190 208 23.2Cr 2.33 2.40 4.41 4.06 2.24 5.25 4.76 3.35 3.60 123 141 23.9Co 1.89 1.76 1.71 1.66 0.65 0.73 0.85 0.71 0.73 35.7 35.7 4.77Ni b.d. b.d. b.d. b.d. b.d. b.d. b.d. b.d. 98 87 9.64Cu 4 b.d. 22 8 3 b.d. 8 11 9.33 50 118 2.72Zn 58 67 194 109 129 128 112 58 107 98 111 63Rb 164 186 154 193 187 180 184 185 179 34.9 70.0 109Sr 35 47 53 47 46 42 49 54 47 250 394 406Y 77 70 86 71 70 82 78 77 76 16 31 12.4Zr 506 481 450 491 473 499 435 469 476 98 194 452Nb 25 24 23 23 21 24 22 23 23 8 15 11.6Cs 2.88 2.70 10.2 5.41 8.47 5.43 6.99 3.68 5.72 1.21 1.66 1.40Ba 1,206 1,111 1,191 1,114 1,080 1,031 1,241 1,202 1,147 334 339 723La 49.2 130 146 103 89.0 90.8 185 97.9 111 17.1 30.5 68.0Ce 105 157 142 188 161 170 199 179 163 34.3 59.0 105Nd 48.3 87.8 106 78.1 70.1 72.3 117 74.6 81.8 17.2 33.8 41.6Sm 10.1 16.0 15.5 15.0 13.5 13.5 23.9 15.0 15.3 3.31 7.10 5.31Eu 1.84 2.48 2.85 2.36 2.07 2.10 3.38 2.23 2.41 0.93 1.94 1.33Gd 13.2 13.7 14.9 13.7 13.1 13.8 18.4 14.2 14.4 3.42 6.78 4.65Tb 2.05 2.15 2.60 2.12 2.10 2.07 2.76 2.52 2.30 0.54 1.00 0.57Tm 1.28 1.09 1.27 1.07 1.09 1.23 1.22 1.26 1.19 0.26 0.44 0.22Yb 8.51 7.22 8.33 7.31 7.33 8.18 8.18 8.11 7.90 1.75 2.69 1.16Lu 1.30 1.07 1.20 1.05 1.11 1.23 1.24 1.24 1.18 0.24 0.37 0.15Hf 13.0 12.6 12.1 12.0 12.3 12.5 12.9 13.4 12.6 2.44 4.64 5.85Ta 1.89 1.76 1.71 1.66 1.84 1.74 2.17 2.15 1.87 0.29 0.74 0.61Th 25.1 24.2 23.7 23.8 24.9 24.9 26.9 27.7 25.2 3.86 5.82 48.0U 6.57 4.89 5.21 4.64 3.87 4.43 6.20 5.40 5.15 0.68 1.28 n.d.
aAll iron reported as Fe2O3
Table 3. Compositions determined by XRF and INAA for high-Siunits of the Kwaggasnek Formation. V, Ni, Cu, Y, Nb, and mostmajor elements determined by XRF. Na, Fe, Cr, Zn, Sr, Zr, and Badetermined by a combination of both XRF and INAA. The re-mainder of the trace elements determined by INAA. CompositionVG1 is an average of analyses of granitoids and gneisses from theVredefort Dome and the Johannesburg Dome that were sampledand analyzed by C. Lana, University of the Witwatersrand,
Johannesburg (personal communication 2001) using the same an-alytical techniques. For some major and trace elements, the com-position of VG1 is the average of 38 analyses acquired by XRF.For other elements, VG1 is the average of 16 analyses acquired byINAA. The averages of low Ti and high Ti units are from Bu-chanan et al. (1999). b.d. Below detection limits; n.d. not deter-mined
137

with increasing stratigraphic height (Fig. 7a–c), sug-gesting crystallization of feldspar. Crystallization offeldspar is also consistent with the decrease in abun-dances of Al2O3 (Fig. 5b) and CaO (Fig. 5c) with de-creasing abundances of MgO and with increasingstratigraphic height. Feldspar crystallization is alsoconsistent with the negative pyrolite-normalized Sranomalies, which increase in magnitude with increasingstratigraphic height (Fig. 8a–c). Abundances of Sr de-crease with increasing abundances of the commonly in-compatible element Zr (Fig. 6a), suggesting that Sr wascompatible with the suite of crystallizing minerals andfurther supporting the crystallization of feldspar.
Crystallization of other minerals is also suggested bythese geochemical data. Abundances of Sc decrease withincreasing abundances of Zr (Fig. 6b) and decreasingMgO content (Fig. 5e), suggesting that Sc was compat-ible with the suite of crystallizing minerals, whichprobably included pyroxene. Abundances of Co (andNi) also decrease with increasing abundances of Zr(Tables 1, 2, and 3, Fig. 6c) and suggest the crystalliza-tion of olivine or pyroxene. Negative pyrolite-normal-ized P anomalies for these strata also increase inmagnitude with increasing stratigraphic height andsuggest crystallization of apatite (Fig. 8a–c). Increasingmagnitudes of negative pyrolite-normalized Ti anoma-lies with increasing stratigraphic height may indicatefractionation of ilmenite, magnetite, pyroxene, oramphibole (Fig. 8a–c).
In light of the geochemical data presented in Tables 1,2, and 3, it is also possible that assimilation of uppercontinental crust played a role in the petrogenesis ofthese magmas. The low Ti and high Ti volcanic suites ofthe Dullstroom Formation, which are mostly basalticandesites, have a distinct signature of continental crust(e.g., Buchanan et al. 1999). This crustal signature iseven more pronounced for the intermediate to siliceousvolcanic rocks considered in the present study (Fig. 8a–c). Assimilation seems the most likely explanation forthis crustal signature in volcanic rocks that range from
Fig. 4. Classification system based on SiO2 (wt%) vs. Na2O +K2O (wt%; after Le Bas et al. 1986) for low Ti and high Ti volcanicrocks of the Dullstroom Formation through rhyolitic volcanicrocks of the Kwaggasnek Formation
Fig. 5. Variation diagrams for units of the Dullstroom, Damwal,and Kwaggasnek Formations: a MgO (wt%) vs. TiO2 (wt%),b MgO (wt%) vs. Al2O3 (wt%), c MgO (wt%) vs. CaO (wt%),d MgO (wt%) vs. K2O (wt%), e MgO (wt%) vs. Sc (ppm), andf MgO (wt%) vs. Sm (ppm). Data for low Ti and high Ti volcanicunits are from Buchanan et al. (1999)
138

relatively mafic to very siliceous. However, it is impor-tant to recognize that, in some cases, it may be difficultto distinguish between the effects of assimilation ofcrustal material by a mantle-derived melt and the effectsassociated with partial melting of crustal material, par-ticularly if the crustal melt is mixed with a mantle-derived melt in a shallow magma chamber.
Modeling
In an attempt to determine whether the compositions ofthe intermediate to siliceous volcanic rocks of theRooiberg Group are consistent with fractional crystal-lization and assimilation of continental crust by anoriginally mantle-derived melt, several models (models 1to 3) were calculated. The broad range of compositionsfrom low Ti basaltic andesites in the Dullstroom For-mation to rhyolites in the Kwaggasnek Formation al-lowed more detailed calculations than those ofBuchanan et al. (1999). Major element abundances werecalculated in a series of steps assuming equilibriumcrystallization of the relevant minerals. Each step rep-resented 10% by weight of fractional crystallization.Trace element abundances were calculated using the
Fig. 6. Variation diagrams for units of the Dullstroom, Damwal,and Kwaggasnek Formations: a Zr (ppm) vs. Sr (ppm), b Zr (ppm)vs. Sc (ppm), c Zr (ppm) vs. Co (ppm), d Zr (ppm) vs. Ba (ppm),e Zr (ppm) vs. Ta (ppm), and f Zr (ppm) vs. Hf (ppm). Data for lowTi and high Ti volcanic units are from Buchanan et al. (1999)
Fig. 7. Chondrite-normalized REE diagrams for Rooiberg Groupvolcanic units: a upper Dullstroom Formation, b DamwalFormation, and c Kwaggasnek Formation. Abundances arenormalized to those of C1 chondrites from Anders and Grevesse(1989). Compare with a similar diagram for high Ti and low Tiunits of the Dullstroom Formation in Fig. 6 of Buchanan et al.(1999)
139

methods and equations discussed in DePaolo (1981).Mineral/melt partition coefficients for trace elementsused in these calculations were based on the discussionand references contained in Wilson (1989). Althoughthese models probably aren’t unique, they representreasonable approximations of assimilation and frac-tional crystallization processes that might have affectedthese magmas.
Instead of the approximate composition of the uppercontinental crust of Taylor and McLennan (1985), theassimilant was assumed to be the average composition(VG1, Table 3) of a significant number of granitoids and
gneisses from the Vredefort Dome and the Johannes-burg Dome, immediately south of the Bushveld Com-plex (personal communication 2001, C. Lana, Universityof the Witwatersrand). Compositions of these granitoidsand gneisses were determined in the same laboratoriesand using the same analytical techniques as the othergeochemical data in this study. For major elements andsome trace elements, the composition of VG1 was cal-culated by averaging compositions determined by XRFfor 38 samples. For other trace elements, the composi-tion of VG1 was calculated by averaging compositionsdetermined by INAA for 16 samples. There is evidencethat these granitoids and gneisses are representative ofthe basement in the study area and in surrounding partsof the Kaapvaal Craton (e.g., Anhaeusser 1999, andpapers discussed and quoted in Anhaeusser 1983). It isimportant to note, however, that there are obviouslimitations associated with any attempt to estimate theaverage composition of a heterogeneous continentalcrust. Nevertheless, the composition of VG1 is generallysimilar to the more limited compositional data for sili-ceous Archean basement rocks from the VredefortDome reported by Hart et al. (1990).
The suites of crystallizing minerals used to calculateeach of these models is based on several factors.Feldspar phenocrysts are rare, but ubiquitous, amongstrata of the Dullstroom and Damwal Formations andsupport the geochemical evidence for the crystallizationof feldspar. Other phenocrysts are present in the low Tiand high Ti volcanic rocks of the Dullstroom Forma-tion and are commonly altered, but apparently wereoriginally mafic silicates (e.g., Buchanan et al. 1999).These phenocrysts support the geochemical evidencefor the crystallization of pyroxene and/or olivine. Inrare cases, it is possible to determine that these phe-nocrysts were originally pyroxene, whereas, in othercases, it is not possible to confidently identify them andthey may have been olivine. Significant proportions ofolivine in the suite of crystallizing minerals in the earlystages of differentiation seems to best reproduce thelevels of enrichment of SiO2 of the Rooiberg Groupvolcanic units. This enrichment could probably also bereproduced with crystallization of larger proportions ofilmenite and magnetite. However, crystallization oflarge amounts ilmenite should result in a more signifi-cant decrease in TiO2 content with increased differen-tiation from the low Ti suite to the overlyingintermediate to siliceous volcanic rocks (Fig. 5a). Thereis, however, indirect geochemical evidence for thecrystallization of small proportions of apatite andpossibly ilmenite and magnetite from these magmas(see above).
Where possible, compositions of the crystallizingphases used in these calculations were assumed to be thecompositions of phenocrysts. In other cases (e.g., maficsilicates), approximate compositions of crystallizingphases were estimated. Proportions of crystallizingphases were varied within reasonable limits and themodels described below are generally the calculated
Fig. 8. Spider-diagrams for Rooiberg Group volcanic units:a upper Dullstroom Formation, b Damwal Formation, andc Kwaggasnek Formation. Abundances are normalized to thecomposition of pyrolite (silicate earth) of McDonough and Sun(1995)
Fig. 9. Variation diagram of Hf (ppm) vs. Ti/Zr (both in ppm) forRooiberg Group volcanic units. Data for low Ti and high Tivolcanic units from Buchanan et al. (1999)
140

compositions that reproduce most closely the averagecompositions of each of the rock groups.
Model 1 was calculated to approximate the averagecomposition of the andesites and dacites of the upperDullstroom Formation. For this calculation, the averagecomposition of the low Ti suite of volcanic rocks wassubjected to 30% assimilation of VG1 and 50% crys-tallization by weight of a mixture of 60% plagioclase,20% olivine, and 20% of a mixture of subequal pro-portions of augite and pigeonite. Composition of theplagioclase ranged from Ab23 (the approximate com-position of plagioclase phenocrysts in the low Ti strata)to Ab63, that of the olivine ranged from Fo78 to Fo50,and the Mg# of the pyroxene ranged from 54 to 80. Thecalculated model 1 composition is compared with the
average composition of the dacites in Fig. 10 and inTable 4.
Model 2 was calculated in an attempt to reproducethe average composition of the dacites and rhyolites ofthe Damwal Formation. The average composition of thevolcanic rocks of the upper part of the DullstroomFormation was subjected to 30% crystallization byweight of a mixture of 65% plagioclase and 35% of amixture of subequal proportions of pigeonite and augite.Composition of the plagioclase ranged from Ab63 toAb70 and the Mg# of the pyroxene ranged from 46 to 62.The calculated composition of model 2 is compared withthe average composition of the volcanic rocks of theDamwal Formation in Fig. 10 and in Table 4.
Model 3 was calculated to approximate the averagecomposition of the rhyolites of the Kwaggasnek For-mation. The average composition of the volcanic rocksof the Damwal Formation was subjected to 25% crys-tallization by weight of a mixture of 40% albite, 10% K-feldspar, 40% augite (Wo45En10), and 10% of a mixtureof ilmenite and magnetite. Model 3 composition iscompared with the average composition of rhyolitesfrom the Kwaggasnek Formation in Fig. 10 and Table 4.It is worth noting that the abundance of phosphorus inmodel 3 is a bit higher than the average abundance ofthat element in the Kwaggasnek rhyolites. This probablyis the result of crystallization of significant, but small,proportions of apatite.
Petrogenesis
Buchanan et al. (1999) suggested that the high Ti andlow Ti volcanic rocks of the Dullstroom Formationrepresent liquids that were derived by partial melting ofcompositionally distinct source areas and probably re-sided in different magma chambers. The data presentedin the present study (e.g., Fig. 9) indicate that theoverlying intermediate to siliceous volcanic units of theBushveld Magmatic Province are not petrogeneticallyrelated to high Ti volcanic rocks, but are probablyclosely related to the low Ti suite.
Fig. 10. Spider-diagram comparing compositions of models 1–3from this study with average compositions of the dacites of theupper Dullstroom Formation, the rhyolites and dacites of theDamwal Formation, and the rhyolites of the KwaggasnekFormation. Also included is the average composition of the lowTi volcanic units of the Dullstroom Formation (Table 3). All dataare normalized to the composition of pyrolite (silicate earth) ofMcDonough and Sun (1995). See text for details of calculations
Table 4. Comparison of majorand minor element abundancesfor models 1–3 with averagecompositions of dacites of theupper Dullstroom Formation,rhyolites of the Damwal For-mation, and siliceous units ofthe Kwaggasnek Formation.b.d. Below detection limits
Sample Model 1 Avg. upperDullstroom
Model 2 Avg. Damwal Model 3 Avg. Kwaggasnek
wt%SiO2 64.2 66.3 70.5 69.2 74.6 75.6TiO2 0.90 0.63 0.90 0.56 0.25 0.27Al2O3 13.7 13.2 11.8 11.9 12.7 11.5Fe2O3
a 7.13 6.69 6.08 7.36 3.16 3.44MnO 0.22 0.12 0.17 0.13 0.17 0.04MgO 1.22 1.95 0.70 0.35 0.04 b.d.CaO 5.72 4.37 2.48 2.01 b.d. 0.10Na2O 2.82 3.08 2.11 3.24 2.75 2.68K2O 2.40 2.57 3.67 4.32 5.20 4.97P2O5 0.16 0.13 0.19 0.13 0.17 0.02LOI 1.52 1.02 1.46 0.73 0.97 1.00
Total 100.0 100.1 100.1 99.9 100.0 99.6
aAll iron reported as Fe2O3
141

Schweitzer et al. (1997) used the similarity betweenthe bulk compositions of the dacites of the upperDullstroom Formation and the continental crust (Taylorand McLennan 1985) to suggest that some of the vol-canic strata of the Rooiberg Group represent crustalmelts generated by a mantle plume. However, averageabundances of some incompatible trace elements (e.g.,the rare earth elements) in the low Ti strata (Table 3) areextremely similar to those of the estimated compositionof the lower continental crust (Taylor and McLennan1985). Hence, it is unlikely that these rocks representpartial melts of lower crustal material. In contrast, al-though the average composition of the high Ti volcanicsuite (Table 3) is generally enriched in incompatibletrace elements compared with the estimated compositionof the lower continental crust (Taylor and McLennan1985), the average abundances of SiO2 and many othermajor element oxides are similar and are difficult toreconcile with partial melting of lower crustal material.Further, the compositions of the overlying intermediateto siliceous volcanic rocks and the compositions of lowTi strata form very well defined trends on many majorand trace element variation diagrams (Figs. 5, 6, and 9).The continuity of these trends is unlikely if these vol-canic rocks represent partial melts of different sourceareas (i.e., lower crust and mantle, respectively). Hence,based on the data presented in this study it is unlikelythat any of these rocks represents a crustal melt sensustricto.
Another possible interpretation is related to the sug-gestion by Maier et al. (2000) that some magmas of thelower part of the Rustenburg Layered Suite representmixtures of mantle-derived melts with partial melts ofcrustal material. Could volcanic rocks of the RooibergGroup represent mixtures of mantle-derived melts andincreasing proportions of crustal melts with increasingstratigraphic height? Although this hypothesis explainssome of the spectrum of compositional data for thesestrata, the decrease in abundances of Al2O3 with de-creasing MgO content (Fig. 5b) requires that the crustalmelts would have had to contain significantly less than11% Al2O3 (see also Table 3). Based on a variety ofexperimental studies (e.g., Huang and Wyllie 1981), thisseems unlikely. Considering the discussion presentedabove, a more reasonable interpretation is that theserocks were affected by increasing amounts of feldsparcrystallization.
Hence, based on the model calculations presented inthe preceding section and the above discussion, the mostreasonable interpretation is that the volcanic rocks ofthe Rooiberg Group represent mantle melts that un-derwent large amounts of differentiation and assimila-tion of crustal material in two or more shallow magmachambers. This seems to be the only way to explain thevery well-defined trends formed by geochemical datafrom the low Ti suite of volcanic rocks and the overlyingintermediate to siliceous volcanic rocks. This interpre-tation may have significant implications for the petro-genesis of the related intrusive rocks of the Rustenburg
Layered Suite. Magmas that played a role in the petro-genesis of these igneous rocks also have a distinct crustalsignature (e.g., Maier et al. 2000). The data presented inthe present study indirectly confirm the suggestion byMaier et al. (2000) that some of these magmas assimi-lated significant amounts of continental crust. Thesedata also confirm the suggestion by Irvine (1982) thatthe intrusive and extrusive phases of the BushveldMagmatic Province are related and experienced similarpetrogenetic processes.
What do these features imply about the tectonicframework in which these volcanic rocks were depos-ited? On the one hand, some evidence supports amantle plume origin (Hatton 1995; Hatton andSchweitzer 1995). For example, these magmas appar-ently were very hot and very voluminous. The abun-dances of trace elements in all of these volcanic rocksbear a striking signature of continental crust. However,the data presented in this study suggest that none ofthese volcanic rocks represent crustal melts sensustricto as suggested by Schweitzer et al. (1997). Par-ticularly distinctive of these strata are the sequentialchanges with vertical stratigraphic height from moremafic compositions to siliceous compositions. Althoughthese features are consistent with a mantle plume origin(Hatton 1995), they are also consistent with a variety ofother continental environments, including subductionzones, which are noted for shallow, long-lived magmachambers (e.g., Wilson 1989). This question may beelucidated by isotopic analyses presently underway inthis laboratory.
Conclusions
1. Dacites and rhyolites of the upper Dullstroom For-mation and the Damwal and Kwaggasnek Forma-tions are petrogenetically related to the low Ti suite ofvolcanic rocks of the lower to middle DullstroomFormation. Compositions of these volcanic rockscomprise well-defined trends on a variety of variationdiagrams and they are best explained as the productsof increasing assimilation and fractional crystalliza-tion by a mantle-derived melt in a shallow, long-livedmagma chamber.
2. High Ti magmas are not petrogenetically related tothe low Ti magmas.
3. The characteristics of the volcanic rocks of theBushveld Magmatic Province are consistent withformation of these magmas in a variety of continentalsettings, including plume-related environments, butalso including subduction-related environments.
4. The data presented in this study indirectly confirmthe suggestion by Maier et al. (2000) that significantamounts of assimilation of crustal material mayhave also affected magmas associated with theRustenburg Layered Suite of the intrusive BushveldComplex.
142

Acknowledgments The University Research Council (URC) andthe Impact Cratering Research Group of the University of theWitwatersrand, Johannesburg, South Africa, provided support forP.C.B. The National Research Foundation (NRF) of the Republicof South Africa also supports W.U.R.’s research. Support wasprovided by the Austrian Fonds zur Forderung der wissenschaft-lichen Forschung, project Y58-GEO to C.K. This publicationrepresents University of the Witwatersrand Impact Cratering Re-search Group Contribution #34. Sharon Farrell and Matt Kitchingprovided excellent technical support and Lynn Whitfield and Di duToit assisted with expert drafting. Excellent reviews were providedby J.S. Marsh and W.D. Maier.
References
Anders E, Grevesse N (1989) Abundances of the elements: mete-oritic and solar. Geochim Cosmochim Acta 53:197–214
Anhaeusser CR (1983) Contributions to the geology of the Bar-berton Mountain Land. Geol Soc S Africa Spec Publ 9:223
Anhaeusser CR (1999) Archaean crustal evolution of the centralKaapvaal craton, South Africa: evidence from the Johannes-burg Dome. S Afr J Geol 102:303–322
Buchanan PC, Reimold WU (1998) Studies of the RooibergGroup, Bushveld Complex, South Africa: no evidence for animpact origin. Earth Planet Sci Lett 155:149–165
Buchanan PC, Koeberl C, Reimold WU (1999) Petrogenesis of theDullstroom Formation, Bushveld Magmatic Province, SouthAfrica. Contrib Mineral Petrol 137:133–146
Buick IS, Maas R, Gibson R (2001) Precise U–Pb titanite ageconstraints on the emplacement of the Bushveld Complex,South Africa. J Geol Soc Lond 158:3–6
Cheney ES, Twist D (1991) The conformable emplacement of theBushveld mafic rocks along a regional unconformity in theTransvaal succession of South Africa. Precambrian Res 52:115–132
Council of Geosciences (1978) 1:250,000 geologic maps (2528Pretoria and 2428 Nylstroom sheets). Pretoria, South Africa
DePaolo DJ (1981) Trace element and isotopic effects of combinedwallrock assimilation and fractional crystallization. EarthPlanet Sci Lett 53:189–202
Elston WE (1992) Does the Bushveld–Vredefort system (SouthAfrica) record the largest known terrestrial impact catastrophe(abs)? International Conference on Large Meteorite Impactsand Planetary Evolution. Lunar Planet Inst Contrib 790:23–24
Eriksson PG, Schreiber UM, Reczko BFF, Snyman CP (1994)Petrography and geochemistry of sandstones interbedded withthe Rooiberg Felsite Group (Transvaal Sequence, South Afri-ca): implications for provenance and tectonic setting. J Sedi-ment Res A64:836–846
Harmer RE, von Gruenewaldt G (1991) A review of magmatismassociated with the Transvaal Basin – implications for its tec-tonic setting. S Africa J Geol 94:104–122
Hart RJ, Andreoli MAG, Tredoux M, De Wit MJ (1990) Geo-chemistry across an exposed section of Archaean crust atVredefort. Chem Geol 82:21–50
Hatton CJ (1988) Formation of the Bushveld Complex at a platemargin (abs). Congr Geol Soc S Afr 22:251–254
Hatton CJ (1995) Mantle plume origin for the Bushveld andVentersdorp magmatic provinces. J African Earth Sci 21:571–577
Hatton CJ, Schweitzer JK (1995) Evidence for synchronous ex-trusive and intrusive Bushveld magmatism. J African Earth Sci21:579–594
Huang WL, Wyllie PJ (1981) Phase relationships of S-type granitewith H2O to 35 kbar: muscovite granite from Harney Peak,South Dakota. J Geophys Res 86:10515–10529
Irvine TN (1982) Terminology of layered intrusions. J Petrol23:127–162
Le Bas MJ, Le Maitre RW, Streckeisen A, Zanettin B (1986) Achemical classification of volcanic rocks based on the total al-kali–silica diagram. J Petrol 27:745–750
Maier WD, Arndt NT, Curl EA (2000) Progressive crustal con-tamination of the Bushveld Complex: evidence from Nd iso-topic analyses of the cumulate rocks. Contrib Mineral Petrol140:316–327
McDonough WF, Sun S-S (1995) The composition of the Earth.Chem Geol 120:223–253
Rhodes RC (1975) New evidence for impact origin of the BushveldComplex, South Africa. Geology 3:549–554
Schweitzer JK, Hatton CJ (1995) Chemical alteration within thevolcanic roof rocks of the Bushveld Complex. Econ Geol90:2218–2231
Schweitzer JK, Hatton CJ, de Waal SA (1995) Regional litho-chemical stratigraphy of the Rooiberg Group, upper TransvaalSupergroup: a proposed new subdivision. S Afr J Geol 98:245–255
Schweitzer JK, Hatton CJ, de Waal SA (1997) Link between thegranitic and volcanic rocks of the Bushveld Complex, SouthAfrica. J Afr Earth Sci 24:95–104
Tankard AJ, Jackson MPA, Eriksson KA, Hobday DK, HunterDR, Minter WEL (1982) Crustal evolution of southern Africa:3.8 billion years of Earth history. Springer, Berlin HeidelbergNew York
Taylor SR, McLennan SM (1985) The continental crust: its com-position and evolution. Blackwell, Oxford
Twist D (1985) Geochemical evolution of the Rooiberg silicic lavasin the Loskop Dam area, southeastern Bushveld. Econ Geol80:1153–1165
Walraven F (1997) Geochronology of the Rooiberg Group,Transvaal Supergroup, South Africa. Information Circular 316,Economic Geology Research Unit, University of the Witwa-tersrand, Johannesburg, South Africa
Walraven F, Retief EA, Burger AJ, Swanepoel DJ de V (1987)Implications of new U–Pb zircon age dating on the NeboGranite of the Bushveld Complex. Trans Geol Soc S Africa90:344–351
Walraven F, Armstrong RA, Kruger FJ (1990) A chronostrati-graphic framework for the north-central Kaapvaal craton, theBushveld Complex and the Vredefort structure. Tectonophysics171:23–48
Wilson M (1989) Igneous petrogenesis: a global tectonic approach.Unwin Hyman, London
143