pb+j = alteryx & tableau
TRANSCRIPT

© G M Yogma https://www.flickr.com/photos/yogma/

StephenWagnerInformation Management & Analytics Consultant
Data Visualization and Discovery Information Strategy
Data Management Business Intelligence
Analytics Information Governance
Slalom Consulting is an international business and technology consulting firm
@analyticswagner

A single workflow for
data blending, analytics, and reporting
© Chris Jagers https://www.flickr.com/photos/chrisjagers/

+ Explore
+ Visualize
+ Share
+ Acquire
+ Join
+ Manipulate

© Caitlin http://www.hardlyhousewives.com
Measuring the performance
of a direct mail campaign

+ How did each list perform?
+ Channel people are converting on?
+ Who are our top customers?
© Dave King https://www.flickr.com/photos/djking/

Help you go from this . . .

. . . to this
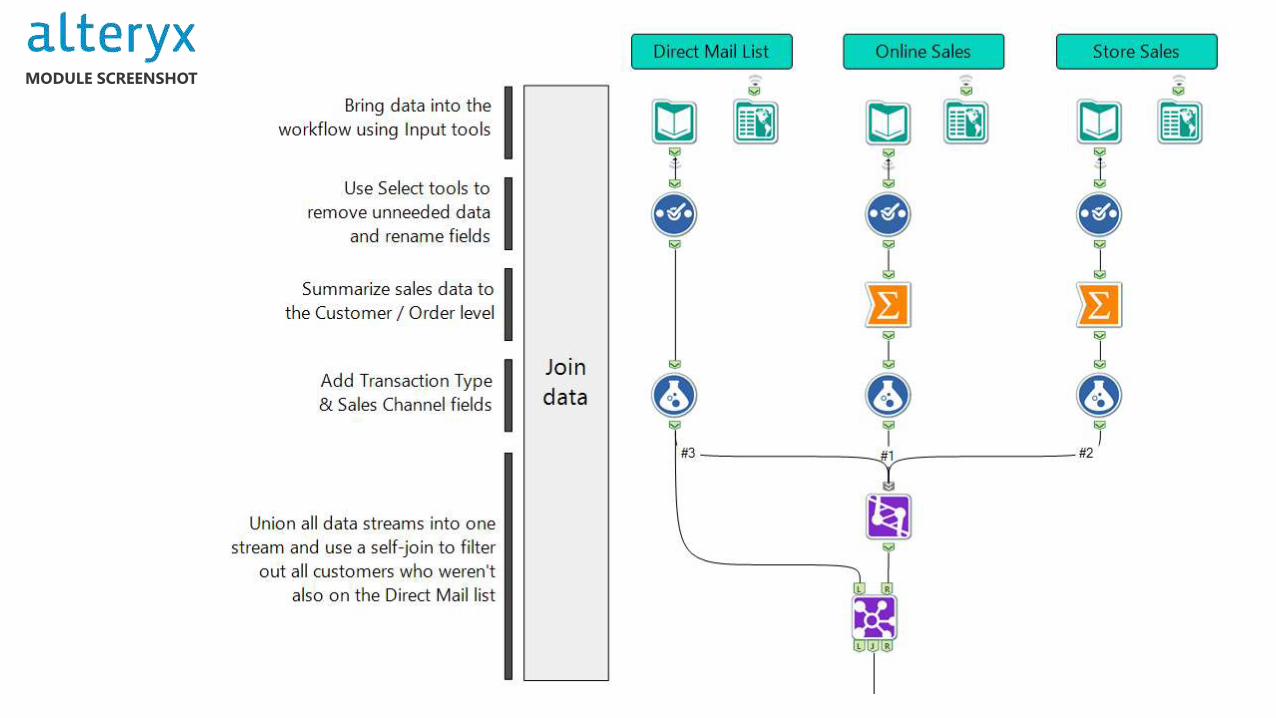
MODULE SCREENSHOT
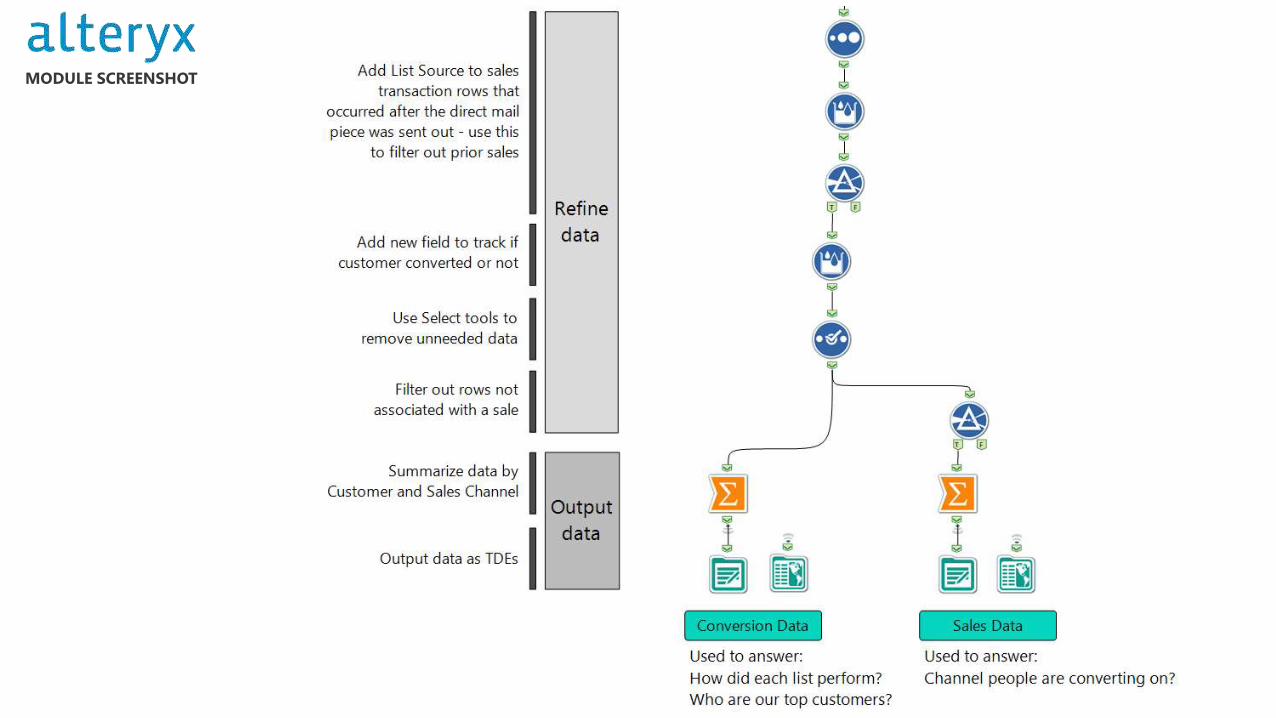
MODULE SCREENSHOT
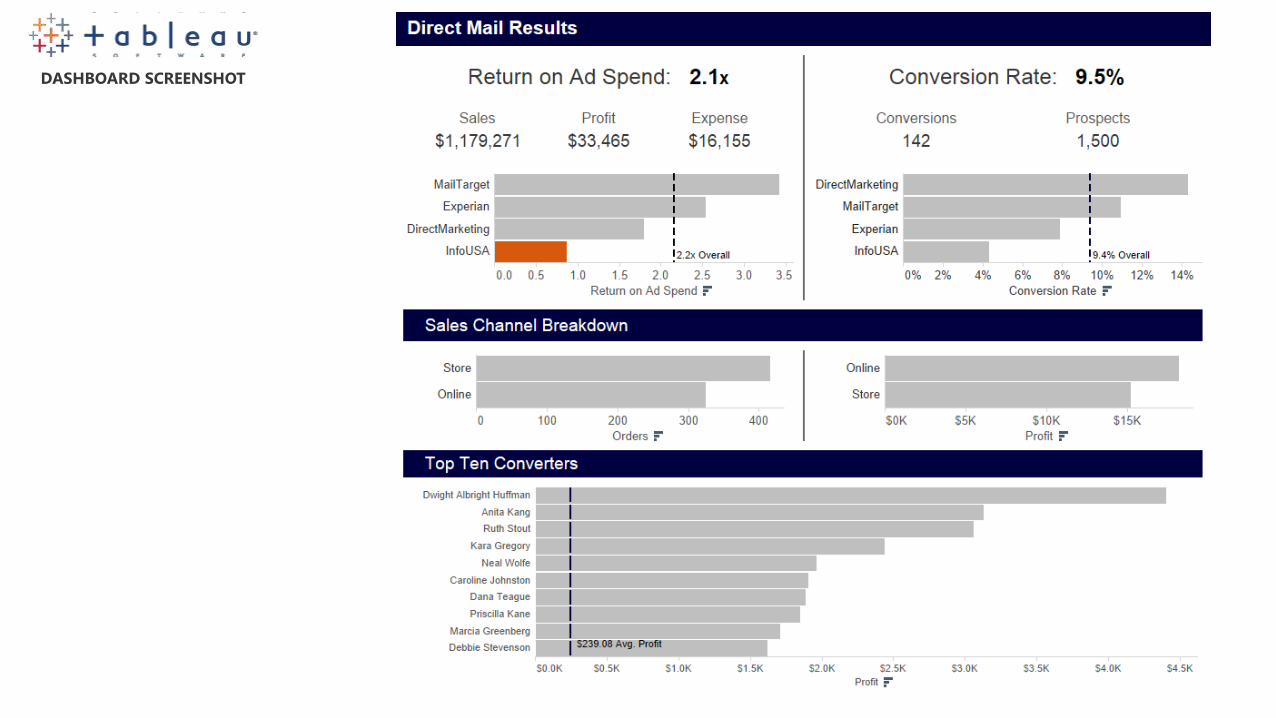
DASHBOARD SCREENSHOT