pbg 650 advanced plant breeding module 6: quantitative genetics – environmental variance –...
TRANSCRIPT

PBG 650 Advanced Plant Breeding
Module 6: Quantitative Genetics– Environmental variance– Heritability– Covariance among relatives
More interactions
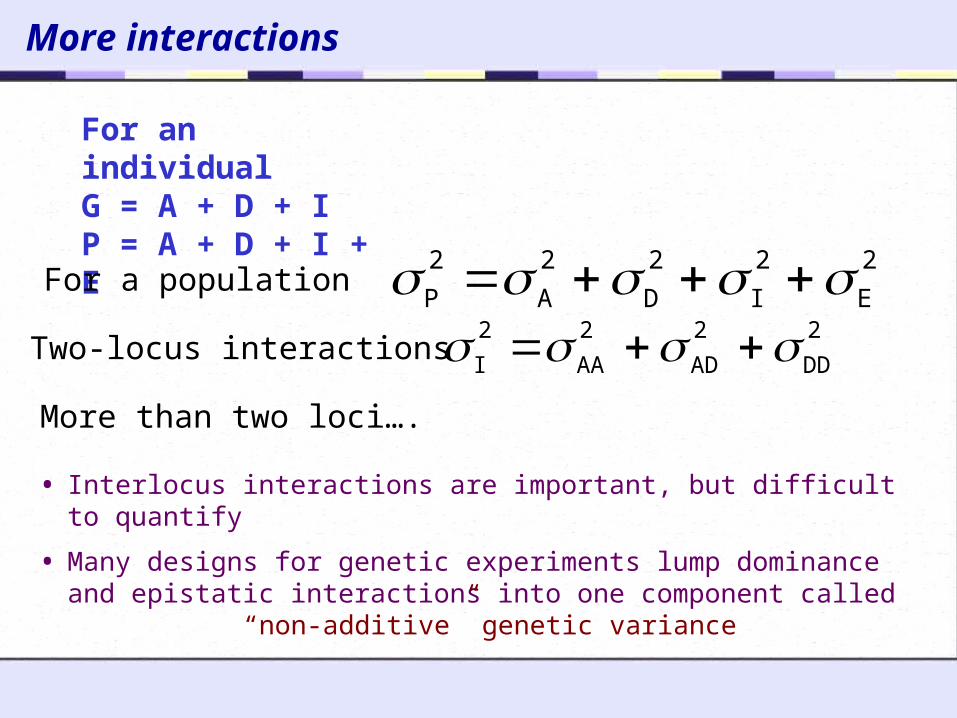
• Interlocus interactions are important, but difficult to quantify
• Many designs for genetic experiments lump dominance and epistatic interactions into one component called “non-additive” genetic variance
For an individualG = A + D + IP = A + D + I + E
2
E
2
I
2
D
2
A
2
P For a population
2
DD
2
AD
2
AA
2
I Two-locus interactions
More than two loci….

Genetic variances from a factorial model
Bernardo, Chapt. 5
Source of Variation Degrees of Freedom Variance Component
A locus main effect 2 2locusAD
2locusAA )()(
A linear 1 2locusAA )(
A quadratic (deviations) 1 2locusAD )(
B locus main effect 2 2locusBD
2locusBA )()(
B linear 1 2locusBA )(
B quadratic (deviations) 1 2locusBD )(
A x B interaction 4 2I
A linear x B linear 1 2AA
A linear x B quadratic 1 2
AD (pooled) A quadratic x B linear 1
A quadratic x B quadratic 1 2DD
Environmental variance
GE
2
E
2
G
2
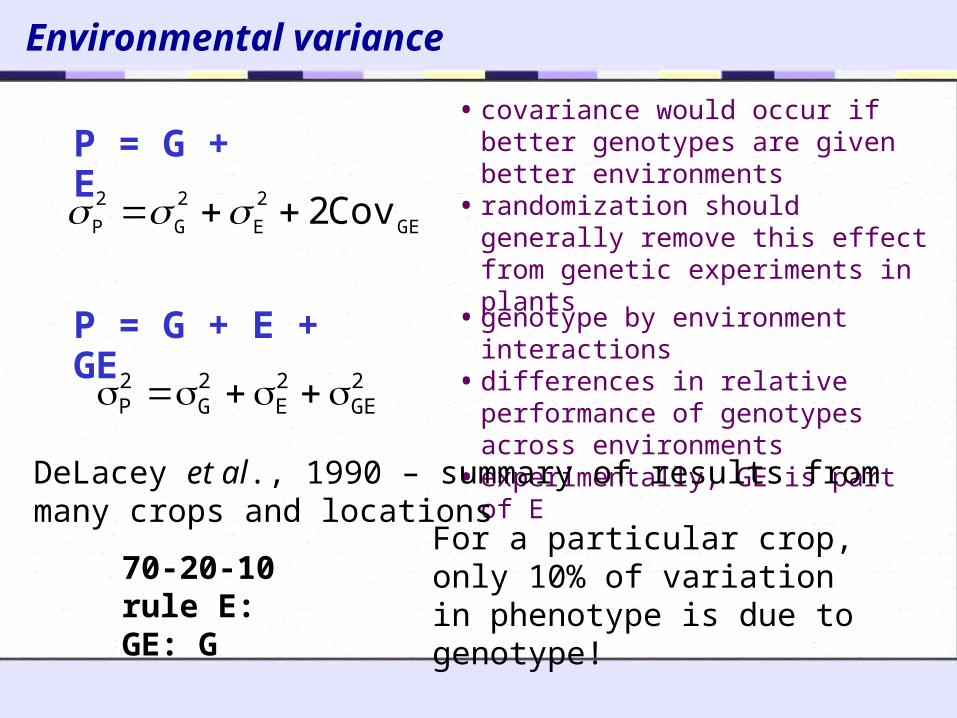
P Cov2
P = G + E• covariance would occur if better
genotypes are given better environments
• randomization should generally remove this effect from genetic experiments in plants
P = G + E + GE2GE
2E
2G
2P
• genotype by environment interactions• differences in relative performance of
genotypes across environments• experimentally, GE is part of E
DeLacey et al., 1990 – summary of results from many crops and locations
70-20-10 rule E: GE: G
For a particular crop, only 10% of variation in phenotype is due to genotype!
Repeatability
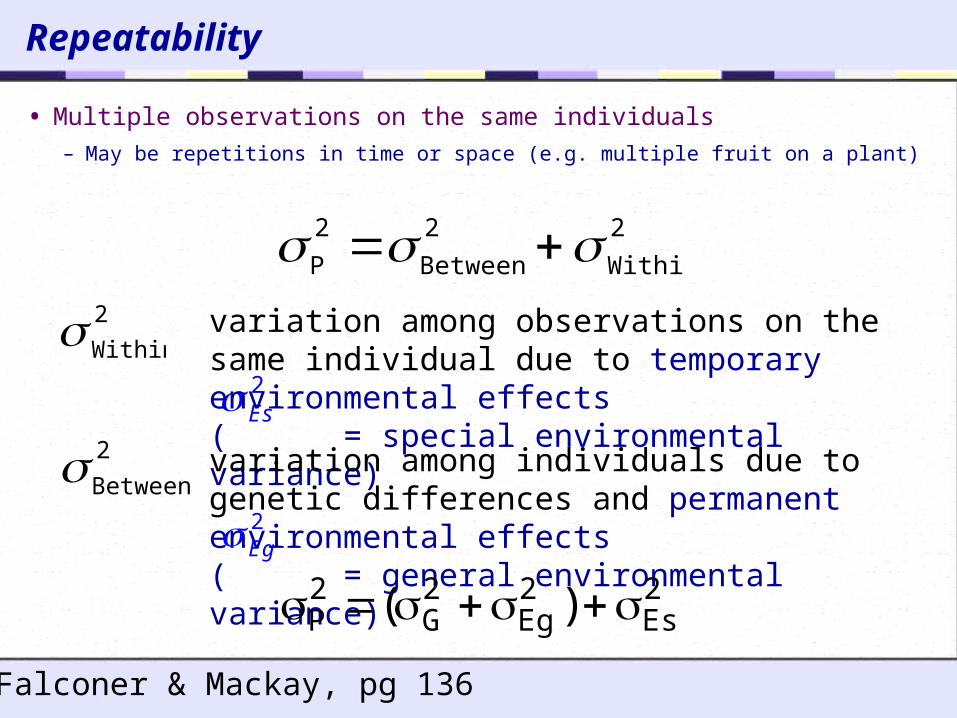
• Multiple observations on the same individuals
– May be repetitions in time or space (e.g. multiple fruit on a plant)
2Es
2
Within
2
Between
2
P 2
Within variation among observations on the same individual due to temporary environmental effects( = special environmental variance)
2
Between variation among individuals due to genetic differences and permanent environmental effects( = general environmental variance)
Falconer & Mackay, pg 136
2Es
2Eg
2G
2P )(
2Eg
Repeatability
2Es
2G
2Es
2Eg
2G
2P )(
2P
2Eg
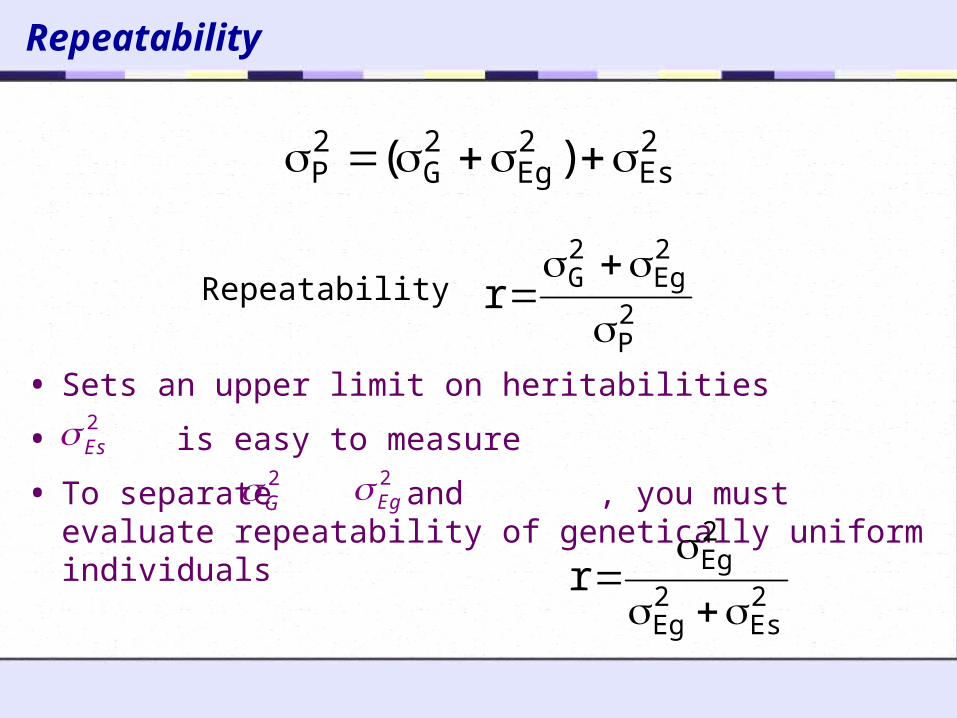
2Gr
Repeatability
• Sets an upper limit on heritabilities
• is easy to measure
• To separate and , you must evaluate repeatability of genetically uniform individuals
2Es
2Eg
2Egr
2Eg

Gain from multiple measurements
• Multiple measurements can increase precision and increase heritability (by reducing environmental and phenotypic variation)
• Greatest benefits are obtained for measurements that have low repeatability (large )
2Esn
12Eg
2G
2nP )()(
n
)1n(r12
P
2
)n(P
fyi
2Es

Heritability
• For an individual: P = A + D + I + E
• For a population:
• Broad sense heritability
– degree of genetic determination
• Narrow sense heritability– extent to which phenotype is determined by genes transmitted from the parents
2E
2I
2D
2A
2P
2G
2P
2GH
2P
2A2h
“heritability”
Falconer & Mackay, Chapter 8

h2 = the regression of breeding value on phenotypic value
Narrow sense heritability – another view
h2=0.5
h2=0.3
+1
+2
h2 is trait specific, population specific, and greatly influenced by the choice of testing environments
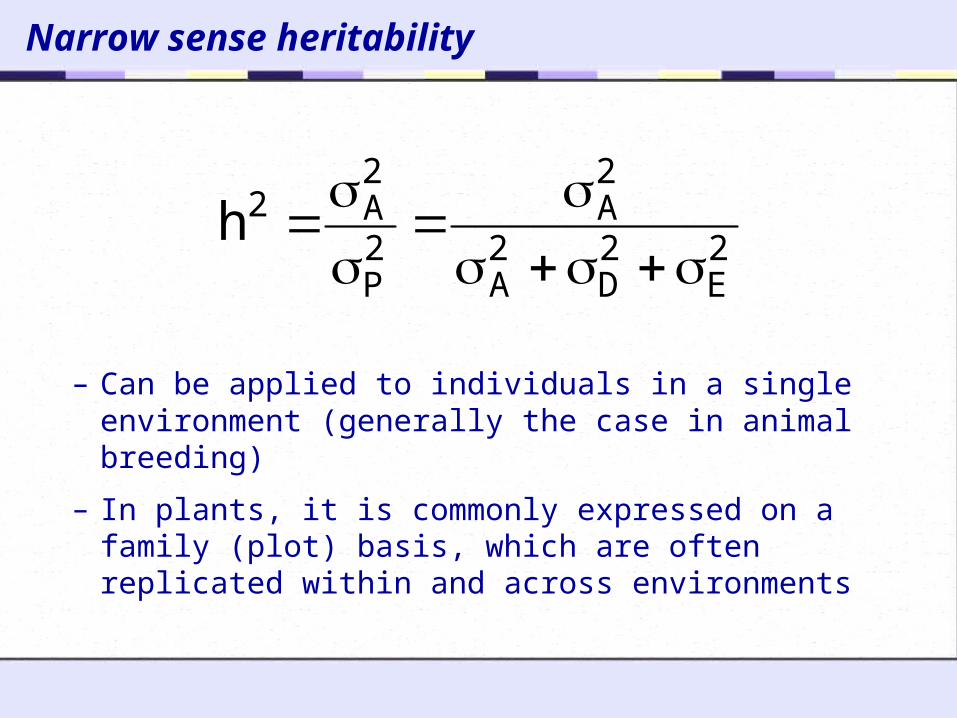
Narrow sense heritability
2E
2D
2A
2A
2P
2A2h
– Can be applied to individuals in a single environment (generally the case in animal breeding)
– In plants, it is commonly expressed on a family (plot) basis, which are often replicated within and across environments

Heritability in plants - complications
• Different mating systems, including varying degrees of selfing
• Different ploidy levels
• Annuals, perennials
• For many crops, measurement of some traits is only meaningful with competition, in a full stand
– variables such as yield are measured on a plot basis
– other traits are averages of multiple plants/plot
– plot size varies from one experiment to the next
• Replicates are evaluated in different microenvironments
• Genotype x environment interaction is prevalent for many important crop traits
Nyquist, 1991; Holland et al., 2003

Heritability in plants - definition
• Fraction of the selection differential that is gained when selection is practiced on a defined reference unit (Hanson, 1963)
Selection Differential S=s-0
Selection Response R=1-0
Y=bX
R=Sbyx
R/S=h2=byx
• Main purpose for estimating heritability is to make predictions about selection response under varying scenarios, in order to design the optimum selection strategy
R=h2S
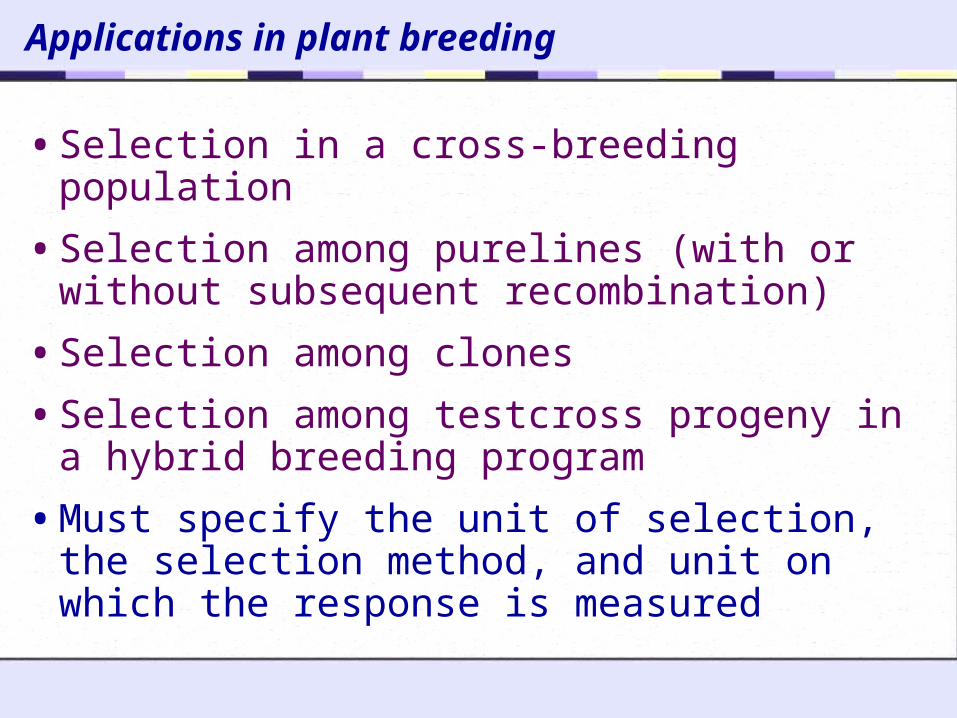
Applications in plant breeding
• Selection in a cross-breeding population
• Selection among purelines (with or without subsequent recombination)
• Selection among clones
• Selection among testcross progeny in a hybrid breeding program
• Must specify the unit of selection, the selection method, and unit on which the response is measured

Heritability of a genotype mean
2 2
22
2 GL e
G
l rlG
H
2 22 2 GL e
P G l rl
2 2
22
2 GL e
A
l rlG
h
Error varianceGXE
broad sense heritability narrow sense heritability or “heritability”

Resemblance between Relatives
• Covariance between relatives measures degree of genetic resemblance
• Variance among groups = covariance within groups
2
W
2
B
2
Bt
Intraclass correlationof phenotypic values
Strategy:
• Determine expected covariance among relatives from theory, and compare to experimental observations
• Estimate genetic variances and heritabilities
Falconer & Mackay, Chapt. 9

Covariance between offspring and one parent
Genotype Frequency Genotypic Value Breeding
Value
Mean Genotypic Value of Offspring
A1A1 p2 2q(-qd) 2q qA1A2 2pq (q-p)+2pqd (q - p) (1/2)(q - p)A2A2 q2 -2p(+pd) -2p -p
CovOP=p2*2q(-qd)q+2pq[(q-p)+2pqd](1/2)(q - p) +q2[-2p(+pd)](-p)
CovOP = pq2 = (1/2)σA2
This result is true for a single offspring and for the mean of any number of offspring
i i i X YCov(X,Y) f X Y μ μ

Resemblance between offspring and one parent
• For parents and offspring, observations occur in pairs
• Regression is more useful than the intraclass correlation as a measure of resemblance
– does not depend on the number of offspring
– does not require parents and offspring to have the same variance
2
P
2
A21
2
P
)P,O(Covb
phenotypic
variance of the parental population
Estimate
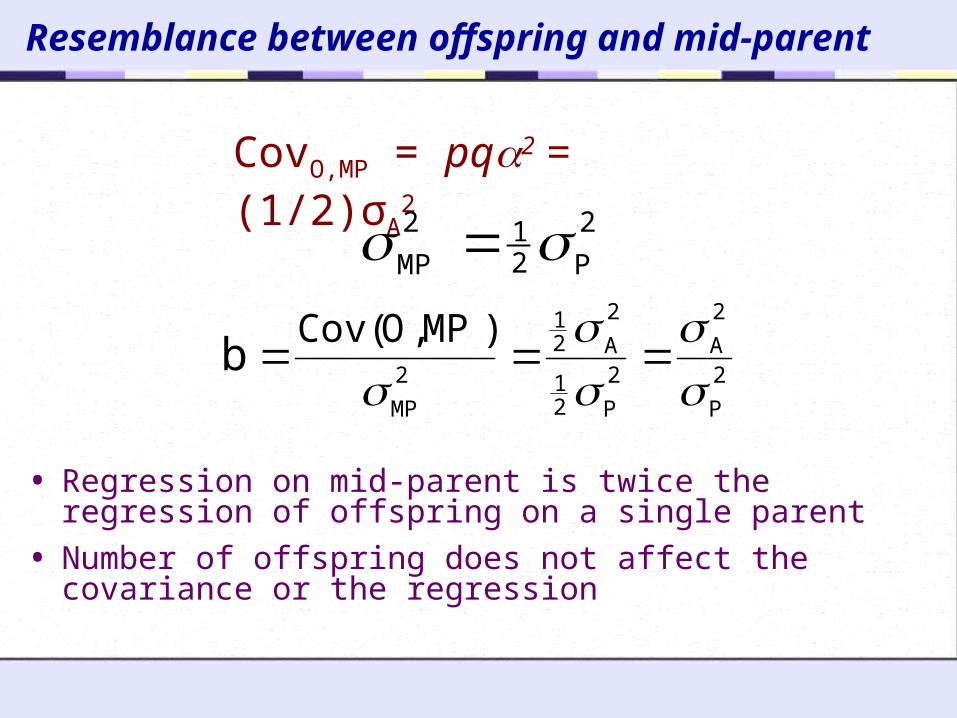
Resemblance between offspring and mid-parent
• Regression on mid-parent is twice the regression of offspring on a single parent
• Number of offspring does not affect the covariance or the regression
CovO,MP = pq2 = (1/2)σA2
2
P212
MP
2
P
2
A2
P21
2
A21
2
MP
)MP,O(Covb
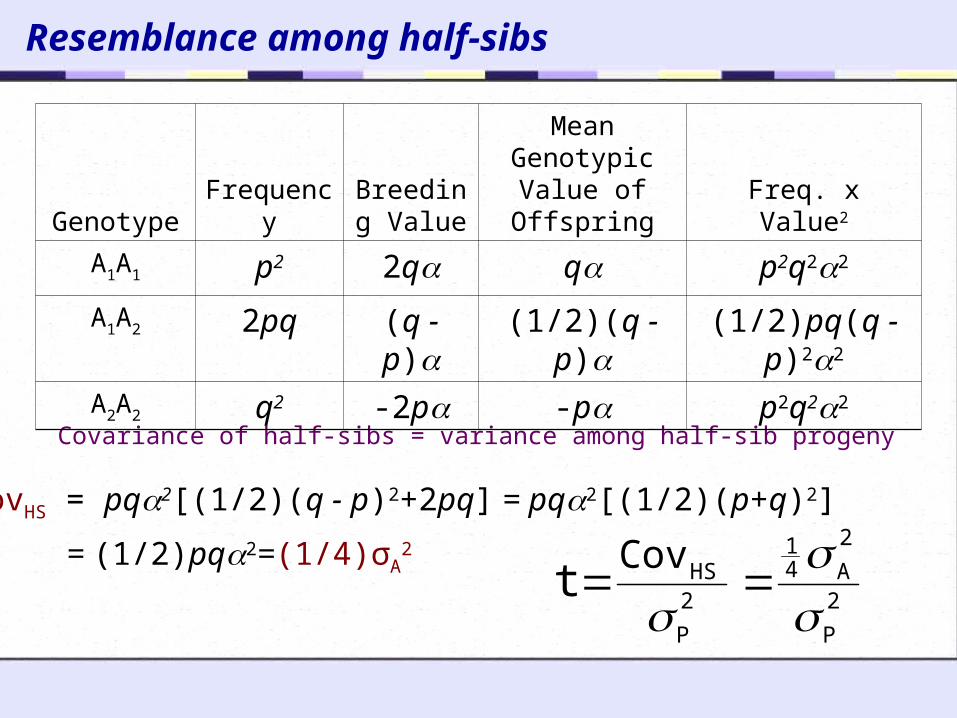
Resemblance among half-sibs
Covariance of half-sibs = variance among half-sib progeny
Genotype FrequencyBreeding
Value
Mean Genotypic Value of Offspring Freq. x Value2
A1A1 p2 2q q p2q22
A1A2 2pq (q - p) (1/2)(q - p) (1/2)pq(q - p)22
A2A2 q2 -2p -p p2q22
CovHS = pq2[(1/2)(q - p)2+2pq] = pq2[(1/2)(p+q)2]
= (1/2)pq2=(1/4)σA2
2
P
2
A41
2
P
HSCovt

Resemblance among full-sibs
Progeny
Genotype of parents
Frequency of mating
A1A1
aA1A2
dA2A2
-aMean Value of Progeny
A1A1 A1A1 p4 1 a
A1A1 A1A2 4p3q 1/2 1/2 (1/2)(a+d)
A1A1 A2A2 2p2q2 1 d
A1A2 A1A2 4p2q2 1/4 1/2 1/4 (1/2)d
A1A2 A2A2 4pq3 1/2 1/2 (1/2)(d-a)
A2A2 A2A2 q4 1 -a
CovFS= σFS2 = p4a2+4p3q[(1/2)(a+d)]2….+q4(-a)2 - 2
= pq[a+d(q-p)]2 + p2q2d2

Resemblance among full-sibs
222 dqpp-qdapq 4222
G
2
D412
A212
FSFSCov
2
P
2
D412
A21
2
P
FSCovt
CovFS= σFS2 = p4a2+4p3q[(1/2)(a+d)]2….+q4(-a)2 - 2
= pq[a+d(q-p)]2 + p2q2d2
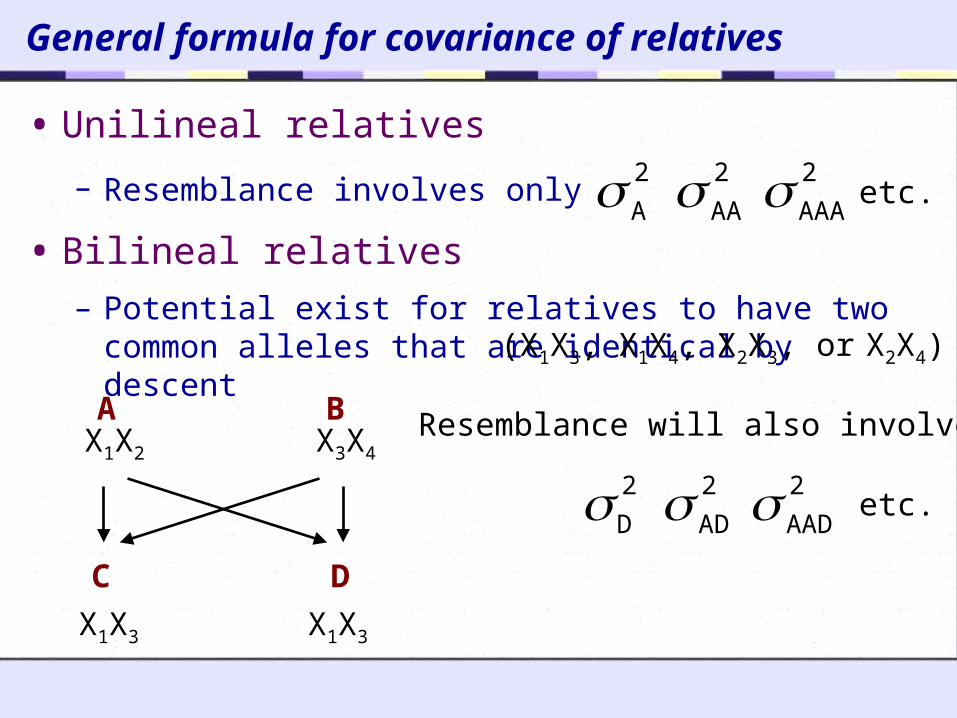
General formula for covariance of relatives
• Unilineal relatives
– Resemblance involves only
• Bilineal relatives
– Potential exist for relatives to have two common alleles that are identical by descent
2
A 2
AA 2
AAA etc.
A
C
B
D
X1X2 X3X4
(X1X3, X1X4, X2X3, or X2X4)
X1X3 X1X3
2
D 2
AD 2
AAD etc.
Resemblance will also involve:
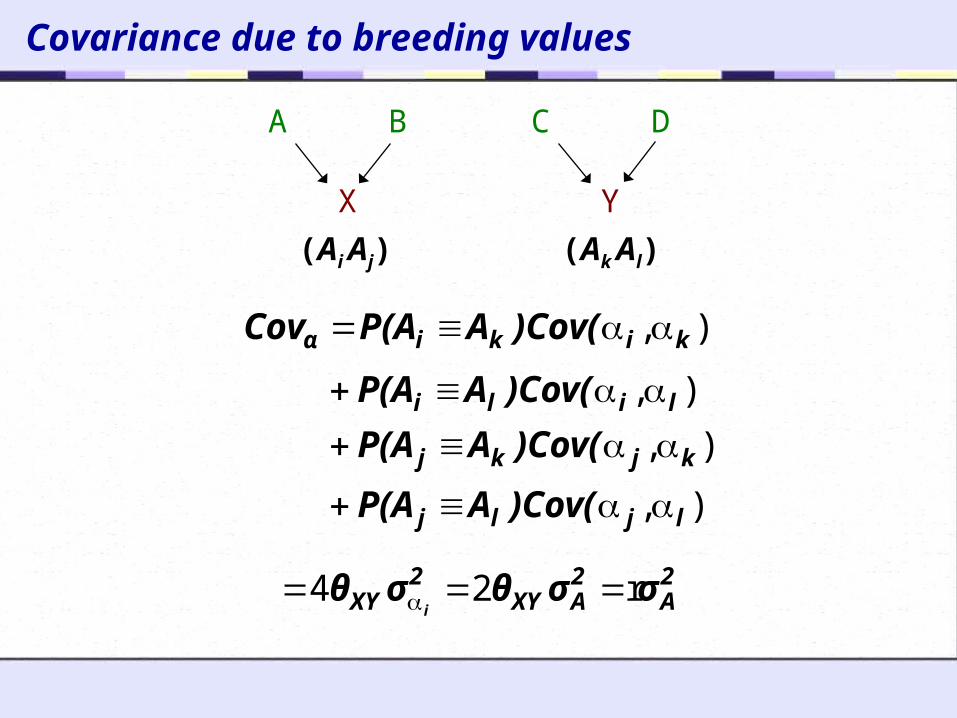
Covariance due to breeding values
A B C D
X Y
), kikiα )Cov(AP(ACov
),
),
),
ljlj
kjkj
lili
)Cov(AP(A
)Cov(AP(A
)Cov(AP(A
(Ai Aj) (Ak Al)
2A
2AXY
2XY σσθσθ
ir24

Covariance due to dominance deviations
A B C D
X Y
), klijljki )Cov(AA,AP(ACov
(Ai Aj) (Ak Al)
2DBCADBDAC σθθθθ )(
), klijkjli )Cov(AA,AP(A
2DXY σ
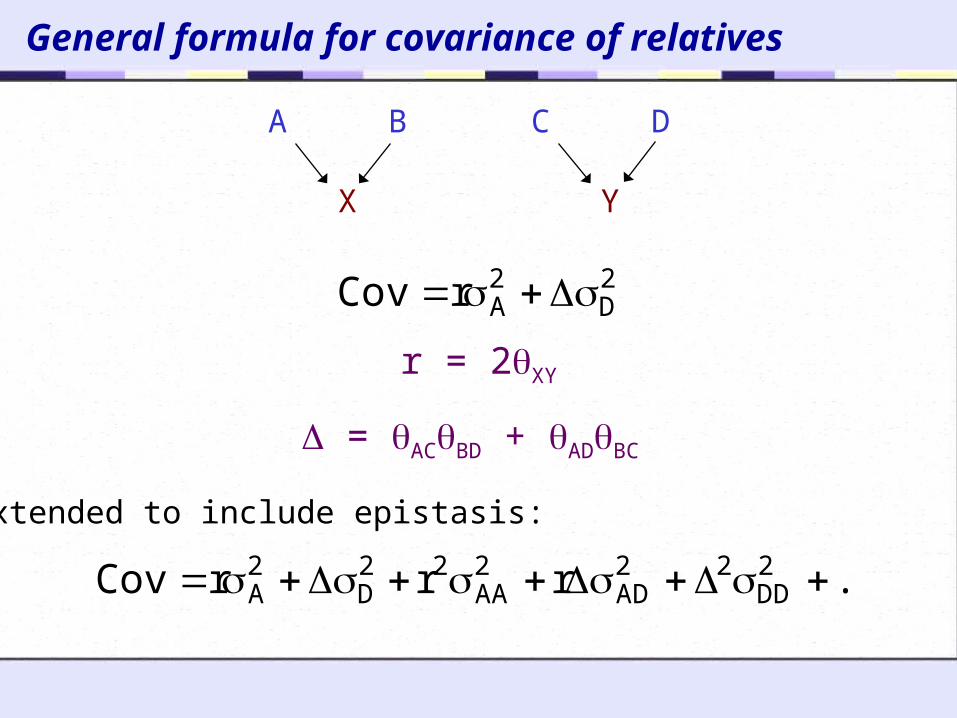
General formula for covariance of relatives
2D
2ArCov
A B C D
X Y
r = 2XY
= ACBD + ADBC
Extended to include epistasis:
... 2DD
22AD
2AA
22D
2A rrrCov

Adjusting coefficients for inbreeding
Relatives r = 2XY Parent-offspring 1/2 0
Half-sibs
Common parent not inbred 1/4 0
Common parent inbred (1+F)/4
Full-sibs
Parents not inbred 1/2 1/4
Parents inbred (2+FA+FB)/4 (1+FA)(1+FB)/4
2
A 2
D