pays couintt - northwestern university...
TRANSCRIPT

-114-
Tableau 50. SOIE GRAGE. - Table 50. RAW SILK.Production ou exportation en tonnes metriques. - Production or Exports in metric tons.
PAYS 1920 | 1921 1922 1923 1924 1925 1926 | 1927 1928 1929 COUINTT
ASIE '..... 34,810 37,761 42,750 46,215 48,513 52,475 * 54,900 ASIA. 1Coree * 2 ... 455 450 485 665 777 909 1,011 1,132 1,192 ... Korea. * Japon . 21,877 23,395 23,991 25,335 28,414 31,066 34,349 37,051 39,691 42,346 Japan.Syrie et Chypre . . . . 185 270 250 265 270 280 290 Syria and Cyprus.Turquie ...... 60 90 95 70 80 125 135 Turkey.
Chine * (E.) . 6,305 9,130 8,675 8,370 7,935 10,155 10,190 9,675 10,897 11,490 China.* (E.)Inde (E.) . . . . 80 85 75 50 35 30 55 80 60 20 Brit. India. (E.) 3Indochine (E.) 4 15 20 25 40 45 60 65 60 50 40 Indo-China. (E.) 'Turkestan, Cancase. Turkestan, Caucasiaet Perse (E.) . . . . .105 195 185 210 165 180 325 and Persia. (E.)
EUROPE... . . . . ,513 6,020 5,123 4,580 5,445 5,630 5,660 EUROPE.Espagne . . .. 80 60 77 70 95 100 85 83 79 74 Spain.France . . . . . . 250 195 198 255 335 260 240 295 205 195 France.Gr6ce ....... 35 56 58 75 88 100 125 175 175 Greece.Itali. . . ... 3,326 3,206 3,735 4,900 5,255 4,380 3,855 4,627 4,836 4,826 Italy.Autres pays . .. 230 260 295 300 315 335 390 Other countries. 5
TOTAL ...... 40,323 43,781 47,873 50,795 53,958 58,105 *60,560 TOTAL.
Prix en francs-or Price in gold francspour 1 kg. per 1 kg.
MILAN 6 MILANO 6classique 8/10 a 12/14, Classic 8/10 to 12/14.XII. . ... ... . .86.04 68.82 76.93 73.91 52.35 60.36 48.17 XII.
SOURCES: Union des Marchands de soie de Lyon: Statistique de la production de la soie en France et a l'etranger. Annuaireinternational de statistique agricole. International Year-Book of Agricultural Statistics. - Statistiques nationales de com-merce. National trade statistics. - Financial and Economic Annual of Japan.* Estimation. - Estimate. (E.) Exportations. - Exports.1 Asie: totaux repr6sentant en partie des exportations et 1 Asia: totals represent in part exports and are consequentlypar consequent trop bas. Le chiffre correspondant pour 1913 too low. The corresponding figure for 1913 was 2.5 millionest de 2,5 millions de tonnes, tandis que la production totale tons, while total production was estimated at 9-9.5 millions.6tait estim6e i 9-9,5 millions de tonnes. Ii est probable que la It is probable that the production has not increased sinceproduction n'a pas augments depuis 1913 proportionnellement 1913 in proportion to the fraction thereof shown in thet la fraction qui est donn6e dans le tableau. table.2 Cor6e: chiffres calcules d'apr6s la production de cocons. 2 Korea: estimated on basis of production of cocoons.3 Inde: exportations du Bengale et du Cachemire. India: exports from Bengal and Kashmir.' Indochine: exportations des ports principaux. 4 Indo-China: exports from principal harbours.Comprend l'Autriche, la Bulgarie, la Hongrie, la Roumanie 5 Austria, Bulgaria, Hungary, Roumania and Yugo-et la Yougoslavie. slavia.6 Italie : prix fin 1930, 30,44 frs. or. 6 Italy : price end 1930, 30.44 gold francs.
Tableau 51. SOIE ARTIFICIELLE. - Table 51. ARTIFICIAL SILK.Production en tonnes m6triques. Production in metric tons.
PAYS 1922 1923 1924 1925 1926 1927 1928 1929 * 1930 COUNTRY
AMIRIQUE DU NORD . . . 24,127 29,891 35,450 46,107 57,298 56,271 NORTH AMERICA.Canada . . . . 585 1,021 1,179 1,700 1,930 2,430 Canada.Etats-Unis . . 11,070 16,546 17,461 23,542 28,870 34,271 44,407 55,368 53,841 United States.
ASIE: Japon*. . 110 360 910 1,270 2,495 3,630 5,440 13,970 15.785 ASIA: Japan*.
EUROPE ..... * 24,900* 32,500 48,800 61,150 69,900 95,400 114,900 129,550 124,000 EUROPE. Allemagne . 5,710 5,900 10,740 11,790 13,600 18,200 23,800 25,000 27,000 Germany.Autriche . . 710 1,130 1,200 1,200 1,590 1,590 1,810 1,590 740 Austria.Belgique . . 2,800 3,500 4,000 5,000 6,000 7,500 6,800 7,300 5,414 Belgium.Espagne . . . 84 84 136 454 680 1,360 1,749 Spain.France . . . 2,854 4,000 6,000 6,500 7,940 9,525 13,620 16,780 18,144 France.Grece. . . 23 14 - 45 45 Greece.Hongrie . . 300 400 250 300 300 400 300 295 250 Hungary.Italie . . 2,854 4,830 10,450 13,850 16,682 24,406 25,999 32,342 30,139 Italy.Pays-Bas . . 1,141 1,792 1,530 4,000 6,120 7,480 8,165 9,070 8,165 Netherlands.Pologne . . 350 550 850 1,050 910 1,810 2,950 2,200 2,670 Poland.Royaume-Uni . 6,957 7,713 11,195 13,500 11,570 17,600 23,590 25,810 22,225 United Kingdom.Sude . . . 32 62 105 104 138 151 156 211 Sweden.Suisse . . . 856 1,679 1,820 2,800 3,630 4,690 5,440 5,560 4,830 Switzerland.Tch6coslovaquie 286 907 588 957 1,250 1,590 1,590 2,040 2,500 Czechoslovakia.
MONDE ENTIER . . * 36,100* 49,400 * 67,200 86,600 102,300 134,500 166,500 200,800 *196,000 WORLD,
SOURCES: Statistiques officielles nationales. - Bulletin International du Coton. - Renseignements fournis pour la Confe-rence economique.SOURCES: National official statistics. - International Cotton Bulletin. - Information supplied for the World EconomicConference.* Estimation ou chiffre provisoire.- Estimate or provisional figure.
Europe: non compris U. R. S. .. Europe: excluding U.S.S.R.

- 115
Tableau 52. PATE DE BOIS (ehimique et m6canique).Table 52. WOOD PULP (Chemical and Mechanical).
Production en milliers de tonnes m6triques (poids sec). - Production in metric tons (000's, dry weight)
1923 1924 1925 1926 1927 1928 1929
Chim. 2,971 3,098 3,259 3,608 3,661 3,642 * 3,910 Chem.AMPRIQUE DU NORD ) M6c. 2,804 2,984 3,132 3,645 3,347 3,545 * 3,810 Mec. NORTH AMERICA.Total 6,775 6,082 6,391 7,153 6,908 7,187 * 7,720 Total
Canada . .... Chim. 918 895 984 1,135 1,160 1,247 1,362 Chem. CMcC. 1,288 1,295 1,471 1.,725 1,744 1,930 2,196 Mec. Canada.Etats-Unis. . Chim. 2,017 2,168 2,240 2,427 2,348 2,343 2,493 Chem. United States.M6c. 1,427 1,586 1,551 1,678 1,442 1,457 1,455 Mec Unite d States.Terre-Neiuve , Chim. 36 35 35 46 53 52 ... Chem. MTerr e . . M6c. 89 103 110 142 161 158 .. .Mec. Newfoundland.
AMRRIQUE CENTRALE ( Chim. 10 10 15 15 20 20 Chem. ET DU SUD * . . . C. 20 20 30 30 30 30 ... Mec CARIBBEAN ANDTotal 30 30 4 45 0 50 ... Total SOUTH AMERICA.*
Chim. 180 186 207 263 292 315 * 342 Chem.ASIE (Japon) .... M. . Mc. 190 187 218 239 244 241 * 277 Mec. ASIA (Japan).Total 370 373 425 502 536 556 * 619 Total
Chim. 2,941 3,306 3,784 4,105 4,499 4,571 * 5,340 Chem.EUROPE 1. M6c. 1,697 1,989 2,230 2,357 2,552 2,679 * 2,960 Mec. EUROPE. Total 4,638 5,295 6,014 6,462 7,051 7,250 * 8,300 Total
Allemagne. . Chim. 675 732 913 971 1,073 1,149 1,204 Chem. GermanM6c. 459 575 737 727 818 837 852 Mec. Germany.Autriche . ... Chim. 128 149 176 183 193 207 224 Chem. Arc M6c. 82 83 89 96 95 104 104 Mec. Austria.
Estonie . Chim. 0 16 14 26 40 50 Chem Estonia.M6c. 9 16 19 18 20 22 18 Mec. Estonia.Finlande. Chim. 318 344 397 443 495 584 625 Chem. M6c. 208 222 227 232 282 312 348 Mec. Finland.Lettonie. .... Total . . (14) (15) (19) (20) Total Latvia.Norvge . Chim. 327 274 372 333 373 405 447 Chem... Mec. 370 385 440 422 446 477 511 Mec. Norway.Pays-Bags 2 . . Chim. 26 32 38 42 45 47 48 Chem Netherlands.Pays-Bs M6c. 25 28 28 33 38 42 44 Mec. Netherlands. ·Poloine .. . .. Chim . 35 36 46 48 53 59 64 Chem. Poland.Pologne.. M c . . . . (32) (38) (45) Mec. Poland.
Roumanie. . . Chim. 25 25 28 80 72 84 ... Chem Roumana.I M6c. 4 4 4 70 36 43 ... Mec. Roumania.Royaume-Uni. Chim. 108 120 117 120 145 140 ... hem. United ingdom.. . .Mc. — — - - __ - _ - Mec. United Kingdom.
Sude.. . .. Chim. 994 1,246 1,294 1,450 1,579 1,359 1,882 Chem. . M6c. 378 450 439 477 524 541 658 Mec. Sweden.Suisse . . Chim. 25 37 40 42 41 46 45 Chem itzerlad.M6c. 5 20 23 24 25 30 30 Mec. Switzerland.Tch6coslovaquie . Chim. 135 150 192 190 200 235 ... Chem Czechoslvakia.M6c. 25 44 50 53 50 50 ... Mec. Czechoslovakia.U.R.S. .S.S Chim. 22 35 30 64 78 86 123 Chem U SM6c. 19 44 45 72 85 86 157 Mec. U.S.S.R.Autres pays* . I jChim. 113 113 125 125 126 130 Chem. Autres pays ' Mc. 113 118 129 133 133 135 . Mec. Other countries.{ Chim. 6,102 6,600 7,265 7,991 8,372 8,548 * 9,600 Chem.
Monde .. . . . .. Mdc. 4,711 5,180 6,610 6,171 6,173 6,496 * 7,100 Me. World.Total 10,813 11,780 12,875 14,162 14,545 15,043 * 16,700 Total
Prix moyen d'exp. en francs-or. Average export price in gold fr.SUitDE - Chim. 298.61 268.88 282.71 297.65 278.51 266.76 260.61 Chem. SWEDEN.
par tonn8 2. 6 Chem. t SWEDE .par tonne M6c. 177.92 149.67 150.22 153.18 130.57 120.57 12.17 Me. per 1 metr ton.
SOURCES: Statistiques nationales; tableaux internationaux SOURCES: National statistics; international tables publishedpublies dans les annuaires statistiques des pays scandinaves; in the Statistical Year-Books of the Scandinavian countries;revues techniques. technical reviews.
* Estimations ou chiffres provisoires. * Estimate or provisional figure.Les totaux pour l'Europe et le monde ne comprennent ' The totals for Europe and world exclude the productionpas la production de la Lettonie et celle de pAte de bois meca- of Latvia and that of mechanical pulp in Poland.nique en Pologne.
'Pays-Bas: principalement pAte de paille. 2 Netherlands: mainly pulp from straw.8 Royaume-Uni: principalement pAte de sparte. 3United Kingdom: mainly pulp from esparto.'Belgique, Espagne, France, Italie et Portugal. 'Belgium, France, Italy, Portugal and Spain.

- 116
Tableau 53. - PAPIER ET CARTON.
Table 53. - PAPER AND PAPER BOARDS.
Production en milliers de tonnes m6triques. Production in metric tons (000's omitted).
1925 1926 1927 1928 1929
PAYS .... COUNTRY
Papier Carton Papier Carton Papier Carton Papier CartonTotal Total Total Total TotalPaper Board Paper Board Paper Board Paper Board T
AMtRIQUE DU NORTHNORD . . . 8,984 7,338 2,435 9,773 7,307 2,394 9,701 7,814 2,609 10,423 *8,430 2,870 *11,300 AMERICA.
Canada . . .. 1,710 1,915 141 2,056 2,093 147 2,240 2,410 175 2,585 2,970 227 3,197 Canada.Etats-Unis. . . 7,186 5,254 1 2,294 7,548 5,030 1 2,247 7,277 5,195 12,434 7,629 5,250 2,643 7,893 United States.Terre-Neuve . . 88 169 - 169 184 - 184 209 - 209 ... - ... Newfoundland.
ASIE .... 518 . . 533 . . 577 . * 580 . . 680 ASIA.
Inde (brit.) . . 29 30 30 . ... India.Japon ..... 489 388 115 503 434 113 547 418 133 55 * 510 ... ... Japan.
EUROPE* S. . 7,120 6,050 1,200 7,250 6,670 1,330 8,000 * 6,700 * 1,420 * 8,120 7,540 1,480 9,020 EUROPE. '"
Allemagne . . . 2,058 1,668 329 1,997 2,008 434 2,442 2,105 442 2,547 2,126 430 2,556 Germany.Autriche . . . 241 198 54 252 211 56 267 230 56 286 230 55 285 Austria.Belgique . . .. 150 155 16 171 162 17 179 . . 181 . 189 Belgium.Danemark . . . 46 50 2 52 51 2 53 50 2 52 49 2 51 Denmark.Estonie .... 38 38 . 35 . 36 . 34 Estonia.Finlande . . . 314 257 55 312 282 47 329 305 53 358 313 64 377 Finland.Grece .. 3 3 - 3 5 - 5 10 - 10 12 12Greece.Italie . .. . 400 .341 .299 .324 .343 Italy.Norv6ge . . . . 336 288 15 303 350 21 371 353 24 377 378 26 404 Norway.Pays-Bas. . . . 339 141 2 227 372 158 2 236 394 179 2247 426 * 193 245 438 Netherlands.Pologne . . . . 90 82 19 101 99 22 121 122 34 156 128 37 165 Poland.Roumanie . . . 34 36 3 39 40 2 42 44 *3 * 47 ... ... ... Roumania.Royaume-Uni . a) 1.307 . United Kingdom.Sude . . . . . 557 520 78 598 530 80 610 512 88 600 620 100 720 Sweden.Suisse . ..82 . 86 . 95 . 99 . .Switzerland.Tch6coslovaquie 206 195 33 228 220 35 255 .Czechoslovakia.U.R.S.S . . . 282 266 32 298 280 41 321 265 51 316 425 56 48 U.S.S.R.Yougoslavie * . 25 25 7 32 31 11 42 ...... Yugoslavia *Autres pays * 4 600 540 110 650 500 100 60 0 520 5 625 625 125 750 Othercountries.*
MONDE
ENTIER *5 16,630 13,810 3,750 17,560 14,440 3,840 18,280 14,980 4,140 19,12016,515 4,485 21,000 WORLD. *
SOURCES: Statistiques nationales officielles. Rapports et relev6s des organisations de producteurs. Revues techniques, etc
SOURCES: National official statistics. Reports and statements of producers' organisations. Technical Reviews, etc.
a) 1924. a) 1924.
* Estimation ou chiffre provisoire. * Estimate or provisional figure.
Etats-Unis: les chiffres du carton sont incomplets; en l United States : the board figures are not complete; in 19271927, ils representaient a peu pr6s 55 % de la production totale. they accounted for about 55 per cent. of total production.
2 Pays-Bas: carton de paille. 2 Netherlands: straw board.3 Royaume-Uni: on a inclus dans les totaux une estimation 3 United Kingdom: a rough estimate of production based on
approximative faite sur la base du nombre-indice de la produc- the index number of paper production published by the Londontion du papier publi6 par le ( London and Cambridge Economic and Cambridge Economic Service, has been included in theService )). totals.
4 Europe, a autres pays : la France est le principal produc- ' Europe, " other countries ": France is the largest producerteur compris dans ce groupe; les chiffres donn6s sont tres included in this group ; the figures shown are rough estimates.approximatifs.
o Monde: non compris certains pays qui ne sont situ6s ni 5 World: not including certain minor producing countriesen Europe ni dans l'Amerique du Nord et dont la production outside Europe and North America, the production of which isglobale est n6gligeable, mais y compris la production estimee negligible, but including the estimated production for the Unitedpour le Royaume-Uni. Kingdom.

117 -
Tableau 54. CIMENT. - Table 54. CEMENT.
Production en millier de tonnes metriques. - Production in metric tons (000's omitted).
PAYS 1923 1924 1925 1926 1927 1928 1929 COUNTRY
AFRIQUE 1......... . . . AFRICA '
Algerie. ......... 40 39 49 61 46 52 Algeria.Congo beige ....... 12 12 19 32 41 160 Belgian Congo.Egypte ........ . 85 1S0 ... Egypt.Maroc (francais) ..... 20 29 30 39 43 ... ... Morocco (French).
AMERIQUE DU NORD .... 24,859 26,905 29,155 29,802 31,501 32,177 31,431 NORTH AMERICA.
Canada ......... 1,198 1,190 1,289 1,382 1,598 1,750 1,950 Canada.Etats-Unis ........ 23,661 25,715 27,866 28,420 29,903 30,427 29,481 United States.
AMtRIQUE CENTRALE ... . . . . . . . CARRIBBEAN.
Mexique ......... 104 137 165 153 216 225 Mexico.
AMEIRIQUE DU SUD .... . . . . . . SOUTH AMERICA .
Argentine ....... . 133 169 201 233 ... Argentina.BrKsil ....... .... 17 68 170 ... Brazil.Chili .. ........ . . . . 96 111 143 Chile.Perou ......... . 11 29 49 48 ... ... Peru.
ASIE * .......... 2,900 3,100 3.700 4,500 4,900 4,900 *5,300 ASIA *.
Inde (brit.). . ...... 200 200 250 300 341 India.Indochine ... ... 124 148 139 149 159 184 Indo-Cnina Japon .......... 1,884 1,959 2,273 3,032 3,267 3,293 3,700 Japan.Philippines ....... 6 45 48 60 66 65 ... Philippines.Autres pays* ...... 700 800 1,000 1,000 1,000 1,100 ... Other countries *.
EUROPE 3 .......... 18,200 20,490 23,900 26,100 29,600 32,500 *33,800 EUROPE 3.
Allemagne ... 3,641 4,048 5,812 5,950 7,342 7,546 7,039 Germany.Autriche ......... 376 424 433 464 523 582 ... Austria.Belgique-Luxembourg . . 2,000 2,100 2,275 2,400 2,600 * 3,000 ... Belgium-Luxemburg.Bulgarie ......... 50 61 80 88 112 108 151 Bulgaria.Danemark ........ 655 682 591 569 643 779 799 Denmark.Espagne......... 863 917 1,136 1,183 1,453 1,542 1,820 Spain.Estonie . ........ 62 58 65 76 49 60 58 Estonia.Finlande ........ 122 136 141 174 232 280 278 Finland.France ......... 2,518 3,201 3,107 3,960 3,590 4,240 France.Grce .......... 36 55 60 86 105 145 155 Greece.Hongrie ......... 250 202 232 323 417 426 397 Hungary.Italie .......... 2,300 2,350 2,500 2,833 2,788 3,077 3,497 Italy.Lettonie ... ...... . . 21 23 18 25 40 Latvia.Norv6ge ... . ..... (269) (318) (319) Norway.Pologne .... ..... 922 758 1,025 1,176 1,634 2,159 2,055 Poland.Portugal.. ..... . . . . 62 74 Portugal.Roumanie . .20 194 230 288 321 332 317 Roumania.Royaume-Uni . . 2,742 3,242 3,813 3,841 4,399 4,400 4,766 United Kingdom.Su6de .......... 393 407 446 471 496 468 570 Sweden.Suisse .......... 547 620 581 541 537 628 687 Switzerland.Tch6coslovaquie ..... (680) (727) (809) Czechoslovakia.U. R. S. S......... 221 358 708 1,293 1,599 1,902 2,290 U.S.S.R.Yougoslavie ....... 473 554 613 646 713 808' ... Yugoslavia.
OC^I ANIE. ......... 530 600 712 760 848 986 *950 OCEANIA.
Australie . 4.82 500 587 615 648 766 720 Australia.Nouvelle-Z6lande ..... 48 100 125 145 200 220 ... New Zealand,
Total' ....... 46,600 51,100 57.600 61,600 67,000 70,600 * 71.700 Totnl'.
SOURCES : Statistiques nationales. - National Statistics. - Informations directes de divers gouvernements. - Directinformation from various Governments. - U.S.A. Department of Commerce: Commerce Reports.
* Estimation. * Estimate.
'Afrique, Am6rique du Sud: chifqres non compris dans les 1Africa, South America: figures not included in the totals.totaux.D'aprcs le U. S. Department of Commerce la production According to the U. S. Department of Commerce the estimatedtotale de l'Afrique en 1927 aurait 6t6 de 450.000 tonnes et celle production in 1927 was for Africa 450,000 tons and for Southde l'Am6rique du Sud de 570.000 tonnes. America 570,000 tons.
Indo-Chine : production de la principale entreprise des 2 Indo-China: production of the principal artificial cementciments artificiels. works.
3 Europe : non compris la Norvege et la Tch6coslovaquie. 3 Europe : excluding Norway and Czechoslovakia.4 Total: non compris l'Afrique, l'Am6rique du Sud, la Nor- ' Total: excluding Africa, South America, Norway and
vege et la Tch6coslovaquie. Czechosloavakia.

- 118 -
Tableau 55. SEL. - Table 55. SALT.
Production en milliers de tonnes metriques.Production in metric tons (000's omitted).
PAYS 1921 1922 1923 1924 1925 1926 1927 1928 1929 COUNTRY
AFRIQUE ..... * 375 * 450 * 450 * 530 * 540 540 * 592 * 475 * 475 AFRICA.
Alg6rie ..... 18 20 25 24 27 43 37 11 15 Algeria.Egypte (E.) . . 154 187 157 210 211 180 223 168 149 Egypt (E.).Erithr6e (E.) . . 57 58 71 67 56 53 69 59 ... Eritrea (E.). 1Somalie fr. . . . . . . 32 17 29 39 Somali (Fr.).Soudan anglo- Anglo-Egypt.
6gyptien . 10 15 9 7 9 10 12 15 Sudan.Tripolitaine (E.) . . 16 9 11 8 ... Tripolitania (E.).Tunisie . . .. 33 52 73 li0 128 133 * 145 * 105 ... Tunis.Union S.-Afric. 62 76 62 70 59 81 80 84 ... Union of S. Africa.
AM1ERIQUE '. . . * 4,900 6,548 6,888 6,601 7,113 7,142 7,393 7,884 * 8,370 AMERICA 2.
Canada . . 149 165 184 189 212 238 244 272 300 Canada.Etats-Unis: Total 4,519 6,162 6,469 6,172 6,711 6,687 6,866 7,325 7,751 Unit. States: Total.
6vapor6. 1,752 2,065 2,032 2,018 2,028 1,994 2,053 2,204 2,310 evaporated.saunmnre . . . 1,431 2,331 2,529 2,281 2,558 2,756 2,868 3,109 3,524 brine.gemme .... 1,336 1,766 1,908 1,873 2,125 1,937 1,945 2,012 1,917 rock.
Argentine. . 76 94 111 122 75 97 153 168 198 Argentine.Chili .... 40 34 38 36 29 35 72 35 ... Chile.P6rou ... 26 26 27 29 23 30 30 33 Peru.Turques et Turks and Caicos
Caiques (E.). . 67 59 53 63 55 28 51 62 Isl. (E.).
AslE 3. ....... * 2,800 *3,200 *3,200 *3,050 *3,050 3,380 3,230 3,230 *3,750 ASIA 3.
Ceylan . .... 16 47 29 10 21 17 26 44 26 Ceylon.Formose . . . 102 138 239 136 138 135 113 135 164 Formosa.Inde brit. : Total 1,558 1,680 1,810 1,650 1,316 1,665 1,638 1,540 1,737 India 4: Total.
dvapor6 . 1,408 1,469 1,688 1,458 1,163 1,516 1,465 1,382 ... evaporated.gemme .... . 150 211 122 192 153 149 173 158 rock.
Indes n6erl. .. * 170 * 200 * 180 * 160 484 408 274 280 514 Dutch E. Indies 5.Indochine . . 130 118 124 160 200 202 196 161 255 Indo-China.Japon . . 515 665 480 637 669 614 619 638 644 Japan.Philippines . . 31 69 * 76 29 31 43 67 72 ... Philippines.Siam: Total. . . 126 126 115 119 Siam: Total.
marin . 104 103 90 94 sea-salt.Turquie.. . . 155 94 170 172 242 ... Turkey.
EUROPE ..... * 7,500 * 9,750 *9,300 *9,900 * 10,300 * 11,000 12,333 *12,700 *13,000 EUROPE.
Allemagne': total 1,960 3,076 1,876 1,974 2,224 2,445 2,803 2,909 3,043 Germany 6: Total.gemme . . 1,656 2,68) 1,584 1,597 1,767 1,966 2,269 2,400 2,542 rock.6vapor6 .. 304 91 292 377 457 479 534 509 501 evaporated.
Autriche': Total. 129 144 83 111 131 145 148 154 178 Austria : Total.saumure . . 127 142 82 108 129 142 145 152 175 brine.
Bulgarie. . . 10 10 25 35 27 29 48 47 29 Bulgaria 8.Espagne: Total 513 681 716 968 860 1,097 979 983 ... Spain: Total.
6vapor6 . . 475 567 617 863 753 979 868 837 ... evaporated.gemme . . . 38 114 99 105 107 118 111 146 rock.
France 9: Total 1,005 1,390 1,526 1,575 1,725 2,037 1,950 2,115 France ": Total.Mines et salines : Mines & brine-wells:
a) gemme etraffin6 293 344 462 475 514 574 549 559 a) rock & refined.b) saumure. . . 500 739 726 843 949 1,070 969 1,148 1,13 b) brine.
ma rin ..... 212 307 338 257 262 393 432 408 sea-salt.Grace ... 65 68 60 69 79 90 104 59 ... Greece.Italie: Total . . 513 790 765 807 916 766 1,051 903 * 910 Italy: Total.
marin . . 423 [653 623 597 637 461 686 562 563 sea-salt.saumure . . . 45 87 89 153 215 237 298 274 284 brine.gemme .... 45 50 53 57 64 68 67 67 63 rock.
Pays-Bas . . . 25 28 27 32 34 35 41 42 45 Netherlands.Pologne. 468 371 430 458 498 548 570 Poland.Portugal (E.) . 77 86 105 91 34 49 47 15 ... Portugal (E.).Roumanie 8: Total 233 285 308 304 331 344 328 343 322 Roumania s: Total
gemme . . . 233 2835 306 303 330 344 328 340 319 rock.Royaume-Uni: United Kingdom:
Total . .. 1,405 1,801 1,917 2,079 1,965 1,755 2,015 1,978 2,006 Total.sauure . . . 1,369 1,764 1,867 2,024 1,920 1,714 1,985 1,946 1,969 brine.
Suisse ... 47 70 71 72 75 77 78 80 87 Switzerland.

- 119
Tableau 55. Sel (fin). - Table 55. Salt (concluded).
Production en milliers de tonnes metriques.Production in metric tons (000's omitted.)
PAYS 1921 1922 1923 1924 1925 1926 1927 1928 1929 COUNTRY
Tchecoslovaquie: Czechoslovakia:Total . 91 128 134 125 77 98 122 154 ... Total.
gemme . . . . . . 70 89 114 144 ... rock.U.R.S.S. 0 . . . 983 743 1,173 1,243 1,331 1,537 2,061 2,428 ... US.S.R. 1Yougoslavie: Yugoslavia:
Total. . .. . . . . . 60 68 60 Total.gemme . . . 23 44 46 49 55 52 55 52 45 rock.
OCIANIE: OCEANIA.
Australie * . 98 100 113 128 141 125 133 86 Australia
TOTAL . . . * 15,700 * 20,000 * 19,950 * 20,200 * 21,100 * 22,200 * 23,700 * 24,450 * 25,700 TOTAL.
SOURCES: Statistiques nationales officielles. - National official statistics. - Imperial Institute: The Mineral Industry.
Note. - Le tableau comprend la grande majorit6 des pays Note. - The table includes the great majority of the countriespour lesquels il existe des statistiques relatives au sel. La pro- for which statistics regarding salt exist. The actual worldduction mondiale est en fait plus elevee que les totaux donnes production is greater than the totals given in the table, sincedans le tableau, puisque le sel est obtenu dans presque tous salt is produced in nearly all countries. In view of the importanceles pays du monde. Vu l'importance de la consommation natio- of national consumption, data relating to exports are notnale, les donn6es relatives a l'exportation ne sont pas repr6- representative of production. The classification of the varioussentatives de la production. La classification des diverses kinds of salt given in the table in most cases corresponds toespeces de sel qui figure dans le tableau correspond dans la the classification in use in the different countries. It is basedplupart des cas a la classification en usage dans les divers pays; sometimes on the origin of the salt (e.g., salt from mines, sea-elle d6coule tant6t de l'origine du sel (exemple: sel de mines, salt, brine-wells, etc.) and sometimes on the form in whichsel marin, sel de salines, etc.), tant6t de la forme sous laquelle it is extracted (rock-salt, brine). As mine salt is often extractedil est extrait (sel gemme, saumure). Comme le sel des mines from flooded mines in the form of brine, the principle on whichest souvent extrait de mines inondees, sous forme de saumure, the classification in use in the different countries is based isle principe sur lequel repose la classification en usage dans les not uniform.divers pays n'est pas uniforme.
* Estimation. * Estimate.
(E.) Exportations. (E.) Exports.
1 Erithre : la production est estimee h 150.000 tonnes. 1 Eritrea: production is estimated at 150,000 tons.2 Amerique: la production de la Colombie et du Venezuela 2 America: production of Colombia and Venezuela is esti-
est estimee i 30.000 tonnes, celle du Mexique a 70.000 et celle mated at 30,000 tons, that of Mexico at 70,000 and that ofdu Panama h 50.000 tonnes. Panama at 50,000 tons.
3 Asie : la production de la Chine est estimee h 2-3 /2 millions a Asia: production of China is estimated at 2 to 3 Y millionsde tonnes. . of tons.
4 Inde: y compris Aden. 4 India: including Aden.5 Indes n6erlandaises : total du monopole et de la production 5 Dutch East Indies: total of the monopoly and of the free
libre des indigenes. production of the natives.6 Allemagne: non compris le contenu en sel de la saumure 6 Germany: not including the salt content of brine employed
employee telle quelle par l'industrie et par les etablissements as such in industry and by bathing establishments, whichbalneaires, estim6 en 1927 h 719.000 tonnes et en 1928 i was estimated at 719,000 tons in 1927 and 817,000 tons in 1928.817.000 tonnes.
7 Autriche: total du sel gemme et du contenu en sel de la 7 Austria: rock salt and salt content of brine derived fromsaumure extraite des salines. the brine-wells.
8 Bulgarie, Roumanie: total du sel gemme et du sel marin. 8 Bulgaria, Roumania: total of rock and sea-salt.9 France: sel gemme et raffine: production effective des 9 France: rock salt and refined salt: actual production of
mines et salines; saumure: sel en dissolution destine a l'indus- mines and brine-wells; brine: salt in solution for industrialtrie. purposes.
10 U.R.S.S.: total du sel gemme, de la saumure, du sel 10 U.S.S.R.: total of rock salt, brine, sea-salt and lake-salt.marin et du sel extrait des lacs. La quantite de ce dernier est The latter accounts for the greatest quantity.la plus importante.
n Australie: donn6es incompletes, en partie estimees. n Australia: incomplete data, partly estimated.

- 120 -
Tableau 56. HOUILLE. - Table 56. COAL.
Production en milliers de tonnes m~triques. - Production in metric tons (000's omitted).
.AY» 1922 1923 1924 1925 1926 1927 1928 1929 * 1930 OOUTBY
AFRIQUE ..... 9,423 11,553 12,158 12,735 13,678 13,362 13,636 14,025 13,300 AFRICA.Alg6rie . ... 9 4 9 10 14 21 17 16 ... Algeria.Nig6ria . ... 115 178 224 243 330 364 365 350 ... Nigeria.Rhod6sie du Sud 468 560 592 689 874 909 1,095 1,037 ... Southern Rhodesia.Union Sud-Afric. 8,831 10,811 11,333 11,793 12,460 12,068 12,159 12,622 11,890 Union of S. Africa.
AMtRIQUE DU NORD 443,275 609,011 527,703 536,497 608,443 555,215 535,062 564,742 492,474 NORTH AMERICA.Canada . . 10,588 12,164 9,139 8,628 11,687 12,341 12,439 12,273 10,367 Canada.Etats-Unis . . 432,687 596,847 518,564 527,869 596,756 542,874 522,623 552,469 482,107 United States'
AMARIQUECENTRALE CARIBBEAN.
(Mexique) . . . 933 1,262 1,227 1,444 1,309 1,031 1,022 1,060 ... (Mexico).
AMARIQUE DU SUD *1,785 1,767 1,987 1,972 * 2,077 1,895 * 1,820 * 2,000 1,900 SOUTH AMERICA.Br6sil ..... *400 324 268 392 * 400 235 * 250 ... ... Brazil.Chili ... 1,053 1,164 1,539 1,453 1,491 1,482 1,376 1,508 1,435 Chile.P6rou . . 303 253 155 102 170 162 178 ... ... Peru.Venezuela . . 29 26 25 25 16 16 16 17 ... Venezuela.
AsIE . . . . . . * 76,709 * 84,619 * 84,805 * 87,007 * 88,753 * 95,167 * 93,000 * 90,000 85,000 ASIA.Borneo brit. .. 137 102 129 101 93 80 80 ... ... British Borneo.Chine . . . * 21,000 * 24,000 * 21,000 * 21,000 * 22,000 * 23,000 * 20,000 * 15,000 ... China.Cor6e . . . . . 317 380 399 622 683 710 785 938 ... Korea.Etats Malais f6d. 286 323 379 415 472 470 566 672 ... Fed. Malay States.Formose. . . 1,347 1,445 1,506 1,705 1,795 1,800 1,584 1,530 Formosa.Inde: Prov. brit. 18,483 19,116 20,596 20,309 20,435 21,478 21,907 22,721 22,951 India: Brit. prov.
Etats ind. 832 854 916 930 900 957 997 1,073 Indian StatesIndes noerland. 1 1,041 1,157 1,470 1,401 1,466 1,620 1,704 1,832 1,695 Dutch East Indies.'Indochine .1 990 1,057 1,236 1,363 1,290 1,491 1,967 1,983 ... Indo-China. Japon . 27,702 28,949 30,111 31,459 31,427 33,531 33,860 34,258 29,286 Japan.Kouan-Toung. 4,006 6,429 6,047 6,632 6,977 8,754 ... ... Kwantung.Philippines . 42 43 48 49 29 23 28 ... ... Philippines.Sakhaline . . 115 167 199 251 276 357 539 636 ... Saghalien.Turquie . 411 597 769 770 910 896 918 1,421 ... Turkey.
EUROPE ..... 502,281 485,669 549,914 536,973 457,598 604,611 593,946 642,795 604,700 EUROPE.Allemagne . . 119,183 62,316 118,769 132,622 145,296 153,599 150,861 163,441 142,698 Germany.Autriche . 166 158 172 145 157 176 202 208 216 Austria.Belgique . . 21,209 22,923 23,362 23,097 25,260 27,551 27,578 26,940 27,406 Belgium.Bulgarie . . 49 63 70 57 64 69 70 79 Bulgaria.Espagne . . 4,436 5,929 6,127 6,117 6,536 6,563 6,369 7,108 7,170 Spain.France . .. 31,141 37,679 44,019 47,097 51,392 51,792 51,365 53,736 53,884 France.Hongrie . .. 857 793 744 805 828 786 783 825 812 Hungary.Italie . . . . 195 174 127 189 209 169 128 223 226 Italy.Pays-Bas . 4,866 5,595 6,180 7,117 8,843 9,488 10,920 11,581 12,211 Netherlands.Pologne . .. 34,631 36,098 32,280 29,081 35,747 38,084 40,616 46,236 37,500 Poland.Portugal . 129 138 125 108 202 179 201 197 ... Portugal.Roumanie . 254 292 297 314 322 373 398 371 348 Roumania.Royaume-Uni 253,613 280,430 271,405 247,079 128,305 255,264 241,283 262,046 247,671 United Kingdom.Sarre . .. 11,240 9,192 14,032 12,990 13,681 13,596 13,107 13,579 13,236 Saar.Spitzberg (E.) 326 341 450 413 290 296 279 240 ... Spitzbergen. (E.)Su6de . 379 420 438 264 384 398 359 395 Sweden.Tch6coslovaquie 10,465 12,347 15,179 12,559 14,177 14,016 14,560 16,751 14,572 Czechoslovakia.U.R.S.S.' a) . 9,040 10,646 16,006 16,741 25,714 31,923 34,513 38,430 45,566 U.S.S.R. 2 a)Yougoslavie . . 102 135 132 178 11 289 354 409 366 Yugoslavia.
OCPANIE. . 13,389 13,669 15,080 14,906 14,703 15,052 13,400 11,921 ... OCEANIA.Australie .. 12,405 12,718 13,978 13,845 13,488 13,740 12,030 10,532 ... Australia.Nouvelle-Z61ande q984 951 1,102 1,061 1,215 1,312 1,370 1,389 ... New Zealand.
MONDE ENTIER. . *1,047,800 *1,207,600 *1,192,900 *1,191,500 *1,186,600 *1,286,300 *1,251,900 *1,326,500 1,209,000 WORLD.
SOURCES: Statistiques nationales. - National statistics. Imperial Institute: Statistical Summary. - Gliickauf; etc.
* Estimation ou chiffres provisoires. * Estimate or provisional figures.
(E.) Exportation. (E.) Exports.
a) Depuis 1923, ann6e fiscale finissant le 30 septembre. a) Since 1923, fiscal year ending September 30th.
1 Etats-Unis, Indes n6erlandaises, Indochine: y compris 1 United States, Dutch East Indies, Indo-China: includingune faible partie de lignite. small quantity of lignite.
2 U.R.S.S.: y compris les territoires d'Asie. 2 U.S.S.R.: including Asiatic territories.

- 121 -
Tableau 57. LIGNITE.
Table 57. LIGNITE.
Production en milliers de tonnes metriques. - Production in metric tons (000's omitted).
rA y 1922 1923 1924 1926 1926 1927 1928 1929 *1930 COUTlT
AFRIQUE AFRICA.
(Congo beige) . . 3 61 81 66 89 86 97 116 ... (Belgian Congo.)
AMf:RIQUE DU NORD NORTH AMERICA.(Canada) .... 3 ,163 3,250 3,233 3,288 3,262 3,469 3,495 8,600 3,131 (Canada).
ASIE (Japon). ... 66 156 177 169 161 179 122 ... ... ASIA (Japan).
EUROPE ..... 174,9 154,426 164,627 177,14 177,394 190,793 207,121 219,907 185,400 EUROPE.
Allemagne .. . . 137,179 118,785 124,637 139,725 139,151 150,504 165,588 174,454 145,914 Germany.Autriche . .. 3,136 2,685 2,786 3,033 2,958 3,064 3,263 3,525 3,063 Austria.Bulgarie . .. .983 1,013 1,155 1,166 1,142 1,168 1,361 1,573 1,572 Bulgaria.Espagne . . . . 330 394 412 403 400 430 423 439 ... Spain.France ... . 772 877 963 933 1,061 1,083 1,075 1,187 1,143 France.Grlce . . . . 132 118 131 142 153 143 121 156 ... Greece.Hongrie . . . . 6,183 6,895 6,342 5,519 5,822 6,244 6,510 7,044 6,174 Hungary.Italie ...... . 751 959 920 1,108 1,192 925 704 790 560 Italy.Pays-Bas . . 29 54 191 208 211 201 197 157 144 Netherlands.Pologne .... 220 171 89 66 76 78 74 74 55 Poland.Portugal . ... 14 16 8 17 31 26 27 29 ... Portugal.Roumanie . ... 1,862 2,229 2,479 2,615 2,731 2,850 2,630 2,675 2,045 Roumania.Tch6coslovaquie . 19,174 16,266 20,460 18,605 18,516 19,621 20,451 22,561 19,273 Czechoslovakia.Yougoslavie . . . 3,628 3,964 4,054 3,974 3,950 4,456 4,697 5,243 4,903 Yugoslavia.
OC:ANIE . . . . . 996 1,170 1,144 1,978 2,033 2,572 2,723 2,956 ... OCEANIA
Australie . . . , 92 119 130 891 973 1,479 1,618 1,769 ... Australia.Nouvelle-Z61lande . 904 1,051 1,014 1,087 1,060 1,093 1,105 1,187 ... New Zealand.
MONDE ENTIER .. . 178,800 159,100 169,300 183,000 182,900 197,100 213,600 * 226,700 191,500 WORLD.
SOURCES: Statistiques nationales. - National statistics. Imperial Institute: Statistical Summary.
* Estimation ou chiffres provisoires. * Estimate or provisional figures.

122 -
Tableau 58. HOUILLE ET LIGNITE (equivalent en houille ).Table 58. COAL AND LIGNITE (in terms of coal 1).
Production en milliers de tonnes metriques. Production in metric tons (000's omitted).
IAYS 1922 1928 1924 1925 1926 1927 1928 1929 * 1930 COUNTRY
AFRIQUE ... . 9,434 11,573 12,185 12,757 13,708 13,391 13,668 * 14,064 13,300 AFRICA.Union Sud Afri- Union of South
caine. . 8,831 10,811 11,333 11,793 12,460 12,068 12,159 12,622 11,890 Africa.Algrie . . 9 4 9 10 14 21 17 16 ... Algeria.Congo beige . 11 20 27 22 30 29 32 39 ... Belgian Congo.Nigeria . . . 115 178 224 243 300 364 365 350 ... Nigeria.Rhod6sie du Sud 468 560 592 689 874 909 1,095 1,037 ... South. Rhodesia.
AMiRIQUEDU NORD . . 444,329 610,094 528,781 537,593 609,530 556,371 536,227 565,942 493,518 NORTH AMERICA.
Canada . ... 11,642 13,247 10,217 9,724 12,774 13,497 13,604 13,473 11,411 Canada.Etats-Unis. . 432,687 596,847 518,564 527,869 596,756 542,874 522,623 552,469 482,107 United States.AMJIRIQUE
CENTRALE CARIBBEAN(Mexique) . . . 933 1,262 1,227 1,444 1,309 1,031 1,022 1,060 ... (Mexico).
AM1tRIQUE DU SUD 1,785 1,767 1,987 1,972 * 2,077 * 1,895 1,820 * 2,000 1,900 SOUTH AMERICA.Brsil . . . 400 324 268 392 * 400 * 235 250 ... ... Brazil.Chili . 1,053 1,164 1,539 1,453 1,491 1,482 1,376 1,508 1,435 Chile.P6rou . 303 253 155 102 170 162 178 Peru.Venezuela . 29 26 25 25 16 16 16 17 ... Venezuela.
ASIE ...... * 76,764 * 84,669 *:84,864 * 87,063 * 88,807 * 95,227 * 93,700 * 90,900 * 85,000 ASIA.Borneo brit.. 137 102 129 101 93 80 80 British Borneo.Chine . . * 21,000 * 24,000 * 21,000 * 21,000 * 22,000 * 23,000 * 20,000 * 15,000 ... China.Gore .317 380 399 622 683 710 785 938 ... Korea.Etats Malais Fed. Malay
f6d6r6s . . 286 323 379 415 472 470 566 672 States.Formose. . 1,347 1,445 1,506 1,705 1,795 1,800 1,584 1,530 Formosa.Inde: Prov. bri 18,483 19,116 20,596 20,309 20,435 21,478 21,907 22,721 22,951 India :Britprov.Etats ind. 832 854 916 930 900 957 997 1.073 Ind. StatesIndes n~erl. 1,041 1,157 1,470 1,401 1,466 1,620 1,704 1,832 1,695 Dutch East Ind.Indochine . 990 1,057 1,236 1,363 1,290 1,491 1,967 1.983 ... Indo-China.Japon . . .. 27,757 28,999 30,170 31,515 31,481 33,591 33,901 34,300 29,320 Japan.Kouan-Toung 4,006 6,429 6,047 6,632 6,977 8.754 .. ... .. Kwantung.Philippines. 42 43 48 49 29 93 28 Philippines.Sakhaline . 115 167 199 251 276 357 539 636 ... SaghalienTurquie. . 411 597 769 770 910 896 918 1,421 ... Turkey.
EUROPE . . . 550,887 528,793 596,892 586,146 506,804 * 657,321 650,409 703,399 656,000 EUROPE.Allemagne . 149,667 88,713 146,466 163,672 176,218 187,044 187,658 202,209 175,123 Germany.Autriche. . . 2,048 1,769 1,844 1,965 1,932 2,014 2,160 2,323 2,054 Austria.Belgique . . 21,209 22,923 23,362 23,097 25,320 27,574 27,543 26,928 27,406 Belgium.Bulgarie . . 377 401 455 446 445 458 524 603 600 Bulgaria.Espagne . . 4,601 6,126 6,333 6,318 6,736 6,778 6,581 7,328 7,360 Spain.France 31,398 37,971 44,340 47,408 51,746 52,153 51,723 54,132 54,265 France.Gr6ce . 44 39 44 47 51 48 40 52 Greece.Hongrie. . 2,918 3,091 2,858 2,645 2,769 2,867 2,953 3,173 2,870 Hungary.Italie . 383 414 357 466 507 400 304 421 366 Italy.Pays-Bas . . 4,876 5,613 6,244 7,186 8,913 9,555 10,986 11,633 12,259 Netherlands.Pologne . . 34,704 36,155 32,310 29,103 35,772 38,110 40,641 46,261 37,518 Poland.Portugal. 134 143 128 114 212 188 210 207 Portugal.Roumanie . . 875 1,035 1,123 1,186 1,232 1,323 1,275 1,263 1,030 Roumania.Royaume-Uni 253,613 280,430 271,405 247,079 128,305 255,264 241,283 262,046 247,671 Unit. Kingdom.Sarre . . 11,240 9,192 14,032 12,990 13,681 13,596 13,107 13,579 13,236 Saar.Spitzberg (E.) 326 341 450 413 290 296 279 240 ... Spitzbergen (E.).Suede. 379 420 438 264 384 398 359 395 ... Sweden.Tcheoslovaquie 21,744 21,915 27,214 23,503 25,069 25,558 26,590 30,022 25,909 Czechoslovakia.U. R. S. S. a)2 9,040 10,646 16,006 16,741 25,714 31,923 34,513 38,430 45,566 U. S. S. R. a) 2Yougoslavie . 1,311 1,456 1,483 1,503 1,508 1,774 1,920 2,157 2,000 Yugoslavia.
OCPANIE . . . 13,721 14,059 15,461 15,565 15,380 15,909 14,307 12,907 ... OCEANIA.Australie . . . 12,436 12,758 14,021 14,142 13,812 14,233 12,569 11,122 ... Australia.Nouv.-Z61ande . 1,285 1,301 1,440 1,423 1,568 1,676 1,738 1,785 New Zealand.
MONDE ENTIER*. 1,097,8531,252,217 1,241,397 1,242,540 1,237,615 1,341,145j*1,311,153 *1,390,0001,263,000 WoRLD.
SOURCES: Voir tableau 56. - See table 56.
* Estimation ou chiffre provisoire. * Estimate or provisional figure.(E.) Exportation. (E.) Exports.a) Depuis 1923, ann6e fiscale finissant le 30 septembre. a) Since 1923, fiscal year ending Septembre 30th.1 Lignite calcul6 en 6quivalent dehouille selon le taux de 2°: 1 Lignite converted into terms of coal at the rate of 3: 59 pour l'Allemagne, 3 : 5 pour l'Autriche, 1 : 2 pour l'Espagne, for Austria, 10: 17 for Czechoslovakia, 2: 9 for Germany, I: 4I : 4 pour l'Italie, 10: 17 pour la Tch6coslovaquie et 1 : 3 for Italy, 1 : 2 for Spain, and 1 : 3 for the other countries.pour les autres pays.2 U.R.S.S. : y compris les territoires d'Asie. 2 U. S. S. R. : including Asiatic territories.

- 123 -
Tableau 59 - CONSOMMATION DE HOUILLE (CHARBON, COKE, BRIQUETTES ET LIGNITE)EN TERMES DE CHARBON.
Table 59 - CONSUMPTION OF COAL (INCLUDING COKE, BRIQUETTES AND LIGNITE) IN TERMSOF COAL).
Consommation en millions a) Importations nettes en % de la consommationde tonnes m6triques Net imports as % of consumption
~pays g ~Consumption in metric b) Exportations nettes en % de la production, indiqu6es par « +tons (000,000's omitted) Net exports as % of production, shown as · + » Country
1924 1925 1926 1927 1928 1929 1930 1924 1925 1926 1927 1928 1929 1930
AFRIQUE: AFRICA:
Union Sud-Afri- Union of Southcaine .... 10 10 10 11 11 11 11 +15.0 + 13.6 +16.8 +13.2 +12.3 +13.2 +11.0 Africa.
AMI~RIQUE DU NORTHNORD: AMERICA:
Canada ... . 25 25 28 30 29 30 29 59.6 60.9 54.3 54.7 53.3 55.5 60.4 Canada.Etats-Unis . . . 495 505 555 519 501 529 462 + 4.56 + 4.4 + 7.1 + 4.4 + 4.2 + 4.2 + 4.2 United States.
AMI3RIQUE DU SOUTHSUD: AMERICA:
Argentine . . . 3.3 3.2 2.9 3.5 3.2 3.2 3.2 100.0 100.0 100.0 100.0 100.0 100.0 100.0 Argentine.Brsil . . . . 2.1 2.3 2.3 2.4 2.5 ... . 85.7 82.6 82.6 91.7 88.0 ... ... Brazil.Chili ..... 1.8 1.8 1.5 1.6 1.5 1.6 1.4 16.9 16.9 6.7 3.3 5.4 3.9 + 3.3 Chile.
ASIE: ASIA:
Chine ..... 19 21 22 21 18 13 ... +7.6+ 1.0 - 1.0+ 7.4+ 7.5+12.7 ... China.Inde brit. 21 21 20 21 22 22 23 1.4 1.5 + 2.0 + 1.4 + 1.8 + 2.3 + 1.1 Brit. India.Japon. ... 30 32 31 34 35 35 30 1.0 + 2.9 + 1.6 1.5 1.7 3.4 1.9 Japan.
EUROPE: EUROPE:
Allemagne . . . 135 139 126 154 160 170 148 + 8.0 +15.0 +28.3 +17.4 +14.6 +15.8+15.6 Germany.Autriche. . .. . 7 7 7 7 8 9 7 75.3 71.8 72.1 73.0 71.8 74.1 69.7 Austria.Belgique et Belgium and
Luxembourg . 32 31 31 36 34 38 36 27.6 25.3 18.1 23.5 19.6 28.3 24.2 Luxemburg.Danemark . . . 4.9 4.2 4.1 5.2 4.8 5.8 5.4 100.0 100.0 100.0 100.0 100.0 100.0 100.0 Denmark.Espagne .... 8 8 8 9 9 9 ... 18.3 21.3 10.7 25.3 22.4 22.6 ... Spain.Finlande. . . . 0.6 0.6 0.6 1.1 1.1 1.2 1.1 100.0 100.0 100.0 100.0 100.0 100.0 100.0 Finland.France et Sarre 83 81 84 87 85 94 96 30.2 25.9 2'2.3 24.4 23.5 28.2 29.6 France and Saar.Hongrie ... .. 3.8 3.4 3.6 4.3 4.6 5.0 4.0 23.7 23.5 22.2 32.6 34.8 36.4 28.6 Hungary.Italie .. 11 11 13 14 13 15 14 96.5 95.4 96.0 97.2 97.7 97.3 97.4 Italy.Lettonie . . . . 0.5 0.4 0.4 0.5 0.5 0.7 ... 100.0 100.0 100.0 100.0 100.0 100.0 ... Latvia.Norvege . .. .. 2.1 2.0 1.6 2.2 2.1 2.1 2.3 100.0 100.0 100.0 100.0 100.0 100.0 100.0 Norway.Pays-Bas. . . . 10 11 11 12 13 14 13 41.0 34.1 20.5 22.6 14.8 15.9 8.8 Netherlands.Pologne ... . 21 21 21 27 28 33 25 + 35. 6 +28. 2+40.1-+]28. 9-+31.5 +29.7 +-33. 5 Poland.Royaume-Uni . 186 175 120 185 169 179 172 + 31.5 + 29.3 + 6. 8 + 27.5 + 30. 0 + 31.7 + 30.7 UnitedKingdom.Suede .. .. 5 5 5 7 6 7 ... 92.6 93.6 91.5 93.9 93.3 94.4 ... Sweden.Suisse ..... 2.6 2.7 2.6 2.9 3.0 3.4 3.1 100.0 100.0 100.0 100.0 100.0 100.0 100.0 Switzerland.Tch6coslovaquie 24 22 22 27 29 28 24 +11.0 + 7.7 +13.9 + 9.2 + 5.6 + 6.7 + 6.6 Czechoslovakia.U.R.S.S. . . . 16 17 27 32 34 38 46 0.6q+ 1.2 1.1 0.6-+ 0.3 ... ... U.S.S.R.
OCEANIE: OCEANIA:
Australie. . . 13 13 13 14 12 12 ... + 7.1 + 5.7 + 6.5 + 3.5 + 2.4 + 4.5 ... Australia.'Nouvelle-Zelande 2.0 1.9 1.9 2.0 1.9 1.8 ... 29.2 26.3 15.8 15.0 10.5 8.7 ... New Zealand.
NOTE. - La consommation a 6t6 calculie d'apres la production NOTE. - The consumption has been calculated from thede charbon et de lignite et le commerce exterieur du charbon, production of coal and lignite and the foreign trade in coal,du coke, des briquettes et du lignite. Comme, dans plusieurs pays, coke, briquettes and lignite. As in a number of countries stocksles stocks ont etc reduits durant le conflit charbonnier anglais were reduced during the British coal stoppage in 1926 andde 1926 et reconstitues dans l'annee suivante, les chiffres du replenished in the following year, the consumption figures fortableau relatifs h la consommation en 1926 sont probablement 1926 are in some cases believed to understate, and the correspond-au-dessous de la consommation v6ritable et en 1927 probablement ing 1927 figures to overstate, actual consumption.au-dessus. For coefficients used in converting lignite into terms of coal,
Pour les coefficients utilises en vue de la conversion du lignite see table 58. Coke has been converted into terms of coal at theen termes de charbon, voir tableau 58. Le coke a 6te converti rate of 133/, : 100.au taux de 1331/, : 100.
Australie : les pourcentages sont approximatifs vu que les 'Australia: the percentages are approximate because ofstatistiques du commerce se ref-rent aux annres fiscales. the trade statistics which refer to fiscal years.

124
Tableau 60. EiLECTRICITI. - Table 60. ELECTRICITY.
Production en millions de Kwh. - Production in KWH. (000,000's omitted).
^PAYS - 1923 1924 1925 1926 1927 1928 1929 *1930 COUNTRY
AFRIQUE. AFRICA.
Alg6rie ...... . 47 58 72 79 80 ... ... Algeria.Maroc (fr.) . .. . . . . . . . 50 ... Morocco (Fr.).Union sud-africaine a). 1,442 1,581 1,761 1,889 2,110 ... ... ... Un. of South Afr. a).
AMEIRIQUE DU NORD. NORTH AMERICA.
Canada' ...... 8,099 9.315 10,110 12,093 14,549 16,338 * 17,633 17,828 Canada .hydraulique .. 7,936 9,159 9,942 11,911 14,346 16,106 *17.303 17,525 hydro-electric.thermique .' 158 149 161 174 203 231 *330 303 thermo-electric.
Etats-Unis (P.).. 55,665 59,014 65,870 73,791 80,205 87,850 97,352 95,638 United States' (P.).hydraulique ..... 19,343 19,969 22,356 26,189 29,875 34,696 34,629 32,789 hydroelectric.thermique . ..... 36,322 39,044 43,514 47,602 50,330 53,154 62,723 62,849 thermo-electric.
AMEIRIQUE CENTRALE. CARIBBEAN.
(Mexique) ..... . . . 1,262 1,381 ... ... ... (Mexico) ',
AMERIQUE DU SUD. SOUTH AMERICA.
Argentine ..... 466 537 587 631 692 752 829 Argentine'.Chili (P.) . . . . . . 113 165 214 230 245 260 ... .. Chile (P.).Uruguay b) (P.). . . 76 84 87 97 109 125 ... Uruguay b) (P.).
AsIE. ASIA.
Chine (P.) ...... . . 2,124 ... ... China (P.).hydraulique ...... 5 . hydro-electric.thermique ...... '2,119 ... ... thermo-electric.
Japon (P.) . .... 6,145 7,331 8,172 9,313 10,559 12,036 ... Japan (P.).Indes n6erlandaises(P.) 152 ... ... Dutch East Indies (P.).
hydraulique ..... . . hydro-electric.thermique ...... 55 thermo-electric.
Malaisie brit. . . . 50 57 69 86 130 199 ... British Malaya 5.hydraulique .. .19 21 19 22 27 38 hydro-electric.thermique ..... . 31 36 50 64 103 161 ... thermo-electric.
EUROPE. EUROPE.
Allemagne. .... . . 20,328 21,218 25,135 27,870 30,661 ... Germany.hydraulique ..... 2,852 3,318 3,806 3,566 3,564 ... hydro-electric.thermique ...... 17,476 17,900 21.329 24,304 27,097 thermo-electric.
Autriche ... ... . . 2,320 2,446 *2,500 *2,500 *2,500 2,500 Austria.Belgique ...... 1,650 2,274 3,243 3,725 4,270 ... Belgium.Bulgarie ... . . 21 32 36 45 65 86 ... Bulgaria.
hydraulique ..... 35 49 ... hydro-electric.thermique ...... 39 37 ... thermo-electric.
Danemark. .... . 300 340 380 422 458 500 545 ... Denmark.Espagne .. . . . 1,281 1,433 1,611 1,708 1,849 ... ... ... Spain '.Estonie . ..... 8 10 12 15 17 0 22 Estonia57Finlande ...... 329 534 541 610 685 755 995 ... Finland.France.8. ... 7,490 9,066 10,222 11,268 11,388 12,976 14,327 France 8
.hydraulique . . 3,405 3,600 4,000 4,743 5,057 5,598 6,125 hydro-electric.thermique ...... 4,085 5.466 6,222 6,525 6,331 7,378 8,202 thermo-electric.
Hongrie (.) . . . . 340 358 441 516 602 649 703 ... Hungary (P.).Italie 8 .8. .4,879 5,623 6,545 7,644 8,108 8,936 9,794 9,766 Italy s.
hydraulique . . . . . 6,193 7,281 7,817 8,694 9,410 9,504 hydro-electric.thermique . . . ... 352 363 291 242 84 262 thermo-electric.
Lettonie ...... 68 81 ... Latvia.hydraulique . . . . . 2 hydro-electric.thermique ...... 67 79 thermo-electric.
Norvege ...... 7,310 7,430 7,820 8,4-90 8,700 9,490 ... ... Norway.Pays-Bass. . . . . . c) 669 896 1,004 1,060 1,234 1,400 1,606 1,818 Netherlands '.Pologne 9 ...... 1,297 1,441 1,742 1,925 2,355 ... Poland .
- 125
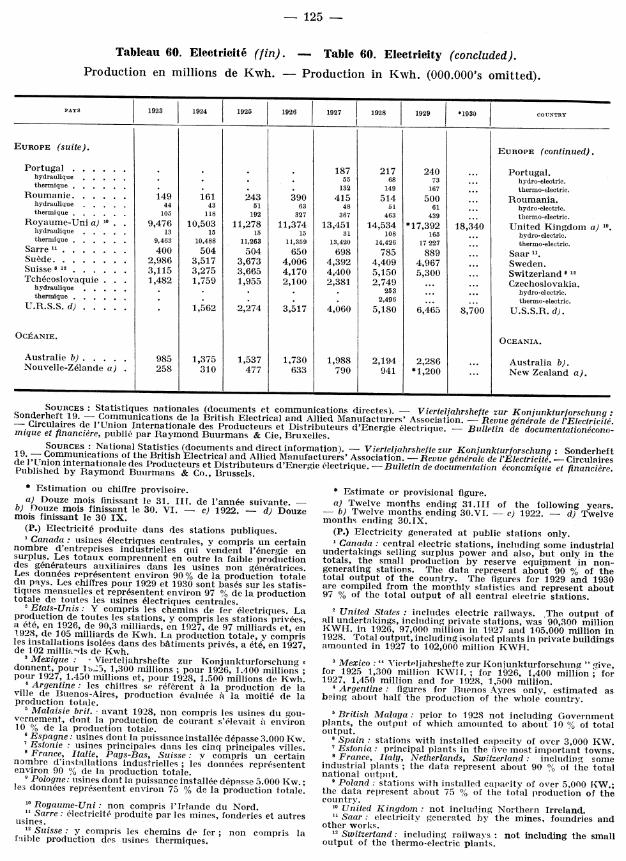
Tableau 60. Electrieite (fin). - Table 60. Electricity (concluded).
Production en millions de Kwh. - Production in Kwh. (000.000's omitted).
PAYS 1923 1924 1925 1926 1927 1928 1929 *1930 COUNTRY
EUROPE (suite). EUROPE (continued).
Portugal ...... 187 217 240 ... Portugal.hydraulique . . . . 5 68 73 ... hydro-electric.thermique . . . . . 132 149 167 ... thermo-electric.
Roumanie. . . . . . 149 161 243 390 415 514 500 ... Roumaniahydraulique ... .. 44 43 51 63 48 51 61 ... hydro-electric.thermique .. . ... 105 118 192 327 367 463 439 ... thermo-electric.
Royaume-Uni a) 10 9,476 10,503 11,278 11,374 13,451 14,534 *17,392 18,340 United Kingdom a) 1.hydraulique ..... 13 15 15 15 31 108 165 .. hydro-electric.thermique .. . ... 9,463 10,488 11,263 11,359 13,420 14,426 17 227 ... thermo-electric.
Sarre" . .. . ... 400 504 504 650 698 785 889 ... Saar Suede .. ... . 2,986 3,517 3,673 4,006 4,392 4,409 4,967 ... Sweden.Suisse 1 .. ... 3,115 3,275 3,665 4,170 4,400 5,150 5,300 ... Switzerland 12Tchcoslovaquie . . . 1,482 1,759 1,955 2,100 2,381 2,749 ... . Czechoslovakia.hydraulique . 253 ... ... hydro-electric.
thermique . .. . . . 2,496 ... .. thermo-electric.U.R.S.S. d) .... . 1,562 .2,274 3,517 4,060 5,180 6,465 8,700 U.S.S.R. d).
OCIANIE. OCEANIA.
Australie b). . . . . 985 1,375 1,537 1,730 1,988 2,194 2,286 ... Australia b).Nouvelle-Z6lande a). 258 310 477 633 790 941 *1,200 ... New Zealand a).
SOURCES Statistiques nationales (documents et communications directes). - Vierteljahrshefte zur Konjunkturforschunng:Sonderheft 19. Communications de la British Electrical and Allied Manufacturers' Association. - Revue generale de t'Electricite.- Circulaires de l'Union Internationale des Producteurs et Distributeurs d'Energie electrique. - Bulletin de documentationecono-mique et financiere, publice par Raymond Buurmans & Cie, Bruxelles.SOURCES: National Statistics (documents and direct information). - Vierteljahrsheftezur Konjunklurforschung: Sonderheft19. - Communications of the British Electrical and Allied Manufacturers' Association. - Revue generale de t'Electricite. - Circulairesde I'[Tnion internationale des Producteurs et Distributeurs d'Energie (-lectrique. - Bulletin de docuzlmentation econcmiqtle et financiere.Published by Raymond Buurman-s & Co., Brulssels.
* Estimation ou chiflre provisoire. * Estimate or provisional figure.a) Douze mois finissant le 31. IIT. de l'ann6e suivante. - a) Twelve months ending 31.111 of the following years.b) D)ouze mois finissant le 30. VI. - c) 1922. - d) Douze - b) Twelve months ending 30.VI. - c) 1922. - d) Twelvemois finissant le 30 IX. months ending 30.IX.(P.) Electricite produite dans des stations publiques. (P.) Electricity generated at public stations only.' Canada: usines 6lectriques centrales, y compris un certain I Canada: central electric stations, including some industrialnombre d'entreprises industrielles qui vendent l'6nergie en undertakings selling surplus power and also, but only in thesurplus. Les totaux comprennent en outre la faible production totals, the small production by reserve equipment in non-des generateurs auxiliaires dans les usines non g6n6ratrices. generating stations. The data represent about 90 % of theLes donn6es representent environ 90% de la production totale total output of the country. The figures for 1929 and 1930du pays. Les chiffres pour 1929 et 1930 sont bas6s sur les statis- are compiled from the monthly statistics and represent abouttiques mensuelles et repr6sentent environ 97 % de la production 97 % of the total output of all central electric stations.totale de toutes les ussines 6lectriques centrales.2 Etats-Unis: Y compris les chemins de fer electriques. La 2 United States : includes electric railways. The output ofproduction de toutes les stations, y compris les stations priv6es, all undertakings, including private stations, was 90,300 milliona 6t6, en 1926, de 90,3 milliards, en 1927, de 97 milliards et, en KWH-I. in 1926, 97,000 million in 1927 and 105,000 million in1928, de 105 milliards de Kwh. La production totale, y compris 1928. Total output, including isolated plants in private buildingsles installations isol6es dans des bAtimcnts prives, a 6te, en 1927, amounted in 1927 to 102,000 million KWH.de 102 millia-ds de Kwh.Mexique : Vierteljahrshefte zur Konjunkturforschung 3 Mexico :" Viertoljahrshefe zur Kon junkturforschung "give,donnent, pour 1,25, 1,300 millions ; pour 1926, 1.400 millions ; for 1925 1,300 million Kl TII.; for 1926, 1,400 million; forpour 1927, 1.450 millions et, pour 1928, 1.500 millions de Kwh. 1927, 1,450 million and for 1928, 1,500 million.4 Argentine: les chillres se r6efrcnt h la production de la Argentine: figures for Buenos Ayres only, estimated asville de Buenos-Aires, production evalu6e a la moiti6 de la being about half the production of the whole country.production totale.
5 Malaisie brit. avant 1928, non compris les usines du gou- 5 British Malaya: prior to 1928 not including Governmentvernement, dont la production de courant s'elevait i environ plants, the output of which amounted to about 10 % of total10 % de la production totale. output.6 Espagne: usines dont la puissance installee d6passe 3.000 Kw. 6 Spain : stations with installed capacity of over 3,000 KW.7 Estonie : usines principales dans les cinq principales villes. 7 Estonia: principal plants in the five most important towns.8 France, Italie, Pays-Bas, Suisse: y compris un certain 8 France, Italy, Netherlands, Switzerland: including somenombre d'installations industrielles; les donnieas repr6sentent industrial plants; the data represent about 90 % of the totalenviron 90 % de la production totale. national output." Pologne: isines dont la puissance installee depasse 5.000 Kw.; 9 Poland: stations with installed capacity of over 5,000 KW.;les donnies representent environ 75 % de la production totale. the data represent about 75 % of the total production of the
country.So Royaume-Uni: non compris l'Irlande du Nord. 10 United Kingdom : not including Northern Irreland.
11 Sarre: · lectricite produite par les mines, fonderies et autres 1" Saar: electricity generated by the mines, foundries andusines. other worlks.12 Suisse: y compris les chemins de fcr; non compris la 12 Switzertand: including railways : not including the smallfaible production des usines thermiques. output of the thermo-electric plants.

- 126 -
Tableau 61. PI.TROLE. - Table 61. PETROLEUM.Production en milliers de tonnes metriques - Production in metric tons (000's omitted)
PAYS 1921 1922 1923 1924 1925 1926 1927 1928 1929 *1930 COUTZY
AFRIQUE AFRICA.(Egypte) ...... 183 173 153 163 180 173 185 268 272 278 (Egypt.)
AMARIQUE DU NORD 64,745 76,441100,396 98,047104,670106,521123,547123,673138,010123,310 NORTH AMERICA.Canada. .. .. .. 27 26 25 23 48 47 61 81 145 195 Canada.Etats-Unis .... . 64,718 76,415 100,371 98,024 104,622 106,474 123,486 123,592 137,865 123,115 United States.
AM]RIQUE CENTRALE 29,320 27,668 23,147 21,956 18,263 14,450 10,477 8,655 7,993 7,250 CARIBBEAN.Mexique .... . . 28,978 27,312 22,704 21,367 17,626 13,758 9,728 7,585 6,780 5,980 MexicoTrinit6 (tle) . ... 342 356 443 589 637 692 749 1,070 1,213 1,270 Trinidad.
AM2fRIQUE DU SUD 1,009 1,521 1,949 3,122 5,128 8,698 14,247 21,612 26,601 26,523 SOUTH AMERICA.Argentine ... . 302 439 497 677 887 1,146 1,257 1.318 1.362 1.295 Argentine.Colombie ...... - 46 61 64 144 920 2,144 2,841 2,911 2,905 Colombia.Equateur...... - - - -_ 23 30 76 154 191 221 Ecuador.Perou ...... 489 701 752 1,046 1,220 1,395 1,386 1,588 1,774 1,648 Peru.Venezuela ..... 218 335 639 1,335 2,884 5,207 9,384 15,711 20,363 20,4154 Venezuela.
ASIE ......... 6,351 7.281 8,645 9,328 9,812 9,866 11,212 12,510 13,872 14,031 ASIA.Borneo brit. 203 410 567 602 613 713 712 751 760 839 Brit. N. Borneo.Inde (brit.) . ... 1,268 1,238 1,220 1,222 1,201 1,100 1,118 1,217 1,219 1,153 India.Indes n6erlandaises. 2,359 2,382 2,833 2,926 3,066 3,018 3,694 4,308 5,239 5,385 Dutch East IndiesIrak . . . . . . . . - - - - - -- 45 95 121 100 Iraq.Japon . . . . 298 285 251 252 266 248 248 270 279 271 Japan.Perse .... 2,223 2,966 3,774 4,313 4.652 4,759 5,326 5,763 6,072 6,023 Persia.Sakhaline russe ... — - - 13 14 28 69 106 182 260 Saghalien (Russian)
EUROPE ....... . 5,986 7,171 7,663 8,818 10,364 12,548 14,944 16,808 19,294 23,898 EUROPE.Allemagne . . . 38 42 51 59 79 95 97 92 103 170 Germany.France . . 56 70 71 71 65 67 73 81 83 82 France.Italie ........ 4 4 5 5 8 5 6 6 6 7 Italy.Pologne . . . . . . 705 713 737 771 812 796 723 743 675 663 PolandRoumanie .. ... 1,168 1,373 1,512 1,860 2,317 3,244 3,669 4,282 4,837 5,787 Roumania.Tchcoslovaquie . . 14 18 11 11 23 22 16 14 14 22 Czechoslovakia.U.R.S.S.a) .. .. 4,001 4,951 5,276 6,041 7,060 8.319 10,360 11,590 13,576 17,167 U.S.S.R. a)
MONDE ENTIER . . .. 107,594 120,255 14953141,434148,417152,256 174,612183,526206,042 195,290 WORLD.
SOURCEs Statistiqus nationales. — Nationals statistics. U. S. Department of Commerce ; Bureau of Mines: Mineral Resourcesof the U.S. Institut fur Konjunkturforschung: Vierteljahrshefte zur Konjunkturforschung; Sonderheft 19, 1930. Imperial Institute:Statistical Summary. The Petroleum Times. ,* Chiffres provisoires.—- *'Provisional figures.
a) Depuis 1923, ann6e finissant le 30 septembre. - a) Since 1923, year ending September 30th.
Tableau 62. GAZ NATUREL. - Table 62. NATURAL GAS.Consommation en millions de mi. - Consumption in cubic meters (000,000's omitted).
PAYS 1921 1922 1923 1924 1925 1926 1927 1928 1929 1930 COUNTRY
AMIRIQUE. AMERICA.Canada . . . . . . 399 416 452 421 479 544 605 639 804 837 Canada.Etats-Unis . . . . 18,748 21,594 28,515 32,325 33,658 37,182 40,931 44,406 52,299 ... United States.
AsiE. ASIA.Indes nerlandaises 1 94 100 218 277 402 364 348 468 525 ... Dutch East Indies.Japon ....... 33 32 26 20 23 22 28 27 ... ... Japan.
EUROPE. EUROPE.Italie ....... 7.9 6.7 6.9 6.7 6.9 5.9 5.8 6.4 7.0 ... Italy.Pologne . . . . . . 404 402 390 438 535 481 454 460 467 484 Poland.Roumanie ..... 180 250 287 362 370 377 439 613 807 ... Roumania.U.R.S.S ....... . 128 217 245 ... ... ... U.S.S.R.
SOURCES: Statistiques nationales. - Imperial Institute: The Mineral Industry.Note. - Les donn6es representent la quantit6 de gaz naturel Note. - The statistics refer to natural gas actually collectedeffectivement capt6e etutilis6e,soit pour 6clairage et chauffage, and utilised either as lighting and fuel or for transformationsoit pour etre transformee en essence ou autres produits. Le into gasoline or other products. The table does not includetableau ne comprend pas plusieurs pays pour lesquels il n'existe several countries for which statistics are not avialable.
pas de relev6s statistiques.1 Indes n~erlandaises · les donn-es originales exprimdes en Dutch East Indies : the original data expressed in metrict mnes ont 146 converties au taux approximatif de 976 millions tons were converted at the approximate rate of 1 long ton =de ma
pour une tonne m6trique. 35.000 feet (= 976 million cubic meters per I metric ton).

--- 127 -
Tableau 63. MINERAI DE FER. - Table 63. IRON ORE.
Production en milliers de tonnes m6triques. - Production in metric tons (000's omitted).
PAYS 1921 1922 1923 1924 1925 1926 1927 1928 1929 * 1930 COUNTRY
AFRIQUE. AFRICA.
Algerie . . . . . . 707 1,019 1,448 1,662 1,781 1,630 2,004 1,986 2,165 2,207 Algeria.Congo beige .... 81 75 106 107 87 113 78 51 50 56 Belgian Congo,Egypte . . . . . . 55 104 132 150 81 122 153 138 191 ... Egypt.Tunisie . . . . . 273 554 845 771 724 582 922 909 977 828 Tunis.Union Union of
Sud-Africaine . . 2 2 1 - - 47 78 21 38 ... South Africa.
AM]tRIQUE DU NORD. . NORTH AMERICA.
Canada...... 54 16 28 1 4 2 2 2 Canada.Etats-Unis . . .. 29,964 47,885 70,464 55,138 62,902 68,708 62,732 63,195 74,199 55,978 United States.Terre-Neuve . . . 349 1,019 733 993 1,150 880 1,357 1,573 1,541 1,197 Newfoundland.'
AMPIRIQUE CENTRALE. CARIBBEAN.
Cuba ...... . 132 452 374 481 567 587 422 401 * 234 Cuba.Mexique . . 51 52 27 93 64 80 ... ... Mexico.
AMJIRIQUE DU SUD. SOUTH AMERICA.
Chili ....... 8 290 673 1,050 1,234 1,396 1,508 1,525 1,809 ... Chile.
AsIE. ASIA.
Chine (E.) . . 515 672 739 853 822 525 503 925 980 China. (E.)Cor6e. ..... 233 186 306 324 376 388 423 559 559 ... Korea.Inde (brit.) . . 957 635 834 1,469 1,569 1,686 1,876 2,089 2,468 India.Japon . .87 40 55 58 76 130 159 158 178 Japan.Mandchourie . 206 140 214 220 221 567 631 674 781 ... Manchuria,
EUROPE. EUROPE.
Allemagne . . . 5,824 5,928 5,118 4,457 5,923 4,793 6,626 6,475 6,374 Germany.Autriche . . . 711 1,112 1,211 714 1,030 1,094 1,599 1,928 1,891 1,174 Austria.Belgique . . 59 71 117 155 166 145 182 164 156 Belgium.Espagne .... 2,602 2,772 3,456 4,613 4,443 3,182 4,960 5,771 6,546 5,408 Spain.France ... .. 14,201 21,106 23,428 28,992 35,763 39,480 45.482 49,008 50,597 48,457 France.Gr6ce . .55 49 100 102 88 127 124 167 ... Greece.Hongrie .36 46 138 102 69 132 194 200 252 157 Hungary.Italie. . 285 314 360 238 513 523 521 641 722 728 Italy.Luxembourg . 3,032 4,489 4,098 5,334 6,673 7,756 7,266 7,027 7,571 Luxemburg.Norvege . . 55 259 386 522 425 213 479 663 746 Norway.Pologne . 306 410 455 293 214 317 546 737 659 476 Poland.Portugal .... 10 18 9 9 2 2 8 14 9 Portugal.Roumanie. 91 95 99 103 107 103 97 84 90 ... Roumania.Royaume-Uni . . 3,526 6,946 11,050 11,228 10,306 4,160 11,386 11,443 13,427 United Kgdm.Suede. .. 6,464 6,201 5,588 6,500 8,169 8,466 9,661 4,669 11,468 Sweden.Tchecoslovaquie . 80! 313 675 1,174 1,230 1,421 1,591 1,779 1,808 Czechoslovakia.U.R.S.S. a). . .. 129 244 481 1,043 2,083 3,317 4,775 5,357 7,265 10,235 U.S.S.R. a)Yougoslavie . . 16 61 245 330 139 367 336 440 428 431 Yugoslavia.
OC]ANIE OCEANIA(Australie) . . . . 701 172 567 731 751 753 899 686 867 ... (Australia).
SOURCES: Statistiques nationales. Relev6s sp6ciaux fournis par les Administrations officielles de statistique. ImperialInstitute: Statistical Summary.
SOURCES: National statistics. Special statements submitted by the official statistical administrations. Imperial Institute:Statistical Summary.
* Estimation ou chiffre provisoire. (E.) Exportation. * Estimate or provisional figure. (E.) Exports.a) Depuis 1923, annde finissant fin septembre. a) Since 1923, year ending end of September.
Terre-Neuve: expeditions des mines. ' Newfoundland: shipments from mines.
- 128 -
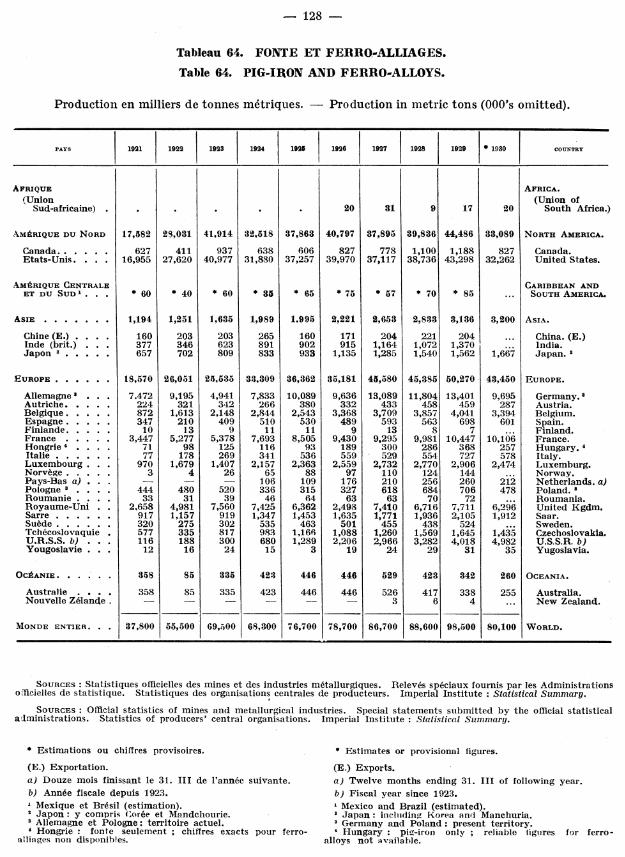
Tableau 64. FONTE ET FERRO-ALLIAGES.
Table 64. PIG-IRON AND FERRO-ALLOYS.
Production en milliers de tonnes metriques. - Production in metric tons (000's omitted).
PAYS 1921 1922 1923 1924 1928 1926 1927 1928 1929 * 1930 COUNTRY
AFRIQUE AFRICA.
(Union (Union ofSud-africaine) . . . . . . 20 31 9 17 20 South Africa.)
AM^RIQUE DU NORD 17,582 28,031 41,914 32,518 37,863 40,797 37,895 39,836 44,486 33,089 NORTH AMERICA.
Canada .. .. 627 411 937 638 606 827 778 1,100 1,188 827 Canada.Etats-Unis. 16,955 27,620 40,977 31,880 37,257 39,970 37,117 38,736 43,298 32,262 United States.
kAMIRIQUE CENTRALE CARIBBEAN ANDET DU SUD .. . * 60 * 40 * 60 35 *65 *75 *57 *70 85 ... SOUTH AMERICA.
ASIEm...... . . 1,194 1,251 1,635 1,989 1.995 2,221 2,653 2,833 3,136 3,200 ASIA.
Chine (E.) . . .. 160 203 203 265 160 171 204 221 204 ... China. (E.)Inde (brit.) . . . 377 346 623 891 902 915 1,164 1,072 1,370 ... India.Japon 2..... 657 702 809 833 933 1,135 1,285 1,540 1,562 1,667 Japan. "
EUROPE ...... 18,570 26,051 25,535 33,309 36,362 35,181 45,580 45,385 50,270 43,450 EUROPE.
Allemagne .. 7.472 9,195 4,941 7,833 10,089 9,636 13,089 11,804 13,401 9,695 Germany.'Autriche.... 224 321 342 266 380 332 433 458 459 287 Austria.Belgique. . .. 872 1,613 2,148 2,844 2,543 3,368 3,709 3,857 4,041 3,394 Belgium.Espagne. . . 347 210 409 510 530 489 593 563 698 601 Spain.Finlande. . . .. 10 13 9 11 11 9 13 8 7 ... Finland.France ..... . 3,447 5,277 5,378 7,693 8,505 9,430 9,295 9,981 10,447 10,106 France.Hongrie' . .. . 71 98 125 116 93 189 300 286 368 257 Hungary. 4
Italie .... . 77 178 269 341 536 559 529 554 727 578 Italy.Luxembourg. . . 970 1,679 1,407 2,157 2,363 2,559 2,732 2,770 2,906 2,474 Luxemburg.Norv$ge .. .. . 3 4 26 65 88 97 110 124 144 ... Norway.Pays-Bas a) . . - - - 106 109 176 210 256 260 212 Netherlands. a)Pologne . . . . 444 480 520 336 315 327 618 684 706 478 Poland. »Roumanie . . . . 33 31 39 46 64 63 63 70 72 ... Roumania.Royaume-Uni .. 2,658 4,981 7,560 7,425 6,362 2,498 7,410 6,716 7,711 6,296 United Kgdm.Sarre . . . . . . 917 1,157 919 1,347 1,453 1,635 1,771 1,936 2,105 1,912 Saar.Su~de . . . . . 320 275 302 535 463 501 455 438 524 ... Sweden.Tchecoslovaquie . 577 335 817 983 1,166 1,088 1,260 1,569 1,645 1,435 Czechoslovakia.U.R.S.S. b) . .. 116 188 300 680 1,289 2,206 2,966 3,282 4,018 4,982 U.S.S.R. b)Yougoslavie . . 12 16 24 15 3 19 24 29 31 35 Yugoslavia.
OC:ANIE. .. . . 358 85 335 423 446 446 529 423 342 260 OCEANIA.
Australie .. 358 85 335 423 446 446 526 417 338 255 Australia.Nouvelle Z61ande. 3 6 4 ... New Zealand.
MONDE ENTIER. . . 37,800 55,500 69,500 68,300 76,700 78,700 86,700 88,600 98,500 80,100 WORLD.
SOURCES : Statistiques officielles des mines et des industries m6tallurgiques. Relev6s sp~ciaux fournis par les Administrationsofficielles de statistique. Statistiques des organisations centrales de producteurs. Imperial Institute : Statistical Summary.
SOURCES : Official statistics of mines and metallurgical industries. Special statements submitted by the official statisticaladministrations. Statistics of producers' central organisations. Imperial Institute : Statistical Summary.
* Estimations ou chifTres provisoires. * Estimates or provisional figures.
(E.) Exportation. (E.) Exports.a) Douze mois finissant le 31. III de l'annee suivante. a) Twelve months ending 31. III of following year.b) Ann6e fiscale depuis 1923. b) Fiscal year since 1923.
^ Mexique et Brdsil (estimation). I Mexico and Brazil (estimated).2 Japon: y compris Corde et Mandchourie. 2 Japan: including Korea and Manchuria.P Allemagne et Pologne: territoire actuel. . Germany and Poland: present territory.* Hongrie : fonte seulement ; chif4res exacts pour ferro- 6 Hungary : pig-iron only ; reliable figures for ferro-
alliages noui disponibles. alloys not available.
- 129 -
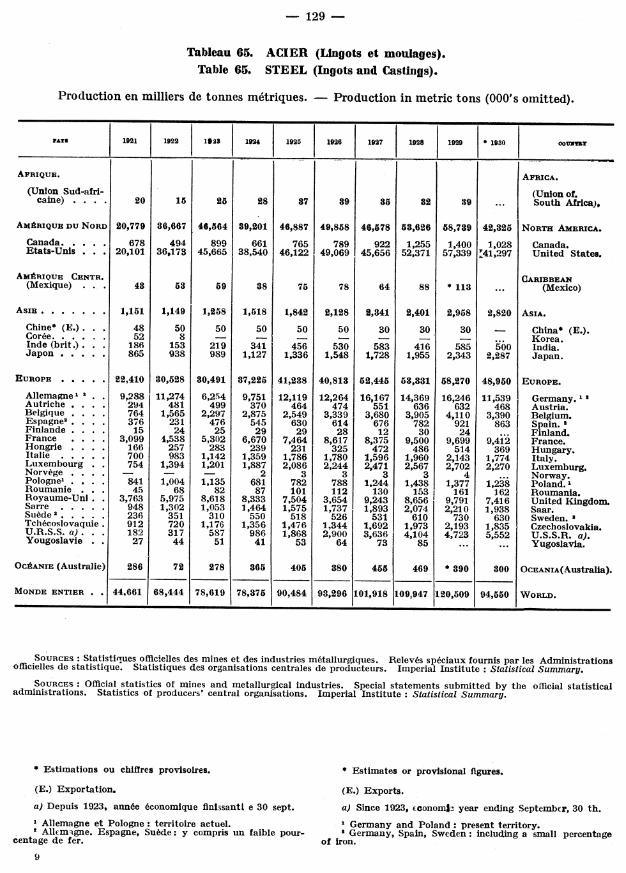
Tableau 65. ACIER (Lingots et moulages).Table 65. STEEL (Ingots and Castings).
Production en milliers de tonnes metriques. - Production in metric tons (000's omitted).
PAYr 1921 1922 1923 1924 1925 1926 1927 1928 1929 * 1930 oouTOs
AFRIQUE. AFRICA.
(Union Sud-afri- (Union of.caine) . ... 20 15 25 28 87 89 85 82 39 ... South Africa),
AMWRIQUE DU NORD 20,779 36,667 46,564 39,201 46,887 49,858 46,578 58,626 58,739 42,325 NORTH AMERICA.
Canada. 678 494 899 661 765 789 922 1,255 1,400 1,028 Canada.Etats-Unis . 20,101 36,173 45,665 38,540 46,122 49,069 45,656 52,371 57,339 y41,297 United States.
AMmRIQUE CENTR. CARIBBEAN(Mexique) ... 48 58 59 38 75 78 64 88 *113 ... (Mexico)
ASIE ....... 1,151 1,149 1,258 1,518 1,842 2,128 2,3841 2,401 2,958 2,820 ASIA.
Chine* (E.). . 48 50 50 50 50 50 30 30 30 China* (E.).Coree. 52 8 - - - Korea.Inde (brit.) . 186 153 219 341 456 530 583 416 585 500 India.Japon . . . 865 938 989 1,127 1,336 1,548 1,728 1,955 2,343 2,287 Japan.
EUROPE ..... 22,410 30,528 30,491 87,225 41,238 40,813 52,445 53,331 58,270 48,950 EUROPE.
Allemagne . . 9,288 11,274 6,254 9,751 12,119 12,264 16,167 14,369 16,246 11,539 Germany. Autriche . 294 481 499 370 464 474 551 636 632 468 Austria.Belgique . . .. 764 1,565 2,297 2,875 2,549 3,339 3,680 3,905 4,110 3,390 Belgium.Espagne . . . . 376 231 476 545 630 614 676 782 921 863 Spain. Finlande . . .. 15 24 25 29 29 28 12 30 24 Finland.France . . .. 3,099 1,538 5,302 6,670 7,464 8,617 8,375 9,500 9,699 9,412 France.Hongrie . . .. 166 257 283 239 231 325 472 486 514 369 Hungary.Italie . . . . . 700 983 1,142 1,359 1,786 1,780 1,596 1,960 2,143 1,774 Italy.Luxembourg . . 754 1,394 1,201 1,887 2,086 2,244 2,471 2,567 2,702 2,270 Luxemburg.Norvcge .. .. - 2 3 3 3 3 4 ... Norway.Pologne . . . 841 1,004 1,135 681 782 788 1.244 1,438 1,377 1,238 Poland.1Roumanie . . 45 68 82 87 101 112 130 153 161 162 Roumania.Royaume-Uni . 3,763 5,975 8,618 8,333 7,504 3,654 9,243 8,656 9,791 7,416 United Kingdom.Sarre . . . 948 1,302 1,053 1,464 1,575 1,737 1,893 2,074 2,210 1,938 Saar.Suede . . . . . 236 351 310 550 518 526 531 610 730 630 Sweden.Tch6coslovaquie. 912 720 1,176 1,356 1,476 1,344 1,692 1,973 2,193 1,835 Czechoslovakia.U.R.S.S. a). . . 182 317 587 986 1,868 2,900 3,636 4,104 4,723 5,552 U.S.S.R. a).Yougoslavie .. 27 44 51 41 53 64 73 85 ... ... Yugoslavia.
OCAANIE (Australie) 286 72 278 3865 405 380 455 469 * 890 300 OcEANIA(Australia).
MONDE ENTIER . . 44,661 68,444 78,619 78,375 90,484 98,296 101,918 109,947 120,509 94,550 WORLD.
SOURCES: Statistiques officielles des mines et des industries m6tallurgiques. Relev6s sp6ciaux fournis par les Administrationsofficielles de statistique. Statistiques des organisations centrales de producteurs. Imperial Institute : Statistical Summary.
SOURCES : Official statistics of mines and metallurgical industries. Special statements submitted by the official statisticaladministrations. Statistics of producers' central organisations. Imperial Institute: Statistical Summary.
· Estimations ou chiffres provisoires. * Estimates or provisional figures.
(E.) Exportation. (E.) Exports.
a) Depuis 1923, ann6e 6conomique finissantl e 30 sept. a) Since 1923, economlr year ending September, 30 th.
Allemagne et Pologne: territoire actuel. 1 Germany and Poland: present territory.* Allemigne. Espagne, Su6de: y compris un faible pour- a Germany, Spain, Sweden: including a small percentage
centage de fer. of iron.
9

- 130 -
Tableau 66. MINERAI DE CUIVRE. a) Brut. - Table 66. COPPER ORE. (a) Raw.Production en milliers de tonnes metriques. - Production in metric tons (000's omitted).
PAYS 1921 1922 1923 1924 1925 1926 1927 1928 1929 *1930 COUNTRY
AFRIQUE. AFRICA.Alg6rie. 2 2 3 3 3 3 2 2 0.3 6 Algeria.S.-Ouest afr. (E.) 39 31 39 46 51 38 34 40 S.-W. Afr. (E.).Union Sud-afric. - 33 142 167 199 209 229 208 240 Un. of S. Afr.
AMIERIQUE. AMERICA.Etats-Unis . . 12,153 24,397 41,294 44,614 48,175 51,875 51,460 56,334 ... United States.Chili . . . 2,511 6,749 10,099 10,587 11,922 12,752 14,718 18,803 21,688 ... Chile.
AsIE. Inde (brit.) 2 33 31 7 - - 10 6 18 78 ... ASIA. India 2
EUROPE. EUROPE.Allemagne . . 623 712 762 787 798 915 948 904 1,015 ... Germany.Autriche. . . 24 42 68 85 88 115 131 134 135 ... Austria.Bulgarie Bulgaria,
Minerai cuivre 14 24 24 26 28 36 11 11 31 Copper.· cuivre-plomb 0.1 - 17 9 10 ... Copper-lead
Espagne . . 2,139 2,055 2,419 1,899 3,681 3,937 3,984 3,972 4,270 3,729 SpainFinlande . 5 19 13 8 31 22 19 42 106 Finland.Hongrie 0.04 0.05 0.1 0.2 0.7 3.7 4.2 1.0 Hungary.Italie .. . 23 8 7 7 10 13 14 8 12 Italy.Norv6ge
4.. . 14 1 2 2 4 4 3 15 29 ... Norway
4.
Portugal . . 242 200 204 221 219 213 302 243 388 Portugal .Roumanie . . 1 3 0.2 4 8 23 5 3 13 ... Roumania.Tch6coslovaquie 0.01 0.01 0.2 0.6 3.6 16.7 44.5 52.3 55.6 ... Czechoslovakia.U.R.S.S. . 4 13 61 100 172 425 509 647 872 U.S.S.R.Yougoslavie . 76 96 123 145 176 220 288 328 329 49 Yugoslavia.
b) Contenu en mgtal. (En milliers de tonnes metriques). - (b) Metal content (Metric tons, 000's omitted).
AFRIQUE ..... 40.4 54.1 78.2 105.4 109.3 99.6 112.8 138.7 157.6 AFRICA.Alg6rie. 0.3 0.4 0.5 0.7 1.3 0.5 0.3 - 0.1 Algeria.Congo Bege . 30.5 43.4 57.9 85.6 90.1 80.6 89.2 112.5 130.0 140.0 Belgian Congo.Rhod6sie. .. 3.0 3.3 2.8 2.7 1.8 0.7 3.3 6.1 5.9 ... Rhodesia.S.-Ouest afr. a) 6.5 6.3 9.0 8.0 8.3 9.0 10.7 11.3 12.6 ... S.-West Afr. a).Union S.-Afr. 0.1 0.7 8.0 8.4 7.8 8.8 9.3 8.8 9.0 ... Union of S. Afr.
AMIRIQUE DU N. 233.1 457.0 709.7 775.9 811.8 843.0 812.0 912.9 1,025.3 763.8 NORTH AMERICA.Canada6 . . 21.6 19.5 39.4 47.4 50.6 60.4 63.6 91.9 112.5 137.6 Canada 6.Etats-Unis . . 211.5 437.5 670.3 728.5 761.2 782.6 748.4 821.0 * 912.8 626.2 United States.AMEIRIQUE CENTR. 23.0 37.7 64.3 61.7 66.5 68.2 74.0 84.4 * 101.0 CARIBBEAN.Cuba ... . 7.8 10.7 10.9 11.6 11.9 11.8 14.1 17.1 14.3 ... Cuba.Mexique . . . 15.2 27.0 53.4 50.1 54.6 56.4 59.9 67.3 ... ... Mexico.AMI1RIQUE DU SUD. 103.4 176.7 238.7 232.8 238.4 255.0 298.4 347.3 381.4 SOUTH AMERICA.Argentine . . . 0.5 0.5 0.3 0.8 0.8 0.8 0.8 - ... Argentine.
Bolivie. 9.7 9.2 10.7 7.4 6.8 6.4 7.1 7.5 7.2 ... Bolivia.Chili . . . 59.2 129.6 182.4 189.6 192.5 203.1 242.6 286.8 319.8 ... Chile.P6rou . . 33.3 36.4 44.2 33.9 36.9 43.8 47.8 53.0 54.4 ... Peru.Venezuela . . . 0.7 1.0 1.1 1.1 1.4 0.9 0.1 - - ... Venezuela.ASIE ....... 56.2 55.9 60.8 67.1 73.5 76.7 76.8 78.9 89.3 ASIA.
Chypre . . . 0.3 0.6 1.3 2.8 3.5 3.4 4.1 5.0 5.8 ... Cyprus.Inde (brit.). . 0.9 1.2 0.2 1.2 3.5 *5.9 *6.1 *5.7 *8.0 ... India.Japon .. .. 55.0 54.1 59.3 63.1 66.5 67.4 66.6 68.2 75.5 79.8 Japan.EUROPE. . 60.0 63.7 73.9 74.0 101.4 117.2 129.8 143.9 172.7 ... EUROPE.
Allemagne . . 15.5 17.5 18.2 22.7 23.8 27.2 27.7 26.8 29.1 ... Germany.Autriche' . . 0.6 1.1 1.6 1.7 1.7 2.1 2.3 3.0 2.1 ... Austria7.Espagne . . . 31.2 27.9 33.4 26.3 48.1 49.5 49.6 54.2 58.0 ... Spain.
Finlande . . . 0.8 0.6 0.4 1.4 1.0 0.8 1.9 4.6 ... Finland.France. .... - 0.1 0.1 0.1 0.2 ... France.Italie . . . . . 0.6 0.7 0.9 0.9 0.8 1.5 1.6 1.5 1.6 ... Italy.Norvge 8 . . . 5.0 8.0 8.5 10.2 11.0 12.5 12.3 15.8 17.5 Norway .Roumanie . . 0.1 0.1 0.1 0.1 0.1 0.2 0.2 0.1 0.1 ... Roumania.Royaume-Uni . 0.1 0.1 0.1 0.1 0.1 0.1 0.2 0.1 0.1 ... United Kingd.Suede . . . . . 0.2 0.2 0.8 - 0.2 0.7 0.8 0.6 *0.6 ... Sweden.Tchecoslovaquie 0.2 0.6 1.2 1.6 1.3 ... Czechoslovakia.U.R.S.S. . 2.0 2.0 2.9 3.5 6.6 12.0 20.0 23.2 37.0 ... U.S.S.R.Yougoslavie . 4.0 5.2 6.8 8.1 7.3 9.7 12.9 15.1 20.7 ... Yugoslavia.
OCIANIE, Australie 11.1 12.7 18.0 14.8 12.0 8.9 10.1 9.6 13.0 ... OCEANIA, AustraliaMONDE ENTIER. . 527.2 857.8 1,243.6 1,331.7 1,412.9 1,468.6 1,513.9 1,715.7 1,940.3 ... WORLD.
SOURCES: Statistiques nationales (documents divers et informations directes). - National statistics (various documentsand direct information). - Imperial Institute. The American Bureau of Metal Statistics. Metallgesellschaft (Frankfurt a. M.).Note. - Les donn6es de la partie b) du tableau ne correspon- Note. - The data given in part (b) of this table do not
dent pas necessairement toujours aux donn6es de la partie a). necessarily always correspond to those given in part (a).* Estimation ou chiffre provisoire. * Estimate or provisional figure.a) Douze mois finissant le 31. III. de l'ann6e suivante. (a) Twelve months ending 31.111. of the following year.Union Sud-africaine: minerai traite. 2 Inde: non-compris 1 Union of South Africa: ore treated. India : not includ-mattes de cuivre produites en Birmanie, comme sous-produit ing copper matte produced as a by-product in the smelting ofde la fonte du minerai de plomb-argent (en 1929, 11.500 t.). lead-silver ore in Burma (in 1929: 11,500 metr. t.). Spain:* Espagne: y compris pyrites de cuivre. * Norvege: non com- including copper pyrites. * Norway: excluding copper pyrites.pris pyrites de cuivre. 5 Portugal: minerai de cuivre pr6cipit6 * Portugal: precipitate of copper and copper pyrites. Canada:et pyrites de cuivre. ' Canada: y compris le cuivre utilis6 including the copper employed in the making of copper
pour la fabrication du sulfate de cuivre. ' Autriche: non com- sulphate. 7 Austria: excluding the copper content of pyrites.pris le cuivre contenu dans les pyrites. 8 Norvege : ces chiffres 'Norway: these figures include the recoverable copper contentcomprennent le cuivre pouvant 6tre extrait des pyrites, of pyrites.

- 131
Tableau 67. CUIVRE. - Table 67. COPPER.Production de fonderie (en milliers de tonnes m6triques).
Smelter production in metric tons (000's omitted).
PAYS 1921 1922 1923 1924 1925 1926 1927 1928 1929 *1930 coOmitB
AFRIQUE . ..... 33.5 46.7 60.7 88 .,3 91.9 81.3 92.5 118.6 142.9 ... AFRICA.
Congo belge . . 30.5 43.4 57.9 85.6 90.1 80.6 89.2 112.5 137.0 ... Belgian Congo.Rhod6sie. 3.0 3.3 2.8 2.7 1.8 0.7 3.3 6.1 5.9 ... Rhodesia.
AMtRIQUE DU NORD 275.2 526.5 770.6 831.0 883.8 923.5 911.5 1,018.3 1,142.5 879.1 NORTH AMERICA.
Canada 14.6 13.4 14.2 15.9 24.4 30.7 32.7 56.6 72.7 101.6 Canada.Etats-Unis . . . 260.6 513.1 756.4 815.1 859.4 892.8 878.8 961.7 1,069.8 777.5 United States.'
AM]RIQUE CENTRALE CARIBBEAN
(Mexique) . . .. 7.5 21.0 38.0 32.0 32.9 38.5 39.8 45.9 57.8 53.1 (Mexico).
AMARIQUE DU SUD. 79.3 149.4 206.2 208.7 214.0 230.5 272.6 327.2 358.7 260.0 SOUTH AMERICA.Chili ....... 46.9 113.7 162.8 174.8 177.1 188.9 226.2 274.9 303.2 208.1 Chile.P6rou ...... 32.4 35.7 43.4 33.9 36.9 41.6 46.4 52.3 55.5 ... Peru.
AsIE ....... 57.2 55.5 60.3 63.9 67.5 69.6 67.7 72.6 80.7 86.0 ASIA.
Chine (E.) . 1.0 0.3 0.8 0.8 1.0 2.2 1.1 4.4 3.4 China. (E.)Inde Cbrit.). 1.2 1.1 0.2 — - - 1.8 3.0 India.Japon ...... 55.0 54.1 59.3 63.1 66.5 67.4 66.6 68.2 75.5 79.8 Japan.
EUROPE ...... 79.9 81.6 87.4 101.6 116.2 130.5 156.8 161.0 186.9 187.0 EUROPE.
Allemagne .... 25.0 32.0 26.2 34.6 39.1 46.2 50.6 48.5 53.6 59.2 Germany.Autriche .... 4.3 4.6 4.8 3.8 3.8 3.2 3.3 3.4 3.9 ... Austria.Belgique . 5.2 6.3 6.7 8.1 9.7 9.5 8.9 9.7 8.9 Belgium.Espagne . . .. 22.0 10.0 13.2 16.6 21.3 23.9 28.7 27.8 28.5 22.3 Spain.Finlande. 0.2 0.3 0.4 0.3 0.4 0.4 0.4 0.4 0.3 Finland.France . . . . . 2.0 2.0 2.5 2.5 2.5 2.5 2.5 2.2 2.5 1.8 France.Italie . . 0.1 - 0.2 - 0.6 0.4 0.5 0.9 0.5 0.3 Italy.Norvege .... 1.3 0.1 0.1 0.1 0.3 0.2 - 0.8 2.4 ... Norway.Roumanie .... 0.1 0.1 0.1 0.1 0.1 0.2 0.2 0.1 0.1 ... Roumania.Royaume-Uni . 12.2 18.7 23.2 21.5 20.7 18.0 22.8 26.0 22.9 ... United Kgdm.Sude . . 1.3 0.1 0.1 2.1 3.8 4.0 5.6 3.6 4.9 ... Sweden. Tchcoslovaquie' 0.2 0.2 0.2 0.3 0.3 0.4 0.5 0.7 ... Czechoslovakia."U.R.S.S. . 2.0 2.0 2.9 3.5 6.6 12.0 20.0 22.0 37.0 U.S.S.R.Yougoslavie . . 4.0 5.2 6.8 8.1 7.3 9.7 12.9 15.1 20.7 24.5 Yugoslavia.
OCtANIE OCEANIA.
(Australie) . . . 18.9 11.7 18.1 14.3 11.2 11.8 9.7 12.0 11.0 13.3 (Australia.)'MONDE ENTIER .. . 552 892 1,241 1,340 1,418 1,485 1,551 1,756 1,981 1,624 WORLD.
Prix en francs-or Price in gold francspour 1 tonne m6tr. per 1 metric ton.
NEW-YORKNew-YO ( NEW YORKelectro- i moy. 1,428 1,529 1,648 1,488 1,604 1,576 1 476 1,665 2,069 1,484 av. electrolytic.lytique. electrolytic.
LONDRES LONDONelectro- moy. 1,473 1,569 1.695 1,539 1,651 1,629 1,544 1,724 2,116 ... av. electrolyticlytique. electrolytic.
SOURCEs: Statistiques nationales officielles. - National official statistics. American Bureau of Metal Statistics: Year-Book.Metallgesellschaft (Frankfurt a. M.): Statistische Zusammensiellungen. Imperial Institute: Statistical Summary.
• Estimation ou chiffre provisoire. * Estimate or provisional figure.
(E.) Exportation. (E.) Exports.
Etats-Unis: production de fonderie du mineral indigene et 1 United States : smelter production from domestic andttranger, des concentr6s, etc., ainsi qu'une certaine quantit6 de foreign ore, concentrates, etc., and also some blister from thecuivre provenant du traitement des mati6res secondaires. treatment of secondary material.2 Suede: cuivre raffin6, non compris le cuivre pr6cipit6. ' Sweden: refined copper, excluding precipitate of copper.
Tch6coslovaquie: cuivre 6lectrolytique et raffin6, non ' Czechoslovakia: electrolytic and refined copper, excludingcompris cuivre pr6cipit6. precipitate of copper.• Australie: cuivre raffing. * Australia: refined copper.

- 132—
Tableau 68. MINERAI DE PLOMB a) Brut. - Table 68. LEAD ORE. (a) Raw.Production en milliers de tonnes metriques. - Production in metric tons (000's omitted).
PAYS 1921 1922 1j 1923 1924 1925 j1926 11927 11928 1929 COUNTRY
AFRIQUE. AFRICA.Alg6rie 1 ....... 10 13 23 16 18 14 15 13 16 Algeria 1.Tunisie .. 19 30 36 40 38 37 37 34 31 Tunis.
AMIRIQUE. AMERICA.Canada ....... 14 25 70 139 189 231 250 232 ... Canada 2
.Etats-Unis . ... .. 6,467 6,612 6,906 7,774 7,766 7,582 7,574 7,301 ... United States'.Mexique ..... . . . . . 1,708 1,857 1,690 Mexico.Bolivie (E.)...... 4.8 6.1 9.0 33.6 36.8 30.9 22.7 18.0 21.6 Bolivia (E.).
ASIE. ASIA.Chine (E.) ...... 6 5 5 7 11 13 5 5 5 China (E.).Inde (Birmanie) . ... 146 175 250 315 327 369 458 451 472 India (Burma).Turquie ........ 8.4 1.5 5.5 6.5 8.1 7.3 Turkey.
EUROPE. EUROPE.Allemagne' .. . 70 63 68 100 105 134 139 153 167 Germany '.Autriche . . . . . . 76 83 103 113 104 124 128 131 115 Austria .Bulgarie 3 . . . 3 3 4 8 9 11 1 4 Bulgaria.Espagne . . . . . . . 168 168 182 199 208 216 196 177 180 Spain.France'. ....... 6 10 19 25 16 16 23 16 12 France".Grece . ....... 23 39 54 71 77 84 90 71 ... Greece.Italic .. . 28 31 37 41 51 54 55 55 53 Italy.Pologne ....... 19 21 19 17 21 18 18 17 17 Poland'.Royaume-Uni 6 . 7 11 13 15 16 19 21 19 24 United Kingdom '.Sude. . .1 2 3 3 3 4 7 6 12 Sweden.Tch6coslovaquie . ... 12 12 13 14 15 Czechoslovakia.Yougoslavie ...... 60 61 57 12 79 80 101 115 113 Yugoslavia.
OCI.ANIE: Australie 7. . . 54 203 249 250 287 283 296 252 ... OCEANIA: Australia 7.
(b) Contenu en metal du minerai extrait. - (b) Metal content of ore mined.
AFRIQUE ........ 48.5 61.0 69.9 60.7 51.4 49.1 54.5 58.5 54.6 AFRICA.Alg6rie ....... 6.2 8.0 12.5 8.8 9.3 7.8 8.4 6.6 7.7 Algeria.Rhod6sie ....... 18.0 20.8 11.2 6.0 4.4 3.9 6.0 4.8 1.7 Rhodesia.Sud-Ouest Africain. .. 12.8 10.7 20.2 18.8 16.0 17.3 20.1 26.7 25.9 South-West Africa.Tunisie ........ 11.3 17.4 21.0 22.5 20.3 19.8 19.8 20.4 19.2 Tunis.Union Sud-Africaine . . 0.2 4.1 5.0 4.6 1.4 0.3 0.2 - 0.1 Union of South Africa
AMI~RIQUE DU NORD . 407.6 475.2 548.2 620.0 733.7 751.5 746.6 724.4 *735.5 NORTH AMERICA.Canada ........ 30.2 42.3 50.5 79.6 115.0 128.7 141.3 153.3 148.1 Canada.Etats-Unis ...... 377.4 432.9 497.7 540.4 618.7 622.8 605.3 571.1 *587.4 United States.
AMiRIQUE CENTRALE CARIBBEAN.(Mexique) ...... 60.5 110.5 155.7 164.1 171.8 210.8 243.3 236.5 248.4 (Mexico).
AMEIRIQUE DU SUD * . 6.0 9.5 11.3 26.0 34.2 34.1 25.4 34.0 41.5 SOUTH AMERICA *.Argentine * . . 3.0 3.5 . 4.5 7.6 2.3 2.4 3.0 ... Argentine *.Bolivie (E.) . . . . . . 21.0 18.4 15.3 12.7 15.0 Bolivia (E.).Chili . . - 0.3 i.6 1.3 2.1 3.1 2.5 1.4 ... Chile.P6rou ........ 0.5 0.7 0.7 0.8 3.5 10.3 5.2 16.9 21.8 Peru.
ASIE * . ........ 56.2 68.4 76.2 * 83.5 81.8 92.9 118.2 117.5 118.8 ASIA *.Chine * . . . 2.0 2.5 2.0 4.8 6.2 3.5 3.5 5.1 China *.Inde (britannique). . . 48.1 57.3 70.0 71.9 68.9 76.9 103.2 103.2 103.7 India.Japon ........ 3.1 3.2 2.7 2.9 3.3 3.6 3.4 3.7 3.4 Japan.Turquie ....... 3.0 5.4 1.5 5.1 4.8 6.2 8.1 7.1 6.6 Turkey.
EUROPE ........ * 181.2 * 188.6 208.1 232.7 253.8 273.5 271.5 266.1 * 276.5 EUROPE '.Allemagne.. . . . 23.0 30.9 35.9 46.1 49.7 50.0 52.0 Germany.Autriche . . . . . . . 4.8 5.0 6.2 6.5 6.5 8.2 9.3 9.4 7.5 Austria.Espagne .. . 102.0 106.7 117.2 127.3 130.1 135.9 122.0 113.3 116.3 Spain.France ........ 2.1 3.5 3.0 3.1 4.8 4.5 6.0 * 7.5 * 7.5 France.Gr6ce. 5.7 3.0 4.2 4.8 4.6 5.1 5.3 7.3 5.4 Greece.Italie ....... 14.7 15.4 19.9 21.3 28.1 29.2 30.2 31.4 29.0 Italy.Pologne. . . . 10.5 12.0 14.5 12.3 12.7 12.2 15.0 Poland.Portugal ....... 0.3 . . 0.1 0.3 0.5 0.3 Portugal.Royaume-Uni . . . . . 5.5 9.0 10.2 11.6 12.7 15.5 16.6 15.1 18.9 United Kingdom.Su.de . . . . 1.0 0.9 1.1 2.0 2.6 3.1 4.9 3.3 * 3.5 Sweden.Tch6coslovaquie et Czechoslovakia and
Yougoslavie. . . 7.0 10.8 12.5 12.5 12.9 12.0 13.1 12.8 12.5 Yugoslavia.U.R.S.S. 0.3 0.3 0.3 0.7 1.0 1.3 1.2 3.5 8.5 U.S.S.R.
OC2IANIE (Australie) . . . 85.2 154.4 174.6 156.6 187.6 185.3 203.4 182.2 197.1 OCEANIA (Australia).MONDE ENTIER.. . .. . 845.2 1,067.6 1,244.0 1,343.6 1,514.3 1,597.2 1,662.9 1,619.2 1,672.4 WORLD.
SOURCES : Statistiques nationales. - National statistics. Imperial Institute : Statistical Summary. American Bureau of MetalStatistics : Year-Book. Metallgesellschaft (Frankfurt a. M.): Statistische Zusammenstellungen. The Mineral Industry (New York).
* Estimation ou chiffre provisoire. (E) Exportations. * Estimate or provisional figure. (E.) Exports.:,Alg6rie: non compris les minerals mixtes. 2 Canada: exp- 1 Algeria: excluding mixed ores. ' Canada: shipments ofdition des mines de minerals et de concentr6s. 8 Etats-Unis, lead ores and concentrates from mines. ' United States, Bulga-Bulgarie, France: voir tableaux 66 et 70, contenant des ria, France : see tables 66 and 70 showing mixed ores.donn6es pour les minerals mixtes. * Allemagne et Pologne: * Germany and Poland: present territory. » Austria : includingterritoire actuel. a Autriche : y compris minerai de zinc, zinc ore. 6 United Kingdom: dressed ore. ' Australia: silver-" Royaume-Uni: mineral trait6. Australie: minerai de plomb- lead ore, concentrates, etc. 'Europe: totals do not include
argent, concentres, etc. -Europe: non compris certains pays certain small producers.producteurs peu importants,

--- 133 -
Tableau 69. PLOMB. Table 69. LEAD.
Production de fonderie (en milliers de tonnes m6triques.)Smelter production in metric tons (000's omitted).
PAYS 1921 1922 1928 1924 1925 1926 1927 1928 1929 *1930 COUTRYO
23.5 AFRICA.AFRIQUE ...... 33.7 34.7 26.1 22.5 18.6 24.0 28.5 27.4 23.4 desia
Rhod6sie . . .. 18.0 20.8 11.2 6.0 3.4 3.9 6.0 4.8 1.7 19.1 Tunis.Tunisie. .... 15.2 13.2 14.3 15.7 13.6 18.4 18.7 17.6 18.8 Union of S.-Afr.Union S.-Afr. ... and S.-W. Africa.et Sud-Ouest afr. 0.5 0.7 0.6 0.8 1.6 1.7 3.8 5.0 2.9
AM~RIQUE DU NORD. 484.6 520.1 606.8 685.6 792.5 841.5 856.8 845.2 840.8 733.0 NORTH AMERICA.Canada .... . . 27.6 36.9 45.9 59.2 96.7 116.7 134.2 136.6 138.1 Canada.Etats-Unis . . 407.0 483.2 560.9 626.4 695.8 724.8 722.6 708.6 702.7 596.2 United States.1
AMtRIQUE CENTRALE(Mexique). .... 60.0 114.2 150.5 133.9 143.0 173.7 214.5 215.5 230.0 ... CARIBBEAN (Mexico).
AM~RIQUE DU SUD . 2.6 3.7 3.7 4.7 7.8 8.7 7.9 21.7 28.8 ... SOUTH AMERICA.
Argentine. ... 2.5 3.6 3.6 4.5 7.7 8.5 7.8 8.4 9.4 ... Argentine.P6rou (E.) 0.1 0.1 0.1 0.2 0.1 0.2 0.1 13.3 19.4 ... Peru. (E.)
ASIE ....... 46.0 49.1 51.6 61.7 56.5 65.0 79.4 90.3 91.4 90.0 ASIA.
Chine (E.) .... 0.3 0.7 0.7 1.1 0.4 0.2 0.1 - - . China. (E.)Indebrit... .. 34.3 39.8 46.8 52.6 48.0 55.2 68.0 79.6 81.5 80.8 India.Japon ...... 3.1 3.2 2.7 2.9 3.3 3.6 3.4 3.7 3.4 ... Japan.Turquie . . . . . 8.3 5.4 1.4 5.1 4.8 6.0 7.9 7.0 6.5 ... Turkey.
EUROPE ...... 297.2 291.1 289.0 342.8 393.3 388.0 405.5 397.8 409.1 418.0 EUROPE.
Allemagne. ... . 75.0 65.0 31.9 50.2 70.5 76.6 84.0 87.0 97.9 110.8 Germany.Autriche ..... 3.3 3.4 4.3 5.0 5.4 6.5 8.1 8.1 6.6 Austria.elgique . . .. 25.0 43.6 51.1 58.3 65.6 61.7 66.1 62.6 60.0 54'0 Belgium. Espagne . .. .. 135.9 119.2 127.5 141.8 153.6 149.5 144.0 131.0 133.6 128.0 Spain.France...... 15.5 13.9 17.4 18.9 20.5 19.5 24.2 21.0 21.0 19.4 France.Gr/ce ...... 5.6 4.7 4.2 5.1 5.4 5.1 53 7.3 5.3 Greece.Italie. ...... 12.5 10.7 17.1 22.1 24.5 23.6 23.8 21.2 22.7 24.3 Italy.Pologne 2 .. . . . 13.8 14.5 16.3 21.3 28.6 27.9 29.6 37.1 36.5 44.4 Poland.2
Roumanie . . . . 0.4 0.2 0.4 0.4 0.5 0.7 0.8 0.5 0.6 Roumania.
(AustraEie) . . . 56.6 107.2 120.48 128.7 148.56 1,52.9 167.1 157.6 179.7 166.6 (Australia).MONDE ENTIER 930.7 1,120.1 1,248.1 1,379.9 1,560.2 1,653.8 1,759.7 1,755.5 1,80.2 1,670.0 WORLD.
pour 1 tonne m6tr. per 1 metric ton.NEw-YORK . OY. 523 662 844 945 1,040 959 771 721 780 631 av. NEW YORKplomb i oy. 446 538 606 759 883 771 605 525 576 ... av. foreignimportie }^' lead. ra
SOURCES: Statistiques nationales of ficielles. - National\official statistics. American Bureau of Metal Statistics : Year-Book,Reports. Metallgesellschaft (Frankfurt a. M.): Statistische Zusammenstellungen. Imperial Institute: Statistical Summary.
* Estimation ou chiffre provisoire. I Estimate or provisional figure.(E.) Exportation. (E.) Exports.
et plomb provenn2t du vieux metal. and secondary lead.2 Allemagne et Pologne : territoire actuel. £ Germany and Poland: present territory.* Belgique: i Plombs marchands.. » Belgium: merchantable lead.
Sude: plomb raffin, non compris plomb provenant du Sweden: refined lead, excluding secondarylead.vieux m6tal.

- 134 -
Tableau 70. MINERAI DE ZINC. a) Brut. - Table 70. ZINC ORE. (a) Raw.Production en milliers de tonnes m6triques. - Production in metric tons (000's omitted).
PAYS 1921 1922 1923 1924 1925 1926 1927 1928 1929 COUNTRY
AFRIQUE. AFRICA.Alg6rie ..... 15 20 41 43 56 62 48 23 *35 Algeria.Tunisie ..... 5 7 12 15 20 25 17 10 9 Tunis.
AMERIQUE. AMERICA.Canada . . . . 270 323 253 174 157 220 186 281 ... Canada".Etats-Unis. United States.
Minerai de zinc. 1,549 2,419 3,687 2,867 3,095 3,755 6,190 5,312 ... Zinc ore., plomb-zinc 3,389 7,761 9,967 12,116 16,094 17,321 13,288 12,137 ... Lead-zinc ore.Mexique . 5 17 42 59 120 216 280 311 (E.)293 Mexico.
Bolivie (E.) . .. - - - 6 17 13 6 3 Bolivia (E.).P6rou . .... - - - (E.) 4 26 23 13 20 Peru.
ASIE. ASIA.Chine (E.) . . 12 61 61 20 35 25 5 8 22 China (E.).Cor6e ...... - - 1 4 7 4 Korea.Indochine frangaise 11 21 31 43 53 62 55 52 *50 Indo-China.
EUROPE. EUROPE.Allemagne . .. 96 98 78 103 122 200 260 261 270 Germany 2.Belgique . I 10 12 12 *10 ... Belgium.Bulgarie. Bulgaria,
Minerai de zinc. 0.1 - - - 0.4 1.5 2.3 1.9 Zinc ore.») plomb-zinc — — _---_ 7 15 11 Lead-zinc ore.Espagne . . . . 48 72 102 117 168 201 132 122 145 Spain.France, France,Minerai de zinc. 3 2 11 15 15. 19 15 9 8 Zinc ore., plomb-zinc . . 18 14 37 49 Lead-zinc ore.Gr 'ce .2 .. . ]2 1 4 5 8 35 31 18 Greece.Italie ...... 63 95 133 151 177 178 222 220 224 Italy.Pologne . . . 275 265 280 292 375 406 347 321 377 Poland 2
.Royaume-Uni . 1 2 2 2 2 2 3 2 2 United Kingdom.Suede ...... 29 38 42 48 51 56 63 34 72 Sweden.Tch6coslovaquie . 1.8 1.3 - 0.7 1.1 0.5 0.9 0.6 0.1 Czechoslovakia.Yougoslavie . . 0.1 0.4 0.6 0.5 0.5 0.6 1.1 1.2 1.1 Yugoslavia. 3OC]tANIE (Australie) 4 81 370 433 362 233 277 288 327 ... OCEANIA (Australia)'
b) Contenu en mdtal. (Milliers de tonnes metriques.) - (b) Metal content. (Metric tons, 000's omitted.)
AFRIQUE . .. . 7.8 13.1 24.8 23.3 30.6 34.1 25.2 33.6 *40.6 AFRICA.Algerie . . . . . 6.0 10.0 18.8 17.6 20.3 22.0 18.0 15.0 13.0 Algeria.Rhod6sie . . . - - - - 2.0 0.1 - 13.6 22.6 Rhodesia.Tunisie ..... 1.8 3.1 6.0 5.7 8.3 12.0 7.2 5.0 *5.0 Tunis.
AMEIRIQUE DU NORD. 256.9 453.7 581.4 623.7 694.5 770.7 727.0 714.4 727.3 NORTH AMERICA.Canada ..... 24.1 25.5 27.4 44.9 49.6 68.0 75.1 83.8 89.5 Canada.Etats-Unis . . 232.8 428.2 554.0 578.8 644.9 702.7 651.9 630.6 637.8 United States.AM.RIQUE CENTRALE CARIBBEAN.
(Mexique) . . . . 1.3 6.1 18.5 18.9 45.8 105.4 136.5 161.7 174.1 (Mexico).AM.IRIQUE DU SUD - - *0.2 *0.3 4.8 23.2 17.1 8.3 *10.5 SOUTH AMERICA.
Bolivie (E.) . . - *0.2 *0.2 2.8 7.6 5.6 2.3 1.4 Bolivia (E.).Chili ...... 0.1 0.5 1.0 0.5 ... Chile.P6rou . .... - - 0.1 1.9 15.1 10.5 5.5 8.5 Peru.
AsE . ....... 43.5 *63.3 *81.7 *80.7 *88.5 *95.4 *103.1 *101.9 *90.1 ASIA.Chine . . . . . . 4.3 18.3 18.4 *10.0 *15.0 *12.0 *10.0 *5.0 *5.0 China.Inde (brit.) . . . 29.6 30.3 42.3 43.9 42.7 46.2 60.8 65.4 56.3 India.Indo-Chine . . . 5.0 8.7 13.0 16.8 20.8 25.2 22.3 21.5 18.8 Indo-China.Japon . . . 4.6 *6.0 *8.0 *10.0 *10.0 *12.0 *10.0 *10.0 *10.0 Japan.EUROPE ...... *186.0 *204.0 249.8 282.2 336.7 390.7 415.0 392.5 *434.6 EUROPE.Allemagne. . . . 31.7 41.7 49.1 79.4 111.4 117.0 120.0 Germany.Autriche. . 0.1 0.6 1.0 1.2 1.9 2.2 3.5 4.5 4.0 Austria.Espagne . . .. 17.6 21.9 38.1 41.9 48.8 53.0 47.1 43.0 52.9 Spain.
France . 5.6 0.7 3.4 8.0 4.8 5.7 8.6 7.8 *8.0 France.Grce . . . . . . 1.0 1.5 15 1.4 1.5 6.0 6.0 3.8 4.0 Greece.Italie .. . 27.6 40.2 52.9 58.5 69.3 71.4 85.1 84.6 68.0 Italy.Norvege . ... 0.2 0.7 0.6 0.3 -0.1 -1.4 Norway.Pologne. . . 104.0 109.7 140.0 148.9 125.5 114.5 140.0 Poland.Royaume-Uni ' 0.4 0.8 1.0 1.1 0.7 0.8 1.3 0.7 0.9 United Kingdom.Sude . . 10.5 14.2 15.0 17.1 18.6 21.3 24.4 14.2 *30.0 Sweden.U.R.S.S.. 0.1 0.5 1.0 1.7 2.0 2.0 2.4 5.4 U.S.S.R.
OC1tANIE (Australie) 141.7 198.7 145.5 109.9 141.0 153.3 174.3 150.2 157.0 OCEANTE (Australia).MONDE ENTIER. . *637.2 *938.9 1,101.9 1,139.0 1,341.9 1,572.8 1,598.2 1,562.6 1,634.2 WORLD.
SOURCES : Statistiques nationales. - National Statistics. American Bureau of Metal Statistics. Metallgesellschaft. ImperialInstitute.
Note. - Comme les statistiques ont 6t6 puis6es dans des Note. - As the statistics have not always been takensources diff6rentes, les donn6es de la partie b) du tableau ne from the same sources, the data given in part (b) of this tablecorrespondent pas n6cessairement toujours aux donn6es de la do not necessarily always correspond to those given inpartie a). part (a).* Estimation ou chiffre provisoire. (E.) Exportations. * Estimate or provisional figure. (E.) Exports.1 Canada : expeditions des mines de zinc, du minerai et des 1 Canada : shipments of zinc ores and concentrates from minesconcentr6s.'Allemagne et Pologne: territoire actuel. 2 Germany and Poland: present territory.2 Yougoslavie: sous-produit des mines de plomb. 3 Yugoslavia: secondary product of lead mines.'Australie : zinc et concentr6s de zinc. ' Australia: zinc and zinc concentrates.

-- 135 -
Tableau 71. ZINC.
Table 71. ZINC.
Production de fonderie (en milliers de tonnes m6triques).
Smelter production in metric tons (000's omitted).
PAYS 1921 1922 1923 1924 1925 1926 1927 1928 1929 * 1930 COUNTRY
AFRIQUE AFRICA(Rhodesie) . . . - - - - 0.2 0.2 - 9.9 12.3 18.2 (Rhodesia).
AMaSRIQUE DU NORD. 205.9 346.9 490.3 494.2 554.7 617.0 603.9 620.9 644.7 567.7 NORTH AMERICA.
Canada ... . . 24.0 25.5 ; 27.2 24.9 34.9 56.0 66.4 74.2 78.1 110.2 Canada.Etats-Unis . . .. 181.9 321.4 463.1 469.3 519.8 561.0 537.5 546.7 566.6 457.5 United States.
AMPIRIQUE CENTRALE CARIBBEAN(Mexique) ... .. - - 0.1 - 1.3 6.0 6.4 11.2 15.1 29.4 (Mexico).
ASIE ........ 11.7 12.7 14.3 14.5 18.5 19.2 19.0 22.3 27.1 ... ASIA.
Chine * ..... 1.3 0.2 0.5 0.3 0.3 0.3 0.3 0.3 0.3 ... China. *Indochine. . 0.1 1.2 1.9 1.2 2.9 3.8 ... Indo-China.Japon ' . .. . 10.4 12.5 13.8 14.1 17.0 17.0 17.5 19.1 23.0 ... Japan.'
EUROPE ...... 212.4 324.0 398.9 447.9 511.9 528.2 628.0 690.8 705.6 672.0 EUROPE.
Allemagne . ... 27.4 34.8 32.4 41.5 58.6 68.3 84.1 98.1 102.0 97.3 Germany. Belgique . . ... 66.2 112.3 147.0 161.7 170.9 188.8 199.1 206.3 197.9 178.0 Belgium.Espagne . .. . 6.7 6.3 10.9 12.8 15.1 16.1 16.5 13.5 11.8 9.8 Spain.France .. ... 24.2 39.7 49.3 57.7 64.3 64.2 79.6 96.8 91.5 90.7 France.Italie . .. . . . . . 0.5 3.1 3.7 6.0 6.5 7.6 7.4 10.7 15.8 19.0 Italy.Norv6ge . .. .. 2.0 1.9 3.8 5.0 6.8 5.4 5.5 - 5.5 .. Norway.Pays-Bas ..... 6.4 13.0 16.4 18.2 21.1 24.8 26.3 26.9 25.7 23.3 Netherlands.Pologne .... 68.9 84.7 96.5 93.1 114.3 123.7 150.3 161.8 169.0 174.0 Poland. '
UnitedRoyaume-Uni . . 3.0 23.4 33.5 38.6 42.7 17.3 42.7 56.3 59.2 49.4 Kingdom. 4Suede .... 3.5 1.6 1.3 3.5 4.7 4.8 4.7 5.1 4.8 ... Sweden.Tch6coslovaquie 3.2 2.0 2.2 6.9 3.0 2.8 6.3 8.0 10.7 ... Czechoslovakia.U.R.S.S... . - 0.8 1.7 2.0 2.0 2.4 5.4 ... U.S.S.R.Yougoslavie. . 0.4 1.2 1.9 2.1 2.2 2.4 3.5 4.9 6.3 5.4 Yugoslavia.
OCANIE OCEANIA(Australie) . . . . 1.7 24.1 41.8 47.1 46.4 48.1 49.9 51.0 52.7 55.9 (Australia).
MONDE ENTIER . . . 432 708 945 1,004 1,133 1,219 1,307 1,406 1,458 1,370 WORLD.
SOURCES: Statistiques nationales. - National statistics. American Bureau of Metal Statistics: Year-Book. Metallgesellschaft(Frankfurt a. M.): Statistische Zusammenstellungen. Imperial Institute: Statistical Summary.
* Estimation ou chiffre provisoire. * Estimate or provisional figure.
' Chine: estimations d'aprbs les chiffres de l'exportation. ' China: estimated from export figures.' Japon: y compris la production provenant du vieux m6tal a Japan: including production from old metal.' Allemagne, Pologne: territoire actuel. s Germany, Poland: present territory.* Royaume-Uni: y compris une partie provenant du vieux ' United Kingdom: includes some secondary metal.metal.

- 136 -
Tableau 72. MINERAI D'iTAIN. CONTENU EN M1ETAL.
Table 72. TIN ORE. METAL CONTENT.
Production en milliers de tonnes m~triques. - Production in metric tons (000's omitted).
PAYs 1921 1922 1923 1924 1925 1926 1927 1928 1929 * 1930 coNTRTY
AFRIQUE ...... 6.5 6.4 7.5 8.2 8.4 10.0 10.4 11.5 13.2 10.7 AFRICA.Congo belge . .. 0.4 0.6 0.5 0.5 0.6 1.3 0.9 0.8 1.0 Belgian Congo.Nig6ria. . . . . 5.1 5.2 6.0 6.3 6.4 7.5 8.2 9.3 10.9 8.8 Nigeria.Swazieland . . 0.3 0.1 0.1 0.2 0.2 0.1 0.1 0.1 0.1 0.1 Swaziland.Union Union ofSud-Africaine . . 0.7 0.5 0.9 1.2 1.2 1.1 1.2 1.3 1.2 1.0 South Africa.
AMtRIQUE DU SUD * 19.5 32.6 30.5 32.3 33.3 30.3 36.6 41.2 43.9 37.8 SOUTH AMERICA.*Bolivie (E.) .... 19.1 32.3 30.2 32.1 33.1 30.1 36.4 41.0 43.7 37.6 Bolivia. (E.)Autres pays* . . 0.4 0.3 0.3 0.2 0.2 0.2 0.2 0.2 0.2 ... Other countr.*
ASIE ........ 84.1 90.4 89.3 95.2 98.8 99.0 108.1 119.8 128.9 122.0 ASIA.Chine . 11.3 14.0 8.9 7.1 8.5 6.6 6.3 7.1 7.0 7.0 China.Etats Malais Fed. Malay
fEdres (E.).. 35.0 35.9 38.3 44.8 46.7 46.7 53.0 62. 9 68.1 63.1 States. (E.)Etats Malais Unfed. Malaynon fdr6s (E.). 1.8 2.0 1.8 2.0 2.2 1.8 2.1 2.7 2.4 1.9 States.(E.)Inde (brit.) . . . 1.4 1.6 1.4 1.3 1.6 2.5 2.5 2.0 2.7 2.0 India.Indes neerland a) 27.8 29.1 30.4 31.3 31.9 32.7 35.1 35.9 36.3 34.9 D. East Indies a)Indochine francaise 0.3 0.4 0.4 0.5 0.6 0.6 0.7 0.8 0.9 . Fr. Indo-China.Japon . 0.3 0.3 0.3 0.3 0.4 0.5 0.7 0.7 0.8 1.0 Japan.Siam. . . . . . 62 7.1 7.8 7.9 6.9 7.6 7.7 7.7 10.7 11.3 Siam.
EUROPE ...... . 0.9 0.9 1.5 2.2 3.1 3.3 3.4 3.6 3.9 3.1 EUROPE.Allem-gne .... 0.1 0.1 0.1 0.1 0.1 0.1 0.1 0.1 0.1 ... Germany.Portugal . . 0.1 0.4 0.4 0.1 0.6 0.8 0.7 0.7 0.5 ... Portugal.Royaume-Uni . . 0.7 0.4 1.0 2.0 2.4 2.4 2.6 2.8 3.3 2.5 United King.
OCAANIE OCEANIA(Australle) 3.7 2.6 3.3 3.1 3.1 2.9 3.2 2.9 2.3 1.8 (Australia).
MONDE ENTIER . . 114.7 132.9 132.1 141.0 146.7 145.5 161.7 179.0 192.2 175.4 WORLD.
SOURCES: Statistiques nationales. - National statistics. American Bureau of Metal Statistics: Year-Book, etc. Metallgesellschaft (Frankfurt a. M.): Statistische Zusammenstellungen, etc. Imperial Institute: Statistical Summary.
* Estimation ou chiffre provisoire. * Estimate or provisional figure.
(E.) Exportation. (E.) Exports.
a) Pour les mines de 1'Etat, douze mois finissant fin f6vrier a) For State mines, twelve months ending end of Februaryde l'ann6e suivante. of following year.
? Allemagne: production de la Saxe. i Germany: production in Saxony.

137
Tableau 73. ]TTAIN.
Table 73. TIN.
Production de fonderie (en milliers de tonnes m6triques).
Smelter production in metric tons (000's omitted).
PAYS 1921 1922 192 1924 1925 1926 1927 1928 1929 * 1930 CooUNr
AM]RIQUE DU NORD NORTH AMERICA.(Etats-Unis). .. 10. 8.3 6.8 0.4 - - (United States.)
AMIRIQUB DU SUD SOUTH AMERICA.(Bollvie) (E.). . 0.1 0.2 1. - 0.1 - - - ... (Bolivia.) (E.)
ASIE'....... 63.8 98.2 95.5 105.8 105.1 101.9 108.2 122.9 125.3 121.7 ASIA. Chine (E.).. . . 6.2 9.2 8.1 7.1 9.0 6.6 6.3 7.1 6.8 7.0 China. (E.)Inde (brit.) . . 0.2 0.2 - -_ ... India.Indes n6erlan- Dutch Eastdaises (E.) . . 13.5 15.5 15.2 15.7 14.7 16.7 15.8 14.2 13.6 14.8 Indies. (E.)
EUROPE .. . .. 17.5 27.3 84.4 89.6 41.2 46.4 51.3 58.8 67.4 53.5 EUROPE.
Allemagne. .. . 2.9 3.4 2.4 2.5 1.0 2.2 5.4 7.0 7.0 5.6 Germany.Belgique et France 0.4 0.5 0.5 0.5 0.6 1.5 2.2 2.0 2.5 Belgium- France.Royaume-Uni . . 14.2 23.4 31.5 36.6 39.6 42.7 43.7 49.8 57.9 46.1 United Kingdom.
OC3ANIE OCEANIA(Australie) . . . .0 2.7 3.1 3.2 3.2 3.2 3.0 3.2 2.3 1.8 (Australia).
TOTAL . .. . 94.4 131.7 141.3 149.0 149.6 151.5 162.5 184.9 195.0 177.0 TOTAL.
SOURCES: Statistiques nationales officielles. - National official statistics. American Bureau of Metal Statistics : Year-BookReports. Metallgesellschaft (Frankfurt a. M.): Statistische Zusammenstellungen. Imperial Institute: Statistical Summary.
* Estimation ou chiffre provisoire. * Estimated or provisional figure.
(E.) Exportation. (E.) Exports.
Bolivie: exportation d'etain en barres. i Bolivia: exports of tin in bars.Asie: il n'est pas possible d'avoir des donn6es sur la 2 Asia : figures of actual smelter production are notproduction reelle de fonderie dans tous les pays asiatiques. obtainable for all Asiatic countries. Most of the ore is smel-La plus grande partie du mineral est fondue a Singapour et ted at Singapore and re-exported as tin bars. Export figuresr^exportee sous forme de barres d'etain. Pour tous les pays asia- of tin in bars are thus given instead of smelter productiontiques, a l'exception de l'Inde brit., de l'Indochine et du figures for all Asiatic countries-
except India, Indo-ChinaJapon, on donne par consequent des chiffres relatifs a and Japan.l'exportation de l'etain en barres au lieu de la production defonderie.
Siam: exportations moins les importations. ' Siam: exports less imports.

- 138
Tableau 74. MLNERAI DE MANGANESE - Table 74. MANGANESE OREProduction en milliers de tonnes m6triques. Production in metric tons (000's omitted)
PAYS 1921 1922 1923 1924 1925 1926 1927 1928 1929 COUNTRIES
AFRIQUE. AFRICA.
Cote del'Or (E.) . . 7.3 67.2 141.9 258.5 362.9 404.9 375.1 329.7 414.8 Gold Coast (E.).Egypte. . .. .
.. 55.1 104.1 132.4 150.2 80.6 121.9 152.8 137.5 191.5 Egypt 1.Maroc francais (E.) 0.4 0.7 0.3 2.4 2.2 0.2 French Morocco (E.).
Rhod6sie du Nord - -- - - 0.7 1.8 1.9 Northern Rhodesia.Tunisie . . . . .. 1.1 0.2 1.2 2.8 1.7 1.4 2.1 2.5 0.1 Tunis.Union Sud-Africaine. 0.3 0.2 0.6 0.9 0.5 0.8 1.3 - 9.4 Union of South Africa.
AMIRIQUE DU NORD. NORTH AMERICA.
Etats-Unis ..... 2 13.7 363.8 356.8 57.4 99.9 47.0 45.5 47.6 61.3 United States 2
AMIERIQUE CENTRALE. CARIBBEAN.
Cuba . .. 0.6 9.2 19.6 25.3 23.8 24.6 129.8 87.1 ... Cuba.Mexique. . 2.2 1.8 3.3 3.3 0.9 0.7 Mexico.Porto-Rico (E.). . . . 2.8 4.7 4.3 1.4 1.7 1.5 ... Porto Rico (E.).
AMEIRIQUE DU SUD. SOUTH AMERICA.
Argentine 0.1 0.2 0.1 Argentine.Br6sil .. .. . 275.6 340.6 235.8 159.2 326.5 260.5 241.8 319.8 293.3 Brazil.Chili ........ 0.9 4.3 4.2 11.1 10.6 7.7 9.2 3.1 Chile.
ASIE. ASIA.
Chine (E.) ..... 25.6 19.2 27.7 38.5 43.3 42.5 46.3 43.3 41.9 China (E.).Inde (brit.) . .... 690.2 482.0 706.2 815.9 852.9 1,031.2 1147.4 994.1 1,023.4 India.Indes portugaises . - - - 0.7 3.1 2.4 4.2 Portuguese India.Indes n6erlandaises 2.1 3.2 5.2 8.5 11.0 11.4 18.5 24.5 20.7 Dutch East Indies.Japon ....... 3.9 4.4 5.5 7.6 12.0 15.2 27.6 17.7 Japan.Turquie.. ..... - - - - 0.1 - 0.1 0.2 Turkey.
EUROPE. EUROPE.
Allemagne. ..... 3.4 5.5 10.2 3.6 0.1 - 0.2 0.5 Germany.Autriche.. : 13.3 19.9 24.0 15.1 21.4 23.3 33.0 39.6 39.1 Austria 3
.
Espagne . 20.1 25.5 28.6 20.8 36.1 44.9 36.9 13.7 16.6 Spain.France . . 3.5 5.2 6.0 3.7 4.0 4.6 27 3.0 *1.1 France.Grce ........ 1.3 - 5.8 4.3 6.3 8.1 1.1 ... Greece.Hongrie. 2.4 0.4 1.2 3.1 9.9 17.3 22.2 19.0 Hungary.Italie .5.1 . . 12.2 15.0 14.1 9.8 10.3 9.9 Italy.
Suede .. . . 6.2 4.5 5.0 10.9 10.9 15.3 16.8 15.8 14.6 Sweden.Tch6coslovaquie . . 43.5 23.6 42.1 79.1 78.0 95.2 108.4 99.4 96.5 Czechoslovakia.U. R. S. S. . .. .. 66 319 426 634 898 833 737 1,184 U.S.S.R.Yougoslavie . . . . . 0.9 1.1 5.1 4.6 2.7 1.2 2.0 2.7 4.5 Yugoslavia.
OCIANIE (Australie)... 6.1 3.3 2.9 4.8 1.2 1.4 1.5 0.2 0.2 OCEANIA (Australia).
SOURCES: Statistiques nationales. - National Statistics. Imperial Institute: Statistical Summary.* Estimations ou chiffres provisoires. * Estimates or provisional figures.(E.) Exportations. (E.) Exports.Egypte: manganese et mineral de fer. "Egypt: manganese and iron ore.
2YEtats-Unis: quantit6s exp~dies par les mines; non com- 2United States : shipments, excluding ore containing 10-35 %pris le mineral contenant 10-35 0/0 Mn, inclus avec mineral Mn, which is included with iron ore and which amounted inde fer et dont la production s'est 6levee, en 1928, A 92.034 1928 to 92,034 metric tons.tonnes.3,Autriche: contenu en manganese des minerals de manga- 3Austria: manganese content of manganese ore and man-nase et de fer manganifsre. ganiferous iron ore.

- 139 -
Tableau 75. PYRITES. - Table 75. PYRITES.Production en milliers de tonnes metriques. - Production in metric tons (000's omitted).
PAYS 1921 1922 1923 1924 1925 1 192 1927 1927 1928 1929 COUNTRY
AFRIQUE AFRICA.
Alg6rie ..... 19 7 21 18 13 12 13 14 17 Algeria.
AMtIRIQUE AMERICA.
Etats-Unis ... 160 172 185 163 173 169 219 185 ... United States.
ASIE ASIA.
Chypre 12 30 63 141 (E)176 168 203 248 293 Cyprus.Japon ....... 95 162 226 221 313 418 506 594 619 Japan.
EUROPE ....... *4,250 4,122 *4,370 4,086 5,484 5,946 6,249 6,055 ... EUROPE.Allemagne ... .. 414 329 193 160 223 238 350 342 352 Germany.Autriche ...... 23 19 15 28 25 22 19 10 - Austria.Espagne ...... 2,605 2,339 2,653 2,212 3,359 3,655 3,611 3,625 ... Spain.France ....... 189 187 202 194 213 194 201 202 195 France.Grce ....... 50 55 52 76 65 81 100 94 Greece.Italie........ 448 486 493 516 534 594 625 558 * 665 Italy.Norvege . . . 231 396 375 403 624 635 617 739 740 Norway.Pologne ....... 1 1 6 8 11 19 25 11 9 Poland.Portugal ...... 185 184 220 217 211 301 242 384 Portugal.Roumanie ...... 16 20 26 33 27 42 26 24 24 Roumania.Suede ....... 46 57 58 66 70 70 69 20 72 Sweden.Tch6coslovaquie ... 35 9 - 16 22 23 23 24 ... Czechoslovakia.U. R. S. S ... .. 6 28 100 128 55 109 225 100 ... U.S.S.R.Yougoslavie .. 11 . * 26 39 53 57 64 62 Yugoslavia.
TOTAL ........ *4,540 4,500 *4,870 4,630 6,160 6,710 7,190 7,100 ... TOTAL.
SOURCES: Statistiques nationales (Annuaires, statistiques de l'industrie min6rale). Imperial Institute.SOURCES: National Statistics (Year-Books, Statistics referring to mineral industry). Imperial Institute.
· Estimation ou chiffre provisoire. * Estimate or provisional figure.(E.) Exportation. (E.) Exports.Note. - Les pyrites de fer (FeS') contiennent a l'6tat pur Note. - Pure iron pyrites (FeS,) contain 46.4 % of iron and
46,6 % de fer et 53,4 % de soufre. Dans certains pays, et tout 53.4 % of sulphur. In some countries, especially in Spain,sp6cialement en Espagne, les pyrites de fer se trouvent parfois pyrites are sometimes mixed up with copper, hence the deno-m6lang6es avec du cuivre, d'ot l'appellation « pyrites de cuivre ,. mination "copper pyrites ". The sulphur content of pyritesLe contenu en soufre des pyrites extraites est donn6 au mined is shown in table 90.tableau 90.
Tableau 76. - BAUXITE. - Table 76. BAUXITE.Production en milliers de tonnes metriques. - Production in metric tons (000's omitted).
PAYS 1921 1922 1923 1924 192 19265 1926 7 1928 1 1929 1930 COUNTRY
AMIRIQUE DU NORD. NORTH AMERICA.
Etats-Unis . . . . 141.8 314.6 531.1 353.1 321.6 398.5 326.1 381.5 371.6 ... United States.
AMtIRIQUE DU SUD. SOUTH AMERICA.
Guyane britann.. . 20.0 - 135.7 188.1 197.5 222.5 193.0 200.9 220.1 ... British Guiana.Surinam (E.) . . . - 13.0 12.6 60.0 86.8 46.5 176.3 206.8 *210.0 ... Surinam (E.).
ASIE. ASIA.
Inde (brit.). . . . 4.7 4.1 5.9 22.5 10.2 5.0 4.4 11.3 9.2 ... India.
EUROPE. EUROPE.
Allemagne . . 10.1 15.2 6.7 3.1 1.8 0.3 2.4 6.9 6.9 Germany.Autriche .. .. 2.6 4.1 2.7 *3.0 *4.0 *5.0 ... ... ... ... Austria.Bulgarie 1 . ... - - - - - 1.9 2.8 2.7 3.6 ... Bulgaria .France . .. . 95.3 236.1 314.2 335.6 406.5 408.6 540.0 597.8 643.0 538.3 France.Grace . .... 1.0 3.7 2.3 4.3 0.3 ... Greece.Hongrie ... . . 0.5 0.2 0.4 3.7 339.5 396.0 389.2 ... Hungary.Irlande du Nord . 2.3 .0 3.5 5.2 5.4 2.3 2.4 ... Northern Ireland.Italie..... 4. 49.1 66.6 98.1 140.8 195.0 90.5 95.3 162.2 192.8 143.0 Italy.Roumanie . . .. - 3.7 4.2 - - 0.7 1.7 0.7 0.9 ... Roumania.Yougoslavie. . . . 10.0 31.3 32.6 18.5 79.0 131.8 100.3 49.3 103.4 93.7 Yugoslavia.
OCIlANIE. OCEANIA.Australie ..... -- -- - 0.9 0.2 0.6 ... Australia.
SOURCES: Statistiques nationales. - National statistics. Imperial Institute: Statistical Summary.
Note. - Outre la bauxite, il y a encore un mineral aluminifere Note. - In addition to bauxite, there is another alumi-- la cryolite - dont les gisements se trouvent au Groenland; niferous ore - Cryolite - which is found in Greenland ; thesa production s'est 61lev6e en 1929 a 30.000 tonnes. quantity mined in 1929 amounted to 30,000 tons.
* Chiffres provisoires. * Provisional figures.(E.) Exportation. (E.) Exports.'Bulgarie : minerai d'aluminium et caolin. ' Bulgaria: aluminium ore and kaolin.

- 140
Tableau 77. ALUMINIUM. - Table 77. ALUMINIUM.Production estimee de fonderie en milliers de tonnes metriques.
Estimated smelter production in metric tons (000's omitted).
PAYs 1921 1922 1923 1924 1925 1926 1927 1928 1929 COUNToY
AM]RIQUE DU NORD 32.5 45.2 75.2 80.2 78.2 86.3 99.4 105.4 140.7 NORTH AMERICA.Canada 1
. . . . 8.0 9.2 12.2 12.2 12.2 18.3 27.4 25.4 38.6 Canada.'Etats-Unis . .. 24.5 36.0 63.0 68.0 66.0 68.0 72.0 80.0 102.1 - United States.EUROPE . .. .. 42.2 50. 3 70.6 86.4 101.5 111.6 109.4 119.5 130. 5 EUROPE.
Allemagne 2 . . . 10.0 * 15.0 * 15.9 18.7 26.2 29.6 27.4 30.5 31.5 Germany. Autriche . . . . 2.0 2.0* 1 .5 2.2 3.0 3.0 4.0 4.0 3.7 Austria.'Espagne . ... . 0 7 1 .0 Spain.France . .. . . 4 7 5 14.3 16.3 18.4 23.6 25.0 26.4 29 France.Italie ... . . 0.7 0.8 1.5 2.1 1.9 1.9 2.5 3.5 7.4 Italy.Norvege . . . . 4.0 4.9 13.3 20.0 21.3 24.4 20.8 24.8 29.1. Norway.Royaume-Uni . 1 7.1 9.1 8.1 9.7 8.1 9.7 9.7 8.1 United Kingdom.Suisse' . . . 12.0 13.0 * 15.0 19.0 21.0 21.0 20.0 19.9 20. 7 Switzerland.'MONDE ENTIER . . 74.7 95.5 1456.8 166.6 179.7 197.9 208.8 224.9 271.2 WORLD.
Prix en francs-or Price in gold francspour 1 tonrne mtr. per 1 metric ton.NEw-YORK 99 %mNEWYORKNEW9-YORK moy. 2,412 2.134 2,903 3,088 3,107 3,084 2,902 2,731 2,731 av. virgin metal
98-99 %ALLEMAGNE moy. . . 2,765 2.926 2,825 2,593 2,444 2,346 av. GERMANY.
SouRcEs: Statistiques nationales. - National statistics. American Bureau of Mletal Statistics: Year-Bcok. Metal!.gesellschaft (Frankfurt a. M.): Statistische ZusommnenslellunBen. Imperial Institule: Sflaisli(ol Sumnn cry.* Estimation. * Estimate.1 Canada: comme il n'existe qu'un seul producteur canadien F Canada: as there is only one Canadian producer of alu-d'aluminium, il n'est pas publie de chiffres officiels de pro- minium, no official production figures are published. Theduction. Les estimations disponibles varient dans des limites available estimates vary within comparatively wide limits.comparativement assez larges.
Allemagne, Autriche, Suisse: la production exacte, en 2 Germany, Austria, Switzerland: the exact production inAutriche, en Allemagne et en Suisse, en 1921-22, est difficile h Austria, Germany and Switzerland in 1921-22 is difficult to1tablir par suite du manque de specification des chiffres de ascertain on account of lack of specification in the productionproduction de l'Aluminium-Industrie.A.-G., laquelle possede des figures of the Aluminium-lndustrie-A.-G. which operates plantsusines dans ces trois pays. La distribution donn6e dans ce in all three countries. The allocation shown in the table istableau est une estimation. estimated.
Tableau 78. NICKEL 1. Table 78. NICKEL.I'Production en milliers de tonnes metriques. - Production in metric tons (000's omitted).
PAS 1921 1922 2 1924 1925 1926 192 1928 1929 1930 COUT Y
AMPIRIQUE DU NOnD 8.9 8.2 28.4 31.7 33.7 30.1 31.1 44.4 50.3 NORTH AMERICA.Canada . . 8.8 8.0 28.3 31.5 33.5 29.8 30.3 43.9 50.0 47.1 Canada. Etats-Unis . . . 0.1 02 0.1 0.2 0.2 0.3 0.8 0.5 0.3 ... United States.'
ASIE ASIA(Inde (brit.))3 . . - - - __ _ 0.3 0.7 0.8 ... (India).
EUROPE ... . -- 0.1 -- - 0.6 0.4 ... EUROPE. 4(Norvege ) . . . - 0.1 - - 0.6 0.4 ... (Norway. ')
OC]2ANIE (Nouvelle- OCEANIA (NewCal(donie) I . . . 2.6 3.6 2.7 3.6 3.4 3.8 3.2 3.5 4.2 .. Caledonia).
MONDE ENTIER. . 11.5 11.8 31.2 35.3 37.1 33.9 34.6 49.2 55.7 ... WORLD.
Prix en francs-orPrice in gold francspour 1 ton nemetr. iper metric ton.per 1 metric ton.CANADA moy. 3,071 3,380 2,799 2,819 3,428 3,399 3,313 3,313 3,313 3,313 av. CANADAlingots 98,5 /%
lingots 98.5%.
SOURCES: Statistiques nationales - National statistics. Imperial Institute: Statistical Summary.* Estimation. * Estimate.1 Tous les pays sauf les Etats-Unis: nickel contenu dans 1 All countries except U.S.A.: nickel contained in the matteles mattes fondues provenant des minerais. smelted from domestic ore.2 Etats-Unis : nickel obtenu comme co-produit dans le ' United States: nickel obtained as a by-product in theraffinage 6lectrolytique du cuivre. electrolytic refining of copper.' Inde (brit.): m6tal contenu dans les mattes obtenues 3 India: metal content of nickel speiss obtained as a by-comme co-produit dans la fonte. pr oduct in smelting operations.' Europe: non compris le nickel obtenu des mattes import6es, 4 Europe: excluding nickel obtained from imported matte,du vieux metal, ou du raffinage 6lectrolytique du cuivre. old metal, or electrolytic refining of copper.

141 -
Tableau 79. OR. - Table 79. GOLD.Production en kilogrammes. - Production in kilograms.
PAYS 1922 1923 1924 1925 192 1 1927 1928 1929 * 1930 OOUTma
AFRIQUE. *249,800 *316,200 *329,800 *329,000 *340,500 344,250 *350,840 *354,400 *363,000 AFRICA.Afrique occ. fr.. 348 132 408 179 132 95 21 ... ... French W. Africa.Bechuanaland 187 95 43 114 118 64 54 54 Bechuanaland.Congo belge . 2,311 3,147 3,606 3,764 4,125 4,031 4,313 5,375 6,093 Belgian Congo.C6te de I'Or. 6,615 6,206 6,404 6,180 6,207 5,337 5,198 6,795 ... Gold Coast.Egypte 8 15 29 11 20 2 - - . Egypt.Ethiopie . 620 *620 *620 *620 *620 672 284 140 ... Ethiopia.Kenya. 39 *24 * 24 20 25 28 Kenya.Madagascar 578 451 429 420 307 210 210 216 ... Madagascar.Mozambique 365 327 165 382 284 295 132 12 ... Mozambique.Nig6ria . .. 22 29 45 31 4 1 3 6 Nigeria.Rhodesie . . 20,382 20,189 19,564 18,126 18,482 18,096 17,938 17,465 16,645 Rhodesia.Soudan (E.) . 253 259 311 272 230 222 182 78 ... Sudan. (E.)Sud-Ouest Afric . 5 55 53 31 17 14 ... S.W, Africa.Swaziland . . 3 3 12 41 47 35 11 3 ... Swaziland.Tanganyika .. 12 61 242 315 251 297 399 328 Tanganyika.Union S.-Afr. 218,031 284,575 297,824 298,526 309,628 314,845 322,054 323,860 333,333 Union of S. Africa.
AMhiRIQUE DU NORD. 110,501 113,835 123,537 126,148 124,194 123,483 125,514 121,827 ... NORTH AMERICA.Canada . . .. 39,296 38,361 47,446 53,989 54,564 57,628 58,804 59,977 65,537 Canada.Etats-Unis. . . 71,205 75,474 76,091 72,159 69,630 65,855 66,710 61,850 69,400" United States.
AM.RIQUE,CENTRALE. * 27,037 27,171 27,355 27,550 26,742 24,813 23,626 21,931 ... CARIBBEAN. *
Mexique . . . 23,275 24,162 24,647 24,541 24,033 22,556 21,745 20,276 ... Mexico.Am6rique Centre.* 3,762 3,009 2,708 3,009 2,709 2,257 1,881 1,655 ... Central America.'
AMIRIQUE DU SUD.* *16,000 *18,000 *17,000 16,800 17,300 15,009 13,900 *15,800 ... SOUTH AMERICA.*Argentine *... 112 120 '90 83 75 30 30 30 ... Argentine.*Bolivie. 13 13 30 12 10 8 16 21 .. Bolivia.Br6sil . . .. 4,562 4,500 3,758 3,743 3,176 3,190 3,114 3,340 ... Brazil.Chili . . .. . 2,483 3,283 3,484 3,293 3,596 976 958 ... Chile.Colomble . . . 2,382 2,849 2,649 2,080 2,384 ... Colombia.
*
Equateur . . 1,320 1,456 1,204 1,128 1,928 1,991 2,319 2,094 ... Ecuador.Guyane brit.. 338 226 224 283 216 185 189 227 ... Guiana, Brit.
• franr?. 1,390 1,392 1,251 1,210 1,407 1,504 1,414 1,436 .. . French.Prou . . .. 2,533 3,744 3,700 3,420 2,860 2,878 2,193 3,799 ... Peru.Surinam ... 374 396 323 309 259 240 171 111 ... SurinamVenezuela*. . . 540 390 654 950 896 1,343 1,434 1,446 ... Venezuela. *
ASIE.* 82,800 3,100 *34,300 36,200 38,700 37,000 37,400 37,100 ASIA. *Chine*..... 3,000 2,800 3,300 3,300 3,500 3,000 3,000 1,500 ... China.*Core . .. 3,009 3,609 3,879 4,439 6,852 5,578 5,175 4,406 .. Korea.Etats Malais f6ed 440 298 465 440 450 366 581 831 ... Fed. Malay States.Formose . . 684 420 269 242 308 457 280 462 Formosa.Inde (brit.) . 12,143 11,934 12,328 12,251 11,949 11,950 11,695 11,315 10,200 India.Indes n6erl. . 3,642 3,595 3,869 4,147 3,587 3,513 3,429 3,411 ... Dutch East Indies.Indochine . . (E.) 150 (E.) 193 11 11 *10 *10 8 16 .. Indo-China.Japon . . . . . 7,527 7,691 7,600 8,463 9,098 9,607 10,391 10,422 *11,800 Japan.Philippines. .. 2,206 2,537 2,522 2,928 2,897 2,537 2,865 4,720 . Philippines.Sarawak (E.). . 52 68 27 22 8 8 * 6 44 ... Sarawak. (E.)
EUROPE. 6,860 12,450 19,950 22,400 28,800 27,175 ... ... EUROPE.Allemagne . . . 169 200 226 182 162 180 169 181 . Germany.Autriche. . .. 29 33 67 70 58 5 _ ... Austria.Espagne . . . 28 28 30 30 30 30 23 15 ... Spain.France. 526 626 1,154 1,084 1,372 1,726 1,682 * 1,691 ... France.Italie ..... 22 43 48 63 57 57 72 47 ... Italy.Roumanie . . . 1,337 1,342 1,311 1,245 1,731 2,006 1,809 2,213 ... Roumania.Tch6coslovaquie 264 104 280 238 240 231 221 156 ... Czechoslovakia.U.R.S S. . *4,270 9,884 16,586 19,270 24,930 22,553 ... * 27,000 U.S.S.R.2Yougoslavie . 216 191 243 236 240 386 450 574 ... Yugoslavia.
OCfIANIE. *27,900 * 27,600 *25,200 21,000 20,360 21,330 19,726 20,460 ... OCEANIA.Australie 23,500 22,166 21,009 17,392 16,215 15,812 14,236 13,283 14,000 Australia.Nouvelle-Zl1ande* 3,926 5,104 4,021 3,442 3,762 3,897 3,561 3,500 ... New Zealand. *Nouv. Guin6e (E.) 136 184 1,431 1,876 3,627 ... New Guinea. (E.)Papoua . . . . 389 158 45 129 199 191 53 50 ... Papua.
MONDE ENTIER.. *471,000 *548,300 *577,400 *.579,300 *596,600 *593,000 *600,0001*600,0001 *620,000 WORLD.
SOURCES: Statistiques nationales (Annuaires, Rapports sur 1'Industrie miniere). National statistics (Year-Books, Reportson the Mining Industry). - Imperial Institute. - The Mineral Industry. - Annual Reports of the Director of the Mint, U.S.A.
Note. - Les chiffres repr6sentent dans la mesure du possi- Note. - The data represent, whenever possible, the goldble le contenu en or du mineral extrait. content of ore mined.
* Estimation ou chiffre provisoire. [(E.) Exportations. * Estimate or provisional figure. (E.) Exports.Am6rique Centrale: estimations donn6es dans les Rapports i Caribbean: estimates given in the Reports of the Director
du Directeur de la Monnaie E.-U. A., basees sur les importations of the Mint, U.S. A. based on U. S. A. imports of ore and bullion.aux Etats-Unis de mineral et de m6tal.
s Colombie, U.R.S.S. : les donn6es sont incertaines et va- Colombia, U.S.S.R.: the data are uncertain and vary.rient. Colombia, U.S.S.R.: the data are uncertain and vary.
8 Etats-Unis, 1930: y compris les Philippines. * US.A., 1930: including Philippines.
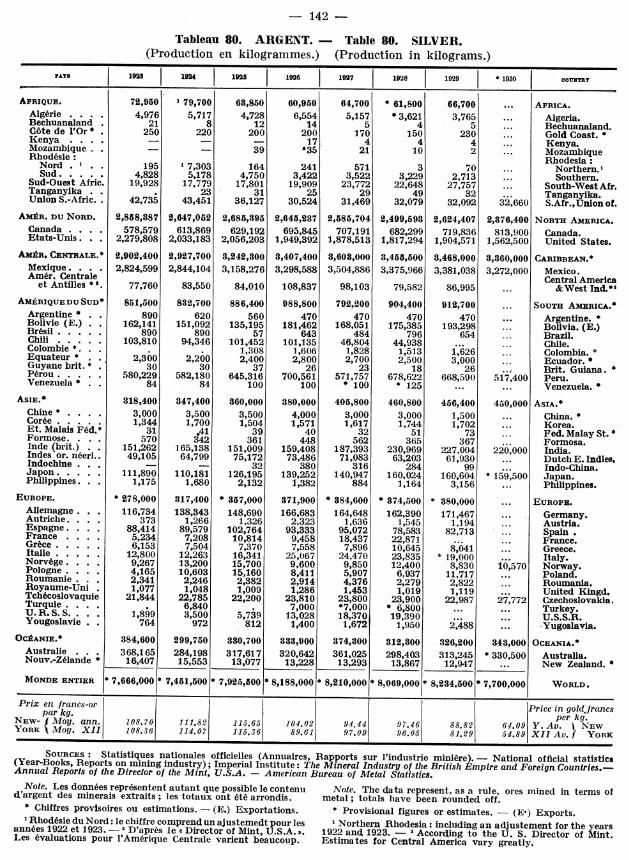
142 -
Tableau 80. ARGENT. - Table 80. SILVER.(Production en kilogrammes.) (Production in kilograms.)
x*Ys ^1923 1924 1925 j 1926 j 1927 1928 1929 j 1930 COUNTRY
AFRIQUE. 72,950 1 79,700 63,850 60,950 64,700 * 61,800 66,700 ... AFRICA.Alg6rie .... 4,976 5,717 4,728 6,554 5,157 * 3,621 3,765 ... Algeria.Bechuanaland . 21 8 12 14 5 4 5 ... Bechuanaland.Cote de l'Or*. 250 220 200 200 170 150 230 ... Gold Coast.*Kenya .... .- - 17 4 4 4 ... KenyaMozambique - - 39 *35 21 10 2 ... MozambiqueRhodesie: Rhodesia:
Nord . . 195 ' 7,303 164 241 571 3 70 ... Northern. Sud..... 4,828 5,178 4,750 3,422 3,522 3,229 2,713 ... Southern.Sud-Ouest Afric. 19,928 17,779 17,801 19,909 23,772 22,648 27,757 ... South-West AfrTanganyika . . 23 31 25 29 49 32 ... Tanganyika.Union S.-Afric. 42,735 43,451 36,127 30,524 31,469 32,079 32,092 32,660 S.Afr.,Union of.
AMIR. DU NORD. 2,858,387 2,647,052 2,685,395 2,645,237 2,585,704 2,499,593 2,624,407 2,376,400 NORTH AMERICA.Canada . . .. 578,579 613,869 629,192 695,845 707,191 682,299 719,836 813,900 Canada.Etats-Unis. . . 2,279,808 2,033,183 2,056,203 1,949,392 1,878,513 1,817,294 1,904,571 1,562,500 United States.
AMIR, CENTRALE.* 2,902,400 2,927,700 3,242,300 3,407,400 8,603,000 3,455,500 3,468,000 3,360,000 CARIBBEAN.*Mexique. . . . 2,824,599 2,844,104 3,158,276 3,298,588 3,504,886 3,375,966 3,381,038 3,272,000 Mexico.Am6r. Centrale Central America
et Antilles *. 77,760 83,550 84,010 108,837 98,103 79,582 86,995 ... &West Ind."
AMtRIQUEDU SUD* 851,500 832,700 886,400 988,800 792,200 904,400 912,700 ... SOUTH AMERICA.*Argentine * . 890 620 560 470 470 470 470 ... Argentine. *Bolivie (E.). 162,141 151,092 135,195 181,462 168,051 175,385 193,298 ... Bolivia. (E.)Br6sil . .. 890 890 57 643 484 796 654 ... Brazil.Chili ... . . 103,810 94,346 101,452 101,135 46,804 44,938 ... ... Chile.Colombie *. . . 1,308 1,606 1,828 1,513 1,626 ..." Colombia. *Equateur * . , 2,300 2,200 2,400 2,800 2,700 2,500 3,000 ... Ecuador.*Guyanebrit. * 30 30 37 26 23 18 26 Brit. Guiana *P6rou . . . 580,229 582,180 645,316 700,561 571,757 678,622 668,590 517,400 Peru.Venezuela * . 84 84 100 100 * 100 * 125 ... ... Venezuela. *
AsE. * 318,400 347,400 360,000 380,000 405,800 460,800 456,400 450,000 ASIA.*Chine* . .. 3,000 3,500 3,500 4,000 3,000 3,000 1,500 ... China. *Cor6e ..... 1,344 1,700 1,504 1,571 1,617 1,744 1,702 ... Korea.Et. Malais Fed.* 31 ,41 39 40 32 51 73 ... Fed. Malay St. *Formose. . . . 570 342 361 448 562 365 367 Formosa.Inde (brit.) . . 151,262 165,138 151,009 159,408 187,393 230,969 227,004 220,000 India.Indes or. n6erl.. 49,105 64,799 75,172 73,486 71,083 63,203 61,930 ... Dutch E. Indies,Indochine . .. - 32 380 316 284 99 ... Indo-China.Japon .. . .. 111,890 110,181 126,195 139,252 140,947 160,024 160,604 * 159,500 JapanPhilippines. . 1,175 1,680 2,132 1,382 884 1,164 3,156 ... Philippines.
EUROPE. * 278,000 317,400 * 357,000 371,900 * 384,600 * 374,500 * 380,000 ... EUROPE.Allemagne. . 116,734 138,343 148,690 166,683 164,648 162,390 171,467 ... Germany.Autriche. . . 373 1,266 1,326 2,323 1,636 1,545 1,194 ... Austria.Espagne. . .. 88,414 89,579 102,764 93,333 95,072 78,583 82,713 ... Spain France . . . 5,234 7,208 10,814 9,458 18,437 22,871 ... France.Grce . ... 6,153 7,504 7,370 7,558 7,896 10,645 8041 ... Greece.Italie . .. .. 12,800 12,263 16,341 25,067 24,470 23,835 *19,000 Italy.Norv6ge. . .. 9,267 13,200 15,700 9,600 9,850 12,400 8,830 10,570 Norway.Pologne . . 4,165 10,603 15,160 8,411 5,907 6,937 11717 ... Poland.Roumanie . 2,341 2,246 2,382 2,914 4,376 2,279 2,822 ... Roumania.Royaume-Uni 1,077 1,048 1,009 1,286 1,453 1,019 1,119 United Kingd.Tch6coslovaquie 21,844 22,785 22,200 23,810 23,800 23,900 22,987 27,772 Czechoslovakia.Turquie . .. . 6,840 . 7,000 *7,000 * 6,800 ... ... Turkey.U. R. S.S.. . . 1,899 3,500 5,739 13,028 18,370 19,390 ... U.S.S.R.Yougoslavie . . 764 972 812 1,400 1,672 1,950 2,488 ... Yugoslavia.
OCIANIE.* 384,600 299,750 330,700 333,900 374,300 312,300 326,200 343,000 OCEANIA.*Australie . . 368,165 284,198 317,617 320,642 361,025 298,403 313,245 * 330,500 Australia.Nouv.-Z61ande * 16,407 15,553 13,077 13,228 13,293 13,867 12,947 ... New Zealand. *
MONDE ENTIER *7,666,000 *7,451,500 * 7,925,500* 8,188,000* 8,210,000 *8,069,000 * 8,234,500 * 7,700,000 WORLD.
Prix en francs-or Price in goldjrancspar kg. per kg.
N~EW- Moy. ann. 108.70 111.82 115.65 104.02 94.44 97.46 8882 6409 Y.Av. NEWYORK MoY. XII 1 108.36 114.07 115.36 89.61 97.09 96.05 81.29 54.89 XII Av. YORK
SOURCES: Statistiques nationales officielles (Annuaires, Rapports sur l'industrie mini6re). - National official statistics(Year-Books, Reports on mining industry); Imperial Institute: The Mineral Industry of the British Empire and Foreign Countries.-Annual Reports of the Director of the Mint, U.S.A. - American Bureau of Metal Statistics.Note. Les donn6es repr6sentent autant que possible le contenu Note. The data represent, as a rule, ores mined in terms ofd'argent des minerais extraits; les totaux ont 6te arrondis. metal; totals have been rounded off.* Chiffres provisoires ou estimations. - (E.) Exportations. * Provisional figures or estimates. - (E,) Exports.Rhod6sie du Nord: le chiffre comprend un ajustemedt pour les 1 Northern Rhodesia: including an adjustement for the yearsann6es 1922 et 1923. - D'apr/s le a Director of Mint, U.S.A. D. 1922 and 1923. - 2 According to the U. S. Director of Mint.Les evaluations pour l'Am6rique Centrale varient beaucoup. Estimates for Central America vary greatly.

143
Tableau 81. NITRATE DE SOUDE (NaNO3) ET NITRATE DE CHAUX (Ca(NO3 )2).Table 81. NITRATE OF SODA (NaNO3 ) AND NITRATE OF LIME (Ca(N0 3)2).
Production en milliers de tonnes metriques. - Production in metric tons (000's omitted).
rAYS 1921 1922 1923 1924 1925 1926 1927 1928 1929 1930 COUNTRY
NITRATE DE SOUDE: NITRATE OF SODA:
Chili . ..... 1,310 1,071 1,904 2,406 2,524 2,016 1,614 3,165 3,238 12,580 Chile.Allemagne * . . . . 131 197 230 Germany " *Norvge a) . ... 21 24 23 20 28 30 38 27 37 Norway a).
NITRATE DE CHAUX: NITRATE OF LIME:
Allemagne 2 * . . 200 320 398 550 ... Germany *.France .. . . .12 25 27 France.Norvege a) . . . 130 156 163 143 190 180 160 173 149 451 Norway a).
Prix en francs-or. Prices in gold francs.
NaNO : CHILI \XII 241 248 236 254 260 245 214 208 202 202 XII. NaNO :_-CHILEpar tonne. Jmoy. 228 235 242 236 253 248 226 209 202 204 av. per metr. ton.
NaNO3: ALLE- NaNO: GER-MAGNE 16% .i .X . 1.60 1.54 1.52 1.52 1.42 ... XII. MANY 16%
pr kg d'azote.) (moy. . 161. 6 1.63 1.56 .53 1.52 1.46 ... av. per 1 kg ofnitrogen.
Ca(NO)2
: ALLE- X Ca(NO,) 2 : GER-~MAGNEl~5~5%~ . . .~. 1.47 1.42 1.40 1.40 1.30 ... XII. J MANY 15.5%pr 1kg d'azote. moy. . . 1.48 1.44 1.51 1.5 1.34 ... av. per 1 kg of
nitrogen.
SOURCES : Statistiques nationales (Annuaires, Informations directes). Institut international d'Agriculture.
SOURCES: National statistics (Year-Books, direct information). International Institute of Agriculture. IF '
Note. - A l'exception du salpetre du Chili (nitrate de soude), Note. - With the exception of the Chile nitrate (saltpetre)tous les nitrates donn6s dans le tableau sont synth6tiques. all the nitrates given in the table are synthetic. Even if theM6me en tenant compte de la production du sulfate d'ammon- production of sulphate of ammonia and of cyanamide of calciumniaque et du cyanamide de calcium, les statistiques donn6es be taken into account, the statistics shown in the presentdans le pr6sent volume ne sont pas representatives de la pro- volume are not representative of the total output of syntheticduction totale de produits azot6s synth6tiques, qui s'est d6ve- nitrogenous products which developed during and since thelopp6e pendant et depuis la guerre et dont la composition n est war and of which the composition is not necessarily uniform orpas necessairement uniforme et fixe. fixed.D'apres les estimations publi6es par 1' Imperial Institute ), la According to estimates published by the Imperial Instituteproduction mondiale de tous les produits azotes, exprim6e en the world production of all nitrogen compounds, expressed inazote pur, s'est 6lev6e en 1927 h environ 1.520.000 tonnes, en terms of pure nitrogen, amounted in 1927 to about 1,520,0001928 h 1.950.000 tonnes et en 1929 A 2.180.000 tonnes. metric tons, in 1928 to 1,950,000 and in 1929 to 2,180,000
metric tons.Le contenu approximatif en azote des divers nitrates est le The approximate nitrogen content of the various nitrates issuivant - as follows: Norwegian nitrate of soda 16 % ; German nitratenitrate de soude norv6gien 16%; of soda 16% ; German nitrate of lime 15.5% ; Norwegiannitrate de soude allemand 16%; nitrate of lime, until 1929, 13%, in 1929 a small proportion ofnitrate de chaux allemand 15,5 % ; 15% and since 1930 chiefly 15 %.nitrate de chaux norv6gien, jusqu'a 1929, 13 %, en 1929 aussiune faible partie a 15% et depuis 1930 surtout 15 %. The quotations refer, except in the case of Chile nitrate, toLes cours se referent, a l'exception du salpetre du Chili, au the price of one kg of pure nitrogen contained in the respectiveprix d'un kg d'azote pur contenu dans les divers produits. nitrates.
* Chiffres incertains. * Figures uncertain.
a) Annee industrielle finissant le 30 juin. a) Industrial year ending June 30th.Chili: chiffre pour 1930 estim6 d'apres les premiers dix 1 Chile: figure for 1930 estimated from the first ten months.mois.
2 Allemagne, nitrate de soude: donines publi6es par l', Im- 2 Germany, nitrate of soda: data published by the Imperialperial Institute ; nitrate de chaux: donn6es publi6es dans Institute; nitrate of lime: data published in Annuaire Lambert;l'Annuaire Lambert; 1' Imperial Institute) donne pour les according to the Imperial Institute the production was, forann6es 1927 A 1929 les chiffres suivants (en milliers de tonnes): the years 1927-1929, in thousands of metric tons, as follows:300; 650; 730. Des donn6es officielles allemandes ne sont pas 300; 650; 730. No official German data are available.disponibles.

- 144
Tableau 82. SULFATE D'AMMONIAQUE. - Table 82. SULPHATE OF AMMONIA.Production en milliers de tonnes metriques. - Production in metric tons (000's omitted).
PAYS 1921 1922 1923 1924 1925 1926 1927 1928 1929 COUTRY
AMARIQUE DU NORD . . 341 445 567 533 619 662 696 774 855 NORTH AMERICA.Canada . . . . . 16 12 20 16 17 21 22 27 30 Canada.Etats-nis 325 433 547 517 602 641 674 747 825 United States.
ASIE (Japon) 9.. . 84 4 104 109 131 147 176 232 235 AIA (Japan).
EUROPE ....... *,300 ,700 *7 *,650 *2,010 *2,280 2,20 2 2,676 2,825 ... EUROPE.Allemagne . . 880 1,191 1,000 1,300 1,550 1,500 1,675 1,575 ... Germany.Autriche .. 3 4 4 5 5 5 6 Austria.Belgique . 21 43 62 62 64 82 109 132 193 Belgium.Espagne 2 . 6 6 11 12 14 17 22 Spain. aFrance . . . . . . 52 65 89 100 117 157 186 218 258 France.Italie 6 10 11 14 29 61 92 124 146 Italv.Pays-Bas 12 9 23 3 35 6 46 45 30 59 .Netherlands.Pologne . . . . . 1 15 6 18 27 37 56 Poland.Royaume-Uni . . . 256 307 387 415 394 301 441 568 842 United Kingdom.Sarre, territ. de la . 14 18 16 21 23 26 28 28 28 Saar territory.Su6de . . .... 3 6 9 8 7 5 5 8 NrSweden.Tch6coslovaquie n .atio26 24 26 36 65 80 Czechoslovakia.UiSo. R. S,.. S. . . 7 10 13 19 U. S. S. R.
OCIANIE (Australie) . 12 9 7 11 15 17 11 11 22 OCEANIA (Australia).
TOTAL . . . . . . . . *1,750 *2,240 *2,330 *2,670 3,050 3,075 3,560 3,840 ... TOTAL.
Prix en francs-or. l Prices in gold francs.NEW YORK3 a XII 260 377 326 317 340 289 283 269 243 XII. NEW YORK."pr 1 tonne m6tr. t moy. 271 354 359 310 331 305 278 283 253 av. per 1 metr.ton.
LONDRES20,6 %4 XII 321 394 328 348 313 295 258 262 245 XII. LONDON 20.6%'pr 1 tonne metr. moy. 367 375 372 326 325 287 4 282 260 253 av. fper 1 metr. ton.
ALLEMAGNE.M 20,8 % )XII . . . . 1.30 1.21 1.14 1.13 1.06 XI. GERMANY20.8%'pr 1 kg d'azote moy. 1. 37 1.31 1.23 1.16 1.13 1.10 av- p Ntr 1gen
SOURCES: Statistiques nationales (Annuaires, informations directes). Institut international d'Agriculture.SOURCES: National statistics (Year-Books, direct information). International Institute of Agriculture.
Note. - Les statistiques se re6frent au sulfate d'ammoniaque Note. - The statistics refer to sulphate of ammonia (NH4 ),SOG(N H-)2SOl obtenu comnme sous-produit de la fabrication du obtained as a by-product of the production of coke andcoke et du gaz et au sulfate d'ammoniaque synth6tique. Comme gas, and to synthetic sulphate of ammonia. As the by-productle sulfate d'ammoniaque en tant que sous-produit repr6sente sulphate represents only a part of the ammonia produced byseulement une partie de l'ammoniaque obtenu par les cokeries cokeries and gas-works, the statistics of certain countrieset usines . gaz, les statistiques de certains pays qui se referent which show the sulphate equivalent of ammonia compoundsa l'6qaivalent en sulfate d'ammoniaque des compos6s ammo- obtained by those establishments, are exaggerated in comparisonniacaux obtenus par ces 6tablissements, se trouvent exag6r6s with data giving the production of sulphate of ammonia aspar rapport aux donn es relatives a la production du sulfate such. The nitroaen content of the synthetic and coke-ovend'ammc3niaque comme tel. Le contenu en azote du sulfate sulphates varies from 20 to 21 %; that of the gas-works fre-d'ammaniaque synth6tique et de celui des cokeries varie entre quently does not exceed 17 %. The table does not include some20 et 21% celui des usines a gaz ne d6passe souvent pas 17 %. minor producers, such as the Union of South Africa, Denmark,Le tableau ne comprend pas certains pays producteurs peu Roumania and Switzerland.importants, p. ex. l'Union Sud-Africaine, le Danemark, la
Roumanie et la Suisse.
* Estimation. * Estimate.Allemagne: en partie 6quivalent en sulfate de compos6s Germany: in part sulphate equivalent of ammonia com-ammoniacaux. pounds.
2 Espagne: sous-produit de cokeries. La production totale a Spain: by-product of cokeries. The total productions'est eleve en 1926 a 36 milliers de tonnes. amounted in 1926 to 36 thousand tons.a New-York, prix en 1930: XII 177, moy. 204 frs.-or. 3 New York, price in 1930: XII 177, av. 204 gold frs.4 Cours de prix; Londres: jusqu'a fin juillet 1926: 21,1%. 4 Price quotations, London: until end of July 1926: 21.1 %.Le prix mayen de 1926 se r6fere aux cinq derniers mois. The average price for 1926 refers to the last five months.5 Allemagne, prix en 1930: XII 0,99, moy. 1,02 frs.-or; Germany, price in 1930: XII 0.99, av. 1.02 gold fr.jusqu'a juin 1929: 20,6%. until June 1929: 20.6%.

- 145
Tableau 83. CYANAMIDE DE CALCIUM (Ca CN2 ).
Table 83. CYANAMIDE OF CALCIUM (CaCN 2).
Production en milliers de tonnes m6triques. - Production in metric tons (000's omitted).
PAYS 1921 1922 1923 1924 1925 1926 1927 1928 1929 *1930 COUNTRY
AMIRIQUE DU NORD NORTH AMERICA(Canada) . . .. 23 32 53 66 82 87 90 121 153 ... (Canada).
ASIE (Japon)'. . 3 102 77 122 125 141 120 160 161 ... ASIA (Japan).'
EUROPE . .... *400 *500 *375 *450 649 791 869 930 *960 ... EUROPE.
Allemagne .. . 250 320 170 220 350 420 440 465 475 Germany.France . .. . 14 29 39 50 55 55 53 50 64 .. France.Italie . . 21 31 45 43 38 45 39 55 80 104 Italy.Norvege .... .. - 21 34 57 72 50 Norway.Pologne 2 .... 74 68 39 51 86 118 143 155 163 79 Poland.
2
Roumanie .. 7 9 12 14 18 17 18 ... Roumania.Suede .. 12 20 31 28 34 37 24 13 .. ... Sweden.Suisse . . 9 10 18 20 27 27 26 23 10 ... Switzerland.Tchecoslovaquie . 3 5 14 22 25 31 ... Czechoslovakia.Yougoslavie . . . . . 42 40 70 70 *35 ... Yugoslavia.
TOTAL . . . . . 426 *634 *475 *638 856 1,019 1,079 * 1,211 * 1,274 ... TOTAL.
Prix en francs-or. Prices in gold francs.ALLEMAGNE GERMANY
22-22,5 %3; XII 1.18 1.11 1.05 1.05 1.02 ... XII. 22-22.5 %/pour 1 kg moy. 1.28 1.18 1.12 1.07 1.05 1.03 ... av. per 1 kgd'azote. of nitrogen.
SOURCES: Statistiques nationales (Annuaires, informations directes). Institut international d'Agriculture.SOURCES : National statistics (Year-Books, direct information). International Institute of Agriculture.
Note. - Le contenu en azote du cyanamide de calcium, Note. - The nitrogen content varies and tends to increase;appele aussi ( chaux azotee %, varie et tend a augmenter; il n'est it is generally not less than 15 % and now often exceeds 20 %.generalement pas inf6rieur a 15 % et depasse a present souvent A certain proportion of the output of cyanamide is used for20%. Une partie de la production du cyanamide est utilis6e producing sulphate of ammonia.en vue de la production de sulfate d'ammoniaque.
Les cours de prix se referent au prix d'un kg d'azote pur The quotations refer to the price of one kg of pure nitrogencontenu dans le cyanamide. contained in the cyanamide.
* Estimation. * Estimate.
Japon: y compris le cyanamide ayant servi a la fabrication 1 Japan: including cyanamide used for producing sulphatede sulfate d'ammoniaque. of ammonia.
2 Pologne: le cyanamide produit pour la vente s'est eleve 2 Poland: the quantity produced for sale amounted in 1928en 1928 a 107.000 tonnes et en 1929 a 148.000 tonnes. to 107,000 tons and in 1929 to 148,000 tons.s Cours de prix: jusqu'^ VI. 1929: 18-22 %. Price quotations: until June 1929, 18-22%.
10

146 -
Tableau 84. PHOSPHATES NATURELS. - Table 84. - NATURAL PHOSPHATES.Production en milliers de tonnes metriques. - Production in metric tons (000's omitted).
PAYS 1921 1922 1923 1924 1925 1926 1927 1928 1929 COUNTRY
AFRIQUE ....... 2,375 2,565 3,075 4,095 4,310 4,620 5,720 5,140 *5,700 AFRICA.
Algerie ....... 399 449 467 681 815 929 919 876 * 808 Algeria.Egypte .. .. 122 60 25 88 107 232 279 201 215 Egypt.Madagascar . . . . . 0.7 0.5 6 6 8 13 Madagascar.Maroc fran;ais . . . 33 96 225 462 692 883 1,442 1,268 1,650 French Morocco.Tunisie . ... . 1,819 1,958 2,357 2,862 2,691 2,568 3,075 2,789 3,018 Tunis.
AMPRIQUE DU NORD. NORTH AMERICA.
Etats-Unis ..... 2,465 2,375 2,991 2,891 3,306 3,650 3,074 3,580 *3,820 United States.
AMIRIQUE CENTRALE. CARIBBEAN.
Antilles neerl. (E.) . 61 56 86 100 82 107 109 104 103 D. West Indies [(E.)
AsIE ......... * 130 123 119 232 237 263 216 195 * 200 ASIA.Ile Christmas (E.) . 88 101 72 127 112 131 119 114 120 Christmas Island (E.)Indochine ..... 9 8 10 12 30 15 21 20 20 Indo-China.Japon ....... 32 12 33 86 87 109 75 59 ... Japan.Philippines . 2 4 7 8 8 1 2 ... Philippines.
EUROPE ........ 192 225 230 276 289 363 329 313 ... EUROPE.Belgique ...... 55 57 23 26 15 30 40 16 30 Belgium.Espagne ...... 20 6 5 7 5 6 4 8 8 Spain.Estonie. . . 2 4 4 7 8 Estonia.France ....... 112 147 180 222 231 252 212 180 160 France.U.R.S.S....... 5 14 21 21 36 71 69 102 ... U.S.S.R.
OCI-ANIE . ...... * 485 470 490 630 585 660 790 775 ... OCEANIA.
Etabliss. trangais (E.). 60 71 74 90 81 129 141 187 229 French Settlem. (E.)lie Nauru (mandat). 191 185 216 286 228 279 323 324 331 Nauru Isl. (mandate).lie Ocean (E.) a) . . * 166 152 137 193 210 191 263 194 ... Ocean Island (E.) a).lie Palaos (mand. jap.) Palau Isl. (Jap. man-
(E.)' ...... 55 56 60 61 66 63 64 69 64 date) (E.) .
TOTAL ' ....... 5,700 5,800 7,000 8,200 8,800 9,670 10,240 10,107 *11,000 TOTAL.'
Prix en francs-or. Price in gold francs.
FLORIDE, land- XII 18.6 15.0 18.6 12.0 16.3 18.3 17.5 18.1 18.1 XII. FLORIDA, land-pebble, t t moy. 32.5 17.5 17.7 13.1 14.1 18.3 17.5 17.8 18.1 av. pebble, 68%.p 1 tonne m6tr.2I mYper 1 metr. ton."
ALGIERIE, TUNI-SIE 58-63 0/6. ALGERIA,TUNIS,f. o. b. XII 0.48 0.43 0.28 0.30 0.21 0.24 0.24 0.24 0.24 XII. 58-630/, f.o.b.;
pour 1 kg de moy. 0.42 0.49 0.33 0.28 0.29 0.20 0.24 0.24 0.24 av. per 1 kg of tri-phosphate tri- calcium phos-calcique phate.
SOURCES: Statistiques nationales (Annuaires, informations directes). Institut international d'Agriculture.SOURCES: National statistics (Year-Books, direct information). International Institute of Agriculture.
Note. -- Dans la majority des cas les statistiques se r6fcrent Note. - In the majority of cases the statistics refer to crudeh des minerals bruts avec une teneur en phosphate variable. mineral with a variable phosphate content. This content isCette teneur est exprimee g6n6ralernent en phosphate trical - generally expressed in terms of tricalcium phosphate, butcique, mais parfois en acide phosphorique (P05). (Pour obteni r sometimes in terms of phosphoric acid (P,O2). (To obtain theI'6quivalent en phosphate tricalcique d'un pourcentage exprim 6 equivalent, in terms of tricalcium phosphate, of a percentageer P0O,5 on le multiplie par 2,18). expressed in terms of P20 5 the latter should be multiplied by
2.18).Voici la teneur approximative des minerais en phosphate The approximate content of the mineral in terms of tricalcium
tricalcique: Algerie, Tunisie 58-70 %; Belgique 30% ; Egypt- phosphate is as follows: Algeria and Tunis 58-70 % ·Belgium59-70% ; Maroc 77% ; Etats-Unis 63-77% ; Indochine, pho s 30% ; Egypt 59-70%; Morocco 77 %; United States 68-77 %;phate moulu, 44 %; lies Christmas 78 et mdme 85 % ; Japon Indo-China (ground phosphate) 44 %; Christmas Island 78 and75 %; Espagne 65 %; France 10-44%, principalement 35-40 %; even as much as 85%; Japan 75 %; Spain 65 %/; FranceNauru 85-88 % ; Ile de l'Ocean 78-90 % ; Etablissements frangais 10-44 % (for the most part 35-40 %); Nauru 85-88 %; Oceande l'Oc6anie jusqu'h 85%. Island 78-90% ; French Settlements in Oceania up to 85%.
Les phosphates bruts sont utilis6s principalement h la fabri- The crude phosphates are used chiefly for the manufacturecation de superphosphates qui figurent dans le tableau 86 of superphosphate (see Table 86), and in a lesser degreeci-apres et dans un degr6 moindre comme engrais. as fertilisers.
* Estimation. (E.) Exportation. * Estimate. (E.) Exports.a) Ann6e finissant le 30 juin. a) Year ending on June 30th.1 lie Palaos: mineral raffing. I Palau Isl. : refined ore.2 Une petite quantit6 est produite en Allemagne, en Norv6ge, 2 Small amount produced in Germany, Norway, Can i
au Canada, aux Indes, en Australie et en Nouvelle-Zl1ande. India, Australia and New Zealand.s Floride: les prix en 1930 ont 6t6 les m6mes qu'en 1929. "Florida: the prices in 1930 were the same as in 1929.

- 147
Tableau 85. SCORIES DE DlPHOSPHORATION.
Table 85. BASIC SLAG.
Production en milliers de tonnes metriques. - Production in metric tons (000's omitted).
PAYS |1921 1922 1923 1924 1925 1926 1927 1928 1929 COUTTRY
AMAERIQUE DU NORD 1 . . . *20 ... NORTH AMERICA. 1
Canada . .... 8 5 3 2 4 2 ... ... Canada.Etats-Unis . . . . . . . . 18 ... United States.
EUROPE ....... *2,580 3,391 *2,826 4,300 4,620 4,880 5,700 5,840 *6,250 EUROPE.
Allemagne . 987 1,179 526 1,065 1,303 1,397 1,742 1,639 1,886 Germany.Belgique .. . . 325 475 *400 612 546 723 887 956 *1,025 Belgium.France ...... 383 589 574 1,013 1,165 1,284 1,332 1,475 *1,502 France.Luxembourg . . 179 325 285 441 466 522 571 598 636 Luxemburg.Pologne . .. 37 40 40 26 21 72 26 3 ... Poland.Royaume-Uni . . . 383 469 711 791 724 461 676 674 ... United Kingdom.Sarre ...... 179 206 165 223 250 283 310 330 345 Saar.Suede .. . 5 8 5 8 7 12 10 10 14 Sweden.Tchecoslovaquie . 100 120 120 138 126 145 155 151 Czechoslovakia.
TOTAL ........ *2,600 *3,420 *2,850 *4,320 *4,640 *4,900 *5,720 *5,860 *6,270 TOTAL.
Prix en francs-or. Prices in gold francs.
FRANCE 18% 2{ XII 70 51 40 3 31 55 4 46 53 XII. FRANCE 18%.2pr 1 tonne metr. moy. 67 59 45 4 37 44 45 45 53 av. per 1 metr. ton.
LONDRES 13,8%3f XII 115 97 63 63 68 82 69 50 53 XII. LONDON13.8%.pr 1 tonne metr. \ moy. 123 87 77 60 66 77 74 62 54 av. per 1 metr. ton.
ALLEMAGNE 15 %' XII . . . 0.34 0.42 0.37 0.28 0.37 0.40 XII. \GERMANY 15 %pr kgde P06 Imoy. 0.37 0.39 0.42 0.36 0.31 0.39 av. per kg P205.
SOURCES: Statistiques nationales (Annuaires, informations directes). Institut International d'Agriculture.
SOURCES: National statistics (Year-Books, direct information). International Institute of Agriculture.
Note. - Le contenu en acide phosphorique (PO2') des scories, Note. - The phosphoric acid (P2 0s) content of the slag, calledappelees 6galement ( scories Thomas , varie pour l'Europe also " Thomas slag " varies in European countries generallygen6ralement de 14-19%; les scories lorraines contiennent from 14-19 %; the content of the slag from Lorraine is aboutenviron 18-23 %; les scories am6ricaines sont i faible dosage 18-23 %; the American slag has a low content (about 7 %).(environ 7 %).
* Estimation. * Estimate.
La production de l'Amerique est insignifiante. The production in America is insignificant.2France, prix en 1930: XII 51,2, moyenne: 51,8 frs.-or; 2 France, prices in 1930: XII 51.2, av. 51.8 gold frs.; until
jusqu'a fin de 1925, 16%. the end of 1925, 16%.* Londres, prix en 1930: 53 frs.-or. 3 London, price in 1930: 53 gold frs.
Allemagne, prix: en 1929, 16%. 'Germany, prices: in 1929, 16%.

- 148
Tableau 86. SUPERPHOSPHATES DE CHAUX. - Table 86. SUPERPHOSPHATES OF LIME.
Production en milliers de tonnes metriques. - Production in metric tons (000's omitted).
PAYS 1921 1922 1923 1924 1925 1926 1927 1928 1929 *1930 COUNTRY
AFRIQUE . .. . . . . . . 169 164 *160 *160 ... AFRICA.
Alg6rie . ... . . 84 97 86 ... ... . Algeria.Maroc . ... 23 34 37 37 44 ... Morocco.Tunisie. .. .. . .. 38 41 40 35 ... Tunis.
AM1IRIQUE DUNORD 1 A. . *2,500 2,532 3,056 2,951 3,494 3,447 3,146 4,062 3,897 *4,125 NORTH AMERICA' A.
Canada..... 3 3 2 3 5 1 1 5 1 ... Canada.Etats-Unis i A. . 2,529 3,054 2,948 3,489 3,446 3,145 4,057 3,896 *4,123 United States ' A.
B. .3,161 . 3,845 . 3,716 . 3,707 ... . B.
ASIE ... . . . . 800 951 943 *965 ... ASIA.
Japon .... . 554 511 507 593 674 786 935 926 947 ... Japan.Formose . . . .. 14 16 17 ... ... Formosa.
EUROPE . ...... *4,600 *6,100 *6,600 *7,250 *8,250 *8,500 8,315 8,416 *9,400 ... EUROPE.
Allemagne. . . . 450 550 365 550 692 696 739 792 *843 ... Germany,Autriche .... . 7 10 13 33 49 46 51 ... Austria.Belgique . . . 300 400 375 384 581 530 408 400 433 ... Belgium.Danemark. . . 84 172 203 *200 208 277 276 238 289 347 Denmark.Espagne . . . . 542 462 562 696 723 829 864 895 *1,045 ... Spain.Finlande . . .. 2 18 25 24 22 20 47 40 ... Finland.France ..... 1,404 2,133 2,215 2,304 2,381 2,430 2,215 2,265 2,430 ... France.Grace. .. . . 29 34 30 38 68 ... Greece.Hongrie .. . 86 115 126 150 ... Hungary.Italie . . . 859 948 1,227 1,242 1,529 1,475 1,372 1,151 1,307 1,388 Italy.Lettonie . .. . . . . . 34 46 48 ... Latvia.Lithuanie.... . - - - - - - - 25 44 ... Lithuania.Norvege . . . . 6 7 10 13 14 15 25 24 Norway.Pays-Bas i. . . i94 302 380 482 572 593 631 645 633 660 Netherlands.Pologne. .... 71 76 113 118 197 168 250 274 *315 197 Poland.Portugal .... . 110 99 100 100 100 135 150 182 227 ... Portugal.Roumanie. 1 1 2 9 11 12 15 ... Roumania.Royaume-Uni . 388 672 493' 542 539 529 519 507 607 ... United Kingdom.'Suede ..... 134 126 155 178 240 231 219 243 236 ... Sweden.Suisse ..... . 37 40 33 27 27 26 25 28 ... Switzerland.Tch6coslovaquie . . 56 253 240 202 191 202 218 245 ... Czechoslovakia.U. R. S. S. ... 4 8 20 26 66 93 104 150 219 *400 U.S.S.R.Yougoslavie. . .. *30 60 72 48 57 67 76 89 ... Yugoslavia.
OC.iANIE ...... . . . 921 1,028 1,153 1,183 ... OCEANIA.
Australie . . . . 385 474 525 832 737 748 885 914 ... Australia.Nouvelle-ZWlande .. . . 184 208 268 269 ... New Zealand.
TOTAL I A. .... *8,000 *9,600 *10,800 *11,500 *13,500 *13,850 *13,600 *14,700 *15,600 ... TOTAL' A.B. *8,650 . *11,600 . *13,700 . *14,200 . ... ... B.
Prix en francs-or. Prices in gold francs.BALTIMORE16%} XII 57.1 55.7 46.2 51.4 54.8 48.6 48.6 57.1 54.3 45. 7 XIIBALTIMORE16%
pour ..ptonneumitr. noy. 73.7 50.8 50.2 46.1 53.4 54.8 48.8 53.1 55.6 49.4 av. 1 erl tonne m~tr. 1 metr. ton.
tour 1 to Ine . 56.1 64.5 64.2 60.4 XII.FRANCE 14 %~~~~~pour 1 tonne, 62.8 56.9 61.1 63.2 per 1 metr.mtr.moy. . . . 55.2 50.9 51.5 62.8 56.9 61.1 63.2 av. ton.
ALLEMAGNE18% XI, . 0.52 0.43 0.42 0.44 0.47 0.44 XIIGERMANY 18kg de Pour 51 ~. · · · perpokg urdeP2 05 moy. 0.59 0.52 0.50 0.46 0.44 0.47 0.46 av. per~~~~~~~~~~~~1 kg de~~~ ~~a.l I Ikg of P, 0,
SOURCES : Statistiques nationales (Annuaires, informations directes). Institut international d'Agriculture.SOURCES: National statistics (Year-Books, direct information). International Institute of Agriculture.
Note. - Les statistiques se r6ferent tant6t t tous les super- Note. - Some of the statistics cover all superphosphatesphosphates (superphosphates min6raux obtenus i l'aide de (mineral superphosphates obtained from phosphates, and bonephosphates et superphosphates d'os), tant6t seulement aux superphosphates), while others cover only mineral super-superphosphates min6raux. Le contenu en acide phosphorique phosphates. The phosphoric acid (PO,s) content varies; it is(P2 0) varie; il n'est en rigle g6n6rale pas inf6rieur a 12%, seldom less than 12 %, and in certain "double" superphos-mais pent depasser pour certains superphosphates, dits doubles, phates it may exceed 35 %. It is generally about 18 % for35 %. II1 est pour le Maroc, l'Allemagne et la Norvege, en moyenne Morocco, Germany and Norway, 14% for France, and 16-18 %de 18 %, de 14 % pour la France, et de 16-18 % pour les Etats- for the United States. The percentage for the U.S.S.R. variesUnis. Le pourcentage pour l'U.R.S.S. varie g6n6ralement entre generally from 13.5 % to 18 %, but is sometimes below 13 %.13,5 % et 18%, mais il est parfois au-dessous de 13 %.
* Estimation. * Estimate.
x Etats-Unis : A. Seulement la production des fabriques 1 United States : A. Production of fertiliser establishmentsd'engrais. B. Production totale selon les recensements only. B. Total production according to biennial censuses,bisannuels, y compris les usines chimiques. including chemical factories.
2 Royaume-Uni: y compris l'Etat libre d'Irlapde, dont la 2 'United Kingdom: including the Irish Free State, theproduction en 1927 s'est 6lev6e i 72.462 tonnes. production of which amounted, in 1927, to 72,462 metric tons.

149
Tableau 87. SELS POTASSIQUES (en potasse pure K20).
Table 87. POTASH (in terms of Pure Potash K20).
Production en milliers de tonnes metriques. - Production in metric tons (000's omitted).
PAY$ 1921 1922 1923 1924 1925 1926 1927 1928 1929 1930 COOUTRY
AMARIQUE DU NORD NORTH AMERICA(Etats-Unis) . 9 11 IS 21 23 21 39 54 56 ... (United States).
ASIE * ...... 9 8 6 6 4 3 4 3 3 ... ASIA.*
Inde (brit.) .. 6 5 3 3 2 3 2 2 ... India.Japon 2 . . 3 3 3 1 1 1 1 1 1 ... Japan.
2
EUROPE ..... 20*. .. | 0 * 111.750 *,5 *1,340 1,930 1,680 1,950 2,180 *2,350 ... EUROPE.
Allemagne . . 3 933 31,303 31,060 3 895 1,578 1,263 1,518 1,691 1,788 ... Germany.3
Espagne .. . 3 8 17 24 24 ... Spain.France .. . 145 212 262 272 312 367 371 410 493 506 France.Pologne . . . . 3 11 12 18 36 41 47 53 ... ... Poland.
TOTAL . . ... . *1,260 *1,770 *1,540 *1,360 1.955 1,700 1,995 2,235 *2,410 ... TOTAL.
Prix en francs-or Prices in gold francsp' 1 kg de potasse per 1 kg of pure
pure: potash:
ALLEMAGNE XI . . . . .. 19 0,.19 0.19 ... XII. GERMANY18-22% moy. . . . 0.1 0.1 5 0.19 0.19 0.19 a. 18-22%.
FRANCE XII 0.18 0.16 0.11 0.13 0.10 0 0.16 0.16 0.15 0.15 XII. FRANCE12-16%. \moy. 0.16 0.18 0.14 0.12 0.12 0.11 0.16 0.16 0.16 0.15 av. 12-16%.
SOURCES: Statistiques nationales (Annuaires, informations directes). Institut international d'Agriculture.
SOURCES: National statistics (Year-Books, direct information). International Institute of Agriculture.
Note. - Le tabelau indique, en regle g6nerale, le contenu en Note. - The table shows, as a rule, the potash (KO) contentpotasse pure (K
20) de divers sels extraits. Ce contenu varie; of various ores mined. This content varies; in Europe it is
il est en Europe de 12-15% pour le kainite, de plus de 17% pour 12-15% for kainite, over 17% for sylvinite and 9-12% forle sylvinite et de 9-12 % pour le carnallite. La potasse est pro- carnallit. Potash is likewise produced in some other countriesduite dans certains autres pays, notamment en Erithr6e, en - e.g. Eritrea, Tunis and Chile.Tunisie et au Chili.
* Estimation. * Estimate.
Etats-Unis: production industrielle. 1 U.S.A.: industrial production.2 Japon: 6quivalent au potasse des sels de potasse et du 2 Japan: potash equivalent of potash salt and potassium
sulfate potassique. sulphate.3Allemagne: (1921-24) ; production industrielle. Comme a Germany (1921-24): industrial production. As the German
l'extraction allemande parait 6tre de 15-20% sup6rieure a actual output appears to be 15-20% superior to the industrialla production industrielle, les totaux des ann6es 1921-1924 production, the totals for the years 1921-24 have been adjustedont 6te ajust6s en consequence. accordingly.

- 150 -
Tableau 88. GUANO NATUREL. - Table 88. NATURAL GUANO.
Production en milliers de tonnes metriques. - Production in metric tons (000's omitted).
PAYS 1921 1922 1923 1924 1925 1926 1927 1928 1929 COUNTBY
AFRIQUE ....... . . . 20 27 33 35 AFRICA.
Madagascar . . . . 6 7 9 13 Madagascar.Seychelles (E.).. . . , 14 7 11 15 13 Seychelles (E.).Union S.-Afric. a). . 8 9 9 8 7 9 9 9 S. Africa, Union a).
AMInIQUE DU SUD . . 75 77 124 156 142 96 110 128 ... SOUTH AMERICA.
Chili ...... 11 14 13 19 16 16 32 3 ... Chile.P6rou b) .64 63 11 137 126 80 78 125 151 Peru b).
OCIANTE (Nouvelle-Cal6- OCEANIA (New Caledo-donie) ...... 5 13 8 12 10 10 11 ... nia).
TOTAL ........ *100 *107 *160 *190 *180 126 147 172 *200 TOTAL.
SOURCES : Statistiques nationales (Annuaires, informations directes). Institut international d'Agriculture.
SOURCES : National statistics (Year-Books, direct information). International Institute of Agriculture.
Note. - Le tableau Ie contient pas les engrais appel6s parfois Note. - The table does not include fertilisers also sometimes( guano ,,, tels que le , guano , de poissons, de viande, de baleines called "guano", such as fish, meat, whale-guano and "phospho-et le c phosphoguano ,,. Le guano du P6rou contient g6n6rale- guano". The Peru guano usually contains some 14-15% ofment 14-15 % d'acide phosphorique (P"0S), 7 % d'azote et 1-3 % phosphoric acid (P20 5), 7 % of nitrogen and 1-3 % of potash.de potasse.
* Estimation. (E.) Exportations. * Estimate. (E.) Exports.
a) Exercice finissant le 30.VI de l'ann6e. a) Yearly period ending, on 30.VI.b) Exercice finissant le 31.111 de l'ann6e suivante. b) Yearly period ending on 31.11III of following year.
Tableau 89. SULFATE DE CUIVRE. - Table 89. SULPHATE OF COPPER.
Production en milliers de tonnes metriques. - Production in metric tons (000's omitted).
PAYS 1921 1922 1923 1924 1925 1926 1927 1928 1929 1930 COUNTBRY
AMIARIQUE DU NORD NORTH AMERICA(Etats-Unis) . . 12 15 14 10 12 15 16 20 18 ... (United States).
EUROPE. ... ... *178 *175 *186 196 189 210 232 265 205 ... EUROPE.Allemagne . .. 6 8 6 7 8 9 16 20 16 Germany.Autriche .. .. 0.8 1.1 0.4 0.2 0.2 1.0 1.5 1.5 1.5 ... Austria.Belgique' * . . . . 6 13 16 19 20 20 ... Belgium' *.Espagne . . . 6 6 8 7 4 4.7 6.9 8.0 8.1 ... Spain.France ..... 31 36 36 40 35 37 36 38 39 France.Italie ... .. *100 73 86 90 83 100 104 121 72 69 Italy.Portugal .... 4 4 4 5 5 3.3 5.5 7.6 6.3 ... Portugal.Royaume-Uni (E.) 28 42 43 41 41 39 43 49 42 ... Unit. Kingd. (E.).
TOTAL . . ... . . *190 *190 *200 206 201 225 248 285 223 ... TOTAL.
Prix en francs-or Prices in gold francspour 1 tonne m6tr. per 1 metr. ton.
GANES f XII 529 582 493 509 509 650 584 627 629 511 XII. \ GENOA§98-99%. moy. 597 575 542 500 491 547 647 608 637 579 av. 98-99%.
SOURCES: Statistiques nationales (Annuaires, informations directes). Institut international d'Agriculture.
SOURCES: National statistics (Year-Books, direct information). International Institute of Agriculture.
* Estimation. (E.) Exportations. * Estimate. (E.) Exports.
'Belgique: donn6es extraites de l'Annuaire Lambert. 1 Belgium: figures quoted in Annuaire Lambert.

151 -
Tableau 90. SOUFRE. - Table 90. SULPHUR;
a) Production effective en milliers de tonnes mdtriques.(a) Actual production in metric tons (000's omitted).
PAYS 1921 1922 1923 1924 1925 1926 1927 1928 1929 1930 COUeTra
AMIIRIQUE DU NORD NORTH AMERICA.(Etats-Unis) 1 1,909 1,860 2,069 1,240 1,432 1,920 2,146 2,014 2,400 ... (United States).
AMJERIQUE DU SUD SOUTH AMERICA.(Chili). . . . 10 12 11 10 9 9 12 16 16 ... (Chile) 2.
ASIE *. .... . 38 38 38 49 61 61 63 71 61 68 ASIA * .
Formose 2 . 0.8 3.3 1.1 1.9 2.6 3.2 2.3 0.8 0.5 Formosa 'Japon . . . . 37 35 37 47 48 48 61 70 60 57 Japan '.
EUROPE . ..... *317 210 284 336 308 324 350 349 369 ... EUROPE.
Espagne 4 ... *15 20 18 19 17 19 20 21 24 ... Spain'.Italie . ... 302 190 266 317 291 305 330 328 345 372 Italy.
TOTAL * ..... 2,270 2,120 2,400 1,635 1,800 2,300 2,570 2,450 2,860 ... TOTAL *.
Prix en francs-or par Price in gold francstonne mitrique. per metric ton.
NEW-YORKut: fin 89 74 74 74 87 94 94 97 99 99 end raw sulphurf. o. b. mines moy. 88 84 74 4 78 94 94 95 99 99 av. f. . b. mines.CATANIA: fin. 121 123 111 110 121 136 133 132 132 ... end CATANIA.jaune, sup. fmoy. 155 121 114 I11 119 127 137 132 132 ... av. yellow sup.
b) Contenu en soufre de pyrites extraites (milliers de tonnes mdtriques).(b) Sulphur content of pyrites mined (000's omitted).
AFRIQUE AFRICA.
Alg6rie ..... 8.9 3.4 9.5 8.4 6.0 5.4 6.0 6.5 7.7 ... Algeria.
AMEIRIQUE ..... 75 84 97 84 82 82 129 130 ... ... AMERICA.
Canada . . . 11 15 23 19 13 14 41 56 63 ... Canada.Etats-Unis* . . . 64 69 74 65 69 68 88 74 .. ... United-Stades.*
ASIE ASIA.
Chypre ..... 6 15 31 71 (E.) 88 84 102 124 146 ... Cyprus.
EUROPE ..... *1,880 *'1,820 *1,875 1,753 2,406 2,579 2,647 2,4560 ... ... EUROPE.Allemagne.. . 151 118 63 48 82 99 150 146 150 ... Germany.Autriche . . . . 6.0 5.7 5.1 3.2 2.0 ... Austria.Espagne . .. *1,200 1,072 1,216 1,028 1,540 1,658 1,608 1,440 . Spain.France 86 86 91 84 90 91 91 95 91 .. France.Grce ...... 24 26 *25 35 32 40 49 45 Greece.Italie ...... 206 224 205 237 244 273 286 257 *300 *320 Italy.Norvige . .. 99 167 162 173 267 272 267 322 324 ... Norway.Portugal* . . . . 110 109 105 152 121 192 199 Portugal.*Sulde . . . 26 27 27 32 12 32 ... Sweden.Tch6coslovaquie 14 3.6 - 6.4 8.9 9.0 9.2 9.3 ... ... Czechoslovakia.
TOTAL ...... *'1,970 *1,920 *2,010 1,920 *2,580 2,750 2,890 *2,710 ... ... TOTAL.
SOURCES: Statistiques nationales (Annuaires, communications directes); Imperial Institute.SOURCES: National statistics (Year-Books, direct information); Imperial Institute.
Note. - La partie a) du tableau comprend en regle g6n6rale Note. - Part (a) of the above table refers, as a rule, to thela production r6elle du soufre en provenance des mines situ6es actual sulphur production from the mines lying in the respectivedans les pays memes. Ces statistiques ne sont toutefois pas countries. These statistics are, however, not entirely homo-entierement homogenes, vu qu'elles se rapportent dans quelques geneous, since they refer in some cases to sulphur ore or tocas au minerai de soufre ou a la production industrielle du the industrial production of refined sulphur.soufre raffin6. Pyrites, the sulphur content of which is given under (6)
Les pyrites dont le contenu en soufre est donn6 sous b) sont above, are utilised as such in industry. The production ofutilisees par l'industrie telles quelles. La production des pyrites actual pyrites is given in table 75 which contains, in addition,memes est donn6e au tableau 75 qui comprend certains pays several countries which do not publish the sulphur contentpour lesquels le contenu en soufre n'est pas publi6. of their pyrites.
* Estimation. (E.) Exportation. * Estimate. (E.) Exports.' Etats-Unis : soufre brut. 1 United States: raw sulphur.
Chili, Formose: minerai de soufre. 2 Chile, Formosa: sulphur ore.3 Asie : non compris la Chine, dont la production est estim6e * Asia : excluding China, the production of which is estimated
at 6 milliers de tonnes. at 6 thousand tons.* Japon, Espagne: soufre raffin6; le soufre brut utilise a 4 Japan, Spain: refined sulphur produced in part from
6t6 en partie import-. imported raw sulphur.

--- 152--
Tableau 91. NO~BRES-INDICES DE PRODUCTION.
(¥oir explications, p. 159.)
CANADA (Monthly Review of Business Statistics).
Base · 1919-1924.
1929Groupemen~ et pondSration 1924 1925 1926 1927 1928 1929 1930
I I I i v I w I II ............ !INDICE GI~N~RAL (100) · . 116 125 146 156 173 193 164 209 203 200 198 200 190 192 194 175 [
SYLVICULTURE (15,5) . . 124 136 158 168 180 201 183 193 180 193 206 220 199 202 197 201Mn~Es (9,3) ...... 113 119 135 143 155 165 154 179 163 181 138 168 170 154 166 152BATIMENTS (9,5) .... 116 121 149 181 187 242 206 457 223 177 160 212 251 243 243 211
INDUSTRIES (65,7) :Total (100) ...... 115 126 145 150 172 186 155 181 180 208 210 199 182 194 190 166Minoterie (8,5) . 136 124 128 119 131 131 115 115 139 135 154 156 138 158 205 111Suere (4,4) ...... 93 133 130 106 109 107 108 47 70 62 84 98 108 88 109 100Colon (10,8) ..... 87 117 132 133 132 133 100 140 128 159 173 162 102 111 85 72~ois (10,8) ...... 114 121 119 114 96 98 85 107 98 106 125 118 90 92 95 86Papier fi journal (17,9) 131 147 182 200 231 264 242 246 229 246 255 281 264 268 258 271Fonte (2,5) ...... 84 77 104 100 147 154 105 149 159 146 135 138 153 169 191 168Acier (10,1) · · · 83 96 99 114 158 176 128 178 179 210 187 193 183 198 184 151Automobiles (9,4; 126 153 191 170 226 241 139 274 359 406 398 303 225 203 178 165
iiii i ii iiii i i
~TATS-UNIS (Federal Reserve Board).
Base' 1923-25.!
~-~upement et pond6mtton 1924 1925 1926 1927 1928 1929 1930
IiNDICE G]~Ni~RAL .... 195 104 108 106 111 119 97 118 118 119 122 124 126' 124 123 122MINES:
Total (100) ...... 96 99 108 107 106 99 118 120 107115 i 115 116 112 114 115 118Charbon bitumin. (35,9) 92 100 110 99 94 102 88 104 110 90 102 104 102 102 98 103Anthracite (13,0) .... 108 77 105 99 93 91 86 110 110 77 95 86 76 72 81 106 IP6trole (32,6) ..... 97 103 104 121 122 137 122 137 137 133 132 134 135 143 145 140Mineral de fer (5,5) . . 82 104 113 98 104 121 90 143 126 119 121 121 ICuivre (6,5) ...... 100 106 110 105 115 127 87 129 136 135 141 139 124 122 119 125Zinc (2,2) ....... 97 107 116 111 112 114 91 100 106 112 116 120 122 125 127 124Plomb (2,8) ...... 102 111 114 111 106 113 100 111 100 112 125 122 112 114 107 119Argent (1,5) ...... 100 98 95 92 88 94 78 94 91 93 103 93 94 88 91 89
INDUSTRIES :
Total (100) ...... 94 105 108 106 112 119 96 118 117 120 123 126 129 126 124 122Fer et acier (23,0)... 88 106 113 104 119 130 95 117 126 132 135 145 155 152 143 140Textiles: Total (20,5) . 91 104 104 113 107 115 91 116 113 116 120 121 121 118 120 116Colon (10,2). 90 104 109 122 107 115 87 118 115 117 119 125 122 119 119 115Alimentation (10,1) . . 103 98 97 96 98 97 93 103 10! 96 102 97 96 96 100 98Paplet et imprim~ (11,2) 99 106 115 113 118 125 113 122 123 125 124 127 128 125 125 130Automobiles (6,0) . . . 90 107 108 86 110 135 85 150 148 159 153 148 162 142 143 133Cuir et produlls (4,0) . 94 96 98 103 103 105 94 99 99 100 103 106 110 108 108 110Ciment (1,3) ..... 100 108 110 115 118 114 108 125 115 99 110 111 116 118 122 118¥erre (1,3) ...... 92 118 130 112 132 152 107 141 140 148 144 146 154 164 168 174M~tauxnon-ferreux(4,0) 99 107 112 109 115 125 98 124 123 129 137 137 126 127 122 125P~trole raffin6 (1,9) . . 99 115 125 136 152 168 164 159 160 160 165 168 170 171 176 173Pneus (1,8) ...... 98 116 116 121 144 135 100 148 152 152 161 158 162 141 119 116Tabac (1,1) ...... 99 105 112 118 124 134 131 131 129 126 142 142 139 131 133 136

- 153-
Table 91. INDEX NUMBERS OF PRODUCTION.
(For explanations, see p. 159.)
CANADA (Monthly Review of Business Statistics).
Basis: 1919-1924.
1930
x j__I I [—— _ _ J v Grouping and WeightingX I Xi XII I II Iii IV V I VI I VIi VIII| Ix X xi I XII
198 196 161 188 164 167 170 187 168 165 156 154 156 156 138 GENERAL INDEX (100).213 214 201 199 185 188 203 210 188 187 169 168 169 167 162 FORESTRY (15.5).177 167 160 187 129 177 125 164 146 153 143 163 169 136 150 MINING (9.3).272 269 189 420 227 163 186 160 196 165 219 157 172 253 154 BUILDING (9.5).
MANUFACTURES (65.7):
186 185 148 151 154 161 166 188 12 161 146 49 149 140 128 Total (100).90 99 77 79 91 101 116 110 104 141 198 140 110 106 84 Flour (8.5).
161 179 177 83 86 44 46 89 119 79 109 126 174 170 176 Sugar (4.4).183 173 105 81 75 98 75 102 79 81 56 111 197 150 99 Cotton (10.8).
94 85 77 132 108 111 103 108 83 75 59 62 59 59 63 Lumber (10.8).284 291 275 239 231 234 263 272 251 254 235 233 235 233 222 Newsprint (17.9).155 147 140 148 120 123 123 137 112 110 98 82 68 79 65 Pig-iron (2.5).177 143 126 176 163 180 157 140 146 105 88 85 100 110 86 Steel (101).186 126 70 132 173 207 231 236 158 118 122 95 52 72 72 Motor-cars (9.4).
UNITED STATES (Federal Reserve Board).
Basis: 1923-25.
1930
I. I lanlr/n ~~~—, — ~lm/uIII rr Grouping and WeightingX XI XII II III IV V VI VII VII I IX X XI XII
118 108 101 104 107 104 107 104 100 95 91 91 87 85 82 GENERAL INDEX.
MINING :118 110 116 112 109 96 104 103 100 97 96 94 98 92 94 Total (100).102 98 103 100 92 81 97 92 89 86 82 85 87 86 85 Bituminous coal (35.9).116 92 121 106 100 68 71 81 78 82 88 80 105 83 93 Anthracite coal (13.0).140 131 132 133 135 125 128 127 124 120 117 114 115 114 111 Petroleum (32.6).107 98 . . . . . 104 108 95 96 79 74 51 Iron ore (5.5).123 118 116 101 95 88 90 90 86 83 84 89 83 83 76 Copper (6.5).112 105 102 104 98 96 94 94 99 91 94 93 90 70 68 Zinc (2.2).115 114 105 95 112 107 111 104 99 103 106 101 94 83 92 Lead (2.8).
94 114 87 88 98 89 88 80 75 69 70 73 70 73 71 Silver (1.5).
MANUFACTURES:118 108 98 103 107 106 107 105 100 94 91 90 85 84 80 Total (100).124 100 90 99 119 113 114 111 110 93 93 86 75 65 59 Iron and steel 22118 108 96 103 99 98 96 90 84 84 81 88 91 93 87 Textiles: Total (2o.5).117 104 89 102 94 94 100 91 85 82 78 79 81 83 77 Cotton (10.2).
96 96 95 96 94 90 97 98 93 94 91 96 94 94 89 Foodstuffs (10.1).126 123 118 120 122 120 121 119 116 111 109 109 107 103 98 Paper and printing (11.2).113 81 65 97 102 98 102 101 90 75 62 62 49 74 85 Motor-vehicles (6.0).111 108 100 100 97 99 103 98 97 95 95 95 89 81 81 Leather and products (4.0)113 109 110 108 110 111 108 119 119 116 117 111 97 86 83 Cement (1.3)172 149 117 124 122 117 131 143 114 105 65 95 101 91 65 Glass, plate (1.3)122 119 113 105 102 104 106 101 96 97 96 97 95 87 85 Non-ferrous metals (4.0).178 171 167 163 168 168 174 173 170 166 164 165 160 151 149 Petroleum refining (1.9).114 94 80 106 107 105 123 121 119 93 96 84 88 77 73 Rubber, tyres etc. (1.8).135 130 133 131 133 128 136 134 141 137 130 125 129 119 128 Tobacco (1.1).

- 154 -
Tableau 84 (suite). Nombres-Indices de production.(Voir explications p. 159.)
ALLEMAGNE (Institut fiir Konjunkturforschung).Base : 1928.
1929Groupernent et pond6ration 19241 1925 1926 1927 1928 1929 1930
1 I I II I IV VV m I VII VIl IX
INDICE GE.NEiRAL (100). . . . 69 83 79 100 100 102 * 84 95 91 99 108 109 110 105 103 102
INDUSTRIE F DE BASE (50) :
Charbon (20):Houille (13,6) . . . . . 78 88 97 102 100 108 95 104 102 108 108 105 108 107 108 108Briquettes dehouille (0,4) 78 102 109 101 100 114 96 109 123 125 100 102 109 112 113 109Coke (2,3) . . . . . . . 70 80 78 96 100 114 96 105 109 116 113 109 113 116 117 117Lignite (2,6) . . . . . . 75 84 85 91 100 105 88 105 103 107 104 102 101 101 103 104Briquettes de lignite (1,1) 74 84 86 91 100 106 85 103 93 105 106 104 107 106 108 109
Fer (20,0) :Fonte (2,0)....... 66 87 82 111 100 114 83 110 109 106 115 115 120 120 117 115Acier (5,4) . . . . . . 68 85 85 113 100 113 81 119 112 111 120 120 121 115 110 104Laminage (12,6) . . .. 68 89 89 112 100 108 79 112 103 107 117 113 116 111 108 106
M6taux (2,5) :Cuivre (0,3) ...... . . . . 100 117 124 107 105 97 118 112 118 112 117 130Plomb (0,1) . . .. 90 100 104 109 89 90 113 109 77 93 90 106 123Zinc (0,1) .. .... . 86 100 108 102 105 105 104 108 110 111 109 109 109Laminage (2,0) . ..... . . 103 100 95 72 97 98 100 100 98 107 94 93 97
Construction (Chaux (1,0) . . . . . . 61 80 78 98 100 100 78 55 52 106 152 136 117 112 111 121Ciment (2,0) . . . 56 78 78 99 100 95 76 46 26 59 123 128 124 128 118 119Briques (3,5) . . . . . . 48 75 70 106 100 91 . 19 16 52 104 149 169 142 115 105
Potasse (1,0) . . . . . . . 60 93 75 90 100 106 95 119 105 101 105 99 103 103 103 108
MANUFACTURES (50):
Machines (22,0).. ... 65 82 70 92 100 100 * 83 80 77 94 109 98 113 110 106 103V6hicules (6,0):
Autos particuli6res (3,7) ' . . . . 100 92 * 72 90 86 111 129 133 121 106 89 75Camions (1,4) . . . .... 100 106 * 65 98 107 106 134 161 145 107 102 98Motocyclettes (0,9) . . . . . 100 116 * 55 98 126 166 187 196 187 109 83 70
Textiles (8,5) :Fil de Coton (7,5) . . 80 96 80 111 100 91 90 98 94 91 97 83 85 71 87 88
• Lin (0,5) . 145 156 103 163 100 88 83 92 90 95 95 80 53 61 92 90J » Chanvre (0,5) 84 81 77 110 100 99 80 107 86 74 107 98 82 110 94 91
Chaussures (4,0) . . . . . . 114 100 104 101 96 94 103 110 100 96 87 105 114Porcelaine (1,5) ...... 101 109 91 104 100 87 82 87 85 86 90 86 86 82 84 90Industrie du papier (6,0):
PAte m6ecanique (0,9) . . 69 88 86 98 100 102 100 99 87 105 115 111 106 99 97 93Cellulose (1,2) .... 64 80 84 94 100 105 103 103 97 104 105 107 109 103 101 107Carton (1,2) . . . . . . 63 84 75 98 100 98 93 97 88 92 103 107 105 101 99 95Papier (2,7) . . . . . . 65 80 78 95 100 101 95 101 98 101 102 104 104 101 100 98
Pianos (1,0).. .. 101 117 100 80 * 46 95 77 76 85 75 70 55 59 76Montres (1,0) . . . ..... 100 82 69 81 73 74 82 82 83 73 81 87
* Provisoire.
SUEDE (Svensk Finanstidning).Base: 1923-1924.
1929Groupement et pond~ration 1924 1925 1926 1927 1928 1929 1930
I II III IV V VI VII I VIII IX
INDICE GEiNENRAL (100) . . .. 104 1106 109 115 110 135 131 148 134 135 146 130 129 129 133 131
Mineral de fer (4,5) . . . . 108 137 146 164 71 189 187 202 187 161 202 184 198 189 186 182Fer et acier (18,7) . . . . . 105 99 102 100 114 138 120 134 124 129 131 141 139 141 152 147Bois (22,0) ......... 100 99 91 97 1100 103 108 104 127 128 121 101 93 92 91 99Pate (22,8) ......... 105 1107 120 134 1117 160 160 218 159 163 196 146 155 152 158 153Papier (11,8) ........ 106 1112 122 126 1122 146 1133 158 150 140Superphosphates (1,1) . . . . 104 137 129 123 138 134 145 141 134 153 166 135 133 130 117 126Tabac (9,9) . . . . . . . . 101 101 102 103 104 106 109 103 103 107 99 115 103 107 108 10Bilre (6,6) . . . . . . . . . 99 105 108 108 106 108 117 106 100 99 114 111 105 102 102 112
Conflit de travail.

- 155 -
Table 91 (continued). Index Numbers of Production.(For explanations, see p. 159.)
GERMANY (Institut for Konjunkturforsehung).Basis: 1928.
1930..... —-——— Grouping and Weightingx XI XII I I II III |IV v VI| VII I IX X XI xii Grouping and Weighting
101 101 96 95 93 93 95 90 84 81 80 78 77 76 73 GENERAL INDEX (100).
BASIC INDUSTRIES (50):
Coal (20):110 117 115 113 102 97 96 93 92 86 89 91 91 93 94 Coal (13.6).115 132 119 99 92 85 85 90 94 93 93 101 107 109 110 Compressed coal (0.4).118 118 116 115 112 109 100 97 94 94 93 91 87 84 79 Coke (2.3).109 116 111 99 87 80 82 87 91 84 88 91 90 91 86 Brown coal (2.6).108 110 108 97 79 71 75 88 97 87 91 94 85 81 76 Compressed lignite (1.1).
Iron (20.0):116 113 110 109 107 101 93 86 79 77 74 68 69 66 61 Pig-iron (2.0).108 109 102 104 104 98 91 84 76 71 73 66 67 68 66 Steel (5.4).104 101 99 101 98 95 92 83 73 72 70 65 68 68 69 Rolling mills (12.6).
Metals (2.5):121 132 130 123 125 122 134 126 105 113 133 132 121 127 125 Copper (0.3).119 125 113 111 120 121 105 99 113 92 113 117 96 113 110 Lead (0.1).108 104 108 109 110 112 110 110 109 102 101 90 88 89 88 Zinc (0.1).
83 91 78 75 76 74 77 74 73 73 68 75 63 76 65 Rolling mills (2.0).Building (6.5):
89 84 61 60 76 124 102 91 76 71 84 87 65 55 41 Limestone (1.0).104 88 69 51 52 84 103 104 94 86 83 78 74 59 39 Cement (2.0).105 71 40 35 40 69* 69 * 73 * 75 … … — Bricks (3.5).108 114 106 125 124 105 91 90 82 91 93 96 91 82 76 Potash (1.0).
MANUFACTURES (50):
96 97 111 81 83 90 89 88 87 88 90 85 70 74 * 72 Engineering (22.0).Vehicles (6.0):
70 54 38 58 84 108 136 112 85 63 52 57 43 36 * 34 Passenger cars (3.7).78 91 48 77 85 91 72 65 64 58 50 63 47 60 * 45 Trucks (1.4).63 53 56 57 77 100 125 102 63 43 15 20 17 15 * 23 Motor-cycles (0.9).
Textiles (8.5):95 97 100 99 100 97 108 92 79 89 82 82 84 83 88 Cotton yarn (7.5).
102 105 102 105 107 107 105 90 73 92 70 61 61 66 66 Linen yarn (0.5).110 121 111 99 95 80 91 74 65 90 68 60 95 82 65 Hemp yarn (0.5).121 115 105 105 106 103 116 122 95 80 92 103 108 97 80 Shoes (4.0).91 96 88 89 90 90 94 90 81 76 73 72 79 76 68 Porcelain (1.5).
Paper (6.0):98 104 111 111 102 102 108 106 99 94 96 91 95 100 97 Mechanical wood-pulp(0.9;.
104 110 110 110 106 107 104 105 105 100 101 96 99 105 98 Chemical » (1.2)96 98 96 97 95 95 98 98 102 88 87 87 89 91 88 Board (1.2).
101 104 102 104 100 99 98 97 97 91 89 89 90 92 91 Paper (2.7).83 99 113 65 57 54 52 44 37 27 31 38 46 51 *53 Pianos (1.0).87 98 85 63 63 64 72 62 67 53 64 80 84 92 66 Watches (1.0).
* Provisional.
SWEDEN (Svensk Finanstidning).Basis: 1923-1924,
1930
Jxj x ] [ I.Grouping and WeightingX XI XII I |I III IV V VI VII VIII IX X XI XII
134 137 130 151 144 149 149 140 123 130 120 127 126 120 120 GENERAL INDEX (100).
186 204 200 217 189 185 215 226 198 196 158 193 175 152 149 Iron ore (4.5).138 148 135 136 125 121 121 118 112 127 113 127 117 110 115 Iron and steel (18.7).113 102 102 91 140 139 133 131 112 101 102 97 103 98 93 Wood (22.0).152 158 149 232 176 19696 16 164 134 150 139 148 144 143 145 Pulp (22.8).
139 166 1l12- 1- 131 124 - Paper (11.8).118 141 121 165 173 172 172 151 127 124 123 141 136 141 120 Superphosphates (1.1).108 108 108 109 108 108 110 110 108 111 105 111 110 106 116 Tobacco manufacture (9.9).117 126 114 114 107 118 120 120 115 116 102 117 133 127 117 Malt liquors (6.6).
Labour disputes.

- 156 -
Tableau 91 (suite). Nombres-indices de production.(Voir explications p. 159.)
FRANCE (Statistique ge6nerale).Base: 1913.
1929Groupement et ponderation 1924 1925 1926 1927 1928 1929 1930 _______- __-____-___-___-_____
.. __ -___- __ __ - _ 1' ]f I III IV V VI VI I VII I X
INDICE GIN].RAL (50) . . . 108 107 124 109 127 139 140 137 136 138 139 139 141 139 139 138
INDUSTRIES MtCANIQUES (17): 123 115 132 114 138 157 157 154 151 156 156 157 159 156 159 157Travail du fer (14). . . 113 104 122 107 128 145 147 141 137 142 142 142 144 144 147 145Travail du cuivre (2). . 134 122 122 81 118 144 130 142 138 143 145 150 157 147 150 152Automobiles (0,5). . . . 422 461 543 524 610 657 640 697 675 704 698 720 706 644 637 608Constructions navales (0,5) 44 56 48 44 40 46 58 49 49 49 46 46 46 43 43 43
MtTALLURGIE (3) : . . . . 94 101 113 112 125 129 125 132 126 127 131 132 130 128 130 126Fonte (1) . . . . . . . 85 93 103 102 111 115 Ill 117 112 114 116 116 116 113 116 114Acier (1,5). . . . . . . 99 107 120 119 134 139 135 141 134 135 141 143 139 138 139 133
TEXTILES (12) ..... 85 85 94 90 99 92 85 97 96 94 95 93 95 92 88 87Coton (3) ....... 73 77 82 79 82 83 79 84 84 82 84 83 84 82 80 78Laine (3) . . . . . . . 103 99 106 100 109 103 97 107 106 102 104 102 106 104 99 98Soie (2) ........ 88 100 105 87110 91 74 103 101 101 98 96 94 89 84 84
MINES (4): ..... . 94 104 114 117 117 123 12 120 120 123 124 121 123 122 123 120Houille (3) . . . . . . 101 108 118 120 117 123 124 119 119 122 124 121 123 122 123 120Mineral de fer (0,6) . 67 84 92 107 114 119 113 123 118 120 118 117 118 116 118 116Potasse (0,1) . . 87 100 118 121 132 159 163 160 153 150 153 146 155 149 160 156
BATIMENT (8,5) . . .. . 74 80 114 80 97 123 137 107 110 113 116 116 118 120 123 127CUIR (4,0) ........ 110 104 128 103 130 119 110 139 137 134 133 129 123 115 108 102CAOUTCHOUC (0,5) . . .. 38 502 599 547 587 861 898 684 726 768 813 843 875 924 923 923PAPIER (1,0) . .... 77 83 90 83 87 106 130 99 99 93 95 97 102 108 110 111
POLOGNE (Institut de reeherehes sur le mouvement des affaires et des prix).Base: 1925-1927.
1929Gioupement et pondration 1924 1925 1926 1927 1928 1929 930 • 1 it i vl I"
I II I i IV V VI VII VIII IX
INDICE GE1NIERAL (100) . . . 94 92 115 129 129 106 137 127 130 134 129 128 126 126 129Biens de production. .. . . . . 146 144 115 152 138 141 151 151 150 143 142 142Biens de consommation . . . . . 125 118 99 136 127 127 121 112 111 109 112 116
MINES '(22,4):
Charbon (18,2) . . . . 94 85 104 111 119 135 109 128 123 132 143 135 130 139 136 139Naphte (1,5) . ..... 99 104 102 93 96 87 85 82 82 95 89 92 85 86 86 91Sel (0,6) .... . 79 95 97 108 116 117 109 108 98 142 153 107 118 125 117 113Mineral de fer (0,7) . . 81 59 89 152 198 186 134 187 154 151 173 181 200 214 194 184Zinc et plomb (1,4) . 74 102 103 95 99 102 95 101 96 101 114 105 108 110 93 102
M-TALLURGIE (7,6):
Fer et acier (5,9) . . . 71 83 82 135 154 145 129 172 143 146 166 160 147 143 141 137Zinc (1,7) . . . . . . . 71 88 96 116 125 131 135 131 123 121 135 130 130 137 138 139
INDUSTRIES (70,0):
M6taux et industries m6ca-niques (10,9) . . . 97 89 115 142 143 108 150 147 150 156 155 152 133 135 136
Industrieschimiques (5,1) 100 95 105 115 119 116 121 114 115 119 116 115 118 118 121Min6raux (6,9) . . . . . 90 88 122 152 149 113 155 137 141 147 147 152 152 154 156Bois (7,8) . . . . . . . . 100 92 108 115 111 93 112 103 106 113 112 114 112 115 115Constructions (4,0) . . . 103 88 108 164 162 109 158 135 140 159 177 180 172 167 164Textiles (20,8) . . . . . . 89 85 126 131 117 91 144 134 134 123 107 104 102 107 114Habillement (1,3) . .. 175 187 158 187 180 172 180 184 186 193 186 195Cuir (0,7) . . . . . . . . . . 126 111 105 129 108 104 101 102 101 103 107 114Alimentation (9,4) .. 108 94 98 105 109 100 115 111 106 106 111 110 109 108 107Papier (1,7) . . . . . . . . . 125 125 121 130 116 123 121 128 127 125 124 121Arts graphiques (1,4) . . . . 122 125 124 130 128 126 127 125 124 122 121 121

157
Table 91 (continued). Index Numbers of Production.(For explanations, see p. 159.)
FRANCE (Statistique generale).Basis: 1913.
1930
1J xI xI I I I l [— Grouping and WeightingX | XI XI I | II 1 1 V V VI VII| VIII IX I X | IXII
141 143 144 144 143 144 144 144 144 141 139 137 136 135 134 GENERAL INDEX (50).
159 159 159 162 159 161 161 161 162 161 159 156 152 149 146 ENGINEERING (17)150 151 152 154 149 152 148 151 153 149 149 144 144 138 135 Iron (14)144 139 126 129 135 128 139 135 139 135 128 127 118 120 123 Copper (2).587 598 613 639 668 686 685 678 661 652 630 600 596 594 593 Motor vehicles (0.5).
48 48 48 55 55 55 58 58 58 62 62 62 57 57 57 Shipbuilding (0.5).
129 133 130 126 130 132 129 132 128 124 125 120 120 119 118 METALLURGY (3):116 116 113 113 116 116 115 116 113 111 109 107 107 105 104 Pig-iron (1).137 144 142 135 140 143 138 143 137 133 135 129 129 129 127 Steel (1.5).
90 91 91 87 88 85 87 86 87 82 80 80 84 86 85 TEXTILES (12):84 84 84 82 84 79 82 79 79 72 73 78 82 83 80 Cotton (3).
101 105 107 104 102 97 101 101 105 100 93 84 90 94 95 Wool (3).83 80 76 71 72 75 75 75 73 71 70 76 78 77 76 Silk (2).
126 129 126 131 130 126 124 121 119 121 121 120 120 121 119 MINES (4):125 128 127 131 130 126 124 121 119 121 121 121 120 124 122 Coal (3).126 123 113 125 122 118 114 115 115 116 115 111 108 103 98 Iron ore (0.6).162 181 179 189 190 184 166 174 120 149 154 162 183 146 136 Potash (0.1).
132 138 140 138 139 143 144 143 140 139 138 137 134 132 131 BUILDING (8.5).100 103 105 108 111 114 116 117 116 113 110 106 104 104 106 LEATHER (4.0).930 957 962 938 918 913 909 913 876 874 865 874 892 899 903 RUBBER (0.5).111 116 121 131 137 141 145 147 142 140 126 121 114 111 111 PAPER (1.0).
POLAND (Institut de reeherehes sur le mouvement des affaires et des prix).Basis: 1925-1927.
1930
I f ) _~~ l i lt__ ~13 _I\\ i i i Grouping and Weighting
X I I XII I II III IV V VI VII VIII IX X XI XII
130 126 125 117 108 103 103 104 103 104 106 109 11 106 102 GENERAL INDEX (100):142 140 137 132 126 116 113 115 113 113 113 114 110 108 99 Producers' goods.119 115 114 102 95 94 94 98 96 97 100 105 107 102 102 Consumers' goods.
MINING (22.4):140 134 138 125 107 98 102 97 100 103 110 115 117 118 117 Coal (18.2).85 86 86 82 81 86 83 79 83 82 89 90 87 91 89 Naphtha (1.5).
113 96 115 113 107 104 100 113 127 129 100 102 103 107 106 Salt (0.6).200 202 193 170 153 129 118 129 127 127 121 129 140 137 119 Iron ore (0.7).105 93 103 98 100 99 96 97 93 94 95 88 94 92 94 Zinc and lead (1.4).
METALLURGY (7.6):133 134 122 140 134 128 125 141 124 134 129 130 127 130 110 Iron and steel (5.9).135 124 125 130 135 133 136 134 133 136 137 134 135 136 139 Zinc (1.7).
MANUFACTURES (70.0):
Metals and engineering136 132 132 126 120 114 113 108 107 103 107 104 103 97 93 (10.9).122 125 125 120 120 113 118 111 115 115 112 121 116 118 118 Chemicals (5.1).156 151 141 127 121 117 110 111 115 113 113 115 116 102 91 Minerals (6.9).115 110 105 104 97 97 100 96 93 92 93 91 93 87 78 Wood (7.8).162 159 168 154 136 105 94 103 107 108 107 106 104 99 85 Building (4.0).119 113 105 87 84 82 83 88 87 91 95 103 105 I 5 96 Textiles (20.8).190 195 200 173 162 160 163 1778 158 125 156 161 158 153 153 Clothing (1.3)116 123 118 111 102 99 99 100 97 100 96 110 115 114 112 Leather (0.7).108 104 118 116 100 100 99 101 99 96 96 95 101 102 100 Food (9.4).126 126 130 124 118 119 120 120 120 119 123 120 124 127 120 Paper (1.7).125 127 128 133 130 127 123 125 119 120 120 123 122 121 119 Graphic arts (1.4).
_________ _________ I~~~~~~~~~~~~

- 158
Tableau 91 (fin). Nombres-indices de production.Table 91 (concluded). Index Numbers of Production.
(Voir explications p. 159.) - (For explanations, see p. 159.)
ROYAUME-UNI (Board of Trade). - UNITED KINGDOM (Board of Trade).Base : 1924. - Basis: 1924.
1929 1930Groupement et pond~ration 1927 1928 1929 1930 - -I - IV - Grtuping and Weightitg
I- IV - VII- X. I- IV- VII- X-d_III VI IX XII III VI IX XII
INDICE GENIARAL (100) ... . 107 106 112 103 111 112 III 114 111 103 99 99 GENERAL INDEX (100).
MINES (19,9) ......... 94 89 97 91 99 93 94 101 102 87 84 91 MINING (19.9).
INDUSTRIES (80,1): 110 109 116 106 113 117 115 117 113 107 103 101 MANUFACTURES (80.1):Fer, acier et leurs produits Iron and steel and their pro-
(10,3) . . . . . . . . . . 110 102 114 89 112 118 114 112 114 96 80 66 ducts (10.3).M6taux non ferreux (1,5) . 117 119 121 119 116 129 115 123 106 124 129 118 Non-ferrous metals (1.5).Industries mecaniques et cons- Engineering and shipbuildingtructions navales (19,1) . 115 113 121 117 120 125 119 120 126 123 112 107 (19.1).
Textiles (18,7) ....... 102 100 99 79 102 100 91 101 92 78 72 75 Textiles (18.7).Produits chimiques (3,5). .. 105 110 116 101 108 115 120 120 105 101 104 95 Chemical & allied trades (3.5).Cuirs, chaussures (3,4) . . 108 102 99 101 100 101 95 98 109 104 98 95 Leather & boots & shoes (3.4).Alimentation, boisson, tabac Food, drink and tobacco(13,7) . ........ 100 102 106 105 98 109 112 106 97 105 108 109 (13.7).Gaz et 6lectricit (4,8). .. 120 126 136 140 . .. . . . .. Gas and electricity (4.8).
U.R.S.S. - U.S.S.R.a) Institut de Conjoncture.
Base: 1923-1924. - Basis: 1923-1924.
2924 192 19286 1927 1928 1929Gropeent et pondration 24 192 926 1928 1929 Grouping and Weightinga) a a) a) a) a)
INDICE G]NE:RAL (100) . . .. 100 161 227 277 335 388 GENERAL INDEX (100).
MINES (26,8) ......... 100 110 155 195 219 254 MINING (26.8).
INDUSTRIES (73,2): MANUFACTURES (73.2):Lourdes (32,9) ....... 100 215 335 424 516 580 Heavy (32.9).Autres (40,3) . . . .100 165 216 245 304 359 Light (40.3).
b) Valeur de la production industrielle au prix de 1926-1927,en chiffres absolus - millions de roubles - et en pourcentages.
b) Value of Industrial Production, at 1926-1927 Pricesexpressed in millions of rubles and percentages thereof.
Chiftres absolus en millions de roubles. Nombres-indices - Index numbersActual figures in rubles. 000'000's omitted. (1929=100)
aa 1 a) 1928 a) 1929 a) 1930 ]928 1929 1930
Total ........ 12,900 15,921 . 100 123 Total.
Houille ..... . . 333.2 357.5 489.7 93 100 137 Coal.P6trole et produits ... . 661.9 786.4 819.4 84 100 104 Petroleum and products.Minerals ...... . 71.4 95.2 147.2 75 100 155 Ores.Ciment .... .. 62.9 72.9 111.1 86 100 152 Cement.Verre. . . . 107.6 129.7 170.0 83 100 131 Glass.Mtallurgie et machines . . 1,896.2 2,456.9 2,714,8 77 100 110 Metallurgy and engineering.Textiles et habillement .. 3,496.2 4,182.1 4,716.8 84 100 113 Textiles and clothing.Cuir.. ... 521.9 740.4 1,189.0 70 100 161 Leather.Produits chimiques .... 633.4 775.8 1,177.3 82 100 152 Chemicals.Alimentation, tabac, etc. . . 901.8 1,052.1 1,363.7 86 100 130 Food, tobacco.Bois. . ........... 281.4 345.2 675.9 82 100 196 Timber.Papier .. .. .. . 132.1 177.6 246.1 74 100 139 Paper.
a) Annees finissant le 30 septembre. - Economic years ending September 30th.

- 159 -
NOTES DU TABLEAU 91. - NOMBRE-INDICES DE PRODUCTION. NOTES TO TABLE 91. - INDEX NUMBERS OF PRODUCTION.
NOTE G1iN]RALE. - La composition des indices de la GENERAL NOTE. - The composition of the variousproduction varie naturellement selon la structure economique production indices naturally varies according to the economicdes divers pays. Elle est indiqu6e de maniere approximative structure of the several countries. It is roughly indicated bypar les rubriques qui donnent 6galement l'importance relative the headings to each group index where the relative importancede chacune des industries comprises dans l'indice. of each industry is also shown.
Comme la composition des indices de groupe varie, toutefois, The composition of the group indices themselves, however,elle aussi, il faut faire des comparaisons avec beaucoup de pru- also varies and comparison requires to be made with very greatdence. Ces differences dans la composition sont particulierement care. These differences in composition affect particularly thefrappantes en ce qui concerne l'indice des industries mecaniques engineering index which, in certain cases, includes for instancequi contient parfois les constructions navales et les indices de la shipbuilding and the textile indices. The composition of theseproduction textile. Voici, a titre d'exemple, la composition de latter is indicated below.ces derniers:
Pays - Country Coton- Cotton Laine- Wool Sole - Silk Autres textiles - Other Textiles
Canada Import. du coton brut. Importations de laine brute.Raw cotton imports. Raw wool imports.
Etats-Unis Consommation de co- a) Consommation de laine brute par a) Livraison de soieUnites States ton brut des usines. les usines. b) Heures d'activite des brute aux usines.
Mill consumption of metiers et broches. c) Heures d'ac- b) Pourcentage de me-raw cotton. tivit6 des mitiers h tapis. - tiers en activit6.
(a) Mill consumption of raw wool. (a) Deliveries of raw(b) Loom and spindle hours activity. silk to mills. (b) Per-(c) Carpet and rug loom hours activity centage of looms active
Allemagne Production de fil a) Product.de fil delin.Germany Production of yarn b) Expedition de filde chanvre. -
(a) Production of linenyarn. (b) Hemp yarn_despatched.
France Product. moyenne par Laine conditionnee a Roubaix-Tour- Soie conditionnie aFrance broche et par m6tier. coing et Mazamet. Lyon.
Average production Wool conditioning at Roubaix-Tour- Silk conditioning atper spindle and loom coing and Mazamet. Lyons.
Pologne Un seul indice repr6sentant le nombre d'heures de travail dans l'industrie textile en g6enral.Poland A single index representing working hours in the textile industry as a whole.
a) Filature. b) Tissage. Draps et eigs. ) Soie artificielle.c) Blanchim. d) Tein- b) Jute. c) Toile.United Kingdom ture. e) Impression. -- Woollen and worsted. Silk d) Bonneterie.
(a) Spinning. (b) Wea- (a) Artificial silk.ving. (c) Bleaching. (b) Jute. (c) Linen.(d) Dyeing. (e) Print. (d) Hosiery.
Les indices g6enraux, ainsi que les indices relatifs aux textiles The general indices as well as the indices of textiles and ofet aux machines, sont publies reguliirement dans le Bulletin engineering are published regularly in the Mcnihiy Bulletin ofmensuel de Staiistique de la Soci6te des Nations. Les explica- Stalislics of the League of Nations. The description of thetions concernant les m6thodes utilisees y sont tenues a jour. methods of computation is kept there up to date.
Canada : l'indice se ref re a 26 branches de l'industrie Canada: the index covers 26 different branches of industryet du commerce. and trade.
Les donnees sont combin6es en 4 principaux indices de The items are combined into four main group indices andgroupe et en un nombre-indice gienral, a l'aide d'une moyenne into a general index by means of a weighted arithmetic average.arithmetique pond6r6e. Les coefficients de pondiration sont The relative net values of production in the period 1919-1923bas6s sur la valour relative nette de production dans la pericde are used as weights. Each item in the index is adjusted,1919-1923. Chaque donnee de l'indice est corrigee pour liminer when necessary, for seasonal variations.les variations saisonni6res, lorsque c'est n6cessaire.
Etats-Unis : l'indice se compose de 49 series relatives U. S. A.: the index covers 49 series relating to manu-aux produits manufactures dont les plus importantes sont facturing industries, from which the most important seriesdonn6es dans le tableau et de 8 s6ries relatives a l'in- are given in the table, and 8 series relating to mining.dustrie extractive. Dans la mesure du possible, les indices As far as possible, direct production data are used in compilingsont calcules d'apr6s les donnees directes sur la production. the indices; in some cases, figures showing the consumptionDans d'autres cas, on a utilis6 les chiffres relatifs a la consom- of certain raw materials and other subsidiary figures are used.mation de certaines matieres premieres ou autres donnees The weights are derived:subsidiaires. (a) for mining, from the total value of production in the years
La pond6ration repose, dans le cas de l'industrie extractive, 1923-1925, andsur la valeur totale de la production dans les annees 1923-1925; (b) for manufacturing industries, from values added bypour le groupe des produits manufactures, la pond6ration manufacture in 1923.a ete fix6e d'apres la plus-value resultant du processus de mrnu- The averages are calculated by the aggregate method.facture en 1923. The index is adjusted for inequalities of months and seasonal
Les moyennes sont calcul6es d'apris la m6thcde des valeurs variations.globales.
L'indice est corrig6 pour 6liminer l'in6galit6 des mois et lesvariations saisonniires.
Allemagne : l'indice est calcule i l'aide d'une moyenne Germany : the index is calculated by means of a weightedarithmetique pond6r6e d'apres 31 s6ries, lesquelles se rapportent arithmetic average from 31 items based mainly on actual pro-dans la majorit6 des cas directement a la production. Les duction. The weights used are intended to represent thecoefficients de pond6ration sont cens6s representer la plus-value value added by manufacture ; but as accurate net productioncreee par le processus de manufacture, mais, comme il n'existait figures were not available, they were based on the averagepas de donn6es sur cette valeur, on a basi la ponderation sur number of workers employed and the motor-power installedle nombre moyen des ouvriers ermploy6s et la puissance des in each industry in 1925.moteurs installes dans chaque industrie en 1925. Inequalities of months are eliminated.
Les in6galit6s des mois ont et6 ilimin6es.
- 160
France: 'indice comprend 18 series repr6sentant direc- France: the index includes 18 series directly or indirectlytement ou indirectement la production dans chaque branche representing the production in the various branches of industry.d'industrie. Group indices and the general index are calculated as weightedLes indices de groupe et l'indice general sont calcules a l'aide arithmetic averages. The weights have been based on thede moyennes arithmetiques ponderees. Les coefficients de pon- approximate proportion of workers employed in 1913; adjust-deration sont bases sur la proportion approximative du nombre ments have been made in order to include Alsace and Lorraine.d'ouvriers travaillant en 1913; des ajustements ont permis The series for extractive industry, metallurgy, cotton andd'inclure l'Alsace et la Lorraine. wool-weaving (a partial index of the wool group) are basedLes series relatives a l'industrie extractive, a la metallurgie, on an equal number of working days in each month.a l'industrie du coton et au tissage de la laine (indice partiel The series relating to building, motor-vehicles, leather, silkdu groupe laine) sont basees sur un nombre fixe de jours ouvra- and wool-spinning (a partial index of the wool group) arebles par mois. adjusted for seasonal variations.
Les variations saisonnieres sont l6iminees des series se rappor-tant af l'industrie de la construction, de l'automobile, du cuir,de la sole et du filage de la laine (indice partiel du groupe laine);
Pologne : les series relatives h l'industrie extractive et Poland : the series relating to mining and metallurgy area la metallurgie sont basees directement sur les chiffres de pro- based on direct production figures, while production of theduction, tandis que celles relatives a la manufacture sont finishing industries is indirectly represented by figures ofbasees sur le nombre d'heures de travail dans chaque industrie. working hours in each industry. The general index is theL'indice general represente une moyenne arithmetique weightedarithmetic average of 18 sub-indices. The weightingponderee de 18 sous-indices. La ponderation repose sur is based on the proportion of workers employed (or, in the casela proportion du nombre d'ouvriers (ou dans le cas des indus- of the finishing industries, the proportion of working hours)tries manufacturieres, la proportion des heures de travail) dan3 in each industry during the period 1925 to 1927.chaque industrie pendant les annees 1925 f 1927. The index is adiusted for inequalities of months. SeasonalL'indice est corriga pour eliminer l'inegalite des mois. Les variations are eliminated since April 1927.variations saisonnieres sont 6limin6es depuis avril 1927.!
Royaume-Uni : les industries comprises dans l'indice United Kingdom: industries included in the index aresont classees en 10 groupes (les neuf qui figurent au tableau, classified into 10 groups (the nine groups shown in the tableainsi que le papier et les imprimes). L'indice general, calcul and, in addition, paper and printing). The general index, whicha l'aide d'une moyenne arithmetique pond6ree de ces groupes, is calculated as a weighted arithmetic average of these groups,comprend, en outre, les donnees relatives aux diverses industries also includes data relating to various other industries, suchnon specifiees, telles que les produits du caoutchouc, le ciment as rubber manufacture, cement and tiles. The weights representet les tuiles. La pondtration repose sur la plus-value resultant the net values added by industry, as ascertained from thedu processus de l'industrie, determinee d'apres le recensement 1924 census of production.de la production de 1924. The index is not adjusted for seasonal variations orL'indice n'est pas corrige pour eliminer les variations saison- inequalities of months.nieres ou l'inegalite des mois.
Suede: les indices publies sont calcules directement d'apres Sweden : the indices shown are calculated from directles chiffres de production. L'indice general comprend egalement production figures. The general index also covers metall'industrie des metaux et l'industrie mecanique, qui est repre- manufacture and mechanical engineering, the latter beingsentee par l'importation de la fonte. L'indice general est calcule represented by imports of pig-iron. The general index isa l'aide d'une moyenne arithmetique ponderee, les poids 6tant calculated by means of a weighted arithmetic average, thebases sur les valeurs moyennes brutes de production en 1923 weights utilised being based on the average gross productionet 1924. values during the years 1923 and 1924.Les variations saisonnieres sont eliminees, chaque p6riode Seasonal variations are eliminated, each period being only6tant comDaree a la periode correspondante des annees de base. compared with the corresponding period of the base years.
U. R. S. S.: l'indice de l'Institut de Conjoncture, dont le U. S. S. R.: the index of the Institute of Conjoncture, thecalcul a ete interrompu en aoat 1929, comprenait 55 series computation of which was stopped in August 1929, coveredcombinees en indices de groupe et en tun indice general a l'aide 55 series which were combined into group indices and intod'une moyenne g6om6triIue ponderee. Les coefficients de a general index by means of a weighted geometrical average.ponderation 6taient bases sur le nombre moyen des ouvriers The weights were based on the average number of workersainsi que sur la force motrice, exprimee en chevaux-vapeur, employed and the horse-power installed in each industry indans chaque industrie, pour les annaes 1923 et 1924. Il n'etait 1923 and 1924. No adjustment was made for seasonal orpas fait d'ajustement pour eliminer des variations saisonnieres other variations. The figure for 1929 refers to eleven monthsou autres. of the economic year 1928-1929.Le chiffre de 1929 se refere a onze mois de l'anne economique As it did not prove possible to link up that index with any1928-29. other, the following data have been added to the table: (1) theComme il n'a pas 6te possible de relier f cet indice aucun aggregate value of the total industrial production at 1926-1927autre indice, on a ajoute au tableaul: 1. la valeur globale de prices, as published in the bulletins of the State Bank andla production industrielle totale an prix de 1926-1927, telle (2) the value of the production - likewise at 1926-1927 pricesqu'elle est publiee dans les bulletins de la Banque d'Etat, et - of the most important industrial groups. The data for 1927-2. la valeur de la production industrielle - toujours au prix 1928 and 1928-1929 have been worked out from the monthlyde 1926-1927 - d'apres les principaux groupes d'industrie. Statistical Bulletins of the U. S. S. R. and those for 1929-1930Ces donnees ont ete puis6es, pour 1927-1928 et 1928-1929 dans from No 10-11, 1930, of Narodnoie Khozialstvo (" Nationalles Bulletins statistiques mensuels de l'U. R. S. S. et pour 1929- Economy "). The numerous changes made in the computation1930 dans le No 10-11,1930 de Narodnoie Khoziaistvo (a Economie of these statistics by classes of industry necessitated severalNationale),). Les nombreux changements apportes dans le mode adjustments in order to ensure greater comparability. It is,de presentation de ces statistiques par groupes d'industries however, not known, whether, this aim has been entirely achieved.ont necessite quelques ajustements dans le but de rendre les It is, moreover, not certain whether the data for 1929-1930series plus comparables. II est, toutefois, possible que ce but do not in part refer to anticipated output and not actualn'ait pas ete entierement atteint. En outre, on ne sait pas si production.
les chiffres pour 1929-1930 representent partout la production The percentages are based on the absolute figures given ineffective de l'annee ou s'ils contiennent des 6lements de prevision the parallel columns.de la production a atteindre.
Les pourcentages ont ete calcul6s sur la base des chiffresabsolus qui figurent f c6t6.