pay it forward - iofm · may 7-9, 2017 disney’s yacht & beach club resorts®, florida pay it...
TRANSCRIPT
May 7-9, 2017
Disney’s Yacht & Beach Club Resorts®, Florida
Pay it Forward: Linking AP & Procurement for Closed Loop P2P
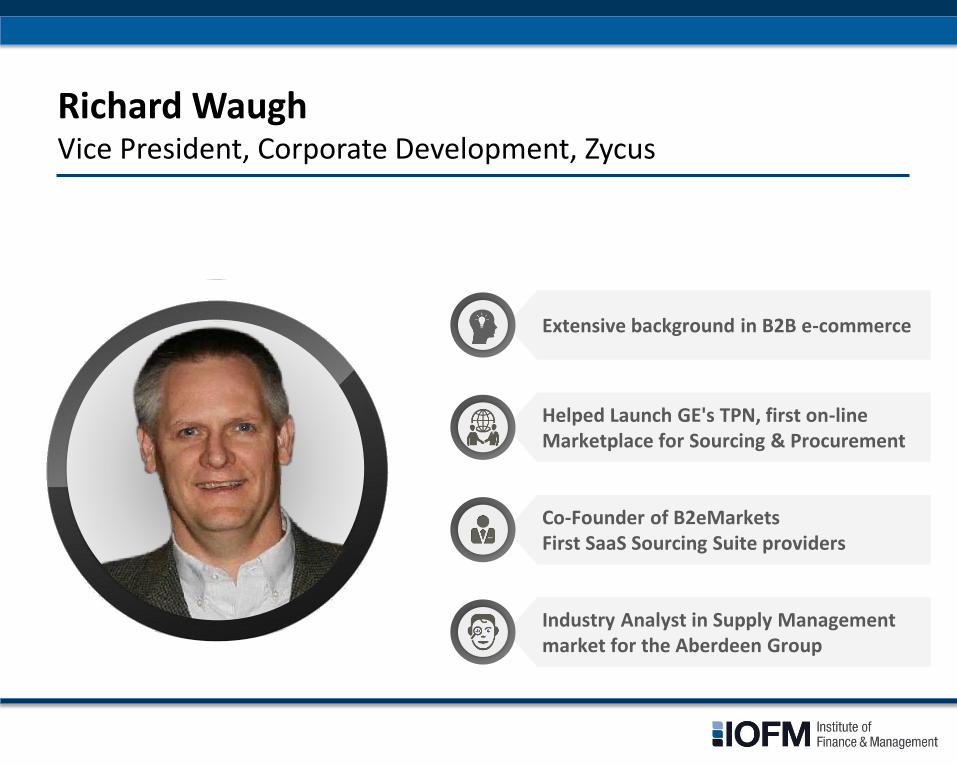
Richard Waugh Vice President, Corporate Development, Zycus
Extensive background in B2B e-commerce
Helped Launch GE's TPN, first on-line Marketplace for Sourcing & Procurement
Industry Analyst in Supply Management market for the Aberdeen Group
Co-Founder of B2eMarkets First SaaS Sourcing Suite providers

Scott Fitzgerald Director, Procurement, The Mentor Network
Seasoned procurement professional and business leader with more than 20 years of experience
Transformed the Procurement function at The Mentor Network from a transaction based compliance partner to a strategic business partner
Certified Purchasing Manager (C.P.M.) for lifetime and holds a Six Sigma Green Belt with Lean certification
Held Procurement and Strategic Sourcing leadership positions at noted leading organizations like Bank of America, MetLife and many more
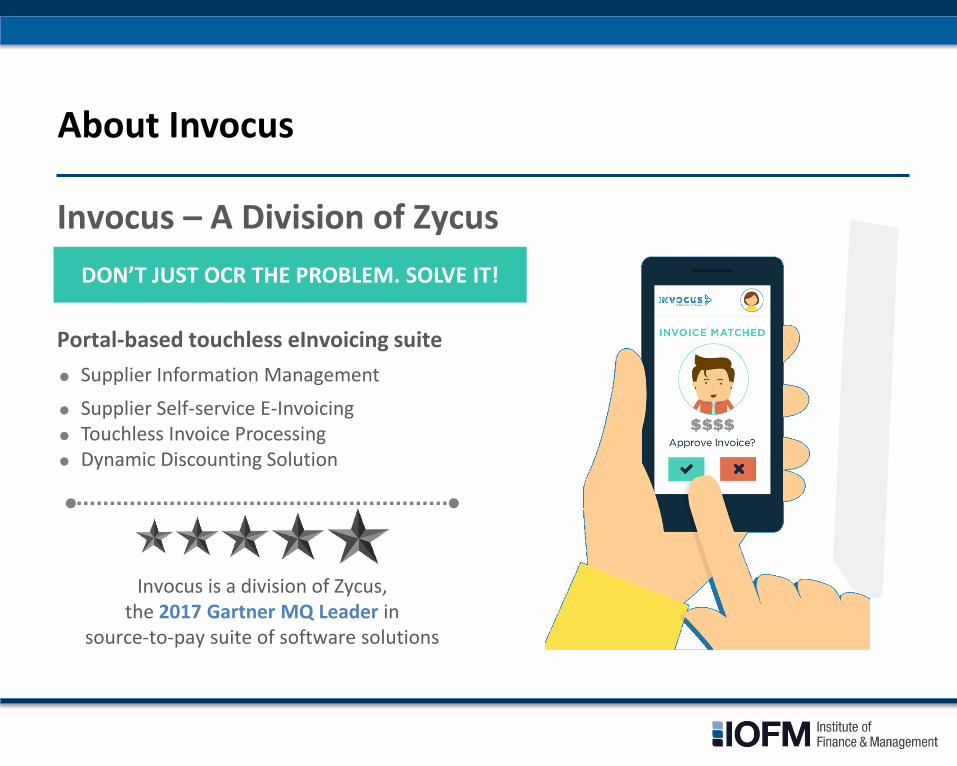
About Invocus
Invocus – A Division of Zycus Portal-based touchless eInvoicing suite
Supplier Information Management
Supplier Self-service E-Invoicing Touchless Invoice Processing Dynamic Discounting Solution
Invocus is a division of Zycus, the 2017 Gartner MQ Leader in
source-to-pay suite of software solutions
DON’T JUST OCR THE PROBLEM. SOLVE IT!
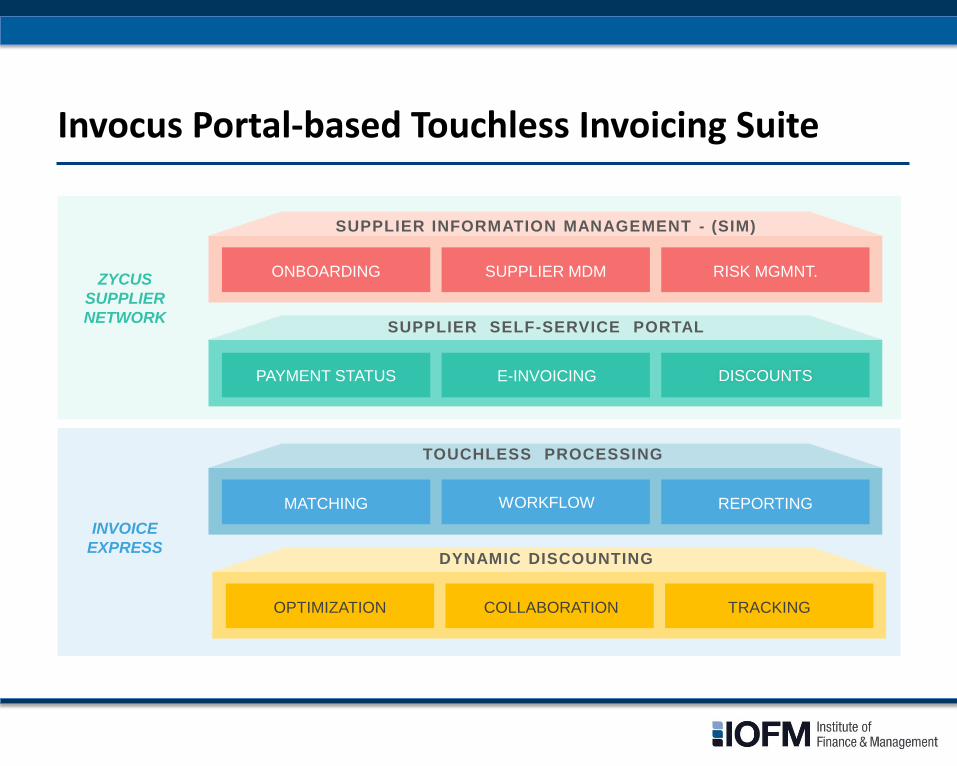
Invocus Portal-based Touchless Invoicing Suite
SUPPLIER SELF-SERVICE PORTAL
PAYMENT STATUS DISCOUNTS E-INVOICING
TOUCHLESS PROCESSING
MATCHING WORKFLOW REPORTING
INVOICE
EXPRESS
SUPPLIER INFORMATION MANAGEMENT - (SIM)
ONBOARDING SUPPLIER MDM RISK MGMNT. ZYCUS
SUPPLIER
NETWORK
DYNAMIC DISCOUNTING
OPTIMIZATION COLLABORATION TRACKING
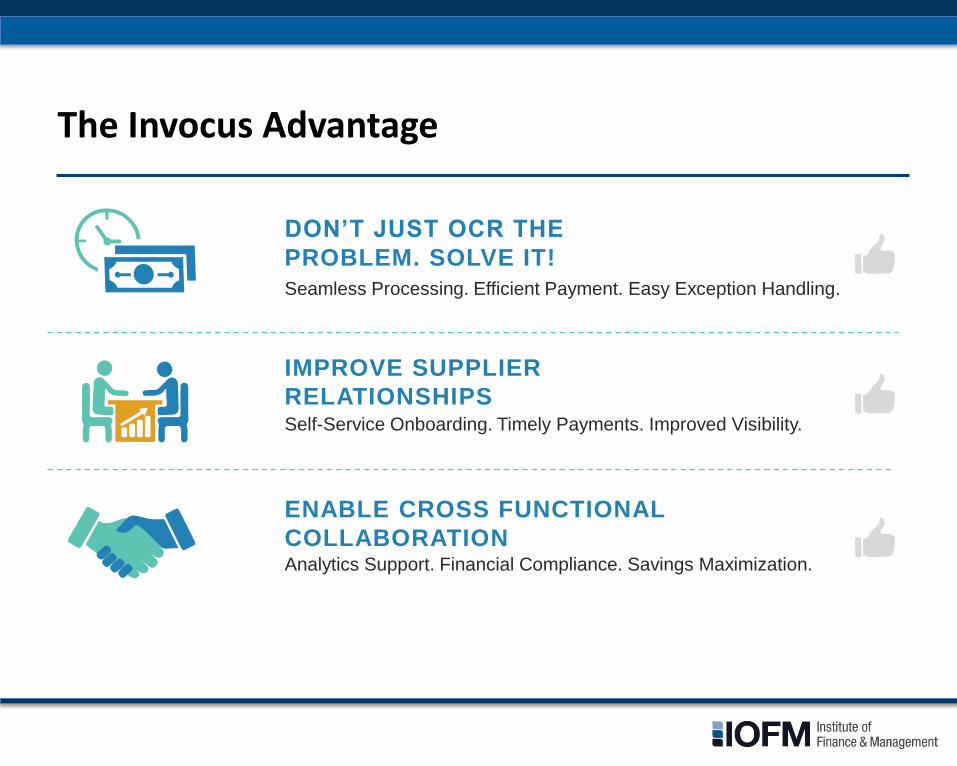
The Invocus Advantage
DON’T JUST OCR THE
PROBLEM. SOLVE IT!
Seamless Processing. Efficient Payment. Easy Exception Handling.
IMPROVE SUPPLIER
RELATIONSHIPS
Self-Service Onboarding. Timely Payments. Improved Visibility.
ENABLE CROSS FUNCTIONAL
COLLABORATION Analytics Support. Financial Compliance. Savings Maximization.

Today’s Agenda
2 What’s at Stake with P2P – for Procurement & AP?
3 What is the Ecosystem and Adoption of P2P Solutions?
4 Linking P2P Buy-Pay Channels
5 Payables Automation Playbook
6 P2P Success Metrics
7 Case Study: Re-Imagining P2P at The Mentor Network
1 A P2P Process Primer

A P2P Process Primer
Source: The Hackett Group
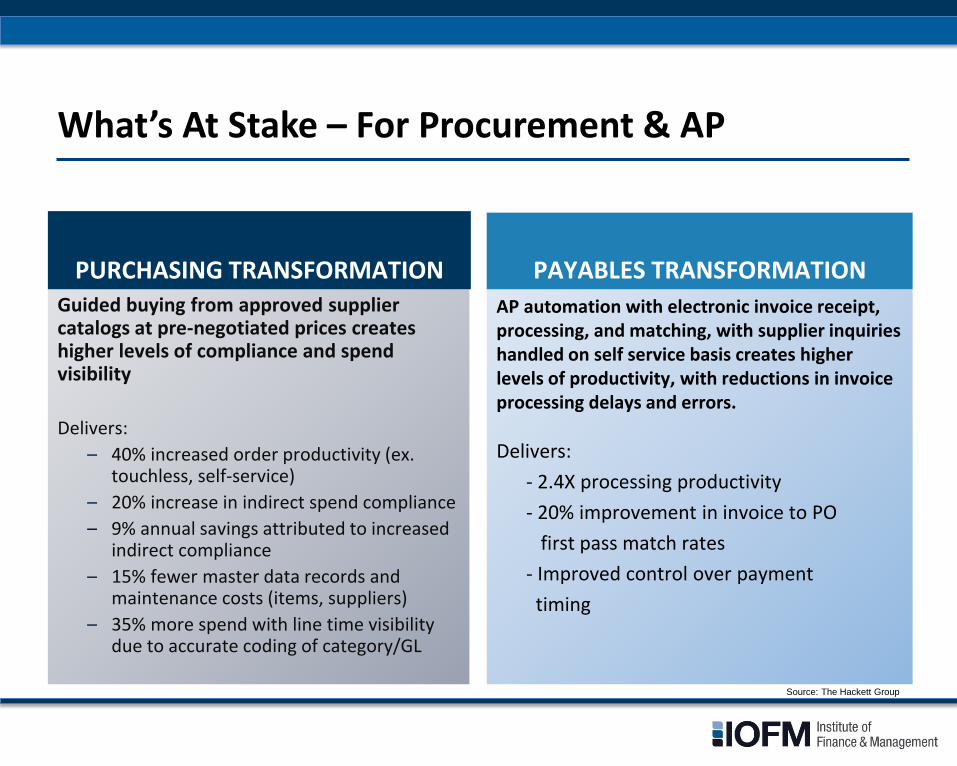
What’s At Stake – For Procurement & AP
Guided buying from approved supplier catalogs at pre-negotiated prices creates higher levels of compliance and spend visibility
Delivers:
– 40% increased order productivity (ex. touchless, self-service)
– 20% increase in indirect spend compliance
– 9% annual savings attributed to increased indirect compliance
– 15% fewer master data records and maintenance costs (items, suppliers)
– 35% more spend with line time visibility due to accurate coding of category/GL
AP automation with electronic invoice receipt, processing, and matching, with supplier inquiries handled on self service basis creates higher levels of productivity, with reductions in invoice processing delays and errors.
Delivers:
- 2.4X processing productivity
- 20% improvement in invoice to PO
first pass match rates
- Improved control over payment
timing
PAYABLES TRANSFORMATION
PURCHASING TRANSFORMATION
Source: The Hackett Group

Ecosystem/Adoption of P2P Solutions
Q For each software category, please indicate how extensively your organisation is using it, the
estimated level of value that it has driven and the deployment model being used.
Source: 2016 P2P Key Issues, The Hackett Group

Linking P2P Buy/Pay Channels
49%
10%
18%
TRANSACTIONS BY
CHANNEL
Source: The Hackett Group
P-card and other
Non-PO
2-way 25%
3-way

Payables Automation Playbook
Supplier
inquiry &
response
Eliminate physical document costs with aggressive use of electronic
Electronic invoice methods by supplier tier ex. EDI, E-Inv, ERS, PO flip, etc
Optimised thresholds for no and negative verification, pre-coded shopping trolley’s and catalogues
Quality approach PO, invoice, receipting. Maser data cleansing and improved timeliness.
No Checks, EFT, alternative payment methods ex. PayPal …value add of financial supply chain
Automated workflow, optimised business rules for approvals and reminders time to respond, 2nd approvers
24/7 transaction status visibility, chat + messenger, escalation
Source: The Hackett Group

P2P Scorecard – Success Metrics
Source: The Hackett Group, *Ardent Partners
% on-time payments
% first-pass match for PO backed invoices
% Electronic payments
% defective deliveries
% of reqs. rejected
% of POs vs. non-POs
Req.
creation
Req.
approval
Create
order
Transmit
order
Goods/ service receipt
Process
invoice
Payment
approval
Process payment
BUY PAY
PROCURE-TO-PAY (P2P)
% Electronic invoice
% Touchless POs
% free text reqs
% spend on catalog
% of spend under contract*
Contract enablement
After the fact POs
Avg. - 16 Days BIC - 3 Days
Avg. - 69% BIC - 80%
Avg. - 19% BIC - 70%
Avg. - 42% BIC - 68%
Avg. - 60% BIC - 72%
Avg. - 62% BIC - 46%
Avg. - 54% BIC - 69%
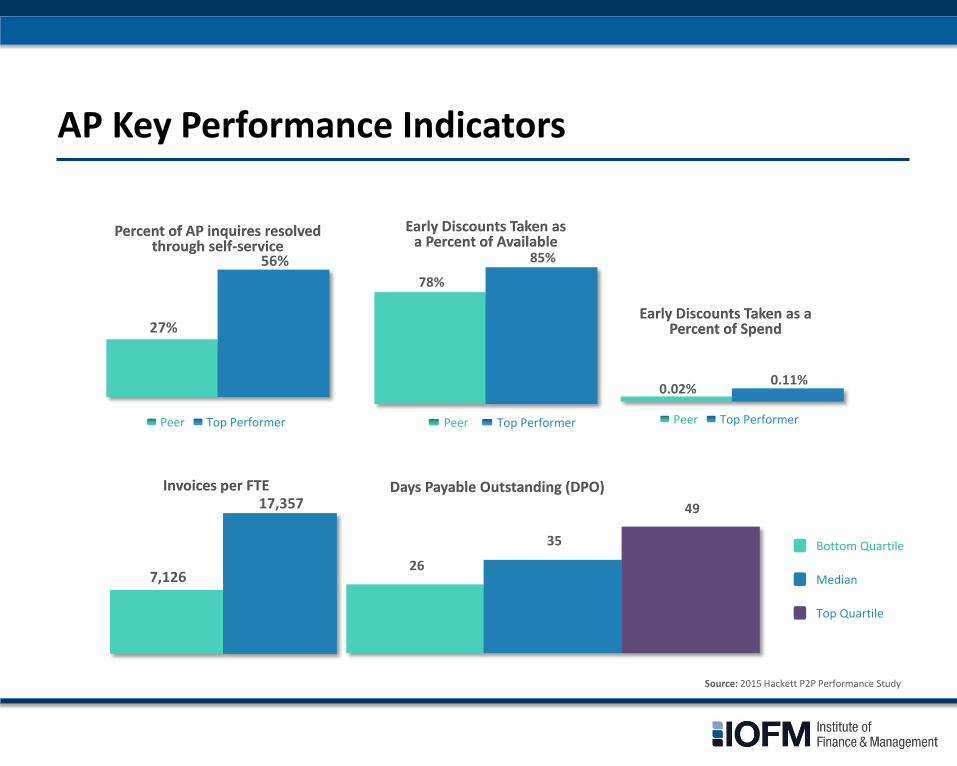
AP Key Performance Indicators
Peer Top Performer
73%
90%
0.02% 0.11%
Early Discounts Taken as a Percent of Spend
78%
85%
Peer Top Performer
Early Discounts Taken as a Percent of Available
Percent of AP inquires resolved through self-service
Source: 2015 Hackett P2P Performance Study
27%
56%
Days Payable Outstanding (DPO)
26
35 Bottom Quartile
Median
Top Quartile
49
7,126
17,357 Invoices per FTE
Peer Top Performer
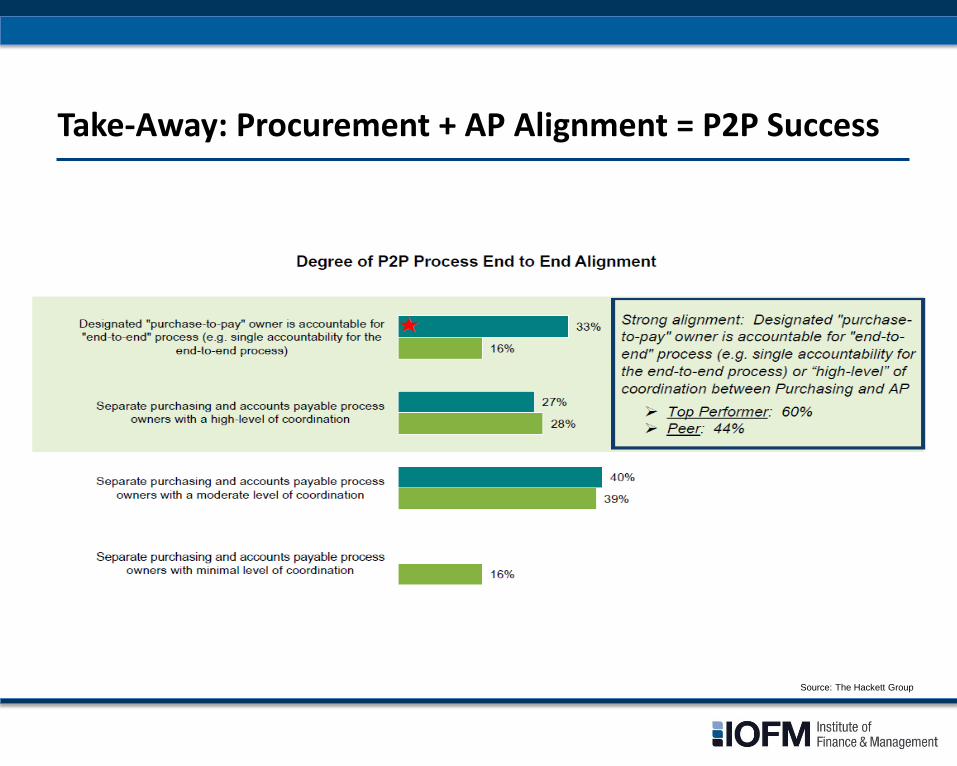
Take-Away: Procurement + AP Alignment = P2P Success
73%
90%
Source: The Hackett Group
Case Study: Re-Imagining P2P
73%
90%
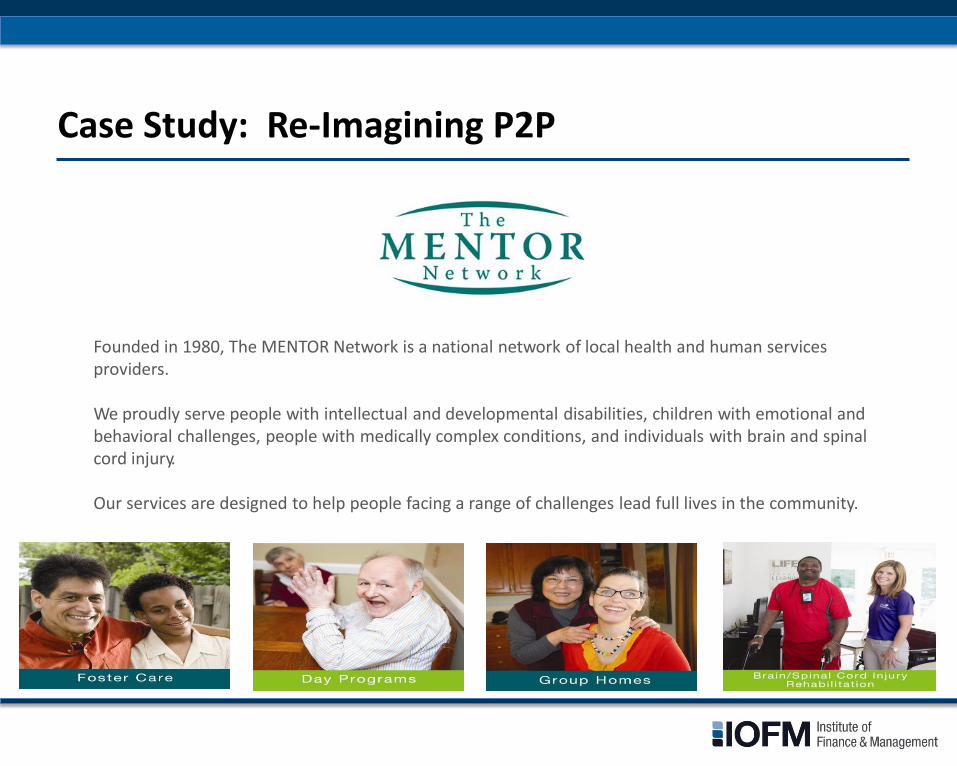
Founded in 1980, The MENTOR Network is a national network of local health and human services providers. We proudly serve people with intellectual and developmental disabilities, children with emotional and behavioral challenges, people with medically complex conditions, and individuals with brain and spinal cord injury. Our services are designed to help people facing a range of challenges lead full lives in the community.
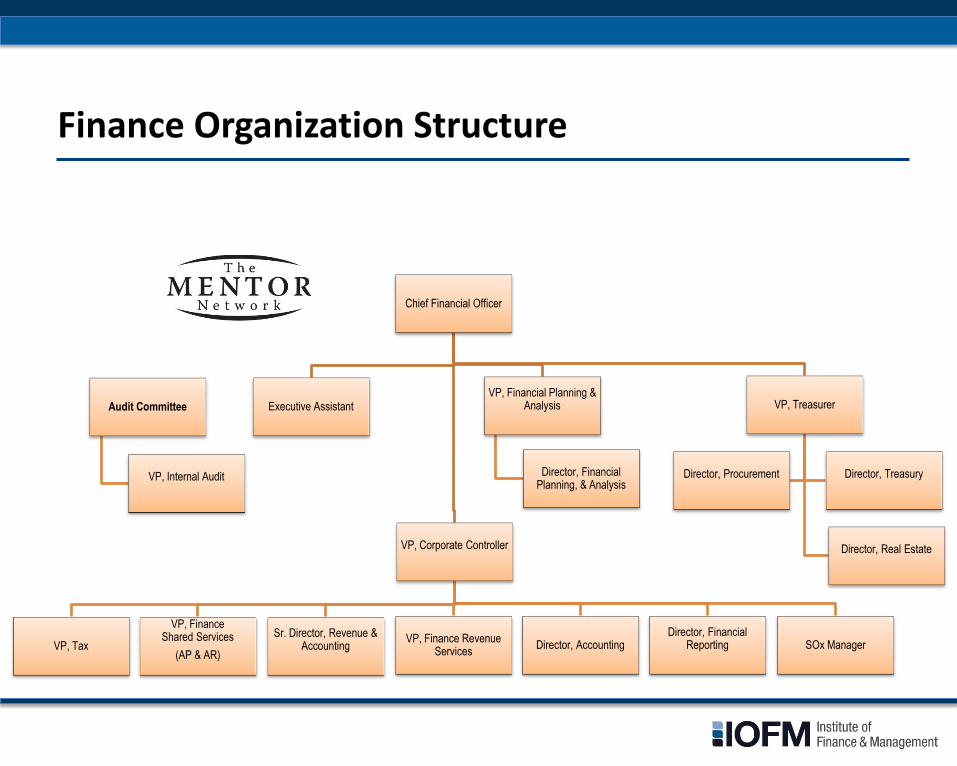
Finance Organization Structure
Chief Financial Officer
Audit Committee
VP, Internal Audit
Executive Assistant VP, Financial Planning &
Analysis
Director, Financial Planning, & Analysis
VP, Corporate Controller
VP, Tax
VP, Finance Shared Services
(AP & AR)
Sr. Director, Revenue & Accounting
VP, Finance Revenue Services
Director, Accounting Director, Financial
Reporting
SOx Manager
VP, Treasurer
Director, Treasury
Director, Procurement
Director, Real Estate
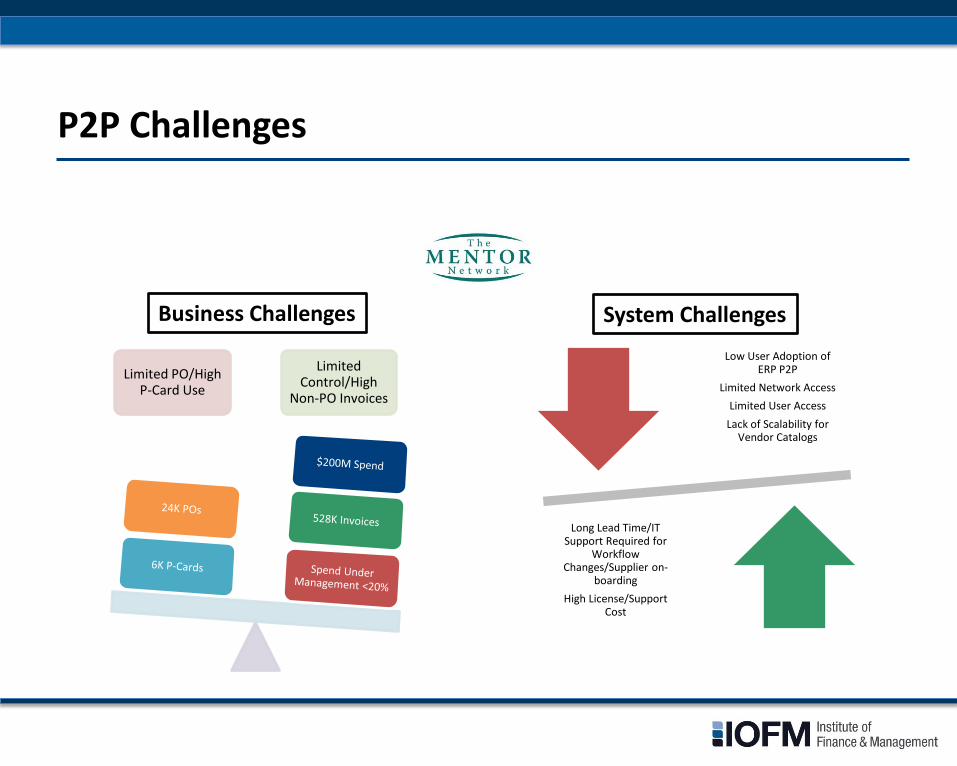
P2P Challenges
Limited PO/High P-Card Use
Limited Control/High
Non-PO Invoices
Low User Adoption of ERP P2P
Limited Network Access
Limited User Access
Lack of Scalability for Vendor Catalogs
Long Lead Time/IT Support Required for
Workflow Changes/Supplier on-
boarding
High License/Support Cost
Business Challenges System Challenges
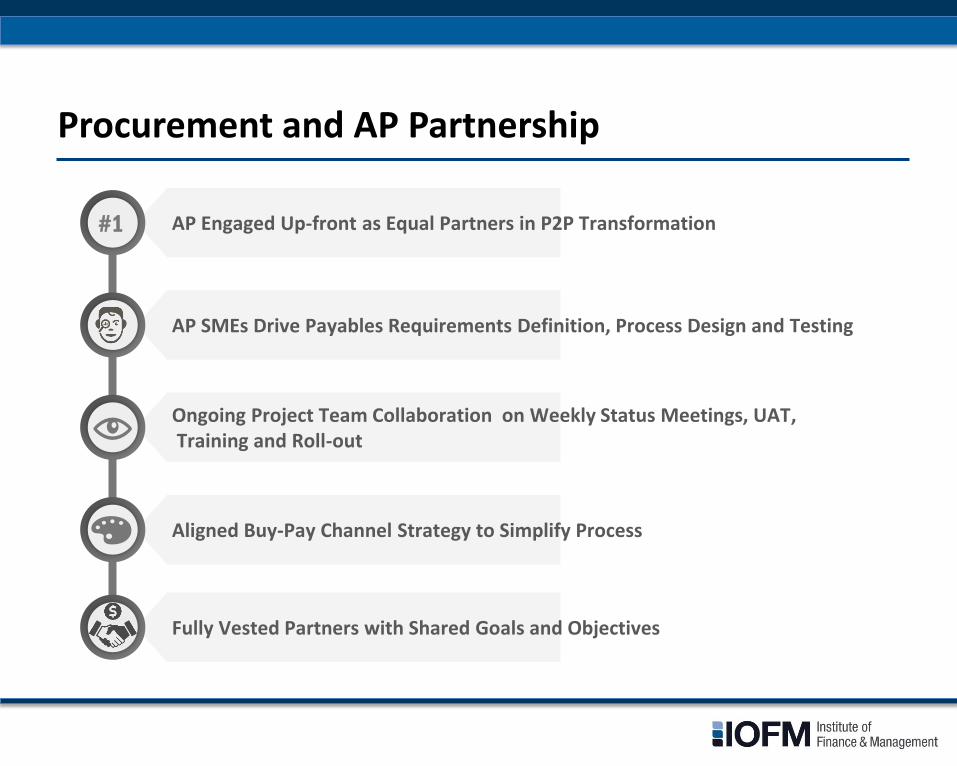
Procurement and AP Partnership
AP Engaged Up-front as Equal Partners in P2P Transformation
AP SMEs Drive Payables Requirements Definition, Process Design and Testing
Aligned Buy-Pay Channel Strategy to Simplify Process
Ongoing Project Team Collaboration on Weekly Status Meetings, UAT, Training and Roll-out
Fully Vested Partners with Shared Goals and Objectives
#1
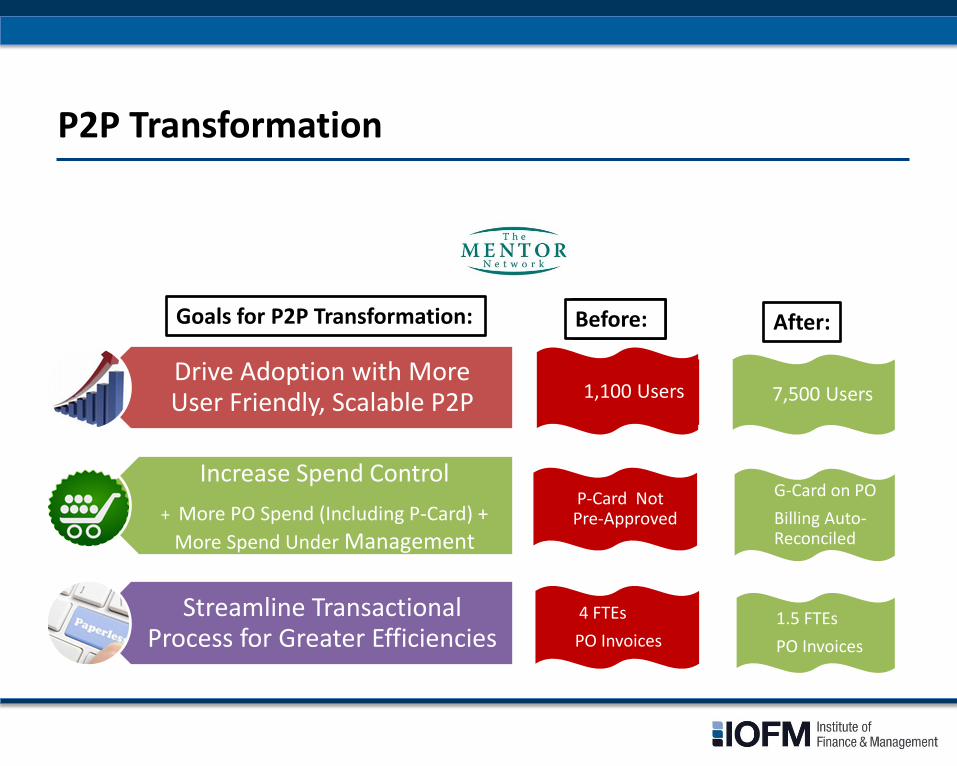
P2P Transformation
Drive Adoption with More User Friendly, Scalable P2P
Increase Spend Control
+ More PO Spend (Including P-Card) +
More Spend Under Management
Streamline Transactional Process for Greater Efficiencies
1,100 Users 7,500 Users
Goals for P2P Transformation: Before: After: Before:
P-Card Not Pre-Approved
G-Card on PO
Billing Auto-Reconciled
4 FTEs
PO Invoices 1.5 FTEs
PO Invoices
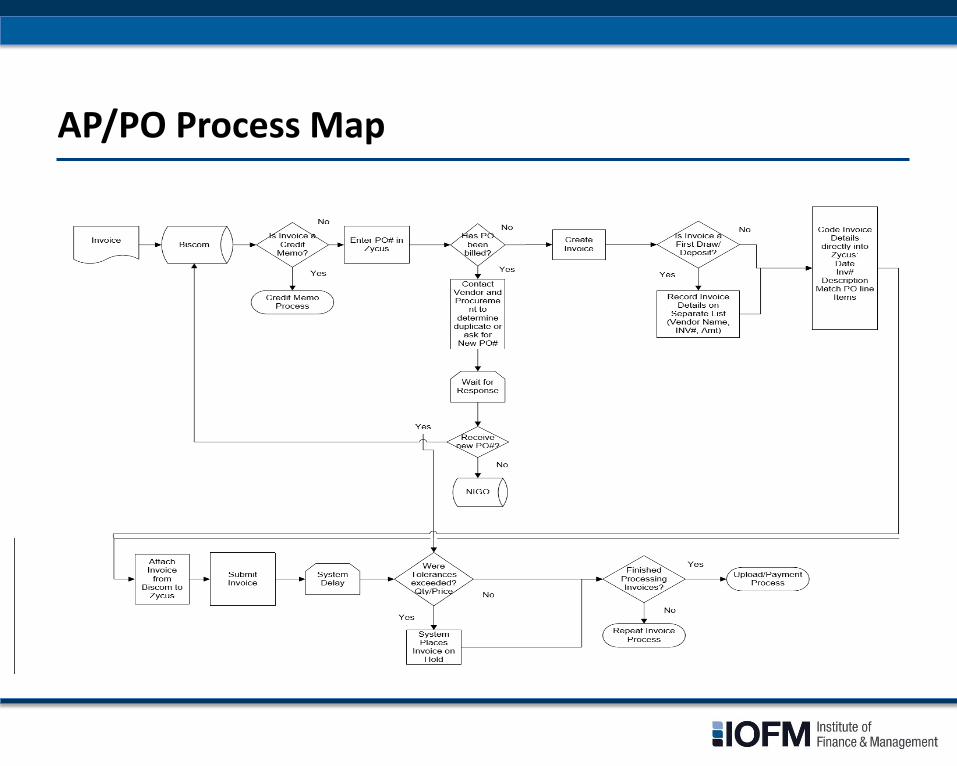
AP/PO Process Map
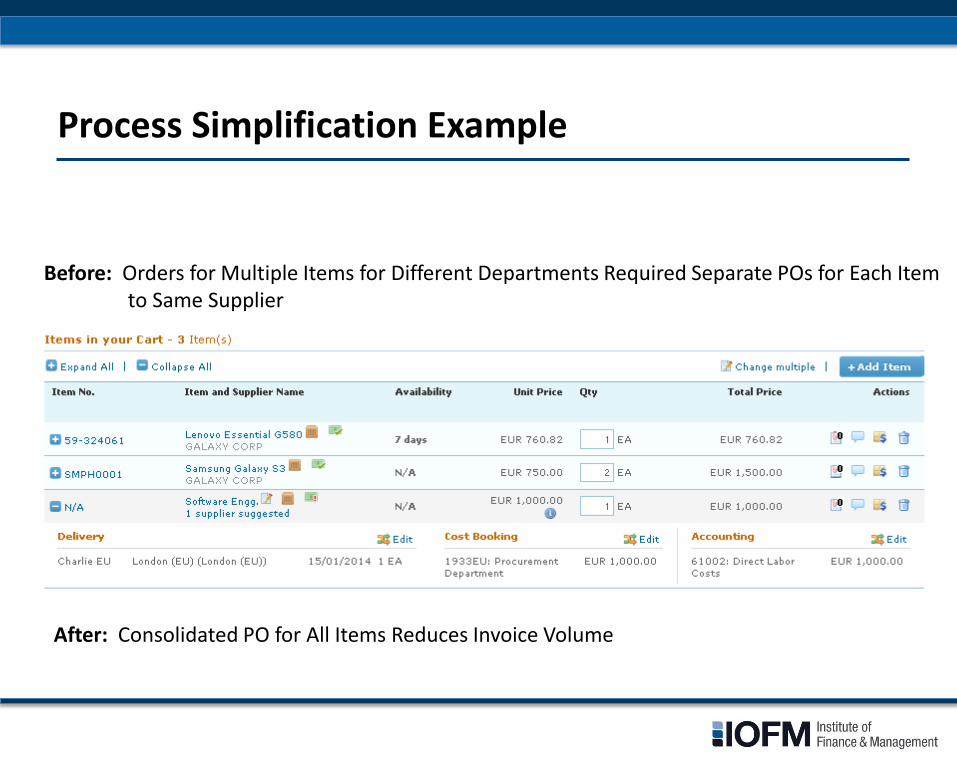
Process Simplification Example
Before: Orders for Multiple Items for Different Departments Required Separate POs for Each Item to Same Supplier
After: Consolidated PO for All Items Reduces Invoice Volume
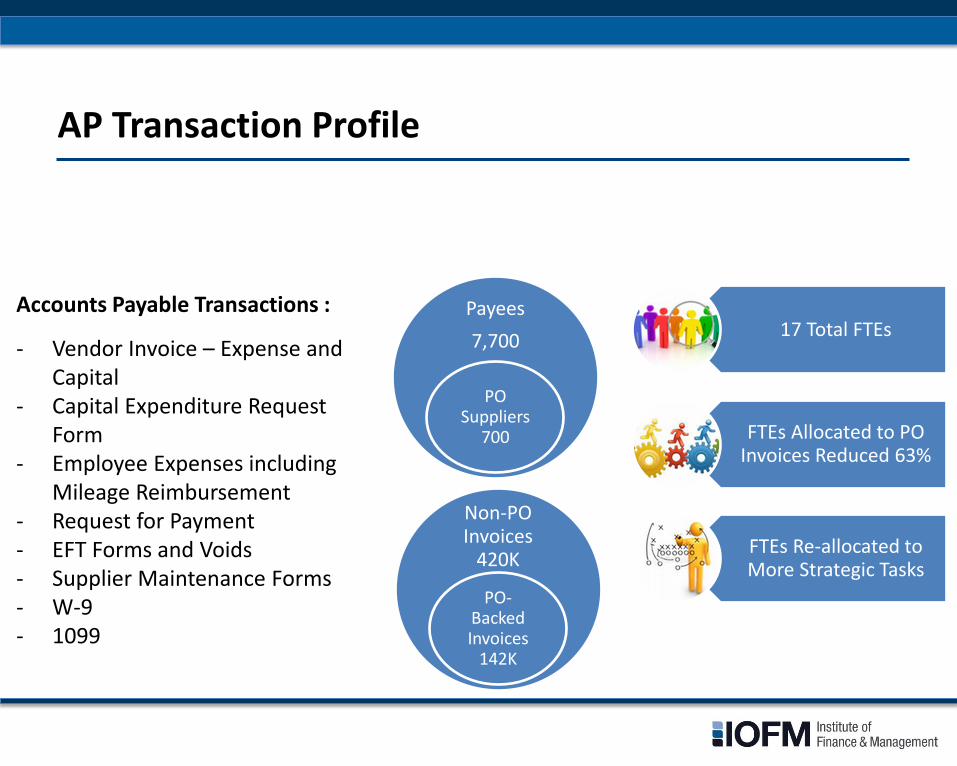
AP Transaction Profile
Accounts Payable Transactions :
- Vendor Invoice – Expense and Capital
- Capital Expenditure Request Form
- Employee Expenses including Mileage Reimbursement
- Request for Payment - EFT Forms and Voids - Supplier Maintenance Forms - W-9 - 1099
Non-PO Invoices
420K
PO-Backed Invoices
142K
17 Total FTEs
FTEs Allocated to PO Invoices Reduced 63%
FTEs Re-allocated to More Strategic Tasks
Payees
7,700
PO Suppliers
700
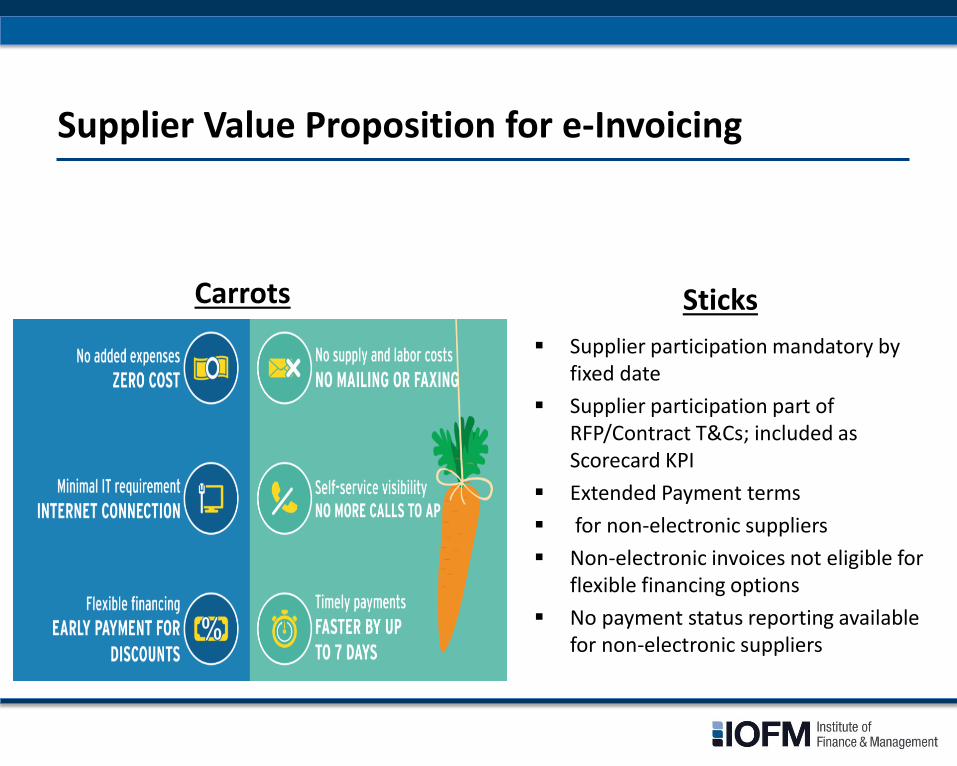
Supplier Value Proposition for e-Invoicing
Carrots
Supplier participation mandatory by fixed date
Supplier participation part of RFP/Contract T&Cs; included as Scorecard KPI
Extended Payment terms
for non-electronic suppliers
Non-electronic invoices not eligible for flexible financing options
No payment status reporting available for non-electronic suppliers
Sticks
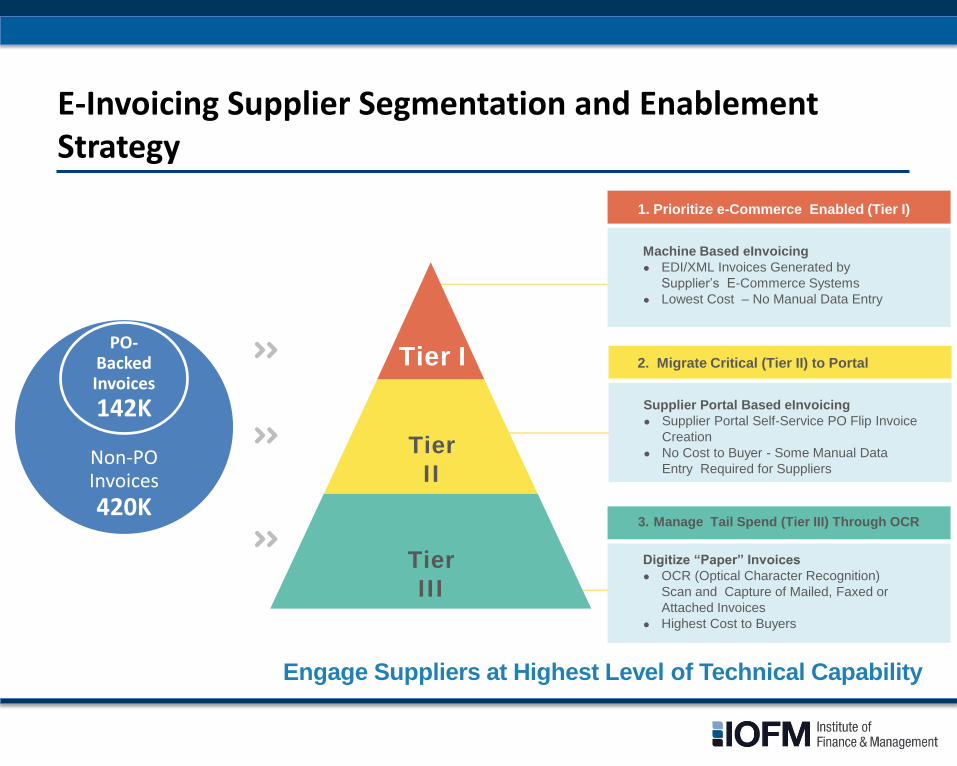
E-Invoicing Supplier Segmentation and Enablement Strategy
1. Prioritize e-Commerce Enabled (Tier I)
Machine Based eInvoicing
● EDI/XML Invoices Generated by
Supplier’s E-Commerce Systems
● Lowest Cost – No Manual Data Entry
2. Migrate Critical (Tier II) to Portal
Supplier Portal Based eInvoicing
● Supplier Portal Self-Service PO Flip Invoice
Creation
● No Cost to Buyer - Some Manual Data
Entry Required for Suppliers
3. Manage Tail Spend (Tier III) Through OCR
Digitize “Paper” Invoices
● OCR (Optical Character Recognition)
Scan and Capture of Mailed, Faxed or
Attached Invoices
● Highest Cost to Buyers
Tier
I I
Tier
I I I
Tier I
Engage Suppliers at Highest Level of Technical Capability
Non-PO Invoices
420K
PO-Backed Invoices
142K
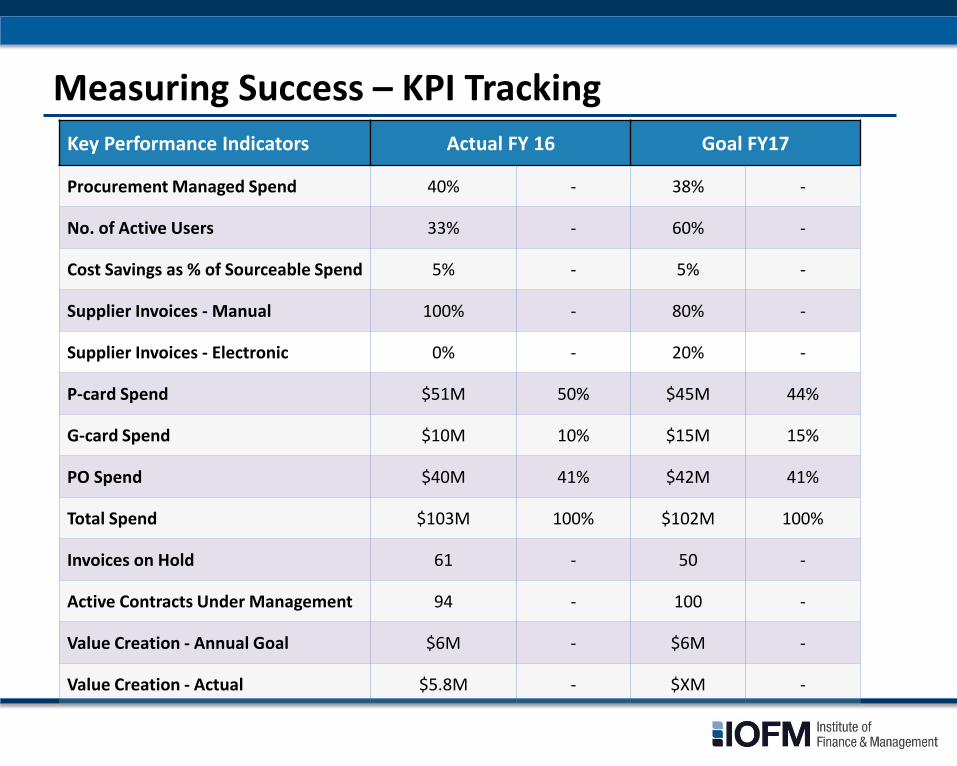
Measuring Success – KPI Tracking
Key Performance Indicators Actual FY 16 Goal FY17
Procurement Managed Spend 40% - 38% -
No. of Active Users 33% - 60% -
Cost Savings as % of Sourceable Spend 5% - 5% -
Supplier Invoices - Manual 100% - 80% -
Supplier Invoices - Electronic 0% - 20% -
P-card Spend $51M 50% $45M 44%
G-card Spend $10M 10% $15M 15%
PO Spend $40M 41% $42M 41%
Total Spend $103M 100% $102M 100%
Invoices on Hold 61 - 50 -
Active Contracts Under Management 94 - 100 -
Value Creation - Annual Goal $6M - $6M -
Value Creation - Actual $5.8M - $XM -