paving the critical path final japanjcop/h20/download_first_congress...supporting "free market...
TRANSCRIPT

© Pharsight Corporation All Rights ReservedReference ID or Date
Paving the Critical Path
Japanese Conference on Pharmacometrics
Tokyo, November 15, 2008Daniel Weiner, PhDChief Technical Officer and Sr. [email protected]
Utilization of Model Based Drug Development for Improving the
Efficiency of Clinical Drug Development

slide 2 © Pharsight Corporation All Rights Reserved
Agenda
•The Business Case for M&S – Status of the Pharmaceutical Industry
•FDA’s evolving view of M&S and the Critical Path
•What is Model Based Drug Development (MBDD)?
•Case Studies Illustrating the Value of MBDD in All Phases of Drug Development
•The Status of MBDD in the U.S., Japan, Korea and China
•The Future of MBDD in Drug Development

© Pharsight Corporation All Rights ReservedReference ID or Date
Status of the Pharmaceutical Industry

slide 4 © Pharsight Corporation All Rights Reserved
FDA White Paper“Innovation/Stagnation: Challenge and Opportunity on the Critical Path to New Medical Products”
Beginning in 2000, a slowdown in new drug and biologic submissions to regulatory agencies occurred worldwide, partially due to increasing costs and complexity of drug development
“The vast majority of drugs in clinical trials fail. A drug entering Phase I in 2000 has no better chance to reach market than one entering Phase I 15 years ago.”
“The main causes of failure in the clinic include safety problems and lack of effectiveness: inability to predict these failures beforehuman testing or early in clinical trials dramatically escalates costs.”
http://www.fda.gov/oc/initiatives/criticalpath/whitepaper.pdf

slide 5 © Pharsight Corporation All Rights Reserved
Presented at Kitasato-Harvard Conference, Sept. 2008

slide 6 © Pharsight Corporation All Rights Reserved
Only 17 New Drugs Were Approved by the FDA in 2006

slide 7 © Pharsight Corporation All Rights Reserved
Only 17 New Drugs Were Approved by the FDA in 2007
FDA caution, 'research drought' cuts drug approvals
• By Julie Schmit, USA TODAYFederal approvals of new drugs last year sank to the lowest in five years, a drop some industry analysts attribute to more cautious regulators and less innovation by drugmakers.
The Food and Drug Administration last year approved 17 new molecular entities —active ingredients that weren't marketed in the USA before.The FDA also approved 65 original new drug applications last year, the fewest since 1999, according to data from BioMed Tracker of Sagient Research Systems.Drug applications include new molecular entities as well as new formulations or new manufacturers of existing drugs. The FDA approved 64% of the applications it decided last year, down from 73% the year before, BioMed data show.
…Ira Loss of research firm Washington Analysis says the industry's "research drought" has led to weaker applications, thus fewer approvals. An explosion of drug discoveries started in the late 1980s, peaked in the mid-1990s, then "petered out."

slide 8 © Pharsight Corporation All Rights Reserved
Even for those drugs that were approved …
Only 3 out of 10 drugs produce revenues that match or exceed R&D costsa
Only about 1 out of every 5000 molecules gets approved. If you do the math, we should be targeting identification of and eliminating the “losers” as soon as possible! But most reward systems go the opposite way!
a) Source: PhRMA 2003 Industry Profile, March 2003

slide 9 © Pharsight Corporation All Rights Reserved
Top 5 layoffs of 2007
October 15, 2007
By Maureen Martino
2007 has been a rough year for a number of the pharmaceutical and biotech industry’s biggest players. Concerns about patent expirations, falling sales due to drug safety concerns, redundancy from acquisitions and a general need streamline operations contributed to these companies’ decisions to cut employees. Check out this list of the top five pharma and biotech layoffs of 2007 for more on the cuts and a look at what these companies are doing to turn things around.
1. Pfizer - 10,000 jobs
2. AstraZeneca - 7,600 jobs (another 550 also announced)
3. Bayer - 6,100 jobs
4. Johnson & Johnson - 5,000 jobs
5. Amgen - 2,600 jobs
6. GlaxoSmithKline - 5,000 jobs*
7. Bristol-Myers Squibb - 4,800 jobs*
8. Novartis - 3,750 jobs*
*Note: These job cut announcements occurred after the date this report was originally published. GSK
announced cuts on 10/25/07, BMS on 12/6/07 and Novartis on 12/13/07.
Many companies have announced additional layoffs in 2008.
The Increase in Drug Dev. Costs, Coupled with a Decline in Approvals is Impacting Industry

slide 10 © Pharsight Corporation All Rights Reserved
The Cost Cutting Continues …
Big Pharma Layoffs Mounting -- 26 More Plants to Close, an Industrial Info News Alert
Tuesday July 22, 8:26 am ET
SUGAR LAND, TX--(MARKET WIRE)--Jul 22, 2008 -- Reported by Annette Kreuger, Industrial Info Resources (Sugar Land, Texas)
Despite the fact that millions of people consume prescription drug products on a daily basis, a tsunami of job cuts continues to roll across the Pharmaceuticals Industry. A recent analysis of Industrial Info Resources' Pharmaceutical Tracker - Online Database reveals 26 North American plants and research facilities currently targeted for closure. Pharma giant Pfizer (PFE - News) (New York, New York) has announced layoffs in Michigan, and Schering-Plough (SGP - News) (Kenilworth, New Jersey) and Johnson & Johnson (JNJ - News) (New Brunswick) are both expected to shed jobs in New Jersey.
slide 11 © Pharsight Corporation All Rights Reserved
The Cost Cutting Continues … Pfizer
Pfizer retooling, pushing emerging market sales
Mon Sep 22, 4:54 PM ET
TRENTON, N.J. - . is dramatically stepping up sales efforts in emerging markets, overhauling U.S. business operations and slashing more costs ahead of the 2011 patent loss for cholesterol blockbuster Lipitor, its head of pharmaceutical operations said Monday. Ian Read, speaking at the 2008 in New York, told analysts and investors the company has reduced annual costs by $1.2 billion from 2006 levels and expects to meet its goal of cutting a total of $2 billion by year's end. Most of the remaining reductions will come in the fourth quarter, he said, possibly signaling more job cuts.
New York-based Pfizer faces a big hurdle in replacing its nearly $13 billion in annual revenue from Lipitor, the world's top-selling drug, which loses patent protection and will face generic competition in the United States starting in late 2011.

slide 12 © Pharsight Corporation All Rights Reserved
The Cost Cutting Continues … (Pfizer cont.)
FiercePharmaOctober 14, 2008
Hinting at layoffs, Pfizer extends severance
By Tracy Staton
One hint that Pfizer layoffs will only continue: The company extended its severance-package program, which was due to expire at year's end, through mid-2009, because the drugmaker couldn't treat new layoffs differently from those cut previously. And according to sources close to the action, those layoffs probably would include a large number of sales reps.
Meanwhile, Pfizer is also considering spinning off some of the research units that it put on the "eliminate" list two weeks ago, Pharmalot reports. Plus, the company might buy a "brand-name biotech." As you know, almost every time a biotech appears to be on theblock, Pfizer is rumored to be among the pharma firms kicking tires. Which target might actually prove out is a mystery, though the gossip says Pfizer might take another look at Biogen Idec.
A new round of job cuts would add to the 10,000 Pfizer announced in January 2007 as part of a major restructuring program that also included plant closures and research-center shutdowns.

slide 13 © Pharsight Corporation All Rights Reserved
Price Controls are on the Horizon …
FiercePharmaOctober 24, 2008
Obama plan could whack Big Pharma
By Tracy Staton
Big Pharma may have been buttering up the Democrats lately with big campaign contributions, but Barack Obama's healthcare plan looks primed to hit drugmakers. According to Boston Consulting Group, Obama's plan to let the feds negotiate Medicare drug prices could take a big bite out of industry revenues. A $10 billion to $30 billion bite, to be exact.
But, according to the Wall Street Journal Health Blog, that loss could be offset at least partly by the Democratic candidate's efforts to cut the number of uninsured people. If his plans come to fruition, more people will be able to afford prescription drugs to begin with.
On the other hand, Obama's move toward negotiated Medicare drug prices could start a domino effect, inspiring private insurers to demand price cuts, too.
John McCain doesn't mention whether he'd empower Medicare to negotiate drug prices. But he does favor saving money via re-importation of drugs. And of course he's on the record with his characterization of Big Pharma as "big bad guys."

slide 14 © Pharsight Corporation All Rights Reserved
The Cost Cutting Continues …GSK
Wednesday, October 1, 2008
The Wall Street Journal HEALTH
Glaxo Plans to Cut R&D Jobs
By JEANNE WHALEN
OCTOBER 1, 2008
Drug maker GlaxoSmithKline PLC Tuesday said it plans to cut as many as 850 jobs in research
and development in the U.S. and Britain, the latest cuts in an industry grappling with declining
profits and productivity.
The cuts, about 6% of total R&D staff, would come on top of the 350 R&D jobs Glaxo said it was
eliminating earlier this year, said Claire Brough, a spokeswoman for the Brentford, U.K.,
company…

slide 15 © Pharsight Corporation All Rights Reserved
Just Released
Merck to cut 7,200 jobs October 22, 2008
By Maureen Martino at FierceBiotech
Merck said today that it will cuts 7,200 jobs--more than 12 percent of its workforce--following the announcement of a 28 percent drop in Q3 earnings. The job cuts, which will include 6,800 active employees and 400 vacancies, will be made in all areas of the company. Forty percent of the cuts will be in the U.S. and 25 percent will be senior and mid-level execs. Back in 2005, Merck cut 10,400 positions; these new cuts come in addition to that, and are expected to be completed by 2011.

slide 16 © Pharsight Corporation All Rights Reserved
Profitability Issues Plague Non-U.S. Companies as Well
Japan's biggest pharmaceutical companies report net-profit declines.
The Wall Street Journal (8/1, Shimamura) reports that Daiichi Sankyo, Eisai, and Takeda Pharmaceutical, "three of Japan's biggest pharmaceutical companies, reported net-profit declines for the April-June quarter, as they sought new sources of profits through major acquisitions and drug research."

slide 17 © Pharsight Corporation All Rights Reserved
Many Pharma’s are investing more in Biotech drugs. Likely a necessary strategy but will result in
even more layoffs.

slide 18 © Pharsight Corporation All Rights Reserved
Eventually There Will Be Price Controls in the U.S.
Total annual healthcare spending in the United States topped the $2 trillion mark in 2005, according to Center for
Medicare and Medicaid Services (CMS), and is
projected to exceed $3 trillion in 2011. That’s more
than the gross domestic product of every country in the world except the U.S., Germany, Japan, China and
Great Britain
Price controls on prescription drugs in the U.S. will put
pressure on Pharma profits
Life Science Trends ‘08
Carlyle & Conlan (C) Copyright (1-08) All Rights Reserved

slide 19 © Pharsight Corporation All Rights Reserved
The Battle Has Started
Today's Top Stories (Nov. 15, 2008)
1. PhRMA poised to fight Obama plans
By Tracy Staton at FierceBiotech
Look out, Barack Obama. Big Pharma is preparing to launch its first blitz against your healthcare plans.
The country's biggest pharma lobbying group--PhRMA--is readying a major public relations campaign supporting "free market health care." The multimillion-dollar campaign includes national television advertising, scheduled to air for the first time next week. It's all designed to head off President-elect Obama's expected campaign for Medicare to negotiate prices for drugs used by its beneficiaries.
Lots of companies stand to lose if the new administration really does reform healthcare. But drugmakersmay be closest to the line of fire. According to the Washington Times, pharma could see a $30 billion reduction in revenues if the government starts to negotiate drug prices as many other countries do.
PhRMA's push won't directly attack Obama's plans; with such a popular president-elect, such an attack could backfire. Instead, the association's ads will take a more oblique approach: "We're going to do an ad campaign designed to make people aware of the importance of preserving your free-market health care system," PhRMA's Ken Johnson told the Times. Coming soon to a TV screen near you.
- read the Washington Times article

slide 20 © Pharsight Corporation All Rights Reserved
Pharma Focus is Changing
Pharmecutical R&D Experiencing Fundamental Shift
by: Research Recap posted on: May 13, 2008
Big Pharma’s failure to develop enough new blockbuster drugs is combining with other forces to drive fundamental changes in pharmaceutical research and
development, according to Deloitte. Chief among these will be the emergence of “NewPharmaCos” concentrating on genotyped market
segments. The companies may be startups or spinoffs of existing pharmacompanies, Deloitte says in a new report The Changing Face of R&D in the
Future Pharmaceutical Landscape.
According to the report, current R&D programs focused on developing a small portfolio of high revenue blockbusters will evolve to R&D programs focused on high efficacy treatments developed for smaller patient populations based on specific genotypes. Such treatments, and their higher demonstrated efficacy,
may ultimately have the potential for higher per treatment revenues.

slide 21 © Pharsight Corporation All Rights Reserved
The Lack of Consistent Success is Adversely Affecting Drug Prices
Pharmaceutical Index (^DRG)
This capitalization-weighted index is designed to represent a cross-section of widely held, highly capitalized companies involved in
various phases of the pharmaceutical industry.

slide 22 © Pharsight Corporation All Rights Reserved
Two Cases in Point Pfizer and Merck
-27%
-43%

slide 23 © Pharsight Corporation All Rights Reserved
Unless the Industry Changes, Things are Just Going to get Worse
Big Pharma Faces Grim Prognosis
Industry Fails to FindNew Drugs to ReplaceWonders Like Lipitor
By BARBARA MARTINEZ and JACOB GOLDSTEINDecember 6, 2007; Page A1
Over the next few years, the pharmaceutical business will hit a wall.
Some of the top-selling drugs in industry history will become history as patent protections expire, allowing generics to rush in at much-lower prices. Generic competition is expected to wipe $67 billion from top companies' annual U.S. sales between 2007 and 2012 as more than three dozen drugs lose patent protection. That is roughly half of the companies' combined 2007 U.S. sales.
Starting in 2010, the pharmaceutical industry faces one of the biggest waves of patent expirations.
At the same time, the industry's science engine has stalled. The century-old approach of finding chemicals to treat diseases is producing fewer and fewer drugs. Especially lacking are new
blockbusters to replace old ones like Lipitor, Plavix and Zyprexa.
The coming sales decline may signal the end of a once-revered way of doing business. "I think the industry is doomed if we don't change," says Sidney Taurel, chairman of Eli Lilly & Co. Just yesterday, Bristol-Myers Squibb Co. announced plans to cut 10% of its work
force, or about 4,300 jobs, and close or sell about half of its 27 manufacturing plants by 2010.
Ref: The Wall Street Journal Online, Dec. 6, 2007

slide 24 © Pharsight Corporation All Rights Reserved
FDA Is Also Getting Tougher on Safety Issues – At a Minimum This Will Delay Approval Times

slide 25 © Pharsight Corporation All Rights Reserved
Pharmaceutical R&D Experiencing Fundamental Shiftby: Research Recap posted on: May 13, 2008
Discusses Deloitte report: The Changing Face of R&D in the Future Pharmaceutical Landscape.
…
In a classic Catch-22 situation, the more effective companies were at developing such mass market blockbusters, the more effective they needed to be in developing even larger revenue replacements, as patents on existing products expired and markets were lost to generics.
…
Technological advances are increasingly providing companies the opportunity to link treatments and efficacy to genetically homogeneous patient groups.
While typical blockbuster efficacy rates range from 35 - 75 percent, genotyped market segments and biomarker-assessed responses promise treatments with significantly higher efficacy rates, possibly approaching 100 percent.

© Pharsight Corporation All Rights ReservedReference ID or Date
FDA’s evolving view of M&S and the Critical Path

slide 27 © Pharsight Corporation All Rights Reserved
FDA View of M&S
“Clinical trial simulation—using in silico modeling—can predict efficient designs for development programs that reduce the number of trials and patients, improve decisions on dosing, and increase informativeness.”3
“In most cases, however, it is important to develop information on population exposure-response relationships… and whether exposure can be adjusted for various subsets of the population.”4
“Exposure-response data thus can add to the weight of evidence of an acceptable risk/benefit relationship and support approval.”4
3FDA Critical Path Initiative, page L-124FDA Guidance for Industry Exposure-Response Relationships

slide 28 © Pharsight Corporation All Rights Reserved
FDA is Struggling to Fund the Critical Path Initiative
The Subcommittee concluded that science at the FDA is in a precarious position: the Agency suffers from serious scientific deficiencies and is not positioned to meet current or emerging regulatory responsibilities.
1.2 Major Findings
The Subcommittee found substantial weaknesses across the Agency, with the possible exception of some drug and medical device review functions funded by industry user fees. There are several areas of greatest concern, however, which form the basis for this report’s most significant findings.
1.2.1 The FDA cannot fulfill its mission because its scientific base has eroded and its scientific organizational structure is weak.

slide 29 © Pharsight Corporation All Rights Reserved
FDA Amendments Act of 2007
On September 27, President George W. Bush signed into law H.R. 3580, the Food and Drug Administration Amendments Act of 2007, with (from left to right) HHS Secretary Michael Leavitt, FDA Commissioner Andrew von Eschenbach, and Rep. Joe Barton of Texas in the Oval Office. This new law represents a very significant addition to FDA authority. Among the many components of the law, the Prescription Drug User Fee Act (PDUFA) and the Medical Device User Fee and Modernization Act (MDUFMA) have been reauthorized and expanded. These programs will ensure that FDA staff have the additional resources needed to conduct the complex and comprehensive reviews necessary to new drugs and devices.
Two other important laws were reauthorized: the Best Pharmaceuticals for Children Act (BPCA) and the Pediatric Research Equity Act (PREA). Both of these are designed to encourage more research into, and more development of, treatments for children.
Overall, this new law will provide significant benefits for those who develop medical products, and for those who use them.

slide 30 © Pharsight Corporation All Rights Reserved
FDA hires 1,300 new doctors and scientists Thu Sep 11, 4:14 PM ET
Thu Sep 11, 4:14 PM ET
WASHINGTON - The said Thursday it has hired more than 1,300 professional staffers in a move that officials hope will help the beleaguered agency better protect the public health amid rapid technological and scientific change. "Every pay period, we have had more than 100 people walking through our doors," said Kimberly Holden, the directing the special recruitment initiative. "We have had some people who left to go into industry and ended up wanting to come back. The swings this way every once in a while."
The staffing drive, launched just five months ago, will result in an estimated 10 percent increase in the FDA's work force. Holden said the new hires will provide critical expertise after years of losing valuable medical and scientific people who took industry jobs or went into retirement. The exodus came as the agency struggled to cope with a string of drug and that damaged its reputation…
The FDA's budget is about $2.2 billion a year, with some $1.7 billion coming from taxpayers and the rest from industry user fees…

© Pharsight Corporation All Rights ReservedReference ID or Date
Newer FDA Initiatives
Ref: Bob Powell, Presentation to Mario Negri Institute, June 13, 2008, and Presentation at Duke University, June 23, 2008 (used with permission)
slide 32 © Pharsight Corporation All Rights Reserved
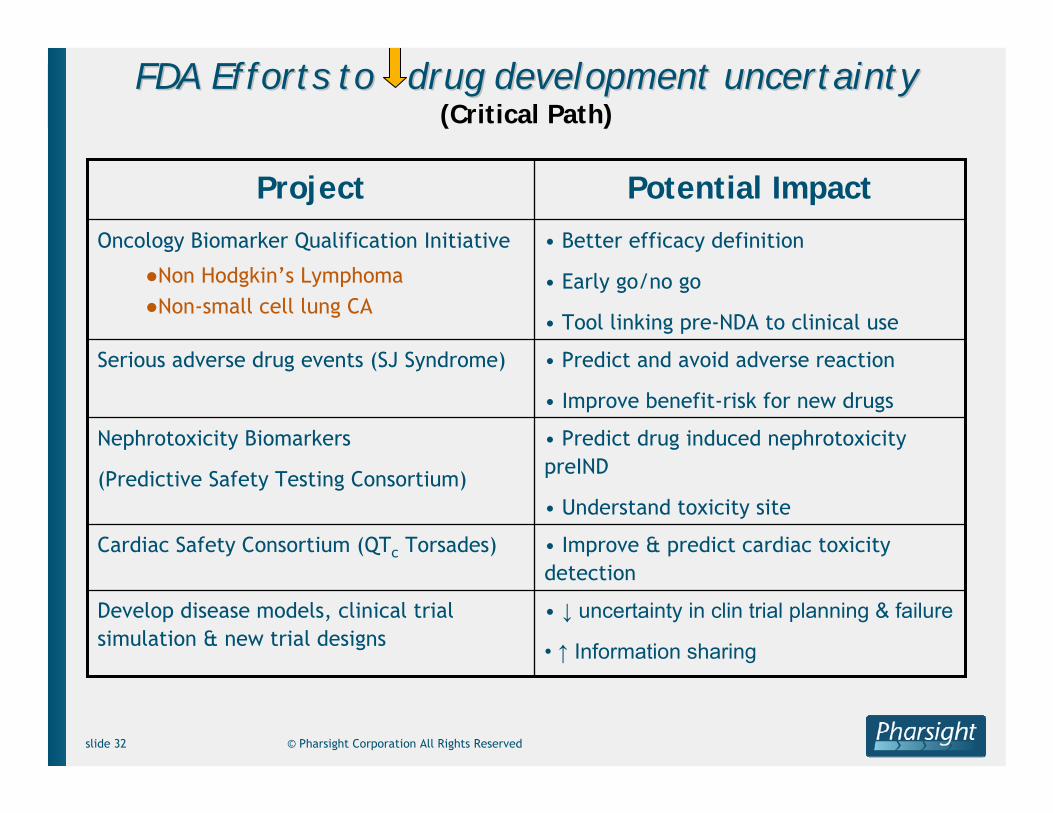
FDA Efforts to drug development uncertaintyFDA Efforts to drug development uncertainty(Critical Path)
• Improve & predict cardiac toxicity detection
Cardiac Safety Consortium (QTc Torsades)
• ↓ uncertainty in clin trial planning & failure
• ↑ Information sharing
Develop disease models, clinical trial simulation & new trial designs
• Predict drug induced nephrotoxicitypreIND
• Understand toxicity site
Nephrotoxicity Biomarkers
(Predictive Safety Testing Consortium)
• Predict and avoid adverse reaction
• Improve benefit-risk for new drugs
Serious adverse drug events (SJ Syndrome)
• Better efficacy definition
• Early go/no go
• Tool linking pre-NDA to clinical use
Oncology Biomarker Qualification Initiative
●Non Hodgkin’s Lymphoma●Non-small cell lung CA
Potential ImpactProject

slide 33 © Pharsight Corporation All Rights Reserved
NephrotoxicityNephrotoxicity BiomarkersBiomarkers
Current markers inadequate (e.g., creatinine)● Delayed detection● Not specific to damage location● Not mechanistic
New biomarkers available● Preclinical to clinical development evolution● Gain mechanistic knowledge● May demonstrate species differences● Detect toxicity earlier

slide 34 © Pharsight Corporation All Rights Reserved
Disease ModelsDisease Models(trial design & endpoints)(trial design & endpoints)
Objectives● Use prior data plus statistical analysis & simulation to solve
regulatory problems● Share solution + models of prior data publicly
Collaboration: Clinical (OND), Biostatistics (OB), OCPProjects● Parkinson’s disease: trial design to detect disease progression
change http://www.fda.gov/ohrms/dockets/ac/cder06.html#PharmScience
• Critical to understand disease/baseline characteristics, diseaseprogression, placebo/drug effects, and statistical issues (Missing data, etc)
● Non-small cell lung cancer: predictive value in 2D imaging for disease progression-8 NDAs
● Alzheimer’s Disease: trial design to detect disease progression change. Funding by AAPS
● …..

slide 35 © Pharsight Corporation All Rights Reserved
Computing Platform (Large storage, Fast network, Fast Processors)
Scientific Computing Support Services including Collaboration
• Critical Path success
• ↑ Development efficiency-productivity
• ↑ Communication clarity to patients
• Janus implementation
• Targeted exploratory analysis
• Modeling & simulation driven trial design
• New tool qualification
Regulatory Science Research
• Biomarker qualification
• Approval endpoints
• Clinical trial design
• Benefit-Risk patient communication tools
• ↑ Productivity-Quality
• ↓ Time-resource
• Move resource to other ↑ priority topics
• Janus implementation
• Best practice → Tools
● Efficacy-Safety● Risk-Benefit
Regulatory Decisions
• ↑ Speed, Quality
• ↑ Protect public health
• ↑ Confidence
●Inside●Outside
• Automated information mgmt (LIMS, Janus)
• Safety signal detection tools
• Best practice → Tools
Health Crisis
(Melamine, Vioxx)
Anticipated ImpactMeans to AddressChallenges/Mandate
FDAPlanned FDA IT Initiatives

slide 36 © Pharsight Corporation All Rights Reserved
Quantitative Benefit-Risk Path
Current State
Future State
Path Foundations
• Personalized Medicine
• Implement FDAAA changes
• Implement FDA modern bioinformatics tools
• Expand worked examples of various tools (FDA, industry, academics) over life-cycle…e.g.,
• Patient stated preference
• Decision analysis
• Establish routine public communication venues including regulatory applications
FDAAA is the FDA Amendments Act of 2007

slide 37 © Pharsight Corporation All Rights Reserved
Presented at Kitasato-Harvard Conference, Sept. 2008

slide 38 © Pharsight Corporation All Rights Reserved
Presented at Kitasato-Harvard Conference, Sept. 2008

slide 39 © Pharsight Corporation All Rights Reserved
Presented at Kitasato-Harvard Conference, Sept. 2008

slide 40 © Pharsight Corporation All Rights Reserved
These Models are Available to the Public
Pharsight Uses FDA Disease Model to Support Oncology Drug Development
Use of FDA Model in Non-Small Cell Lung Cancer Expected to Inform
Quantitative Predictions for Experimental Cancer Treatment
MOUNTAIN VIEW, Calif., November 20, 2007 – Pharsight Corporation (OTC BulletinBoard: PHRS), a leading provider of software, strategic
consulting, and regulatory services for optimizing clinical drugdevelopment, today announced that its Strategic Consulting Services
Group is using a quantitative disease model developed by the Food and Drug Administration (FDA) for non-small cell lung cancer (NSCLC) to
support an oncology drug.
…

© Pharsight Corporation All Rights ReservedReference ID or Date
What is Model Based Drug Development (MBDD)?
Daniel Weiner, PhDChief Technical Officer and Sr. [email protected]

slide 42 © Pharsight Corporation All Rights Reserved
A Distribution of Trial Outcomes is Associated With Every Protocol
Our Dilemma is That We Only Observe One of the Possible Outcomes
How do we deal with this? By building a virtual model of the trial and simulating the range of outcomes!
Range of possible outcomes

slide 43 © Pharsight Corporation All Rights Reserved
Model Based Drug Development
FDA’s characterization: the development and application of pharmaco-statistical models of drug efficacy and safety from preclinical and available clinical data to improve drug development knowledge management and decision making.
If implemented, this facilitates the ability to base important decisions on quantitative inputs.

slide 44 © Pharsight Corporation All Rights Reserved
A Comment …
There have been many presentations, publications, etc., showing examples of building models in various stages of drug development and calling that MBDD. But in my humble opinion that is just that, building models.
Model based drug development is a process whereby you establish decisions that need to be made and the criteria for making them.
The modeling and simulation that you do are inputs to the decision making process, and should only be done in as complex a manner as needed to support the decisions that need to be made.

slide 45 © Pharsight Corporation All Rights Reserved
The Model Based Drug Development Process
Establish decision criteria (at least identify the key decision-drivers).
Models only need to be as complex as needed to make a decision
Leverage prior knowledge from all available sources (more on this in the next lecture)● Data on the NCE of interest
• Preclinical, Phase I safety & biomarkers, clinical safety & efficacy …
● Knowledge about the target disease & affected physiologic systems
● Knowledge/data on related compounds• From proprietary or public sources• Analogs or competitors

slide 46 © Pharsight Corporation All Rights Reserved
The Model Based Drug Development Process (cont.)
Build models for all responses key to strategic decisions based on that knowledge● Disease progression
● Drug models for the drug of interest and related or potentially competing drugs
• Efficacy-related outcomes• Safety-related outcomes
● On-trial behavior, e.g., dropouts and compliance
● Market and financial models
● It is possible that you may be able to show a drug is safe and effective, yet it’s profile (expected label) or resulting market are such that it will have a poor return on investment

slide 47 © Pharsight Corporation All Rights Reserved
Some General Comments on Models
Models can be empirical or mechanistic. We will consider several examples
Models are dynamic and not static.
● They should evolve as more data and knowledge is available. ● As such, repositories are need to support them.
The “Real” value of models is not their application to data at hand; rather it is their ability to be used to predict future outcomes along with some measure of uncertainty

slide 48 © Pharsight Corporation All Rights Reserved
Models Provide a Rational Framework for Integration and Organization of Disparate Compound/Biologic Knowledge
Understanding and embracing uncertainty is key to quantitative decision making and effective risk management.
Model Based Drug Development
● Is an integrated, data-driven, model-supported decision-making methodology
● Integrates all relevant public and proprietary data spanning:• discovery to clinical• in-house data to competitors’ information• healthy volunteers to patients
● Involves building probabilistic model(s) of the compound’s attributes and product profile in the context of a competitive landscape
● Simulates development scenarios of interest

slide 49 © Pharsight Corporation All Rights Reserved
To Simulate Development Scenarios of Interest a Number of Sub-Models are Developed and Integrated
Sub-models differ in focus, mechanistic-depth, required disciplinary expertise, the quantity and quality of data they are developed from, and the extent to which they serve to summarize proprietary client data
• Preclinical data• Early-phase trial results• Late phase results• In-house experts• Public information
InformationSources
Pharmaco-kinetics
Pharmaco-therapeutics
ClinicalEvents
Efficacy & Tolerability Endpoints
Pharmaco-dynamics
FinancialValue
MarketEconomics
DosingRegimens Exposures
1 or more drugs
ClinicalProfile
Companies often stop here

slide 50 © Pharsight Corporation All Rights Reserved
Sample Model Types
Pharmacokinetic (PK)
Pharmacodynamic (PD) and (PK / PD)
Compliance
Patient demographics
Sampling time and dosing time deviations
Between and within subject variability
Site to site variability
Disease progression
Other …
Now for more detail about how MBDD works

slide 51 © Pharsight Corporation All Rights Reserved
MBDD is a Systematic and Accountable Process
Modeling Steps● Define your next drug development decisions in terms of program value.● Explore all the proprietary data you have that is relevant to your decisions.● Augment your proprietary data with all relevant public data. ● Build a mathematical, quantitative model of the complete state of knowledge
relevant to your decision based upon the full data set.● Qualify the model against your data in order that it provides you with an well
defined description of each assumption made in building your model.
Simulation Steps● Simulate outcomes resulting from various possible decision scenarios using the
final model.● Predict the outcome of any relevant decision scenarios and quantify the most
likely result.
Leverage the above in such a way that all decisions are based onquantitative inputs.

slide 52 © Pharsight Corporation All Rights Reserved
MBDD focuses on therapeutic and commercial value
Every development decision is ultimately a decision about value. The overriding question is always, “how best to spend development budget and time to get regulatory approval for the most valuable label possible?”
The Value Function:
To maximize value and reduce risk should we
• Proceed to the next phase of development ?• Stop development altogether ?• Continue to gather data in the current phase ?
To maximize value and reduce risk should we
• Proceed to the next phase of development ?• Stop development altogether ?• Continue to gather data in the current phase ?
Program Value =- Development Costs
- Time to Market Costs
+ Value of Approved Label
The Decision:

slide 53 © Pharsight Corporation All Rights Reserved
MBDD Should Employ an Iterative Learn-Confirm1Approach
Learn-Confirm is the context in which MBDD predicts whether program value will be maximized by proceeding to the next phase, cancelling the program or gathering more data in the current phase and then re-analyzing.
Learn
Decision• Proceed to Next Phase ? • Stop Development ?• Continue Current Phase ?
Decision• Proceed to Next Phase ? • Stop Development ?• Continue Current Phase ?
If prediction looks like this, Continue Current Phase or Accept Risk and Proceed
Confirm Learn Confirm
Phase I
Use MBDD to predict response & compare to Standard of Care
1Sheiner LB, "Learning VS Confirming in Clinical Drug Development," Clin. Pharmacol. Ther. 1997, 61:275-291.
Phase IIa Phase IIb Phase III
If prediction looks like this, Stop Development
Not Competitive
Response at Given Dose
Competitive If prediction looks like this, Proceed to Next Phase
Standard of Care

slide 54 © Pharsight Corporation All Rights Reserved
Workflow for CATD learn/Confirm Cycle
Model
Capture
SimulateLikelihood of Success?Optimize
ClinicalTrial
Collect data
TherapeuticKnowledge
STOP
Meta-Database data and Prior Knowledge
No
Yes

slide 55 © Pharsight Corporation All Rights Reserved
Learn and confirm in non-clinical researchPreclinical - learning
Modeling and Simulation TasksQuestions?Objectives
Predict human efficacy
Predict human clearance using IV/IV data
Assess margin of safety from target efficacy concentration & exposure data
from tox studies
Integrate clearance, potency, bioavailability for human dose projection
Design animal PK/PD experiments, analyze data
Understand MOA
Identify lead candidate based on desired attributes
Evaluation of biomarkers relative to decision criteria
Dose range in early clinical trialsAccrue tox data to support human dosing
Guide development strategy with integrated decision criteria
Safety/efficacy characteristics in animal models
Demonstrate activity in animal models

slide 56 © Pharsight Corporation All Rights Reserved
Learn and confirm in clinical researchPhase 1 - learning
Modeling and Simulation Tasks
Questions?Objectives
Assess parameters in target and sub-populations
Assess dose-concentration-response curve
Quantify variability in PK and PDPD effects in FIM studies
Simulate exposure and response for intended dosing regimens
Linear and/or predictable PK in humans
Collect initial PD data (if possible) and assess PK/PD attributes
Develop or update PK/PD modelsMTDAssess MTD

slide 57 © Pharsight Corporation All Rights Reserved
Learn and confirm in clinical researchPhase 2A (PoC) - confirming
Modeling and Simulation Tasks
Questions?Objectives
Develop drug/disease model to understand time-course of
disease progression and dose-response to interventions
Attributes of drug in target population compared to
existing therapy
Demonstrate efficacy in the intended population

slide 58 © Pharsight Corporation All Rights Reserved
Learn and confirm in clinical researchPhase 2B - learning
Modeling and Simulation Tasks
Questions?Objectives
Assess efficacy/toxicity profile of drug vs. comparators
Validate Pop PK/PD model
Assess impact of covariates using Pop PK/PD model
Analyze dose-exposure-response data using a model based approach
Assess probability of success for a candidate study designs
Use simulations/optimization tools to design dosing and sampling schemes
Critical aspects reflecting value of PoC vs. larger Phase II (duration, sample
collection schedule, biomarkers). Do we have adequate information to terminate
development or continue to the next phase?
Establish doses to be further evaluated in Phase III
Simulate outcomes based on design and variables
Trial design to unequivocally demonstrate efficacy in target population (dose
range/frequency)
Identify optimal use in target population

slide 59 © Pharsight Corporation All Rights Reserved
Learn and confirm in clinical researchPhase 3 - confirming
Modeling and Simulation Tasks
Questions?Objectives
Assess need for dose adjustment in special populations
Confirm dose/exposure response-relationship in target/sub
populations
Do we have adequate information to decide whether to file, collect
addition data, or terminate?
Assess impact of covariatesDose change in a sub or special population (degree of change)?
Validate PopPK/PD modelDo the intended doses (and
regimen) demonstrate safety and efficacy in the target population?
Demonstrate safety and efficacy

slide 60 © Pharsight Corporation All Rights Reserved
Pre-Clinical Data
Safety Trial
PK-PD Example: A model summarizes the current state of knowledge
In this example, the team wants to answer the question, “do I have a competitive dose? “
In the modeling step, scientists model the dose-response of the compound and its competitors by combining proprietary data about the compound with public information such as scientific reports and competitor labels to produce an aggregate data set. Next, proven MBDD methods are used to fit a mathematical expression—a model—to the data and then quantify the quality of the fit.
Latest Phase II Trial
Scientific Literature
CompetitorLabelInformation
Model Assumptions
1.
2.
3.
Dose
Resp
onse
Previous Phase II Trial
The model summarizes and quantifies what is known.The model assumptions detail what is not known.
The model summarizes and quantifies what is known.The model assumptions detail what is not known.
+C = (D/V)(Ae-αt + Be -βt)
PK-PD Model
E(= E0 + (Emax- E0) • C
C+ EC50

slide 61 © Pharsight Corporation All Rights Reserved
PK-PD Example: Simulations produce predictions of performance (plus uncertainty)
In the simulation step, the predicted response for various doses is extracted from the model and compared to the standard of care.
This is done by Monte Carlo simulation: applying different decision scenarios to the model over and over again. The outcomes from the simulation replicates are analyzed to predict the most likely result. These predictions represent new information, derived from all the existing data, that the team can use to decide whether and how to proceed with this drug program.
Model Assumptions
1.
2.
3.
Simulation Step
The model predicts that, given the scenario inputs and the assumptions, there is a competitive dose. The team can decide to confirm this prediction, that is, test the assumptions, in the next development phase.
The model predicts that, given the scenario inputs and the assumptions, there is a competitive dose. The team can decide to confirm this prediction, that is, test the assumptions, in the next development phase.
Response at Given Dose
Not Competitive
CompetitiveDecision Scenario Inputs• Dose• Population• Competitor
Prediction:
+
Standard of Care
C = (D/V)(Ae-αt + Be-βt)
PK-PD Model
E(t) = E0+ (Emax- E0) • C
C + EC50

slide 62 © Pharsight Corporation All Rights Reserved
Models can be built to support any type of decision By integrating different kinds of data, scientists can use MBDD methods to produce quantified predictions for any drug development decision, in any regulatory phase.
• PK-PD Models
• Disease Models
• Compliance Models
• Drop-out Models
Different Kinds of Models
• Trial Models
• Competitor Models
• Commercial Models
• Portfolio Models
Clinical Trial Data
CompetitorLabelInformation
Marketing Study
Portfolio Data
CorporateFinancials
Scientific Literature
Is there a clinical trial design that will show PoC and find the best dose?
Is it worth developing a new dosage form?
Should we continue this development program?
What is the optimal patient population for this drug?
What is an optimal regulatory strategy?
Note the focus is on leveraging
To optimize decisions regarding

slide 63 © Pharsight Corporation All Rights Reserved
MBDD applies across the regulatory timeline
Preclinical Phases I/IIa Phase IIb Phases III/IV
Is there a clinical trial design that will show PoC and find the best dose?
Is it worth developing a new dosage form?
Should we continue this development program?
What is the optimal patient population for this drug?
Which indication should we go into first to maximize the value of the program?
Is this treatment likely to be as good as the competition?
Should we in-license this compound?
What candidate should we take forward to human clinical trials?
What is the probable clinical dose-response in humans?
What’s the best dose and schedule?
What dose provides the best benefit/risk profile?
What is an optimal regulatory strategy?
What are additional indications?
What are the most important attributes of a 2nd generation compound?
time
How do we demonstrate efficacy?
Have we demonstrated improved benefit/risk compared to standard of care?
Sample questions by phase of development.

slide 64 © Pharsight Corporation All Rights Reserved
FDA Assessment of Potential value of MBDD by phase
Used with permission from a presentation by Dr. Bob Powell

© Pharsight Corporation All Rights ReservedReference ID or Date
Case Studies Illustrating the Value of MBDD

slide 66 © Pharsight Corporation All Rights Reserved
Pre-clinical (In-vitro → in-vivo)
● Dose selection for First-in-Humans (FIH) study
Early Development
● Concentration-QT modeling in early development
Late-Stage Development
● Model-based NCE profile assessment versus competing therapies
Post Approval
● Model-based pediatric dose selection for an approved biologic
Case Examples Across All Phases of Drug Development

slide 67 © Pharsight Corporation All Rights Reserved
Rationale for Investing in FIM Dose Calculation Methodologies
Investing in approaches that offer relatively small improvements in prediction of human NCE attributes from preclinical/translational data offers relatively large returns● “10% preclinical prediction improvement has the capacity to save $100
million per drug” (Expert Opin. Drug Saf., 2007. 6(2), pp217-224)
Regulatory climate is shifting towards increased focus on safety issues● TGN1412 and other experiences● New Guidance documents focused on safety
FIH calculations of likely efficacious dose has implications for the manufacturing “cost of goods”
Wagg JK. Update on Quantitative Approaches for Predicting First-in-Man (FIM) Dosing Regimens. Pharsight European Modeling and Simulation Seminar. May 30, 2008. Paris, France.

slide 68 © Pharsight Corporation All Rights Reserved
Overview of Methodologies
1. Allometric scaling of doses (FIH start & end doses)
2. Build PK/PD models, scale parameters to humans and simulate range of likely phase I/II/III outcomes for trial designs of interest (initial estimate of clinical profile, inform trial designs, some times FIH start doses)
3. Build semi-physiological PK/PD models, scale parameters to humans and simulate range of likely phase I/II/III outcomes for trial designs of interest (initial estimate of clinical profile, inform trial designs, some times FIH start doses)
Approaches 2 and 3 allow critical evaluation of different trial design options including adaptive trial designs and represent examples of the broader discipline of Model Based Drug Development (MBDD)

slide 69 © Pharsight Corporation All Rights Reserved
Sample Allometric Scaling Model
Allometric Prediction of Human Systemic Clearance of Xenobiotics from Animal and Human Data
In(Typical Species Body Weight)
In(C
lear
ance
, vol
/tim
e)
++
++
+
+
Expected Human Clearance
A Potential realization of Human Clearance
Source: [Hu and Hayton, AAPS PharmSci 2001; 3(4) article 29].

slide 70 © Pharsight Corporation All Rights Reserved
Alternative Physiological Recirculatory Model
Moriwaki, T., Yasui, H., and Yamamoto, A. A RecirculatoryModel with Enterohepatic Circulation by Measuring Portal and Systemic Blood Concentration Difference, J Pharmacokin PharmacodynV30(2), Apr 2003.
Sample Physiological Model

slide 71 © Pharsight Corporation All Rights Reserved
Synthesis kout · R
R
Warfarin
Res
pons
e
Time
Slope = -kout
Inhibitionby
warfarinR = Prothrombin complex
activity (PCA)
Sample Semi-Physiological Model
Vitamin Kepoxide
ReducedVitamin K
Vitamin KVitamin Kreductase
Vitamin K epoxidereductase
Warfarin
Prothrombin complexprecursors
Prothrombin complex (R)VII, IX, X, protein C, S
γ-Glutenyldecarboxylase

slide 72 © Pharsight Corporation All Rights Reserved
Allometric scaling was used to predict human pharmacokinetics.
Preclinical PK/PD data from cynomolgous monkey, relative potencyinformation and literature data was used for simulation.
A range of doses (30-fold), regimens (QD and BID) and bioavailability fractions (5 to 50%) were used in simulations to project human PK vs. response profiles. The combination of dose and bioavailability ranges was chosen to compensate for any misspecification due to projection method or underlying assumptions.
Target therapeutic range was determined using publicly availableliterature for three comparators.
Example: How can preclinical data be used to support dose selection for a FIM study?
Kastrissios H. Communicating the Value of Pharmacodynamic Modeling in Drug Development. Presented at: Association of Regulatory and Clinical Scientists(ARCS) 17th Annual Congress; May 28-30, 2008; Sydney, Australia

slide 73 © Pharsight Corporation All Rights Reserved
Comparisons across regimens and drugs showed a favorable predicted response
0
20
40
60
80
0 100 200 300
Multiple BID
0 100 200 300
Multiple QD
Dose (mg/day)
%Ti
me
in T
h. W
indo
w

slide 74 © Pharsight Corporation All Rights Reserved
The response was comparable to competitorsA
dvse
rse
Eve
nt P
roba
bilit
y (%
)
0
20
40
60
80
100
A1 A2 A3 A4 A5 A6 0 B1 B2 B3 N1 N2 N3
Drug A Dose Drug B Dose NCE Dose(mg/day) (mg/day) (mg/day)
QD regimenBID regimenDrug C
Human projections for the NCE of interest identified a dose which provided a similar safety profile to that of comparators.

slide 75 © Pharsight Corporation All Rights Reserved
Pre-clinical (In-vitro → in-vivo)
● Dose selection for First-in-Humans (FIH) study
Early Development
● Concentration-QT modeling in early development
Late-Stage Development
● Model-based NCE profile assessment versus competing therapies
Post Approval
● Model-based pediatric dose selection for an approved biologic
Case Examples Across All Phases of Drug Development

slide 76 © Pharsight Corporation All Rights Reserved
C-QT modeling is a valuable tool early in clinical development prior to conduct of a TQT study
Early studies (SAD and MAD) provide a chance to develop a C-QT model and inform critical development decision-making.● Identify drugs with “no-go” levels of QT prolongation faster. ● Better calculate risk-benefit and clinical window (viable dose range)● Determine when and how (or if) a TQT should be performed (only run TQT for
compounds entering later stages of development)
For situations where a TQT cannot be performed (such as oncology), pooled analysis of early studies is critical to understanding QT risk.
To enable valid modeling and prediction, these studies should bedesigned with the QT analysis in mind. (Not a large burden)

slide 77 © Pharsight Corporation All Rights Reserved
C-QT model building in early development is slightly different from what is typically done in the TQT setting
Model unadjusted QTc, not delta or delta-delta QTc.● Basing the model on “whole” QTc avoids any “regression to mean” bias.● It is important to understand the differences in baselines across
populations.● Absolute QTc is also of interest in determining pro-arrhythmic risk.
Use predicted concentrations as opposed to observed● Linked to the population pharmacokinetic model.● Clarifies how population characteristics contribute to variability in
exposure separately from variability in exposure-response.● Using predicted concentrations avoids undue influence of outliers from
measurement error.
May also include time of day directly in the model.

slide 78 © Pharsight Corporation All Rights Reserved
As circadian rhythm is present in QTc, it is important to model time of day (often using a cosine function)
Piotrovsky V (2005), “Pharmacokinetic-Pharmacodynamic Modeling in the Data Analysis and Interpretation of Drug-induced QT/QTc Prolongation.” AAPS Journal 7(3):609-624.

slide 79 © Pharsight Corporation All Rights Reserved
Here is an actual example using the cosine method
1 21 2
2 ( ) 2 ( )( ) cos cos24 12t tf t A Aπ φ π φ− −⎛ ⎞ ⎛ ⎞= +⎜ ⎟ ⎜ ⎟
⎝ ⎠ ⎝ ⎠
360
380
400
420
440
8 10 12 14
Time of the Day [hrs]
QTc
Indi
v [m
sec]
Baseline Visits

slide 80 © Pharsight Corporation All Rights Reserved
When possible, we use a mixed effects model for individual adjustment of QT values for heart rate
Individual adjustment should give more accurate answers when using the model for prediction.
QTc = QT/RRN
In this case, the typical exponent was 0.24 (as opposed to 0.33 [F] or 0.50 [B]).
We have seen this make a 20% difference in the estimate of the slope. This can be the difference between a “positive” or “negative”TQT.
320
340
360
380
400
420
440
600 800 1000 1200 1400
Bazett Fridericia
No Correction
320
340
360
380
400
420
440
600 800 1000 1200 1400
Indiv. Correction
RR [msec]
QT
[mse
c]
Baseline measurements

slide 81 © Pharsight Corporation All Rights Reserved
Steps in the pooled analysis
A general outline is as follows:
1. Correct for heart rate (typically Fridericia, plus maybe individual)
2. Start with simple mixed effects model of baseline
3. Estimate time of day model with baseline data (at individual level if data permit)
4. Explore and model relationship of QTc with concentrations
• predict concentrations for all ECG samples, with/without matching PK draw• examine linear, log-linear, and saturable models• check for hysteresis/metabolite effects, as applicable• fit models at individual level as data permit

slide 82 © Pharsight Corporation All Rights Reserved
Here is a detailed example of how C-QT helps you via the pooled analysis of early phase data
Anti-diabetic compound (in Phase 2)
Modeling and simulation had been conducted throughout clinical development for● selecting doses and regimen● illuminating efficacy/safety tradeoffs● qualifying biomarkers● modeling disease progression
QT was one of several exposure-response endpoints modeled
QTc dataset was from a single Phase I crossover study (pre-TQT)● Maximum dose was 4X planned therapeutic dose● Other studies only had ECG at pre-dose and study exit● Primary study had 24 subjects in a 3 period crossover {10, 20, 60 mg}.
• Each period: Drug X QD for 4 days • Intensive PK sampling on each Day 1 (up to 24 h post dose) and Day 4 (up to 72 h post dose).• ECGs taken on each of the 4 dosing days at pre-dose, 2, and 4 hours post-dose.• Manually-read triplicate observations at each sample point.• Each observation was the average of 3 cardiac beats.

slide 83 © Pharsight Corporation All Rights Reserved
No relationship was seen with concentration
0 20 40 60 80 100 120
10 mg
340
360
380
400
420
440
0 50 100 150 200 250
20 mg
340
360
380
400
420
440
0 200 400 600
60 mg
Predicted DRUG X Concentrations [ng/mL]
QTc
Indi
v [m
sec]
slide 84 © Pharsight Corporation All Rights Reserved
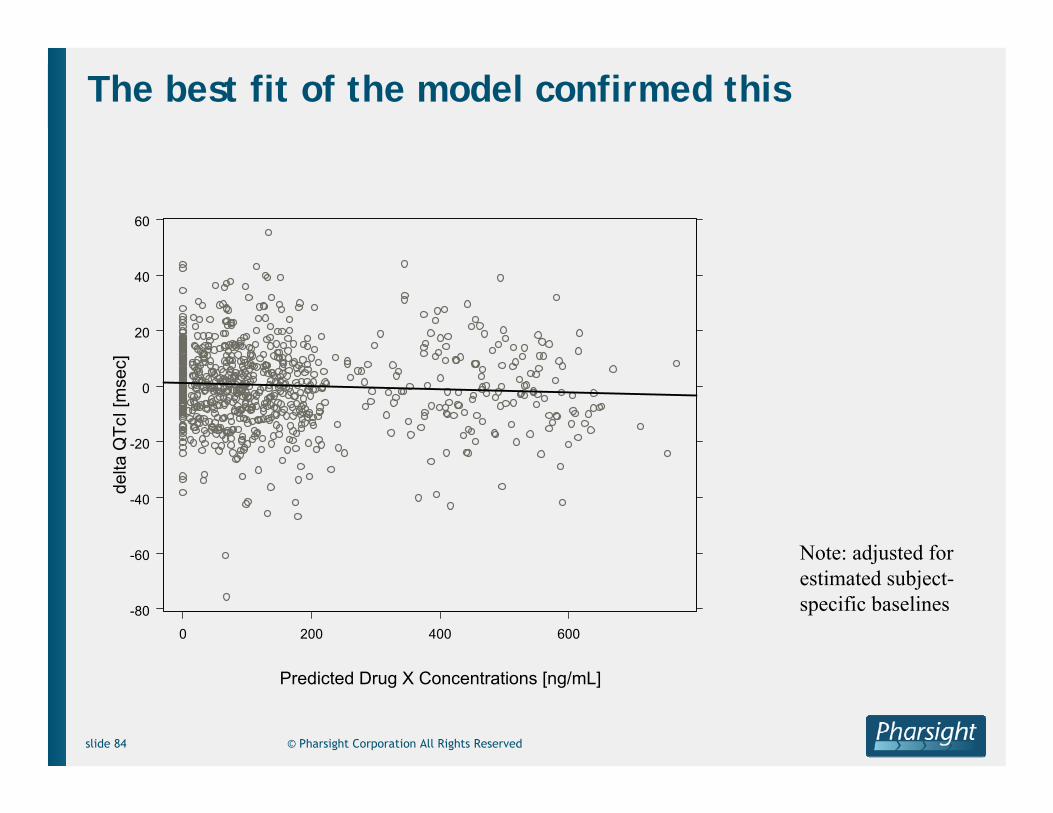
The best fit of the model confirmed this
-80
-60
-40
-20
0
20
40
60
0 200 400 600
Predicted Drug X Concentrations [ng/mL]
delta
QTc
I [m
sec]
Note: adjusted for estimated subject-specific baselines

slide 85 © Pharsight Corporation All Rights Reserved
Modeling predicted the outcome of the TQT
The predictions made by the model were useful.
● Doses and concentrations covered the supratherapeutic scenario● Predictions from the model gave reassurance regarding future TQT result
Time (h)
0 2 4 6 8 10 12 14 16 18 20 22 24-10
-5
0
5
10
15
20A - Therapeutic DoseB – Supratherapeutic DoseD - Moxifloxacin 400 mg
ddQ
TcF
(mse
c)
Plasma Concentrations (ng/mL)0 600 1200 1800 2400 3000 3600
-75
-60
-45
-30
-15
0
15
30
45
60
75
A – 60 mg B - 200 mgPlacebo
Slope = -0.004r ² = 0.004

slide 86 © Pharsight Corporation All Rights Reserved
M&S of QTc Prolongation: References for further reading
General:● Garnett CE et al. (2008) “Concentration-QT relationships play a key role in the evaluation of proarrhythmic risk
during regulatory review.” Journal of Clinical Pharmacology 48:13-18.● Bloomfield D and Krishna R (2008) “Commentary on the clinical relevance of concentration/QT relationships for new
drug candidates.” Journal of Clinical Pharmacology 48:6-8. ● Russell T et al. (2008) “A perspective on the use of concentration-QT modeling in drug development.” Journal of
Clinical Pharmacology 48:9-12.● Carrothers TJ, Khariton T, Rohatagi S (2008). Performance Characteristics of Pooled Early Phase Concentration-QTc
Modeling. 37th Annual Meeting of the American College of Clinical Pharmacology (ACCP); September 14-16, 2008; Philadelphia, Pennsylvania.
● Rohatagi S et al (2008). Role of Modeling and Simulation in Evaluating the QTc Prolongation Potential of Drugs. American Conference on Pharmacometrics (ACoP); March 9-12, 2008; Tucson, Arizona.
● Carrothers TJ (2007) “Concordance between the exposure-QTc response relationship in the pooled phase 1 data vs. thorough QTc study.” Presented at: 2nd Annual DIA Cardiac Safety Conference; December 4, 2007; Prague, Czech Republic. Available at http://pharsight.com/library/library_cs.php
Methods:● Hutmacher MM et al. (2008) “Performance characteristics for some typical QT study designs under the ICH E-14
guidance.” Journal of Clinical Pharmacology 48:215-224. ● Piotrovsky V (2005) “Pharmacokinetic-pharmacodynamic modeling in the data analysis and interpretation of drug-
induced QT/QTc prolongation.” AAPS Journal 7:609-624.● Li L et al. (2004) “QT analysis: a complex answer to a ‘simple’ problem.” Statistics in Medicine 23:2625-2643.
ICH E14:● International Conference on Harmonization of Technical Requirements for Registration of Pharmaceuticals for
Human Use. (2005) The Clinical Evaluation of QT/QTc Interval Prolongation and Proarrhythmic Potential for Non-Antiarrhythmic Drugs: E14. http://www.fda.gov/cber/gdlns/iche14qtc.htm

slide 87 © Pharsight Corporation All Rights Reserved
Pre-clinical (In-vitro → in-vivo)
● Dose selection for First-in-Humans (FIH) study
Early Development
● Concentration-QT modeling in early development
Late-Stage Development
● Model-based NCE profile assessment versus competing therapies
Post Approval
● Model-based pediatric dose selection for an approved biologic
Case Examples Across All Phases of Drug Development

slide 88 © Pharsight Corporation All Rights Reserved
What is the product profile of an NCE versus competing therapies ?
Gemcabene (CI-1027) is a non-statin compound developed as a low-density lipoprotein cholesterol (LDL-C) lowering compound.
Based on a beneficial effect of the drug on LDL-C in several phase I and IIa trials. it was decided to initiate a study in hypercholesterolemia.
Key question: “Given the LDL-C lowering effect of gemcabene in combination with a statin compared with competing therapies, should clinical development continue?”
A second objective was to effectively communicate the critical drug attributes to the clinical team to facilitate decision-making
Hermann D, Wang W, Falcoz C, Hartman D, Mandema J. Strategies to Improve Model-Based Decision-Making During Clinical Development. Presented at: Annual Meeting of the Population Approach Group in Europe (PAGE); June 2005; Pamplona, Spain. Reprinted courtesy of PAGE.

slide 89 © Pharsight Corporation All Rights Reserved
Strategy: Efficient Model-Based Development
A Phase IIA trial was planned to assess gemcabene LDL-C lowering ability, alone and in combination with atorvastatin
To aid decision-making, the team agreed to undertake a dose-response analysis of gemcabene trials as well as statins and ezetimibe (competitor) using literature data● 21 trials were included (~10000 patients)● Statins (atorvastatin, rosuvastatin, simvastatin, pravastatin,
lovastatin)● Nonstatins (gemcabene historical data, ezetimibe, mono- and
combination therapy)● Models were built for 7 efficacy and safety endpoints that drive
decision-making, and were updated with the Phase IIA trial results

slide 90 © Pharsight Corporation All Rights Reserved
Methods: Meta-Dose-Response Analysis
Mono-therapy LDL-C % change dose-response:Statins and Non-statins: gemcabene, ezetimibe
Interaction term added to describe combinations
Weighted (by variance) non-linear mixed effects (study level random effect) regression to estimate model parameters.
nn
n
drug EDDoseEDoseE
50
max
+⋅
=
εη ++⋅⋅+++= −− statinnonstatinstatinnonstatin EEγEEEchangeLDL 0%
slide 91 © Pharsight Corporation All Rights Reserved
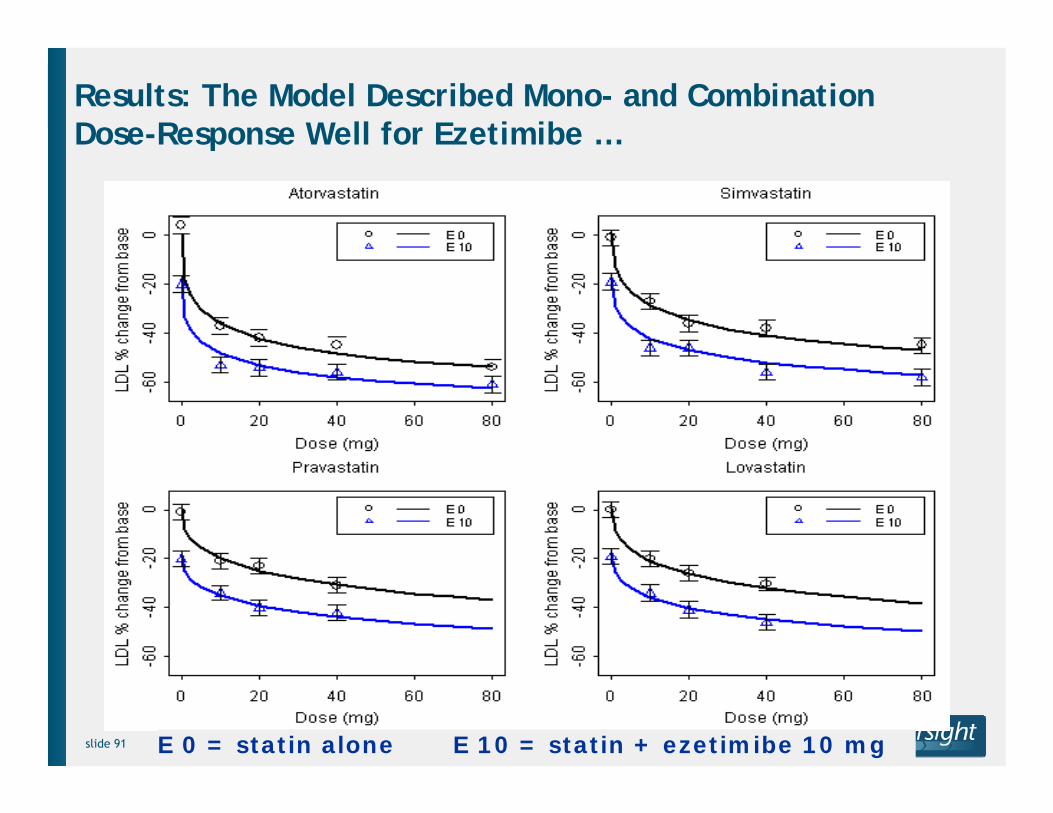
Results: The Model Described Mono- and Combination Dose-Response Well for Ezetimibe …
E 0 = statin alone E 10 = statin + ezetimibe 10 mg

slide 92 © Pharsight Corporation All Rights Reserved
… And Gemcabene
A 0 = gemcabene aloneA 10 = gemcabene + atorvastatin 10 mg etc.

slide 93 © Pharsight Corporation All Rights Reserved
Pre-Clinical Data
Summary of process so far ….
CompetitorLabelInformation
Model Assumptions
1.
2.
3.Safety Trials
Population Modeling
Techniques, Model
qualification
The model summarizes and quantifies what is known.The model assumptions detail what is not known.
The model summarizes and quantifies what is known.The model assumptions detail what is not known.
+
Dose
Resp
onse
Phase II Trials
Scientific Literature
Simulations
Dimensions of Decision Space• X Endpoints• Y Drugs/Doses• Z Covariates
X*Y*Z dimensions
e.g.,1000 simulations/dimension= [X*Y*Z]* 103 data points
C(t) = D/V(Ae-αt + Be -βt)
PK-PD Models
E(t) = E0+ (Emax- E0) • C(t)
C(t) + EC50

slide 94 © Pharsight Corporation All Rights Reserved
What is the expected clinical response for a treatment in a particular patient population?
What is the level of certainty surrounding predicted response?
How do different treatment strategies and target patient sub-populations impact response?
What is the probability that response is less or greater than a specific target?
What dose is required to achieve a target response?
What is the probability of achieving a specific efficacy target while keeping probability for adverse events below a certain level?
How do the attributes for the compound compare to competitors?
What is optimal positioning strategy versus competitors to balance safety and efficacy?
Models provide answers to important clinical questions.

slide 95 © Pharsight Corporation All Rights Reserved
Difference in LDL % change frm baseline vs CI1027Atorvastatin: 0Ref: Atorvastatin: 0 + Ezetimibe: 10
CI1027
LDL
% c
hang
e frm
bas
elin
eD
iffer
ence
in
-20
-10
0
10
20
0 200 400 600 800 1000
Superior
Equal
Inferior
Q1: What is the probability that gemcabene mono-therapy is clinically superior to ezetimibe 10 mg?
Inferior Equal Superior
900 0.0% 2.8% 97.3%
Gemcabene (mg)300 10.0% 89.9% 0.1%450 0.0% 53.5% 46.5%600 0.0% 7.2% 92.8%
Range ± 5%
Gemcabene at a dose of 600 mg or more is superior to ezetimibe

slide 96 © Pharsight Corporation All Rights Reserved
1 PlotLDL % change frm baseline vs Atorvastatin
Treatments
Ezetimibe 0Ezetimibe 10
Atorvastatin
LDL
% c
hang
e frm
bas
elin
e
-80
-60
-40
-20
0
20
0 20 40 60 80
.
.
.
1 PlotLDL % change frm baseline vs Atorvastatin
Treatments
CI1027 0CI1027 900
Atorvastatin
LDL
% c
hang
e frm
bas
elin
e
-80
-60
-40
-20
0
20
0 20 40 60 80
.
.
.
Q2: What is the probability that, in combination with a statin, gemcabene is clinically superior to ezetimibe?
Atorvastatin dose (mg)
LDL % Change from Baseline
Atorvastatin alone
+ Gemcabene 900 mg + Ezetimibe 10 mg
Atorvastatin alone
Gemcabene combination will not provide superior LDL-C lowering relative to ezetimibe

slide 97 © Pharsight Corporation All Rights Reserved
Q3: Given the magnitude of LDL-C lowering across the gemcabene + statin dose range should clinical development continue?
Data Analysis Method
Data Base Assumptions
Mean (95% CI)
Comments
Gemcabene Combo - mono
ANCOVA Phase IIA trial only (n=255)
Few -4.8 (-12.3 to 2.7)
Traditional analysis
Meta-Dose- Response
Phase IIA trial pooled with
relevant historic data
Many -2.5
(-5.8 to 1.2)
Width of CI decreased ½ compared to traditional
analysis
Ezetimibe Combo - mono
Meta-Dose-Response
Phase IIA trial pooled with
relevant historic data
Many -8.6
(-9.1 to -8.3)
Gemcabene combination has very low probability
of reaching target competitor level of LDL-
C lowering
The gemcabene CI from the meta-analysis does not overlap ezetimibe CI, clearly suggesting that
gemcabene is unlikely to lower LDL-C to the extent necessary to compete with ezetimibe.
"The results showed that the new drug was unlikely to outperformits main competitor; Pfizer discontinued development. The
modeling project supported a more confident decision without investment in additional trials and allowed team members to
re-deploy to other programs. It provided an enduring, evolving knowledge repository to support future development projects.
DMX enabled team members to evaluate complex product tradeoffs and ask targeted what-if questions in real time.”
Source: “PK/PD Simulation Speeds Decision Making.” Bio-IT World Best Practices[serial online]. January 23, 2006

slide 98 © Pharsight Corporation All Rights Reserved
Pre-clinical (In-vitro → in-vivo)
● Dose selection for First-in-Humans (FIH) study
Early Development
● Concentration-QT modeling in early development
Late-Stage Development
● Model-based NCE profile assessment versus competing therapies
Post Approval
● Model-based pediatric dose selection for an approved biologic
Case Examples Across All Phases of Drug Development

slide 99 © Pharsight Corporation All Rights Reserved
Pediatric Drug Development: Clinical Needs
• Current Status:● Drug dosing is highly empirical and based on trial and error● Linear extrapolation (mg/kg or mg/m2) may not be adequate● PK/PD relationship is unknown in pediatric patients
• Clinical Needs:
● To determine a safe and effective dose● A easy way to calculate individualized dose if needed● To understand the impact of developmental changes on PK/PD
Mouksassi S, Marier JF. Modeling and Simulation for Optimal Drug Developmentin Pediatric Populations. Presented at: 2nd World Conference on Magic Bullets (Ehrlich II); October 3-5, 2008; Nürnberg, Germany.

slide 100 © Pharsight Corporation All Rights Reserved
Pediatric Drug Development: Challenges
• Data collection difficulties● Invasiveness● Limited sampling possibilities sparse data● Recruiting and consent
• Costs/Ethical Issues

slide 101 © Pharsight Corporation All Rights Reserved
Pediatric Drug Development: Opportunities
• Prior and current Knowledge
● Extensive adult data available● Current understanding of physiology and pharmacology● Significant knowledge available in industry, academia and regulatory agency
need to share
• Non-linear mixed effects modeling and Simulation
● Can handle sparse and unbalanced data● Covariate analysis shed light on important determinants of
exposure/safety/efficacy● Innovative models can reduce sampling ( e.g. Time-response or PK-PD models)
• Allometry theory and developmental changes
• Optimal Pediatric studies
● Clinical trial simulations to design successful trials● Population optimal design limited sampling of high value● Adaptive Bayesian design to inform best the PK/PD relationship

slide 102 © Pharsight Corporation All Rights Reserved
Pediatric Drug Development: Efficiency is the Key
Disease Model
Studied System
Physiology
Pharmacology
Drug Model
Efficacy
Outcomes
Safety
? Developmental Changes
Is a pediatric PK/PD Safety
study required ?
If yes what is the study design that best informs the
decision ?

slide 103 © Pharsight Corporation All Rights Reserved
Case Study: Supporting Pediatric Dose Selection
Background● Biologic drug X approved in adults● PK model one-compartment, the drug is excreted by receptor mediated mechanisms● PD model steep direct Emax (on-off) model, need to keep concentration above a
threshold.● Disease progression is not likely to be different in pediatric patients● Limited prior experience demonstrated that the EC50 is similar in pediatric patients● Allometry theory can be used to predict pediatric clearance
• Objectives● To design an optimal sampling strategy for PK/PD determination in pediatric patients● To design a dosing strategy for a pediatric trial that will ensure adequate PD response
(> 95% above threshold).
• Tools● Optimal design based on the population fisher information matrix and partial
derivatives.● Various clinically feasible dosing scenarios were tested to find the dosing strategy that
has the minimum likelihood of PD response breakthrough.

slide 104 © Pharsight Corporation All Rights Reserved
Scaling from Adults to Pediatrics: Predicting PK
( )0.75
( )70
WeightCL TVCL Maturation age⎛ ⎞= ⎜ ⎟⎝ ⎠i i
Drug X is cleared by receptor mediated mechanisms
No correlation with renal function.
Maturation can reflect receptor density or disease interaction with age. No maturation function was incorporated in this CTS exercise
The allometric model was also used for volume of distribution
1
70WeightVc TVVc ⎛ ⎞= ⎜ ⎟⎝ ⎠i

slide 105 © Pharsight Corporation All Rights Reserved
Optimal Design Points Based on Partial Derivatives
0 2 4 6 8 10 12 14 16WEEK
-70
-50
-30
-10
10
300
600
-17000
-12750
-8500
-4250
0
03570
105140175210245280315350
DOSEPK SamplePredicted PKCL Partial DerivativeVd Partial Derivative

slide 106 © Pharsight Corporation All Rights Reserved
Clinical Trial SimulationsPK/PD Model
Zero Order Infusion over 30 minutes
CL
Vc0.75
70WeightCL TVCL ⎛ ⎞= ⎜ ⎟⎝ ⎠i
1
70WeightVc TVVc ⎛ ⎞= ⎜ ⎟⎝ ⎠i
Scaling Model
γ
γ γ
Emax Conc100 1EC50 +Conc
PD⎛ ⎞⎛ ⎞⋅
= −⎜ ⎟⎜ ⎟⎝ ⎠⎝ ⎠
i
100 %
3 5 7 9 11 13BODYWEIGHT
CL
0-1.5M1.5-3.5M3.5-6.5M6.5-12.5M12.5-24.5M
Covariate Model

slide 107 © Pharsight Corporation All Rights Reserved
Clinical Trial SimulationsDosing Scenarios
Goal
Find the dosing regimen that has the highest likelihood to keep 95% of the patients concentrations above a critical threshold.
Constraints
Dose should be a multiple of the one available strengthDosing may be every two weeks or less

slide 108 © Pharsight Corporation All Rights Reserved
0.0
0.002
0.004
0.006
0.008
0.010
0 500 1000 1500
Regimen 1
0 500 1000 1500
Regimen 2
0 500 1000 1500
Regimen 3
PK
Den
sity
Success Rates (>95% above threshold) of Different Regimens
65% 90% 99%
0.92 0.94 0.96 0.98 1.00Regimen.3
0
20
40
60
80
100

slide 109 © Pharsight Corporation All Rights Reserved
Case Study: Conclusion
Combining Modeling and Simulation tools:
• Understanding of the underlying disease and adult/pediatric differences
• Allometric Scaling
• Optimal design
• Clinical Trial Simulation incorporating variability and uncertainty
• Testing multiple what if Scenarios of dosing Regimens
Made possible to find an effective dose and an optimal design for a prospected pediatric study.
Early clinical findings from the actual trial are confirming the proposed dosing regimen that was based on a computer-assisted trial design.

© Pharsight Corporation All Rights ReservedReference ID or Date
The Status of MBDD in the U.S. Japan, Korea and China

slide 111 © Pharsight Corporation All Rights Reserved
Status of MBDD: Key Themes From ACoP 2008
Inaugural ACoP Meeting ● 300+ participants from
>100 global sponsors & universities
● MBDD is maturing as a science
● Recognition of key elements for success: interdisciplinary collaboration, organizational support, emergence of standards
● Need to train more practitioners (methods, tools, communication)
● Strong FDA presence and engagement
The inaugural American Conference on Pharmacometrics (ACoP) Meeting, held in March 208, provided a useful backdrop for examining the evolution of MBDD, as well as current challenges and opportunities.

slide 112 © Pharsight Corporation All Rights Reserved
Impact of Pharmacometric (PM) Reviews at FDA
MBDD informs FDA analysis and sponsor interactions to:
● Establish evidence of safety and efficacy
● Optimize dose● Improve future trial
designs
Of 31 NDAs reviewed in 2005-2006, PM was involved in approval for 20 NDAs and labeling for 17 NDAs
● Six published case studies
These data build on earlier FDA published work
● 42 NDAs surveyed between 2000-2004
Impact of Pharmacometric Reviews on New Drug Approval and Labeling Decisions – a Survey of 31 New Drug Applications Submitted Between 2005 and 2006. Bhattaram VA et al. Clin Pharmacol Ther; Volume 81, Number 2. February 2007.

slide 113 © Pharsight Corporation All Rights Reserved
MBDD Metrics Are Becoming the Norm by Which Pharma and Biotechs, Large and Small, Compare and Evaluate Performance
Conclusion: top firms are using model-based methods on 10-20% of projects

slide 114 © Pharsight Corporation All Rights Reserved
Informal Adoption Metrics for Model-based Drug DevelopmentA search of Google Scholar for Nonmem + USA, Nonmem + Japan, etc., shows the following counts of publications from all types of authors (commercial and academic):
0
500
1000
1500
2000
2500
3000
Nonmem +USA
Nonmem +Japan
Nonmem +China
Nonmem +Korea
Goo
gle
Scho
lar
Refe
renc
es
Conclusion: together all kinds of authors (commercial and academic) from Japan, China, and Korea have about the same number of NONMEM-referencing publications as do US authors.

slide 115 © Pharsight Corporation All Rights Reserved
Informal Adoption Metrics for Model-based Drug DevelopmentA search of Google Scholar for Nonmem + Pfizer, Nonmem + Eisai, etc., together with phase I compounds reported in BioPharm Insight shows that ● Top Japanese firms have published about 10% as often as top western firms● The ratio of citations to phase I compounds is 7:1 in the West, and 1:1 in Japan
Conclusion 1: Japanese commercial firms have only about 10-15% of the experience of Western firms in the use of model-based drug development.
Conclusion 2: Since Western firms are using model-based methods in 10-20% of projects, then Japanese companies are using model-based methods in 1-3% of projects.

slide 116 © Pharsight Corporation All Rights Reserved

slide 117 © Pharsight Corporation All Rights Reserved
1st Japanese Conference on Pharmacometrics (JCoP)
Date: November 15 and 16, 2008
Location: Showa University
The President of the Conference: Dr. Syozi Awazu, former President and Professor of Tokyo University of Pharmacy
Director of Secretariat: Prof. H. Sato of University of Showa

slide 118 © Pharsight Corporation All Rights Reserved
Increased Outsourcing Fueling Growth in Asia
Increased Outsourcing to CRO’s and
CMO’s. Overseas CRO’s entering the US market in increasing numbers. Outsourcing includes R&D outsourcing to countries with strong international IP protection and lower cost of business. Latin America and Asia are important because of increasing customer interest outside the US, especially in developing countries. For CRO's, presence and infrastructure in developing regions can be a ‘make or break’ for winning large, global opportunities. Latin America and Asia offer large patient pools with fewer competing studies in most indications. Challenges in these areas include health insurance coverage and hidden trial costs, language and cultural barriers, IP protection, rapid growth and sheer volume, larger and more complex studies and regulatory is sometimes unpredictable.
Life Science Trends ‘08
Carlyle & Conlan (C) Copyright (1-08) All Rights Reserved

slide 119 © Pharsight Corporation All Rights Reserved
China is Gaining Ground
Fundamental Trends:
Globalization of Biotechnology: China
has overtaken India in an important
measure of drug research activity. In an
analysis done by the Financial Times, China
now has 274 registered clinical trials
underway, compared to 260 in India. The
trend reflects intensifying interest by the
healthcare sector in China, which is growing
rapidly as a result of rising income and
expanding health coverage and is already
forecast to be the world's fifth-largest
pharmaceuticals market by 2010.
Life Science Trends ‘08
Carlyle & Conlan (C) Copyright (1-08) All Rights Reserved
Based on a recent visit to China, I learned a major
(~$1M) investment is planned for
Chinese FDA, with possibility of
creation of a Pharmacometrics
group

slide 120 © Pharsight Corporation All Rights Reserved
Food and Drug Administration Opening Offices in China
Last week, Health and Human Services Secretary Michael Levitt announced that finally, after months of negotiation and bureaucratic slogging, the FDA will be sending permanent staff to China. The first office will be in Beijing and two more offices, one in Shanghai and the other in Guangzhou, will open sometime next year, for a total of eight FDA staffers.
WashingtonPost.com
By Annys Shin | October 20, 2008; 12:11 PM ET

© Pharsight Corporation All Rights ReservedReference ID or Date
The Future of MBDD in Drug Development
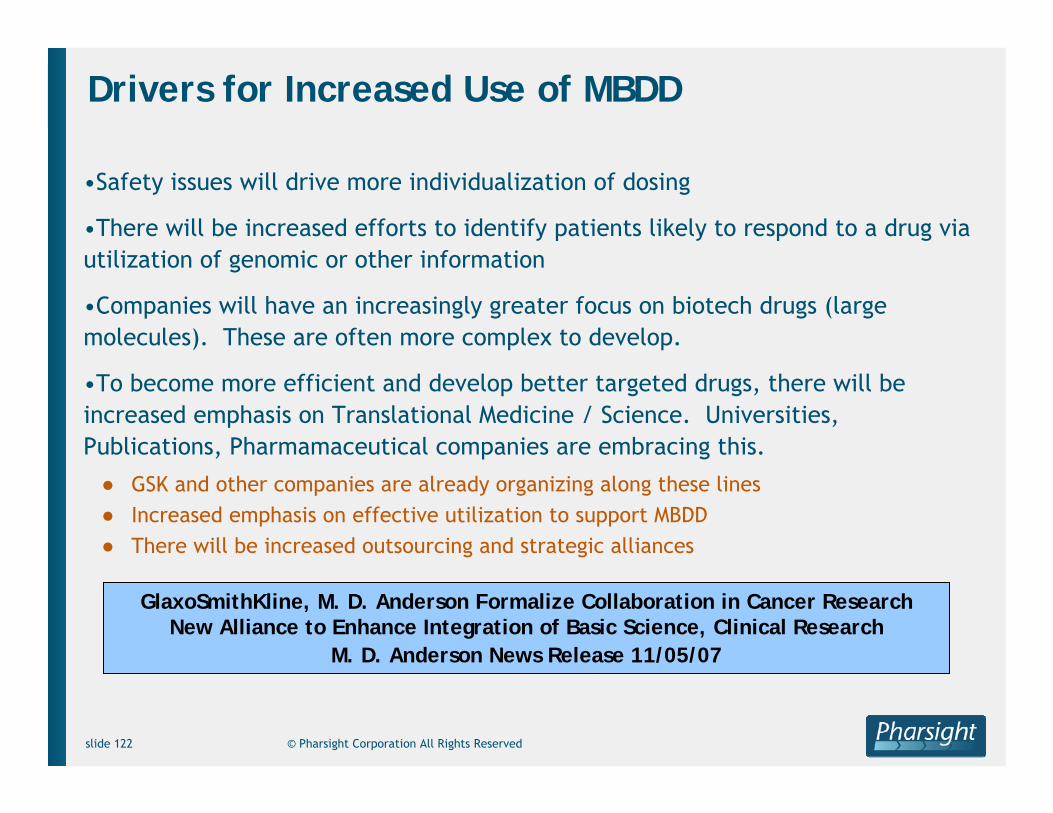
slide 122 © Pharsight Corporation All Rights Reserved
Drivers for Increased Use of MBDD
•Safety issues will drive more individualization of dosing
•There will be increased efforts to identify patients likely to respond to a drug via utilization of genomic or other information
•Companies will have an increasingly greater focus on biotech drugs (large molecules). These are often more complex to develop.
•To become more efficient and develop better targeted drugs, there will be increased emphasis on Translational Medicine / Science. Universities, Publications, Pharmamaceutical companies are embracing this.
● GSK and other companies are already organizing along these lines● Increased emphasis on effective utilization to support MBDD● There will be increased outsourcing and strategic alliances
GlaxoSmithKline, M. D. Anderson Formalize Collaboration in Cancer ResearchNew Alliance to Enhance Integration of Basic Science, Clinical Research
M. D. Anderson News Release 11/05/07

slide 123 © Pharsight Corporation All Rights Reserved

slide 124 © Pharsight Corporation All Rights Reserved

slide 125 © Pharsight Corporation All Rights Reserved

slide 126 © Pharsight Corporation All Rights Reserved
A Vision for MBDD at FDA
Presentation by Dr. Joga Gobburu, FDA, ACoP 2008.

slide 127 © Pharsight Corporation All Rights Reserved
A Path Forward – Companies Need to Make Investments in …
•Increased emphasis and utilization of Biomarkers, including imaging and other techniques
•Implementation of tools to facilitate Translational Science and individualization of patients
•Increased understanding and communication of benefit/risk
•Modeling and Simulation, as a first step towards implementation of MBDD
•Technology, including data repositories and M&S tools
•Shift to Biotechnology
•Academia, to provide programs for training of M&S scientists
•Ongoing training for current staff, to improve their skills
Business
Staff

slide 128 © Pharsight Corporation All Rights Reserved
Acknowledgements
•Joga Gobburu, Pravin Jadhav and Bob Powell, FDA
•Mark Hovde, Adam Rutkin and JF Marier, Pharsight

slide 129 © Pharsight Corporation All Rights Reserved
Thank You