pavement remaining service interval implementation guidelines · · 2013-11-06pavement remaining...
TRANSCRIPT

Research, Development, and TechnologyTurner-Fairbank Highway Research Center6300 Georgetown PikeMcLean, VA 22101-2296
Pavement Remaining Service IntervalImplementation Guidelines
PublIcatIon no. FHWa-HRt-13-050 novembeR 2013

FOREWORD
Many important decisions are necessary in order to successfully provide and manage a pavement network. At the heart of this process is the prediction of needed future construction events. One approach to providing a single numeric on the condition of a pavement network is the use of pavement remaining service life (RSL). However, many issues exist with the current RSL terminology and resulting numeric that complicate proper interpretation, interagency data exchange, and use. A major source of uncertainty in the current RSL definition is the use of the term “life” to represent multiple points in the pavement construction history. The recommended path to consistency involves adopting terminology of time remaining until a defined construction treatment is required (i.e., RSL is replaced by remaining service interval (RSI)). The term “RSI” has the ability to unify the outcome of different approaches to determine needs by focusing on when and what treatments are needed and the service interruption created. This report provides guidelines for implementing the RSI concept as a replacement to the current remaining life terminology for pavements. The RSI concept is broken down into a series of steps that follow a logical progression. Examples of the concept are presented using pavement engineering methodologies in current use. Suggestions are also provided based on the results of the RSI process. While this report focuses on pavements, it is also applicable to other types of transportation infrastructure. A companion report presents the framework for replacing the current RSL terminology with one based on more exact construction event terms.(1) This report is intended for use by pavement managers and pavement investment decisionmakers across the United States.
Jorge E. Pagán-Ortiz
Director, Office of Infrastructure Research and Development
Notice
This document is distributed under the sponsorship of the U.S. Department of Transportation in the interest of information exchange. The U.S. Government assumes no liability for its contents or use thereof. This report does not constitute a standard, specification, or regulation. The U.S. Government does not endorse products or manufacturers. Trade and manufacturers’ names appear in this report only because they are considered essential to the object of the document.
Quality Assurance Statement The Federal Highway Administration (FHWA) provides high-quality information to serve Government, industry, and the public in a manner that promotes public understanding. Standards and policies are used to ensure and maximize the quality, objectivity, utility, and integrity of the information. FHWA periodically reviews quality issues and adjusts its programs and processes to ensure continuous quality improvements.

TECHNICAL REPORT DOCUMENTATION PAGE 1. Report No. FHWA-HRT-13-050
2. Government Accession No.
3. Recipient’s Catalog No.
4. Title and Subtitle Pavement Remaining Service Interval Implementation Guidelines
5. Report Date November 2013 6. Performing Organization Code
7. Author(s) Gary E. Elkins, Gonzalo R. Rada, Jonathan L. Groeger, and Beth Visintine
8. Performing Organization Report No.
9. Performing Organization Name and Address AMEC Environment and Infrastructure, Inc. 12000 Indian Creek Court, Suite F Beltsville, MD 20705-1242
10. Work Unit No. (TRAIS) 11. Contract or Grant No. DTFH61-08-C-00033
12. Sponsoring Agency Name and Address Office of Infrastructure Research and Development Federal Highway Administration 6300 Georgetown Pike McLean, VA 22101-2296
13. Type of Report and Period Covered Implementation Guidelines October 2009–May 2012 14. Sponsoring Agency Code
15. Supplementary Notes The Contracting Officer’s Representative (COR) was Nadarajah Sivaneswaran, HRDI-20. 16. Abstract Many important decisions are necessary in order to effectively provide and manage a pavement network. At the heart of this process is the prediction of needed future construction events. One approach to providing a single numeric on the condition of a pavement network is the use of pavement remaining service life (RSL). However, many issues exist with the current RSL terminology and resulting numeric that complicate proper interpretation, interagency data exchange, and use. A major source of uncertainty in the current RSL definition is the use of the term “life” to represent multiple points in the pavement construction history. The recommended path to consistency involves adopting terminology of time remaining until a defined construction treatment is required (i.e., RSL is replaced by remaining service interval (RSI)). The term “RSI” has the ability to unify the outcome of different approaches to determine needs by focusing on when and what treatments are needed and the service interruption created. This report provides step-by-step guidelines for implementing the RSI terminology. A companion report presents the framework for replacing the current RSL terminology with one based on more exact construction event terms.(1) 17. Key Words Pavement remaining service life, Pavement remaining life, Pavement remaining service interval, Pavement construction events, Pavement construction triggers, Pavement threshold limits, Pavement performance expectancy curves, Pavement data collection, Pavement strategy selection, Repairable system
18. Distribution Statement No restrictions. This document is available to the public through the National Technical Information Service, Springfield, VA 22161
19. Security Classif. (of this report) Unclassified
20. Security Classif. (of this page) Unclassified
21. No. of Pages 62
22. Price
Form DOT F 1700.7 (8-72) Reproduction of completed page authorized

ii
SI* (MODERN METRIC) CONVERSION FACTORS APPROXIMATE CONVERSIONS TO SI UNITS
Symbol When You Know Multiply By To Find Symbol LENGTH
in inches 25.4 millimeters mm ft feet 0.305 meters m yd yards 0.914 meters m mi miles 1.61 kilometers km
AREA in2 square inches 645.2 square millimeters mm2
ft2 square feet 0.093 square meters m2
yd2 square yard 0.836 square meters m2
ac acres 0.405 hectares ha mi2 square miles 2.59 square kilometers km2
VOLUME fl oz fluid ounces 29.57 milliliters mL gal gallons 3.785 liters L ft3 cubic feet 0.028 cubic meters m3
yd3 cubic yards 0.765 cubic meters m3
NOTE: volumes greater than 1000 L shall be shown in m3
MASS oz ounces 28.35 grams glb pounds 0.454 kilograms kgT short tons (2000 lb) 0.907 megagrams (or "metric ton") Mg (or "t")
TEMPERATURE (exact degrees) oF Fahrenheit 5 (F-32)/9 Celsius oC
or (F-32)/1.8 ILLUMINATION
fc foot-candles 10.76 lux lx fl foot-Lamberts 3.426 candela/m2 cd/m2
FORCE and PRESSURE or STRESS lbf poundforce 4.45 newtons N lbf/in2 poundforce per square inch 6.89 kilopascals kPa
APPROXIMATE CONVERSIONS FROM SI UNITS Symbol When You Know Multiply By To Find Symbol
LENGTHmm millimeters 0.039 inches in m meters 3.28 feet ft m meters 1.09 yards yd km kilometers 0.621 miles mi
AREA mm2 square millimeters 0.0016 square inches in2
m2 square meters 10.764 square feet ft2
m2 square meters 1.195 square yards yd2
ha hectares 2.47 acres ac km2 square kilometers 0.386 square miles mi2
VOLUME mL milliliters 0.034 fluid ounces fl oz L liters 0.264 gallons gal m3 cubic meters 35.314 cubic feet ft3
m3 cubic meters 1.307 cubic yards yd3
MASS g grams 0.035 ounces ozkg kilograms 2.202 pounds lbMg (or "t") megagrams (or "metric ton") 1.103 short tons (2000 lb) T
TEMPERATURE (exact degrees) oC Celsius 1.8C+32 Fahrenheit oF
ILLUMINATION lx lux 0.0929 foot-candles fc cd/m2 candela/m2 0.2919 foot-Lamberts fl
FORCE and PRESSURE or STRESS N newtons 0.225 poundforce lbf kPa kilopascals 0.145 poundforce per square inch lbf/in2
*SI is the symbol for th International System of Units. Appropriate rounding should be made to comply with Section 4 of ASTM E380. e(Revised March 2003)

iii
TABLE OF CONTENTS
EXECUTIVE SUMMARY .......................................................................................................... 1
CHAPTER 1. INTRODUCTION ................................................................................................ 3 BACKGROUND ..................................................................................................................... 3 REFORMULATING RSL TERMINOLOGY ..................................................................... 4 REPORT ORGANIZATION ................................................................................................. 5
CHAPTER 2. RSI CONCEPT OVERVIEW ............................................................................. 7 CONSTRUCTION NEEDS PROCESS ................................................................................ 7 CONSTRUCTION EVENT TERMINOLOGY ................................................................... 8 RSI IMPLEMENTATION FRAMEWORK ...................................................................... 10
CHAPTER 3. IMPLEMENTING THE RSI CONCEPT ........................................................ 11 STEP 1—SETTING CONSTRUCTION TRIGGERS ...................................................... 11 STEP 2—SETTING THRESHOLD LIMITS .................................................................... 14
Subjective Approach ......................................................................................................... 14 Engineering Approach ...................................................................................................... 14 Empirical Approach .......................................................................................................... 15 Economic Analysis Approach........................................................................................... 15 Combinations Approach ................................................................................................... 16
STEP 3—SELECTING OR DEVELOPING EXPECTANCY PERFORMANCE CURVES ................................................................................................................................ 17
Models Based on Design Equations ................................................................................. 18 Empirical Models .............................................................................................................. 20 Agency Time-Based Rules ............................................................................................... 20
STEP 4—IDENTIFYING COLLECTION OF INPUTS .................................................. 21 Pavement Roughness ........................................................................................................ 21 Pavement Distress ............................................................................................................. 22 Pavement Structural Response .......................................................................................... 22 Traffic Loads ..................................................................................................................... 23 Climate .............................................................................................................................. 24
STEP 5—ESTABLISHING A STRATEGY SELECTION PROCESS ........................... 25 Network Analysis.............................................................................................................. 26 Project Analysis ................................................................................................................ 27
STEP 6—PERFORMING PERIODIC ASSESSMENTS AND UPDATES .................... 27 Assessments ...................................................................................................................... 27 Updates ............................................................................................................................. 28
CHAPTER 4. RSI IMPLEMENTATION EXAMPLES ......................................................... 29 EXAMPLE 1—SHA USING PHT ANALYSIS TOOL ..................................................... 29
Background ....................................................................................................................... 29 RSI Implementation .......................................................................................................... 29
EXAMPLE 2—SHA USING THE 1972 AASHTO INTERIM GUIDE FOR DESIGN OF PAVEMENT STRUCTURES ......................................................................................... 33
Background ....................................................................................................................... 33 RSI Implementation .......................................................................................................... 33

iv
EXAMPLE 3—SHA USING MULTIPLE PERFORMANCE INDICATORS .............. 38 Background ....................................................................................................................... 38 RSI Implementation .......................................................................................................... 39
LCC CONSIDERATIONS ................................................................................................... 44
CHAPTER 5. COMMUNICATING RSI FRAMEWORK RESULTS ................................. 47
APPENDIX. GENERIC AGENCY ISSUES ............................................................................ 49 ESTABLISHING AN RSI PROTOCOL ............................................................................ 49 IDENTIFYING AND APPOINTING AN RSI COORDINATOR ................................... 49 DISSEMINATION OF RSI CONCEPT WITHIN AGENCY .......................................... 50
REFERENCES ............................................................................................................................ 51
BIBLIOGRAPHY ....................................................................................................................... 53

v
LIST OF FIGURES
Figure 1. Flowchart. Future pavement construction needs process ................................................ 7 Figure 2. Flowchart. Agency RSI implementation ....................................................................... 10 Figure 3. Graph. Conceptual relationship between agency repair costs as a function of pavement condition ....................................................................................................................... 16 Figure 4. Graph. Three treatment zones as a function of pavement condition ............................. 17 Figure 5. Graph. Illustrated service histories of trial pavement designs incorporating future overlays ......................................................................................................................................... 19 Figure 6. Graph. Multiple distress-based pavement design where one of the distresses reaches a maximum threshold limit .............................................................................................. 19 Figure 7. Photo. Inertial road profilers used to measure IRI, RN, and other roughness indices ........................................................................................................................................... 21 Figure 8. Photo. FWD used for structural evaluation ................................................................... 23 Figure 9. Photo. TSD used for structural evaluation .................................................................... 23 Figure 10. Photo. TSD internal pavement response measurement instrumentation ..................... 23 Figure 11. Photo. WIM sensor used to record truck axle and gross vehicle weights ................... 24 Figure 12. Photo. Mini site-specific SMP weather station used to record climatic data .............. 24 Figure 13. Equation. Reflection cracking model .......................................................................... 30 Figure 14. Equation. IRI prediction model ................................................................................... 31 Figure 15. Equation. Flexible pavement design equation ............................................................. 35 Figure 16. Equation. SN................................................................................................................ 35 Figure 17. Flowchart. Partial set of construction event combinations and schedule of activities for example 1 ................................................................................................................. 46
LIST OF TABLES
Table 1. Reflection cracking or IRI construction triggers-threshold limits .................................. 30 Table 2. Reflective cracking model parameter d .......................................................................... 31 Table 3. Network-level construction trigger-threshold limits....................................................... 34 Table 4. Project-level construction trigger-threshold limits ......................................................... 34 Table 5. RSI based on PSR values and construction treatment .................................................... 38 Table 6. Construction trigger-threshold limits matrix .................................................................. 40 Table 7. RSI based on construction treatments ............................................................................. 43

vi
LIST OF ABBREVIATIONS
AADT Average annual daily traffic
AASHTO American Association of State Highway and Transportation Officials
CPR Concrete pavement restoration
FHWA Federal Highway Administration
FN Friction number
FWD Falling weight deflectometer
GPR Ground penetration radar
HMA Hot mix asphalt
HPMS Highway Performance Monitoring System
IRI International Roughness Index
JPCP Jointed plain concrete pavement
LCC Life-cycle cost
MEPDG Mechanistic-Empirical Pavement Design Guide NCDC National Climate Data Center
PCC Portland cement concrete
PCI Pavement Condition Index
PHT Pavement health track
PMS Pavement management system
PSI Present Serviceability Index
PSR Pavement serviceability rating
RSI Remaining service interval
RSL Remaining service life
RN Ride number
SHA State highway agency
SMP Seasonal monitoring program
SN Structural number
TSD Traffic speed deflectometer
WIM Weigh-in-motion

1
EXECUTIVE SUMMARY
The remaining service life (RSL) concept has been around for decades and is well entrenched in the pavement community. It is used at all levels of the pavement management decisionmaking process to plan for future field construction events. However, there is no single, clear, widely accepted definition of RSL. Moreover, there is a great deal of uncertainty associated with the definition, especially with the use of the term “life” to represent different points in a pavement’s construction history. In addition, “life” is interpreted differently by stakeholders.
To overcome the RSL shortcomings, this report introduces terminology that removes the word “life” from the lexicon. Instead, the new terminology, known as the remaining service interval (RSI), introduces the concept of time remaining until a defined construction event is required. Pavements are comprised of interrelated structural parts that can be maintained, preserved, restored, rehabilitated, or reconstructed to serve the intended transportation needs.
The RSI concept does not provide an alternative to assessing the health of the network or making decisions about where to spend the available funds. It simply provides a clear terminology and a logical process that will create consistent construction event-based terminology and understanding (i.e., types of construction events and the timing of those events within the concept of life-cycle cost (LCC), risk analyses, and other prioritization approaches based on streams of future construction events and benefits to facility users).


3
CHAPTER 1. INTRODUCTION
BACKGROUND
Many decisions need to be made in order to successfully provide and manage a pavement network. The main decision is the prediction of future construction events, which is the fundamental basis of engineering design and management of pavement structures. Future construction events include the do nothing alternative, routine reactive maintenance, preventive maintenance and preservation activities, alternative rehabilitation treatments, and reconstruction.
The goal of pavement management is to optimize agency resources while providing a maximum level of service to users. Accomplishing this goal requires monitoring the condition of the pavement network and forecasting future pavement performance in order to effectively plan future pavement construction events. Predicting RSL of the segment units that make up the pavement network is of paramount importance to pavement management planning. Knowing or estimating the future condition of pavement sections is the rational basis of informed pavement infrastructure planning.
Remaining service is typically defined as the period over which a pavement section adequately performs its desired function or performs to a desired level of service. RSL is the time from the present (i.e., today) to when a pavement reaches an unacceptable condition and requires construction intervention. The central role of RSL in pavement management business decisions is predicting the change in pavement condition as a function of time, traffic loading, and environment. The basic difference in the RSL models used at the project, network, and contract administration levels is data requirements related to level of technical detail, extent, quality, precision, and accuracy.
While the prediction of time until a construction treatment should be applied is a critical component at all levels of pavement management decisions, many issues exist in the current RSL terminology, which confuse, confound, and complicate proper interpretation, interagency data exchange, and use.
One common RSL definition is the time until the next rehabilitation or reconstruction event; however, these are two different events in terms of the condition of the pavement at the time of construction as well as the associated construction costs. Rehabilitation treatments are typically applied before a pavement has suffered extensive structural damage, while reconstruction treatments are generally warranted after a pavement has reached an advanced degree of deterioration. Attempting to interpret combined RSL estimates from mixed rehabilitation and reconstruction units provides little information to decisionmakers. Also, the timing of the next rehabilitation or reconstruction event will depend on what future lower-level treatments are applied.
Another common RSL definition is the time until a condition index threshold limit is reached. This definition not only has the same issues as rehabilitation and reconstruction RSL units, but it also introduces other service and safety condition indices that further complicate the meaning of RSL. Setting threshold limits for pavement conditions that are not based on human subjective ratings, such as cracking, can be complicated to justify. Moreover, interpretation of a single RSL

4
number becomes even more complicated when it is based on multiple condition states. For example, if RSL for roughness is 2 years, RSL for cracking is 5 years, RSL for friction is 7 years, and RSL for rutting is 20 years, expressing that the current pavement RSL equals 2 years can lead to faulty construction decisions since the construction treatment to correct roughness may ignore the more serious cracking issue expected to occur soon after the roughness threshold is reached. Since there are many construction treatments that can be used to correct excessive pavement roughness that can be classified as pavement preservation, this approach adds maintenance-type activities to RSL units.
Another intriguing aspect of RSL based on threshold limits is negative RSL. When a Pavement Condition Index (PCI) limit is reached, the number of years it remains in service after this time could be considered a negative service life, which is counterintuitive. One approach is to set negative values to zero, thus not allowing a negative RSL value to be provided by the process. Another approach is to consider negative RSL as overdue needs, in which case the number of years overdue can be considered as useful information to decisionmakers if they know the basis of the condition in need of attention.
Another approach to RSL is based on agency management rules on the time between applications of corrective pavement construction treatments. For example, a State highway agency (SHA) with a relatively small number of interstate highway lane-miles may decide, based on past performance, to apply a resurfacing, rehabilitation, or reconstruction treatment every 8 years to each construction segment unit on the system to keep their highest level functional class pavements in the best condition. The RSL becomes the difference in time between the construction frequency established and how long it has been since the last treatment was applied. While this approach simplifies the decisionmaking and project selection process, it does not typically result in the most cost effective solution.
An unintentional consequence of using current RSL terminology is that it tends to promote “worst-first” approaches to correcting pavement deficiencies. By expressing pavement condition in terms of RSL, it is expected that pavements in the worst condition get treated first; however, construction treatments on pavements in the worst condition tend to cost the most. Applying a life-extending corrective rehabilitation treatment before the pavement condition gets too bad tends to cost less than reconstruction treatments. Optimum allocation of annual pavement resurfacing, rehabilitation, and reconstruction budgets will include pavements with differing remaining lives and should not be based solely on a worst-first approach.
REFORMULATING RSL TERMINOLOGY
The objective of this document is to provide a definition and process for determining pavement RSL that will promote consistency in the use of the terminology. Currently, many RSL definitions are used to describe different events in the construction history of a pavement. Construction-related history best describes the use of RSL models at all levels of the pavement management decision process because the primary purpose of predicting pavement RSL within the context of pavement management is to plan for future field construction event(s) (i.e., maintenance, preservation, rehabilitation, reconstruction, or other treatments to correct some attribute of the pavement structure).

5
A major source of uncertainty in the current definition is the use of the term “life” to represent different points in the construction history. In the pavement design context, “life” is used to represent the time until the as-designed pavement structure reaches an unacceptable condition. In the pavement management context, after construction of the pavement structure, the as-constructed properties become more important in pavement life expectations than the assumed inputs into the original design process. A pavement structure can be thought of as a system whose components include subgrade treatments, subsurface drainage features, base layers, shoulders, bound structural load bearing layers, and surface layers. As a repairable system, the life of the system is not defined by correctable component failures.
The proposed solution is to remove the word “life” from the lexicon since it is the basis for confusion. Instead of using RSL, it is recommended to adopt the term RSI, which indicates the time remaining until a defined construction treatment is required.
Adoption of a definition related to construction treatments opens up the vocabulary to treatments related to other factors besides pavement condition. For example, if a construction cycle is defined in terms of the time until the next construction event requiring lane closures, then capacity improvements, shoulder widening, utility construction, and realignment construction activities can be included in the construction event. In turn, this broadens the application of the definition in the future. In some situations, capacity issues can have more of an effect on the service provided by a pavement structure than the condition of the pavement surface, or the pavement has reached a level where the next utility cuts and resulting repairs can be performed within a defined time period. This shifts the emphasis on the life remaining in a pavement structure to the time remaining until the next planned construction lane closure is required or future construction is needed.
REPORT ORGANIZATION
This report provides a more refined construction activity needs analysis terminology and approach to reduce potential confusion over the use of the RSL nomenclature. To accomplish this task, this report is organized into the following sections:
• Chapter 1 provides background information on the RSL concept and establishes the need to reformulate this concept.
• Chapter 2 discusses the basic process for determining future pavement construction needs, introduces construction event terminology, covers the framework associated with the RSI concept, and introduces the RSI implementation steps.
• Chapter 3 provides a step-by-step description of the process required to establish the RSI concept by SHAs, including construction triggers, threshold limits, expectancy curves, collection of inputs, strategy selection, and assessments and updates.
• Chapter 4 presents hypothetical examples to illustrate the RSI implementation process described in chapter 3.

6
• Chapter 5 discusses key issues surrounding the results generated within the context of the RSI framework.
• The appendix addresses generic issues associated with the implementation of the RSI concept within an agency. These issues are not part of the actual RSI implementation process, but they are critical to the success of an agency’s migration to the RSI concept.
These guidelines have been developed based on the results of the effort carried out under the Federal Highway Administration (FHWA) project, “Definition and Determination of Remaining Service and Structural Life.” These results have been documented in the FHWA publication, Reformulated Pavement Remaining Service Life Framework.(1) Users are encouraged to read this report prior to implementing the RSI concept, as it provides the foundations for the concept along with other valuable information such as basic pavement design and management concepts, RSL models, and the results of the literature review performed as part of the project.

7
CHAPTER 2. RSI CONCEPT OVERVIEW
CONSTRUCTION NEEDS PROCESS
The basic process used to determine future pavement construction needs is illustrated in figure 1. Most pavement construction activity planning is based on an annual fiscal time cycle used by an agency. The steps shown in this figure are cyclical and depend on the time cycle appropriate to the type of pavement asset. The process starts with input data that are fed into the expectancy model to predict future changes in the construction trigger models. The outputs from the predictions are used to select the most appropriate construction strategy, which is used to develop construction plans and specifications. The feedback cycle starts with documentation of the actual condition observed over time as well as the actual construction activities performed. Monitoring measurements provide updated inputs for the next planning cycle and also refine expectancy models.
Figure 1. Flowchart. Future pavement construction needs process.
Within the context of the process illustrated in figure 1, the fundamental elements required to replace the existing RSL terminology with the new RSI terminology include the following:
• A controlled vocabulary to define pavement construction events.
• A common basis for when the future construction event is needed.
• How future needs are determined to differentiate between different levels of business decisions.
• The location and extent of the needed treatment.

8
The logic of this structure is based on separating the definitions of what future construction event is needed from how the need is determined.
CONSTRUCTION EVENT TERMINOLOGY
The objective of construction event terminology is to uniquely define what type of predicted future construction event is needed. This vocabulary is needed to describe the construction treatments to promote database integration and increase levels of aggregation at local, district, State, and national levels. Moreover, the terminology requires the identification of three attributes: time when a treatment is needed, type of construction treatment, and reason for the construction treatment.
The time (or the year) when a treatment is needed is specified since this is the basis for budget planning. This is meant to replace prediction models based on traffic applications. Traffic application rates used in the modeling process need to be converted to a time basis. Converting traffic application rates to a time basis is a complex process based on considering the design lane (which receives the most truck loadings), multilane facilities, damaged lanes (which are the lanes in the worst condition), and other local factors that influence pavement damage from vehicle and environmental effects.
The following examples highlight definitions of construction events based on the expanded paradigm of common pavement improvements included in many pavement management systems (PMSs):
• Crack sealing: Application of sealants in surface cracks.
• Joint sealing: Application of sealants in preformed joints.
• Surface treatment: Application of a layer of material of intended uniform thickness less than 0.5 inches (12 mm).
• Thin overlays: Application of a material layer of intended uniform thickness greater than 0.5 inches (12 mm) and less than 2 inches (50 mm) and which does not increase the thickness of the bound material layers by more than 25 percent.
• Thick overlays: Application of a material layer of intended uniform thickness greater than 2 inches (50 mm) or increases thickness of bound pavement layers by more than 25 percent.
• Concrete pavement restoration (CPR): Application of full- or partial-depth joint repairs, slab replacement, dowel bar retrofit, or other restoration treatments.
• Grinding: Removal of portions of the surface layer of a pavement without placement of a new material layer.
• Grooving: Cutting grooves in the surface of a pavement without application of a new material layer.

9
• Milling: Removal of bound portions of a pavement that is associated with placement of a new material surface layer.
• Undersealing: Injection of cementitious material underneath bound pavement layers.
• Reconstruction: Removal and replacement of all bound layers of an existing pavement.
• Addition of lanes: Construction of additional lanes to the facility designed to permit greater traffic capacity.
• Addition of tied shoulders: Removal and construction of portland cement concrete (PCC) shoulders tied to adjacent PCC pavement structures.
• Shoulder widening: Extending the width of the existing shoulder with use of similar materials.
The definitions only describe what type of construction treatment is being applied to the pavement. An indication of the reason(s) why a future construction event is predicted is needed to complete the definition since pavement improvements are based on different needs. The following examples highlight controlled terminology that can be used to explain the basis of predicted time to a threshold event:
• Roughness exceeds y in terms of International Roughness Index (IRI). The y value is the generally accepted limiting value for pavement roughness in terms of IRI.
• Cracking exceeds the limit requiring major rehabilitation.
• Cracking exceeds the limit requiring reconstruction.
• Rut depth correction requires major rehabilitation.
• Rut depth correction requires reconstruction.
• Skid resistance reaches the safety limit.
• PCI reaches threshold x. For systems based on a PCI-based index, x represents the various thresholds between rehabilitation and reconstruction.
• Pavement serviceability rating (PSR) reaches x. For systems still using the PSR/Present Serviceability Index (PSI) concept, x is the terminal serviceability value considered by the agency appropriate for the route.
Typically, an agency will develop a decision matrix to use as part of its pavement management process. This matrix will associate types of pavement deficiencies requiring construction actions with types of construction best suited to correct them. For example, if the roughness exceeds the IRI threshold, then a typical approach would be placing an overlay to correct the roughness.

10
RSI IMPLEMENTATION FRAMEWORK
The framework for implementing the new RSI terminology is illustrated in figure 2. The key components of the framework that must be addressed by SHAs to develop, implement, maintain, and update a construction needs analysis methodology that includes generic agency and RSI implementation issues.
These components should be tailored to the individual agency requirements related to budgeting process, types of pavements in use, common types of pavement deficiencies requiring correction, construction contract instruments, and other considerations.
The generic agency issues address the establishment of the agency’s RSI protocol, the identification of an RSI coordinator, and the dissemination of the RSI concept within the agency. These issues only need to be addressed once, with periodic monitoring and revising to ensure they are still appropriate; however, they are vital to the success of an agency’s RSI program. These generic agency issues are discussed in more detailed in the appendix.
Figure 2. Flowchart. Agency RSI implementation.
The RSI implementation issues focus on a step-by-step approach that is necessary to successfully establish the RSI concept within the agency. These RSI implementation steps are discussed in the following two chapters of this report.
1. Construction triggers, 2. Threshold limits, 3. Expectancy curves, 4. Collection of inputs, 5. Strategy selection, and 6. Assessments and updates
1. RSI Protocol 2. RSI Coordinator 3. RSI Dissemination
Generic Agency Issues
RSI Implementation Issues

11
CHAPTER 3. IMPLEMENTING THE RSI CONCEPT
The first step in implementing the RSI concept is deciding that a change is needed in how an agency presents pavement construction needs to different departments within the agency and to decisionmakers as well as understanding the benefits of interagency information exchange. The RSI concept is based on the technical aspects of when, what, and why future construction treatments are required. Conversely, the RSL concept acts as an overall measure of the system life status based on hidden factors not properly expressed. The RSI concept creates a rational basis for applying modern risk-based models, which address the variability inherent in current condition measurements, future condition predictions, and resulting economic impacts of pavement management decisions. This allows for the creation of multifaceted pavement performance measurements tools that are based on more than simple pavement condition indices.
It is recommended that SHA personnel responsible for implementing the RSI concept undertake the following steps before proceeding with the six implementation steps:
• Review Reformulated Pavement Remaining Service Life Framework.(1)
• Review the guidelines contained in this document.
• Hold a brainstorming meeting with agency pavements program stakeholders to discuss the various RSI elements, issues, and implementation steps.
This chapter addresses the following six steps to successfully implement the RSI concept by a highway agency, including alternative options within each step where applicable:
1. Setting construction triggers.
2. Setting threshold limits.
3. Selecting or developing expectancy performance curves.
4. Identifying collection of inputs.
5. Establishing a strategy selection process.
6. Performing periodic assessments and updates.
The steps are presented in a logical sequence, but this does not imply that they are independent of each other. For example, setting construction triggers in step 1 or setting threshold limits in step 2 cannot be done independently of selecting the expectancy performance curves in step 3.
STEP 1—SETTING CONSTRUCTION TRIGGERS
Construction triggers are measureable aspects of a pavement’s condition that can be used to indicate the need for corrective treatment. Selecting construction triggers is the basis for

12
developing field data collection programs to measure the condition state of each pavement segment. Some considerations in selecting construction triggers include the following:
• Historical practice.
• Related agency practice.
• Extent of the pavement network being managed.
• Data collection budget.
• Types of pavements or family of pavements managed by the agency.
• Required measurement accuracy, precision, and detail.
• Functional class of pavements in the network.
• Common distress manifestations.
• FHWA Highway Performance Monitoring System (HPMS) reporting requirements.
Construction triggers that may be considered by an individual SHA based on its current or planned pavement practices include the following:
• Level of service: These triggers are primarily based on human factor ratings of the pavement serviceability and measurement of pavement roughness. The use of pavement roughness as a primary indicator of level of service is originally based on the American Association of State Highway Officials Road Test conducted in the late 1950s.(2) Currently, pavement roughness, expressed in terms of the IRI, is the most common measure of pavement level of service.
• Pavement surface distress: While national standards exist for more than 15 possible types of pavement distress attributes for each type of pavement, they are not all typically required for pavement construction decisions. Reducing the number of distresses to a small number of core distresses can reduce field data collection costs. Methods that can be used to create construction triggers based on pavement distress measurements include the following:
o Survey the predominant types of distresses common to an area or region that deteriorate the quickest and require construction intervention to correct.
o Use the predicted distress types from the pavement design method.
o Create or use an existing numerical index based on assigning deducting values for the type, extent, and severity of a selected range of distresses.
o Develop a correlation between distresses and level of service indicators.

13
o Associate distress types with corrective treatments (e.g., potholes can be corrected with patches, while severe fatigue cracking usually requires pavement reconstruction).
• Structural considerations: These considerations are typically based on certain types of distress and non-destructive pavement deflection testing. Common distresses associated with pavement structural integrity include cracking in the wheel path (fatigue cracking), corner cracks on jointed PCC pavements, faulting on jointed PCC pavements, punch outs on continuously reinforced concrete pavement, and rutting associated with subgrade and base instability. Conversely, deflection measurements can be used as a diagnostic tool to look below the pavement surface to get an indication of subsurface damage. Pavement structural information from deflection measurements include the following:
o Modulus (stiffness) of the pavement foundation layer (subgrade).
o Indicators of the relative stiffness of the surface and base layers.
o Load transfer across joints and transverse cracks in PCC pavements.
o Stiffness characterization of distinct pavement layers.
o Effective structural capacity of pavement based on the 1993 American Association of State Highway and Transportation Officials (AASHTO) Guide for Design of Pavement Structures or other methodology.(3)
• Safety aspects: Pavement condition safety aspects are primarily related to friction and hydroplane potential. Pavement friction characteristics are most often characterized using a skid number parameter. Hydroplane potential is related to ponding of water on the pavement surface due to the ability of pavement ruts to hold water or drainage defects in the surface profile. The nominal depth of water can be associated with hydroplane potential based on the speed limit. Another pavement condition related to safety concerns is excessive pavement roughness relative to the speed limit. It is possible for localized bumps, dips, faults, and holes in the pavements to reach a level that negatively influences vehicle control.
• Agency time-based rules: One of the simplest construction needs triggers is the time since the last construction treatment. Some agencies have implemented rules on the maximum time between construction events. The time-based rules are intended to reduce field measurement costs and provide a proactive pavement management approach to keep pavements in good working condition.
• Traffic capacity: In changing the definition of RSL to one that is related to assessing future construction needs, it is important to identify when a roadway needs to be expanded due to traffic growth. These types of rules are generally outside the realm of pavement management, but they are required when developing an estimate of future budget needs.

14
STEP 2—SETTING THRESHOLD LIMITS
Threshold limits are used to indicate when a construction trigger reaches a condition and when a corrective or preventive construction treatment is needed. There are two general types of threshold limits: one related to road users and one based on agency economics. For example, ride quality, rutting, and skid resistance are related to road users, while cracking and faulting (although it impacts ride quality) are related to agency economics and should ideally be based on LCCs. The specific methods and procedures that can be used to establish the various types of threshold limits include subjective, engineering, empirical, economic analysis, and a combination, which are described in the following subsections.
Subjective Approach
Subjective approach threshold limits are based on ratings from a panel of judges comprised of laymen facility users, pavement experts, or a combination. Generally, a formal rating scale is created and used by the judges, and statistical methods are then used to interpret the ratings and establish limits. Subjective ratings can be used to define an absolute acceptable limit or degrees of acceptability for a measured condition attribute. The following acceptance scales can be used to capture subjective panel ratings:
• Binary or two-level acceptable/not acceptable or pass/fail rating scale: While this type of forced choice acceptance scale purposefully limits the range of response to identify the acceptance threshold, it also limits analysis of the results.
• Five-level Likert scale: The five-level Likert scale provides a measure of the range in acceptance criteria to be considered (e.g., 5 = totally acceptable, 4 = slightly acceptable, 3 = neutral or not sure, 2 = unacceptable, and 1= totally unacceptable).
• Four-level Likert scale: The four-level Likert scale removes the neutral middle rating to force raters to provide either an acceptable or unacceptable rating (e.g., 4 = totally acceptable, 3 = slightly acceptable, 2 = unacceptable, and 1= totally not acceptable).
The degree of acceptability can also be based on a Likert scale by altering the definitions of the ratings (e.g., 5 = very poor, 4 = poor, 3 = fair, 2 = good, and 1 = excellent). In this example, to improve the repeatability of the results, it is useful to provide the raters with a more refined definition of each category that is related to the attribute of interest.
Engineering Approach
Considerations used to establish these threshold limits are based on pavement performance mechanistic concepts or pavement-vehicle interaction factors. Examples of engineering considerations include the following:
• Cracks extend completely through bound pavement layers.
• Potential depth of water held in ruts.
• Depth of top-down cracks on asphalt concrete pavements.

15
• Increase in applied dynamic truck loads caused by pavement roughness.
• Pavement structural capacity diminished to the point where stress and strain level of applied traffic loads accelerates pavement damage.
Empirical Approach
The empirical approach to setting threshold limits is based on observing events. A critical aspect to this approach is that it is most applicable to the inference space of the observations from which they were developed. Technology advancements or other changes that are outside of the inference space of the original observations can limit the applicability of existing empirical models to future events. Examples of empirical approaches used to setting threshold limits include the following:
• Analysis of friction data and associated accident rates or field experiment to set a safe level of friction.
• Statistical analysis of the pavement condition when construction treatments have been applied and their effectiveness (as a function of condition) when they were applied.
The advantage of this approach is that it does not require a thorough understanding of the mechanism being modeled. For example, it may be postulated that the accident rate on a section of roadway is related to the level of friction offered by the pavement surface. It may also be recognized that the accident rate on this same section of roadway is related to the speed of the vehicles traveling that roadway. With an empirical approach, it is not necessary to fully understand all of the mechanisms associated with the accident rate; rather, the correlation of the friction with the accident rate can assist in identifying an unacceptable level of friction on the roadway.
Economic Analysis Approach
Construction limit thresholds can be developed from an economic analysis of construction time-series costs over a long-term period. This analysis depends on knowing or estimating how long alternative construction treatments will last based on the predicted condition of the pavement at the time of the treatment and the cost of the construction treatment. A critical factor in pavement construction time-series economic analysis are the rules concerning deterioration rate of the pavement, what type of repair treatments are considered, the effect pavement condition has on the resulting performance for each repair treatment, and costs included in the analysis. To avoid manipulating the results from pavement LCC analysis, SHAs need to create a set of rules. To the extent possible, these rules should be based on observations from pavements under agency jurisdiction. However, the use of engineering judgment based on available data may be the best option to create the rules. Establishing a preliminary set of rules provides a basis to evaluate and update them based on experience. Part of the rules should be standard estimates of error and error distribution forms for use in stochastic/risk-based analysis. Figure 3 illustrates the expected outcome of an economic analysis on the most cost effective repair strategies as a function of pavement condition for an individual pavement.

16
Figure 3. Graph. Conceptual relationship between agency repair costs as a function of
pavement condition.
Combinations Approach
Under this scenario, the development of threshold limits is done through a combination of the approaches previously described. The recommended approach to setting threshold limits on need for corrective construction intervention is by using a combined engineering economic approach. The objective should be to determine condition states where maintenance or preservation treatments, rehabilitation treatments, and reconstructive treatments are most cost effective. Considerations to determine appropriate pavement state thresholds for application of maintenance or preservation treatments include the following:
• Preservation maintenance treatments should be applied while a pavement is still in relatively good condition. When possible, the upper limit should be based on specific pavement defects which can be corrected to a good-as-new condition without the need for structural restoration treatments. If aggregated distress-based indices are being used, then an expert subjective option can be used to determine a nominal threshold value when preservation maintenance activities can be used. Figure 4 illustrates the general concept of applying corrective pavement treatments as a function of pavement condition.
• A strategy for setting threshold limits for the lower limit of a pavement condition is by considering when the extent and severity of distress types require corrective treatments that can be considered as structural improvements. Some consideration examples include the following:
o The number of locations per mile requiring full-depth repair exceeds 10–30 percent of the surface area depending on the pavement and distress type.
o The extent of faulting of jointed PCC pavement requires a combination of grinding, ultra-thin overlays, and dowel bar retrofit to correct.

17
o The severity and extent of alligator or fatigue-related cracking in the wheel paths requires full-depth patches on more than 10 percent of the section length.
• When structural and restoration treatments cost less than alternative spot repairs.
• When pavement roughness reaches a level that it causes a significant increase in vehicle operating costs.
Figure 4. Graph. Three treatment zones as a function of pavement condition.
A common rule of thumb is that an overlay thicker than 2 inches (50 mm) is considered to be a structural improvement regardless of the depth of material milled from the pavement surface. Another common threshold rule used is that when the treatment cost rises to a certain level set by the agency, it is considered a capital improvement project and requires formal engineering plans and specifications. Like definitions of preservation maintenance, the definition of pavement rehabilitation is also dependent on available funding agency sources. The upper pavement condition threshold limit for rehabilitation is based on when preservation maintenance is no longer effective. Lower limit rehabilitation pavement condition thresholds are based on when reconstruction becomes the most cost effective treatment. There are also situations when structural defects may require reconstruction to correct even though all other functional aspects of the pavement are acceptable.
STEP 3—SELECTING OR DEVELOPING EXPECTANCY PERFORMANCE CURVES
Expectancy performance curves are used as a means to predict the time when a pavement’s condition will reach a construction trigger threshold. While measuring the pavement condition can be used to respond to current conditions, long-term planning of future needs and optimization requires predicting future pavement changes.

18
A key consideration in developing performance curves is grouping pavement types into categories of pavement families. A pavement family is a group of pavement structures constructed with similar structural materials, construction methods, pavement components, and experience loading conditions and that are expected to have a common set of distress mechanisms. The number of pavement families that should be used depends on the diversity in types of pavement structures with an agency’s jurisdiction and the amount of time history data available for each defined family of pavements.
The best state-of-the-practice is to base performance expectancy curves on the analysis of pavement performance history observations. This requires the availability of uniform long-term time-series data on pavement condition that are linked to measured pavement features that permit the application of mechanistic-based performance models. When empirical data are not available to formulate proper statistical models of future performance, expected performance curves can be used as a surrogate starting point to judge the relative performance of pavements. For example, the knowledge of engineers with long-term experience in a region can be used as a surrogate starting point. While the use of expert subject opinion can be used as a starting point to create expectancy curves, the curves should be updated over time with field measurements to improve their accuracy and applicability. Potential expectancy curve options include models based on design equations, empirical models, and agency time-based rules.
Models Based on Design Equations
Expectancy performance curves used for pavement design can be different than those used for pavement management. Nonetheless, they can be used for pavement management. Examples of models based on design equations include the following:
• Models based on the 1986 AASHTO Guide for Design of Pavement Structures and subsequent updates have been used by some agencies (see figure 5).(4) Pavement condition is expressed in terms of PSR or PSI, and resurfacing or reconstruction is indicated by the PSR level. When the predicted pavement PSR in an analysis cycle drops below a minimum tolerable condition based on highway functional classification, then resurfacing is indicated. Reconstruction is triggered if the PSR drops below the lower rehabilitation threshold if the section was not previously selected for resurfacing. While these models are still being used by some agencies, because PSR is used to measure pavement condition, it is not a good measure of what future construction treatments are required since it is most sensitive to pavement roughness.
• FHWA developed a set of expectancy performance curves based on the AASHTO Mechanistic-Empirical Pavement Design Guide (MEPDG) for use in the pavement health track (PHT) analysis tool.(5) Simplified models based on use of the default level 3 MEPDG inputs along with the HPMS data are used to predict changes in multiple pavement condition measures adjusted for current and past observed levels. They include pavement distress and roughness prediction models. Figure 6 illustrates a hypothetical distress-based pavement design approach consisting of pavement roughness and two distress types. The use of specific types of pavement distresses as construction triggers at the network level allows greater flexibility in assigning and costing future construction needs. This permits the application of automated rational decision tree

19
logic to select appropriate treatments based on multiple aspects of pavement condition. Moreover, models such as these can be simplified to a level commensurate with intensity of data collection and sensitivity of business decisions.
Figure 5. Graph. Illustrated service histories of trial pavement designs incorporating future
overlays.(4)
Figure 6. Graph. Multiple distress-based pavement design where one of the distresses
reaches a maximum threshold limit.

20
Empirical Models
These expectancy performance curves are based on observations of events. The following list summarizes empirical approaches to modeling pavement performance:
• Survivor curves: The various approaches to development of survivor curves based on life table, Kaplan-Meier, or failure time theory approaches are based on the prevailing definition of pavement death as defined by each agency. These legacy survivor curves have been replaced with more modern engineering change of state models that can be used to estimate future construction needs not properly reflected by the variability in past definitions of pavement death.
• Failure Cox Proportional Hazard model: This statistical model form is recommended as the basis for future development in empirical expectancy curves for pavement management applications. The approach is well suited for pavement performance management data.
• Numerical regression models: These models are based on finding the best numerical functional form that describes the variation in the relationship between variables being compared. Regression models only describe the numerical relationship in the available observation data and are most applicable to that inference space. Extrapolation beyond the inference space should include an estimate of the magnitude of variability in the prediction.
• Bayesian statistical updates: Updating prior models with new data can be based on Bayesian statistical concepts. A key component in Bayesian statistics is the comparison of weight given between prior and posterior observations.
• Neural network models: These models are inspired by the way biological nervous systems, such as the brain, process information. They have the capability to fit the variations in observed data that is not possible by using traditional numerical regression techniques. Research to extract information from neural analysis similar to that inferred by numerical regression based model forms is being pursued.
Some measure of variability distribution from function and relevant factors should be contained in all predictions of future pavement condition states. These measures can be used to accumulate future risk probabilities in the prediction based on the variability in the input parameters and prediction models.
Agency Time-Based Rules
The simplest future expectancy performance curve is a time-based rule for future construction. This type of rule does not require investing in field measurement devices and custom computer programs to predict future events. However, this approach does not provide a basis for optimizing utilization of constrained agency resources. An example of a time-based rule is that an agency decides that some type of corrective construction treatment will be applied on its rural interstates every 8 years. The network is segmented into contiguous projects, and a construction

21
rotation sequence is established. An appropriate correction strategy is selected and applied during the target construction year. Thus, the expectancy curve for the time until the next construction event is the time remaining until the next target construction year.
STEP 4—IDENTIFYING COLLECTION OF INPUTS
Collecting data on the condition state of pavements under an agency’s jurisdiction should be based on the same construction triggers that form the basis for local decisions on corrective construction needs. Field data collection on current pavement conditions should properly be used to determine the impact of the data element on future construction requirements based on the current construction triggers. This effort is complicated with the need to adapt past and new pavement condition measurement practices.
The current challenge to SHAs is integrating, adapting, and adopting advancements in measurement of the physical features of pavement assets to legacy management systems. The development of datasets to establish expectancy curves of the long-term performance of a pavement requires a uniform set of data based on uniform measurements. Since common past pavement design practice was based on a 20-year life span, developing datasets with consistent data over this type of timeframe is difficult at best. This challenge will continue since emerging practice is to design some pavements with even longer lifetimes (i.e., 50 years).
Pavement Roughness
The use of high-speed longitudinal pavement profile equipment has become the generally accepted industry standard for measuring pavement roughness. The measurement technique is based on using an inertial profiler, which measures the change in longitudinal profile in the wheel paths at or near the speed limit. Roughness indices are computed from this profile and summarized at user-defined intervals. IRI is one of the most commonly computed pavement roughness measures. Other pavement condition feature measures and indices can be computed from this type of profile data such as the roughness index, half-car roughness index, ride quality index, ride number (RN), profilograph index, rolling straight edge simulation, bump/dip detection, fault heights on jointed PCC pavements, slab curvature on jointed PCC pavements, and heavy truck dynamic loading index. If pavement roughness measurements are performed using inertial longitudinal profiler devices, as shown in figure 7, both network- and project-level data requirements can be satisfied using this common set of data.
Figure 7. Photo. Inertial road profilers used to measure IRI, RN, and other
roughness indices.

22
Pavement Distress
Distress ratings can be performed by human raters driving on the pavement network using a manual process, a semi-automated process where field collected images are interpreted by human raters in an office, or fully automated systems. Manual pavement distress measurements require raters to drive each route and typically cost the most, put raters at risk (raters must drive and get down on the road to note any necessary information), and generally have the greatest variability in the ratings. In the semi-automated process, pavement distress ratings are performed using field video images, which reduce the risk to the raters and provide a historical archive of images for use in project-level investigations. Fully automated pavement distress ratings systems use computer algorithms to interpret distresses obtained from field images and/or three-dimensional measurements. It offers the potential to reduce the cost of acquiring distress data by eliminating the need for human interpretation. The newer three-dimensional imaging technology, which assigns a depth to image pixels, provides a more robust dataset that can be used for pavement cracking, rutting, and possibly pavement roughness measurements.
Pavement Structural Response
Deflection measurements are used to measure the response of a pavement structure to a known applied load. Interpretation of the resulting deflection data ranges from the identification of weak spots to advanced non-linear characterization of the engineering properties of pavement material layers.
Deflection measurement devices (e.g., falling weight deflectometers (FWDs) as shown in figure 8) currently used in practice must stop at each measurement location, which requires traffic control. To overcome traffic control requirements, agencies are in various stages of developing and implementing modern moving deflection measurement devices. The rolling wheel deflectometer can travel at highway speeds and does not require traffic control. While the maximum deflection measured by this device is useful in locating weak locations for follow-up studies, it does not provide additional analytical capabilities offered by devices that measure the shape of the deflection basin. The traffic speed deflectometer (TSD) is another type of moving deflection device that has sensors that measure the shape of the deflection basin (see figure 9 and figure 10).
To ensure accuracy of data interpretation using pavement deflection response devices, it is important to know the pavement thickness and types of near-surface material layers. Manual measurement techniques of pavement thickness are being replaced by automated ground penetration radar (GPR) technology. Pavement deflection measurements are mostly performed at the project level to develop design specifications for the most appropriate construction treatment. However, justification for network-level pavement deflection measurements can be based on the additional refinement in the decisionmaking process resulting from the ability provided by these data to determine the cost of future construction activities.

23
Figure 8. Photo. FWD used for structural evaluation.
Figure 9. Photo. TSD used for structural evaluation.
Figure 10. Photo. TSD internal pavement response measurement instrumentation.
Traffic Loads
For pavement management purposes, the preferred practice is to use weigh-in-motion (WIM) scales at non-enforcement locations to measure actual pavement loads as opposed to legally enforced loads. In order to accurately predict future pavement performance, engineers need to

24
know actual heavy loads being applied to a pavement. Access to permitted overloads granted by other divisions within an SHA to the pavement management division could be important to determine the need for future construction intervention events.
At the network level, measuring the type of trucks on a route is more important than the weight of the trucks. This is based on the observation that truck weights are determined by the type of truck. This can simplify measuring heavy trucks into loaded and unloaded classes based on the simplest of WIM technology as shown in figure 11. Within a localized region, a typical heavy load truck profile can be applied to trucks in the same classification with an acceptable level of uncertainty. Project-level measurement of truck axle loads is almost never performed for pavement engineering purposes.
Figure 11. Photo. WIM sensor used to record truck axle and gross vehicle weights.
Climate
Climate data are at best a second-order consideration in the planning of future construction needs. Climate data measure potential climate-related “loads” such as freeze-thaw cycles and temperature-induced stresses that a pavement may need to resist based on material properties (as affected by climate) and constructed drainage features. Predicting future climate changes and accounting for is not currently incorporated in most pavement management models. The best source of historical raw climate data in the United States is available from the National Climate Data Center (NCDC). Figure 12 shows a mini seasonal monitoring program (SMP) weather station, which is an example of equipment used to collect climatic data.
Figure 12. Photo. Mini site-specific SMP weather station used to record climatic data.

25
In addition to the data inputs themselves, it is also important to give serious consideration to the following data-related issues:
• Missing data: All infrastructure management systems require a mechanism to handle missing measurement data. One approach is based on the truth-in-data concept in which all data are labeled as observed or imputed. Imputation of missing data based on defined and documented methods is acceptable, provided imputed quantities are appropriately identified. The best practice is to associate a measure of variability with both measured and imputed condition state parameters. It is expected that the variability of imputed parameters will be greater than those based on measurements.
• Measurement variability: A requirement for all input measurement methods is to provide a measure of variability related to their use in prediction models. These measures of variability should be propagated through the models used to predict future pavement condition states to create a posterior probabilistic-based expectancy curve of future condition state. Variability measures should include repeatability of the measurement method, be partitioned by spatial variation in the pavement response, and reflect the sensitivity of the prediction model to resulting damage estimates.
• Sampling intervals and frequency: Collecting pavement condition data on a partial sample of the network is typically used to reduce data collection costs. While sensor data such as pavement roughness and rutting are collected continuously, distress data are often obtained on a sample basis. For manual condition surveys, field crews travel between selected portions of the roadway on which the distress surveys are performed. For semi-automated distress surveys where interpretations of distress are made from video images, only a portion of the video image may be interpreted on a sample basis. The condition ratings from these samples are then used to represent the condition of a larger pavement segment. Most agencies use monitoring frequencies of 1, 2, or 3 years between pavement condition measurements. For cracking, a 1-year frequency appears to be the best so that the first appearance of cracking can be detected in order to fit an appropriate model for cracking prediction. Monitoring of IRI using automated sensor readings could be on a 1- or 2-year interval. A study by Baladi concluded that longer intervals for crack monitoring may cause an overestimation of agency costs for pavement repair at the network level, while longer intervals than suggested for IRI monitoring may result in an underestimation of costs.(6)
STEP 5—ESTABLISHING A STRATEGY SELECTION PROCESS
In order to select the most appropriate corrective pavement construction strategies, many considerations must be taken into account, beginning with the pavement condition subject to other constraints such as budget, bridge height clearance, guard rail adjustment, buried utilities, etc. At the pavement network level, the objective is to characterize the current and future condition state of pavements included in the system that require corrective treatments. At the project level, the objective is to provide detailed decisions on what corrective construction treatments are needed for each project identified from the network-level analysis.

26
The current challenge to highway agencies is to create a rational basis to move from a worst-first to a best-first (i.e., based on lowest LCC or other optimization technique) allocation of available agency repair resources. The application of corrective construction treatments at the proper time can extend the time until more costly treatments are required. These optimal treatments are applied before too much damage has accumulated and hence the pavements are not in the worst condition. To find these favorable pavement conditions at the optimum time requires knowledge of how a pavement will respond to the prescribed treatment plan based on its current condition.
There are also situations within a pavement network where pavements in a worse condition state should be allowed to continue to deteriorate. This type of decision is appropriate for pavements that have accumulated significant structural damage but are still smooth and provide adequate service otherwise.
The remainder of this section provides additional guidance concerning the network versus project analysis strategy selection process.
Network Analysis
At the pavement network level, the objective is to characterize the current condition state of pavements included in the system that require the consideration of appropriate corrective treatments. Since network-level data tend to be more aggregated and less specific in comparison to project-level data, the expectancy models used to predict performance can have greater variability. Likewise, strategy selection may be broken down into broad categories using a standard set of cost assumptions based on the treatment type.
The recommended practice at the network level is to use LCC concepts to optimize the selection of construction projects in the next cycle and forecast future construction needs. LCC concepts consider multiple streams of future construction activities driven by predicting future changes in pavement states. Optimization is based on an objective function whose performance is based on measured field conditions and main factors that are sensitive to future construction activities. In a simple system, optimization is achieved when the best performance of the system is obtained using the available budget.
The pavement performance concept considers the time-history of a chosen functional aspect of a pavement. Serviceability has been used in the past using a scale—the lower the number, the worse the pavement condition. Using this type of scale, the objective function could maximize the area under of the serviceability-time history curve. If a numeric such as IRI is used, optimization of the objective function should focus on minimizing the area under the IRI-time curve since IRI uses an increasing scale where higher numbers indicate pavements in worse condition.
The limitations of construction strategy selection at the network level are based on the sophistication of the system processes. It is not uncommon that the construction cost assumptions used in the network optimization planning processes do not match those developed from project-level design considerations. Continual improvements are being made to field data collection techniques, construction cost models, and new expectancy prediction curves. Modern automated field data collection systems are capable of providing greater amounts of data with specificity

27
that approaches what used to be considered project-level data. In order to use this increase in data availability from network-level measurements, updates to the sophistication of the construction triggers, threshold limits, and expectancy curves are required.
Strategy selection analyses at the network level are primarily based on computer algorithms capable of taking into account all of the factors included in the simulation of future pavement condition states and performing the millions of calculations for impact of alternative strategy scenarios needed for optimization of available budgets.
Project Analysis
Project-level analysis is based on indepth considerations of pavement conditions after a network-level planning process has identified a pavement segment in need of corrective construction. The first level consideration determines the construction need as well as the maintenance, restoration, resurfacing, rehabilitation, or reconstruction needs. The most significant difference between network- and project-level strategy selection is that project-level decisions are based on human interpretations of available data and information as opposed to reliance on automated computer algorithms.
At the project level, LCC analysis can be supplemented with cost engineering considerations specific to each project site. Cost engineering concepts require more intensive inputs on the resulting effects of alternative design considerations than those generally available at the network level. This level of consideration is based on a cost/benefit analysis of alternative construction treatments based on a greater range of treatments options.
Project construction programming is the last chance to integrate other related infrastructure constructions needs into managing pavement assets. In urban areas, the timing of new utility cuts into a pavement structure should be coordinated with repaving events. Having a utility company perform changes to a pavement structure less than 3 years since the last construction event is often an indication of lack of coordination between publically funded city/regional departments. Studies on the impact of the repair of utility cuts in pavements have shown that they return the pavement to less than as new condition and can advance deterioration of the surrounding pavement structure.
STEP 6—PERFORMING PERIODIC ASSESSMENTS AND UPDATES
Modern quality management system concepts are based on a continual cycle of assessments and updates. All systems require formal assessments. Based on the results of the assessments, updates are performed.
Assessments
Regardless of the age of a management system, formal assessments should be performed at periodic intervals to identify improvement opportunities. Assessment tactics may include using panels composed of internal agency staff and external peer review experts. While internal review panels provide recommendations based on the current system, external peer reviews can provide lessons learned from the experience gained from use of other management methods.

28
Updates
As new materials and construction methods are implemented, the models used for both planning and designing need to be updated based on field observations. Creating a proper database designed to document past construction needs and planned construction needs is the recommended approach for updating the various elements included in the management system.

29
CHAPTER 4. RSI IMPLEMENTATION EXAMPLES
This chapter further describes the implementation steps introduced in chapter 3 to reinforce the RSI concept and process. Specifically, three hypothetical examples addressing the six RSI implementation steps are provided for illustration purposes.
LCC analyses are used as part of step 5 in the three examples; it is assumed that they are performed on each set of viable construction events described in the respective examples and that the lowest LCC scenario from the possible combinations of constructions events is selected for the pavement segment in question. Because of their importance to RSI, LCC considerations are discussed in a separate section at the end of this chapter.
EXAMPLE 1—SHA USING PHT ANALYSIS TOOL
Background
The PHT analysis tool was developed by FHWA for the Highway Economic Requirements System and the National Pavement Cost model, but it is also used by other SHAs. It is an engineering software application used for determining and reporting the health of pavement networks. The pavement models used in this tool are based on concepts developed for the AASHTO MEPDG, but they have been simplified (both models and procedures) for purposes of the tool.(5) Both structural (distress) and functional (IRI) pavement performance models are included in the tool. The primary source data for the tool is the 2010+ version of the HPMS program data tables. Data items (state or material type defaults) not provided by the HPMS program but are required by the new pavement models are provided as default data tables developed mostly using Long-Term Pavement Performance data and MEPDG default data tables. Alternatively, an SHA can input data from its PMS.
In this example, the RSI concept is adapted by an SHA using the PHT analysis tool within the context of pavement network-level analyses, where the network is comprised of primary routes (i.e., State routes). To limit its scope, only composite hot mix asphalt (HMA) overlays on jointed plain concrete pavements (JPCPs) are addressed in this example.
RSI Implementation
1. Setting Construction Triggers
The PHT analysis tool makes use of simplified MEPDG pavement performance models. Accordingly, the construction triggers for HMA/JPCP pavements are reflection cracking and pavement smoothness (IRI).
2. Setting Threshold Limits
Because the RSI concept is adapted for pavement network-level analysis, threshold limits have been established for the following construction events:
• Do nothing.

30
• Corrective maintenance (crack filling, patching, etc.).
• Rehabilitation (mill 1-inch (25-mm) plus 4-inch (100-mm) HMA overlay).
• Reconstruction (removal and replacement down to the subgrade).
The resulting construction trigger-threshold limits matrix for reflection cracking or IRI is provide in table 1.
Table 1. Reflection cracking or IRI construction triggers-threshold limits.
Construction Event Reflection Cracking
(percent) IRI, inches/mi (m/km) Do nothing No cracking < 90 (< 1.42) Corrective maintenance > 0 to 15 percent 90 to 150 (1.42 to 2.37) Rehabilitation 15 to 25 percent 150 to 250 (2.37 to 3.94) Reconstruction > 25 percent > 250 (> 3.94)
3. Selecting or Developing Expectancy Performance Curves
Simplified MEPDG reflection transverse cracking and smoothness (IRI) models are used in the PHT analysis tool for HMA/JPCP pavements. Accordingly, these models are used in this demonstration of the RSI concept. The reflection cracking model is given as follows:(5)
Figure 13. Equation. Reflection cracking model.
Where:
RCRK = Percent of cracks reflected (percent area of reflection cracking assumes a reflected crack width of 1 ft (0.305 m)). AGE = Pavement age (years after asphalt overlay placement). a = 3.5 + 0.75 × Heff. b = -0.688 − 3.373 × Heff − 0.9154. c = 1.0. Heff = HHMA − 1 (for JPCP with good joint load transfer efficiency (i.e., faulting < 0.03 inches (0.76 mm)) or HHMA − 3 (for JPCP with poor joint load transfer efficiency (i.e., faulting ≥ 0.03 inches (0.76 mm)). HHMA = Asphalt layer thickness.
The values of the reflective cracking model parameter d are presented in table 2.
RCRK = 100
1+2.718a (c)+ b(AGE)(d)
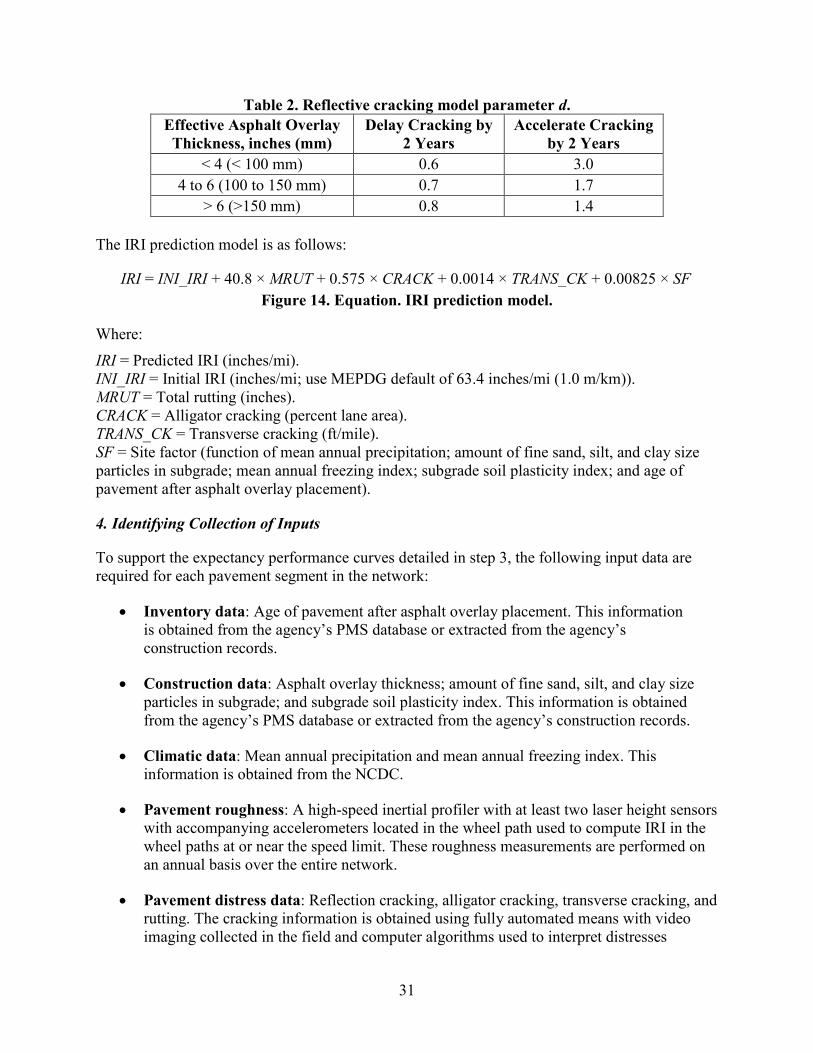
31
Table 2. Reflective cracking model parameter d. Effective Asphalt Overlay
Thickness, inches (mm) Delay Cracking by
2 Years Accelerate Cracking
by 2 Years < 4 (< 100 mm) 0.6 3.0
4 to 6 (100 to 150 mm) 0.7 1.7 > 6 (>150 mm) 0.8 1.4
The IRI prediction model is as follows:
Figure 14. Equation. IRI prediction model.
Where:
IRI = Predicted IRI (inches/mi). INI_IRI = Initial IRI (inches/mi; use MEPDG default of 63.4 inches/mi (1.0 m/km)). MRUT = Total rutting (inches). CRACK = Alligator cracking (percent lane area). TRANS_CK = Transverse cracking (ft/mile). SF = Site factor (function of mean annual precipitation; amount of fine sand, silt, and clay size particles in subgrade; mean annual freezing index; subgrade soil plasticity index; and age of pavement after asphalt overlay placement).
4. Identifying Collection of Inputs
To support the expectancy performance curves detailed in step 3, the following input data are required for each pavement segment in the network:
• Inventory data: Age of pavement after asphalt overlay placement. This information is obtained from the agency’s PMS database or extracted from the agency’s construction records.
• Construction data: Asphalt overlay thickness; amount of fine sand, silt, and clay size particles in subgrade; and subgrade soil plasticity index. This information is obtained from the agency’s PMS database or extracted from the agency’s construction records.
• Climatic data: Mean annual precipitation and mean annual freezing index. This information is obtained from the NCDC.
• Pavement roughness: A high-speed inertial profiler with at least two laser height sensors with accompanying accelerometers located in the wheel path used to compute IRI in the wheel paths at or near the speed limit. These roughness measurements are performed on an annual basis over the entire network.
• Pavement distress data: Reflection cracking, alligator cracking, transverse cracking, and rutting. The cracking information is obtained using fully automated means with video imaging collected in the field and computer algorithms used to interpret distresses
IRI = INI_IRI + 40.8 × MRUT + 0.575 × CRACK + 0.0014 × TRANS_CK + 0.00825 × SF

32
obtained from field images. Rutting information is gathered using laser technology mounted on the same vehicle used to gather the distress data. The technology is capable of taking more than 1,000 transverse elevation measurements across the width of the pavement. Both cracking and rutting measurements are performed on an annual basis over the entire network.
• Pavement structural response: JPCP joint load transfer efficiency. This information is gathered using a FWD unit. Deflection testing to establish joint load transfer efficiency is performed on a 2-year cycle over the entire network, with measurements performed at 1-mi (1.61-km) intervals.
5. Establishing a Strategy Selection Process
For each pavement segment in the network, LCC analyses are performed to identify the strategy having the lowest LCC.
For those segments having more than 25 percent reflection cracking and/or an IRI value greater than 250 inches/mi (3.94 m/km) (RSI = 0 years), the LCC analysis is limited to the reconstruction strategy. For all other segments, more than one construction treatment, hence RSI, are considered. For example, for a segment having 5 percent reflective cracking and an IRI value of 120 inches/mi (1.89 m/km), the following scenarios developed using the PHT analysis tool will be considered (each having a unique RSI in terms of years to construction event):
• Preventive maintenance: RSI = 0 years.
• Rehabilitation: RSI = 5 years (reflective cracking) and RSI = 7 years (smoothness), so RSI = 5 years (controls).
• Reconstruction: RSI = 12 years (reflective cracking) and RSI = 16 years (smoothness), so RSI = 12 years (controls).
A 30-year LCC analysis will be performed for each of the viable construction events described, and the lowest LCC scenario will be selected for the pavement segment in question.
Due to budgetary constraints, the agency will prioritize the LCC results for all the pavement segments in the network to select those segments that will receive some sort of treatment in a given year. The prioritization will be done based on annual average daily traffic (AADT) and percent trucks. Once the segments that will receive a construction treatment have been selected, the project-level design of the construction event and subsequent construction will be turned over to the districts for implementation.
6. Performing Periodic Assessments and Updates
Implementing the RSI concept is anticipated to be completed within 1 year. Once finished, the agency will perform an assessment of the resulting system at the end of 1 year and every other year afterwards. Updates to the system will be planned based on the results of the assessments. In addition, the agency will implement necessary updates to keep pace with

33
technology (e.g., improved expectancy curves and possible additional inputs, improved pavement monitoring equipment and analysis software, etc.).
EXAMPLE 2—SHA USING THE 1972 AASHTO INTERIM GUIDE FOR DESIGN OF PAVEMENT STRUCTURES (7)
Background
A State transportation department is using the 1972 AASHTO Interim Guide for Design of Pavement Structures pavement equations for both design and management purposes.(7) As such, the pavement condition of roads in its network is being monitored and forecasted in terms of PSR. The agency plans on implementing the RSI concept at both the project and network levels. The agency’s network is comprised of roads having multiple functional classifications, but all of them are either new HMA pavement or existing HMA pavement overlaid with HMA.
RSI Implementation
1. Setting Construction Triggers
Because the agency is using the 1972 AASHTO Interim Guide for Design of Pavement Structures pavement equations for both design and management purposes, the construction trigger for all pavement segments in the network will be PSR.(7)
2. Setting Threshold Limits
The RSI concept is to be adapted for pavement network- and project-level analyses. Accordingly, threshold limits have been established for the following construction events:
Network level:
• Do nothing.
• Maintenance.
• Milling and thick HMA overlay.
• Full reconstruction.
Project level:
• Do nothing.
• Preventive maintenance.
• Corrective maintenance.
• Milling and thin HMA overlay.

34
• Milling and thick HMA overlay.
• Partial reconstruction (replace HMA surface layer).
• Full reconstruction.
The resulting construction triggers-threshold limits matrices are provide in table 3 and table 4 for the network and project levels, respectively.
Table 3. Network-level construction trigger-threshold limits. Construction Event Functional Class PSR
Do nothing All > 3.8
Maintenance Primary 3.0–3.8 Secondary 2.8–3.8 Tertiary 2.6–3.8
Rehabilitation Primary 2.0–3.0 Secondary 1.8–2.8 Tertiary 1.6–2.6
Reconstruction Primary < 2.0 Secondary < 1.8 Tertiary < 1.6
Table 4. Project-level construction trigger-threshold limits.
Construction Event Functional Class PSR Do nothing All > 3.8
Preventive maintenance
Primary 3.2–3.8 Secondary 3.0–3.8 Tertiary 2.8–3.8
Corrective maintenance
Primary 2.8–3.2 Secondary 2.6–3.0 Tertiary 2.4–2.8
Mill/thin HMA overlay
Primary 2.4–2.8 Secondary 2.2–2.6 Tertiary 2.0–2.4
Mill/thick HMA overlay
Primary 2.0–2.4 Secondary 2.0–2.2
Partial reconstruction All 1.6–2.0 Full reconstruction All < 1.6
3. Selecting or Developing Expectancy Performance Curves
The 1972 AASHTO Interim Guide for Design of Pavement Structures flexible pavement design equation is used for both design and management purposes.(7) Accordingly, this equation, shown in figure 15, will be used in the implementation of the RSI concept.

35
Figure 15. Equation. Flexible pavement design equation.(7)
Where:
Wt18 = Equivalent 18-kip (40-kN) single-axle load application. R = Regional factor. Si = Soil support value. The number equivalent 18-kip (40-kN) single-axle load applications, or Wt18, is computed as a function of the AADT, direction split, percent trucks, lane distribution, and traffic growth factor. Equivalency factors are used to relate different axle loads to 18-kip (40-kN) single-axle load applications. For pavement management purposes (i.e., for RSI), Wt18 is also expressed in terms of time (years), which are computed using the same inputs just referenced.
The structural number (SN) is defined as follows:
Figure 16. Equation. SN.
Where:
ai = Structural layer coefficient of the various layer that make up the pavement structure (a function of material type and properties). di = Thickness of the various layers that make up the pavement structure.
The regional factor or R value varies between 0.2 and 5.0 depending on subsurface moisture and temperature conditions, while the soil support or Si value is established based on correlations with standard soil tests (e.g., California bearing ratio, R, triaxial strength, etc.).
To account for differences in predicted versus actual PSR values, the agency has developed a linear shift factor for the expectancy curve based on time/traffic (i.e., Wt18).
4. Identifying Collection of Inputs
To support the expectancy performance curve detailed in step 3, the following input data will be required for each pavement segment in the network:
• Inventory data: Age of pavement since construction or since asphalt overlay placement. This information is needed for the Wt18/RSI computations and will be obtained from the agency’s PMS database or extracted from the agency’s construction records.
• Construction data: Pavement material layer types, thicknesses, and properties. This information is needed to determine the SN and Si values and will be obtained from the agency’s PMS database or extracted from the agency’s construction records. Alternatively, this information may be gathered using non-destructive, destructive, and/or laboratory testing.
PSR = f(equivalent 18-kip [40-kN] single-axle load applications or Wt18, structural number or SN of the pavement, regional factor or R, and soil support or Si value)
SN = Σai × di

36
• Climatic data: General information on the subsurface moisture and temperature conditions. This information is needed to establish the R value and will be established on the basis of the agency’s experience of local conditions.
• Traffic data: AADT, direction split, percent trucks, lane distribution, and traffic growth factor. This information will be obtained from existing local or regional traffic counts. Alternatively, if the data are to be used for project-level analysis, actual traffic counts will be carried out.
• Pavement roughness: A high-speed inertial profiler with three laser mounted sensors on the front bumper will be used to measure PSR using existing pavement roughness correlation. These roughness measurements will be performed on a 2-year cycle over the entire network.
• Pavement structural response: Pavement material layer types, thicknesses, and properties. If this information is not readily available, consideration will be given to using a FWD unit in conjunction with a GPR unit, especially if the data are to be used for project-level analysis. The resulting deflection and layer thickness data will be used to compute the effective SN of the pavement, either through the backcalculation of individual layer moduli or through direct computation of SN.
5. Establishing a Strategy Selection Process
For network-level analyses, the same strategy selection process as described in example 1 will be used (i.e., LCC analyses are performed for each pavement segment to identify the strategy having the lowest LCC). For example, for primary segments having a PSR less than 2.0 (RSI = 0 years), the LCC analysis is limited to the reconstruction strategy. The same applies for secondary segments having a PSI less than 1.8 and tertiary segments having a PSR less than 1.6. For all other segments, more than one construction treatment, hence RSI, are considered. For example, for a primary segment having a PSR of 3.0, the following scenarios developed using the 1972 AASHTO Interim Guide for Design of Pavement Structures pavement design equation are considered (each having a unique RSI, in terms of years to construction event):(7)
• Maintenance: RSI = 0 years.
• Rehabilitation: RSI = 6 years.
• Reconstruction: RSI = 15 years.
A 30-year LCC analysis is performed for each viable construction event, and the lowest LCC scenario is selected for the pavement segment in question.
Like the first example, due to budgetary constraints, the agency prioritizes the LCC results for all pavement segments in the network to select the segments that will receive some sort of treatment in a given year. The prioritization is done based on functional class, AADT, and percent trucks.

37
LCC analyses are also performed at the project level using the expanded (project-level) construction events trigger-level matrix. According to this matrix, pavement segments having a PSI less than 1.6 (RSI = 0 years) will undergo full reconstruction, while pavement segments having a PSI of 1.8 may undergo partial reconstruction (RSI = 0 years) or full reconstruction (RSI > 0 years). Similarly, for a primary segment with a PSI of 3.6, the following possible construction treatments (hence RSIs) will be considered:
• Preventive maintenance: RSI = 0 years.
• Corrective maintenance: RSI = 3 years.
• Mill/thin HMA overlay: RSI = 9 years.
• Mill/thick HMA overlay: RSI = 12 years.
• Partial reconstruction: RSI = 17 years.
• Full reconstruction: RSI = 25 years.
Unlike the network-level analysis, however, the chosen construction event (and hence RSI) at the project level is not selected based solely on LCC. Rather, the LCC analysis is supplemented with cost engineering considerations specific to each project segment (i.e., cost/benefit analysis of alternative construction treatments using tool developed for the agency). Moreover, each construction event (e.g., overlay thickness) is designed based on project-specific data (i.e., not a standard treatment for each construction event but tailored to the project).
6. Performing Periodic Assessments and Updates
Implementation of the RSI concept is anticipated to be completed within 18 months. The first 12 months will be spent setting up and fully testing the system, while the remaining 6 months will be spent rolling out the RSI concept within the agency, including training agency personnel. Once implemented, the agency plans on assessing the resulting system on an annual basis. Changes and updates to the system will be implemented based on the results of the assessments as well as on new technology. In addition, because the agency plans on migrating to the AASHTO MEPDG in 5 years, a targeted effort will be dedicated to updating the RSI system within the context of the MEPDG performance models, including the assessment and/or revisions to construction triggers, threshold limits, expectancy curves, collection of inputs, strategy selection process, and future assessments and updates.
Numerical Example:
Consider a pavement network consisting of three primary roadways, two secondary roadways, and a tertiary roadway. For this small network, it is assumed that the regional factor would be equal throughout, and the typical average annual value of 1 is used. Soil type throughout the network ranges from silty clay to sandy gravel, and the age of the pavements and traffic loadings account for some of the variation and rate of change in PSR values.

38
Table 5 contains the current PSR value and the predicted PSR value after 3 and 10 years. The PSR values degrade at different rates due to the differences in traffic loading, pavement age, and structural properties. Based on the construction trigger-threshold limits matrix for the network level, the years to construction event (RSI) is given for each type of construction treatment based on the 1972 AASHTO Interim Guide for Design of Pavement Structures pavement design equation for the given PSR values (see figure 15).(7)
Table 5. RSI based on PSR values and construction treatment.
Pavement ID
Functional Class
PSR Current
PSR 3 Years
PSR 10 Years
Construction Treatment
Current RSI
(years)
3-Year RSI
(years)
10-Year RSI
(years)
1 Primary 3.6 3.2 2.3 Maintenance 0 0 N/A Rehabilitation 6 3 N/A Reconstruction 15 11 3
1 Primary 3.0 2.7 2.1 Maintenance 0 N/A N/A Rehabilitation 4 2 < 1 Reconstruction 9 7 1
2 Primary 2.8 2.3 1.3 Maintenance N/A N/A N/A Rehabilitation 3 2 N/A Reconstruction 8 3 0
3 Secondary 3.4 3.1 2.5 Maintenance 0 0 N/A Rehabilitation 6 4 2 Reconstruction 15 12 6
4 Secondary 2.9 2.7 2.2 Maintenance 1 N/A N/A Rehabilitation 4 3 1 Reconstruction 10 8 4
5 Tertiary
3.2
3.0 2.6 Maintenance 3 2 0 Rehabilitation 6 4 2 Reconstruction 15 13 7
N/A = Not applicable.
Some pavement sections have PSR values below the threshold limit for the respective construction trigger; therefore, that construction type is not applicable to that pavement section, and the next construction type must be considered.
The RSI values are based on the threshold limits for each construction trigger and not the age of the pavement section. This explains why the difference between the current RSI and the RSI after 10 years (or 3 years) is not always 10 years (or 3 years).
EXAMPLE 3—SHA USING MULTIPLE PERFORMANCE INDICATORS
Background
An SHA manages a large network made up of primary State routes only that are comprised entirely of JPCP of varying ages ranging from less than 1 year to 15 years. After several months of deliberations and planning, the agency has recently embarked in the migration of their pavement design and management procedures from the 1986 AASHTO Guide for Design of

39
Pavement Structures.(4) As part of this migration, the agency has decided to include pavement structural capacity and surface friction as additional pavement performance indicators. Moreover, the agency has decided to move forward with the adoption of the RSI concept but is making no distinction between network- and project-level analyses based on the intensive data collection activities they currently have in place.
RSI Implementation
1. Setting Construction Triggers
The agency has embarked in the implementation of the RSI concept using multiple performance indicators. Those indicators include the following:
• AASHTO MEPDG—pavement surface distress.(5)
o Transverse cracking.
o Transverse joint faulting.
• AASHTO MEPDG—pavement smoothness.(5)
o IRI.
• Pavement structural capacity.
o Ratio of current to initial (at time of construction or overlay) effective PCC thickness (based on standard modulus of 4,000,000 psi (27,560 MPa)).
• Pavement surface friction.
o Friction number (FN).
2. Setting Threshold Limits
Because the RSI concept is to be adapted for both network- and project-level analyses, without distinction in terms of construction events, threshold limits have been established for the following construction events:
• Do nothing.
• Preventive maintenance (joint sealing, etc.).
• Corrective maintenance (crack filling, patching, etc.).
• Diamond grinding of JPCP surface.
• Grooving of JPCP surface.

40
• CPR.
• Ultra-thin PCC overlay.
• PCC overlay of existing PCC material, where thickness of new material is determined in accordance with the AASHTO MEPDG procedures.(5)
• Removal and replacement of PCC surface layer.
• Complete removal and replacement of the pavement structure down to the subgrade, where the replacement pavement is determined in accordance with the AASHTO MEPDG procedures and can be either a HMA or PCC structure.(5)
The resulting construction trigger-threshold limits matrix is provide in table 6.
Table 6. Construction trigger-threshold limits matrix.
Construction Event
Transverse Cracking (Percent
Area)
Transverse Joint
Faulting, inches (mm)
IRI, inches/mi (m/km)
Effective PCC
Thickness Ratio FN
Do nothing 0 < 0.05 (< 1.27)
< 90 (< 1.42) > 0.95 > 60
Preventive maintenance
> 0–1 N/A N/A N/A N/A
Corrective maintenance
1–3 N/A N/A N/A N/A
Diamond grinding
N/A 0.05–0.10 (1.27–2.54)
90–120 (1.42–1.89)
N/A 40–60
Grooving N/A N/A N/A N/A < 40 CPR 3–5 N/A N/A 0.95–0.85 N/A Ultra-thin PCC overlay
5–10 0.10–0.15 (2.54–3.81)
120–175 (1.89–2.76)
0.85–0.75 N/A
PCC overlay 10–15 0.15–0.25 (3.81–6.35)
175–250 (2.76–3.94)
0.75–0.65 N/A
Removal and replacement of PCC
15–25 > 0.25 (< 6.35)
> 250 (> 3.94)
0.65–0.50 N/A
Removal and replacement of pavement
> 25 N/A N/A < 0.50 N/A
N/A = Not applicable.
3. Selecting or Developing Expectancy Performance Curves
Since the SHA is migrating from the 1986 AASHTO Guide for Design of Pavement Structures to the AASHTO MEPDG, the pavement performance models contained in the latter guide have

41
been selected for implementing the RSI concept without deviations.(4,5) These models are applicable to the following pavement performance indicators:
• Transverse cracking.
• Transverse joint faulting.
• Pavement smoothness (IRI).
For the pavement structural capacity performance indicator, the agency will use the ratio of current to initial (at time of construction or overlay) effective PCC thickness, where thickness is determined in terms of an equivalent standard modulus of 4,000,000 psi (27,560 MPa) using backcalculated layer moduli data and equivalencies based on the stiffness equation. The agency has chosen to proceed with this ratio as a result of the extensive FWD deflection testing program it has had carried out over the past 15 years. Specifically, effective PCC thickness ratio prediction models have been developed for the various regions in the State from the massive amount of deflection data collected and analyzed over the years.
To account for the seasonal variations in the deflection data, the agency has also developed temperature and moisture correction factors to adjust the effective PCC thickness ratio to a standard temperature and moisture state. In addition, the agency has developed shift factors for the prediction models to account for differences between predicted and measured ratios.
In terms of the pavement surface friction performance indicator, the SHA has been working closely with a neighboring SHA to develop a FN performance model based on data they have gathered over the past decade on JPCP pavements. Jointly, these two agencies have determined that the initial FN for their pavements is 65 on average and that there is a constant rate of deterioration (decrease in FN) equal to -0.80 FN per year. For example, a new pavement that has been in service for 10 years is expected to have a FN = 57. Similarly, a pavement that presently has a FN = 42 is expected to fall below FN = 40 in less than 3 years. As was the case with the effective PCC thickness ratio, the agency has developed shift factors for the FN prediction model to account for differences between predicted and measured FN values.
4. Identifying Collection of Inputs
To support the expectancy performance curves detailed in step 3, the following input data will be required for each pavement segment in the network:
• Inventory (e.g., age of pavements since construction), construction (e.g., PCC thickness and properties), climate (e.g., temperature data), and traffic (e.g., load spectra and volumes) data. Some of this information will be obtained from the agency’s PMS database or extracted from the agency’s construction records. However, because the agency is migrating to the AASHTO MEPDG and intends on using level 2 data, a number of data collection efforts are underway to obtain the necessary information (e.g., collection of load spectra data at various locations throughout the network using WIM technology, materials laboratory testing to characterize the most commonly used pavement materials and subgrades, extraction of appropriate climatic data from

42
the NCDC, use of GPR for determining pavement layer thicknesses throughout the network, etc.)
• Pavement performance data. In support of the various expectancy curves that will be implemented as part of the migration to the AASHTO MEPDG as well as the RSI concept, the agency plans on purchasing two fully integrated and automated devices to collect and interpret pavement distress data (transverse cracking and transverse joint faulting) and smoothness (IRI) data at highway speeds using various laser-mounted sensors and high-resolution video cameras. In support of the effective PCC thickness ratio model, the agency will be performing FWD deflection testing and analysis at 0.5-mi (0.8-km) intervals through the network. Finally, in support of the FN model, the agency will perform skid measurements at 0.5-mi (0.8-km) intervals through the network using a lock-wheel skid trailer at speeds of 40 mi/h (64 km/h). All of these measurements will be performed on a 2-year cycle over the entire network. In addition, more intensive (in terms of spacing between measurements) FWD and friction measurements may be performed at the project level on an as needed basis.
5. Establishing a Strategy Selection Process
The strategy selection process that will be used is the same for both network- and project-level analyses; an LCC analysis-based optimization technique developed by the State’s main university will be used to identify the optimal construction treatments at the appropriate times. The only distinction will be the amount of data that will be used to support project-level analyses (i.e., FWD deflection and skid testing at shorter intervals (as compared to those described in step 4) within the segment units.
To illustrate the strategy selection process, the following example is provided. A 5-year-old pavement segment has been determined (through measurements and/or predictions using expectancy curves) to be in the following condition: transverse cracking = 2 percent, transverse joint faulting = 0.12 inches (3 mm), IRI = 80 inches/mi (1.26 m/km), effective PCC thickness ratio = 0.90, and FN = 50.
Based on the performance condition information and using the selected and developed expectancy curves, the RSIs for the segment in question and the associated construction treatments are summarized in table 7.
Based on the information in the table, it should be apparent that corrective maintenance, ultra-thin PCC overlay, and diamond grinding are required (i.e., RSI = 0 years) to address transverse cracking, transverse joint faulting, and FN, respectively. Clearly, the ultra-thin PCC overlay trumps the other two construction treatments, but this does not imply that the agency will proceed with this construction treatment or one of the other two, as it may be more cost effective to place a PCC overlay in 6 years.

43
Table 7. RSI based on construction treatments.
Construction Event
Transverse Cracking
Transverse Joint
Faulting IRI
Effective PCC
Thickness Ratio FN
Do nothing N/A N/A 0 years 0 years N/A Preventive maintenance
N/A N/A N/A N/A N/A
Corrective maintenance
0 years N/A N/A N/A N/A
Diamond grinding N/A N/A 5 years N/A 0 years Grooving N/A N/A N/A N/A 13 years CPR 4 years N/A N/A 7 years N/A Ultra-thin PCC overlay
12 years 0 years 14 years 13 years N/A
PCC overlay 18 years 6 years 21 years 20 years N/A Removal and replacement of PCC
24 years 12 years 28 years 26 years N/A
Removal and replacement of pavement
32 years 19 years N/A 30 years N/A
N/A = Not applicable.
Based on this example, it is apparent that selecting the timing and the type of construction treatment to be applied to the segment in question or any other segment in the network is not an easy task. In turn, this is the reason the agency has decided to use the LCC analysis-based optimization technique to facilitate the strategy selection process. The technique uses the following steps for each segment in the network:
1. For each pavement performance indicator in question, the technique is used to determine the RSI (time in years) of the segment for each applicable construction event. For the transverse cracking indicator provided in the example, RSI results are as follows:
• Corrective maintenance: RSI = 0 years.
• CPR: RSI = 4 years.
• Ultra-thin PCC overlay: RSI = 12 years.
• PCC overlay: RSI = 18 years.
• PCC removal and replacement: RSI = 24 years.
• Removal and replacement of pavement structure: RSI = 32 years.
2. Based on the information generated in step 1, a logical list of RSI and construction treatments is generated. It makes little sense, for example, to apply corrective maintenance and an

44
overlay during the same year. Similarly, it makes little sense to place an overlay and then reconstruct the pavement 2 years later. A logical list of construction treatments and RSI values for the example provided is as follows:
• Corrective maintenance and diamond grinding: RSI = 0 years.
• CPR and diamond grinding: RSI = 4 years.
• PCC overlay: RSI = 6 years.
• Removal and replacement of PCC: RSI = 12 years.
• Removal and replacement of pavement: RSI = 19 years.
3. A 25-year LCC analysis is then performed for each construction event included in the logical list from step 2. The sequence of construction treatments with the lowest LCC value is selected for the segment in question (e.g., PCC overlay in year 6).
Once the three steps are completed, the total network budget requirements for the next 5 years are considered. If the requirements are greater than the available funds, additional analyses are performed by considering other options beyond the lowest LCC. More specifically, the same three steps are completed by looking at the next lowest LCC value for each segment having lower costs within the first 5 years until the optimum network solution is identified.
6. Performing Periodic Assessments and Updates
Given the scope of work, the effort is anticipated to be completed in 2 years. Once finished, the agency will perform assessments every 6 months during the first 2 years and annual assessments afterwards. Changes and updates to the system will be implemented based on the results of these assessments. In addition, the agency will perform updates to incorporate improved AASHTO MEPDG, structural capacity, and/or FN performance models. Moreover, in their efforts to fully automate all of their pavement performance data collection, the agency plans on replacing its current FWD fleet in 5 years with a moving pavement deflection testing device capable of measuring deflection basins. As such, an updated version of the effective PCC thickness ratio model will be required in support of the RSI processes.
LCC CONSIDERATIONS
LCC analyses were purposely used as part of the strategy selection process (step 5) in all three examples due to their importance to the decisionmaking process. A summary of LCC analysis, as presented by FHWA, is as follows:(8)
• LCC analysis is an engineering economic analysis tool useful in comparing the relative economic merits of competing construction or rehabilitation design alternatives for a single project. By considering all of the relevant costs (agency and user) incurred during the projected service life of an asset, this analytical process helps transportation officials identify the lowest cost option. Additionally, LCC analysis introduces a structured methodology that quantifies the effects of agency activities on transportation users and

45
provides a means to balance those effects with the construction, rehabilitation, and preservation needs of the system itself.
• LCC analysis can be used in making certain transportation investment decisions. Specifically, when a project has been selected for implementation, LCC analysis will assist in determining the lowest cost way to accomplish the performance objectives of the project. LCC analysis cannot, however, be used to compare the economic merits of projects that provide different levels of benefits for highway users, such as comparing a road-widening project with a rehabilitation of existing roadway lanes. LCC analysis accounts only for cost differences between project alternatives and is applicable only to decisions where benefits are equal for all alternatives being considered.
• The LCC analysis process begins with the development of alternatives to accomplish the structural and performance objectives for a project. The analyst then defines the schedule of initial and future activities involved in implementing each of the project design alternatives. Next, the costs of these activities are estimated. Best practice LCC analysis calls for including not only direct agency expenditures (e.g., construction or maintenance activities) but also costs to the project’s users that result from agency work zone operations.
• The predicted schedule of activities and their associated agency and user costs form the projected LCC stream for each design alternative. Using an economic technique known as discounting, these costs are converted into present dollars and then summed for each alternative. The analyst can then determine which alternative is the most cost effective.
In the three examples presented in this chapter, it was assumed that LCC analyses were performed for each of the viable construction events described in the respective examples and that the lowest LCC scenario from the possible combinations of constructions events was selected for the pavement segment in question. In the first example, the combinations of construction events considered over the selected 30-year analysis period included corrective maintenance, rehabilitation, and reconstruction. A partial set of possible combinations of construction events and schedule of activities for the first example is provided in figure 17.
It is important to note that in all three examples, the RSI for reconstruction is not independent of preservation and/or rehabilitation considerations nor is the RSI for rehabilitation independent of preservation considerations in the life-cycle assumptions used as the basis for the determination. The streams of LCCs consist of a future stream of activities, which include preservation, rehabilitation, and reconstruction treatments. To a large extent, the level of dependency is dictated by the pavement performance expectancy curves selected as part of the RSI process.

46
Figure 17. Flowchart. Partial set of construction event combinations and schedule of
activities for example 1.
It is also important to note that the lowest LCC option may not necessarily be implemented when other considerations such as risk, available budgets, and political and environmental concerns are taken into account. LCC analysis provides critical information to the overall decisionmaking process but does not necessarily provide the final answer. This is the case in the third example, where options other than the lowest LCC may need to be considered and selected in order to determine a total network budget for the next 5 years that is within the available funds.
Pavement Network Segment X with Current Condition of Y
Rehabilitation, Year 7
Reconstruction, Year 15
Maintenance, Year 3
Reconstruction, Year 17
Maintenance, Year 25
Rehabilitation, Year 9
Rehabilitation, Year 27
Maintenance, Year 28
47
CHAPTER 5. COMMUNICATING RSI FRAMEWORK RESULTS
While the RSI concept provides an alternative to the long-standing and confusing RSL terminology, the outcomes from the RSI process can be used, presented, and communicated in the same fashion SHAs have been doing for years using RSL. The RSI concept does not provide an alternative to assessing the health of the network or making decisions about how to spend available funds. It simply provides a clear terminology and a logical process that will create a consistent construction event-based terminology and understanding (i.e., types of construction events and the timing of those events within the concept of LCC and/or other prioritization approaches based on streams of future construction events).
An added benefit of adapting the RSI terminology is that the methodology provides a readily available way to communicate impacts of alternate budget scenarios. If the streams of optimum future construction event sequences are stored in a database format that allows the use of automated tools to group similar construction events into categories for planning purposes, then the following information can be easily generated:
• Cost of optimum mix of pavement preservation, rehabilitation, and reconstruction to meet total needs during the current planning cycle.
• Current backlog carryover of unmet needs from the last planning cycle, including increased construction costs due to deferred maintenance and rehabilitation.
• Optimum mix of construction treatments at alternative budget levels, which are less than the total needs.
• Impacts of less-than-optimal budget levels on future backlogs of deferred construction events.
• Needed capital budgets for future planning cycles.
• Rational basis to include both pavement condition and other non-pavement condition factors in the future construction planning process without using confusing terms such as service versus structural needs.
At the technical level (i.e., pavement engineers, managers, and technicians working at State transportation departments and local agencies as well as highway contractors), the new RSI terminology should not be difficult to understand nor should the RSI implementation steps. The biggest challenge will be for engineers to substitute a term they have been using often for most of their careers (RSL) with a new one (RSI). While a challenge, it is simply a matter of time before the new terminology replaces the old one, especially given the simplicity and logic of the new terminology.
At the upper management level (i.e., chief engineers of State and local agencies and Federal, State, and local government decisionmakers), two possible scenarios exist. One scenario includes managers who are not aware of the RSL concept. As a result, the new RSI concept is of little consequence to them; they are mostly interested in budgets and other political considerations.

48
The other scenario includes decisionmakers who are aware of and have been using the RSL concept. Regardless of the scenario, the fact is that people must determine which projects will be funded and when.
Perhaps the most important message to convey to decisionmakers is that pavements are repairable systems—the life of the system is not defined by failure of a few components. As such, the use of remaining life is not only confusing but also inappropriate. Material developed to convey this message needs to be short, to the point, and focused. The objective is to provide decisionmakers with easily understood information that reduces potential for misinterpretation, provides a rational basis to assess current status, and promotes better decisions.
In summary, adopting the RSI concept should not significantly affect the day-to-day operations once the shift in terminology is accomplished. Most or all of the RSI implementation steps should already be in place at most SHAs.
Other than the change in terminology, reporting and communicating the outcomes from these steps should not be affected by the RSI concept (e.g., practitioners will need to know current and future conditions and perform LCC analyses to identify lowest cost strategies, while decisionmakers will need to know what budget is required to maintain the network at or above a minimum level).

49
APPENDIX. GENERIC AGENCY ISSUES
This appendix addresses issues associated with implementing the RSI concept within an agency. While not part of the actual RSI process itself, the issues covered are critical to the success of an agency’s RSI implementation effort. These issues address the establishment of the agency’s RSI protocol, the identification of an RSI coordinator, and the dissemination of the RSI concept within the agency. These issues only need to be addressed once, with periodic monitoring and revising to ensure they are still appropriate; however, they are vital to the success of an agency’s RSI program.
ESTABLISHING AN RSI PROTOCOL
One issue is establishing an agency protocol for implementing the RSI concept. Adoption and acceptance of this protocol will help formalize the RSI implementation effort. This protocol should be communicated to individuals in the agency, and they should be encouraged to follow it. The protocol should include the following elements:
• Reasons for having the protocol.
• Agency’s implementation plan.
o Approach to implementation steps.
o Implementation schedule.
o Allocation of resources.
• Roles and responsibilities.
• Training of agency personnel.
IDENTIFYING AND APPOINTING AN RSI COORDINATOR
To ensure the successful implementation of the RSI concept within an agency, it is important to select an individual to lead the RSI effort and define his/her responsibilities. This person, designated the agency’s RSI coordinator, is expected to be involved in all facets of the agency’s implementation effort (and possibly in establishing the protocol for the agency). This activity is not anticipated to require a full-time position.
Key responsibilities of the coordinator, who should have an appropriate level of decisionmaking authority, include, but are not limited to, the following:
• Acting as the central point of contact for all RSI issues within the agency.
• Implementing the RSI process within the agency.
• Training agency personnel and disseminating RSI information.

50
• Periodically performing RSI assessments and updates.
To properly perform these responsibilities, the agency’s coordinator is expected to have the following qualifications:
• Possess sufficient stature within the agency to make decisions on implementing the RSI concept and to delegate activities and responsibilities to others.
• Have sound understanding, background, and experience in pavement design and performance-related issues.
• Possess good project management skills, including sufficient leadership and communications skills, to organize the various activities associated with forensic investigations within the agency.
The agency’s coordinator should also be given the responsibility of recommending changes to the RSI concept and process based on the findings from the implementation effort and/or assessments and updates and be provided with the necessary technical and administrative support to properly and efficiently address RSI issues within the agency.
DISSEMINATION OF RSI CONCEPT WITHIN AGENCY
The following list highlights dissemination options that an agency may consider in order to facilitate implementation of the RSI concept and improve the likelihood of success:
• RSI Web site: Most agencies maintain a Web site with links to various types of information relevant to the agency, including information about the pavements program. The addition of a RSI link within the agency’s pavement information area is a simple means for making the information available to a large group of potential users both within and outside the agency.
• Paper reports, flyers, brochures, etc.: In addition to the Web site, the agency may distribute relevant RSI information in paper format to individuals/offices most affected by the implementation of the RSI concept.
• Workshops, Webinars, and conferences: Presentations by the agency’s RSI coordinator or others at agency in-house pavement-related workshops, Webinars, and conferences are also an effective method of disseminating the RSI concept and its implementation process. Periodic Webinars are an appropriate and cost effective means of disseminating the RSI concept and process to key individuals within agencies.
It is also recommended that agencies develop a standard of practice regarding input assumptions used by agencies and contractors performing LCC analysis for the agency. While the amount of information available on how long future construction treatments will last varies drastically between SHAs, codifying a set of rules to be used for LCC analysis is the first step in the quality management improvement process. Once implemented, as more information is gained over time, the rules will evolve to match the actual agency experience.

51
REFERENCES
1. Elkins, G.E., Thompson, T.M., Groeger, J.L., Visintine, B., and Rada, G.R. (2013). Reformulated Pavement Remaining Service Life Framework, Report No. FHWA-HRT-13-038, Federal Highway Administration, Washington, DC.
2. Federal Highway Administration. AASHO Road Test, U.S. Department of Transportation, Washington, DC. Obtained from: http://www.fhwa.dot.gov/infrastructure/50aasho.cfm.
3. AASHTO. (1993). AASHTO Guide for Design of Pavement Structures, American Association of State Highway and Transportation Officials, Washington, DC.
4. AASHTO. (1986). AASHTO Guide for Design of Pavement Structures, American Association of State Highway and Transportation Officials, Washington, DC.
5. AASHTO (2008). Mechanistic-Empirical Pavement Design Guide, A Manual of Practice, Interim Edition, American Association of State Highway and Transportation Officials, Washington, DC.
6. Haider, S.W., Chatti, K., Baladi, G.Y., and Sivaneswaran, N. (2011). “Impact of Pavement Monitoring Frequency on Pavement Management System Decisions,” Transportation Research Record 2225, Transportation Research Board, Washington, DC.
7. AASHTO. (1972). AASHTO Interim Guide for Design of Pavement Structures, American Association of State Highway and Transportation Officials, Washington, DC.
8. Federal Highway Administration. (2002). Life Cycle Cost Analysis Primer, U.S. Department of Transportation, Washington, DC.


53
BIBLIOGRAPHY
1. Ahammed, M.A. and Tighe, S.L. (2009). “Early Life, Long Term and Seasonal Variations of Flexible and Rigid Pavement Skid Resistance,” Transportation Research Record 2094, Transportation Research Board, Washington, DC.
2. Alam, M. (2007). Pavement Remaining Life Analysis for National Policy Analysis, National Pavement Management Conference, Norfolk, VA.
3. Newcomb, D.E., Willis, R., and Timm, D.H. (2002). Perpetual Asphalt Pavements: A Synthesis, Report APA 101, Asphalt Pavement Alliance, Lanham, MD.
4. Baladi, G. (1991). Analysis of Pavement Distress Data, Pavement Distress Indices, and Remaining Life: An Advanced Course in Pavement Management Systems, Boston, MA.
5. Building Research Board. (1991). Pay Now or Pay Later, National Research Council, Washington, DC.
6. Carey, W. and Irick, P. (1960). “The Pavement Serviceability-Performance Concept,” Highway Research Board, 40–58, Washington, DC.
7. California Department of Transportation. (2007). Life-Cycle Cost Analysis Procedures Manual, California Department of Transportation, Sacramento, CA.
8. CTC & Associates, LLC. (2004). Pavement Service Life—Rev. 2, Transportation Synthesis Report, Wisconsin Department of Transportation, Madison, WI.
9. Emery, J.J., Lee, M.A., and Kamel, N. (1982). Skid Resistance Predictive Models, ASTM International, Conshohocken, PA.
10. Farrell, F.B. and Paterick, H.R. (1948). “Life Characteristics of Highway Surfaces,” Highway Research Board Proceedings, 28, Washington, DC. Federal Highway Administration. (2004). Life-Cycle Cost Analysis: Realcost User Manual, v 2.1, Federal Highway Administration, Washington, DC. Obtained from: http://www. fhwa.dot.gov/infrastructure/asstmgmt/rc210704.pdf.
11. Federal Highway Administration. (1995). Pavement and Road Surface Management for Local Agencies, Participant's Manual, U.S. Department of Transportation, Washington, DC.
12. Federal Highway Administration. (1986). Highway Performance Monitoring System Analytical Process: Volume II, Technical Manual, Version 2.0, U.S. Department of Transportation, Washington, DC.
13. Florida Department of Transportation. (2008). Flexible Pavement Design Manual, Florida Department of Transportation, Tallahassee, FL.

54
14. Galehouse, L. and Sorenson, J.A. (2009). Quick Check of Your Highway Network Health, Federal Highway Administration, Washington, DC. Obtained from: http://www.fhwa.dot. gov/pavement/preservation/if07006ppt.cfm.
15. Geiger, D.R. (2005). Memorandum: Pavement Preservation Definitions, Federal Highway Administration, Washington, DC. Obtained from: http://www.fhwa.dot.gov/pavement/ preservation/091205.cfm.
16. Gronberg, G.D. and Blosser, N.B. (1956). “Lives of Highway Surfaces—Half Century Trends,” Public Roads, 29(2).
17. Haas, R., Hudson, W.R., and Zaniewski, J. (1994). Modern Pavement Management, Krieger Publishing Company, Malablar, FL.
18. Henry, J.J. (2000). Evaluation of Pavement Friction Characteristics: A Synthesis of Highway Practice, NCHRP Synthesis 291, National Cooperative Highway Research Program, Washington, DC.
19. Hicks, R.G., Simpson, A.L., and Groeger, J.L. (2011). Pavement Management Practices in State Highway Agencies: Madison, Wisconsin Peer Exchange Results, Federal Highway Administration, Washington, DC.
20. Hudson, W.R., Haas, R., and Uddin, W. (1997). Infrastructure Management, McGraw-Hill, New York City, NY.
21. Kaplan, E.L. and Meier, P. (1958). “Nonparametric Estimation from Incomplete Observations,” Journal of the American Statistical Association, 53.
22. Lamptey, G., Ahamad, M., Labi, S., and Sinha, K. (2005). Life Cycle Cost Analysis of INDOT Pavement Design Process, Final Report, FHWA/IN/JTRP-2004/28, Indiana Department of Transportation, West Lafayette, IN.
23. Lindqvist, B.H. (2006). “On the Statistical Modeling and Analysis of Repairable Systems,” Statistical Science, 21(4), 532–551.
24. Litzka, J., Leben, B., La Torre, F., Weninger-Vycudil, A., De Lurdes Antunes, M., Kokot, D., Mladenovic, G., Brittain, S., and Viner, H. (2003). The Way Forward for Pavement Performance Indicators Across Europe, COST Action 354 Performance Indicators for Road Pavements, European Cooperation of Scientific and Technical Research Institute for Road Construction and Maintenance, Brussels, Belgium.
25. National Institute of Standards and Technology. (2012). NIST/SEMATECH e-Handbook of Statistical Methods, Gaithersburg, MD. Obtained from: http://www.itl.nist.gov/div898/ handbook/.
26. New York State Department of Transportation. (2010). Tappan Zee Bridge/I-287 Environmental Review, Albany, NY. Obtained from: http://www.tzbsite.com/index.html.

55
27. Noyce, D.A., Bahia, H.U., Yambo, J.M., and Kim, G. (2005). Incorporating Road Safety into Pavement Management: Maximizing Surface Friction for Road Safety Improvements, Midwest Regional University Transportation Center, Madison, WI.
28. Paterson, W. and Chesher, A. (1986). “On Predicting Pavement Surface Distress with Empirical Models of Failure Times,” Transportation Research Record 1095, Transportation Research Board, Washington, DC.
29. Prozzi, J. and Madanat, S. (2000). “Using Duration Models to Analyze Experimental Pavement Failure Data,” Transportation Research Record 1699, Transportation Research Board, Washington, DC.
30. Rozycki, R. (2009). HPMS Reassessment: Pavements, Southeastern States Pavement Management and Design Conference, New Orleans, LA.
31. Shahin, M.Y. and S. D. Kohn. (1981). Pavement Maintenance Management for Roads and Parking Lots, Technical Report M-294s.l, U.S. Army Corps of Engineers, Washington, DC.
32. Snyder, M.B. (2006). Pavement Surface Characteristics—A Synthesis and Guide, American Concrete Pavement Association, Skokie, IL.
33. Song, W., Chen, X., Smith, T., and Hedfi, A. (2006). “Investigation of Hot Mix Asphalt Surfaced Pavements Skid Resistance in Maryland State Highway Network System,” Transportation Research Board 85th Annual Meeting Compendium of Papers CD-ROM, Transportation Research Board, Washington, DC.
34. Speaks, S. (2010). Reliability and MTBF Overview, Vicor Reliability Engineering, Andover, MA. Obtained from: http://www.vicr.com/documents/quality/Rel_MTBF.pdf.
35. Stevens, L. (1985). Road Surface Management for Local Governments Resource Notebook, Federal Highway Administration, Washington DC.
36. Texas Department of Transportation. (2008). Pavement Design Guide, Texas Department of Transportation, Austin, TX.
37. Vepa, T.S., George, K.P., and Shekharan, R. (1996). “Prediction of Pavement Remaining Life,” Transportation Research Record 1524, Transportation Research Board, Washington, DC.
38. Wayson, R.L. (1998). Relationship Between Pavement Surface Texture and Highway Traffic Noise, NCHRP Synthesis 268, National Cooperative Highway Research Program, Washington, DC.
39. Wlaschin, B., Alam, M., and Gaj, S. Pavement Health Track Analysis Tool for Determining the Health of Pavement Networks, AASHTO Annual Meeting, Palm Desert, CA. Obtained from: www.transportation.org/sites/aashto/docs/Pavement%20Health%20Track-AASHTO.ppt.

56
40. Winfrey, R. and Howell, P.D. (1968). “Highway Pavements—Their Service Lives,” Highway Research Record 252, National Research Council, Washington, DC.
41. Winfrey, R. and Farrel, F.B. (1941). Life Characteristics of Surfaces Constructed on Primary Rural Highways, Volume 22, Public Roads Administration, Washington, DC.
42. Wisconsin Department of Transportation. (1996). Wisconsin Pavement Performance Report, Madison, WI.
43. Witczak, M. (1978). Determination of Flexible Pavement Life, Report No. FHWA/MD/R-79/1, Federal Highway Administration, Washington DC.
44. Yang, J. (2008). “Development of Effective Remaining Life Prediction Methods for Pavement Management at the Network Level,” Transportation Research Board 2009 Annual Meeting CD-ROM, Transportation Research Board, Washington DC.
45. Yu, J., Chow, E., and Yau, J. (2008). “Estimation of the Effects of Influential Factors on Pavement Service Life with Cox Proportional Hazards Method,” Journal of Infrastructure Systems, 14(4), American Society of Civil Engineers, Reston, VA.
46. Yu, J. (2005). Pavement Service Life Estimation and Condition Prediction, University of Toledo, Toledo, OH.


HRDi-20/11-13(500)ERecycledRecyclable