pavement friction management (pfm) support program lessons ... de león izeppi.pdf · lessons...
TRANSCRIPT

30 years on the Road To Progressively Better Data
Pavement Friction Management (PFM) Support Program
Lessons Learned – First draftBy
Edgar David de Leon Izeppi, Research Scientist *
Virginia Tech Transportation Institute
30 years on the Road To Progressively Better Data30 years on the Road To Progressively Better Data
Presentation Outline
• Introduction
• Case Studies of Continuous Measurements (Examples)• Friction
• Texture
• Geometrics and all of the above
• Crash cost analysis and comparisons
• Conclusions
30 years on the Road To Progressively Better Data30 years on the Road To Progressively Better Data
Introduction
IF you had all the money of the world, what car would you buy?
Stay tuned…

30 years on the Road To Progressively Better Data30 years on the Road To Progressively Better Data
•1: Macrotexture
•2: Microtexture
•3: Dry Contact
THREE ZONE CONCEPT
30 years on the Road To Progressively Better Data30 years on the Road To Progressively Better Data
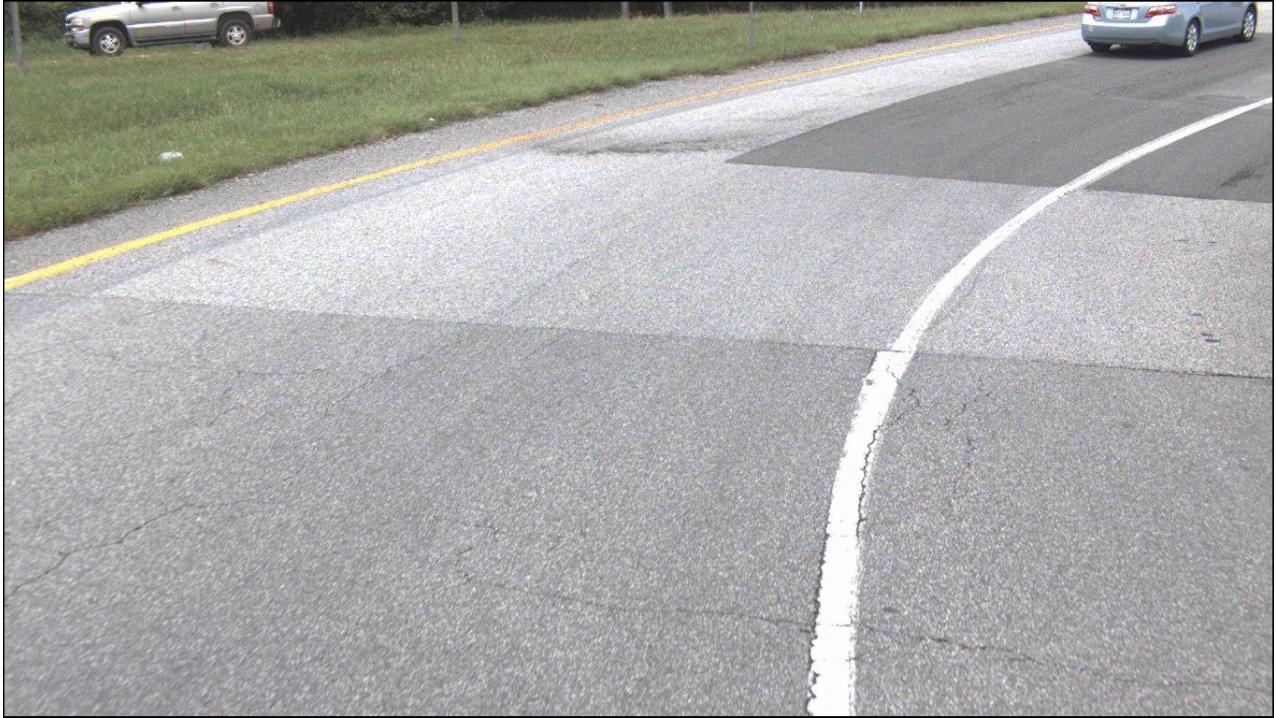
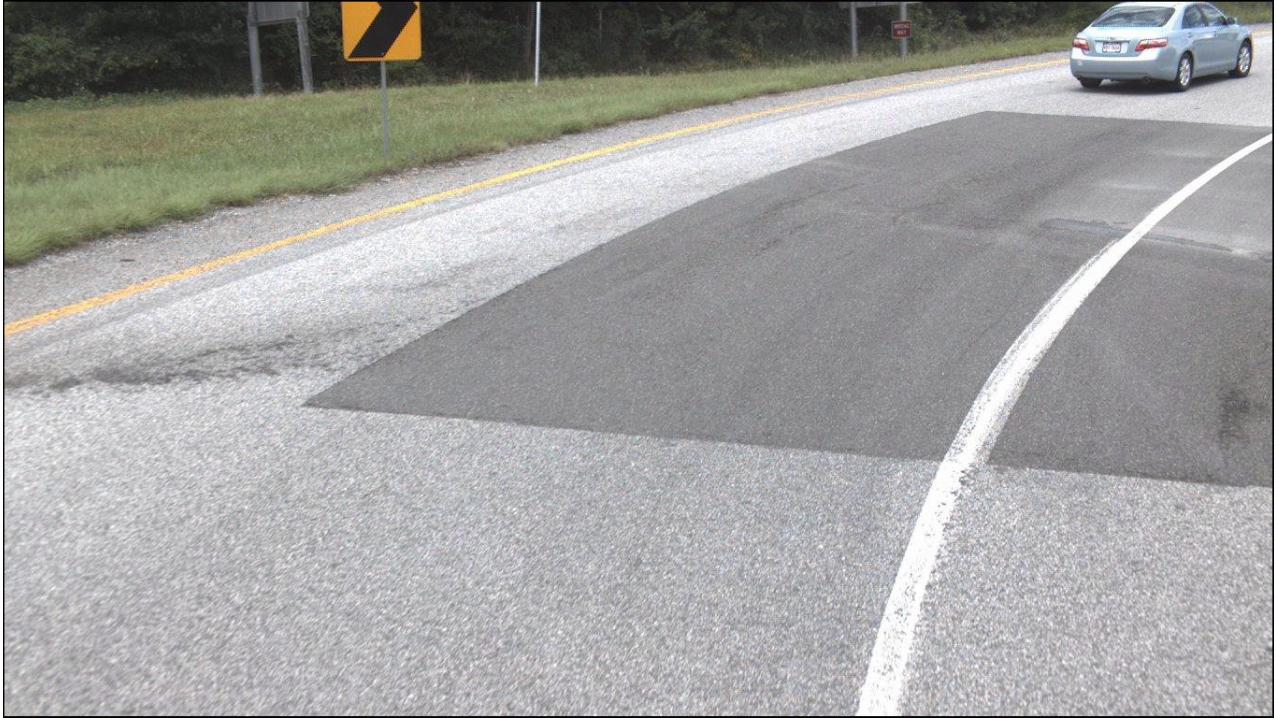
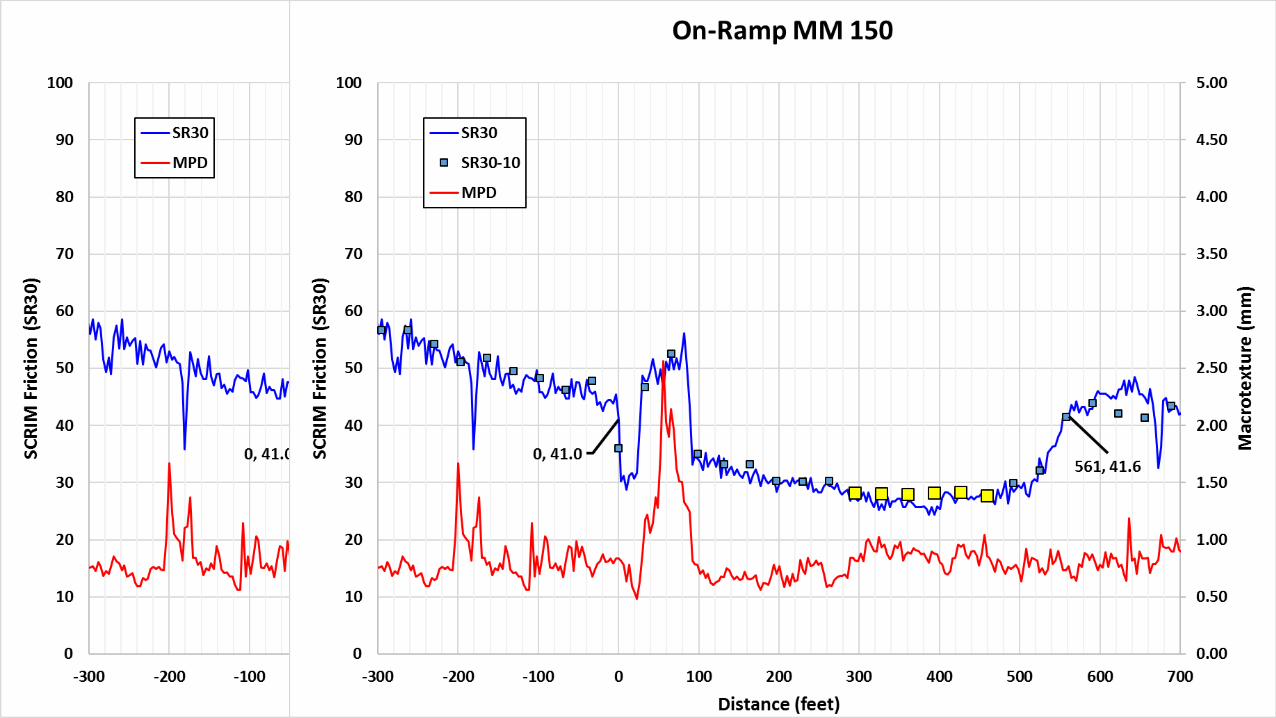
Importance of Continuous Measurements
•CFME and texture data collection
Geometrics and all of the above
30 years on the Road To Progressively Better Data

30 years on the Road To Progressively Better Data
30 years on the Road To Progressively Better Data
30 years on the Road To Progressively Better Data

30 years on the Road To Progressively Better Data

30 years on the Road To Progressively Better Data
30 years on the Road To Progressively Better Data
30 years on the Road To Progressively Better Data
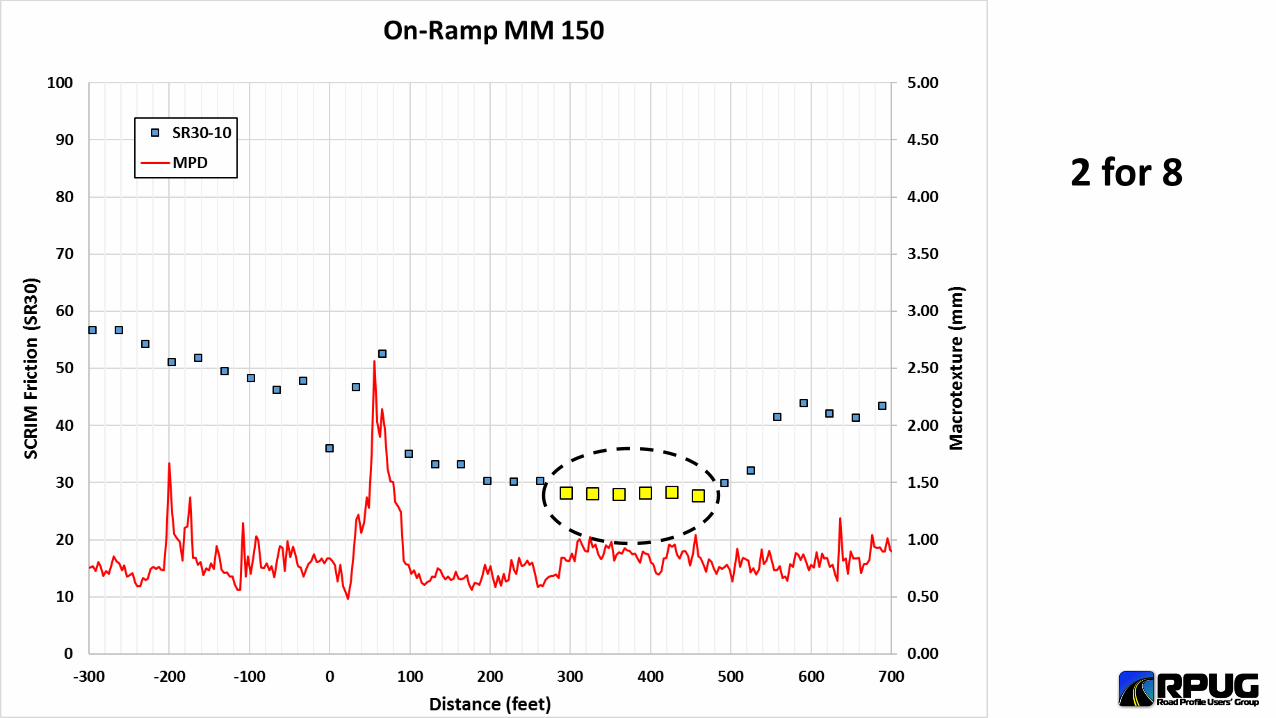
2 for 8
30 years on the Road To Progressively Better Data14
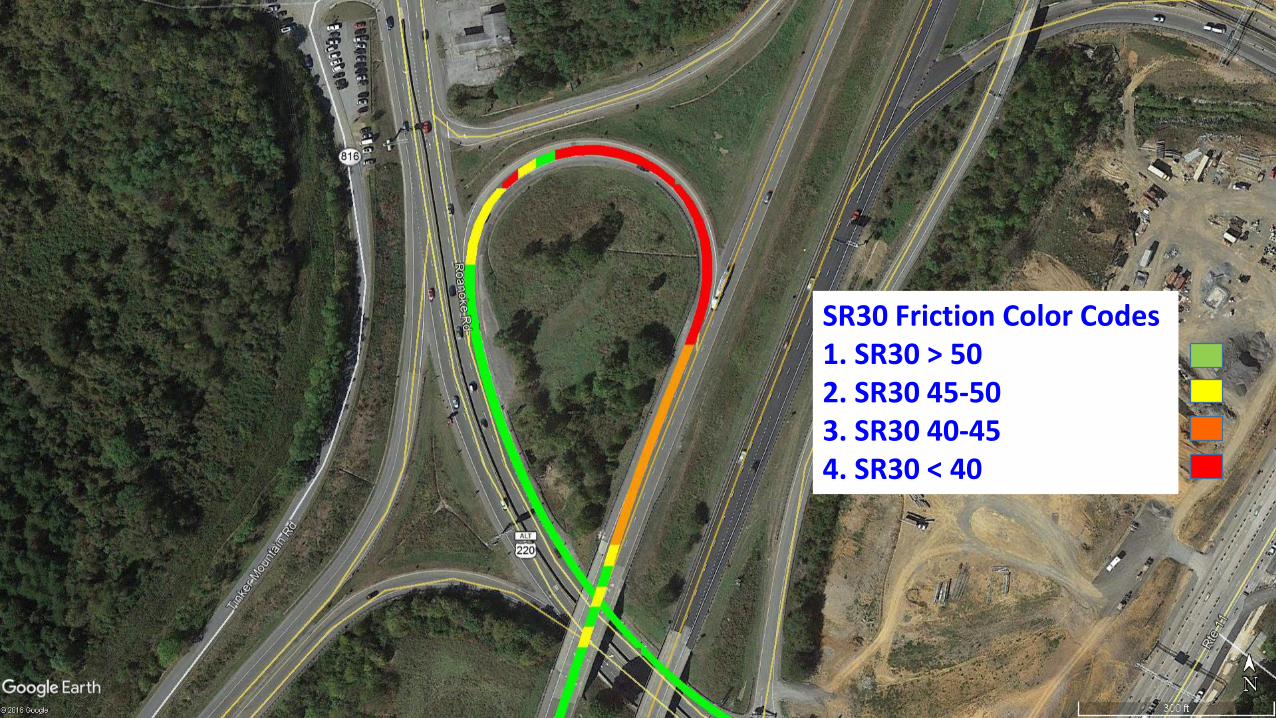
SR30 Friction Color Codes1. SR30 > 502. SR30 45-503. SR30 40-454. SR30 < 40
30 years on the Road To Progressively Better Data15
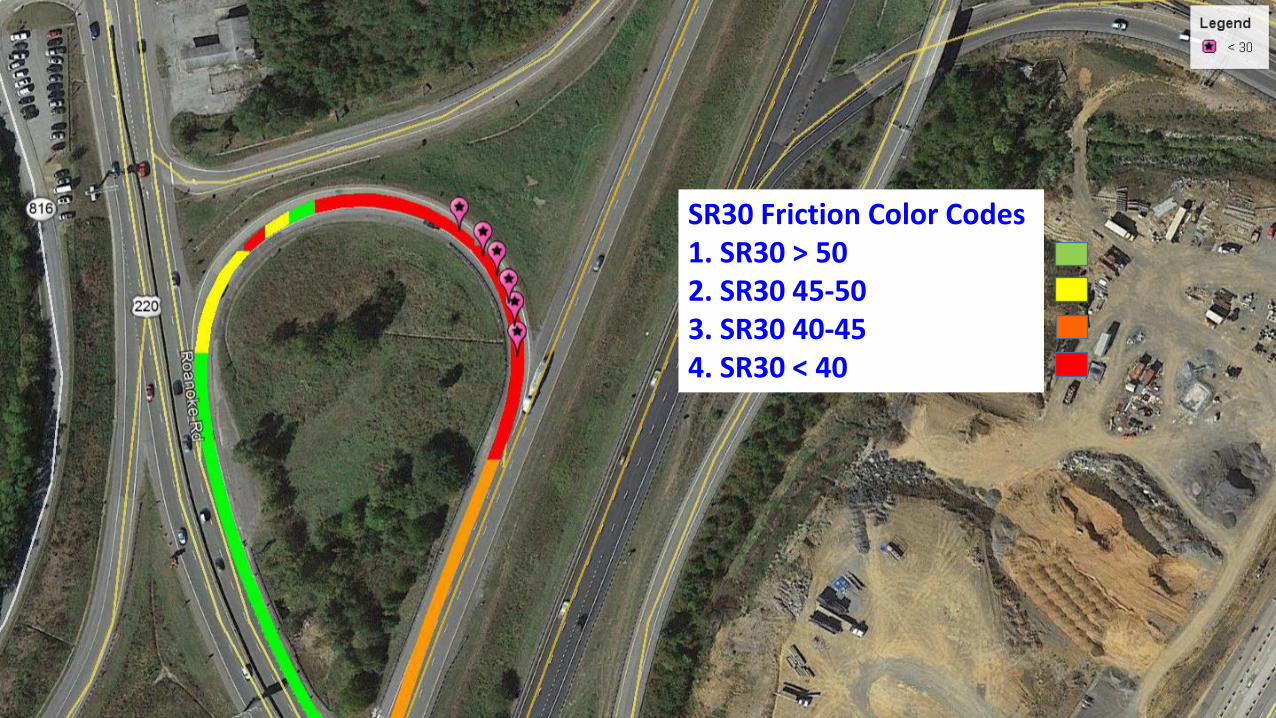
SR30 Friction Color Codes1. SR30 > 502. SR30 45-503. SR30 40-454. SR30 < 40
30 years on the Road To Progressively Better Data
-7.8
-8.0
-7.2
-7.2
-7.7
-7.8
-7.7
-7.5
-8.2
-8.5
-7.5
-7.1
-7.0
-6.9
-6.6
-6.6
-6.8
-6.1
-5.9
-245
-196
-171
-185
-187
-204
-190
-167
-177
-194
-193
-182
-163
-174
-184
-177
-186
-210
-231

30 years on the Road To Progressively Better Data30 years on the Road To Progressively Better Data
Importance of Continuous Measurements
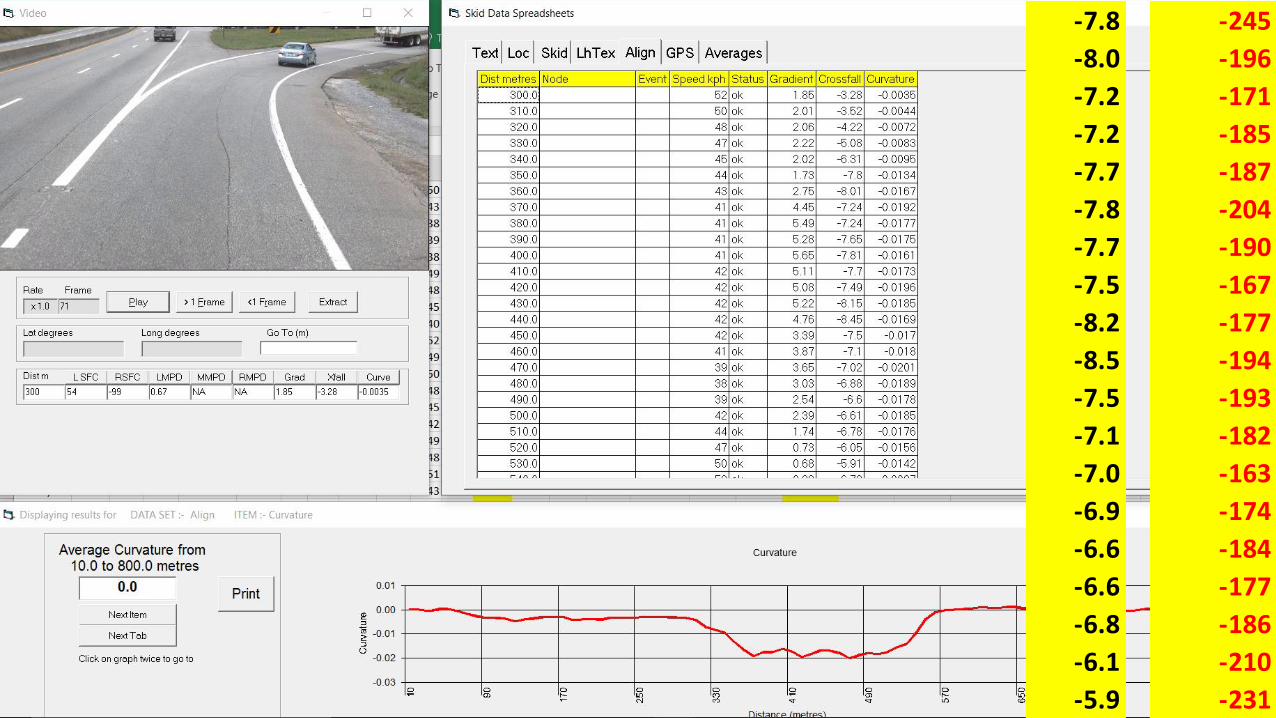
•Comparison CFME and texture data collection with 1.0 mile Friction

30 years on the Road To Progressively Better Data30 years on the Road To Progressively Better Data
Pavement Conditions Vary
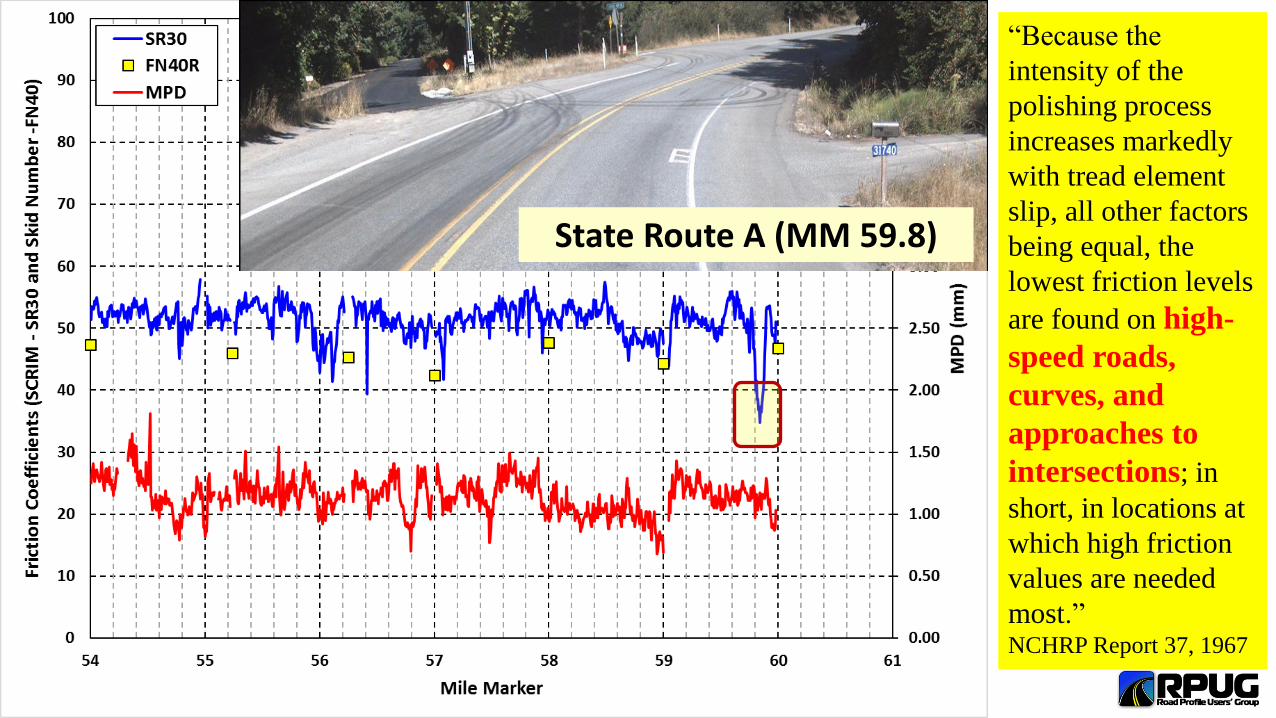
•NCHRP Report 37, 1967: • “Because the intensity of the polishing process
increases markedly with tread element slip, all other factors being equal, the lowest friction levels are found on high-speed roads, curves, and approaches to intersections; in short, in locations at which high friction values are needed most.”
18
30 years on the Road To Progressively Better Data30 years on the Road To Progressively Better Data
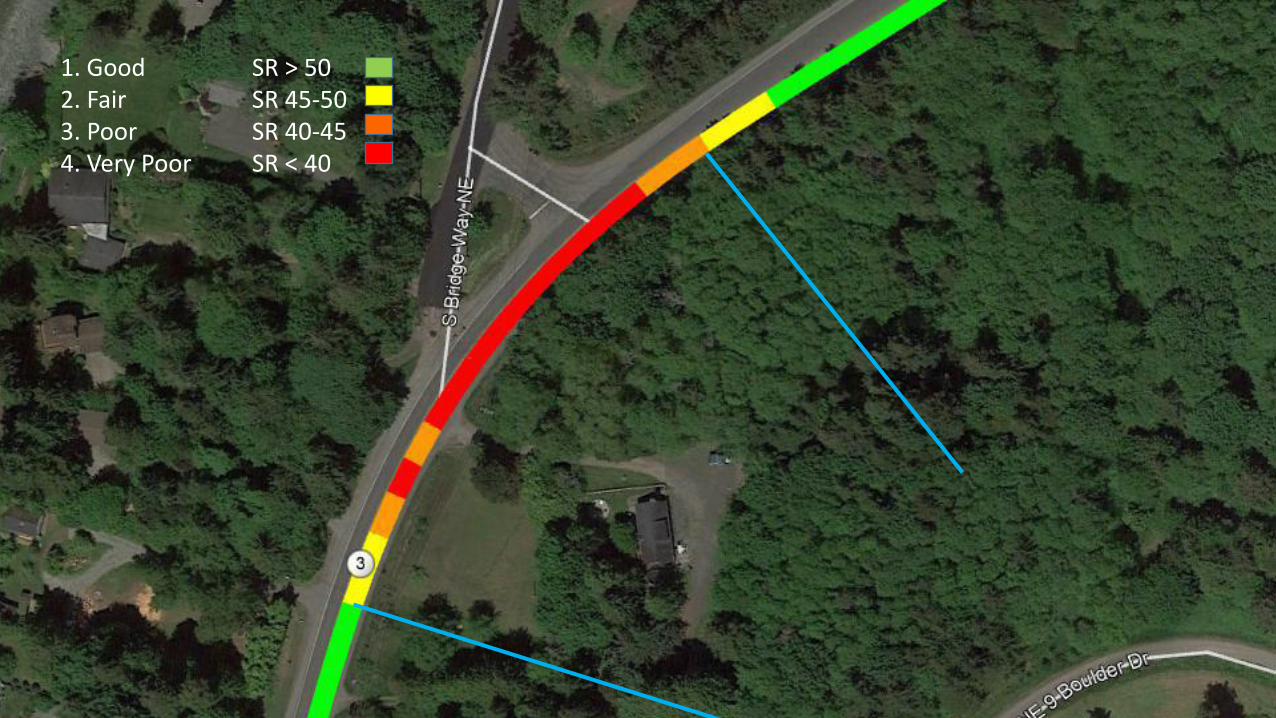
State Route A (MM 59.8)
“Because the
intensity of the
polishing process
increases markedly
with tread element
slip, all other factors
being equal, the
lowest friction levels
are found on high-
speed roads,
curves, and
approaches to
intersections; in
short, in locations at
which high friction
values are needed
most.”NCHRP Report 37, 1967
30 years on the Road To Progressively Better Data30 years on the Road To Progressively Better Data
1. Good SR > 502. Fair SR 45-503. Poor SR 40-454. Very Poor SR < 40

30 years on the Road To Progressively Better Data30 years on the Road To Progressively Better Data
FRICTION initial results
Friction DemandCategory
SR30 Threshold Other (Speed)
Non-events divided 30 – 35 35 – 40
Non-events undivided 35 – 40
Curves (R < 2,000’) 40 – 45
Intersections 45 – 50 40 – 45
Grade > 5% TBD

30 years on the Road To Progressively Better Data30 years on the Road To Progressively Better Data
Importance of Continuous Measurements
•CFME and texture data collection
Texture

30 years on the Road To Progressively Better Data30 years on the Road To Progressively Better DataAdvancing Transportation Through Innovation

30 years on the Road To Progressively Better Data
Preliminary Crash Data
24
39% to 66%
21% to 23%
28% to 50%
21% to 28%

30 years on the Road To Progressively Better Data
Preliminary Crash Data
25
Route Summary
• Section 3, 4, and 6 – 55 MPH
– 9.09 Miles (years before – 3.00, years after – 1.21) ADT = 15,000-18,000
– Total Crashes before = 119 after = 72
– Wet Crashes before = 33 (28%) after = 21 (29%)
– Wet/Year/Mile before = 1.21 after = 1.91 (58% +)
– S9.5C (2015) SR 30 = 51.3-57.1 MPD = 0.37-0.40
• Section 2 and 7 – 70 MPH
– 24.10 Miles (years before – 3.00, years after – 1.21) ADT = 15,000-18,000
– Total Crashes before = 269 after = 234
– Wet Crashes before = 112 (42%) after = 157 (67%)
– Wet/Year/Mile before = 1.55 after = 5.38 (248% +)
– S9.5C (2015) SR 30 = 60.4-60.5 MPD = 0.38-0.40https://connect.ncdot.gov/projects/research/Pages/ProjDetails.aspx?ProjectID=2017-02
30 years on the Road To Progressively Better Data30 years on the Road To Progressively Better Data
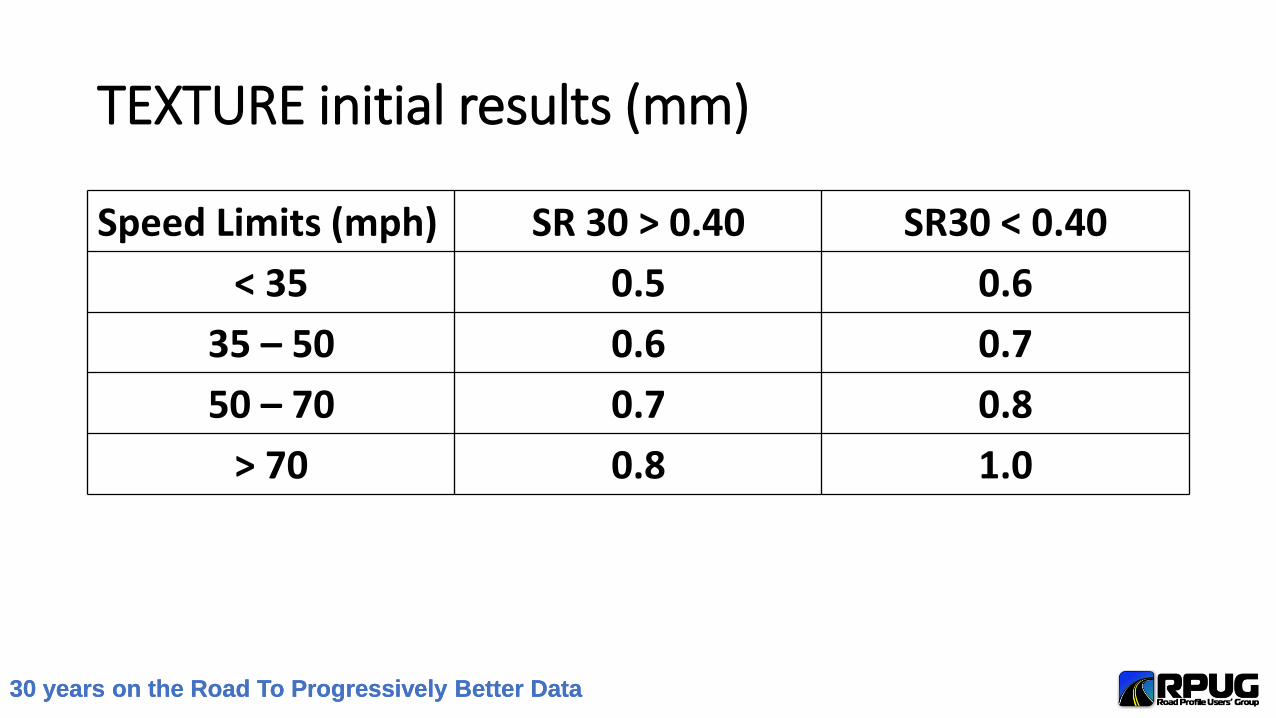
TEXTURE initial results (mm)
Speed Limits (mph) SR 30 > 0.40 SR30 < 0.40
< 35 0.5 0.6
35 – 50 0.6 0.7
50 – 70 0.7 0.8
> 70 0.8 1.0
30 years on the Road To Progressively Better Data30 years on the Road To Progressively Better Data
Crash Cost Considerations

30 years on the Road To Progressively Better Data30 years on the Road To Progressively Better Data
Crash Costs vs. Treatments
Crash Category Virginia Crashes 1
Category % Cost ($1,000) 2 Total Cost ($1,000)
PDO 77,941 63.1% $6.1 $473,570
Injury 44,924 36.4% $167.5 $7,525,803
Fatality 714 0.6% $9,146.0 $6,530,243
Total 123,579 $14,529,615
Notes:1. Year 2,0102. NHTSA Cost Report, 2,010 Average cost:
$117,573

30 years on the Road To Progressively Better Data30 years on the Road To Progressively Better Data
Crash Costs vs. Treatments
FrictionTreatment
TreatmentCost 2
Treatment costper one-crash
Treatments of0.1-mile sectionsper one-crash
CR per $0.5million of savingsper 0.1-milesection
DGAC O/L $15,000 0.10 9.7 3.5
OGFC 1 $22,500 0.15 6.5 3.6
CDG $7,000 0.05 20.8 3.5
HFS $40,000 0.27 3.6 3.7Notes:1. 1.5 cost of DGAC (18/12)2. For 0.1-mile, 12 foot-lane

30 years on the Road To Progressively Better Data30 years on the Road To Progressively Better Data
Conclusions
Hurdles to overcome:
1. INMP syndrome (full cooperation with Safety)
2. Financial vs. Economic Considerations
3. Act today, commit, and do ita. Special Task Forceb. Interdivision Cooperationc. Consider other ideas
30 years on the Road To Progressively Better Data
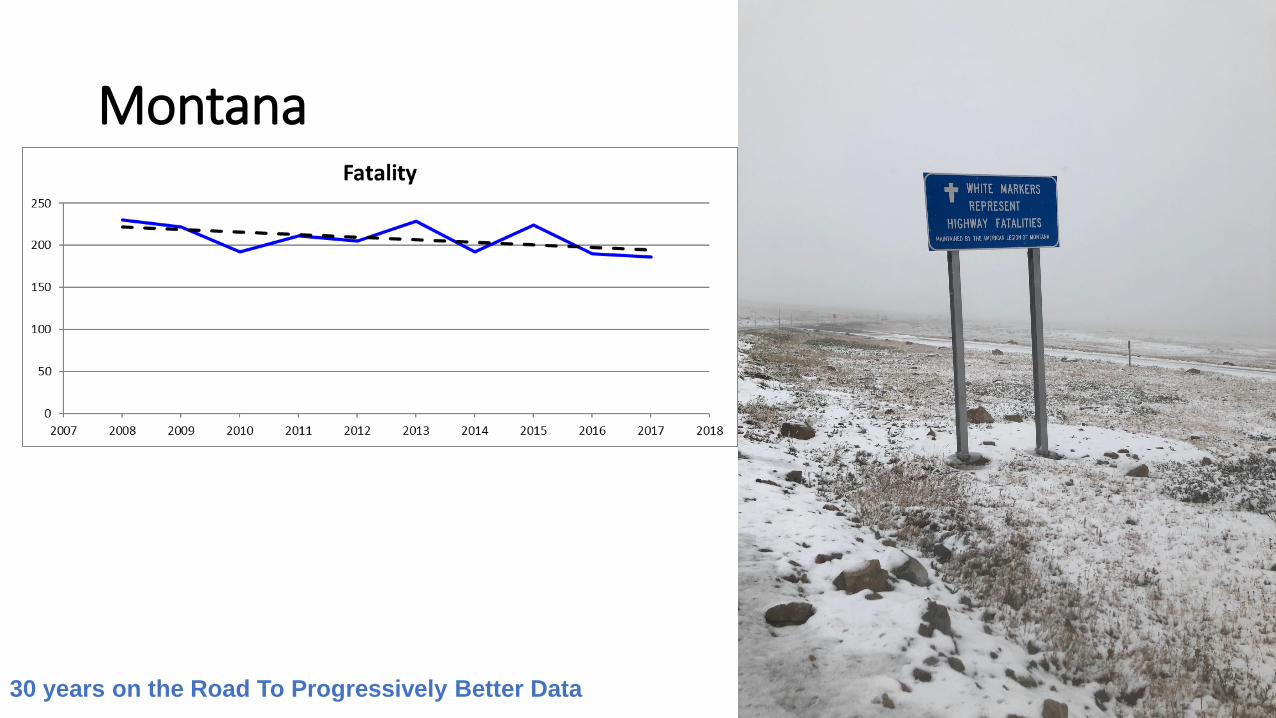
Montana

30 years on the Road To Progressively Better Data
Since 1953, +20,000markershttps://billingsgazette.com/news/state-and-regional/montana/memorial-markers-for-years-white-crosses-have-marked-fatal-accidents/article_6c23cb4a-af89-5347-8df1-51b652946453.html

30 years on the Road To Progressively Better Data
https://billingsgazette.com/news/state-and-regional/montana/memorial-markers-for-years-white-crosses-have-marked-fatal-accidents/article_6c23cb4a-af89-5347-8df1-51b652946453.html
30 years on the Road To Progressively Better Data
PAVEMENT EVALUATION 2019
Roanoke, VA
September 17-21, 2019
Sept.
17-21
2019

30 years on the Road To Progressively Better Data
http://saferroadsconference.com
Advancing Transportation
Through Innovation
May 14 – 16, 2020
Greater Richmond Convention Center
Host Hotel –Marriot Richmond

30 years on the Road To Progressively Better Data
Answer
30 years on the Road To Progressively Better Data
Duncan Imports & Classic Cars
“Christiansburg car collection catching the eye of Bill Gates, NASCAR drivers and movie studios”, Roanoke Times 9/4/18 https://www.roanoke.com/news/local/christiansburg/christiansburg-car-collection-catching-the-eye-of-bill-gates-nascar/article_e1f9f35a-0d33-5be0-b0d7-0235840563b1.html
What is the purpose to get the car? “900 cars and counting: How one man's secret collection drew international fame”, by Jacob Demmitt, Roanoke Times, 7/29/17 https://www.roanoke.com/townnews/motor_vehicle/cars-and-counting-how-one-man-s-secret-collection-drew/article_cc20c7fa-73a3-11e7-a460-af9d1cae7d48.html

30 years on the Road To Progressively Better Data
30 years on the Road To Progressively Better Data
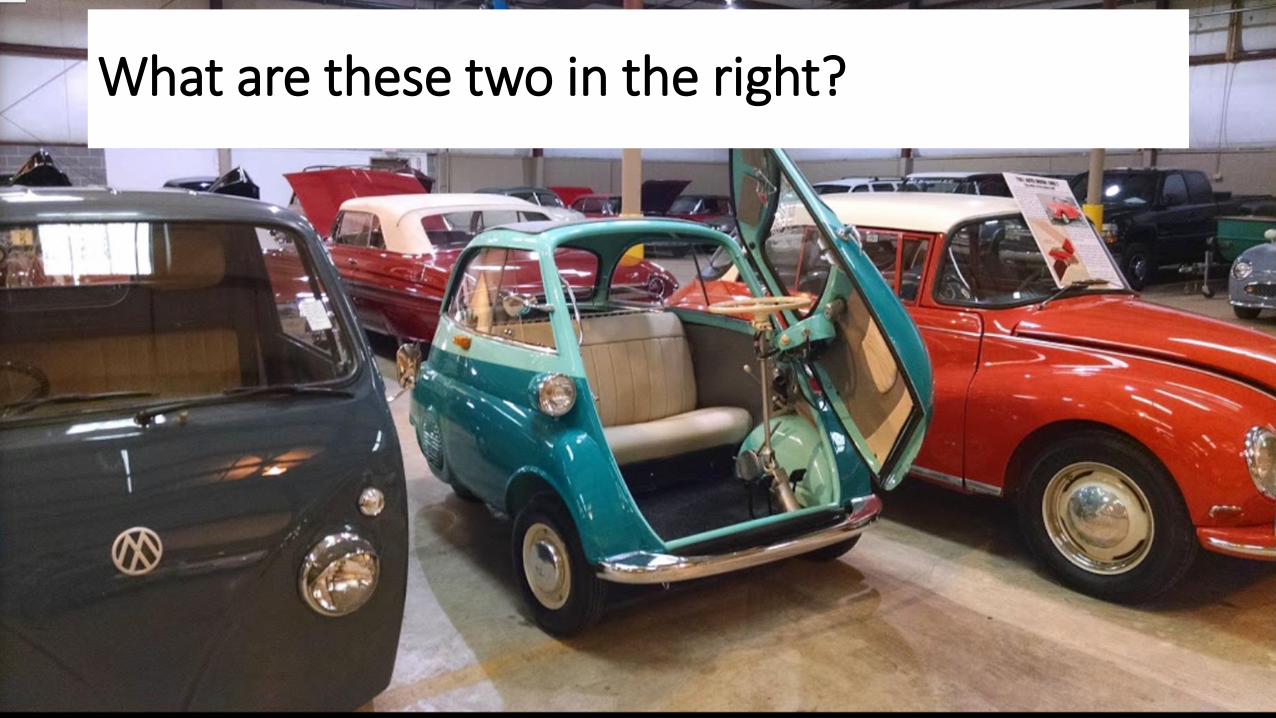
What are these two in the right?

30 years on the Road To Progressively Better Data

30 years on the Road To Progressively Better Data