paul g. spry and robert d. cody - iowapublications.iowa.gov/19964/1/iadot_tr_469_reduction... ·...
TRANSCRIPT
Paul G. Spry and Robert D. Cody Department of Geological & Atmospheric Sciences Iowa State University
Reduction of Concrete Deterioration by Ettringite Using Crystal Growth Inhibition Techniques: Part II Field Evaluation of Inhibitor Effectiveness
~t.. Iowa Department ~'l of Transportation
Final
July, 2004
Sponsored by the Iowa Department of Transportation
Highway Division and the Iowa Highway Research Board
Iowa DOT Project TR - 469
The opinions, findings, and conclusions expressed in this publication are those of the authors and not necessarily those of
the Iowa Department of Transportation.
Paul G. Spry and Robert D. Cody Department of Geological & Atmospheric Sciences
Reduction of Concrete Deterioration by Ettringite Using Crystal Growth Inhibition Techniques: Part II Field Evaluation of Inhibitor Effectiveness
Final
REPORT
July, 2004
Sponsored by the Iowa Department of Transportation
Highway Division and the Iowa Highway Research Board
Iowa DOT Project TR - 469
IOWA STATE UNIVERSITY ~t.. Iowa Department ~.., of Transportation OF SC IEN C E AND TECHNOLOGY
4
Table of Contents Page Number Abstract 8 1. Introduction 9 2. Experimental Design 12
2.1 Field Test on U.S. 20 13
2.2. Roof Experiments 15
2.3. Laboratory Experiments 16
2.4. Nature of Possible Reaction between Ettringite and DTPMP 18
3. Methods of Study 18
3.1 General Procedures and Instrumentation 18
4. Results 19
4.1. Field Test on U.S. 20 19
4.2 Roof Experiments 21
4.3 Laboratory Experiments 23
4.4 Nature of Possible Reaction between Ettringite and DTPMP 26
5. Discussion 26
6. Summary and Conclusions 30
5
7. Acknowledgement 32
8. References 33
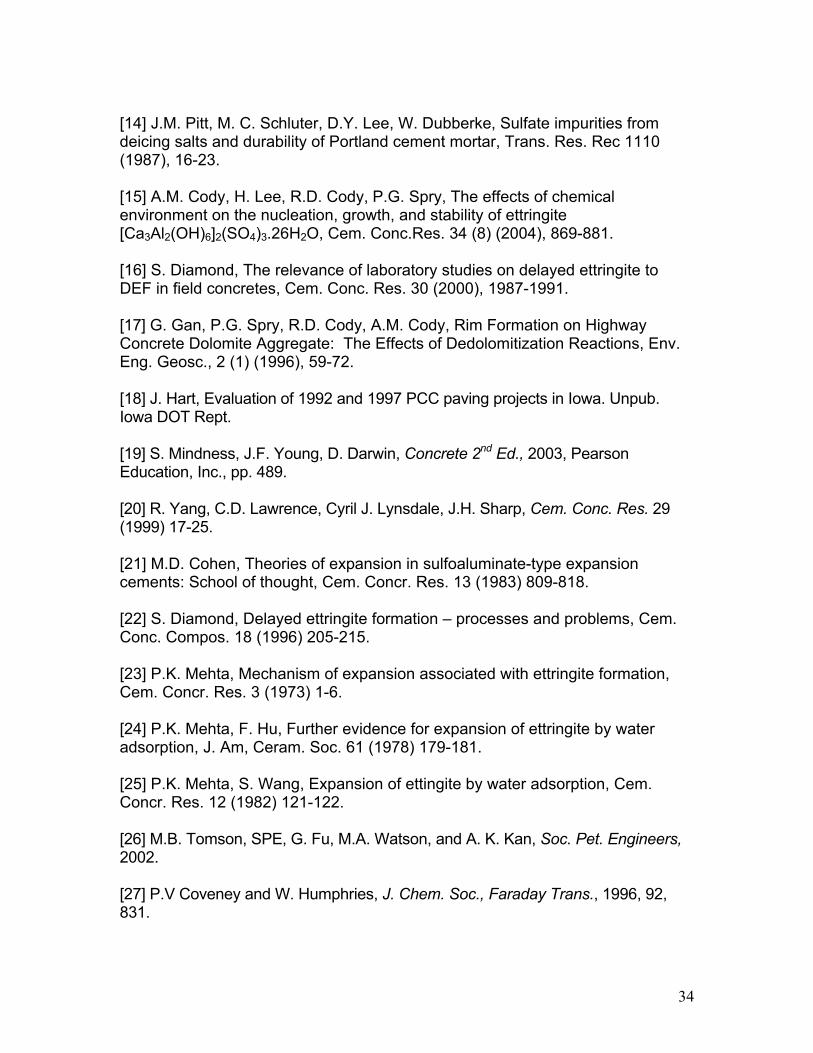
Table 1: Characteristics of Iowa highway concrete cores 35 used in roof, furnace, and freezer experiments.
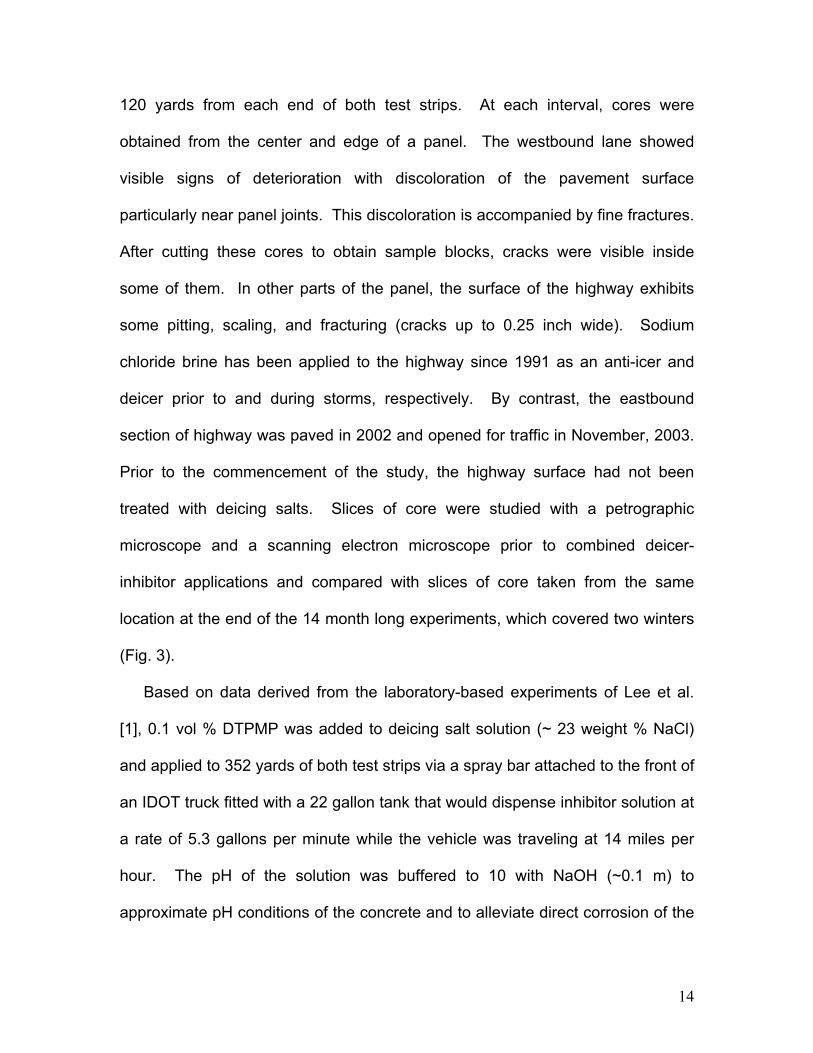
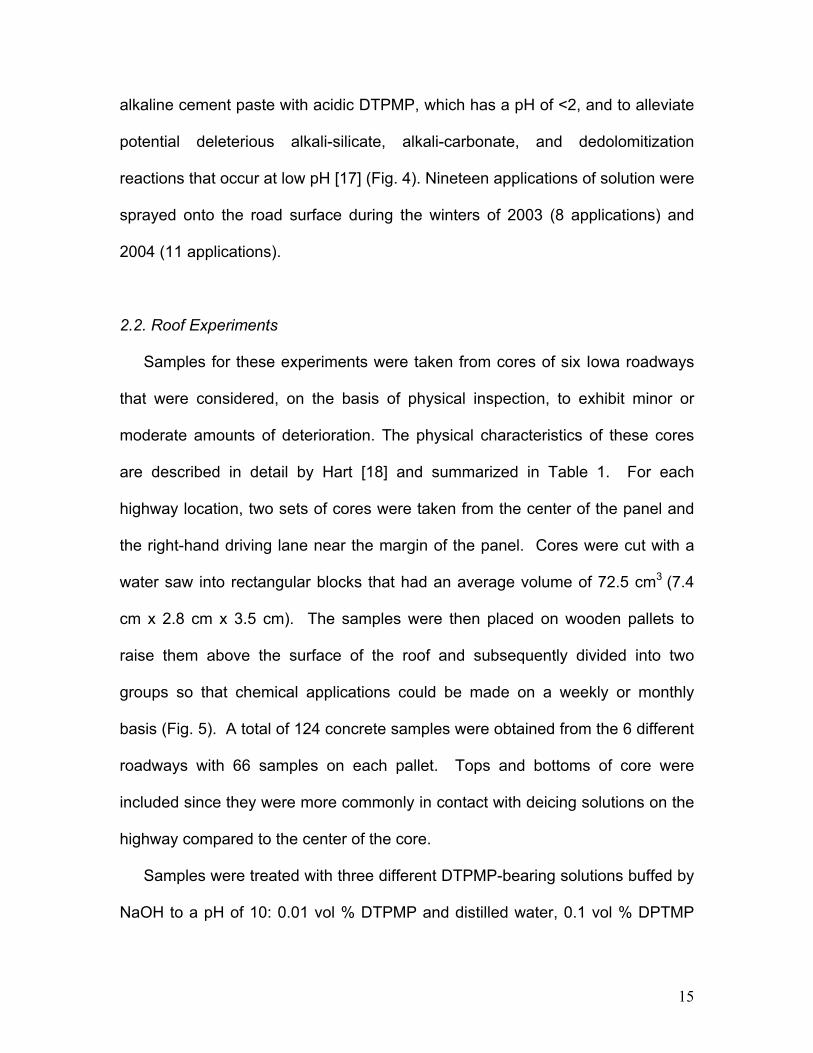
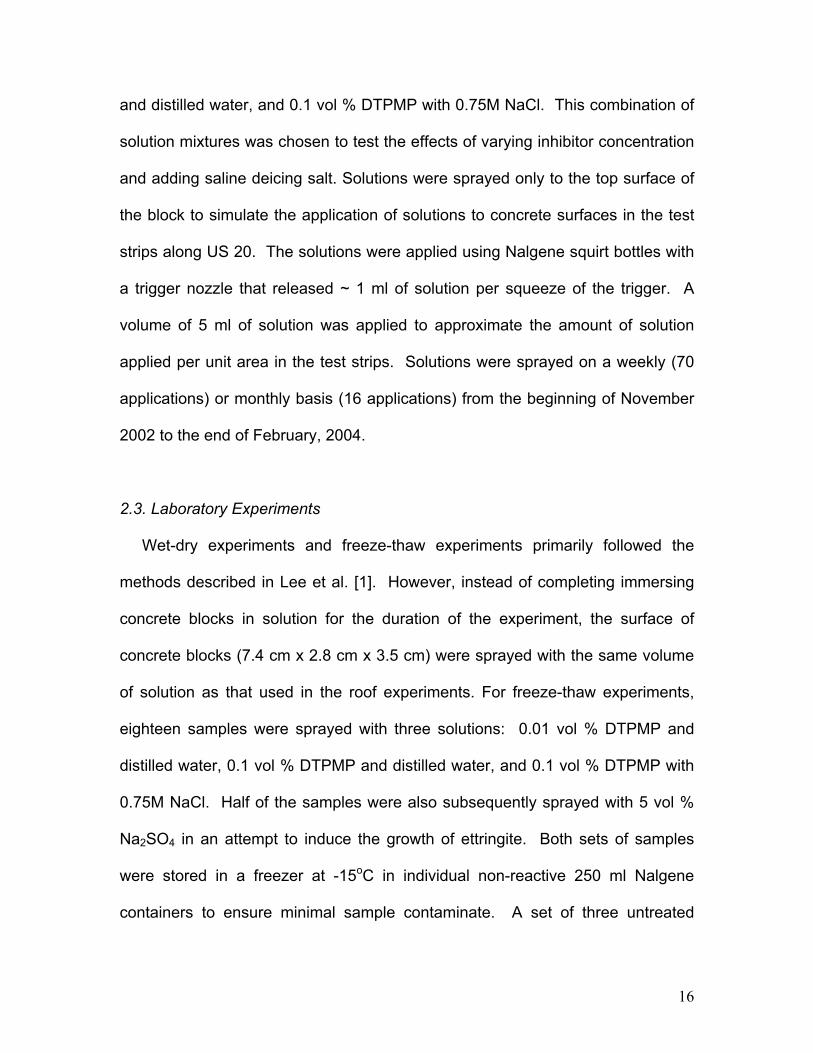
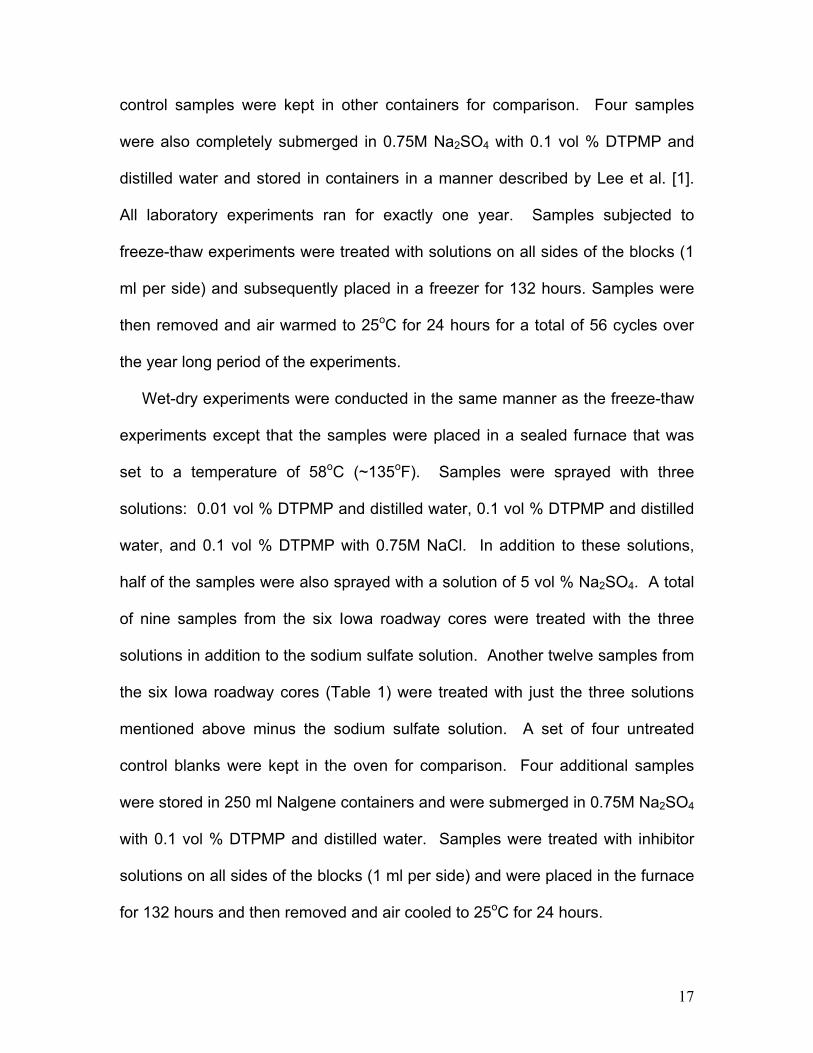
Figure 1. SEM micrograph of large (A) and small (B) air 36 voids lined with well-formed, euhderal ettringite crystals, approximately 20 µm in length in sample “H” treated with sodium sulfate solution. Figure 2. Illustration of Dequest 2060S (DTPMP) molecule - 36 Diethylenetriamine penta (methylene phosphonic acid). Figure 3. Concrete samples O5BB (left) and P3TB (right) 37 showing compositional rims on dolomite particles that formed by dedolomitization reactions associated with the application of NaCl deicing salts. Figure 4. SEM micrographs of treated core samples from the 38 westbound lane of U.S. 20 near Williams, Iowa. A. Ettringite crystals from core sample (E1TB) prior to treatment with inhibitor solution. B. Treated sample of core #1 U.S. 20 westbound, showing very short crystals, 0.23 mm directly below the road surface, coated with portlandite (these crystals are only ~10µm and less in length). C. Profile of treated sample of core #4 U.S. 20 westbound, showing air voids 0.33 mm below road surface. Ettringite crystals are ~20 µm in length but exhibit a different morphology than is normally seen for ettringite. D. Closeup of treated sample of core #2 U.S. 20 westbound, showing unusual morphology. Figure 5. Layout of highway concrete samples on the roof 39 of Science I at Iowa State University. Figure 6. Atomic ratio plots of S/Ca vs. Al/Ca of hydrated 40 Ca-Al sulfate in concrete samples from: A.Experiments
6
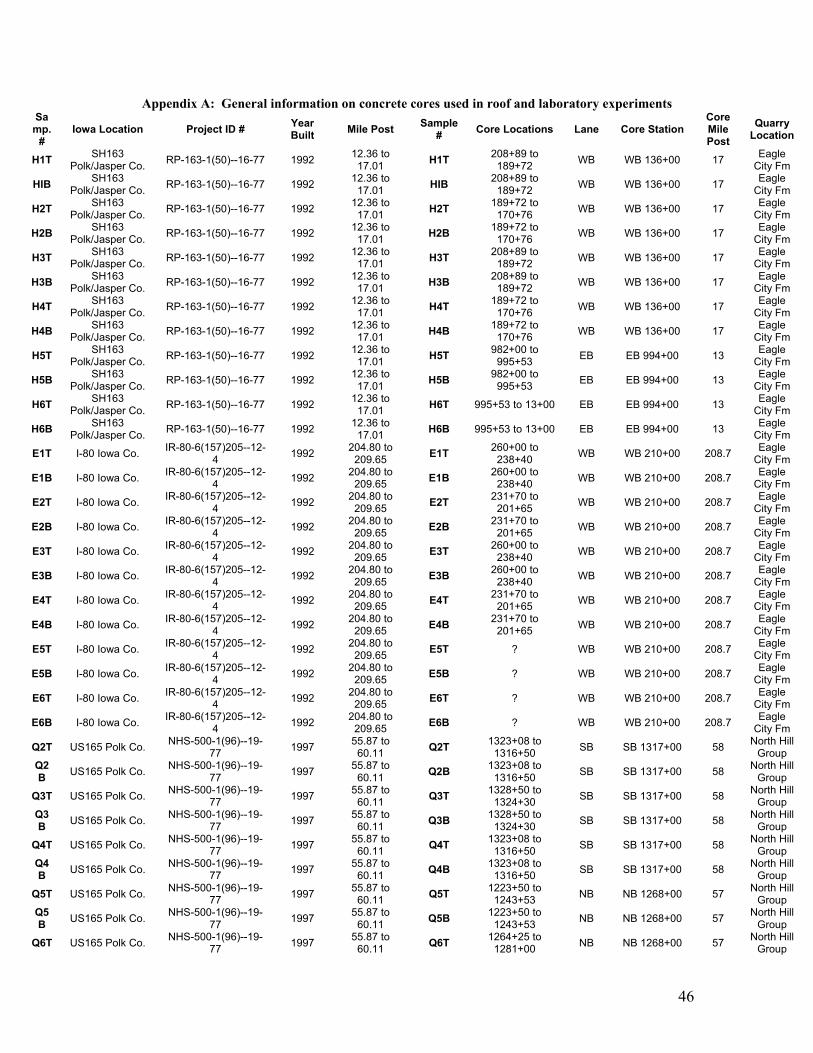
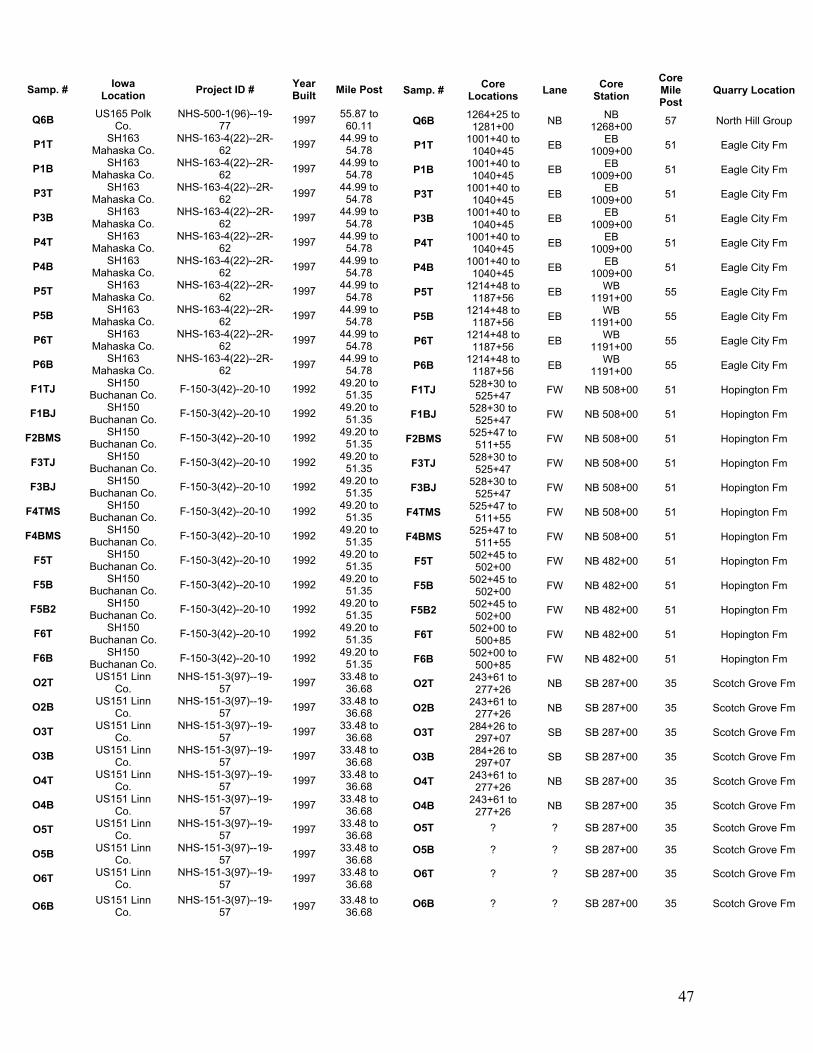
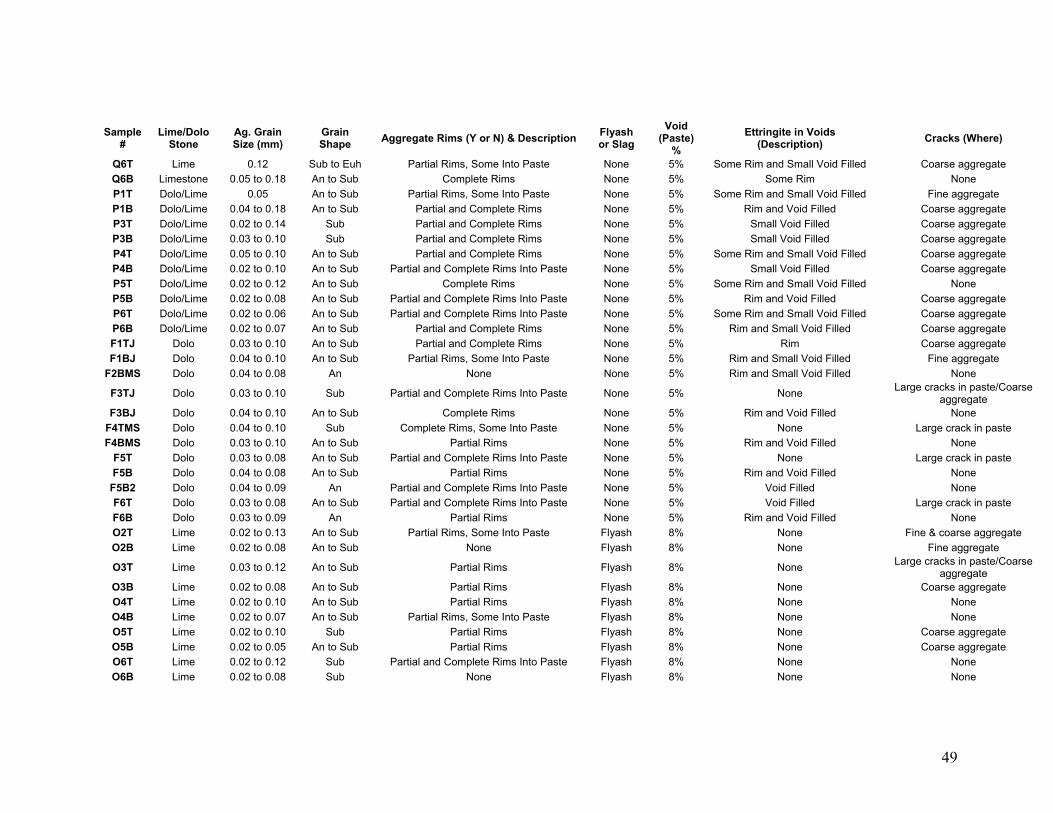
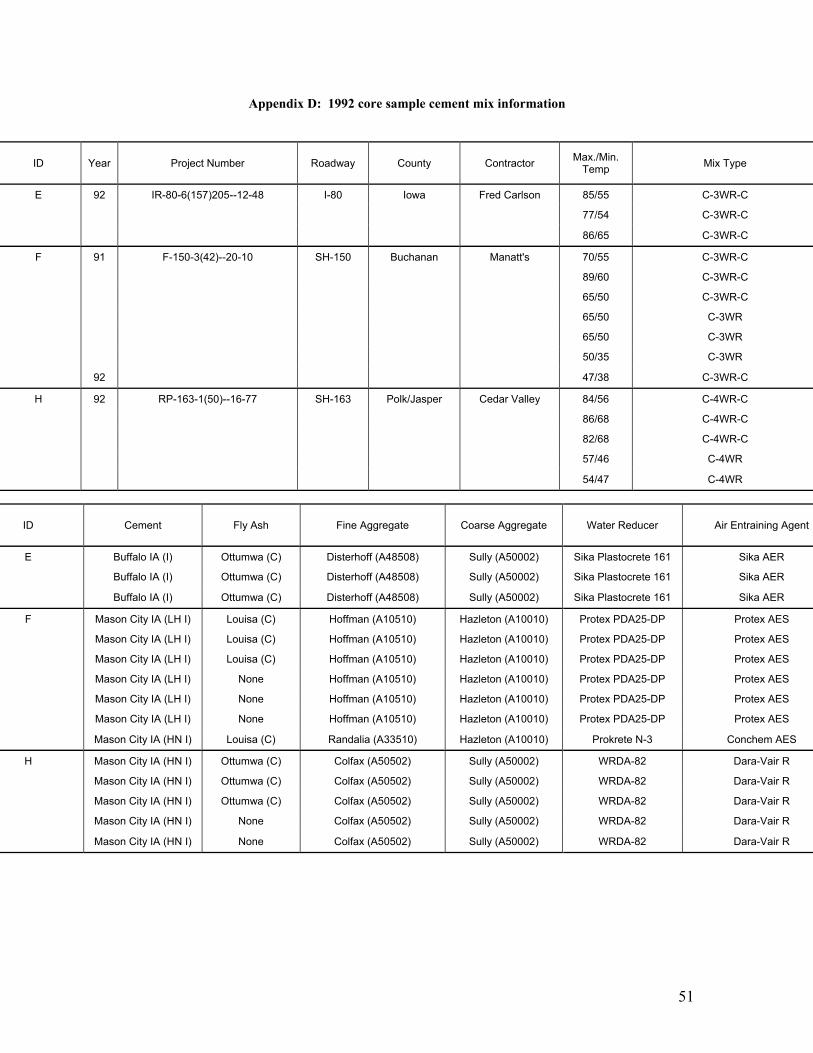
conducted on the roof of Science I at Iowa State University; and B. Controlled freeze-thaw experiments. Note that for bothsets of experiments the sulfate is primarily ettringite with lesser amounts of monosulfate. Figure 7. SEM micrograph of roof sample Q3TM showing a 41 pathway of air voids close to the sample surface that are devoid of ettringite. At a distance of approximately 4 mm from the surface, ettringite remains in the air voids showing the distance the chelating phosphonate solution penetrated. Figure 8. Sample Q3TB was subject to freeze-thaw cycling 42 And application of Dequest 2060S over a one year period and shows signs of pitting, scaling, and cracking. Figure 9. SEM micrograph of sample Q3TB. Near the 43 surface, air voids contain no ettringite but instead trace amounts of alite and belite. At a distance of 2 mm from the surface, euhedral crystals of ettringite line the walls of the air voids. Figure 10. SEM micrograph of stunted ettringite crystals 44 (~10-15 µm in length) in sample H4TB. Figure 11. Electrospray mass spectrometry spectrum in 45 negative ionization mode of deprotonated DTPMP molecule (molecular weight = 572.2), with a Ca2+ and a water molecule adsorbed onothe phosphonate molecule (molecular weight = 628.1) and other unidentifiable species. Appendix A: General information on concrete cores used 46 in roof and laboratory experiments. Appendix B: Summary of etrographic observations of 48 concrete core samples. Appendix C: Percentage of S-bearing minerals (pyrite and 50 gypsum) and members of the system Fe-O-H in roadway cores used in roof and laboratory experiments Appendix D: 1992 core sample cement mix information 51

7
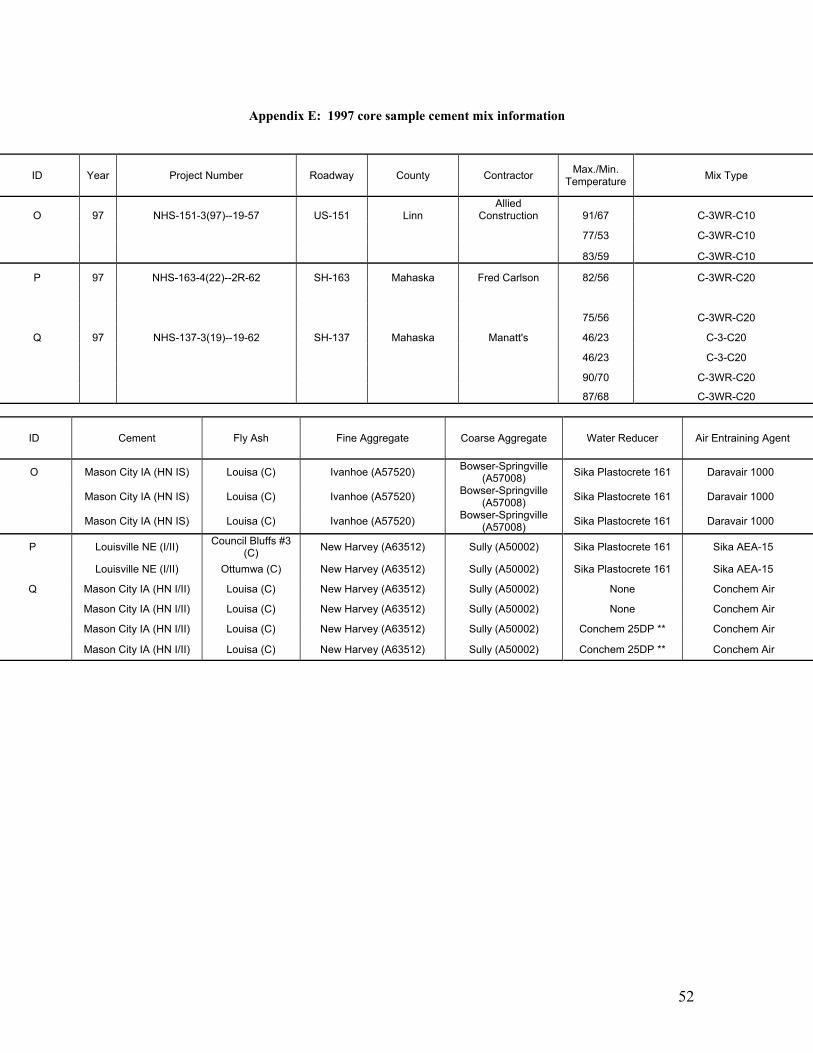
Appendix E: 1997 core sample cement mix information 52 Appendix F: U.S. 20 core sample cement mix information 53
8
Abstract
The effects of diethylenetriaminpenta(methylenephosphonic acid) (DTPMP) a
phosphonate inhibitor, on the growth of delayed ettringite have been evaluated
using concrete in highway US 20 near Williams, Iowa, and the cores of six
highways subject to moderate (built in 1992) or minor (built in 1997) deterioration.
Application of 0.01 and 0.1 vol. % DTPMP to cores was made on a weekly or
monthly basis for one year under controlled laboratory-based freeze-thaw and
wet-dry conditions over a temperature range of -15o to 58oC to mimic extremes in
Iowa roadway conditions. The same concentrations of phosphonate were also
applied to cores left outside (roof of Science I at Iowa State University) over the
same period of time. Nineteen applications of 0.1 vol % DTPMP with added
deicing salt solution (~ 23 weight % NaCl) were made to US 20 during the
winters of 2003 and 2004. In untreated samples, air voids, pores, and occasional
cracks are lined with acicular ettringite crystals (up to 50 µm in length) whereas
air voids, pores, and cracks in concrete from the westbound lane of US 20 are
devoid of ettringite up to a depth of ~0.5 mm from the surface of the concrete.
Ettringite is also absent in zones up to 6 mm from the surface of concrete slabs
placed on the roof of Science I and cores subject to laboratory-based freeze-
thaw experiments. In these zones, the relatively high concentration of DTPMP
caused it to behave as a chelator. Stunted ettringite crystals 5 to 25 µm in
length, occasionally coated with portlandite, form on the margins of these zones
indicating that in these areas DTPMP behaved as an inhibitor due to a reduction
in the concentration of phosphonate. Analyses of mixes of ettringite and DTPMP
9
using electrospray mass spectrometry suggests that the stunting of ettringite
growth is caused by the adsorption of a Ca2+ ion and a water molecule to
deprotonated DTPMP on the surface of the {0001} face of ettringite. It is
anticipated that by using a DTPMP concentration of between 0.001 and 0.01 vol
% for the extended life of a highway (i.e. >20 years), deterioration caused by the
expansive growth of ettringite will be markedly reduced.
1. Introduction
During their service lives, Iowa roadways are susceptible to premature
deterioration due to the growth of expansive secondary minerals in the concrete
paste. These secondary minerals form years after initial highway construction
and include: calcite (CaCO3), portlandite (Ca(OH)2), brucite (Mg(OH)2), and
ettringite (Ca6Al2(SO4)3(OH)12.26H2O). Of these minerals, delayed ettringite is
probably the most abundant [1].
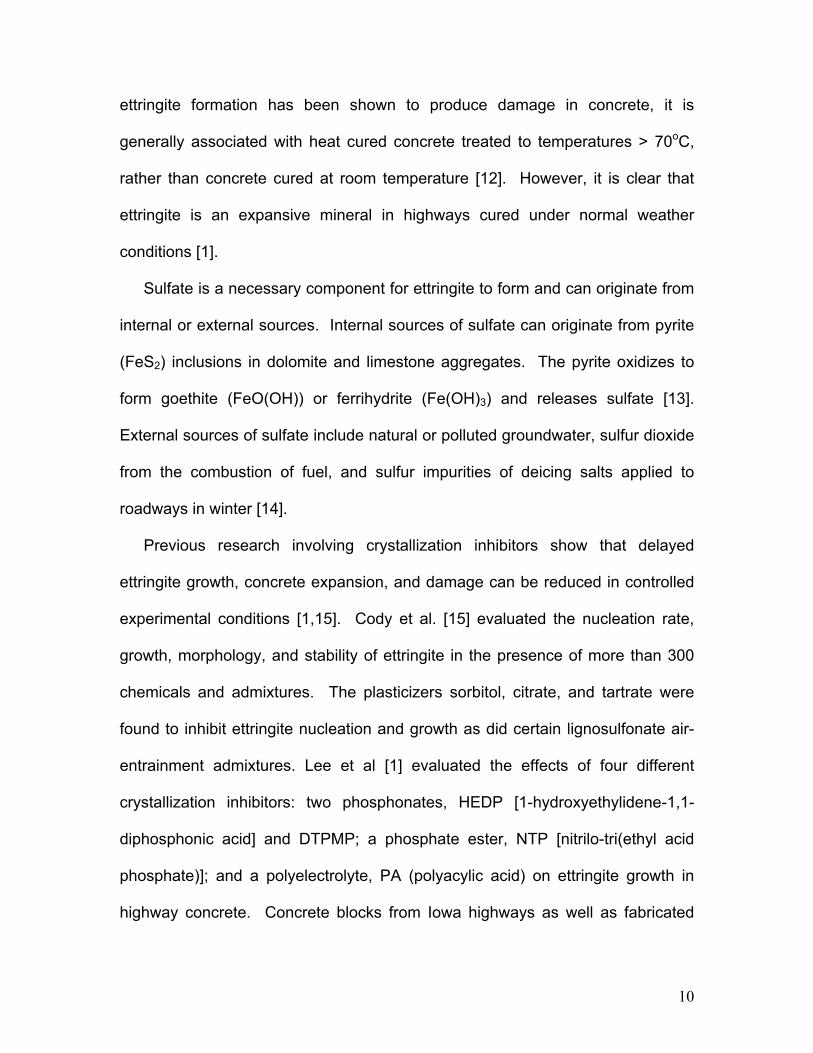
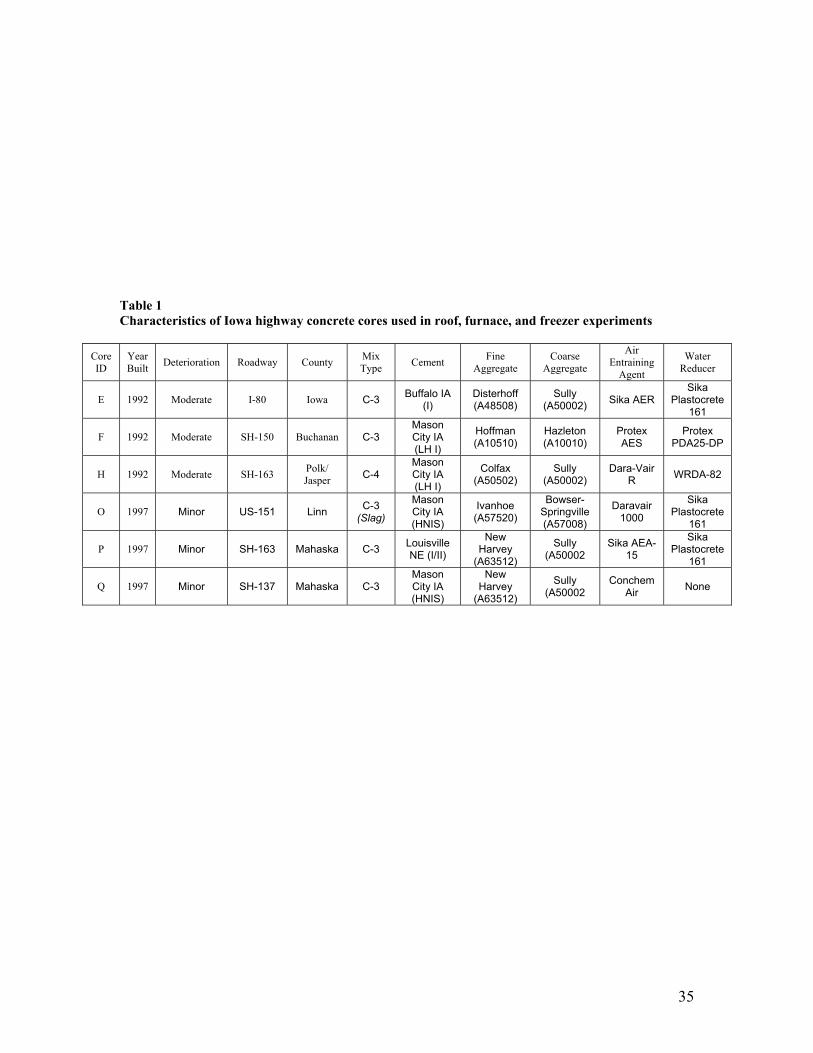
Delayed ettringite in Iowa highways commonly fills microscopic pores and
small air voids (<100 µm in diameter) and lines the margins of large air voids (>
100µm in diameter) (Fig. 1) and occasional cracks. There is considerable
controversy in the literature concerning whether cracking in cement paste is
caused by the expansive growth of ettringite [1-6] or whether ettringite forms after
crack development [7-11]. Regardless of its role in concrete deterioration,
previous research has shown the expansive nature of delayed ettringite, but the
mechanisms involving expansion remain in doubt since it is unclear whether they
are topochemical in nature or due to through solution [1]. Where delayed
10
ettringite formation has been shown to produce damage in concrete, it is
generally associated with heat cured concrete treated to temperatures > 70oC,
rather than concrete cured at room temperature [12]. However, it is clear that
ettringite is an expansive mineral in highways cured under normal weather
conditions [1].
Sulfate is a necessary component for ettringite to form and can originate from
internal or external sources. Internal sources of sulfate can originate from pyrite
(FeS2) inclusions in dolomite and limestone aggregates. The pyrite oxidizes to
form goethite (FeO(OH)) or ferrihydrite (Fe(OH)3) and releases sulfate [13].
External sources of sulfate include natural or polluted groundwater, sulfur dioxide
from the combustion of fuel, and sulfur impurities of deicing salts applied to
roadways in winter [14].
Previous research involving crystallization inhibitors show that delayed
ettringite growth, concrete expansion, and damage can be reduced in controlled
experimental conditions [1,15]. Cody et al. [15] evaluated the nucleation rate,
growth, morphology, and stability of ettringite in the presence of more than 300
chemicals and admixtures. The plasticizers sorbitol, citrate, and tartrate were
found to inhibit ettringite nucleation and growth as did certain lignosulfonate air-
entrainment admixtures. Lee et al [1] evaluated the effects of four different
crystallization inhibitors: two phosphonates, HEDP [1-hydroxyethylidene-1,1-
diphosphonic acid] and DTPMP; a phosphate ester, NTP [nitrilo-tri(ethyl acid
phosphate)]; and a polyelectrolyte, PA (polyacylic acid) on ettringite growth in
highway concrete. Concrete blocks from Iowa highways as well as fabricated
11
and cured type I mortar (without coarse aggregate) were subjected to continuous
immersion, wet/dry cycling, and freeze-thaw cycling in sodium sulfate solutions
and in sodium sulfate solutions containing an inhibitor. The sodium sulfate
ensured the growth of abundant ettringite crystals in the cement paste. The two
phosphonate inhibitors were effective in reducing ettringite nucleation and growth
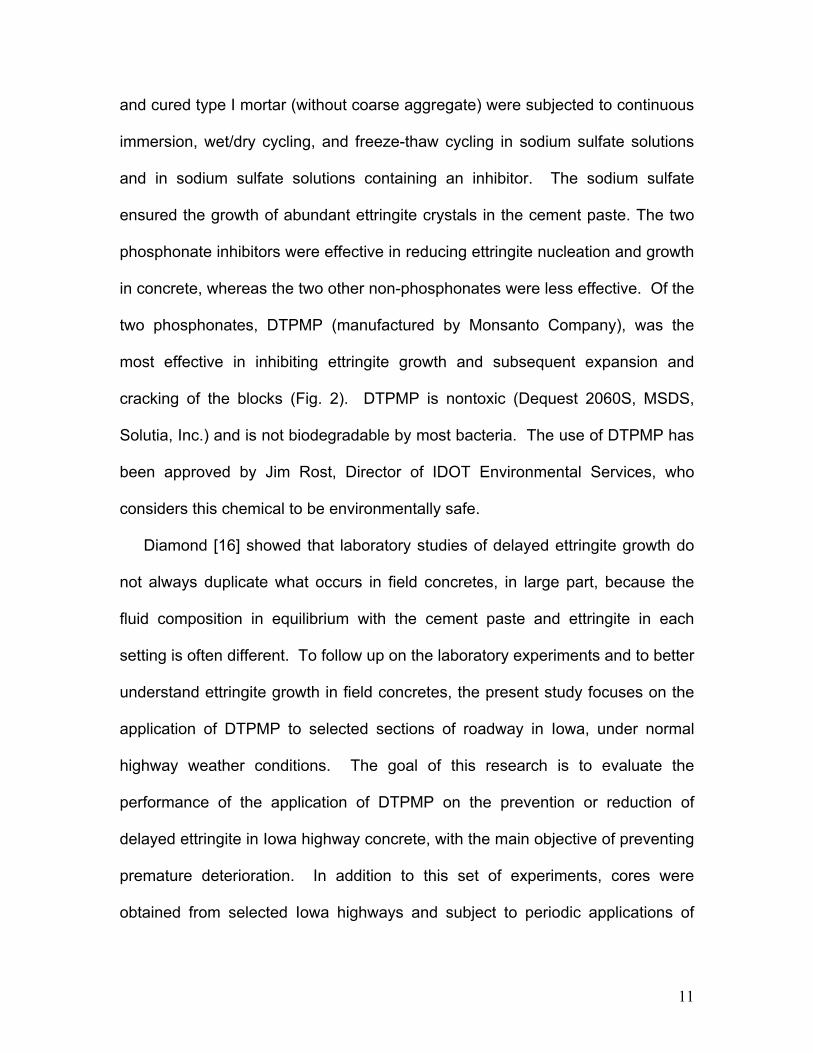
in concrete, whereas the two other non-phosphonates were less effective. Of the
two phosphonates, DTPMP (manufactured by Monsanto Company), was the
most effective in inhibiting ettringite growth and subsequent expansion and
cracking of the blocks (Fig. 2). DTPMP is nontoxic (Dequest 2060S, MSDS,
Solutia, Inc.) and is not biodegradable by most bacteria. The use of DTPMP has
been approved by Jim Rost, Director of IDOT Environmental Services, who
considers this chemical to be environmentally safe.
Diamond [16] showed that laboratory studies of delayed ettringite growth do
not always duplicate what occurs in field concretes, in large part, because the
fluid composition in equilibrium with the cement paste and ettringite in each
setting is often different. To follow up on the laboratory experiments and to better
understand ettringite growth in field concretes, the present study focuses on the
application of DTPMP to selected sections of roadway in Iowa, under normal
highway weather conditions. The goal of this research is to evaluate the
performance of the application of DTPMP on the prevention or reduction of
delayed ettringite in Iowa highway concrete, with the main objective of preventing
premature deterioration. In addition to this set of experiments, cores were
obtained from selected Iowa highways and subject to periodic applications of
12
DTPMP at different concentrations under wet-dry, freeze-thaw and real weather
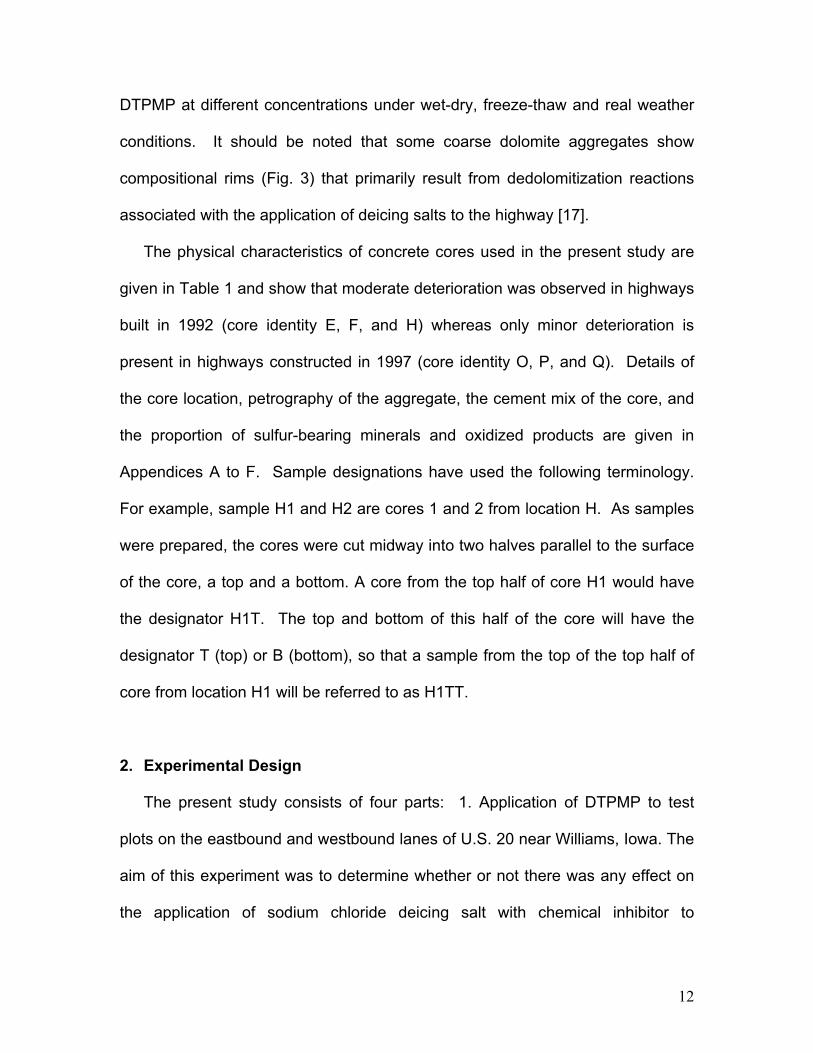
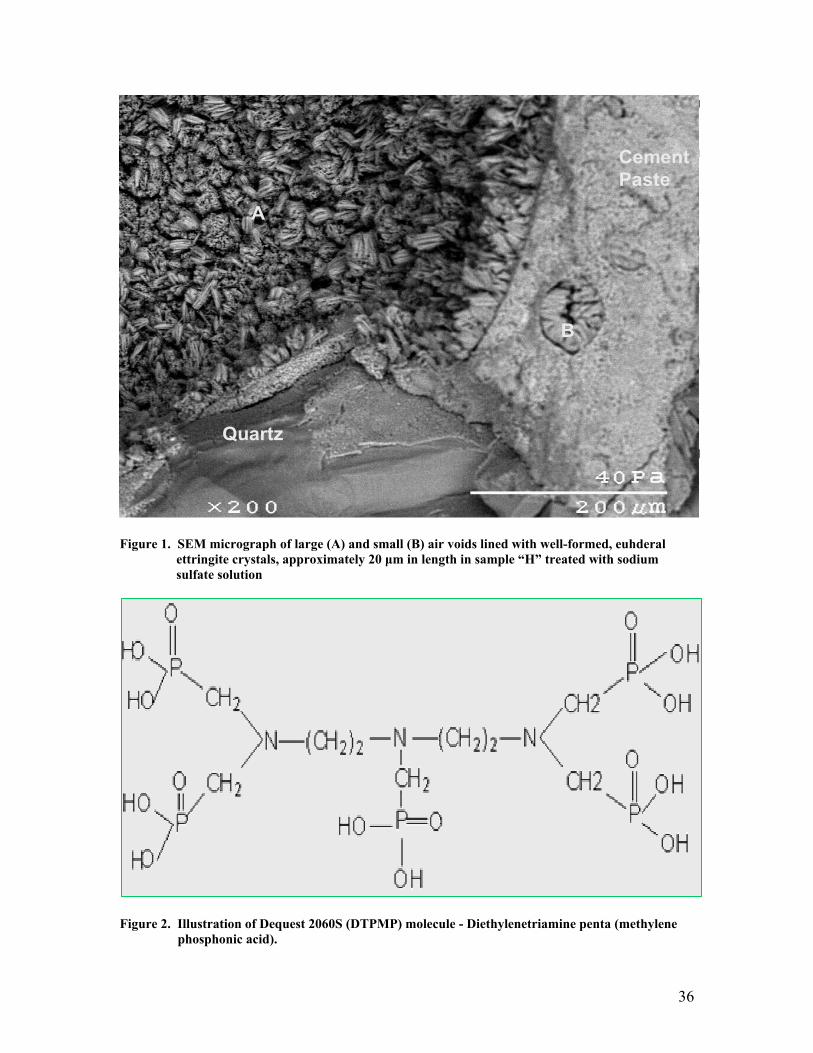
conditions. It should be noted that some coarse dolomite aggregates show
compositional rims (Fig. 3) that primarily result from dedolomitization reactions
associated with the application of deicing salts to the highway [17].
The physical characteristics of concrete cores used in the present study are
given in Table 1 and show that moderate deterioration was observed in highways
built in 1992 (core identity E, F, and H) whereas only minor deterioration is
present in highways constructed in 1997 (core identity O, P, and Q). Details of
the core location, petrography of the aggregate, the cement mix of the core, and
the proportion of sulfur-bearing minerals and oxidized products are given in
Appendices A to F. Sample designations have used the following terminology.
For example, sample H1 and H2 are cores 1 and 2 from location H. As samples
were prepared, the cores were cut midway into two halves parallel to the surface
of the core, a top and a bottom. A core from the top half of core H1 would have
the designator H1T. The top and bottom of this half of the core will have the
designator T (top) or B (bottom), so that a sample from the top of the top half of
core from location H1 will be referred to as H1TT.
2. Experimental Design
The present study consists of four parts: 1. Application of DTPMP to test
plots on the eastbound and westbound lanes of U.S. 20 near Williams, Iowa. The
aim of this experiment was to determine whether or not there was any effect on
the application of sodium chloride deicing salt with chemical inhibitor to
13
deteriorated highway (westbound) and to newly made highway that contained
slag (eastbound). This was a relatively short-term project as applications were
only made over two winters immediately prior to storm activity. Ideally,
applications should be made and studied for a period of at least 10 years to
evaluate the long-term effects of the inhibitor on ettringite growth in Iowa
highways. 2. Application of DTPMP to samples of cores collected from roadways
in Iowa built in 1992 and 1997. These samples were exposed to normal weather
conditions as they were stored in the open on the rooftop of Science I at Iowa
State University. Applications of deicing salt solution and chemical inhibitor were
made on a weekly basis, regardless of weather conditions, to simulate the effects
of long-term (multi-year) applications of deicing salt and chemical inhibitor. 3.
Samples of core from roadways built in 1992 and 1997 were stored in a furnace
and a freezer and subjected to DTPMP to mimic the extreme temperatures (-15o
to 58oC) that can occur on highways in Iowa. 4. An experiment was conducted to
evaluate possible chelating or inhibiting effects of DTPMP on ettringite. This
experiment involved the determination of species using electrospray mass
spectrometry that are produced when ettringite was added to inhibitor solution.
2.1. Field Test on U.S. 20
Two separate sections of highway were treated, one on the westbound
lane of US 20 between mile markers 157.65 and 157.85 and the other on the
eastbound lane between mile markers 168.80 and 169.00. Prior to the
application of the inhibitor, four cores were taken from the highway approximately
14
120 yards from each end of both test strips. At each interval, cores were
obtained from the center and edge of a panel. The westbound lane showed
visible signs of deterioration with discoloration of the pavement surface
particularly near panel joints. This discoloration is accompanied by fine fractures.
After cutting these cores to obtain sample blocks, cracks were visible inside
some of them. In other parts of the panel, the surface of the highway exhibits
some pitting, scaling, and fracturing (cracks up to 0.25 inch wide). Sodium
chloride brine has been applied to the highway since 1991 as an anti-icer and
deicer prior to and during storms, respectively. By contrast, the eastbound
section of highway was paved in 2002 and opened for traffic in November, 2003.
Prior to the commencement of the study, the highway surface had not been
treated with deicing salts. Slices of core were studied with a petrographic
microscope and a scanning electron microscope prior to combined deicer-
inhibitor applications and compared with slices of core taken from the same
location at the end of the 14 month long experiments, which covered two winters
(Fig. 3).
Based on data derived from the laboratory-based experiments of Lee et al.
[1], 0.1 vol % DTPMP was added to deicing salt solution (~ 23 weight % NaCl)
and applied to 352 yards of both test strips via a spray bar attached to the front of
an IDOT truck fitted with a 22 gallon tank that would dispense inhibitor solution at
a rate of 5.3 gallons per minute while the vehicle was traveling at 14 miles per
hour. The pH of the solution was buffered to 10 with NaOH (~0.1 m) to
approximate pH conditions of the concrete and to alleviate direct corrosion of the
15
alkaline cement paste with acidic DTPMP, which has a pH of <2, and to alleviate
potential deleterious alkali-silicate, alkali-carbonate, and dedolomitization
reactions that occur at low pH [17] (Fig. 4). Nineteen applications of solution were
sprayed onto the road surface during the winters of 2003 (8 applications) and
2004 (11 applications).
2.2. Roof Experiments
Samples for these experiments were taken from cores of six Iowa roadways
that were considered, on the basis of physical inspection, to exhibit minor or
moderate amounts of deterioration. The physical characteristics of these cores
are described in detail by Hart [18] and summarized in Table 1. For each
highway location, two sets of cores were taken from the center of the panel and
the right-hand driving lane near the margin of the panel. Cores were cut with a
water saw into rectangular blocks that had an average volume of 72.5 cm3 (7.4
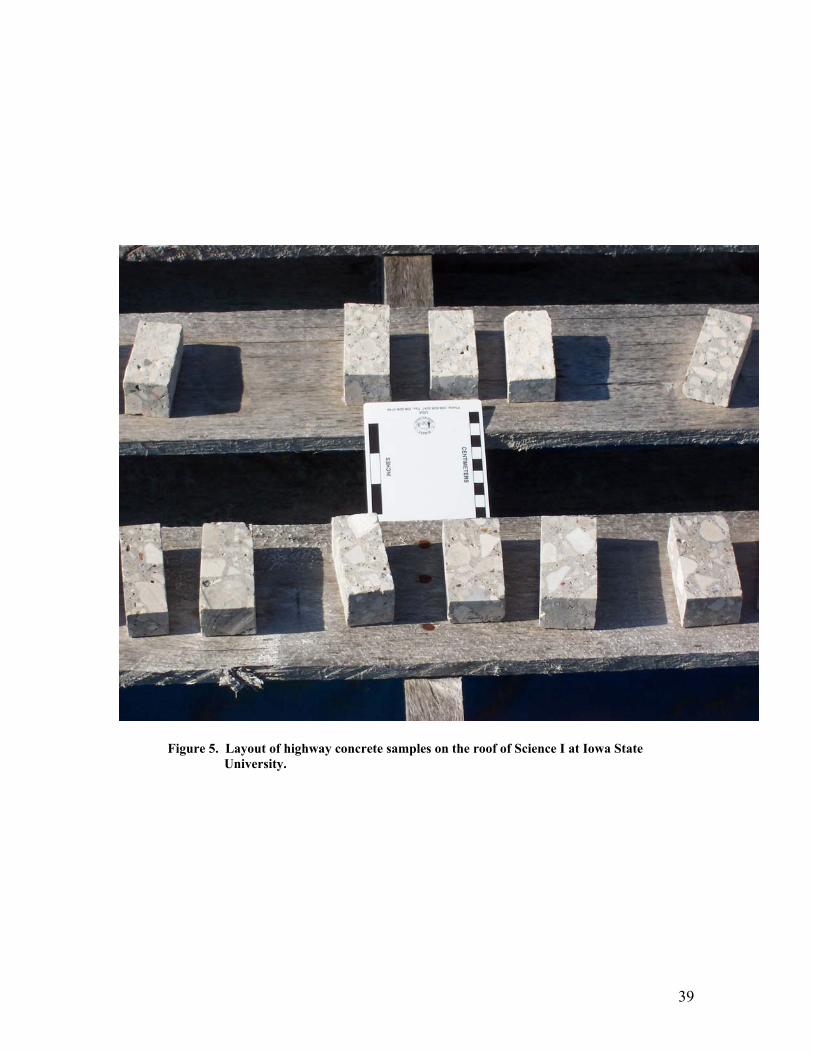
cm x 2.8 cm x 3.5 cm). The samples were then placed on wooden pallets to
raise them above the surface of the roof and subsequently divided into two
groups so that chemical applications could be made on a weekly or monthly
basis (Fig. 5). A total of 124 concrete samples were obtained from the 6 different
roadways with 66 samples on each pallet. Tops and bottoms of core were
included since they were more commonly in contact with deicing solutions on the
highway compared to the center of the core.
Samples were treated with three different DTPMP-bearing solutions buffed by
NaOH to a pH of 10: 0.01 vol % DTPMP and distilled water, 0.1 vol % DPTMP
16
and distilled water, and 0.1 vol % DTPMP with 0.75M NaCl. This combination of
solution mixtures was chosen to test the effects of varying inhibitor concentration
and adding saline deicing salt. Solutions were sprayed only to the top surface of
the block to simulate the application of solutions to concrete surfaces in the test
strips along US 20. The solutions were applied using Nalgene squirt bottles with
a trigger nozzle that released ~ 1 ml of solution per squeeze of the trigger. A
volume of 5 ml of solution was applied to approximate the amount of solution
applied per unit area in the test strips. Solutions were sprayed on a weekly (70
applications) or monthly basis (16 applications) from the beginning of November
2002 to the end of February, 2004.
2.3. Laboratory Experiments
Wet-dry experiments and freeze-thaw experiments primarily followed the
methods described in Lee et al. [1]. However, instead of completing immersing
concrete blocks in solution for the duration of the experiment, the surface of
concrete blocks (7.4 cm x 2.8 cm x 3.5 cm) were sprayed with the same volume
of solution as that used in the roof experiments. For freeze-thaw experiments,
eighteen samples were sprayed with three solutions: 0.01 vol % DTPMP and
distilled water, 0.1 vol % DTPMP and distilled water, and 0.1 vol % DTPMP with
0.75M NaCl. Half of the samples were also subsequently sprayed with 5 vol %
Na2SO4 in an attempt to induce the growth of ettringite. Both sets of samples
were stored in a freezer at -15oC in individual non-reactive 250 ml Nalgene
containers to ensure minimal sample contaminate. A set of three untreated
17
control samples were kept in other containers for comparison. Four samples
were also completely submerged in 0.75M Na2SO4 with 0.1 vol % DTPMP and
distilled water and stored in containers in a manner described by Lee et al. [1].
All laboratory experiments ran for exactly one year. Samples subjected to
freeze-thaw experiments were treated with solutions on all sides of the blocks (1
ml per side) and subsequently placed in a freezer for 132 hours. Samples were
then removed and air warmed to 25oC for 24 hours for a total of 56 cycles over
the year long period of the experiments.
Wet-dry experiments were conducted in the same manner as the freeze-thaw
experiments except that the samples were placed in a sealed furnace that was
set to a temperature of 58oC (~135oF). Samples were sprayed with three
solutions: 0.01 vol % DTPMP and distilled water, 0.1 vol % DTPMP and distilled
water, and 0.1 vol % DTPMP with 0.75M NaCl. In addition to these solutions,
half of the samples were also sprayed with a solution of 5 vol % Na2SO4. A total
of nine samples from the six Iowa roadway cores were treated with the three
solutions in addition to the sodium sulfate solution. Another twelve samples from
the six Iowa roadway cores (Table 1) were treated with just the three solutions
mentioned above minus the sodium sulfate solution. A set of four untreated
control blanks were kept in the oven for comparison. Four additional samples
were stored in 250 ml Nalgene containers and were submerged in 0.75M Na2SO4
with 0.1 vol % DTPMP and distilled water. Samples were treated with inhibitor
solutions on all sides of the blocks (1 ml per side) and were placed in the furnace
for 132 hours and then removed and air cooled to 25oC for 24 hours.
18
2.4. Nature of Possible Reaction between Ettringite and DTPMP
An electrospray mass spectrometer was used to try and better understand
any chemical reaction that may have taken place in solution between ettringite
and DTPMP. Ettringite was synthesized by dissolving Al2(SO4)3.18H2O (Fisher
lot 030165) in deionized water and by combining it with a saturated solution of
Ca(OH)2 (Fisher lot 028280) using the technique described by Cody et al. [11].
Both solutions were filtered prior to mixing and the combined solution allowed to
sit at room for 24 hours whereupon ettringite was filtered from solution and
allowed to air dry. 0.6 g of ettringite was subsequently combined with 250 ml of
0.1 vol % DTPMP and deionized water, with NaOH added to increase the pH to
10. First a blank solution of deionized water was run to set a baseline to
eliminate background peaks. Then a solution with a concentration of 2.4 g/l of
ettringite was obtained and 20 µl of this solution was diluted to 0.4 mM and
introduced into a Finnigan TSQ700 electrospray mass spectrometer. To work
out potential species in this solution a spectrum in negative ionization mode was
obtained of a solution containing 0.1% vol DTPMP with ettringite.
3. Methods of Study
3.1 General Procedures and Instrumentation
Petrographic analyses of thin-sections were conducted with both transmitted
and reflected light utilizing a standard petrographic polarizing microscope to
19
identify minerals and textures. Pieces of concrete core rather than polished thin
sections of concrete were studied with a Hitachi S 2460 reduced-vacuum
scanning electron microscope (SEM) because polishing of the thin section would
likely remove or reduce soluble components. Back-scattered images obtained
with the SEM were taken and energy dispersive analytical X-ray (EDAX) area
maps were collected for Si, Al, K, Na, O, Ca, Mg, S, Cl, P, and Fe. EDAX point
analyses were obtained at high magnification for qualitative mineral identification.
An accelerating voltage of 20 kV was generally used for imaging and EDAX point
analysis.
A Finnigan TSQ700 electrospray mass spectrometer was used to determine
potential chemical reactions that occurred in solution between DTPMP and
ettringite. The TSQ700 instrument was equipped with an API 2 interface to run in
negative electrospray ionization mode. The operating voltage was set 4.5 kV
with a capillary temperature of 250ºC and a sheath gas (nitrogen) pressure of 80
psi.
4. Results
4.1. Field Test on U.S. 20
Cores taken from test plots along the eastbound and westbound lanes at the
end of the nineteen deicer-inhibitor applications were compared with the cores
taken prior to the application of inhibitor solutions. SEM images showed that the
top surface of both treated and non-treated cores contained no ettringite in air
voids or large pores. This is probably due to the dynamic nature of the driving
20
surface of a roadway as the tire tread of a vehicle interacts with the road surface.
The four cores taken from the eastbound section of U.S. 20 in this field test
showed no physical, textural, or mineralogical differences to the original cores
taken before the application of inhibitor solutions, except for a slight discoloration
that could be seen from a cross section of the core. The discoloration (white
instead of the normal blue-gray color) occurred 3 to 4 cm from the surface of the
core and is a result of hydration of slag, which is an integral component of the
concrete paste in the eastbound lane. Petrographic and scanning electron
microscopy did not show any evidence of the presence of primary, secondary or
delayed ettringite in air voids or large pores. This result is hardly surprising
because the presence of slag reduces the amount of cement paste that contains
sulfate and chemically reacts with calcium hydroxide so that calcium hydroxide is
converted to calcium silicate hydrate instead of being converted to gypsum which
can then form ettringite [19]. Moreover, this section of roadway is only 2 to 3
years old and delayed ettringite may have not had sufficient time to grow.
The field test conducted on the westbound lanes yielded completely
different results than the non-reactive eastbound section. The westbound
section of U.S. 20 is composed of a C-3 cement mix and is devoid of slag. SEM
studies show the presence of abundant ettringite in air voids and large pores
throughout the cores obtained prior to and after the deicer-inhibitor applications.
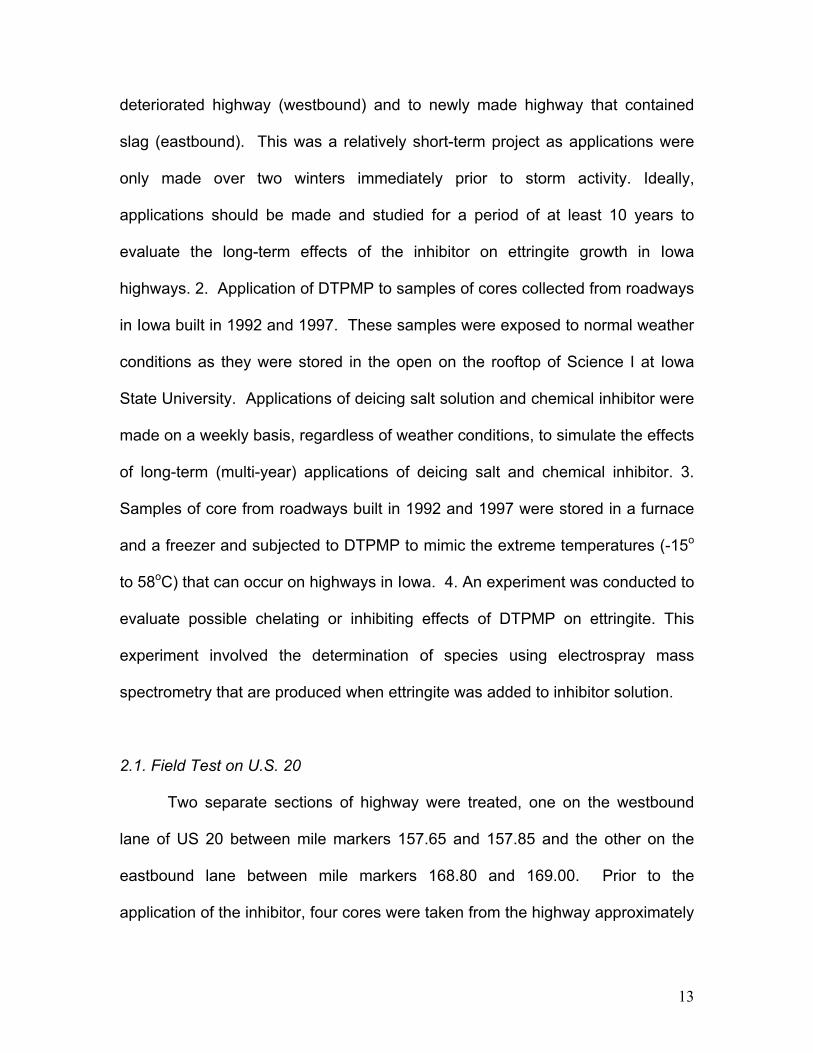
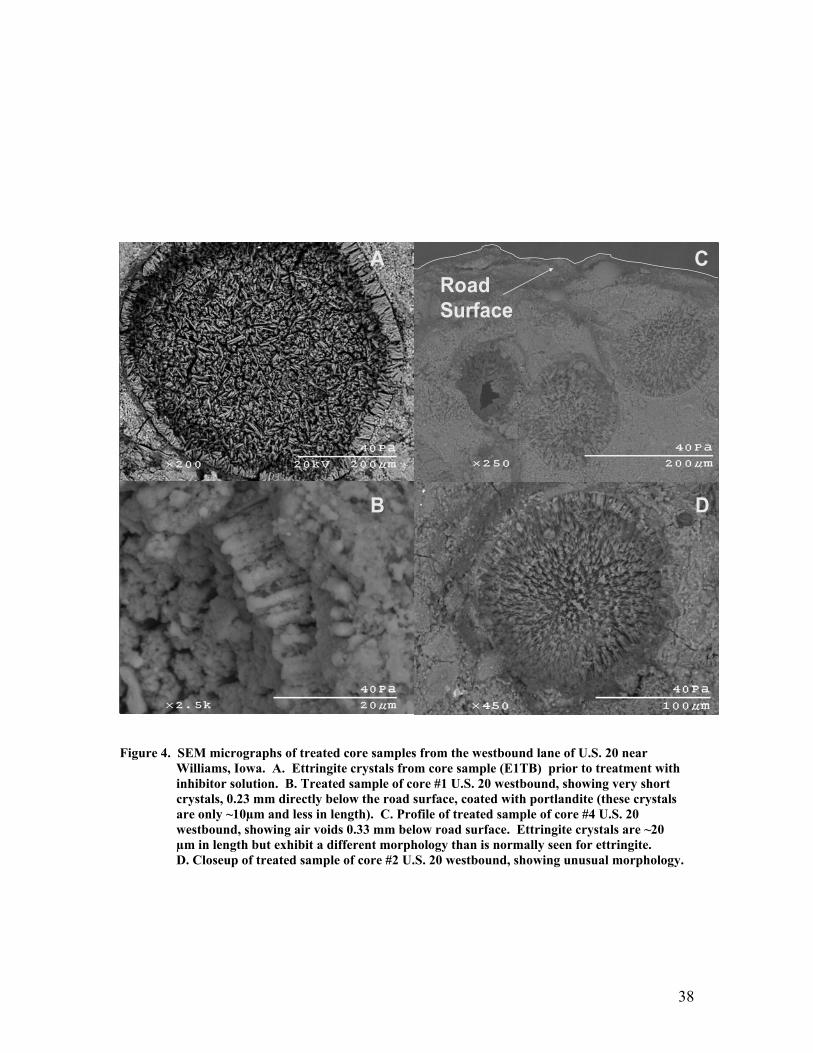
SEM images show that the inhibitor solution clearly affected ettringite growth ~
0.3 to 0.5 mm below the surface of the highway (Fig. 4). In non-treated cores
(i.e. prior to inhibitor application) ettringite near the surface is ~15-20 µm in
21
length (Fig. 4A), with some crystals approaching ~50 µm in length, whereas
ettringite crystals in treated cores were < ~10 µm in length (Fig. 4B). The middle
and bottom sections of treated and non-treated cores exhibited ettringite crystals
in air voids in the ~20 to 50 µm range. The morphology of crystals varied from
euhedral, elongate (20 to 25 µm) crystals (Fig. 4A) to squat, irregular-shaped
crystals approximately 5 to 15 µm in length. Some of these crystals are coated
with portlandite (Fig. 4B) whereas others show no spatial association to
portlandite but are also stunted (Figs. 4C and 4D).
4.2 Roof Experiments
The six concrete cores used for the roof experiments were C-3 and C-4
mixes (Table 1), which have an air entraining agent and a water reducer added.
The water/cement ratio for these cores was 0.38 to 0.43, respectively.
Transmitted light microscopy and SEM imaging of samples prior to the
application of solutions containing DTPMP showed the presence of abundant
ettringite in highways built in 1992 (core samples F, E, and H). Acicular ettringite
crystals between ~20 and 50 µm filled air voids up to ~100 µm in diameter and
generally lined the rims of air voids > ~100 µm in these samples. Ettringite was
less abundant in highway concretes built in 1997 (core samples Q and P), but
they still contained a significant amount of ettringite. Core sample O contained
between 10 to 20 weight % fly ash and was devoid of ettringite because of the
addition of fly ash to the concrete mix that gave the concrete a resistance to
sulfates.
22
At the end of chemical applications, visual inspection of the blocks showed
that they were, in general, structurally intact and devoid of cracks, pits, and
scales. However, three blocks did split because of expansion due to freeze-thaw
action of pre-existing cracks that were initiated during sample preparation.
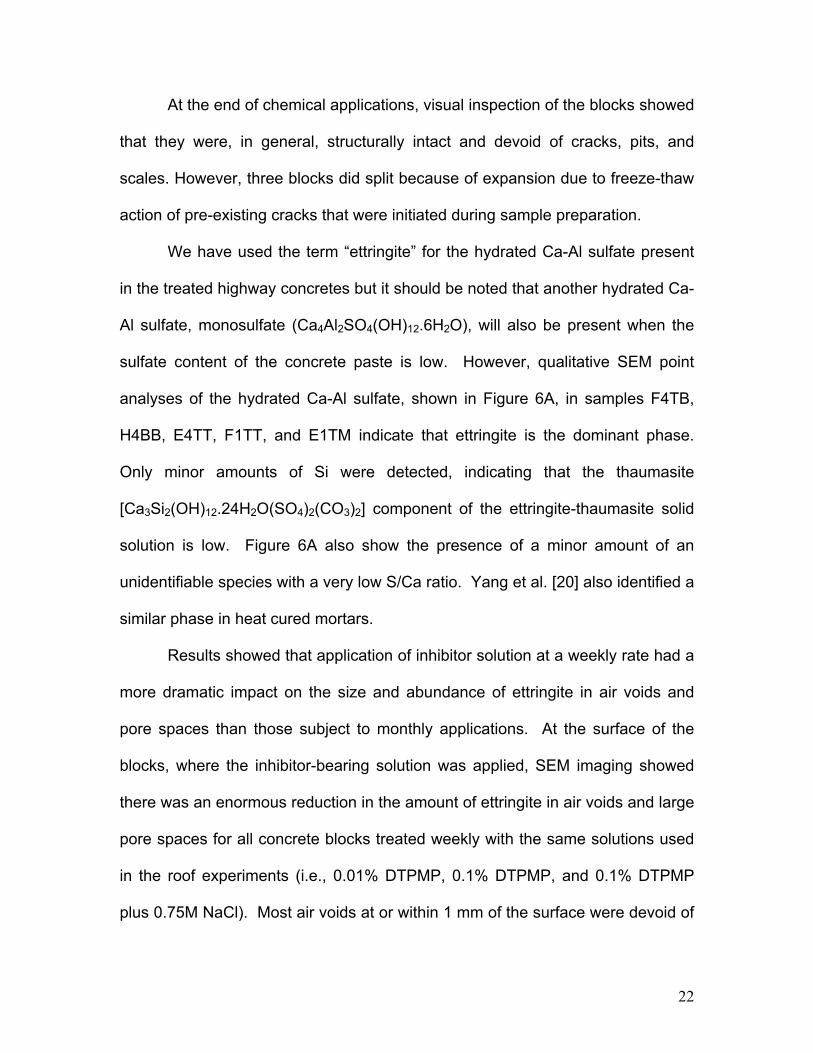
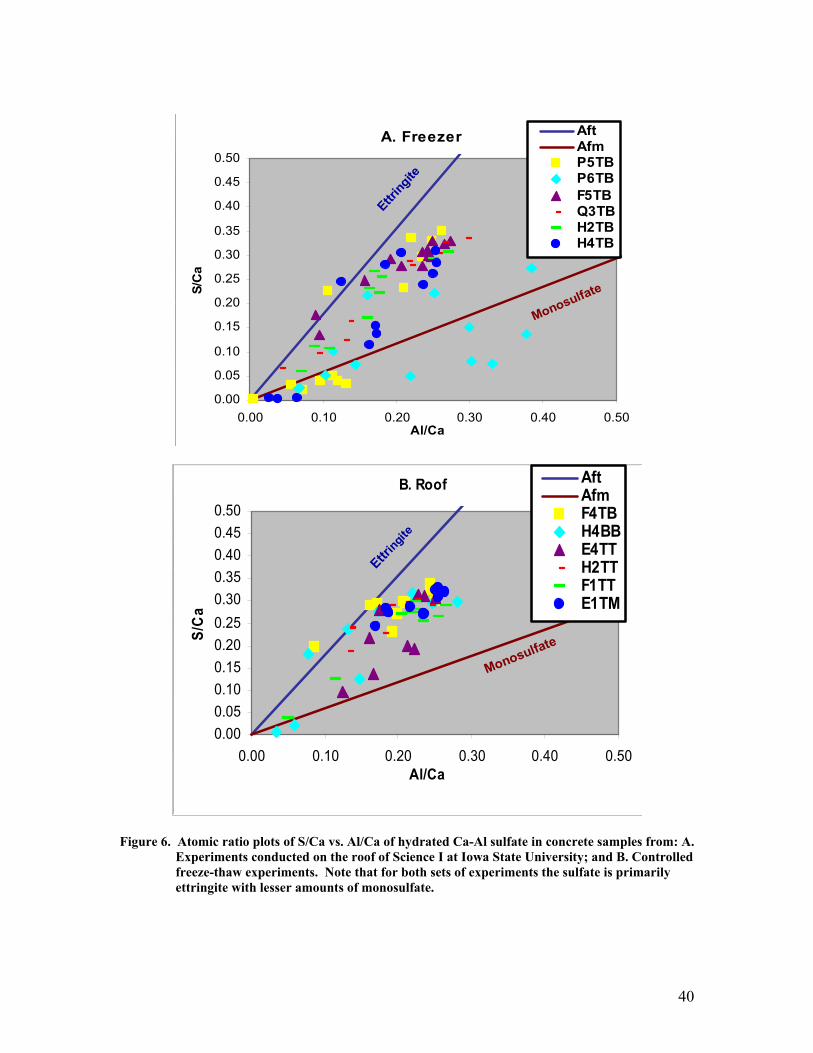
We have used the term “ettringite” for the hydrated Ca-Al sulfate present
in the treated highway concretes but it should be noted that another hydrated Ca-
Al sulfate, monosulfate (Ca4Al2SO4(OH)12.6H2O), will also be present when the
sulfate content of the concrete paste is low. However, qualitative SEM point
analyses of the hydrated Ca-Al sulfate, shown in Figure 6A, in samples F4TB,
H4BB, E4TT, F1TT, and E1TM indicate that ettringite is the dominant phase.
Only minor amounts of Si were detected, indicating that the thaumasite
[Ca3Si2(OH)12.24H2O(SO4)2(CO3)2] component of the ettringite-thaumasite solid
solution is low. Figure 6A also show the presence of a minor amount of an
unidentifiable species with a very low S/Ca ratio. Yang et al. [20] also identified a
similar phase in heat cured mortars.
Results showed that application of inhibitor solution at a weekly rate had a
more dramatic impact on the size and abundance of ettringite in air voids and
pore spaces than those subject to monthly applications. At the surface of the
blocks, where the inhibitor-bearing solution was applied, SEM imaging showed
there was an enormous reduction in the amount of ettringite in air voids and large
pore spaces for all concrete blocks treated weekly with the same solutions used
in the roof experiments (i.e., 0.01% DTPMP, 0.1% DTPMP, and 0.1% DTPMP
plus 0.75M NaCl). Most air voids at or within 1 mm of the surface were devoid of
23
ettringite. When a solution composed of 0.1% DTPMP plus 0.75M NaCl was
applied, NaCl were present in some voids and within the paste.
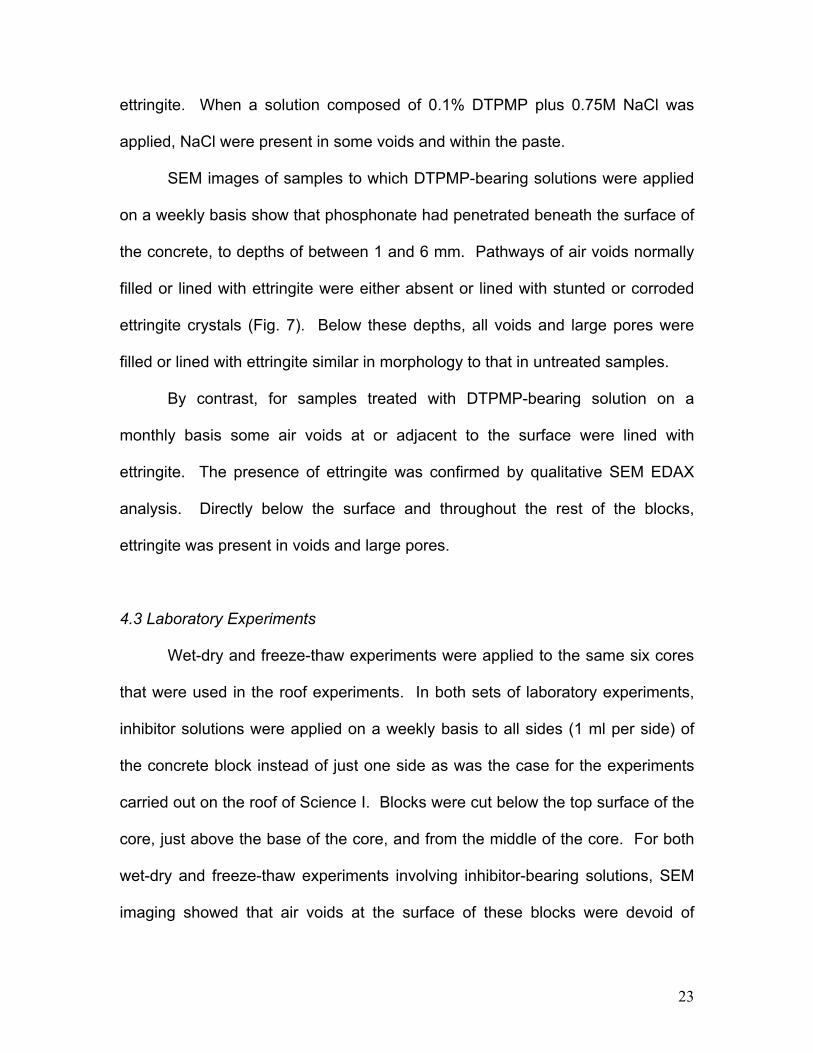
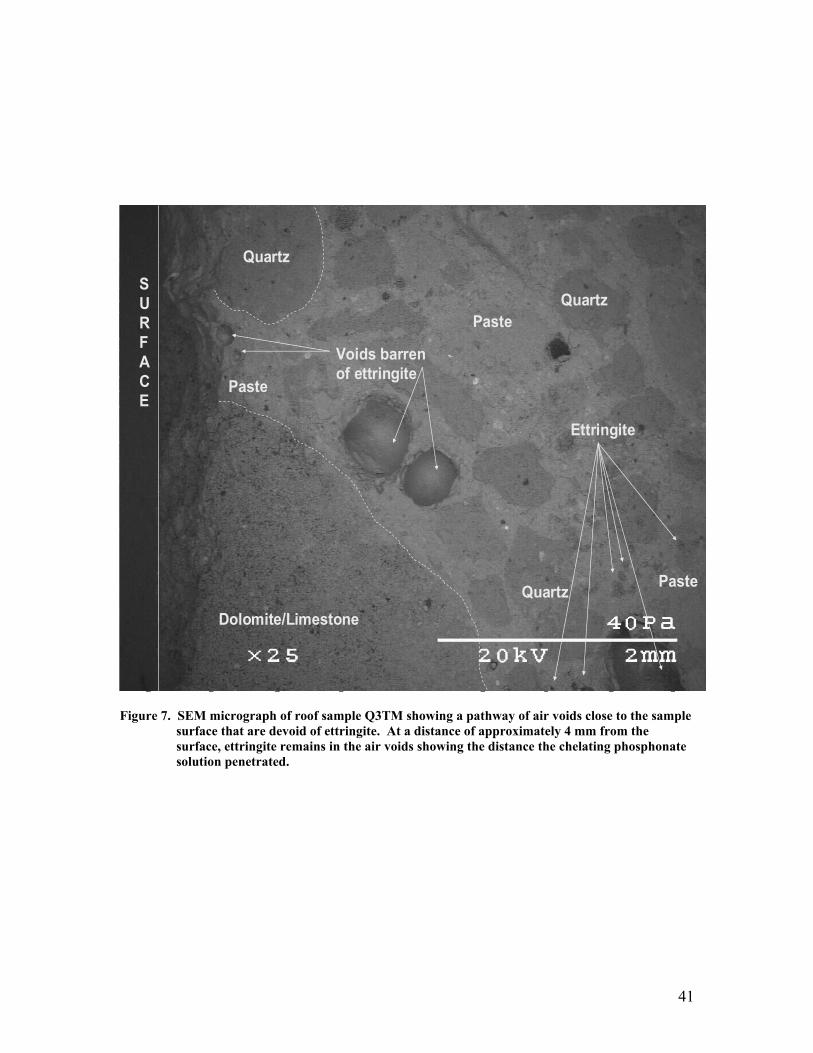
SEM images of samples to which DTPMP-bearing solutions were applied
on a weekly basis show that phosphonate had penetrated beneath the surface of
the concrete, to depths of between 1 and 6 mm. Pathways of air voids normally
filled or lined with ettringite were either absent or lined with stunted or corroded
ettringite crystals (Fig. 7). Below these depths, all voids and large pores were
filled or lined with ettringite similar in morphology to that in untreated samples.
By contrast, for samples treated with DTPMP-bearing solution on a
monthly basis some air voids at or adjacent to the surface were lined with
ettringite. The presence of ettringite was confirmed by qualitative SEM EDAX
analysis. Directly below the surface and throughout the rest of the blocks,
ettringite was present in voids and large pores.
4.3 Laboratory Experiments
Wet-dry and freeze-thaw experiments were applied to the same six cores
that were used in the roof experiments. In both sets of laboratory experiments,
inhibitor solutions were applied on a weekly basis to all sides (1 ml per side) of
the concrete block instead of just one side as was the case for the experiments
carried out on the roof of Science I. Blocks were cut below the top surface of the
core, just above the base of the core, and from the middle of the core. For both
wet-dry and freeze-thaw experiments involving inhibitor-bearing solutions, SEM
imaging showed that air voids at the surface of these blocks were devoid of
24
ettringite. Control blocks that had no inhibitor solutions applied to them exhibited
no physical changes due to freeze-thaw conditions alone.
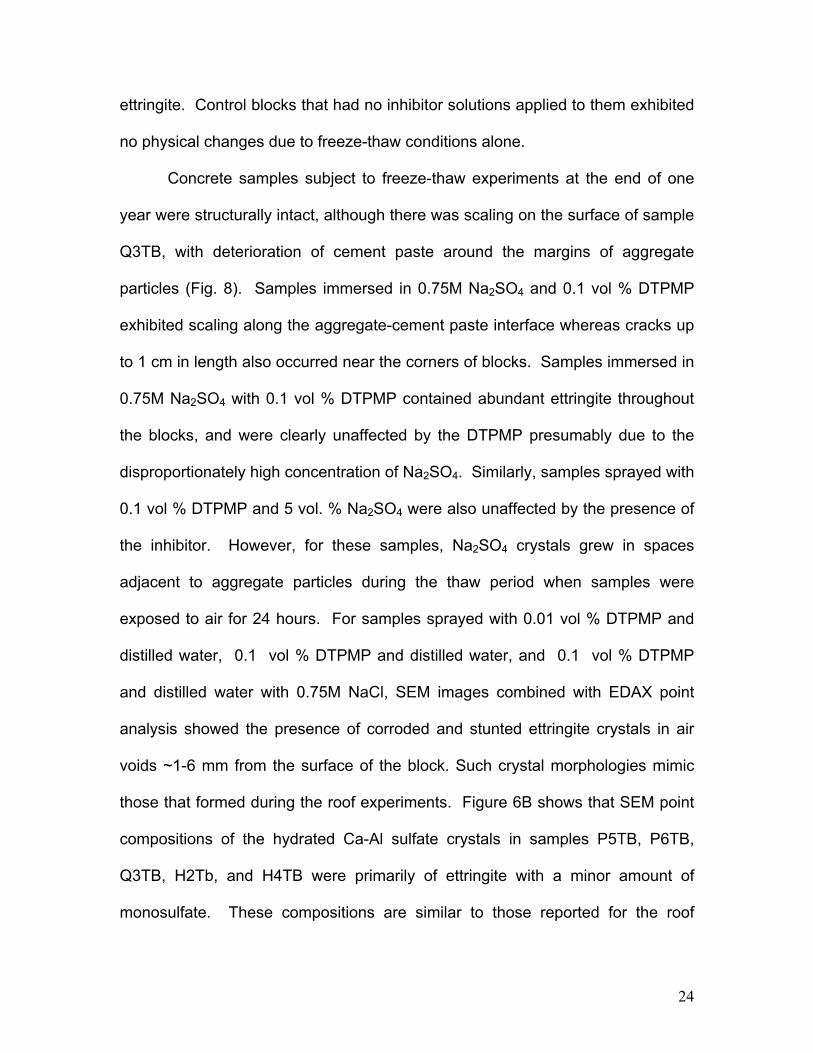
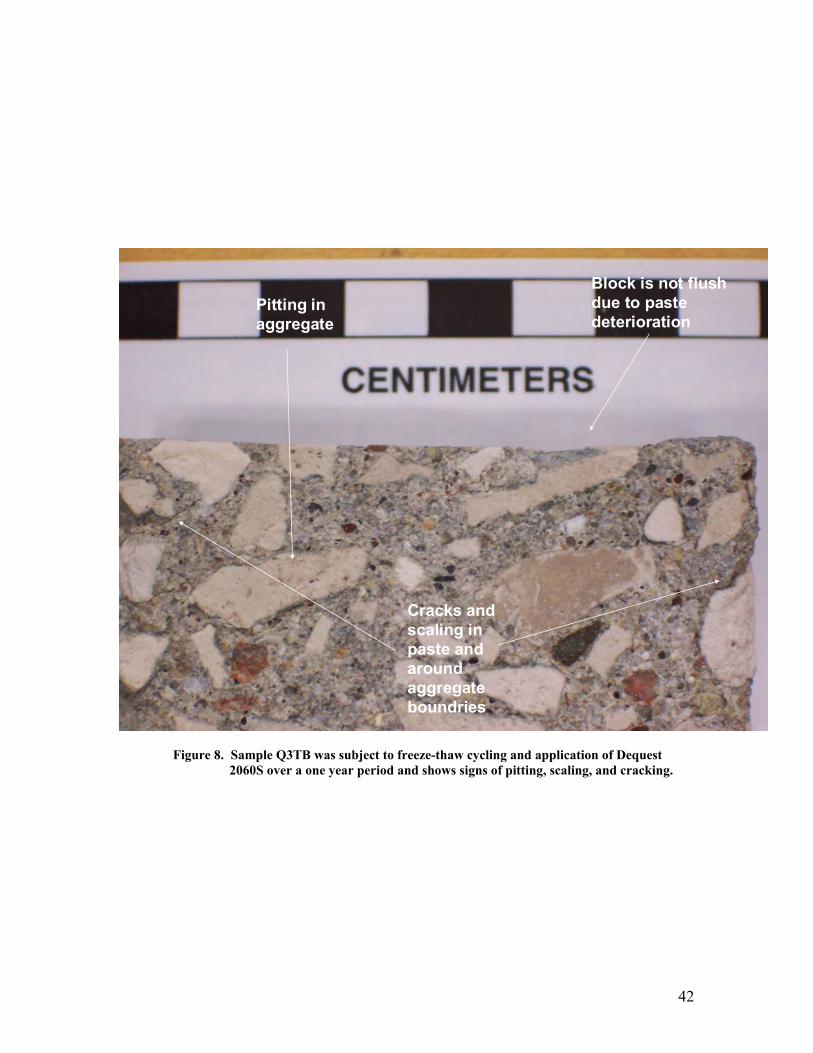
Concrete samples subject to freeze-thaw experiments at the end of one
year were structurally intact, although there was scaling on the surface of sample
Q3TB, with deterioration of cement paste around the margins of aggregate
particles (Fig. 8). Samples immersed in 0.75M Na2SO4 and 0.1 vol % DTPMP
exhibited scaling along the aggregate-cement paste interface whereas cracks up
to 1 cm in length also occurred near the corners of blocks. Samples immersed in
0.75M Na2SO4 with 0.1 vol % DTPMP contained abundant ettringite throughout
the blocks, and were clearly unaffected by the DTPMP presumably due to the
disproportionately high concentration of Na2SO4. Similarly, samples sprayed with
0.1 vol % DTPMP and 5 vol. % Na2SO4 were also unaffected by the presence of
the inhibitor. However, for these samples, Na2SO4 crystals grew in spaces
adjacent to aggregate particles during the thaw period when samples were
exposed to air for 24 hours. For samples sprayed with 0.01 vol % DTPMP and
distilled water, 0.1 vol % DTPMP and distilled water, and 0.1 vol % DTPMP
and distilled water with 0.75M NaCl, SEM images combined with EDAX point
analysis showed the presence of corroded and stunted ettringite crystals in air
voids ~1-6 mm from the surface of the block. Such crystal morphologies mimic
those that formed during the roof experiments. Figure 6B shows that SEM point
compositions of the hydrated Ca-Al sulfate crystals in samples P5TB, P6TB,
Q3TB, H2Tb, and H4TB were primarily of ettringite with a minor amount of
monosulfate. These compositions are similar to those reported for the roof
25
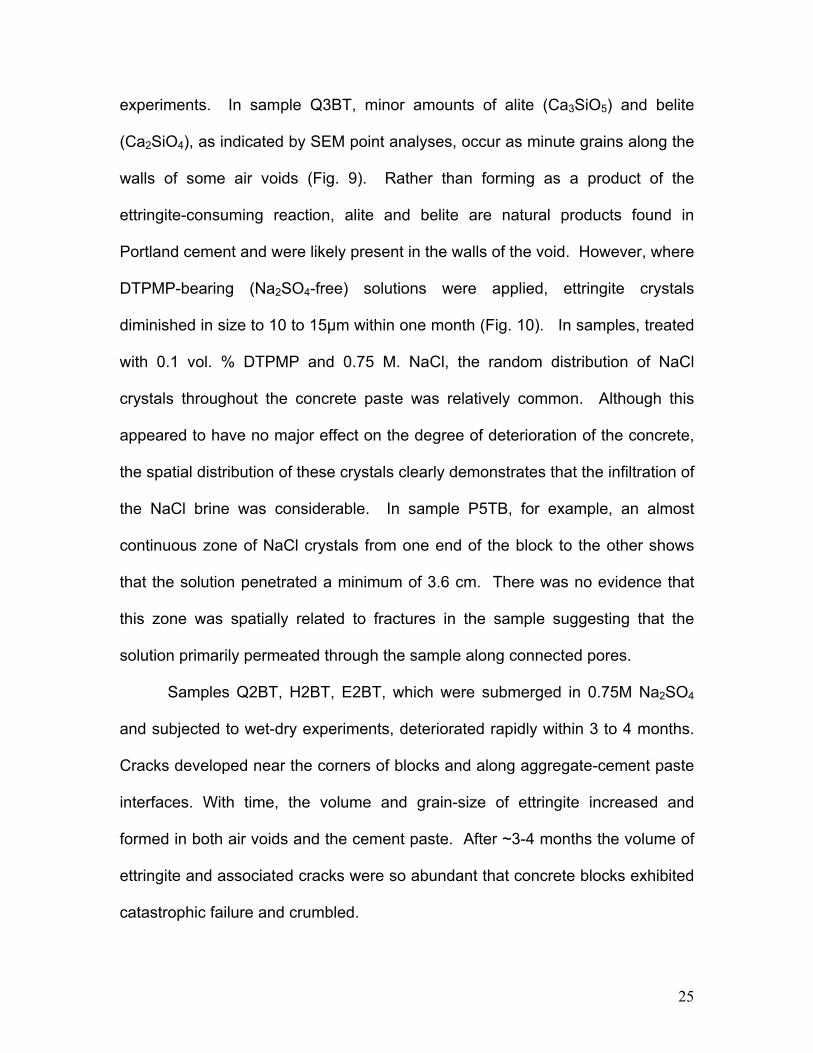
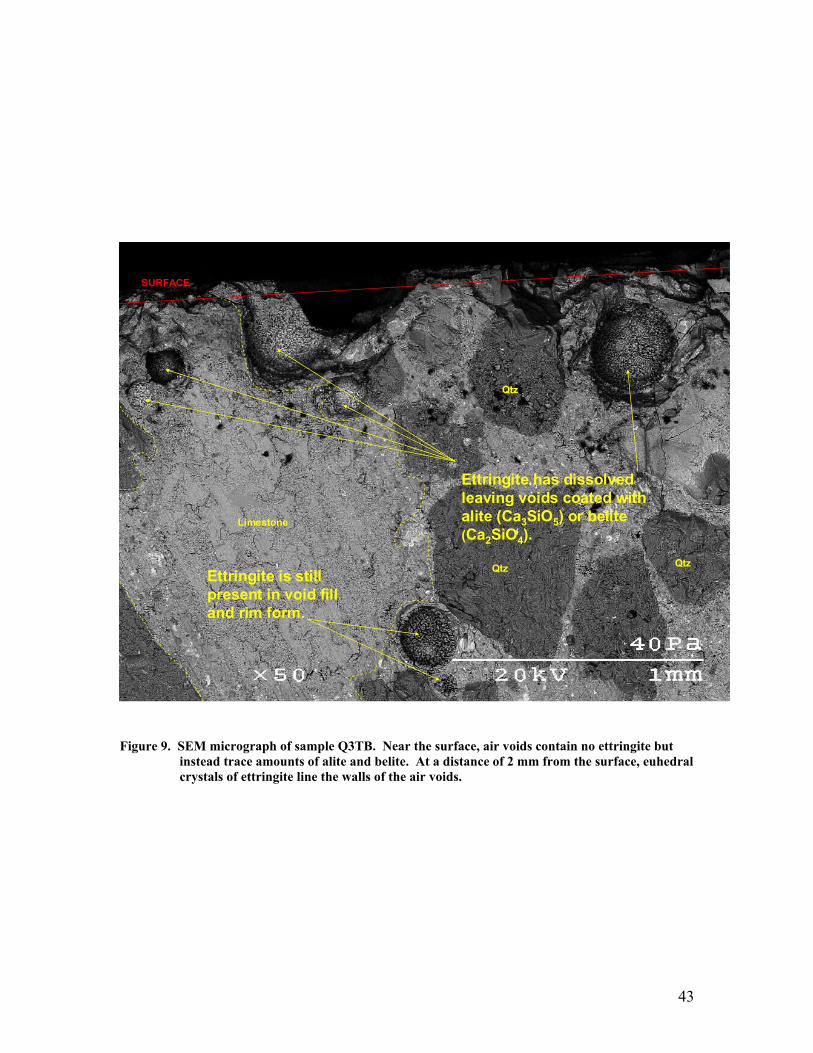
experiments. In sample Q3BT, minor amounts of alite (Ca3SiO5) and belite
(Ca2SiO4), as indicated by SEM point analyses, occur as minute grains along the
walls of some air voids (Fig. 9). Rather than forming as a product of the
ettringite-consuming reaction, alite and belite are natural products found in
Portland cement and were likely present in the walls of the void. However, where
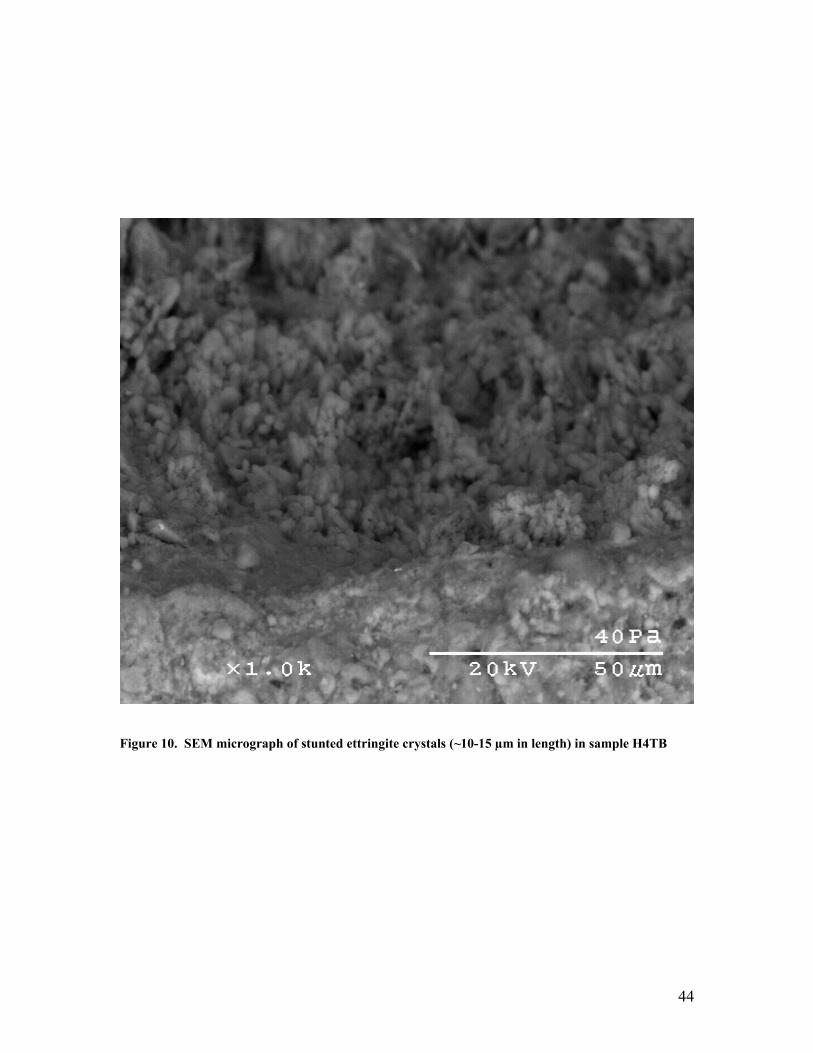
DTPMP-bearing (Na2SO4-free) solutions were applied, ettringite crystals
diminished in size to 10 to 15µm within one month (Fig. 10). In samples, treated
with 0.1 vol. % DTPMP and 0.75 M. NaCl, the random distribution of NaCl
crystals throughout the concrete paste was relatively common. Although this
appeared to have no major effect on the degree of deterioration of the concrete,
the spatial distribution of these crystals clearly demonstrates that the infiltration of
the NaCl brine was considerable. In sample P5TB, for example, an almost
continuous zone of NaCl crystals from one end of the block to the other shows
that the solution penetrated a minimum of 3.6 cm. There was no evidence that
this zone was spatially related to fractures in the sample suggesting that the
solution primarily permeated through the sample along connected pores.
Samples Q2BT, H2BT, E2BT, which were submerged in 0.75M Na2SO4
and subjected to wet-dry experiments, deteriorated rapidly within 3 to 4 months.
Cracks developed near the corners of blocks and along aggregate-cement paste
interfaces. With time, the volume and grain-size of ettringite increased and
formed in both air voids and the cement paste. After ~3-4 months the volume of
ettringite and associated cracks were so abundant that concrete blocks exhibited
catastrophic failure and crumbled.
26
By contrast, the remainder of the samples that were treated with the same
solutions as the freeze-thaw experiments on the roof of Science I remained
structurally intact with no visible evidence for scaling or deterioration for the first
five months. However, after that time, cracks began to develop throughout the
concrete block with the block eventually collapsing. The concrete deteriorated
due to the dehydration of ettringite and other hydrous phases in the cement
paste, including monosulfate, at high temperature (58oC)
4.4 Nature of Possible Reaction between Ettringite and DTPMP
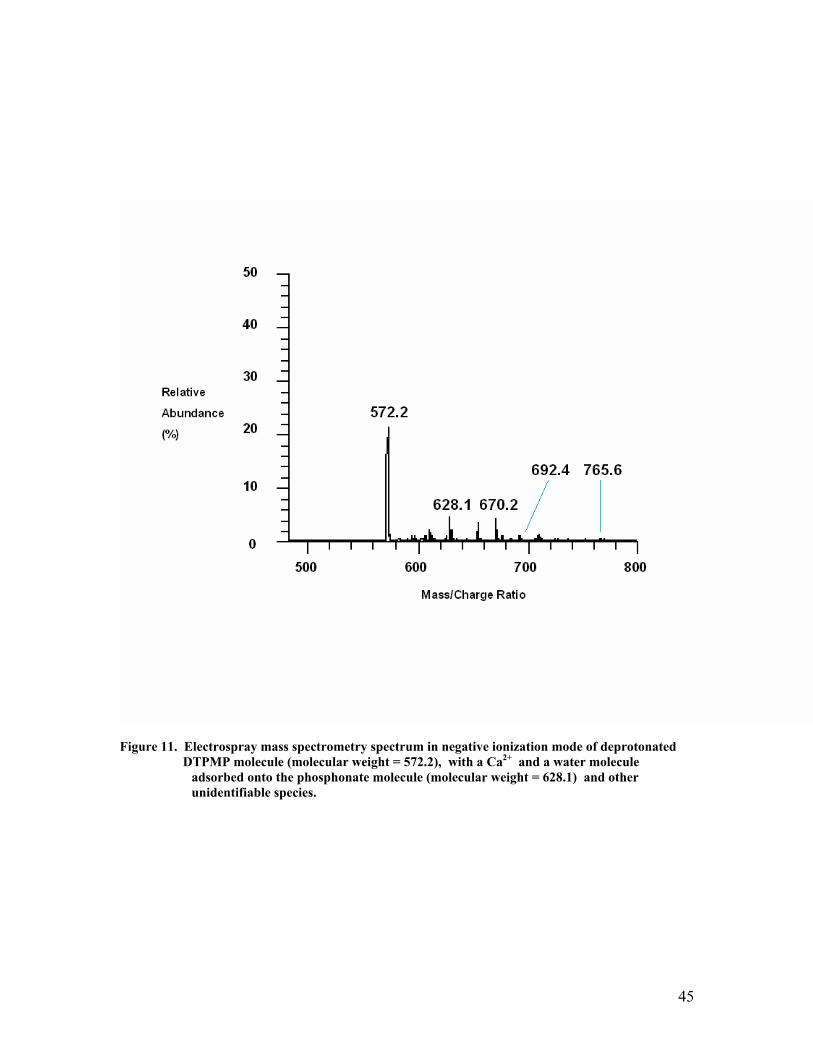
An electrospray mass spectrum was obtained in negative ion mode of a solution
containing 0.1% vol DTPMP mixed with ettringite (Fig. 11). Inspection of Figure
11 shows the presence of a deprotonated DTPMP peak (molecular weight of
572.2) plus two other prominent peaks at 628.1 and 670.2. Although we are
unable to identify the peak at 670.2, that at 628.1 is deprotonated DTPMP with a
Ca2+ ion and a water molecule adsorbed onto the phosphonate ion.
5. Discussion
Deterioration of concrete in, for example, highways, heat-treated precast
concrete, concrete railroad ties, and dam galleries that is caused by the
expansive growth of ettringite has been supported by several studies [1-6].
Various theories have been put forward to explain ettringite-related expansion
mechanisms. For example, Cohen [21] and Diamond [22] proposed that
expansion was caused by crystal growth pressures whereas Mehta [23], Mehta
27
and Wu [24], and Mehta and Wang [25] suggested that concrete expansion is, in
part, caused by water adsorption on the negatively charged surfaces of ettringite.
Despite these suggestions, details of the expansive mechanism remain in
question. Moreover, there is considerable debate whether ettringite is an
expansive mineral or whether it simply grows in pores and cracks after their
development [10-11]
Ettringite in Iowa highways occurs in air-entrainment voids, interstitial pore
spaces, cracks, and along the interface between aggregate particles and cement
paste and is considered by Lee et al. [2] to have been an expansive mineral that
resulted in the deterioration of the highway concrete. Lee et al. [2] speculated
that ettringite was precipitated directly from pore solutions in the highway
concrete and that the expansive pressures developed because of ettringite
growth that completely fills microscopic pores and by pressures caused by water
expansion on the negatively charged surfaces of ettringite. Whether expansion
is enhanced by the ice development in infilled and near-filled air voids during
freeze-thaw remains uncertain, however, it should be noted that such air voids
are common in the highways used in this study.
Ideally, for the highway to maintain its structural integrity, the
concentration of the DTPMP inhibitor applied to the highway should be low
enough to cause a reduction in the size of ettringite so that expansive pressures
produced by ettringite growth on the cement paste are non-existent. However, in
order to determine whether DTPMP would react with ettringite under highway
conditions (rather than in the laboratory where conditions are controlled) in a
28
short period of time (i.e. 15 months); we chose DTPMP concentrations of 0.1 and
0.01 vol %, which we consider to be high. The results obtained from the
applications of DTPMP to the westbound lane of US 20, concrete slabs exposed
on the roof of Science I, and laboratory based wet-dry experiments are
consistent with the phosphonate mostly acting as a chelator rather than an
inhibitor, since ettringite was completely removed in some parts of the highway
slab. Both the 0.1 and 0.01 vol % phosphonate-bearing solution permeated into
the concrete slab and completely dissolved ettringite up to 6 mm from the
concrete surface (most commonly 1-4 mm). The phosphonate-bearing solution
undoubtedly migrated along microcracks, enlarged pore spaces, air voids, and
distorted transition zones between aggregate and cement paste. These
experiments show two important aspects: 1. The chelating solution serves to act
as a tracer to the extent to which phosphonate-bearing solutions can penetrate
concrete slabs over a 12-15 month period (i.e. up to 6 mm); and 2. The relative
importance of chelation and inhibition of DTPMP on ettringite growth. While the
process of chelation completely dissolves the ettringite, the effects of inhibition
are seen at the margins of the zone of chelation where ettringite crystals become
corroded and stunted. This zone presumably represents a volume where the
concentration of DTPMP becomes markedly reduced to the extent that it
behaves like an inhibitor. It should be stressed here that other components of
the solution (e.g., NaCl) likely penetrated samples on the order of the centimeter
scale. We suspect that the large size of the phosphonate molecule, the likely
high adsorption rate of DTPMP, and the clogging of pores by NaCl, likely results
29
in localized differences in the amount of penetration of the phosphonate. The
smaller NaCl molecules are less reactive with the cement paste than the
phosphonate allowing it to penetrate distances on the centimeter scale.
Our understanding of the mechanism which causes DTPMP to act as an
inhibitor is, in part, derived from the findings of Tomson et al. [26] who evaluated
the adsorption and desorption isotherms of four phosphonates, including
Dequest® 2000, Dequest® 2010, and Dequest® 2060 on calcite over a wide
range of solution conditions, which included variable NaCl concentrations. The
effectiveness of phosphonates as a retarder of ettringite growth was also
demonstrated by Coveney et al. [26], using designed phosphonate molecules
with shapes varying from linear to cyclic. In Tomson et al.’s [26] experiments, the
phosphonate solution species that forms is one that essentially has Na and Ca
attached to the surface of the phosphonate. The phosphonate molecules
designed by Coveney et al [27] produced a marked reduction in the length of
ettringite crystals.
Experiments conducted in the present study of solutions that contain
DTPMP and ettringite, using electrospray mass spectrometry in negative ion
mode, show the presence of an ion with a molecular weight of 628.1, which
corresponds to a deprotonated DTPMP molecule with adsorbed Ca2+ and water.
In this experiment, it is likely that the Ca ion was cleaved off ettringite and that
the ion with the molecular weight of 628.1 was adsorbed onto the {0001} face of
ettringite. However, in highway concretes, there are several Ca-bearing minerals
in the cement paste that could also serve as the source of Ca in such an ion. In
30
this regard, it should be noted here that SEM imaging studies showed no
corrosion along aggregate-cement paste interfaces suggesting that the
breakdown and subsequent contribution of Ca from minerals in the cement paste
is less likely than ettringite. Regardless of the source of Ca, such adsorption
produced the stunted ettringite crystals in concrete derived from the westbound
lane of US 20, slabs exposed on the roof of Science I, and in core from
laboratory based wet-dry experiments.
6. Summary and Conclusion
The results obtained in this and companion studies [1,2] on the role of ettringite
in concrete deterioration should have considerable implications on the way
maintenance personnel treat highways over their service life. Ideally, testing of
the effects of inhibitors on the growth of ettringite should be conducted on
highways over a multi-year span (i.e. > 10 years). In this way, the nature and
extent of ettringite growth can be evaluated as well as the amount, the
concentration, and the nature of inhibitors can be tested in a realistic fashion.
The present study attempts to simulate these long-term tests by conducting
experiments involving a phosphonate inhibitor, DTPMP, on an operating highway
(US 20), and cores from operating highways that have been subject to moderate
and minor amounts of deterioration over a year long period when exposed to
normal weather conditions in Iowa. We used phosphonate concentrations of
0.01 and 0.1 vol%, which are high for normal inhibitor concentrations, but it was
unclear at the beginning of the experiments whether any inhibition of ettringite
31
growth would be observed at low concentrations. In addition, we have extended
the laboratory controlled freeze-thaw and wet-dry experiments of Lee at al. [1] by
exclusively testing the potential inhibition effects of ettringite growth by DTPMP,
over a range of temperatures that better mimic the extremes in Iowa weather
conditions. The results of all experiments in the present study have relied on
petrographic analysis and SEM imaging of concrete slabs before and after year
long phosphonate application. The experiments show that high concentrations of
DTPMP (i.e., 0.01 and 0.1 vol. %) will dissolve ettringite in air voids, pores, and
cracks up 6 mm from the surface of the concrete after only one year of
phosphonate application. Note that the zone of chelation along the westbound
lane of US 20 is only 0.3 to 0.5 mm deep but this is due to the fact that only
nineteen phosphonate applications were made during the project. The results of
highway, roof and laboratory experiments effectively show the rate at which
inhibitor solutions penetrate cured concrete paste. However, the experiments
more importantly show that the phosphonate acts as an inhibitor around the
zones of chelation. This suggests that if concentrations of <0.01 vol %
phosphonate, for example 0.001 vol%, were applied to the highway over its
service life, secondary or delayed ettringite is likely to be stunted in length and
will not create deterioration as a result of expansive growth. We saw no visual
affect of cracking or deterioration due to reaction of DTPMP with the cement
paste. The reason for the stunted growth of ettringite when treated by DTPMP is
caused by the adsorption of a Ca2+ ion and a water molecule to deprotonated
DTPMP on the surface of the {0001} face of ettringite.
32
7. Acknowledgement
Funding by the Iowa Department of Transportation (IDOT) is gratefully
acknowledged. We particularly want to thank Bob Dawson, Mark Dunn, Todd
Hanson, Kevin Jones, and Wallace Rippie from the Ames Office of the IDOT for
their advice, discussions, and support of this project. Larry Mesenbrink and
Steve Scott of the Williams maintenance garage (IDOT) kindly participated in the
project by advising us on the logistics of applying deicing salt and inhibitor to U.S.
20 and for applying solutions to the highway during the winters of 2003 and 2004.
Jerry Amenson and Warren Straszheim of the ISU Materials Research
Laboratory are thanked for their assistance with SEM analysis as is Fumin Li who
helped with the electrospray mass spectrometry experiment. We also want to
acknowledge the help of Patrick Hook, who worked on this project as part of his
Master of Science degree, and the help of Anita Cody and Dan Hummer (all from
ISU).
33
8. References [1] H. Lee, R.D. Cody, A.M. Cody, P.G. Spry, Reduction of concrete expansion by ettringite using crystallization inhibition techniques, Env. Eng. Geosci. 9 (4) (2003), pp. 313-326. [2] H. Lee, R.D. Cody, A.M. Cody, P.G. Spry, The formation and role of ettringite in Iowa highway concrete deterioration, Cem. Conc.Res. 34 (2004), in press. [3] W. Lerch, Effect of SO3 content of cement on durability of concrete, PCA Res. Devel. 0285 (1945), 1-9. [4] R.A. Kennerly, Ettringite formation in dam gallery, ACI Jour. 62 (1965) 559-576. [5] D. Heinz, U. Ludwig, Mechanisms of secondary ettringite formation in mortars and concretes subjected to heat treatment, Concrete Durability, Proceedings of the Katharine and Bryant Mather International Conference, Vol. 2, American Concrete Institute, Detroit, 1987, pp. 2059-2071 (ACI-SP 100). [6] S. Sahu, N. Thaulow, Delayed ettringite formation in Swedish concrete railroad ties, Cem. Conc. Res. 2004 in press. [7] K.L. Scrivener, H.F.W. Taylor, Delayed ettringite formation: a microstructural and microanalaytical study, Adv. Cem. Res. 5 (20) (1993) 139-146. [8] C.D. Lawrence, Sulfate attack on concrete, Mag. Conc. Res. 42 (153) (1990) 249-264. [9] Y. Fu, J.J. Beaudoin, Expansion of Portland cement mortar due to internal sulfate attack, Cem. Conc. Res. 27 (9) 1299-1306. [10] J. Stark, K. Bollmann, Delayed ettringite formation in concrete. Nordic Concrete Research Meeting at Reykjavik, Iceland, Nordic Concrete Research No. 23-2 (1999) 25 pp. [11]J. Stark, K. Bollmann, K. Seyfarth, Ettingit – Schadensverursacher, Schadenverstärker oder unbeteiligter Dritter (Ettringite – cause of damage, damage intensifier or uninvolved third party?), ZKG Int. 51 (5) (1998) 280-292. [12] H.F.W. Taylor, C.Famy, K.L. Scrivener, Delayed ettringite formation. Cem. Conc. Res. 31 (2001) 683-693. [13] L.A. Casanova, A. Aguardo, Aggregate expansitivity due to sulfide oxidation. I. Reaction system and rate model, Cem. Conc. Res. 26 (7) (1996), 993-998.
34
[14] J.M. Pitt, M. C. Schluter, D.Y. Lee, W. Dubberke, Sulfate impurities from deicing salts and durability of Portland cement mortar, Trans. Res. Rec 1110 (1987), 16-23. [15] A.M. Cody, H. Lee, R.D. Cody, P.G. Spry, The effects of chemical environment on the nucleation, growth, and stability of ettringite [Ca3Al2(OH)6]2(SO4)3.26H2O, Cem. Conc.Res. 34 (8) (2004), 869-881. [16] S. Diamond, The relevance of laboratory studies on delayed ettringite to DEF in field concretes, Cem. Conc. Res. 30 (2000), 1987-1991. [17] G. Gan, P.G. Spry, R.D. Cody, A.M. Cody, Rim Formation on Highway Concrete Dolomite Aggregate: The Effects of Dedolomitization Reactions, Env. Eng. Geosc., 2 (1) (1996), 59-72. [18] J. Hart, Evaluation of 1992 and 1997 PCC paving projects in Iowa. Unpub. Iowa DOT Rept. [19] S. Mindness, J.F. Young, D. Darwin, Concrete 2nd Ed., 2003, Pearson Education, Inc., pp. 489. [20] R. Yang, C.D. Lawrence, Cyril J. Lynsdale, J.H. Sharp, Cem. Conc. Res. 29 (1999) 17-25. [21] M.D. Cohen, Theories of expansion in sulfoaluminate-type expansion cements: School of thought, Cem. Concr. Res. 13 (1983) 809-818. [22] S. Diamond, Delayed ettringite formation – processes and problems, Cem. Conc. Compos. 18 (1996) 205-215. [23] P.K. Mehta, Mechanism of expansion associated with ettringite formation, Cem. Concr. Res. 3 (1973) 1-6. [24] P.K. Mehta, F. Hu, Further evidence for expansion of ettringite by water adsorption, J. Am, Ceram. Soc. 61 (1978) 179-181. [25] P.K. Mehta, S. Wang, Expansion of ettingite by water adsorption, Cem. Concr. Res. 12 (1982) 121-122. [26] M.B. Tomson, SPE, G. Fu, M.A. Watson, and A. K. Kan, Soc. Pet. Engineers, 2002. [27] P.V Coveney and W. Humphries, J. Chem. Soc., Faraday Trans., 1996, 92, 831.
35
Table 1 Characteristics of Iowa highway concrete cores used in roof, furnace, and freezer experiments
Core ID
Year Built Deterioration Roadway County Mix
Type Cement Fine Aggregate
Coarse Aggregate
Air Entraining
Agent
Water Reducer
E 1992 Moderate I-80 Iowa C-3 Buffalo IA (I)
Disterhoff (A48508)
Sully (A50002) Sika AER
Sika Plastocrete
161
F 1992 Moderate SH-150 Buchanan C-3 Mason City IA (LH I)
Hoffman (A10510)
Hazleton (A10010)
Protex AES
Protex PDA25-DP
H 1992 Moderate SH-163 Polk/ Jasper C-4
Mason City IA (LH I)
Colfax (A50502)
Sully (A50002)
Dara-Vair R WRDA-82
O 1997 Minor US-151 Linn C-3 (Slag)
Mason City IA (HNIS)
Ivanhoe (A57520)
Bowser-Springville (A57008)
Daravair 1000
Sika Plastocrete
161
P 1997 Minor SH-163 Mahaska C-3 Louisville NE (I/II)
New Harvey
(A63512)
Sully (A50002
Sika AEA-15
Sika Plastocrete
161
Q 1997 Minor SH-137 Mahaska C-3 Mason City IA (HNIS)
New Harvey
(A63512)
Sully (A50002
Conchem Air None
36
Cement Paste
Quartz
A
B
Figure 1. SEM micrograph of large (A) and small (B) air voids lined with well-formed, euhderal ettringite crystals, approximately 20 µm in length in sample “H” treated with sodium sulfate solution
Figure 2. Illustration of Dequest 2060S (DTPMP) molecule - Diethylenetriamine penta (methylene phosphonic acid).
37
Figure 3. Concrete samples O5BB (left) and P3TB (right) showing compositional rims on dolomite particles that formed by dedolomitization reactions associated with the application of
NaCl deicing salts.
38
A
B
C
D
Road Surface
Figure 4. SEM micrographs of treated core samples from the westbound lane of U.S. 20 near Williams, Iowa. A. Ettringite crystals from core sample (E1TB) prior to treatment with inhibitor solution. B. Treated sample of core #1 U.S. 20 westbound, showing very short crystals, 0.23 mm directly below the road surface, coated with portlandite (these crystals are only ~10µm and less in length). C. Profile of treated sample of core #4 U.S. 20 westbound, showing air voids 0.33 mm below road surface. Ettringite crystals are ~20 µm in length but exhibit a different morphology than is normally seen for ettringite. D. Closeup of treated sample of core #2 U.S. 20 westbound, showing unusual morphology.
39
Figure 5. Layout of highway concrete samples on the roof of Science I at Iowa State University.
40
A. Freezer
0.00
0.05
0.10
0.15
0.20
0.25
0.30
0.35
0.40
0.45
0.50
0.00 0.10 0.20 0.30 0.40 0.50Al/Ca
S/C
a
AftAfmP5TBP6TBF5TBQ3TBH2TBH4TB
Ettring
ite
Monosulfate
B. Roof
0.000.050.100.150.200.250.300.350.400.450.50
0.00 0.10 0.20 0.30 0.40 0.50Al/Ca
S/C
a
AftAfmF4TBH4BBE4TTH2TTF1TTE1TM
Ettringit
e
Monosulfate
Figure 6. Atomic ratio plots of S/Ca vs. Al/Ca of hydrated Ca-Al sulfate in concrete samples from: A.
Experiments conducted on the roof of Science I at Iowa State University; and B. Controlled freeze-thaw experiments. Note that for both sets of experiments the sulfate is primarily ettringite with lesser amounts of monosulfate.
41
SURFACE
Quartz
Quartz
Quartz
Paste
Paste
Paste
Dolomite/Limestone
Voids barren of ettringite
Ettringite
Figure 7. SEM micrograph of roof sample Q3TM showing a pathway of air voids close to the sample surface that are devoid of ettringite. At a distance of approximately 4 mm from the surface, ettringite remains in the air voids showing the distance the chelating phosphonate solution penetrated.
42
Block is not flush due to paste deterioration
Pitting in aggregate
Cracks and scaling in paste and around aggregate boundries
Figure 8. Sample Q3TB was subject to freeze-thaw cycling and application of Dequest 2060S over a one year period and shows signs of pitting, scaling, and cracking.
43
Cross section of treated sample Q3TBCross section of treated sample Q3TB (Freezer/0.01 M)(Freezer/0.01 M)
Limestone
Qtz
Qtz
Qtz
Ettringite has dissolved leaving voids coated with alite (Ca3SiO5) or belite(Ca2SiO4).
SURFACE
Ettringite is still present in void fill and rim form.
Figure 9. SEM micrograph of sample Q3TB. Near the surface, air voids contain no ettringite but instead trace amounts of alite and belite. At a distance of 2 mm from the surface, euhedral crystals of ettringite line the walls of the air voids.
44
Figure 10. SEM micrograph of stunted ettringite crystals (~10-15 µm in length) in sample H4TB
45
Figure 11. Electrospray mass spectrometry spectrum in negative ionization mode of deprotonated DTPMP molecule (molecular weight = 572.2), with a Ca2+ and a water molecule
adsorbed onto the phosphonate molecule (molecular weight = 628.1) and other unidentifiable species.
46
Appendix A: General information on concrete cores used in roof and laboratory experiments Samp.
# Iowa Location Project ID # Year
Built Mile Post Sample # Core Locations Lane Core Station
Core Mile Post
Quarry Location
H1T SH163 Polk/Jasper Co. RP-163-1(50)--16-77 1992 12.36 to
17.01 H1T 208+89 to 189+72 WB WB 136+00 17 Eagle
City Fm
HIB SH163 Polk/Jasper Co. RP-163-1(50)--16-77 1992 12.36 to
17.01 HIB 208+89 to 189+72 WB WB 136+00 17 Eagle
City Fm
H2T SH163 Polk/Jasper Co. RP-163-1(50)--16-77 1992 12.36 to
17.01 H2T 189+72 to 170+76 WB WB 136+00 17 Eagle
City Fm H2B SH163
Polk/Jasper Co. RP-163-1(50)--16-77 1992 12.36 to 17.01 H2B 189+72 to
170+76 WB WB 136+00 17 Eagle City Fm
H3T SH163 Polk/Jasper Co. RP-163-1(50)--16-77 1992 12.36 to
17.01 H3T 208+89 to 189+72 WB WB 136+00 17 Eagle
City Fm H3B SH163
Polk/Jasper Co. RP-163-1(50)--16-77 1992 12.36 to 17.01 H3B 208+89 to
189+72 WB WB 136+00 17 Eagle City Fm
H4T SH163 Polk/Jasper Co. RP-163-1(50)--16-77 1992 12.36 to
17.01 H4T 189+72 to 170+76 WB WB 136+00 17 Eagle
City Fm H4B SH163
Polk/Jasper Co. RP-163-1(50)--16-77 1992 12.36 to 17.01 H4B 189+72 to
170+76 WB WB 136+00 17 Eagle City Fm
H5T SH163 Polk/Jasper Co. RP-163-1(50)--16-77 1992 12.36 to
17.01 H5T 982+00 to 995+53 EB EB 994+00 13 Eagle
City Fm H5B SH163
Polk/Jasper Co. RP-163-1(50)--16-77 1992 12.36 to 17.01 H5B 982+00 to
995+53 EB EB 994+00 13 Eagle City Fm
H6T SH163 Polk/Jasper Co. RP-163-1(50)--16-77 1992 12.36 to
17.01 H6T 995+53 to 13+00 EB EB 994+00 13 Eagle City Fm
H6B SH163 Polk/Jasper Co. RP-163-1(50)--16-77 1992 12.36 to
17.01 H6B 995+53 to 13+00 EB EB 994+00 13 Eagle City Fm
E1T I-80 Iowa Co. IR-80-6(157)205--12-4 1992 204.80 to
209.65 E1T 260+00 to 238+40 WB WB 210+00 208.7 Eagle
City Fm E1B I-80 Iowa Co. IR-80-6(157)205--12-
4 1992 204.80 to 209.65 E1B 260+00 to
238+40 WB WB 210+00 208.7 Eagle City Fm
E2T I-80 Iowa Co. IR-80-6(157)205--12-4 1992 204.80 to
209.65 E2T 231+70 to 201+65 WB WB 210+00 208.7 Eagle
City Fm E2B I-80 Iowa Co. IR-80-6(157)205--12-
4 1992 204.80 to 209.65 E2B 231+70 to
201+65 WB WB 210+00 208.7 Eagle City Fm
E3T I-80 Iowa Co. IR-80-6(157)205--12-4 1992 204.80 to
209.65 E3T 260+00 to 238+40 WB WB 210+00 208.7 Eagle
City Fm E3B I-80 Iowa Co. IR-80-6(157)205--12-
4 1992 204.80 to 209.65 E3B 260+00 to
238+40 WB WB 210+00 208.7 Eagle City Fm
E4T I-80 Iowa Co. IR-80-6(157)205--12-4 1992 204.80 to
209.65 E4T 231+70 to 201+65 WB WB 210+00 208.7 Eagle
City Fm E4B I-80 Iowa Co. IR-80-6(157)205--12-
4 1992 204.80 to 209.65 E4B 231+70 to
201+65 WB WB 210+00 208.7 Eagle City Fm
E5T I-80 Iowa Co. IR-80-6(157)205--12-4 1992 204.80 to
209.65 E5T ? WB WB 210+00 208.7 Eagle City Fm
E5B I-80 Iowa Co. IR-80-6(157)205--12-4 1992 204.80 to
209.65 E5B ? WB WB 210+00 208.7 Eagle City Fm
E6T I-80 Iowa Co. IR-80-6(157)205--12-4 1992 204.80 to
209.65 E6T ? WB WB 210+00 208.7 Eagle City Fm
E6B I-80 Iowa Co. IR-80-6(157)205--12-4 1992 204.80 to
209.65 E6B ? WB WB 210+00 208.7 Eagle City Fm
Q2T US165 Polk Co. NHS-500-1(96)--19-77 1997 55.87 to
60.11 Q2T 1323+08 to 1316+50 SB SB 1317+00 58 North Hill
Group Q2B US165 Polk Co. NHS-500-1(96)--19-
77 1997 55.87 to 60.11 Q2B 1323+08 to
1316+50 SB SB 1317+00 58 North Hill Group
Q3T US165 Polk Co. NHS-500-1(96)--19-77 1997 55.87 to
60.11 Q3T 1328+50 to 1324+30 SB SB 1317+00 58 North Hill
Group Q3B US165 Polk Co. NHS-500-1(96)--19-
77 1997 55.87 to 60.11 Q3B 1328+50 to
1324+30 SB SB 1317+00 58 North Hill Group
Q4T US165 Polk Co. NHS-500-1(96)--19-77 1997 55.87 to
60.11 Q4T 1323+08 to 1316+50 SB SB 1317+00 58 North Hill
Group Q4B US165 Polk Co. NHS-500-1(96)--19-
77 1997 55.87 to 60.11 Q4B 1323+08 to
1316+50 SB SB 1317+00 58 North Hill Group
Q5T US165 Polk Co. NHS-500-1(96)--19-77 1997 55.87 to
60.11 Q5T 1223+50 to 1243+53 NB NB 1268+00 57 North Hill
Group Q5B US165 Polk Co. NHS-500-1(96)--19-
77 1997 55.87 to 60.11 Q5B 1223+50 to
1243+53 NB NB 1268+00 57 North Hill Group
Q6T US165 Polk Co. NHS-500-1(96)--19-77 1997 55.87 to
60.11 Q6T 1264+25 to 1281+00 NB NB 1268+00 57 North Hill
Group
47
Samp. # Iowa Location Project ID # Year
Built Mile Post
Q6B US165 Polk Co.
NHS-500-1(96)--19-77 1997 55.87 to
60.11
P1T SH163 Mahaska Co.
NHS-163-4(22)--2R-62 1997 44.99 to
54.78
P1B SH163 Mahaska Co.
NHS-163-4(22)--2R-62 1997 44.99 to
54.78
P3T SH163 Mahaska Co.
NHS-163-4(22)--2R-62 1997 44.99 to
54.78
P3B SH163 Mahaska Co.
NHS-163-4(22)--2R-62 1997 44.99 to
54.78
P4T SH163 Mahaska Co.
NHS-163-4(22)--2R-62 1997 44.99 to
54.78
P4B SH163 Mahaska Co.
NHS-163-4(22)--2R-62 1997 44.99 to
54.78
P5T SH163 Mahaska Co.
NHS-163-4(22)--2R-62 1997 44.99 to
54.78
P5B SH163 Mahaska Co.
NHS-163-4(22)--2R-62 1997 44.99 to
54.78
P6T SH163 Mahaska Co.
NHS-163-4(22)--2R-62 1997 44.99 to
54.78
P6B SH163 Mahaska Co.
NHS-163-4(22)--2R-62 1997 44.99 to
54.78
F1TJ SH150 Buchanan Co. F-150-3(42)--20-10 1992 49.20 to
51.35
F1BJ SH150 Buchanan Co. F-150-3(42)--20-10 1992 49.20 to
51.35
F2BMS SH150 Buchanan Co. F-150-3(42)--20-10 1992 49.20 to
51.35
F3TJ SH150 Buchanan Co. F-150-3(42)--20-10 1992 49.20 to
51.35
F3BJ SH150 Buchanan Co. F-150-3(42)--20-10 1992 49.20 to
51.35
F4TMS SH150 Buchanan Co. F-150-3(42)--20-10 1992 49.20 to
51.35
F4BMS SH150 Buchanan Co. F-150-3(42)--20-10 1992 49.20 to
51.35
F5T SH150 Buchanan Co. F-150-3(42)--20-10 1992 49.20 to
51.35
F5B SH150 Buchanan Co. F-150-3(42)--20-10 1992 49.20 to
51.35
F5B2 SH150 Buchanan Co. F-150-3(42)--20-10 1992 49.20 to
51.35
F6T SH150 Buchanan Co. F-150-3(42)--20-10 1992 49.20 to
51.35
F6B SH150 Buchanan Co. F-150-3(42)--20-10 1992 49.20 to
51.35
O2T US151 Linn Co.
NHS-151-3(97)--19-57 1997 33.48 to
36.68
O2B US151 Linn Co.
NHS-151-3(97)--19-57 1997 33.48 to
36.68
O3T US151 Linn Co.
NHS-151-3(97)--19-57 1997 33.48 to
36.68
O3B US151 Linn Co.
NHS-151-3(97)--19-57 1997 33.48 to
36.68
O4T US151 Linn Co.
NHS-151-3(97)--19-57 1997 33.48 to
36.68
O4B US151 Linn Co.
NHS-151-3(97)--19-57 1997 33.48 to
36.68
O5T US151 Linn Co.
NHS-151-3(97)--19-57 1997 33.48 to
36.68
O5B US151 Linn Co.
NHS-151-3(97)--19-57 1997 33.48 to
36.68
O6T US151 Linn Co.
NHS-151-3(97)--19-57 1997 33.48 to
36.68
O6B US151 Linn Co.
NHS-151-3(97)--19-57 1997 33.48 to
36.68
Samp. # Core Locations Lane Core
Station Core Mile Post
Quarry Location
Q6B 1264+25 to 1281+00 NB NB
1268+00 57 North Hill Group
P1T 1001+40 to 1040+45 EB EB
1009+00 51 Eagle City Fm
P1B 1001+40 to 1040+45 EB EB
1009+00 51 Eagle City Fm P3T 1001+40 to
1040+45 EB EB 1009+00 51 Eagle City Fm
P3B 1001+40 to 1040+45 EB EB
1009+00 51 Eagle City Fm P4T 1001+40 to
1040+45 EB EB 1009+00 51 Eagle City Fm
P4B 1001+40 to 1040+45 EB EB
1009+00 51 Eagle City Fm P5T 1214+48 to
1187+56 EB WB 1191+00 55 Eagle City Fm
P5B 1214+48 to 1187+56 EB WB
1191+00 55 Eagle City Fm P6T 1214+48 to
1187+56 EB WB 1191+00 55 Eagle City Fm
P6B 1214+48 to 1187+56 EB WB
1191+00 55 Eagle City Fm F1TJ 528+30 to
525+47 FW NB 508+00 51 Hopington Fm
F1BJ 528+30 to 525+47 FW NB 508+00 51 Hopington Fm
F2BMS 525+47 to 511+55 FW NB 508+00 51 Hopington Fm
F3TJ 528+30 to 525+47 FW NB 508+00 51 Hopington Fm
F3BJ 528+30 to 525+47 FW NB 508+00 51 Hopington Fm
F4TMS 525+47 to 511+55 FW NB 508+00 51 Hopington Fm
F4BMS 525+47 to 511+55 FW NB 508+00 51 Hopington Fm
F5T 502+45 to 502+00 FW NB 482+00 51 Hopington Fm
F5B 502+45 to 502+00 FW NB 482+00 51 Hopington Fm
F5B2 502+45 to 502+00 FW NB 482+00 51 Hopington Fm
F6T 502+00 to 500+85 FW NB 482+00 51 Hopington Fm
F6B 502+00 to 500+85 FW NB 482+00 51 Hopington Fm
O2T 243+61 to 277+26 NB SB 287+00 35 Scotch Grove Fm
O2B 243+61 to 277+26 NB SB 287+00 35 Scotch Grove Fm
O3T 284+26 to 297+07 SB SB 287+00 35 Scotch Grove Fm
O3B 284+26 to 297+07 SB SB 287+00 35 Scotch Grove Fm
O4T 243+61 to 277+26 NB SB 287+00 35 Scotch Grove Fm
O4B 243+61 to 277+26 NB SB 287+00 35 Scotch Grove Fm
O5T ? ? SB 287+00 35 Scotch Grove Fm O5B ? ? SB 287+00 35 Scotch Grove Fm O6T ? ? SB 287+00 35 Scotch Grove Fm
O6B ? ? SB 287+00 35 Scotch Grove Fm
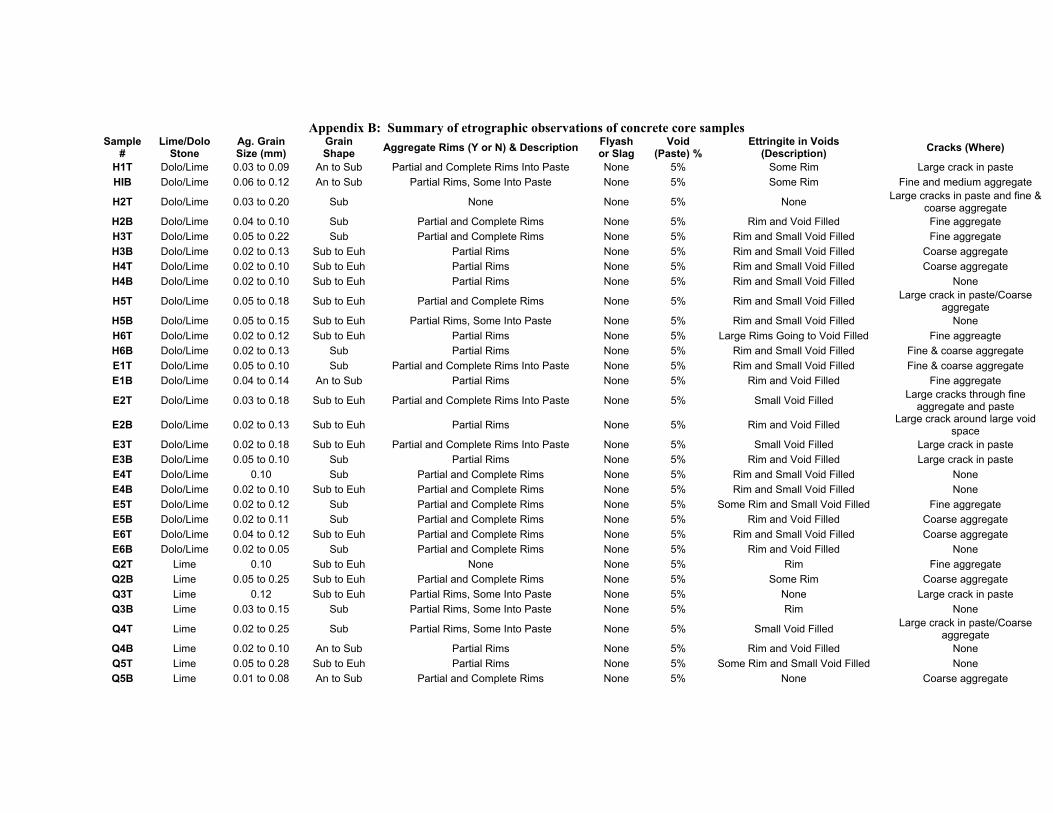
Appendix B: Summary of etrographic observations of concrete core samples Sample
# Lime/Dolo
Stone Ag. Grain Size (mm)
Grain Shape Aggregate Rims (Y or N) & Description Flyash
or Slag Void
(Paste) % Ettringite in Voids
(Description) Cracks (Where)
H1T Dolo/Lime 0.03 to 0.09 An to Sub Partial and Complete Rims Into Paste None 5% Some Rim Large crack in paste HIB Dolo/Lime 0.06 to 0.12 An to Sub Partial Rims, Some Into Paste None 5% Some Rim Fine and medium aggregate
H2T Dolo/Lime 0.03 to 0.20 Sub None None 5% None Large cracks in paste and fine & coarse aggregate
H2B Dolo/Lime 0.04 to 0.10 Sub Partial and Complete Rims None 5% Rim and Void Filled Fine aggregate H3T Dolo/Lime 0.05 to 0.22 Sub Partial and Complete Rims None 5% Rim and Small Void Filled Fine aggregate H3B Dolo/Lime 0.02 to 0.13 Sub to Euh Partial Rims None 5% Rim and Small Void Filled Coarse aggregate H4T Dolo/Lime 0.02 to 0.10 Sub to Euh Partial Rims None 5% Rim and Small Void Filled Coarse aggregate H4B Dolo/Lime 0.02 to 0.10 Sub to Euh Partial Rims None 5% Rim and Small Void Filled None
H5T Dolo/Lime 0.05 to 0.18 Sub to Euh Partial and Complete Rims None 5% Rim and Small Void Filled Large crack in paste/Coarse aggregate
H5B Dolo/Lime 0.05 to 0.15 Sub to Euh Partial Rims, Some Into Paste None 5% Rim and Small Void Filled None H6T Dolo/Lime 0.02 to 0.12 Sub to Euh Partial Rims None 5% Large Rims Going to Void Filled Fine aggreagte H6B Dolo/Lime 0.02 to 0.13 Sub Partial Rims None 5% Rim and Small Void Filled Fine & coarse aggregate E1T Dolo/Lime 0.05 to 0.10 Sub Partial and Complete Rims Into Paste None 5% Rim and Small Void Filled Fine & coarse aggregate E1B Dolo/Lime 0.04 to 0.14 An to Sub Partial Rims None 5% Rim and Void Filled Fine aggregate
E2T Dolo/Lime 0.03 to 0.18 Sub to Euh Partial and Complete Rims Into Paste None 5% Small Void Filled Large cracks through fine aggregate and paste
E2B Dolo/Lime 0.02 to 0.13 Sub to Euh Partial Rims None 5% Rim and Void Filled Large crack around large void space
E3T Dolo/Lime 0.02 to 0.18 Sub to Euh Partial and Complete Rims Into Paste None 5% Small Void Filled Large crack in paste E3B Dolo/Lime 0.05 to 0.10 Sub Partial Rims None 5% Rim and Void Filled Large crack in paste E4T Dolo/Lime 0.10 Sub Partial and Complete Rims None 5% Rim and Small Void Filled None E4B Dolo/Lime 0.02 to 0.10 Sub to Euh Partial and Complete Rims None 5% Rim and Small Void Filled None E5T Dolo/Lime 0.02 to 0.12 Sub Partial and Complete Rims None 5% Some Rim and Small Void Filled Fine aggregate E5B Dolo/Lime 0.02 to 0.11 Sub Partial and Complete Rims None 5% Rim and Void Filled Coarse aggregate E6T Dolo/Lime 0.04 to 0.12 Sub to Euh Partial and Complete Rims None 5% Rim and Small Void Filled Coarse aggregate E6B Dolo/Lime 0.02 to 0.05 Sub Partial and Complete Rims None 5% Rim and Void Filled None Q2T Lime 0.10 Sub to Euh None None 5% Rim Fine aggregate Q2B Lime 0.05 to 0.25 Sub to Euh Partial and Complete Rims None 5% Some Rim Coarse aggregate Q3T Lime 0.12 Sub to Euh Partial Rims, Some Into Paste None 5% None Large crack in paste Q3B Lime 0.03 to 0.15 Sub Partial Rims, Some Into Paste None 5% Rim None
Q4T Lime 0.02 to 0.25 Sub Partial Rims, Some Into Paste None 5% Small Void Filled Large crack in paste/Coarse aggregate
Q4B Lime 0.02 to 0.10 An to Sub Partial Rims None 5% Rim and Void Filled None Q5T Lime 0.05 to 0.28 Sub to Euh Partial Rims None 5% Some Rim and Small Void Filled None Q5B Lime 0.01 to 0.08 An to Sub Partial and Complete Rims None 5% None Coarse aggregate
49
Sample #
Lime/Dolo Stone
Ag. Grain Size (mm)
Grain Shape Aggregate Rims (Y or N) & Description Flyash
or Slag Void
(Paste) %
Ettringite in Voids (Description) Cracks (Where)
Q6T Lime 0.12 Sub to Euh Partial Rims, Some Into Paste None 5% Some Rim and Small Void Filled Coarse aggregate Q6B Limestone 0.05 to 0.18 An to Sub Complete Rims None 5% Some Rim None P1T Dolo/Lime 0.05 An to Sub Partial Rims, Some Into Paste None 5% Some Rim and Small Void Filled Fine aggregate P1B Dolo/Lime 0.04 to 0.18 An to Sub Partial and Complete Rims None 5% Rim and Void Filled Coarse aggregate P3T Dolo/Lime 0.02 to 0.14 Sub Partial and Complete Rims None 5% Small Void Filled Coarse aggregate P3B Dolo/Lime 0.03 to 0.10 Sub Partial and Complete Rims None 5% Small Void Filled Coarse aggregate P4T Dolo/Lime 0.05 to 0.10 An to Sub Partial and Complete Rims None 5% Some Rim and Small Void Filled Coarse aggregate P4B Dolo/Lime 0.02 to 0.10 An to Sub Partial and Complete Rims Into Paste None 5% Small Void Filled Coarse aggregate P5T Dolo/Lime 0.02 to 0.12 An to Sub Complete Rims None 5% Some Rim and Small Void Filled None P5B Dolo/Lime 0.02 to 0.08 An to Sub Partial and Complete Rims Into Paste None 5% Rim and Void Filled Coarse aggregate P6T Dolo/Lime 0.02 to 0.06 An to Sub Partial and Complete Rims Into Paste None 5% Some Rim and Small Void Filled Coarse aggregate P6B Dolo/Lime 0.02 to 0.07 An to Sub Partial and Complete Rims None 5% Rim and Small Void Filled Coarse aggregate F1TJ Dolo 0.03 to 0.10 An to Sub Partial and Complete Rims None 5% Rim Coarse aggregate F1BJ Dolo 0.04 to 0.10 An to Sub Partial Rims, Some Into Paste None 5% Rim and Small Void Filled Fine aggregate
F2BMS Dolo 0.04 to 0.08 An None None 5% Rim and Small Void Filled None
F3TJ Dolo 0.03 to 0.10 Sub Partial and Complete Rims Into Paste None 5% None Large cracks in paste/Coarse aggregate
F3BJ Dolo 0.04 to 0.10 An to Sub Complete Rims None 5% Rim and Void Filled None F4TMS Dolo 0.04 to 0.10 Sub Complete Rims, Some Into Paste None 5% None Large crack in paste F4BMS Dolo 0.03 to 0.10 An to Sub Partial Rims None 5% Rim and Void Filled None
F5T Dolo 0.03 to 0.08 An to Sub Partial and Complete Rims Into Paste None 5% None Large crack in paste F5B Dolo 0.04 to 0.08 An to Sub Partial Rims None 5% Rim and Void Filled None
F5B2 Dolo 0.04 to 0.09 An Partial and Complete Rims Into Paste None 5% Void Filled None F6T Dolo 0.03 to 0.08 An to Sub Partial and Complete Rims Into Paste None 5% Void Filled Large crack in paste F6B Dolo 0.03 to 0.09 An Partial Rims None 5% Rim and Void Filled None O2T Lime 0.02 to 0.13 An to Sub Partial Rims, Some Into Paste Flyash 8% None Fine & coarse aggregate O2B Lime 0.02 to 0.08 An to Sub None Flyash 8% None Fine aggregate
O3T Lime 0.03 to 0.12 An to Sub Partial Rims Flyash 8% None Large cracks in paste/Coarse aggregate
O3B Lime 0.02 to 0.08 An to Sub Partial Rims Flyash 8% None Coarse aggregate O4T Lime 0.02 to 0.10 An to Sub Partial Rims Flyash 8% None None O4B Lime 0.02 to 0.07 An to Sub Partial Rims, Some Into Paste Flyash 8% None None O5T Lime 0.02 to 0.10 Sub Partial Rims Flyash 8% None Coarse aggregate O5B Lime 0.02 to 0.05 An to Sub Partial Rims Flyash 8% None Coarse aggregate O6T Lime 0.02 to 0.12 Sub Partial and Complete Rims Into Paste Flyash 8% None None O6B Lime 0.02 to 0.08 Sub None Flyash 8% None None
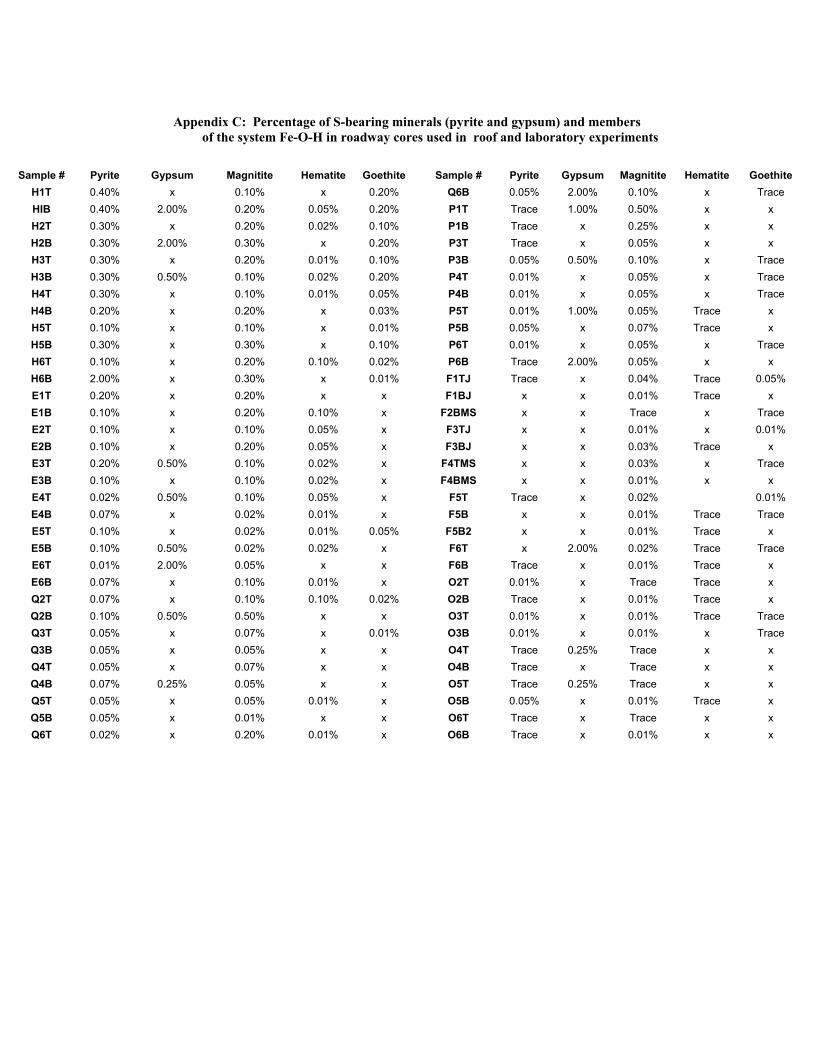
Appendix C: Percentage of S-bearing minerals (pyrite and gypsum) and members
of the system Fe-O-H in roadway cores used in roof and laboratory experiments
Sample # Pyrite Gypsum Magnitite Hematite Goethite H1T 0.40% x 0.10% x 0.20% HIB 0.40% 2.00% 0.20% 0.05% 0.20% H2T 0.30% x 0.20% 0.02% 0.10% H2B 0.30% 2.00% 0.30% x 0.20% H3T 0.30% x 0.20% 0.01% 0.10% H3B 0.30% 0.50% 0.10% 0.02% 0.20% H4T 0.30% x 0.10% 0.01% 0.05% H4B 0.20% x 0.20% x 0.03% H5T 0.10% x 0.10% x 0.01% H5B 0.30% x 0.30% x 0.10% H6T 0.10% x 0.20% 0.10% 0.02% H6B 2.00% x 0.30% x 0.01% E1T 0.20% x 0.20% x x E1B 0.10% x 0.20% 0.10% x E2T 0.10% x 0.10% 0.05% x E2B 0.10% x 0.20% 0.05% x E3T 0.20% 0.50% 0.10% 0.02% x E3B 0.10% x 0.10% 0.02% x E4T 0.02% 0.50% 0.10% 0.05% x E4B 0.07% x 0.02% 0.01% x E5T 0.10% x 0.02% 0.01% 0.05% E5B 0.10% 0.50% 0.02% 0.02% x E6T 0.01% 2.00% 0.05% x x E6B 0.07% x 0.10% 0.01% x Q2T 0.07% x 0.10% 0.10% 0.02% Q2B 0.10% 0.50% 0.50% x x Q3T 0.05% x 0.07% x 0.01% Q3B 0.05% x 0.05% x x Q4T 0.05% x 0.07% x x Q4B 0.07% 0.25% 0.05% x x Q5T 0.05% x 0.05% 0.01% x Q5B 0.05% x 0.01% x x Q6T 0.02% x 0.20% 0.01% x
Sample # Pyrite Gypsum Magnitite Hematite Goethite Q6B 0.05% 2.00% 0.10% x Trace P1T Trace 1.00% 0.50% x x P1B Trace x 0.25% x x P3T Trace x 0.05% x x P3B 0.05% 0.50% 0.10% x Trace P4T 0.01% x 0.05% x Trace P4B 0.01% x 0.05% x Trace P5T 0.01% 1.00% 0.05% Trace x P5B 0.05% x 0.07% Trace x P6T 0.01% x 0.05% x Trace P6B Trace 2.00% 0.05% x x F1TJ Trace x 0.04% Trace 0.05% F1BJ x x 0.01% Trace x
F2BMS x x Trace x Trace F3TJ x x 0.01% x 0.01% F3BJ x x 0.03% Trace x
F4TMS x x 0.03% x Trace F4BMS x x 0.01% x x
F5T Trace x 0.02% 0.01% F5B x x 0.01% Trace Trace
F5B2 x x 0.01% Trace x F6T x 2.00% 0.02% Trace Trace F6B Trace x 0.01% Trace x O2T 0.01% x Trace Trace x O2B Trace x 0.01% Trace x O3T 0.01% x 0.01% Trace Trace O3B 0.01% x 0.01% x Trace O4T Trace 0.25% Trace x x O4B Trace x Trace x x O5T Trace 0.25% Trace x x O5B 0.05% x 0.01% Trace x O6T Trace x Trace x x O6B Trace x 0.01% x x
51
Appendix D: 1992 core sample cement mix information
ID Year Project Number Roadway County Contractor Max./Min. Temp Mix Type
E 92 IR-80-6(157)205--12-48 I-80 Iowa Fred Carlson 85/55 C-3WR-C
77/54 C-3WR-C
86/65 C-3WR-C
F 91 F-150-3(42)--20-10 SH-150 Buchanan Manatt's 70/55 C-3WR-C
89/60 C-3WR-C
65/50 C-3WR-C
65/50 C-3WR
65/50 C-3WR
50/35 C-3WR
92 47/38 C-3WR-C
H 92 RP-163-1(50)--16-77 SH-163 Polk/Jasper Cedar Valley 84/56 C-4WR-C
86/68 C-4WR-C
82/68 C-4WR-C
57/46 C-4WR
54/47 C-4WR
ID Cement Fly Ash Fine Aggregate Coarse Aggregate Water Reducer Air Entraining Agent
E Buffalo IA (I) Ottumwa (C) Disterhoff (A48508) Sully (A50002) Sika Plastocrete 161 Sika AER
Buffalo IA (I) Ottumwa (C) Disterhoff (A48508) Sully (A50002) Sika Plastocrete 161 Sika AER
Buffalo IA (I) Ottumwa (C) Disterhoff (A48508) Sully (A50002) Sika Plastocrete 161 Sika AER
F Mason City IA (LH I) Louisa (C) Hoffman (A10510) Hazleton (A10010) Protex PDA25-DP Protex AES
Mason City IA (LH I) Louisa (C) Hoffman (A10510) Hazleton (A10010) Protex PDA25-DP Protex AES
Mason City IA (LH I) Louisa (C) Hoffman (A10510) Hazleton (A10010) Protex PDA25-DP Protex AES
Mason City IA (LH I) None Hoffman (A10510) Hazleton (A10010) Protex PDA25-DP Protex AES
Mason City IA (LH I) None Hoffman (A10510) Hazleton (A10010) Protex PDA25-DP Protex AES
Mason City IA (LH I) None Hoffman (A10510) Hazleton (A10010) Protex PDA25-DP Protex AES
Mason City IA (HN I) Louisa (C) Randalia (A33510) Hazleton (A10010) Prokrete N-3 Conchem AES
H Mason City IA (HN I) Ottumwa (C) Colfax (A50502) Sully (A50002) WRDA-82 Dara-Vair R
Mason City IA (HN I) Ottumwa (C) Colfax (A50502) Sully (A50002) WRDA-82 Dara-Vair R
Mason City IA (HN I) Ottumwa (C) Colfax (A50502) Sully (A50002) WRDA-82 Dara-Vair R
Mason City IA (HN I) None Colfax (A50502) Sully (A50002) WRDA-82 Dara-Vair R
Mason City IA (HN I) None Colfax (A50502) Sully (A50002) WRDA-82 Dara-Vair R
52
Appendix E: 1997 core sample cement mix information
ID Year Project Number Roadway County Contractor Max./Min. Temperature Mix Type
O 97 NHS-151-3(97)--19-57 US-151 Linn Allied
Construction 91/67 C-3WR-C10
77/53 C-3WR-C10 83/59 C-3WR-C10
P 97 NHS-163-4(22)--2R-62 SH-163 Mahaska Fred Carlson 82/56 C-3WR-C20
75/56 C-3WR-C20
Q 97 NHS-137-3(19)--19-62 SH-137 Mahaska Manatt's 46/23 C-3-C20
46/23 C-3-C20
90/70 C-3WR-C20 87/68 C-3WR-C20
ID Cement Fly Ash Fine Aggregate Coarse Aggregate Water Reducer Air Entraining Agent
O Mason City IA (HN IS) Louisa (C) Ivanhoe (A57520) Bowser-Springville (A57008) Sika Plastocrete 161 Daravair 1000
Mason City IA (HN IS) Louisa (C) Ivanhoe (A57520) Bowser-Springville (A57008) Sika Plastocrete 161 Daravair 1000
Mason City IA (HN IS) Louisa (C) Ivanhoe (A57520) Bowser-Springville (A57008) Sika Plastocrete 161 Daravair 1000
P Louisville NE (I/II) Council Bluffs #3 (C) New Harvey (A63512) Sully (A50002) Sika Plastocrete 161 Sika AEA-15
Louisville NE (I/II) Ottumwa (C) New Harvey (A63512) Sully (A50002) Sika Plastocrete 161 Sika AEA-15
Q Mason City IA (HN I/II) Louisa (C) New Harvey (A63512) Sully (A50002) None Conchem Air
Mason City IA (HN I/II) Louisa (C) New Harvey (A63512) Sully (A50002) None Conchem Air
Mason City IA (HN I/II) Louisa (C) New Harvey (A63512) Sully (A50002) Conchem 25DP ** Conchem Air
Mason City IA (HN I/II) Louisa (C) New Harvey (A63512) Sully (A50002) Conchem 25DP ** Conchem Air
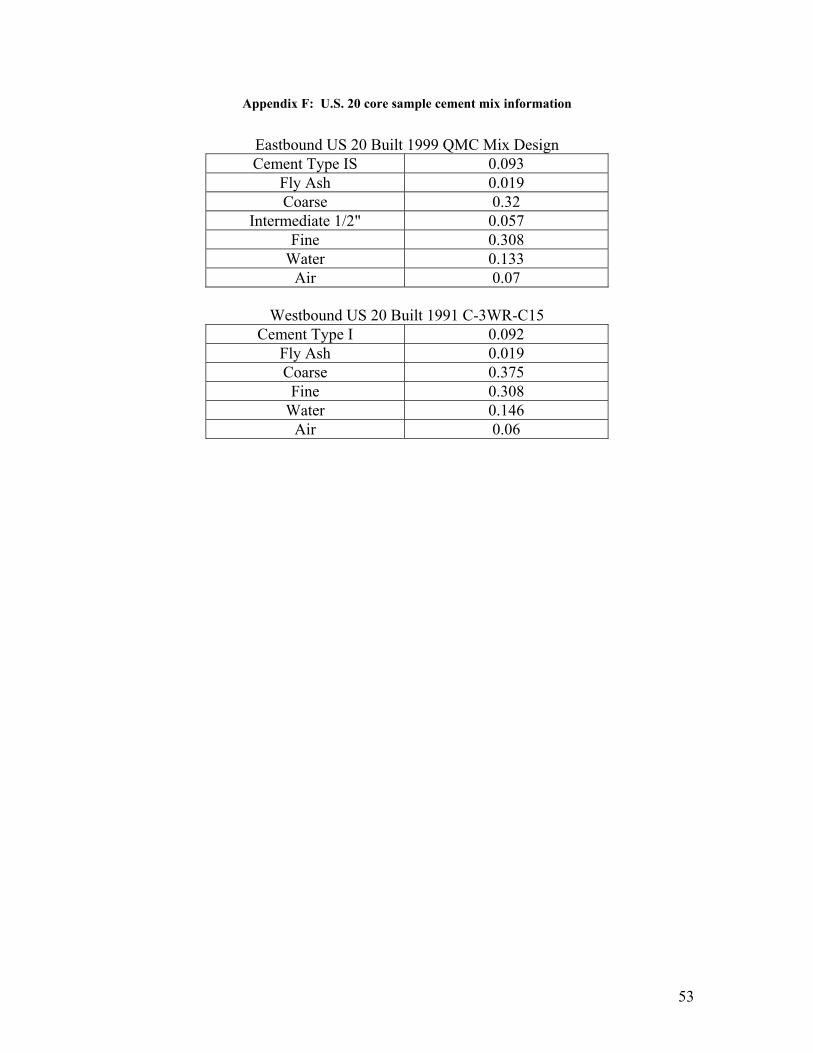
53
Appendix F: U.S. 20 core sample cement mix information
Eastbound US 20 Built 1999 QMC Mix Design Cement Type IS 0.093
Fly Ash 0.019 Coarse 0.32
Intermediate 1/2" 0.057 Fine 0.308
Water 0.133 Air 0.07
Westbound US 20 Built 1991 C-3WR-C15
Cement Type I 0.092 Fly Ash 0.019 Coarse 0.375 Fine 0.308
Water 0.146 Air 0.06