patuxent reservoirs watershed protection group - wsscwater.com · our sincere thanks are given to...
TRANSCRIPT

PATUXENT RESERVOIRS WATERSHED PROTECTION GROUP
2016 ANNUAL REPORT OF THE
TECHNICAL ADVISORY COMMITTEE

ii
Acknowledgements
POLICY BOARD
Lisa Feldt, Chair Montgomery County James Caldwell Howard County William Barnes Howard Soil Conservation District Casey Anderson Maryland-National Capital Park and Planning Commission Robert Butz Montgomery Soil Conservation District Adam Ortiz Prince George's County Carla Reid Washington Suburban Sanitary Commission
Technical Advisory Committee
David Plummer, Chair Montgomery Soil Conservation District Mark Symborski, Vice Chair Maryland-National Capital Park and Planning Commission Bert Nixon Howard County Department of Health Susan Overstreet Howard County Department of Planning and Zoning Christine Lowe Howard County Department of Public Works Kristal McCormick Howard Soil Conservation District Byron Petrauskas Maryland Department of Agriculture Christine Nagle Maryland Department of the Environment Vacant Maryland Department of Natural Resources Amy Stevens Montgomery County Department of Environmental Protection Vacant Montgomery County Department of Permitting Services Ken Clare Prince George’s County Department of Health Lilantha Tennekoon Prince George’s County Department of the Environment Martin Chandler Washington Suburban Sanitary Commission Coordinator Steven Nelson Washington Suburban Sanitary Commission Our sincere thanks are given to those who have contributed their time and advice for the TMDL Subcommittee over the last year. TMDL Subcommittee Martin Chandler Christine Lowe Susan Overstreet Amy Stevens Mark Symborski Lilantha Tennekoon

iii
Contents Acknowledgements ..................................................................................................................... ii Contents .................................................................................................................................... iii Tables and Figures...................................................................................................................... iv
Abbreviations .............................................................................................................................. v
Executive Summary .....................................................................................................................1
Introduction ................................................................................................................................3
Total Maximum Daily Load Implementation ................................................................................6
Pollutant Load Estimation and TMDL Gap Analysis (c. 2000-2015) ...........................................6
Municipal Separate Storm Sewer System (MS4) NPDES Permit Implementation Plans ............7
Howard County ...................................................................................................................7
Montgomery County ...........................................................................................................8
Prince George’s County .......................................................................................................9
Annual Progress on Implementation Items for the Priority Resources .......................................11
Reservoir and Water Supply ..................................................................................................11
Trends Analysis for Reservoir Water Quality ......................................................................11
Reservoir Water Quality Monitoring ..................................................................................11
Terrestrial Habitat .................................................................................................................16
Howard County Stream ReLeaf and Tree Canopy Programs ...............................................16
Oaks Landfill Reforestation ................................................................................................16
White-tailed Deer Management ........................................................................................16
Stream Systems .....................................................................................................................18
Maple Dell Farm Stream Restoration Project .....................................................................18
Cherrytree Farms Stream Restoration Project ...................................................................18
Aquatic Biota .........................................................................................................................19
Tributary Biological and Habitat Monitoring ......................................................................19
Rural Character and Landscape .............................................................................................30
Agricultural Preservation Easement enrollments ...............................................................30
Agricultural Progress .........................................................................................................31
Howard County Land Use ..................................................................................................33
Public Awareness and Stewardship .......................................................................................34
Farm Academy ..................................................................................................................34
Montgomery County Department of Parks ........................................................................34
Patuxent River Clean-up ....................................................................................................35
RainScapes Rewards Program ............................................................................................35
WSSC’s “Watershed” Property Surrounding the Reservoirs - Environmental Outreach ......36
Priority Resources: Goals & Performance Measures ..................................................................37

iv
Tables and Figures Table 1. Modeled Pollutant Load Reductions Achieved since 2000 .............................................2
Table 2. Phosphorus Reductions to Patuxent Reservoirs from Howard County Urban BMPs ......8
Table 3. Baseline Monitoring Stations for Benthic Stations only ...............................................23
Table 4. Agricultural Progress for 2015-16 in the Patuxent Reservoirs Watershed ....................31
Table 5. Performance Measures and Goals for Priority Resources ............................................37
Table 6. Work Plan Expenditures for Current Fiscal Year ..........................................................43
Figure 1. WSSC Drinking Water Service Area - Patuxent & Potomac Sources ..............................4
Figure 2. Patuxent Reservoirs Watershed (from Versar 2009) ....................................................5
Figure 3. Active chlorophyll-a concentrations for 2016 growing season ....................................12
Figure 4. Annual variations in active chlorophyll-a concentrations for Patuxent Reservoirs .......13
Figure 5. Contour plots of DO concentrations for Patuxent Reservoirs .....................................15
Figure 6. Patuxent River State Park Annual Deer Hunts (1996-2016) ........................................17
Figure 7. WSSC Deer Hunt Totals (2001-2016) ..........................................................................17
Figure 8. Howard County Biological Monitoring Results in Rocky Gorge Watershed .................20
Figure 9. Biological Condition vs Percent Imperviousness and Specific Conductivity .................21
Figure 10. Montgomery County DEP Provisional Baseline Stream Monitoring Cycle .................22
Figure 11. Montgomery County Stream Conditions from 2011-2015 Biological assessments ....24
Figure 12. Hawlings River Stream Conditions (2015) .................................................................25
Figure 13. Hawlings River Stream Conditions (1997-2015) ........................................................25
Figure 14. Hawlings River Biological Condition vs habitat (2015) ..............................................26
Figure 15. Lower Patuxent River Watershed Stream Conditions Trends (1999-2015)................27
Figure 16. Lower Patuxent River Watershed Biological Conditon vs Habitat (2015) ..................27
Figure 17. Upper Patuxent River Watershed Stream Conditions (2015) .....................................28
Figure 18. Upper Patuxent River Watershed Stream Conditions (1999-2015) ............................29
Figure 19. Upper Patuxent River Watershed Biological Condition vs Habitat (2015) ..................29
Figure 20. Howard County Protected Lands within the reservoirs’ watershed ..........................30
Figure 21. Farm Acres with Soil Conservation and Water Quality Plans ....................................32
Figure 22. Number of Best Management Practices Installed .....................................................32
v
Abbreviations
Abbreviation Definition
aka Also Known As
BMP Best Management Practice
ca. Approximately; about
chl-a Chlorophyll-a
DEP (Montgomery County) Department of Environmental Protection
DO Dissolved Oxygen
DOT (Montgomery County) Department of Transportation
DPW (Howard County) Department of Public Works
ea Each
EPA U.S. Environmental Protection Agency
ESD Environmental Site Design
FY Fiscal Year
HC Howard County
HSCD Howard Soil Conservation District
LID Low Impact Development
MAST Maryland Assessment Scenario Tool
MC Montgomery County
MDE Maryland Department of the Environment
M-NCPPC Maryland-National Capital Park and Planning Commission
MS4 Municipal Separate Storm Sewer System
MSCD Montgomery Soil Conservation District
mg/L Milligrams per Liter (equivalent to part per million)
µg/L Micrograms per Liter (equivalent to part per billion)
PGC Prince George’s County
NPDES National Pollutant Discharge Elimination System
pH Power of Hydrogen
PRWPG Patuxent Reservoirs Watershed Protection Group
PSA (Howard County) Planned Service Area
RC (Howard County) Rural Conservation
RR (Howard County) Rural Residential
SCD Soil Conservation District
TAC Technical Advisory Committee
TMDL Total Maximum Daily Load
TOC Total Organic Carbon
WLA Waste Load Allocation
WSSC Washington Suburban Sanitary Commission

Patuxent Reservoirs Watershed Technical Advisory Committee Protection Group 1 2016 Annual Report
Executive Summary
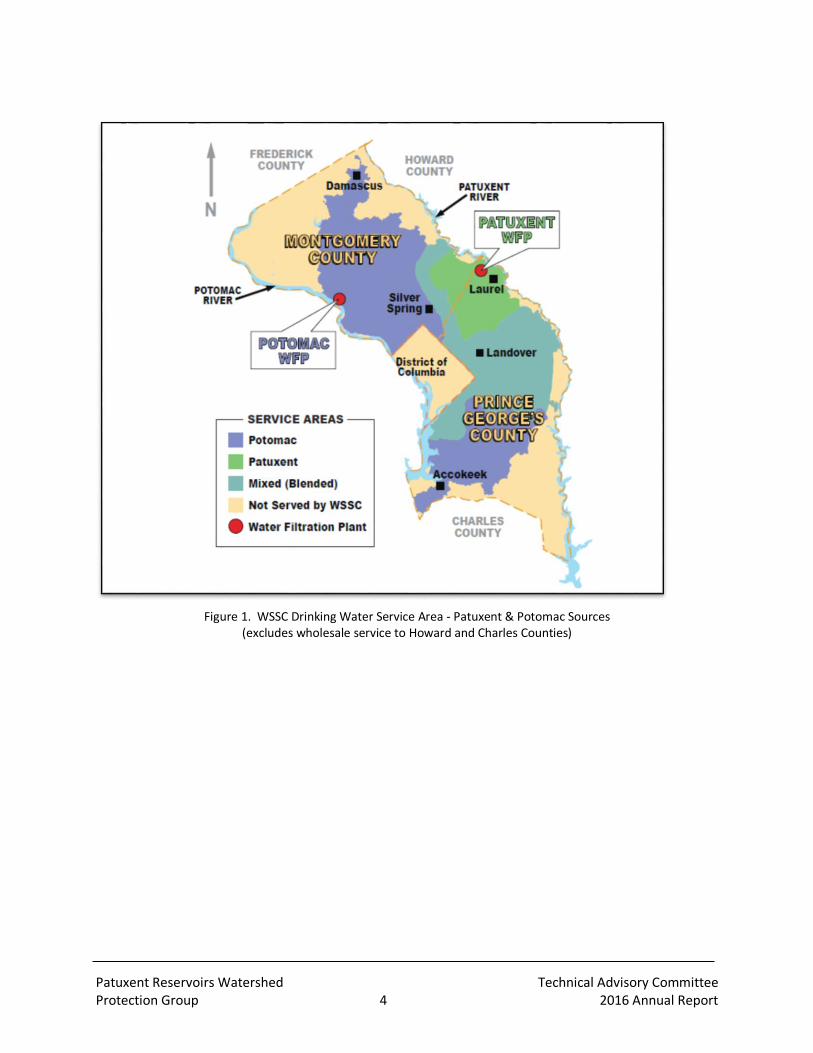
Two reservoirs on the Patuxent River, Triadelphia and Rocky Gorge (aka T. Howard Duckett), are significant water supply sources for the Washington D.C. metropolitan area serving residents primarily in Montgomery and Prince George’s Counties (Figure 1). The Patuxent Reservoirs’ 132-square mile watershed includes land mostly in Howard and Montgomery Counties (about 99%) and the remaining land is in Prince George’s and Frederick Counties (Figure 2).
In 1998, the Maryland Department of the Environment (MDE) identified both reservoirs as impaired by nutrients and identified Triadelphia Reservoir as impaired by sediment; consequently, MDE determined that the reservoirs were unable to achieve State water quality standards for their designated uses, one of which is public water supply. To address these impairments, the US Environmental Protection Agency (EPA) approved Total Maximum Daily Loads (TMDL) for both reservoirs in November 2008. A phosphorus TMDL was established for each reservoir, and a sediment TMDL was established for Triadelphia Reservoir. Since 1997, the Technical Advisory Committee (TAC) has completed an Annual Report to summarize its accomplishments and identify funding needs to address watershed priority resource issues. This annual report provides an update of on-going efforts and those completed in 2016. A work plan is provided at the end of this report (Table 66). The work plan lists implementation needs and items for each of the priority resources along with the responsible agency or agencies and the corresponding budget expenditure for the current year. The following are highlights from 2016:
1. On October 31, the TAC arranged a tour for the Policy Board members to gain a greater
appreciation of these important, regional water resources and to show some of the water quality challenges faced by the Patuxent Reservoirs Watershed Protection Group. Tour stops included the Rocky Gorge Reservoir and the Duckett Dam, the Reddy Branch stream buffer planting site in Montgomery County and a new stream restoration site planned for the Maple Dell dairy farm in Howard County.
2. In 2012, the Policy Board approved a request for $70,000 to determine progress made
towards achieving the pollutant reduction goals specified in the TMDLs for the reservoirs. Modeled results of pollutant load reductions since 2000 revealed some progress towards meeting the TMDLs and the significant load reductions that remain (Table 1). At the 2016 Policy Board Meeting, the estimated reductions were presented, together with draft recommendations for next steps. These steps include seeking feedback from the MDE, continuing to track land use and Best Management Practice (BMP) implementation, assessing the apparent BMP implementation rates, and identifying the most cost-effective

Patuxent Reservoirs Watershed Technical Advisory Committee Protection Group 2 2016 Annual Report
BMPs. The TAC indicated that MDE’s assessment of the gap analysis, and input on the draft next steps would be factored into the TAC’s 2017 work program. The Policy Board approved this approach and directed the TAC to proceed accordingly in 2017.
Table 1. Modeled Pollutant Load Reductions Achieved since 2000
Phosphorus Rocky Gorge
Phosphorus Triadelphia
Sediment Triadelphia
TMDL Reduction Goal 48% 58% 29%
Achieved To-Date 17% 9% 8%
Remaining Gap 31% 49% 21%
Howard, Montgomery, and Prince George’s Counties continue to make progress towards meeting local TMDL goals via their National Pollutant Discharge Elimination System (NPDES) Municipal Separate Storm Sewer System (MS4) Permits. For Howard County, the strategy to meet the MS4 permit impervious restoration requirement and its TMDL goals in its Countywide Implementation Strategy (CIS) was updated in 2016 to include detailed watershed assessments and restoration plans for the Watershed. Two projects identified in Montgomery County’s portion of the Watershed assessment include the Rosa Parks Middle School and the Longwood Recreation Center. Since only about 1% of the Watershed is in Prince George’s County, there is limited opportunities for restoration activities. The County is exploring opportunities to implement restoration projects, but in 2016 no restoration activities occurred.
3. The Washington Suburban Sanitary Commission (WSSC) completed its 25th year of reservoir
water quality monitoring to provide data for technical analysis and long-term trend evaluation to support protection of the reservoirs and drinking water supply. A trends analysis was conducted for selected variables from WSSC’s reservoir monitoring program in 2016. Significant, increasing trends were detected in chloride and sodium at the Patuxent Water Filtration Plant; chloride and sodium values have increased about three-fold in the last 25 years. Seasonal patterns in chloride and sodium were evident in the winter and spring months suggesting input of road salts entering tributaries and the reservoirs. A significant, increasing trend was also observed in chlorophyll-a within Rocky Gorge Reservoir; chlorophyll-a is one type of chlorophyll present in all algae, and it is often used as a surrogate for algal abundance.
4. Technical and financial assistance from the Howard and Montgomery Soil Conservation
Districts (SCDs) resulted in the installation of 68 agricultural BMPs in the Watershed. In addition, the districts developed or revised 22 Soil Conservation and Water Quality Plans for about 2,590 acres (4 square miles) of farm land in the watershed.
5. A variety of successful outreach events occurred again in 2016 including: watershed and
Adopt-A-Road clean-ups, Montgomery County Department of Parks’ Weed Warrior Program, and annual WSSC-sponsored events (Children’s Water Festival, Family Fishing Day).

Patuxent Reservoirs Watershed Technical Advisory Committee Protection Group 3 2016 Annual Report
Introduction The Washington Suburban Sanitary Commission (WSSC) continues to provide potable water from the Patuxent Reservoirs system to about 650,000 customers, located mainly in eastern Montgomery County and Prince George’s County (Figure 1). The Patuxent Reservoirs Watershed (the Watershed) encompasses about 132 square miles located almost entirely (99%) in Howard County (HC) and Montgomery County (MC), with the remaining drainage area located in Prince George’s and Frederick Counties (Figure 2). This year marks the 20th anniversary of the formation of the Patuxent Reservoirs Watershed Protection Group (PRWPG). The Technical Advisory Committee (TAC) has completed an Annual Report, which summarizes accomplishments and funds expended to meet goals set by the TAC to protect the six priority resources. An update of activities in 2016 is provided of on-going efforts to address the implementation items for the Priority Resources. This Annual Report will be accompanied by a separate, supplemental document to provide background information for items summarized in this report. In 2003, the Goals-Setting Workgroup of the TAC re-evaluated the original list of action items and proposed a revised action plan, which was approved by the Policy Board. This revised list of action items or work plan, titled Performance Measures and Goals for Priority Resources, represents a continuation of the commitment to coordinate protection efforts in coming years (Table 4). This table contains goals, performance measures, implementation items, and a time line to achieve each goal for six priority resources selected by the TAC. Those priority resources include the following:
Reservoirs and water supply
Terrestrial habitat
Stream systems
Aquatic biota
Rural character and landscape, and
Public awareness and stewardship.
Although progress towards a number of these goals has been made over the years, the timelines established for the implementation items have generally not been met due to limited agency work programs and budgets and other priorities. The TAC will continue to implement items associated with each of the priority resources primarily through existing TAC agency responsibilities and work programs. A table of work plan expenditures is provided at the end of this report (Table 5) containing a list of implementation needs and action items for each of the priority resources, along with the responsible agency or agencies and the corresponding budget expenditure for the current year.
Patuxent Reservoirs Watershed Technical Advisory Committee Protection Group 4 2016 Annual Report
Figure 1. WSSC Drinking Water Service Area - Patuxent & Potomac Sources
(excludes wholesale service to Howard and Charles Counties)

Patuxent Reservoirs Watershed Technical Advisory Committee Protection Group 5 2016 Annual Report
Figure 2. Patuxent Reservoirs Watershed (from Versar 2009)

Patuxent Reservoirs Watershed Technical Advisory Committee Protection Group 6 2016 Annual Report
Total Maximum Daily Load Implementation In 1998, the Maryland Department of the Environment (MDE) identified both reservoirs as impaired by nutrients and identified Triadelphia Reservoir as impaired by sediment; consequently, MDE determined that the reservoirs were unable to achieve State water quality standards for their designated uses, one of which is a public drinking water supply. To address these impairments, the US Environmental Protection Agency (EPA) approved Total Maximum Daily Loads (TMDLs) for both reservoirs in November 2008. A phosphorus TMDL was established for each reservoir, and a sediment TMDL was established for Triadelphia Reservoir (29% reduction required). Significant phosphorus load reductions are required (58% for Triadelphia Reservoir, 48% for Rocky Gorge Reservoir) to meet Maryland’s water quality standards.1 Almost all of the needed phosphorus load reductions were allocated to non-point sources (NPS) of pollution (i.e., load allocation). Runoff from land uses such as low density residential and agricultural land, in addition to eroding stream banks are considered as NPS of pollution for the Patuxent Reservoirs Watershed.
Pollutant Load Estimation and TMDL Gap Analysis (c. 2000-2015)
During the December 2012 meeting of the PRWPG, the Policy Board approved the TAC’s recommendation to allocate $70,000 in Fiscal Year 2014 (FY14) for a consultant or temporary staff position. The funding was allocated to assess progress made towards achieving the pollutant reduction goals specified in the TMDLs for the reservoirs. A Memorandum of Understanding was signed between the four TAC funding agencies, Montgomery and Prince George’s Counties, the Maryland-National Capital Park and Planning Commission (M-NCPPC), and the Washington Suburban Sanitary Commission (WSSC). The latter agency served as project manager, using a contract with environmental consultant EA Engineering, Science & Technology to perform the work. The scope of work included developing a methodology to account for pollutant load estimates and load reductions; compiling a database of structural and non-structural Best Management Practices (BMPs) installed since the baseline year for the TMDL, c. 2000; and estimating the pollutant load reductions achieved since 2000, as well as the “gap analysis” of remaining load reductions needed to meet the TMDL goals. The geodatabase developed with this project has been provided to the TAC together with an instruction guide to allow ongoing tracking of subsequent BMPs and load reductions. Obtaining data was challenging, as well as reconciling differences between the modeling approaches used in 2003 for the original TMDL development and the later models used by the Counties for tracking and reporting their MS4 National Pollutant Discharge Elimination System
1 Maryland Department of the Environment. June 2008. Total Maximum Daily Loads of Total Phosphorus and
Sediments for Triadelphia Reservoir (Brighton Dam) and Total Maximum Daily Loads of Total Phosphorus for
Rocky Gorge Reservoir, Howard, Montgomery and Prince George’s Counties, Maryland. Baltimore, MD.
Patuxent Reservoirs Watershed Technical Advisory Committee Protection Group 7 2016 Annual Report
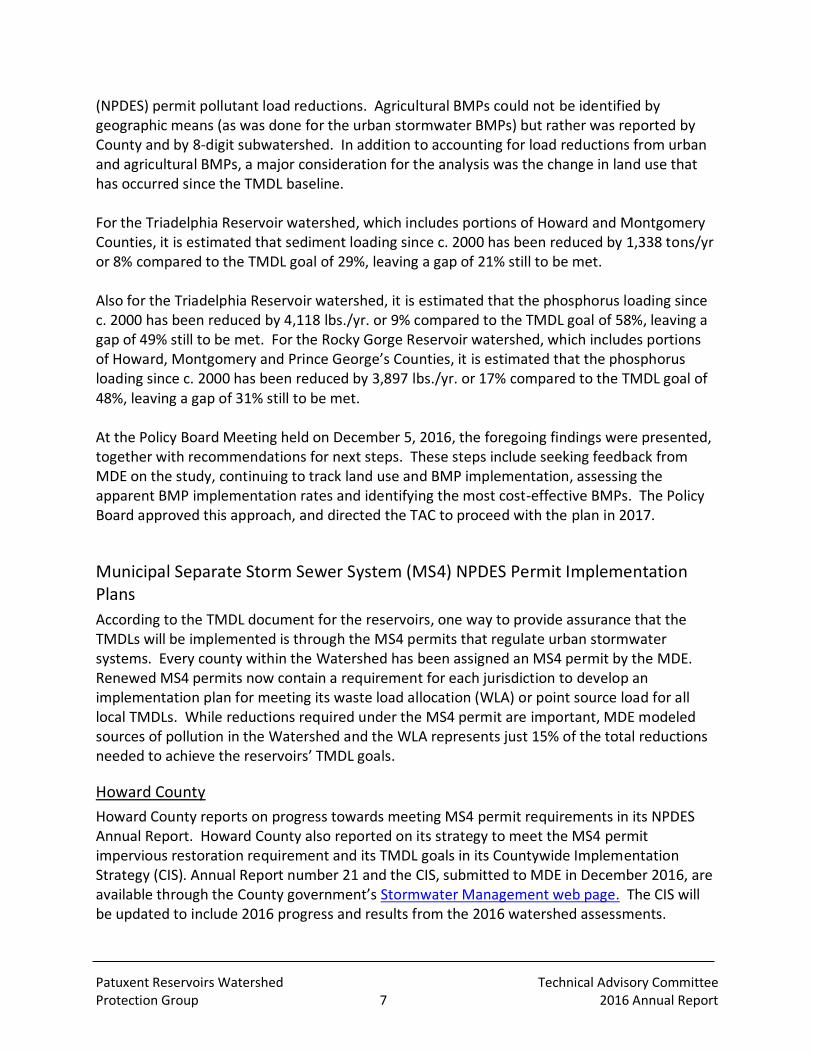
(NPDES) permit pollutant load reductions. Agricultural BMPs could not be identified by geographic means (as was done for the urban stormwater BMPs) but rather was reported by County and by 8-digit subwatershed. In addition to accounting for load reductions from urban and agricultural BMPs, a major consideration for the analysis was the change in land use that has occurred since the TMDL baseline. For the Triadelphia Reservoir watershed, which includes portions of Howard and Montgomery Counties, it is estimated that sediment loading since c. 2000 has been reduced by 1,338 tons/yr or 8% compared to the TMDL goal of 29%, leaving a gap of 21% still to be met. Also for the Triadelphia Reservoir watershed, it is estimated that the phosphorus loading since c. 2000 has been reduced by 4,118 lbs./yr. or 9% compared to the TMDL goal of 58%, leaving a gap of 49% still to be met. For the Rocky Gorge Reservoir watershed, which includes portions of Howard, Montgomery and Prince George’s Counties, it is estimated that the phosphorus loading since c. 2000 has been reduced by 3,897 lbs./yr. or 17% compared to the TMDL goal of 48%, leaving a gap of 31% still to be met. At the Policy Board Meeting held on December 5, 2016, the foregoing findings were presented, together with recommendations for next steps. These steps include seeking feedback from MDE on the study, continuing to track land use and BMP implementation, assessing the apparent BMP implementation rates and identifying the most cost-effective BMPs. The Policy Board approved this approach, and directed the TAC to proceed with the plan in 2017.
Municipal Separate Storm Sewer System (MS4) NPDES Permit Implementation Plans
According to the TMDL document for the reservoirs, one way to provide assurance that the TMDLs will be implemented is through the MS4 permits that regulate urban stormwater systems. Every county within the Watershed has been assigned an MS4 permit by the MDE. Renewed MS4 permits now contain a requirement for each jurisdiction to develop an implementation plan for meeting its waste load allocation (WLA) or point source load for all local TMDLs. While reductions required under the MS4 permit are important, MDE modeled sources of pollution in the Watershed and the WLA represents just 15% of the total reductions needed to achieve the reservoirs’ TMDL goals.
Howard County
Howard County reports on progress towards meeting MS4 permit requirements in its NPDES Annual Report. Howard County also reported on its strategy to meet the MS4 permit impervious restoration requirement and its TMDL goals in its Countywide Implementation Strategy (CIS). Annual Report number 21 and the CIS, submitted to MDE in December 2016, are available through the County government’s Stormwater Management web page. The CIS will be updated to include 2016 progress and results from the 2016 watershed assessments.
Patuxent Reservoirs Watershed Technical Advisory Committee Protection Group 8 2016 Annual Report
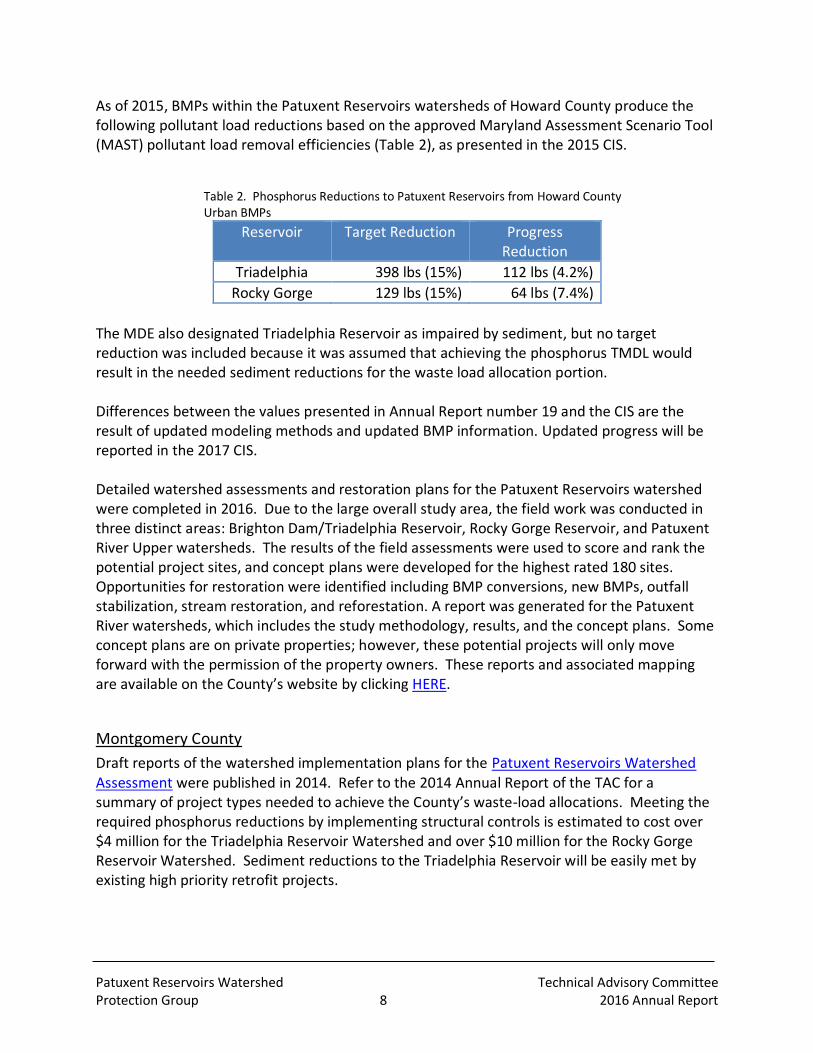
As of 2015, BMPs within the Patuxent Reservoirs watersheds of Howard County produce the following pollutant load reductions based on the approved Maryland Assessment Scenario Tool (MAST) pollutant load removal efficiencies (Table 2), as presented in the 2015 CIS.
Table 2. Phosphorus Reductions to Patuxent Reservoirs from Howard County Urban BMPs
Reservoir Target Reduction Progress Reduction
Triadelphia 398 lbs (15%) 112 lbs (4.2%)
Rocky Gorge 129 lbs (15%) 64 lbs (7.4%)
The MDE also designated Triadelphia Reservoir as impaired by sediment, but no target reduction was included because it was assumed that achieving the phosphorus TMDL would result in the needed sediment reductions for the waste load allocation portion. Differences between the values presented in Annual Report number 19 and the CIS are the result of updated modeling methods and updated BMP information. Updated progress will be reported in the 2017 CIS. Detailed watershed assessments and restoration plans for the Patuxent Reservoirs watershed were completed in 2016. Due to the large overall study area, the field work was conducted in three distinct areas: Brighton Dam/Triadelphia Reservoir, Rocky Gorge Reservoir, and Patuxent River Upper watersheds. The results of the field assessments were used to score and rank the potential project sites, and concept plans were developed for the highest rated 180 sites. Opportunities for restoration were identified including BMP conversions, new BMPs, outfall stabilization, stream restoration, and reforestation. A report was generated for the Patuxent River watersheds, which includes the study methodology, results, and the concept plans. Some concept plans are on private properties; however, these potential projects will only move forward with the permission of the property owners. These reports and associated mapping are available on the County’s website by clicking HERE.
Montgomery County
Draft reports of the watershed implementation plans for the Patuxent Reservoirs Watershed Assessment were published in 2014. Refer to the 2014 Annual Report of the TAC for a summary of project types needed to achieve the County’s waste-load allocations. Meeting the required phosphorus reductions by implementing structural controls is estimated to cost over $4 million for the Triadelphia Reservoir Watershed and over $10 million for the Rocky Gorge Reservoir Watershed. Sediment reductions to the Triadelphia Reservoir will be easily met by existing high priority retrofit projects.

Patuxent Reservoirs Watershed Technical Advisory Committee Protection Group 9 2016 Annual Report
Montgomery County’s Fiscal Year 2016 MS4 NPDES Annual Report provides the progress made to date toward meeting its permit requirements, including those projects planned and completed in the Watershed. View the report on the county’s website by clicking HERE. The FY16 NPDES Annual Report includes a table (page 113) of projects identified through the watershed assessment for the Patuxent watershed. These projects were identified for future consideration to address the TMDL and MS4 permit requirements. More information about the County’s restoration projects in design for the Patuxent Reservoir Watershed is available on the DEP website. The website includes an interactive map that displays the projects by watershed. There are two ways to find a project: by using the map tool to search by address or project name, and by zooming to an area of interest. The projects currently in design or completed in the Watershed include:
Rosa Parks Middle School was selected for a county facilities project to help reduce stormwater pollution that drains into our streams. County Facilities projects generally involve installing small-scale stormwater practices to capture water from rooftops, roadways, and sidewalks during storms. County Facilities projects incorporate many of the same practices as Green Streets projects.
Longwood Recreation Center was selected for a low impact development (LID) retrofit project to help reduce stormwater pollution that drains into our streams. LID projects generally involve installing small-scale stormwater practices on County property to capture water from roadways, parking lots and sidewalks during storms.
Prince George’s County
The County has begun to implement the strategies specified in the restoration plans developed in previous years to improve water quality in local water bodies and the Chesapeake Bay. The County has executed various programs to rapidly expand its restoration activities towards meeting the conditions in its MS4 NPDES Permit. Key among these programs is the County’s partnership with Corvias Solutions to form the Clean Water Partnership. The Partnership is tasked with the restoration of 2,000 impervious acres by FY2018 which will meet almost a third of the County’s restoration requirement under its current MS4 Permit. The types of restoration activities to be implemented will be Environmental Site Design (ESD) type storm water Best Management Practices (BMP), pond retrofits, and other urban BMPs such as stream restoration, outfall stabilization, and tree planting. As of yet, no restoration activities have occurred in the Rocky Gorge Reservoir watershed within the County. Because only a small area of the reservoir watershed falls within the County, and most of the land in the watershed is not owned by the County, there are limited opportunities for restoration activities. The County provides a vast array of volunteer opportunities and outreach activities to promote environmental awareness, green initiatives and community involvement towards protecting the environment. The County has integrated water quality outreach as a vital component of
Patuxent Reservoirs Watershed Technical Advisory Committee Protection Group 10 2016 Annual Report
watershed restoration projects. Since January 2015, the County has engaged grade K–12 students as well as the general public in numerous outreach and education events in the Patuxent River Watershed. The County also conducts numerous tree planting activities through its Arbor Day Every Day and Tree ReLeaf programs as well as litter reduction campaigns through its Comprehensive Community Cleanup Program. These programs occur throughout the County as strategic areas are identified.

Patuxent Reservoirs Watershed Technical Advisory Committee Protection Group 11 2016 Annual Report
Annual Progress on Implementation Items for the Priority Resources
Reservoir and Water Supply
Trends Analysis for Reservoir Water Quality
A trends analysis was conducted for selected variables from WSSC’s reservoir monitoring program, which has been on-going since 1993. The analysis was performed on four indicators of water quality to assess the condition of the Patuxent Reservoirs including: ammonia- nitrogen, chloride, sodium, and total chlorophyll-a. These indicators were chosen because of their relatively good data quality, relevance to nutrient reductions as required by the reservoir TMDLs, and for their usefulness to operators at the Patuxent Water Filtration Plant. Statistical tests were chosen to detect the true signal or trend by eliminating the noise from factors such as influence from stream flow and seasonality in the data. Trends observed include:
1. Significant, increasing trends in chloride and sodium at the Patuxent Water Filtration Plant. Chloride and sodium values have increased about three-fold in about 25 years. Seasonal patterns were evident in the winter and spring months suggesting input of road salts entering tributaries and the reservoirs.
2. A significant, increasing trend was observed in chlorophyll-a within Rocky Gorge Reservoir.
3. A weaker, increasing, flow-adjusted trend was observed for ammonia-nitrogen within the bottom waters of Triadelphia Reservoir.
Potential next steps include expanding the trend analysis to other important indicators of water quality such as dissolved oxygen, total phosphorus, and water clarity.
Reservoir Water Quality Monitoring
The WSSC completed its 25th year of reservoir water quality monitoring to provide data for technical analysis and long-term trend evaluation to support protection of the reservoirs and drinking water supply. Several sites on each reservoir are normally monitored bi-weekly, except during winter months. The parameters measured monthly are alkalinity, chloride, chlorophyll-a, color, phosphorus, nitrogen, sodium, total organic carbon, and turbidity. In addition, in-situ transparency and depth profile measurements of conductivity, dissolved oxygen, oxidation-reduction potential, pH, and temperature were measured bi-
The water quality goal of the nutrient TMDLs is to reduce high chlorophyll-a concentrations that reflect excessive algal blooms, and to maintain dissolved oxygen at a level supportive of the designated uses for Triadelphia and Rocky Gorge Reservoirs. The water quality goal of the sediment TMDL for Triadelphia Reservoir is to increase the useful life of the reservoir for water supply by preserving storage capacity. TMDLs of Phosphorus and Sediments for Triadelphia Reservoir and TMDLs of Phosphorus for Rocky Gorge Reservoir, Howard, Montgomery and Prince George’s Counties, MD. 2008

Patuxent Reservoirs Watershed Technical Advisory Committee Protection Group 12 2016 Annual Report
weekly. In 2016, sensors were added to measure chlorophyll-a and phycocyanin (indicator of cyanobacteria or blue-green algae concentrations), dissolved organic matter, and turbidity. Chlorophyll-a Chlorophyll-a (chl-a) is one type of chlorophyll present in all algae, and it is often used as a surrogate for algal abundance. The monitoring results for this constituent are summarized in this report and used as one indicator of reservoir water quality. The MDE amended Maryland’s water quality standards by adding chl-a criteria for public water supply reservoirs in 2010 (Code of Maryland Regulations 26.08.02.03-3). The two criteria for public water supply reservoirs are:
1. The arithmetic mean of a representative number of samples of chlorophyll-a concentrations, measured during the growing season (May 1 to September 30) as a 30-day moving average may not exceed 10 micrograms per liter (µg/L); and
2. The 90th-percentile of measurements taken during the growing season may not exceed 30 micrograms per liter.
Weekly, active chl-a samples, collected from the Patuxent Water Plant’s raw water source, are used to determine compliance with the first criterion. The thirty-day moving average did not exceed the 10 µg/L threshold during the growing season (Figure 3). The moving average decreased from May through the beginning of August and then increased slightly during an algal bloom in late August.
Figure 3. Active chlorophyll-a concentrations for 2016 growing season (May – September). Red, dashed line represents the thirty day moving average threshold for public water supply reservoirs.
0
2
4
6
8
10
12
14
Act
ive
Chl
orop
hyll-
a C
on
cen
tra
tio
ns
(µg/
Lite
r)
Raw Water Active Chlorophyll-a ConcentrationsRocky Gorge Reservoir - 2016 Growing Season
Active Chlorophyll-a
4 Week Moving Average

Patuxent Reservoirs Watershed Technical Advisory Committee Protection Group 13 2016 Annual Report
For the second criterion, five sets of chl-a samples were collected from the reservoirs during the 2016 growing season (May-September). Active chl-a results were used to better indicate living algal biomass rather than total chl-a. The 90th percentile threshold was not exceeded in Rocky Gorge (28.5 µg/L) or in Triadelphia (13.2 µg/L) during 2016 (Figure 4).
(A) Rocky Gorge Reserv oir
25%-75%
10%-90%
Outliers
Extremes
2010 2011 2012 2013 2014 2015 2016
Year
0
10
20
30
40
50
60
Acti
ve C
hlo
rop
hyll
-a (
mic
rog
ram
s/L
)
(B) Triadelphia Reserv oir
25%-75%
10%-90%
Outliers
Extremes
2010 2011 2012 2013 2014 2015 2016
Year
0
10
20
30
40
50
60
Acti
ve C
hlo
rop
hyll
-a (
mic
rog
ram
s/L
)
Figure 4. Annual variations (2010-2016) in active chlorophyll-a concentrations for (A) Rocky Gorge Reservoir and (B) Triadelphia Reservior. Growing season data (May-Sept) shown for comparison with red, dashed line at 30 micrograms/Liter representing the 90th percentile threshold for public water supply reservoirs.

Patuxent Reservoirs Watershed Technical Advisory Committee Protection Group 14 2016 Annual Report
Dissolved Oxygen Maryland’s water quality standard for dissolved oxygen (DO) of 5 milligrams/Liter (mg/L) is the minimum threshold for all state waters, except when natural conditions, such as thermal stratification in reservoirs, cause DO concentrations to fall below this threshold. Bottom (hypolimnetic) waters of deep portions of reservoirs can become depleted of oxygen during summer months when thermal stratification prevents oxygen from entering into deeper waters and the remaining oxygen is consumed during decomposition of organic matter (e.g., decaying algae). Maryland adopted guidelines for interpreting DO and chl-a criteria for thermally stratified reservoirs in 2006 (MDE 2012). Historically, these hypoxic, or low DO conditions, have occurred seasonally within both Patuxent Reservoirs, although these conditions are more pronounced in Triadelphia Reservoir. The three MDE guidelines2 to help determine compliance with water quality standards pertaining to DO include:
1. A minimum DO concentration of 5 mg/L to be maintained in surface layers at all times (except during periods of spring and fall overturn);
2. A minimum DO concentration of 5 mg/L to be maintained throughout water column when reservoir is well mixed (non-summer months); and
3. Hypoxia (generally thought to be less than 2 mg/L DO) in bottom waters will be addressed by MDE on a case-by-case basis.
Depth-time (or contour) plots of DO for each reservoir illustrate the degree of hypoxia (<2 mg/L) throughout the water column over time (Figure 5). For these plots, data were obtained from the vertical profiling systems recently installed at each dam. DO data used for the contour plots were collected every two hours at Duckett Dam and every six hours at Brighton Dam. As is typical near the Duckett Dam, Rocky Gorge Reservoir exhibited little thermal stratification during 2016, and Triadelphia Reservoir exhibited a more pronounced thermal stratification for a longer period of time than did Rocky Gorge Reservoir. Guideline 1 This guideline was not met for Rocky Gorge Reservoir during occasional excursions below the threshold in August. Surface DO was also less than 5 mg/L from mid-September to early October, but this period coincided with the fall over turn. This guideline was satisfied for Triadelphia Reservoir given that the period in late September when DO fell below 5 mg/L also occurred during its fall over turn. Guideline 2 This guideline was satisfied for both reservoirs when they were well mixed.
2 Maryland Department of the Environment. Guidelines for Interpreting Dissolved Oxygen and Chlorophyll-a
Criteria in Maryland’s Seasonally Stratified Water-Supply Reservoirs. Revised February 2012.

Patuxent Reservoirs Watershed Technical Advisory Committee Protection Group 15 2016 Annual Report
Guideline 3 Hypoxia occurred in the bottom waters of both reservoirs. Similar to results from recent years, hypoxic conditions persisted for a longer period in Triadelphia Reservoir compared to Rocky Gorge Reservoir. Hypoxia occurred in the bottom waters of Triadelphia Reservoir beginning in mid-June and persisted until mid-October; hypoxia occurred in the bottom waters of Rocky Gorge Reservoir beginning in late June and persisted until mid-September.
(A) Rocky Gorge Reservoir
(B) Triadelphia Reservoir
Figure 5. Contour plots of DO concentrations in (A) Rocky Gorge Reservoir and (B) Triadelphia Reservoir

Patuxent Reservoirs Watershed Technical Advisory Committee Protection Group 16 2016 Annual Report
Terrestrial Habitat
The focus of this priority resource continues to be the preservation and management of forested land that provides water quality benefits to the reservoirs and their tributaries. Forests provide numerous, well-documented water quality benefits such as filtering and infiltrating runoff, stabilizing stream banks, and reducing thermal impacts, as well as providing habitat for wildlife.
Howard County Stream ReLeaf and Tree Canopy Programs
Howard County’s Department of Recreation and Parks (DRP) manages both the Stream ReLeaf and the Turf to Trees tree planting programs on private property. The DRP planted a total of 228 trees in the Patuxent Reservoirs Watershed in 2016, through the Turf to Trees Program. Trees planted via the Turf to Trees Program can be planted anywhere on a property, while Stream ReLeaf trees are planted to establish stream buffers.
Oaks Landfill Reforestation
A Montgomery County reforestation project began in 2011 at the Oaks Landfill in Laytonsville to convert mowed fields to a forest of native trees. This tree planting is designed to meet the MDE’s criteria in the August 2014 “Accounting for Stormwater Wasteload Allocations and Impervious Acres Treated.” To claim impervious acre credit, the newly planted forest must grow and develop such that there are at least 100 stems per acre with 50% of them 2 inches or greater in diameter at 4.5 feet above ground level. Once this is achieved, the County will claim 53 acres of forest resulting in 20 acres of impervious acreage equivalent treated. Reforestation and maintenance was largely funded by two grants through the Chesapeake and Atlantic Coastal Bays 2010 Trust Fund, totaling $257,400. The County’s Department of Environmental Protection (DEP) has provided funding for the project as well.
White-tailed Deer Management
One of the TAC’s goals for this priority resource is to ensure forests are self-sustaining and capable of long-term natural regeneration, and one way to implement this goal is by managing the white-tailed deer population within the watershed. The Department of Natural Resources (DNR), the Montgomery County Department of Parks, the Howard County Department of Recreation and Parks, and the WSSC continued to implement their deer hunting programs in 2016. Deer population control is needed given the many harmful effects associated with an over-abundance of deer, including deer-vehicle collisions, agricultural crop damage, and damage to a naturally regenerating and self-sustaining forest ecosystem.3
Howard County Deer Management Program The Howard County Department of Recreation & Parks Deer Management Program includes annually scheduled bow and shotgun managed hunts and sharpshooting in County parks and open space. In the Patuxent Reservoirs Watershed, a hunt was held in the Fulton South Area
3 The Montgomery County Deer Management Work Group. Comprehensive Management Plan for White-tailed
Deer in Montgomery County, MD. Revised 2004.
Patuxent Reservoirs Watershed Technical Advisory Committee Protection Group 17 2016 Annual Report
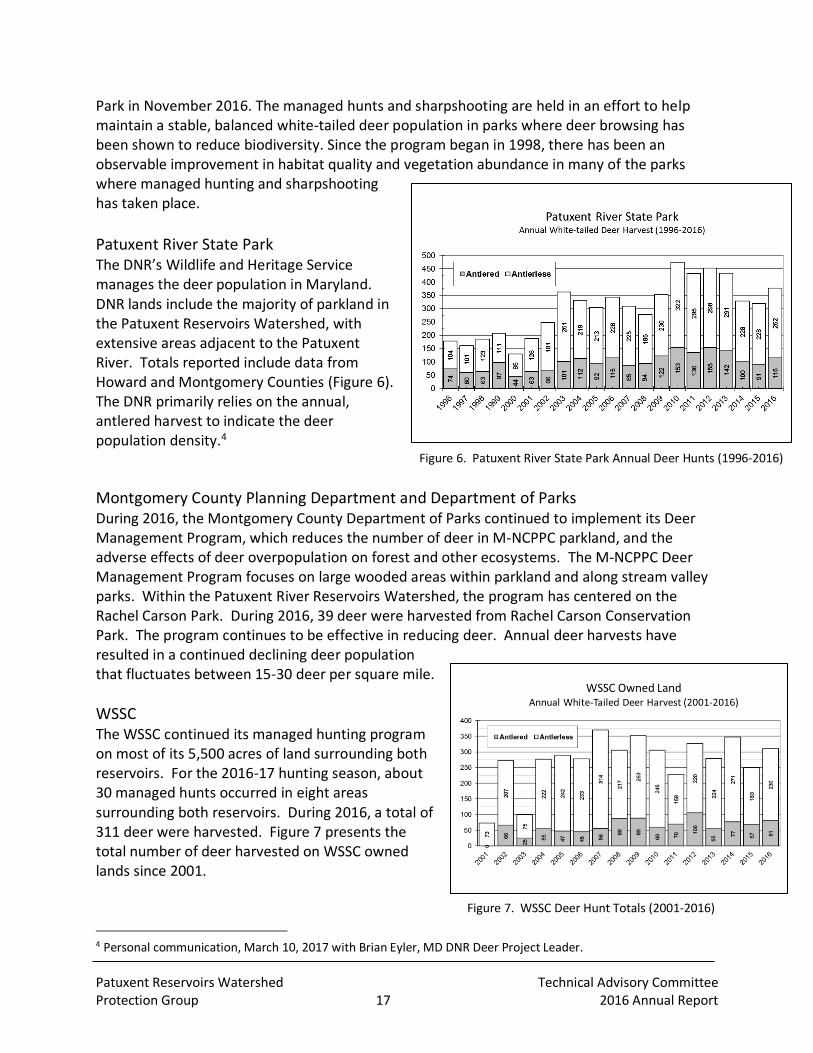
Park in November 2016. The managed hunts and sharpshooting are held in an effort to help maintain a stable, balanced white-tailed deer population in parks where deer browsing has been shown to reduce biodiversity. Since the program began in 1998, there has been an observable improvement in habitat quality and vegetation abundance in many of the parks where managed hunting and sharpshooting has taken place.
Patuxent River State Park The DNR’s Wildlife and Heritage Service manages the deer population in Maryland. DNR lands include the majority of parkland in the Patuxent Reservoirs Watershed, with extensive areas adjacent to the Patuxent River. Totals reported include data from Howard and Montgomery Counties (Figure 6). The DNR primarily relies on the annual, antlered harvest to indicate the deer population density.4
Figure 6. Patuxent River State Park Annual Deer Hunts (1996-2016)
Montgomery County Planning Department and Department of Parks During 2016, the Montgomery County Department of Parks continued to implement its Deer Management Program, which reduces the number of deer in M-NCPPC parkland, and the adverse effects of deer overpopulation on forest and other ecosystems. The M-NCPPC Deer Management Program focuses on large wooded areas within parkland and along stream valley parks. Within the Patuxent River Reservoirs Watershed, the program has centered on the Rachel Carson Park. During 2016, 39 deer were harvested from Rachel Carson Conservation Park. The program continues to be effective in reducing deer. Annual deer harvests have resulted in a continued declining deer population that fluctuates between 15-30 deer per square mile.
WSSC The WSSC continued its managed hunting program on most of its 5,500 acres of land surrounding both reservoirs. For the 2016-17 hunting season, about 30 managed hunts occurred in eight areas surrounding both reservoirs. During 2016, a total of 311 deer were harvested. Figure 7 presents the total number of deer harvested on WSSC owned lands since 2001.
Figure 7. WSSC Deer Hunt Totals (2001-2016)
4 Personal communication, March 10, 2017 with Brian Eyler, MD DNR Deer Project Leader.

Patuxent Reservoirs Watershed Technical Advisory Committee Protection Group 18 2016 Annual Report
Stream Systems
Stream corridor management activities include stream channel stabilization and restoration, and implementing streamside BMPs. These activities are targeted at stream channel reaches that were identified in stream corridor assessment surveys as severe problem areas for erosion. These activities help restore and protect the stream system, improve habitat and water quality for aquatic biota, and support protection of the reservoirs and water supply (i.e., minimize loss of capacity due to sedimentation).
Maple Dell Farm Stream Restoration Project
Maple Dell Farm is a 96-acre active dairy and row crop farm, one of three remaining dairy farms in Howard County. It is located on either side of Cattail Creek, within the Triadelphia Reservoir watershed. Two smaller tributaries merge on the northwestern portion of the farm to form the mainstem of Cattail Creek, which continues east through the farm eventually reaching the Triadelphia Reservoir. Three additional first order tributaries enter Cattail Creek within the project site boundaries. The streams on the property have a drainage area of approximately 2,400 acres. All of the stream reaches are located in the dairy farm pasture areas, with only a sparse or absent riparian forest stream bank cover along the mainstem. A large wetland is located on the mainstem in the middle of the project area, but little wetland character is present in this location. Floodplain areas have been cleared of trees and maintained in pasture cover. The current project includes 6,182 linear feet of stream restoration, selective harvesting of 10.6 acres of trees to establish new pasture, and the installation of 4,527 linear feet of new fencing to exclude the dairy herd from the restoration area. The restoration and repair of stream and riparian areas will support base flow discharge while diverting storm flow discharge into adjacent floodplains. This will temporarily store, treat, and infiltrate precipitation discharges and will contribute to the restoration of the shallow groundwater table. These efforts will improve the wetland hydrology of the site and the quality of the water moving through the property. They will also serve to reverse the effects of watershed changes that have increased runoff volumes, peak discharges, velocities and erosive forces. A ribbon cutting for the project was held in January 2017, and construction is anticipated in fiscal year 2019. The WSSC has partnered with Howard County to fund the establishment of the 15-acre riparian easement; to plant trees within this easement; and to monitor water quality before, during, and after construction. The 15-acre easement encompasses all of the streams and a large portion of the floodplain on the farm. Fencing will be erected along the easement boundary to exclude the dairy herd from the streams and tree planting.
Cherrytree Farms Stream Restoration Project
This restoration site, located in Howard County, is an unnamed tributary to the Rocky Gorge Reservoir and is adjacent to Sand Cherry Lane in Scaggsville. The project area consists of a total of approximately 670 linear feet. Construction of the restored channel was completed in April

Patuxent Reservoirs Watershed Technical Advisory Committee Protection Group 19 2016 Annual Report
2010. In-stream repairs were done in August 2016 at selected areas along the channel that were identified in previous monitoring as needing rehabilitation repairs. Coir log rolls were installed at three locations, with the two most downstream logs installed adjacent to riffle grade control. A stone toe protection was installed and an existing point bar was lowered approximately 6-8 inches in elevation in this area. A small pool in that same area which had been filled in by sediment conveyed by overland flow, and stormwater runoff was reinstalled. In October 2016, the repair areas were inspected and all were in stable condition.
Aquatic Biota
Tributary Biological and Habitat Monitoring
As land cover changes occur and stream restoration and streamside BMPs are implemented, biological and habitat monitoring of the tributaries is used to track progress in protecting the stream system and aquatic biota. These monitoring efforts can also identify problem areas and provide indicators for possible problem sources to help guide future restoration efforts.
Howard County The Howard County Department of Public Works, Stormwater Management Division initiated the Howard County Biological Monitoring and Assessment Program during 2001 to establish a baseline ecological stream condition for all of the County’s watersheds. The program involves monitoring the biological health and physical condition of the County’s water resources and is designed on a five-year rotating basis such that each of the County’s 15 watersheds is sampled once every five years. A third round of monitoring was completed in the Rocky Gorge Watershed during 2016. A significant difference was found between the 2003 and 2016 assessment results indicating improved stream habitat conditions; however, a similar improvement in biological assessment scores or benthic index of biotic integrity (BIBI) was not observed during the same time period, as may be expected (Figure 8). One explanation given in the 2016 report for the lack of corresponding improvement in biological condition in the watersheds sampled (including Rocky Gorge) is an impairment caused by water quality or quantity.

Patuxent Reservoirs Watershed Technical Advisory Committee Protection Group 20 2016 Annual Report
(A) Biological Assessment
B. Physical Habitat Assessment
Figure 8. Comparison of three rounds of (A) Biological and (B) Physical Habitat results in within Howard County’s portion of the Rocky Gorge Watershed.
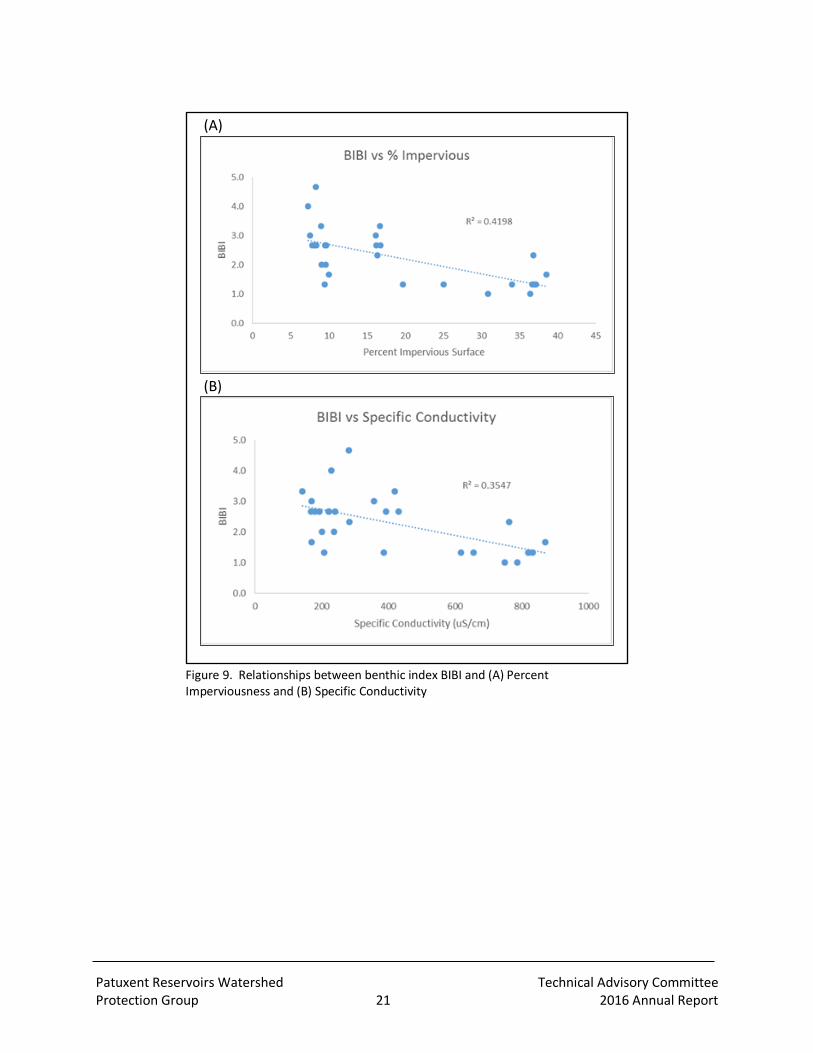
Comparisons were made between BIBI results and contributing watershed percent imperviousness and specific conductivity data collected at each site (Figure 9). Significant, negative correlations were found between decreasing BIBI scores and increasing percent impervious surface (r = -0.648, p<0.001) and conductivity measurements (r = -0.596, p = 0.001). The complete report, including a comparison of the three rounds of survey results, can be found at the DPWs’ Watershed Survey web page.
Patuxent Reservoirs Watershed Technical Advisory Committee Protection Group 21 2016 Annual Report
(A)
(B)
Figure 9. Relationships between benthic index BIBI and (A) Percent Imperviousness and (B) Specific Conductivity
Patuxent Reservoirs Watershed Technical Advisory Committee Protection Group 22 2016 Annual Report
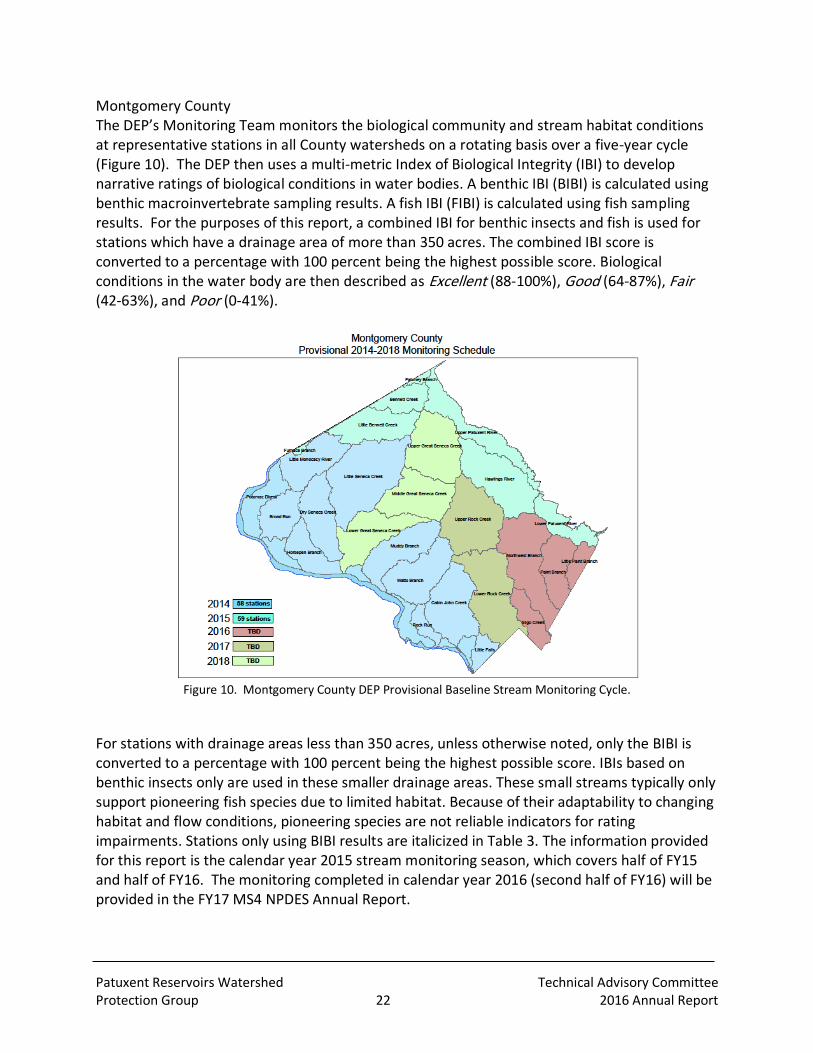
Montgomery County The DEP’s Monitoring Team monitors the biological community and stream habitat conditions at representative stations in all County watersheds on a rotating basis over a five-year cycle (Figure 10). The DEP then uses a multi-metric Index of Biological Integrity (IBI) to develop narrative ratings of biological conditions in water bodies. A benthic IBI (BIBI) is calculated using benthic macroinvertebrate sampling results. A fish IBI (FIBI) is calculated using fish sampling results. For the purposes of this report, a combined IBI for benthic insects and fish is used for stations which have a drainage area of more than 350 acres. The combined IBI score is converted to a percentage with 100 percent being the highest possible score. Biological conditions in the water body are then described as Excellent (88-100%), Good (64-87%), Fair (42-63%), and Poor (0-41%).
Figure 10. Montgomery County DEP Provisional Baseline Stream Monitoring Cycle.
For stations with drainage areas less than 350 acres, unless otherwise noted, only the BIBI is converted to a percentage with 100 percent being the highest possible score. IBIs based on benthic insects only are used in these smaller drainage areas. These small streams typically only support pioneering fish species due to limited habitat. Because of their adaptability to changing habitat and flow conditions, pioneering species are not reliable indicators for rating impairments. Stations only using BIBI results are italicized in Table 3. The information provided for this report is the calendar year 2015 stream monitoring season, which covers half of FY15 and half of FY16. The monitoring completed in calendar year 2016 (second half of FY16) will be provided in the FY17 MS4 NPDES Annual Report.

Patuxent Reservoirs Watershed Technical Advisory Committee Protection Group 23 2016 Annual Report
Table 3. Baseline Monitoring Stations for Benthic Stations only
Table III.F.2 2015 Baseline Monitoring Stations
Benthic Only Sites Are Bold and Italicized
Station Tributary Watershed
HWGT204 Gregg Road Tributary Hawlings River
HWHW209 Vicky Wan Tributary Hawlings River
HWHW301 Unnamed Tributary to Upper Hawlings River Hawlings River
HWHW308B Unnamed Tributary to Upper Hawlings River Hawlings River
HWHW315 Unnamed Tributary to Upper Hawlings River Hawlings River
HWHW407 Lower Hawlings River Hawlings River
HWJC301 James Creek Hawlings River
HWRB301 Reddy Branch Hawlings River
LPAT201 Dustin Road Tributary Lower Patuxent
LPPR206 Ashland Tributary Lower Patuxent
LPRG103 Unnamed Tributary to Rocky Gorge Lower Patuxent
LPRG111 Patuxent Drive Tributary Lower Patuxent
LPRG202 Kruhm Road Tributary Lower Patuxent
LPRG203 Oursler Road Tributary Lower Patuxent
LPRG204 Unnamed Tributary to Ednor Branch Lower Patuxent
UPGT201 Greenstone Tributary Upper Patuxent
UPHB203 Haights Branch Upper Patuxent
UPHR201 Hipsley Mill Run Upper Patuxent
UPMC101 Unnamed Tributary to Lower Brighton Dam Upper Patuxent
UPPR101 Dorsey Run Upper Patuxent
UPPR103 Unnamed Tributary to Lower Brighton Dam Upper Patuxent
UPPR105 Unnamed Tributary to Upper Brighton Dam Upper Patuxent
UPPR201A Unnamed Damascus Tributary to Upper Brighton
Dam Upper Patuxent
UPPR207 Unnamed Damascus Tributary to Upper Brighton
Dam Upper Patuxent
UPPR208 Unnamed Tributary to Upper Brighton Dam Upper Patuxent
UPPR301 Unnamed Damascus Tributary to Upper Brighton
Dam Upper Patuxent
UPPR402 Patuxent River-Upper Brighton Dam Upper Patuxent
UPSB203B Scotts Branch Upper Patuxent
In 2015, the DEP completed a full round of sampling to represent all of the baseline watershed conditions in the County from 2011 to 2015 (Figure 11). An interactive map is also available by clicking HERE. This map allows the user to examine the health of over 150 subwatersheds in the County by zooming in or searching by address.

Patuxent Reservoirs Watershed Technical Advisory Committee Protection Group 24 2016 Annual Report
Figure 11. Montgomery County Stream Conditions from 2011-2015 assessments. Patuxent Reservoirs Watershed is shown as Upper Patuxent River, Lower Patuxent River, and Hawlings River watersehds. From Montgomery County 2016 Annual MS4 NPDES Report.
Patuxent Reservoirs Watershed Technical Advisory Committee Protection Group 25 2016 Annual Report
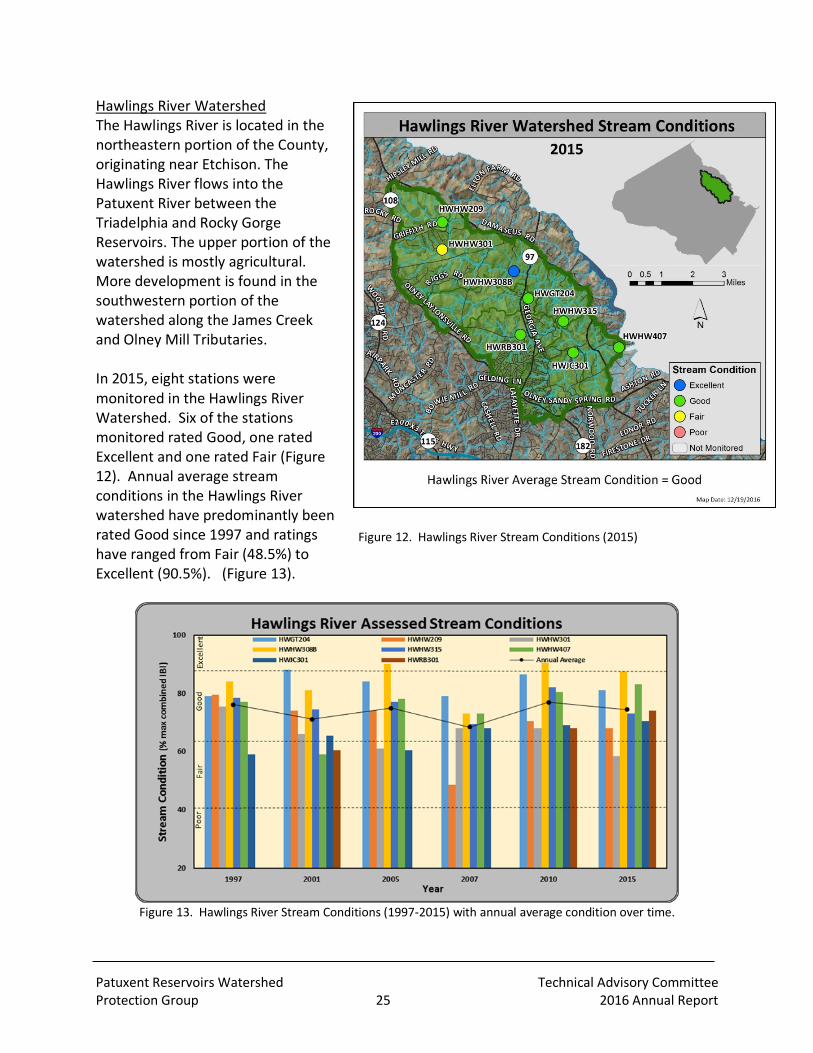
Hawlings River Watershed The Hawlings River is located in the northeastern portion of the County, originating near Etchison. The Hawlings River flows into the Patuxent River between the Triadelphia and Rocky Gorge Reservoirs. The upper portion of the watershed is mostly agricultural. More development is found in the southwestern portion of the watershed along the James Creek and Olney Mill Tributaries. In 2015, eight stations were monitored in the Hawlings River Watershed. Six of the stations monitored rated Good, one rated Excellent and one rated Fair (Figure 12). Annual average stream conditions in the Hawlings River watershed have predominantly been rated Good since 1997 and ratings have ranged from Fair (48.5%) to Excellent (90.5%). (Figure 13).
Figure 13. Hawlings River Stream Conditions (1997-2015) with annual average condition over time.
Figure 12. Hawlings River Stream Conditions (2015)

Patuxent Reservoirs Watershed Technical Advisory Committee Protection Group 26 2016 Annual Report
No stations in the Hawlings River watershed appear to have impaired benthic conditions due to observed habitat. Two stations in the upper reaches do seem to have impaired fish conditions for reasons other than habitat. Both the Vicky Wan Tributary (HWHW209) and an unnamed tributary to the Upper Hawlings (HWHW301) had only Fair FIBI scores when the habitat was assessed as Suboptimal (Figure 14). (A) (B)
Figure 14. Comparision between habitat and biological conditions for (A) benthic macroinvertebrate and (B) fish communites in the Hawlings River Watershed during 2015.
Lower Patuxent Watershed
Seven Lower Patuxent stations were monitored in 2015. Stream conditions ranged from Fair (50.5%) at the Kruhm Road Tributary to Excellent (100%) at the Patuxent Drive Tributary (LPRG111) and the Oursler Road Tributary (LPRG203). The Oursler Road Tributary has a drainage area less than 350 acres and was only sampled for benthics. Both an unnamed tributary to Rocky Gorge (LPRG103) and the Patuxent Drive Tributary were rated Excellent. The Dustin Road (LPAT201) and Kruhm Road (LPRG202) Tributaries, both second order tributaries located in the most downstream areas of the watershed, rated Fair.
Annual average stream conditions have varied from Fair to Excellent since monitoring began in 1999 (Figure 15). Three stations in 2015 have changed one category since monitoring occurred in 2010. An unnamed tributary to Ednor Branch (LPRG204) dropped from Excellent to Good when BIBI scores for 2015 decreased by 20 percent and FIBI scores decreased by 17 percent. However, these lower scores are still within the range observed in prior years.
Two stations improved stream conditions since the prior round of monitoring. The Ashland Tributary (LPPR206) stream condition increased from Fair (56%) in 2010 to Good (71.5%) in 2015, primarily due to improved fish survey results. Results for the 2010 fish survey appear to have been negatively affected by a fish blockage from debris and sediment that had accumulated at a culvert. The 2015 fish community may have rebounded after the blockage cleared.

Patuxent Reservoirs Watershed Technical Advisory Committee Protection Group 27 2016 Annual Report
The Kruhm Road Tributary (LPRG202) had Suboptimal habitat for both benthic and fish sampling. However, biological conditions were rated Fair, which was lower than expected (Figure 16). Rather than water quality issues, low fish scores may be due to the extensive bedrock exposed in many step pools that likely impede fish movement. Biological conditions for fish surveys were substantially lower at the Dustin Road tributary (LPAT201). Habitat was Suboptimal but fish conditions rated Poor with only three pioneer species recorded: Rhinichthys atratulus (blacknose dace), Lepomis cyanellus (green sunfish), and Semotilus atromaculatus (creek chub).
(A) (B)
Figure 16. Comparision between habitat and biological conditions for (A) benthic macroinvertebrate and (B) fish communites in the Lower Patuxent River Watershed during 2015.
Figure 15. Lower Patuxent Stream Conditions Trends, 1999 to 2015

Patuxent Reservoirs Watershed Technical Advisory Committee Protection Group 28 2016 Annual Report
Upper Patuxent Watershed
In 2015, thirteen Upper Patuxent stations were monitored. Excellent ratings (90 to 100%) were more predominant for streams with smaller drainage areas. These include a small second order tributary, Hipsley Mill Run (UPHBR201) and the four first order tributaries: two unnamed tributaries to lower Brighton Dam (UPMC101, UPPR103), one unnamed tributary to the upper Brighton Dam (UPPR105), and Dorsey Run (UPPR101). These locations had drainage areas of less than 350 acres, so only benthic conditions are reflected in the stream conditions. Stream conditions for the remaining stations in the Upper Patuxent were rated Good, ranging from 64.5 to 86 percent (Figure 17).
Figure 17. Upper Patuxent River Watershed Stream conditions during 2015.
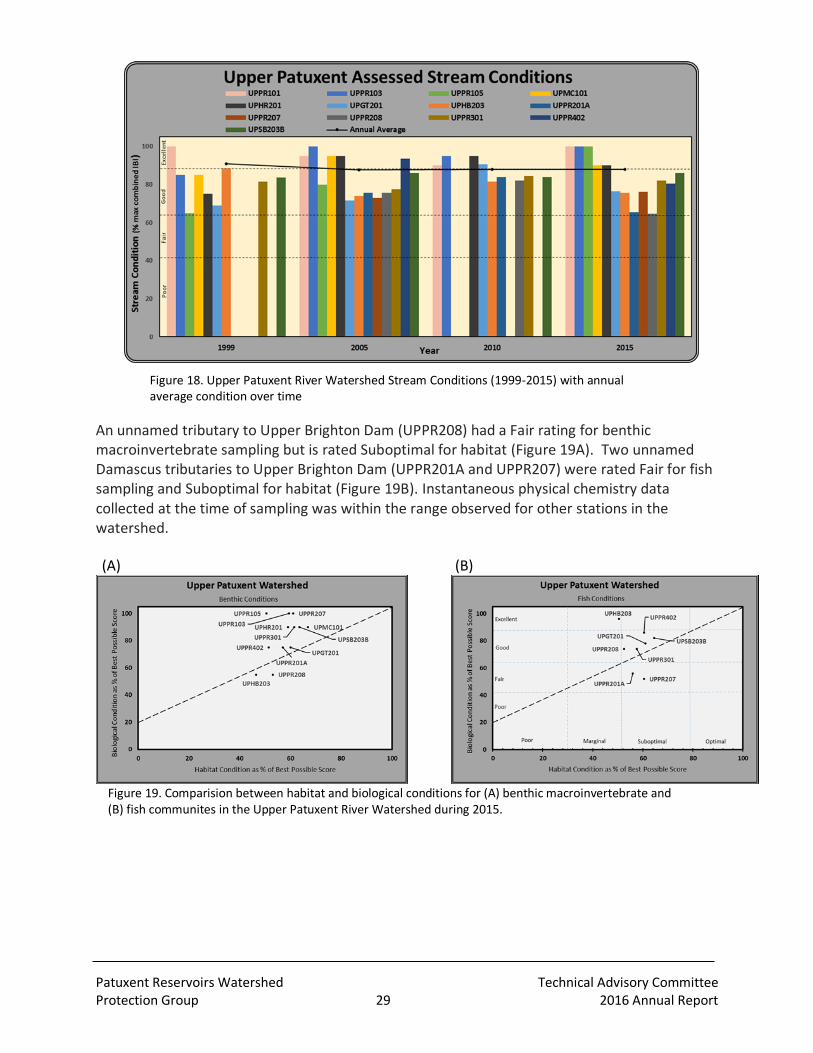
Since 1999, annual average stream conditions have been Good or Excellent, while average conditions for the watershed have remained constant at 87 percent since the 2005 monitoring cycle. Smaller drainage areas continue to have better water quality with the majority of the sites rated Excellent (Figure 18).
The Greenstone Tributary (UPGT201) decreased from Excellent (90.5 percent) in 2010 to Good (76.5 percent) in 2015. Slight changes in the fish population contributed to the decline. One Salmo trutta (brown trout), a sensitive species, was counted in 2010. Overall, the population became more tolerant. The moderately sensitive Clinostomus funduloides (rosyside dace) and Rhinichthys cataractae (longnose dace) were prevalent in 2010, while tolerant blacknose dace, Etheostoma olmstedi (tessellated darters) and green sunfish dominated in 2015. From 2005 to 2015, the Patuxent River-Upper Brighton Dam Tributary (UPPR402) experienced a 20 percent decrease in the BIBI and a 13 percent decrease in the FIBI. A recently observed and heavily used horse trail has likely impacted the station. The loss of instream cover, an increase in sediment deposition, and a decrease in bank stability have occurred since 2005.
Patuxent Reservoirs Watershed Technical Advisory Committee Protection Group 29 2016 Annual Report
Figure 18. Upper Patuxent River Watershed Stream Conditions (1999-2015) with annual average condition over time
An unnamed tributary to Upper Brighton Dam (UPPR208) had a Fair rating for benthic macroinvertebrate sampling but is rated Suboptimal for habitat (Figure 19A). Two unnamed Damascus tributaries to Upper Brighton Dam (UPPR201A and UPPR207) were rated Fair for fish sampling and Suboptimal for habitat (Figure 19B). Instantaneous physical chemistry data collected at the time of sampling was within the range observed for other stations in the watershed.
(A) (B)
Figure 19. Comparision between habitat and biological conditions for (A) benthic macroinvertebrate and (B) fish communites in the Upper Patuxent River Watershed during 2015.
Patuxent Reservoirs Watershed Technical Advisory Committee Protection Group 30 2016 Annual Report
Rural Character and Landscape
The aim of this priority resource is to preserve open spaces while maintaining an economically viable and environmentally protective agricultural community.
Agricultural Preservation Easement enrollments
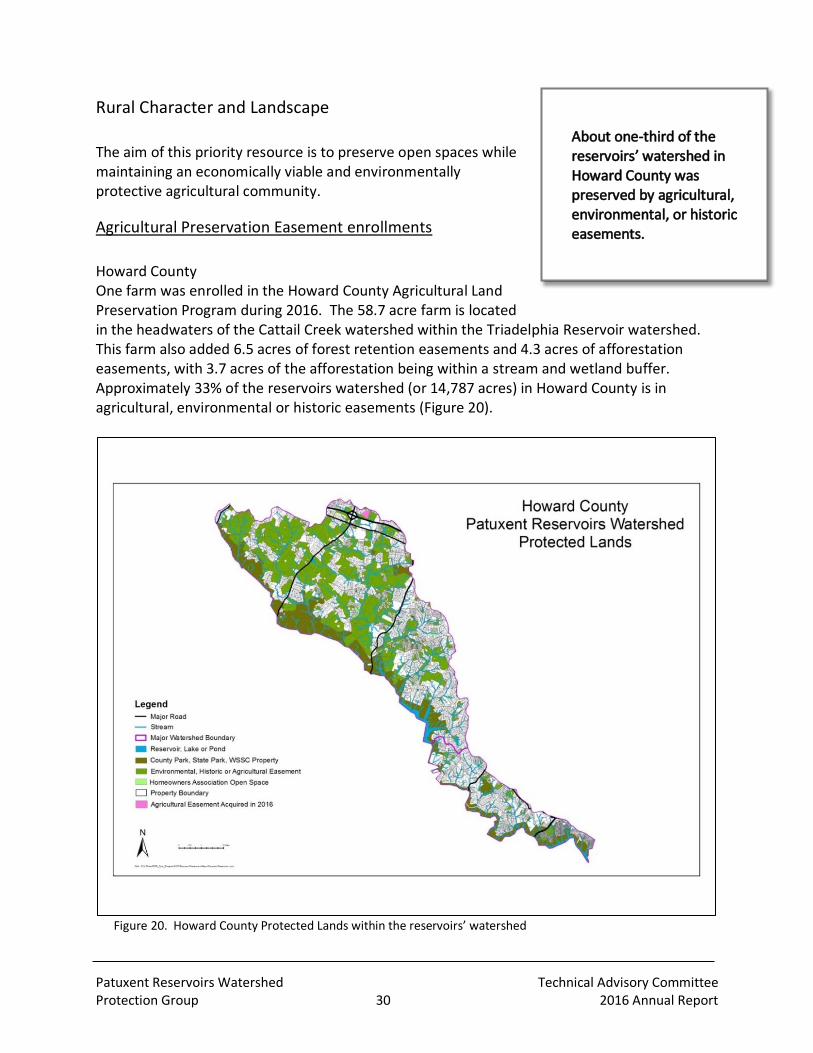
Howard County One farm was enrolled in the Howard County Agricultural Land Preservation Program during 2016. The 58.7 acre farm is located in the headwaters of the Cattail Creek watershed within the Triadelphia Reservoir watershed. This farm also added 6.5 acres of forest retention easements and 4.3 acres of afforestation easements, with 3.7 acres of the afforestation being within a stream and wetland buffer. Approximately 33% of the reservoirs watershed (or 14,787 acres) in Howard County is in agricultural, environmental or historic easements (Figure 20).
Figure 20. Howard County Protected Lands within the reservoirs’ watershed
About one-third of the reservoirs’ watershed in Howard County was preserved by agricultural, environmental, or historic easements.

Patuxent Reservoirs Watershed Technical Advisory Committee Protection Group 31 2016 Annual Report
Montgomery County During 2016, 25 acres of agricultural land in the Reservoirs Watershed were placed under permanent agricultural easements through the County’s Building Lot Termination (BLT) program. The County’s BLT program is designed to enhance the effectiveness of the County’s transfer of development rights program, by further increasing the protection of agricultural land through extinguishing remaining development rights on agricultural properties.
Agricultural Progress
A summary of the progress made during 2016 by both the Howard and Montgomery Soil Conservation Districts (SCDs) is provided in Table 4. The SCDs use funding from local, state and federal programs to provide technical and financial assistance to landowners for the installation of agricultural BMPs. The numbers reported account for activity from July 1, 2015 through June 30, 2016. Note that estimated pollutant load reductions have been assigned in the Chesapeake Bay Program Model for nutrients and total suspended solids for BMPs shaded in Table 4. Estimating load reductions from agricultural BMPs was part of the TAC’s assessment of progress made thus far toward achieving the reservoir TMDL goals. Table 4. Agricultural Progress for 2015-16 in the Patuxent Reservoirs Watershed
Howard SCD Montgomery SCD Total
Conservation Plans developed (acres) 10 (989.7) 5 (360.2) 15 (1349.9)
Conservation Plans revised (acres) 6 (1059.8) 1 (180.6) 7 (1240.4)
Best Management Practices Installed 38 30 68
Best Management Practice
Ag Waste Storage Structure 0 1 1
Conservation Crop Rotation (acres) 0 360.8 360.8
Contour Farming (acres) - - -
Cover Crop (acres) 11 (1,463.5) 7 (2,376.9) 18 (3,840.4)
Critical Area Planting (acre) 1 (0.1) 1 (0.1) 2 (0.2)
Diversion (feet) 1 (250) 0 1 (250)
Field Border (feet) - - -
Grade Stabilization Structure 4 0 4
Grassed Waterways (acres) 5 (2.6) 2 (0.5) 7 (3.1)
Heavy Use Area Protection (acres) - - -
Livestock Exclusion Fencing (feet) 1 (810) 0 1 (810)
Livestock Watering System/Watering Facility 5 0 5
Nutrient Management (acres) - - -
Pipeline (feet) 1 (165) 0 1 (165)
Residue Management – Mulch Till (acres) 0 32.9 32.9
Residue Management – No Till (acres) - - -
Roof Runoff System 0 1 1
Sediment Control Pond 1 0 1
Spring Development 1 0 1
Stream Crossing 1 1 2
Waste Utilization/Recycling (acres) 3 (135.8) 0 3 (135.8)

Patuxent Reservoirs Watershed Technical Advisory Committee Protection Group 32 2016 Annual Report
Two charts are also included to summarize progress of the SCDs since 2000. The MDE used the water quality data collected from 2000 to establish the TMDLs for the reservoirs and used WSSC data from 1998-2003 for model calibration. Therefore, summarizing the cumulative progress since that time period provides a partial means to support an assessment of pollutant reductions since the EPA established the reservoir TMDLs. The charts show the number of farm acres with an established Soil Conservation and Water Quality Plan (farm plan) (Figure 21) and the number of BMPs installed (Figure 22). In 2016 farm plans were developed for 2,590 acres (4 square miles). Since 2000, farm plans have been written for 21,650 acres (33.8 square miles), and 2,510 BMPs have been installed.
Figure 21. Farm Acres with Soil Conservation and Water Quality Plans
Figure 22. Number of Best Management Practices Installed
0
5,000
10,000
15,000
20,000
25,000
0
500
1,000
1,500
2,000
2,500
3,000
3,500
2000 2001 2002 2003 2004 2005 2006 2007 2008 2009 2010 2011 2012 2013 2014 2015 2016
Cu
mu
lati
veLa
nd
Are
a w
ith
Pla
ns
De
velo
ped
(A
cres
)
Lan
d A
rea
wit
h P
lans
Dev
elo
ped
(Acr
es)
Agricultural Conservation Efforts in the Patuxent Reservoirs WatershedHoward and Montgomery Soil Conservation Districts
Land Area with Soil Conservation and Water Quality Plans Developed
0
500
1000
1500
2000
2500
3000
0
100
200
300
400
500
600
2000 2001 2002 2003 2004 2005 2006 2007 2008 2009 2010 2011 2012 2013 2014 2015 2016
Cu
mu
lati
ve N
um
ber
of A
g B
MPs
Inst
alle
d
Nu
mbe
r of A
g B
MPs
Inst
alle
d
Agricultural Conservation Efforts in the Patuxent Reservoirs WatershedHoward and Montgomery Soil Conservation Districts
Number of Best Management Practices (BMPs) Installed

Patuxent Reservoirs Watershed Technical Advisory Committee Protection Group 33 2016 Annual Report
Patuxent Reservoirs Watershed Agricultural Cost-Share Program In 1998, the Patuxent Reservoirs Watershed Protection Group created the Patuxent Reservoir Protection Strategy Memorandum of Understanding (MOU), which established the Patuxent Reservoirs Watershed Agricultural Cost-Share Program. This cost-share program focuses on implementing BMPs that will benefit nearby stream systems. The program is targeted at small agricultural operations that may not qualify for other State and federal cost-share programs. In the Patuxent Reservoirs Watershed, many of these operations are small horse farms. Many details of the original program were outdated and did not reflect current conservation objectives; consequently, it was updated and improved with changes taking effect in May, 2014. As anticipated, these new changes have had immediate benefit in Montgomery County. The remaining funds in this cost-share program as of June 30, 2016 are:
HSCD $50,752 MSCD $19,476 Total $70,228
Although historical interest in the program had been spotty in Montgomery County, these updates have sparked new interest, especially among small equine farms. Montgomery SCD used $15,369 of the Patuxent Cost-Share program funds during FY16. A roof runoff structure and heavy use area were installed in FY16; two more projects are underway in FY17. It is anticipated that the update in cost-share rates and the broadening of program applicability will lead to increased participation throughout the watershed.
Howard County Land Use
The majority of the Patuxent Reservoirs Watershed in Howard County is outside the Planned Service Area (PSA) for public water and sewer service, and is zoned Rural Residential (RR), for low density residential development, or Rural Conservation (RC), for farming and low density, clustered residential development. A small portion of the watershed is within the PSA and is zoned for more dense residential development. In 2014, the County Council convened a Task Force to study current zoning regulations for mulching, composting and wood processing facilities, and to make recommendations for changes to these regulations, if necessary. Bert Nixon was appointed to be a member of the Task Force, which began to meet regularly in July 2014. The Task Force was unable to fully resolve some issues, resulting in both a majority and a minority report being submitted to the County Council in March 2015. In August 2015, the Dayton Rural Preservation Society submitted a Zoning Regulation Amendment (ZRA-160) request to the County, which proposed to “incorporate recommendations of the Mulch and Wood Task Force . . . Specific regulations are a composite of the recommendations of the majority and minority members on the task force as written by the minority members.” ZRA-160 is currently on hold due to the Department of Planning and
Patuxent Reservoirs Watershed Technical Advisory Committee Protection Group 34 2016 Annual Report
Zoning's heavy workload and the Planning Board's full docket. DPZ is hoping to schedule the ZRA for the Planning Board in the late spring or early summer of 2017.
Public Awareness and Stewardship
The TAC agencies and other groups in the watershed continued to coordinate public outreach and involvement initiatives during 2016. Under the coordination of WSSC’s Communications and Community Relations Office staff, there were about 55 environmental stewardship events in 2016, as well as other successful outreach events coordinated by other TAC agencies that occurred in Howard, Montgomery, and Prince George’s Counties.
Farm Academy
Howard SCD held three Farm Academy events in the reservoirs’ watershed. These efforts were to educate non-farming neighbors on what their farming neighbors are doing. Topics covered included best management practices and the timing of manure application.
Montgomery County Department of Parks
During 2016, Montgomery County stream valley buffer reforestation efforts in the Patuxent watershed included projects covering about 0.75 acres in the Hawlings River Watershed. In addition, volunteers have been regularly taking care of the newest reforested section within this area.
Under the Department of Parks’ Weed Warrior Program, which coordinates volunteer efforts to remove invasive plants from natural areas, a total of 339 person-hours within the Patuxent Reservoirs watershed were logged. Some of the Weed Warrior group efforts are coordinated with other events, such as Earth Day, to draw more attention to the environmental needs of natural areas and the importance of stewardship.
The Montgomery County Parks Department also hosted three trash cleanups in the parks within the Patuxent Reservoirs Watershed. A total of 159 person-hours were logged, for a total of 375 pounds of trash and 144 pounds of recyclables removed.

Patuxent Reservoirs Watershed Technical Advisory Committee Protection Group 35 2016 Annual Report
Patuxent River Clean-up
The WSSC’s Communications and Community Relations Office coordinated 10 cleanup events in 2016 on WSSC-owned lands along the Patuxent Reservoirs. Community volunteers, scouts, and school groups assisted in removing hundreds of pounds of debris from the recreation areas as well as along access roads. One large clean-up occurred at a watershed access point on Tucker Lane in Montgomery County where illegal dumping is a big issue. During the clean-up, volunteers pulled out mattresses, a couch, and numerous bags of debris. The WSSC also worked with the Chesapeake Canoe Cruisers Association to coordinate a spring river clean-up. The canoe cruisers cleaned up a portion of the river from the Brighton Dam Recreation Area to the Browns Bridge Recreation Area.
RainScapes Rewards Program
The Montgomery County DEP continued its countywide RainScapes Rewards Program to provide rebates to property owners who voluntarily install practices that capture and store runoff from rooftops and paved areas in their yards, thus reducing storm water impacts downstream. The majority of these projects were urban tree canopy plantings. Combined savings are possible for these projects using $25 coupons from both the Maryland DNR and the M-NCPPC, and the RainScapes $150 per tree rebate. Rainwater harvesting practices using rain barrels or cisterns are the second most popular practice for the rebate program. No rain gardens have been installed in the Reservoirs Watershed through the RainScapes Rewards program. By the end of FY16, there were 33 projects installed in the Patuxent Reservoirs Watershed, managing runoff from 22,207 square feet of impervious surfaces. There were 16 tree canopy projects for over 41 canopy trees planted, along with 9 rain barrels and three cistern projects, four conservation landscapes, and one pervious paver project installed. Applicants spent $56,421 and received $15,769 in rebates.

Patuxent Reservoirs Watershed Technical Advisory Committee Protection Group 36 2016 Annual Report
WSSC’s “Watershed” Property Surrounding the Reservoirs - Environmental Outreach
In 2016 WSSC once again hosted the annual Children’s Water Festival. During this two-day event almost 700 4th grade students from Montgomery and Prince George’s Counties gathered at Brighton Dam to learn about water and the importance of protecting local waterways and ecosystems. Students rotated among 12 activity stations including: recycling, watersheds, water pollution, and water conservation. During the spring, WSSC hosted over 1,500 students during field trips on its watershed property. Many of these students were participating in either Trout Unlimited’s Trout in the Classroom program or the Sunfish and
Students Program through Prince George’s County Public Schools. During the field trip students not only released fish that they raised in their classrooms (trout or blue gill) into the river but also learned about where their drinking water comes from, why it is important to protect local watersheds and actions they can take to avoid polluting waterways. On May 14, 2016 WSSC hosted its annual Family Fishing day at the Triadelphia Recreation Area. This event attracted over 200 participants who learned about WSSC’s work to protect the reservoir watershed and to enjoy a day of fishing. Unfortunately, WSSC’s annual Family Campfire did not occur in 2016 due to inclement weather. On April 2nd, WSSC, in partnership with the Maryland Chapter of the American Chestnut Foundation, hosted over 50 students from the Hillman Entrepreneur’s Program at Montgomery College, Prince George’s Community College, and University of Maryland College Park. These students assisted in planting over 1,000 seeds in the American Chestnut Tree Orchard located adjacent to the Triadelphia Reservoir.

37
Table 5. Performance Measures and Goals for Priority Resources
Priority Resources: Goals & Performance Measures Resource: Reservoir/Water Supply
Issue: The public need for a sufficient quantity of safe and high quality drinking water calls for adopting a proactive and multi-barrier approach, which starts with utilizing raw water of the highest quality and sustainable quantity, now and in the future. To achieve this for the Patuxent water filtration plant, we need to control reservoir eutrophication, reduce disinfectant by-products precursors, and limit reservoirs capacity loss.
Measures Goals Implementation Items Time Line Responsible Partner
Chlorophyll-a (chl-a)
Chl-a not to exceed a 10 µg/L mean during the growing season and not to exceed a 30 µg/L instantaneous concentration
Perform reservoir monitoring for chl-a, DO, and TOC during the growing season
Ongoing
WSSC
Dissolved oxygen (DO)
DO not to fall below 5 mg/L at any time in the epilimnion, not to fall below 5 mg/L in the entire water column during completely mixed periods, and not to fall below 10% saturation at any time in the hypolimnion
Perform reservoir monitoring for CHL-a, DO, and TOC during the growing season
Ongoing WSSC
Suite of water quality parameters in reservoir monitoring protocol
Five-year data trend analysis for other monitored water quality parameters shows no net deterioration
Develop and begin implementation of a plan to reduce nutrients, based on model/TMDL requirements
Update trend analysis for reservoir water quality parameters on a 5-year cycle
Ongoing
Next Update: 2020
TAC
WSSC
Total organic carbon (TOC)
TOC – 20% annual reduction goal, with 40% reduction for peak quarter at the location where water is withdrawn for treatment purposes
Perform reservoir monitoring for CHL-a, DO, and TOC during the growing season
Ongoing WSSC
Sediment Sediment accumulation rate not to exceed previous years
Perform bathymetric survey of reservoirs at 10 year intervals or less
Next Survey in 2025
WSSC

38
Priority Resources: Goals & Performance Measures (continued)
Resource: Terrestrial Habitat
Issue: Preservation of forests provides water quality benefits by reducing sediment and nutrient loading of streams from surrounding land uses.
Measures Goals Implementation Items Time Line Responsible Partner
Forest Cover
Maintain and increase forest cover
Increase forest interior habitat
Encourage private property owners to participate in tree planting programs
Ensure publicly owned parkland and open space is forested to the maximum extent possible
Ongoing
2006 – 2023
TAC
TAC
Forest Connectivity Improve forest connectivity (larger forest tracts are connected by forest corridors)
Target reforestation and forest conservation programs to increase forest connectivity and forest interior habitat
Ongoing TAC
Forest Size Increase forest size Encourage private property owners to participate in tree planting programs
Ensure publicly owned parkland and open space is forested to the maximum extent possible
Ongoing
2006 – 2023
TAC
TAC
Forest Diversity Ensure diverse forest communities (communities contain a variety of species and ages)
Develop a forest management plan to ensure forest diversity and long-term natural regeneration, identifying and addressing potential problems such as excessive deer populations, invasive species and human impacts
2006 – 2013
WSSC Plan completed FY08
TAC
WSSC
Forest Sustainability Ensure forests are self-sustaining and capable of long-term natural regeneration
Implement deer management programs
Implement strategies for control of invasive plants
Ongoing
Ongoing
TAC
TAC

39
Priority Resources: Goals & Performance Measures (continued)
Resource: Stream System
Issue: Preventing stream habitat degradation - The stream system includes all intermittent and perennial streams and their adjacent floodplains. A stable stream system provides significant nutrient and sediment removal during both baseflow and storm flow events. The stream and its associated riparian buffer are also important as sources of high quality food and habitat for both aquatic and terrestrial organisms.
Measures Goals Implementation Items Time Line Responsible Partner
Buffer corridor width and continuity
A minimum 35-foot riparian buffer on all streams on properties that were developed prior to current stream buffer requirements
Establish and maintain minimum 35-foot riparian buffers on all publicly-owned land
Accelerate programs to establish and maintain streamside buffers to a minimum of 35 feet on privately-owned lands to the maximum extent possible
2006 – 2013
2006 – 2023
WSSC, M-NCPPC, HC, MC WSSC, M-NCPPC, HC, HSCD, MC, MSCD
Stream bank and stream channel stability
No areas of "severe" or "very severe" stream bank erosion based on the Stream Corridor Assessments and other locally collected data.
Establish and maintain streamside fencing programs to keep all livestock out of streams to the maximum extent possible
Address significant areas of stream bank and channel instability through stream restoration projects and storm water retrofits to the maximum extent possible
2006 – 2013
2006 – 2013
HSCD, MSCD HC, HSCD, M-NCPPC, MC
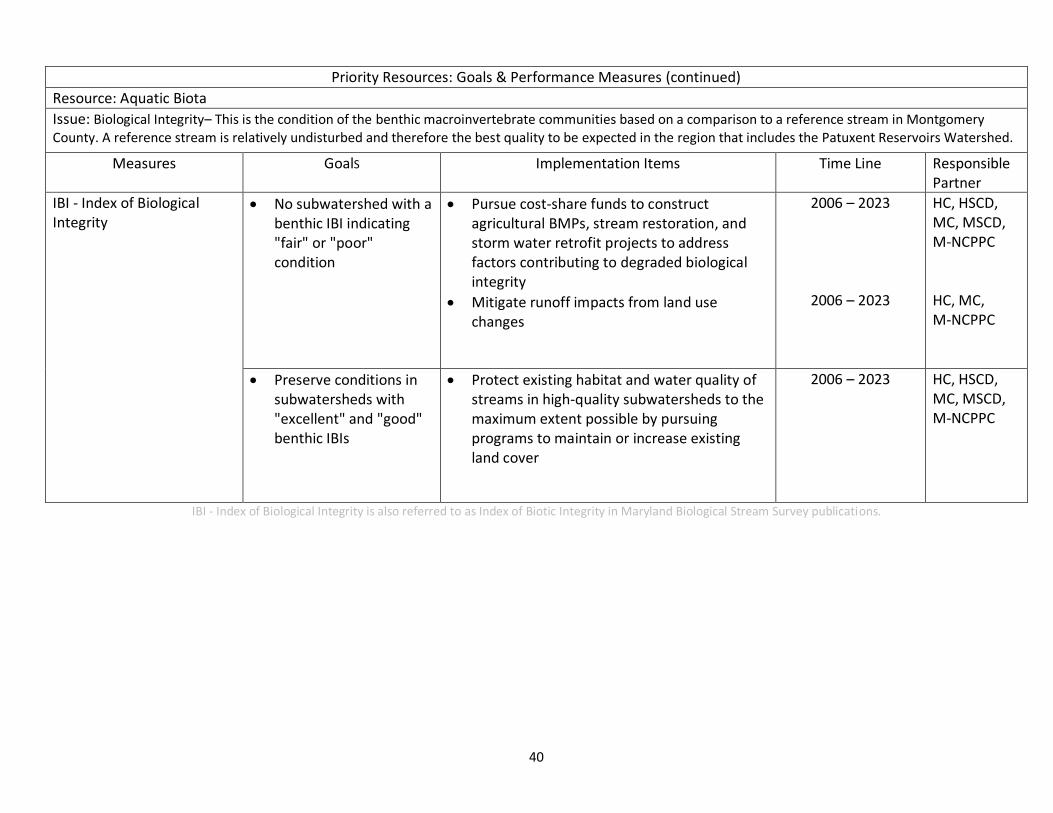
40
Priority Resources: Goals & Performance Measures (continued)
Resource: Aquatic Biota
Issue: Biological Integrity– This is the condition of the benthic macroinvertebrate communities based on a comparison to a reference stream in Montgomery County. A reference stream is relatively undisturbed and therefore the best quality to be expected in the region that includes the Patuxent Reservoirs Watershed.
Measures GoalS Implementation Items Time Line Responsible Partner
IBI - Index of Biological Integrity
No subwatershed with a benthic IBI indicating "fair" or "poor" condition
Pursue cost-share funds to construct agricultural BMPs, stream restoration, and storm water retrofit projects to address factors contributing to degraded biological integrity
Mitigate runoff impacts from land use changes
2006 – 2023
2006 – 2023
HC, HSCD, MC, MSCD, M-NCPPC HC, MC, M-NCPPC
Preserve conditions in subwatersheds with "excellent" and "good" benthic IBIs
Protect existing habitat and water quality of streams in high-quality subwatersheds to the maximum extent possible by pursuing programs to maintain or increase existing land cover
2006 – 2023
HC, HSCD, MC, MSCD, M-NCPPC
IBI - Index of Biological Integrity is also referred to as Index of Biotic Integrity in Maryland Biological Stream Survey publications.
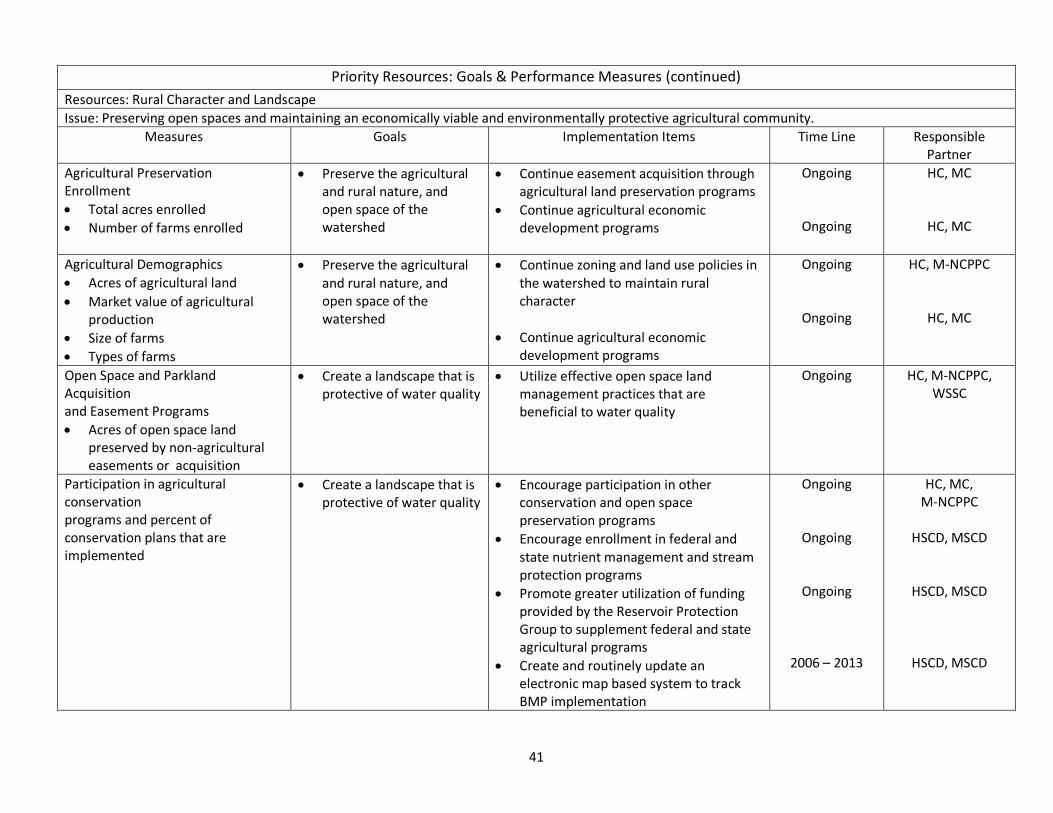
41
Priority Resources: Goals & Performance Measures (continued)
Resources: Rural Character and Landscape
Issue: Preserving open spaces and maintaining an economically viable and environmentally protective agricultural community.
Measures Goals Implementation Items Time Line Responsible Partner
Agricultural Preservation Enrollment
Total acres enrolled
Number of farms enrolled
Preserve the agricultural and rural nature, and open space of the watershed
Continue easement acquisition through agricultural land preservation programs
Continue agricultural economic development programs
Ongoing
Ongoing
HC, MC
HC, MC
Agricultural Demographics
Acres of agricultural land
Market value of agricultural production
Size of farms
Types of farms
Preserve the agricultural and rural nature, and open space of the watershed
Continue zoning and land use policies in the watershed to maintain rural character
Continue agricultural economic development programs
Ongoing
Ongoing
HC, M-NCPPC
HC, MC
Open Space and Parkland Acquisition and Easement Programs
Acres of open space land preserved by non-agricultural easements or acquisition
Create a landscape that is protective of water quality
Utilize effective open space land management practices that are beneficial to water quality
Ongoing HC, M-NCPPC, WSSC
Participation in agricultural conservation programs and percent of conservation plans that are implemented
Create a landscape that is protective of water quality
Encourage participation in other conservation and open space preservation programs
Encourage enrollment in federal and state nutrient management and stream protection programs
Promote greater utilization of funding provided by the Reservoir Protection Group to supplement federal and state agricultural programs
Create and routinely update an electronic map based system to track BMP implementation
Ongoing
Ongoing
Ongoing
2006 – 2013
HC, MC, M-NCPPC
HSCD, MSCD
HSCD, MSCD
HSCD, MSCD

42
PRIORITY RESOURCES: GOALS & PERFORMANCE MEASURES (continued)
Resource: Public Awareness and Stewardship
Issue: Awareness and support by residents and resource users
Measure Goals Implementation Items Time Line Responsible Partner
Residents participating in stewardship activities
Citizen action to improve watershed resources – see evidence of watershed friendly activities and practices
10 to 15 stewardship offerings per year
Identify citizen groups throughout watershed and be available for presentations upon request
Organize stewardship events and participate in other community events
Recognize good stewards through annual awards
Form “Friends of the Watershed” group of citizen volunteers that will take on tasks such as newsletter preparation and some Earth Month planning
2006 – 2009
Ongoing
2006 – 2008
2006 – 2009
TAC
TAC
MC, PGC, HC, M-NCPPC
TAC
Schools participating in mentoring
School and community involvement – 20 participating Green School partners by end of 2003 and 5 additional schools participating each year thereafter until all 43 are attained
Continue and expand Green Schools Mentoring Partnership
Ongoing WSSC, HC, MC, PGC, M-NCPPC
Active support by elected officials
Routine communication with elected officials
Routine communication with elected officials
Ongoing
TAC
Routine coverage by media
Expanded media coverage of watershed events – print, radio and TV
Increase communication with media
Support regional efforts to establish media-savvy campaigns that emphasize water quality protection
2006 – 2009
2006 – 2008
TAC

43
Table 6. Work Plan Expenditures for Current Fiscal Year
PATUXENT RESERVOIRS WATERSHED WORK PROGRAM FOR FY16
PRIORITY RESOURCES PROTECTED
IMPLEMENTATION NEED
IMPLEMENTATION ITEM
AGENCY
FY 2016
Reservoir/Water Supply
Reservoir and tributary water chemistry and flow monitoring
Reservoir monitoring and lab analysis WSSC $162,000 (in-kind)
5 US Geological Survey stream flow gauging stations WSSC
$60,000
ALL Priority Resources Management of agricultural cost-share initiatives Patuxent Reservoirs Watershed MOU and Cost-Share Agreement
Program oversight for voluntary implementation of agricultural BMPs through existing local, State of Maryland, and Federal programs Cost-share funds spent
HSCD, MSCD
MSCD
$165,000 (SCD in-kind)
$15,369
ALL Priority Resources Public outreach and involvement initiatives
RainScapes Rewards MC Rebates availa-ble to county residents for Low Impact Develop-ment (LID)
ALL Priority Resources Public outreach and involvement initiatives
Earth Month, and other outreach activities WSSC
Other TAC agencies
$140,000 (in-kind)
$2,500
(in-kind)

44
PATUXENT RESERVOIRS WATERSHED WORK PROGRAM FOR FY16
PRIORITY RESOURCES
PROTECTED
IMPLEMENTATION
NEED
IMPLEMENTATION ITEM
AGENCY
FY 2016
ALL Priority Resources Complete Annual Report
and Technical Supplement
Compilation and editing WSSC
Other TAC Agencies
$10,000
In‐kind
Coordination and Collaboration
Provide administrative support & coordination among partners
WSSC $35,000
Reservoir/Water Supply Stream System Aquatic Biota Public Awareness & Stewardship
TMDL Implementation Additional remodeling to complete the accounting for interim progress achieved towards meeting Patuxent Reservoirs Watershed TMDLs
WSSC $7,227
Stream System Initial funding for stream restoration project at Maple Dell Farm.
HC $425,000
TOTAL FUNDING $1,022,096